
Fluid Dynamic Assessment and Development of Nusselt Correlations for Fischer Koch S Structures
Institute of Engineering Thermodynamics, German Aerospace Center, 70569 Stuttgart, Germany
*
Author to whom correspondence should be addressed.
Energies 2024, 17(3), 688; https://doi.org/10.3390/en17030688
Submission received: 2 December 2023
/
Revised: 21 January 2024
/
Accepted: 27 January 2024
/
Published: 31 January 2024
(This article belongs to the Special Issue Advances in Heat Exchangers for Sustainable Technologies Applications)
Abstract
:Lattice structures such as triply periodic minimal surface (TPMS) structures have gained significance due to advancements in additive manufacturing, particularly 3D printing, which enable their engineering to be tailored to specific applications, such as heat exchangers. While traditional heat exchanger designs have been extensively studied, investigations into the thermal performance of TPMS structures are limited. Considering the extensive range of the geometric design variations in TPMS structures, highly efficient structures on par with the performance of conventional heat exchanger designs can be expected. This study aims to comprehensively evaluate the thermal and flow characteristics of a specific TPMS structure (Fischer Koch S), and, in particular, the impact of various volume fractions on its heat transfer performance and on its friction factor. Another key objective of this study is to develop Nusselt and friction factor correlations as a function of the investigated volume fractions for potential use in future design tools. To this end, a broad CFD study was carried out. Additionally, this study provides insights into the procedures involved in generating Fischer Koch S geometries and the modeling methodology employed in CFD investigations. Based on the results of the CFD study, the thermal and fluid dynamic performances of Fischer Koch unit cells were evaluated, resulting in heat transfer coefficients up to 160 W/m2K for the investigated structures. A comparison between the heat transfer coefficient of the examined TPMS structure and a conventional plate heat exchanger suggested a potential increase in the heat transfer coefficient of approximately 35%. The generated CFD data were subsequently utilized to formulate fitting correlations for the Nusselt number and friction factors as a function of the volume fraction. The fitted parameters of these correlations are provided in this work.
1. Introduction
The rapid advancements in additive manufacturing in recent years have significantly expanded the potential for the innovative and intricate new designs of components in thermal process engineering [1,2,3]. Among these innovative new designs, triply periodic minimal surface (TPMS) structures, which belong to a geometrical class of lattice structures, represent a promising option. These structures are defined by trigonometric functions and comprise two or more periodically arranged, interwoven channels that are distinct and segregated from one another. Due to their mathematically generated nature, TPMS surfaces are smooth and devoid of edges, which make them particularly well-suited to 3D printing processes [4]. These geometric properties also contribute to reduced pressure drops and the prevention of dead zones for flowing fluids [5], facilitating excellent flow distribution within the channels. The intertwined channels and elevated specific surface areas of TPMS structures have the potential to significantly enhance their heat transfer and thermal performance in relevant applications. Moreover, TPMS structures have demonstrated significant resilience against mechanically applied pressure [2,6,7,8]. With this combination of qualities, TPMS structures have been incorporated into multiple applications spanning various fields of engineering. Crossland et al. [9] reported the first successful application of a TPMS semiconducting network in a solar cell. Elliot et al. [10] applied TPMS structures as moving bed bioreactors used for wastewater management. Additional applications of TPMS structures can be found in the manufacturing of medical scaffolds for bone implants [11] and in chromatography [12].
The focus of this work centers on the significance of TPMS structures in the context of heat exchanger applications [13,14,15,16,17]. Particularly in scenarios where lightweight and high-strength structures are needed, e.g., aerospace and automation manufacturing [8], TPMS structures show great promise. Additionally, additive manufacturing introduces the possibility of producing non-metallic heat exchanger structures with highly customized designs. For example, ceramic heat exchanger structures have the potential to outperform metallic heat exchangers and provide the option of operating at highly elevated temperatures [18].
While traditional heat exchanger structures such as tube heat exchangers or plate heat exchangers have been extensively researched for several decades [19,20,21,22,23,24], studies exploring the thermal performance of TPMS structures are relatively recent and often limited to specific design choices or Reynolds number ranges [1,16,25,26]. Of the wide variety of different TPMS structures, some of the most frequently studied ones include Gyroid, Schwarz-D, Schwarz-P, Neovius, Fischer Koch S, and Schoen-IWP [1]. Figure 1 provides a visualization of these distinct TPMS shapes, which have a unit cell length of 25 mm alongside their respective specific surface areas [16].
The morphology of each TPMS type can be altered by adjusting the volume fractions of the two channel domains, a task readily facilitated by 3D printing technology. Figure 2 illustrates a Fischer Koch S structure featuring different volume fractions, ranging from 25% to 75%.
The possibility of easily adapting the sizes of the channels presents an opportunity for optimization in the design of heat exchange applications where it might be beneficial to have differently sized channels, such as in scenarios involving different mass flows and enthalpy flows of fluids.
Although various studies have explored the thermal and flow performance of different TPMS structures with uniform domain sizes [14,16,25], existing data pertaining to varying volume fractions are scarce [26]. Hence, this study aims to comprehensively investigate the overall heat transfer performance of a specific TPMS structure and specifically research the influence of volume fraction on performance. For this purpose, a simulation study for CFD analysis has been carried out, focusing on the Fischer Koch S (FKS) structure. The FKS structure was selected since it exhibits the highest specific surface area of the commonly researched TPMS structures shown in Figure 1. In order to develop a potential design tool for heat exchanger applications, the CFD results will be used to derive a correlation between the Nusselt numbers and friction factors of the FKS structure in terms of the volume fraction.
2. Methodology
2.1. Generation of Fischer Koch S (FKS) Structures
The generalized mathematical formulation [12] of a TPMS is given by the equation
where , , and denote the cartesian coordinates; is the unit cell length; and , , and define the spatial periodicity in the corresponding direction. In the simplest case of = = = 1, the TPMS is composed of a 1 × 1 × 1 unit cell, a cubic structure with a length of 1 unit in each direction. Finally, the parameter serves as an offset parameter inducing a phase shift in the cosine function, which defines the unique shape of the individual TPMS. By solving for different values of the parameter , the geometrical proportions of the TPMS structure can be altered. For = 0, the channel sizes of the TPMS are symmetrical and each domain occupies half of the total volume, resulting in a volume fraction of 50%. Values of < 0 or > 0 correspondingly increase or decrease the volume fractions of the two domains.
The Fischer Koch S structure, which is the focus of this study, can be mathematically represented by rearranging [27] Equation (1) to
For this study, the parameter was varied between −0.5 and 0.5, producing volume fractions ranging from 25% to 75%. In addition, the unit cell length was investigated, ranging from 25 mm to 60 mm. The resulting specific surface areas of the generated FKS cells are shown in Figure 3. In this context, the specific surface area is defined as the heat-transfer-participating surface divided by the total volume of the unit cell.
As demonstrated in [16], thermal and fluid dynamic properties are already well established within one single unit cell. For this reason, and to maintain computational efficiency in the ensuing CFD simulations, solely individual 1 × 1 × 1 unit cells were investigated.
Based on Equation (2), the FKS geometries were generated utilizing a MATLAB script, which output triangulated surface files (STL) of single FKS cells. ANSYS SPACECLAIM was used to preprocess the MATLAB-generated geometries, merging and converting the vertices and triangles into continuous and smooth surfaces. Additionally, CFD-related boundary conditions and definitions like flow inlets and outlets were predefined. The next step was to import the geometries into ANSYS FLUENT to carry out the CFD simulations, see Figure 4.
The subsequent paragraph provides specifics regarding the methodology and details the modeling parameters used in the simulations.
2.2. CFD Modelling
The flow and thermal performance of the various Fisch Koch configurations were simulated and assessed using ANSYS FLUENT (version 2021 R1) software. Since the effect of multiple aligned unit cells on the configurations’ thermal and hydraulic properties is not significant [16], for the purpose of this study the simulation domain consisted of single 1 × 1 × 1 cubic FKS unit cells. The mesh generation was accomplished through FLUENT Meshing. Ten boundary layers, with a growth rate of 1.2, constituted the mesh at the wall domain to refine the precision of the simulated flow field in proximity to the walls. Appropriate mesh sizes and element types were determined after conducting a convergence analysis, resulting in a maximum element size of the polyhedral elements equivalent to 3% of the total unit cell length. Figure 5 illustrates the generated mesh employed in simulating the FKS structures.
The boundary conditions of the simulated domain included a velocity inlet on the lateral surface of the TPMS, perpendicular to the x-axis. On the opposing surface of the cubic structure, a pressure outlet was placed. The velocity profile at the inlet was assumed to be uniform along the x-axis. This simplified velocity profile at the inlet is acceptable as the flow distribution is expected to be fully developed within the initial flow segments. In this study, the fluid in the domain was defined as air, with properties dependent on temperature and pressure. This includes the properties of density, dynamic viscosity, specific heat capacity, and thermal conductivity. Assuming conditions in high-temperature applications, the temperature at the domain’s inlet was fixed at a constant 550 °C at atmospheric pressure. Figure 6 illustrates the defined boundaries within the simulation domain: The outer walls of the structure were set as symmetrical boundaries, simulating symmetrical flow conditions for larger arrangements of unit cells along the y-axis and z-axis. The inner wall serves as a separator between the two flow channels and was set to be infinitesimally thin. To ensure shorter simulation times and numerical stability., the simulation domain contained only one of the two involved fluid channels. The simulation of a single fluid channel is deemed sufficient for the assessment of pressure drops and heat transfer coefficients, as the heat exchange between the channels was facilitated by imposing a constant and uniform heat flux of = 1000 W/m2 on the inner wall.
For solving the fluid flow, the SST k-ω model implemented in ANSYS FLUENT was deployed.
The simulations were performed for various volume fractions ranging from 25% to 75%, and then repeated for different inlet velocities varying between 0.1 m/s and 10 m/s and distinct unit cell lengths between 25 mm and 60 mm. These studies were carried out with the purpose of establishing a the thermal and fluid dynamic performance of the FKS in terms of Reynolds numbers, Nusselt numbers, and friction factors, depending on the volume fraction.
2.3. Processing of Thermal and Flow-Related Characteristics
This paragraph briefly describes the essential parameters and material properties used in this study for the thermal and fluid dynamic evaluation of our results. The Reynolds number Re characterizes the fluid flow within a flow channel by calculating the ratio of inertial forces to viscous forces. It is defined as
Here, is the fluid density, the areal averaged velocity of the cross section in the main direction of flow, and is the fluid’s dynamic viscosity at the inlet of the fluid domain. These properties were calculated from the simulation results of the CFD analysis. The parameter in (3) is defined as the hydraulic diameter and describes the effective diameter of non-circular channels in fluid mechanics. Typically, it is calculated by the ratio of the cross-sectional area of the flow to its wetter perimeter. In the case of TPMS structures, there exist several possible definitions for the hydraulic diameter. The one used in this study is based on [26]:
Here, is the volume fraction, defined as the ratio between the volume of the flow channel and the total volume of the cubic TPMS unit cell. represents the specific surface area, which, in the case of this study, is computed by dividing the area of the inner wall of the TPMS cell by the total volume of the flow channel.
The dimensionless friction factor f quantifies the effect of internal friction on fluid flow and is used when describing pressure drops in channels. Here, the friction factor is formulated as
with being the resulting pressure drop in the system and the channel length of the specific FKS structure. Here, there is no distinction between the friction of laminar and turbulent flow, since there is no clear inflection point in a TPMS flow, unlike in, e.g., tubular flow.
Finally, the Nusselt number , serving as a pivotal metric in evaluating thermal performance, is defined as
with as the thermal conductivity of the fluid. While other studies have investigated the local heat transfer along the unit cell length [16], the focus in this study lies in the cumulative heat transfer per individual unit cell. As such, represents the averaged heat transfer over the entirety of the FKS cell. It is defined as
Here, is the aforementioned fixed heat flux imposed on the inner walls of the TPMS structure, is the resulting average temperature of the inner wall, is the fixed fluid temperature at the inlet, and is the mass-weighted average of the outlet temperature.
By evaluating the quantities outlined in this section, the following section includes the presentation and analysis of the simulation results.
3. Results
The present study assesses the data obtained from our conducted CFD simulations on fluid dynamics and thermal performance. All data collected stem from numerical simulations of single unit cells with Fischer Koch S structures.
3.1. Fluid flow Characteristics and Pressure Drops
Figure 7 presents exemplary visualizations of the velocity streamlines and contour plots for velocity and pressure in the primary flow direction, obtained from the CFD simulation of an FKS cell with a volume fraction of 60%.
The results of these simulations were used for the calculation of the Reynolds numbers, based on (3), and pressure drops of different FKS variations. Figure 8 depicts the specific pressure drop per length plotted against the Reynolds number and inlet velocity of specific volume fractions at a fixed unit cell length of 45 mm.
The results clearly demonstrate elevated pressure drops for lower volume fractions. This can be attributed to the amplified impact of frictional losses within narrower channel sizes. At the same time, the pressure drop rises exponentially for all volume fractions with an increase in Reynolds number, which is to be expected. The corresponding mass flows for the individual data points of Figure 8 are listed in Table 1.
The pressure drops displayed in Figure 8 were used to calculate the friction factor according to (5). Figure 9 shows the friction factor plotted against the Reynolds number for various volume fractions of the same FKS unit cell.
The data indicate a noticeable difference among the various volume fractions of the Fischer Koch S structures. Lower volume fractions demonstrate higher friction factors for equivalent Reynolds numbers. This occurs because the effect of the friction factor is more pronounced in narrower flow channels. Simultaneously, the friction factor decreases with increasing Reynolds numbers for all volume fractions at comparable rates. As Reynolds numbers rise further, the decline in the friction factor becomes less steep This is a result of the fluid experiencing reduced friction at higher velocities.
When compared to the friction factors observed in basic tube flows [16], the fluid behavior depicted in Figure 9 exhibits similarities. However, the friction factors for the FKS cell in this study are notably higher, ranging from approximately 10 to 20 times higher depending on the Reynolds numbers and volume fractions.
3.2. Heat Transfer Coefficients and Nusselt Numbers
In order to evaluate the heat transfer of the FKS cell, the heat transfer coefficients and Nusselt numbers were computed, following Equations (6) and (7). For this purpose, the resulting outlet temperature Tout and inner wall temperature of the CFD study were assessed. The outcomes for the averaged heat transfer coefficients of the FKS cells are plotted against the length-specific pressure drops for varying volume fractions and unit cell lengths in Figure 10.
The results display a non-linear increase in the heat transfer coefficients at the expanse of growing pressure drops. Both of these effects are interconnected and can be attributed to increased flow velocities. In Figure 10a, the evaluated heat transfer coefficients for a fixed Fischer Koch S unit cell length of 45 mm are depicted at different volume fractions of the fluid domain. Although the non-linear progression of the heat transfer coefficient is similar for all volume fractions, greater volume fractions exhibit greater heat transfer coefficients at equivalent pressure drops. This effect is even more pronounced with increased pressure drops. This is caused by the increased flow velocities at equivalent pressure drops for higher volume fractions, as depicted in Figure 8, which consequently lead to enhanced heat transfer coefficients, as shown in Figure 10a.
Figure 10b compares the heat transfer coefficients for different unit cell lengths with a constant volume fraction of 60%. The resulting heat transfer coefficients are similar in both magnitude and pattern, suggesting a negligible impact of the unit cell length. However, in the context of heat exchange applications, the volumetric heat transfer αm × AV might provide greater insight into the structure’s heat transfer capabilities relative to its heat exchanger volume, since it also considers the specific surface area AV of the specific FKS cell. The volumetric heat transfer is shown in Figure 11 for different unit cell lengths at volume fractions of 30% and 60%.
The results indicate a noticeable increase in volumetric heat transfer with reduced unit cell sizes across the showcased volume fractions of 30% and 60%; the volumetric heat transfer coefficient is notably up to 2.5 times higher for the shorter FKS unit cell lengths, depending on the pressure drop. Smaller-sized unit cells exhibit higher efficiency in heat transfer. This implies that, within confined spatial limitations, employing a larger quantity of smaller unit cells would be more effective compared to a smaller quantity of larger unit cells.
Next, the Nusselt number is determined based on the assessed heat transfer coefficients according to Equation (6). Figure 12 illustrates the assessment of the calculated Nusselt numbers in terms of Reynolds numbers for various volume fractions.
The findings reveal a distinct trend that aligns with the previously displayed results. The Nusselt number for all volume fractions demonstrates a non-linear increase with higher Reynolds numbers; nonetheless, the increase is more pronounced for lower volume fractions compared to higher volume fractions, due to the difference in the hydraulic diameters of each volume fraction. With higher Reynolds numbers, the disparity between the various volume fractions becomes more pronounced.
3.3. Correlation between Nusselt Numbers and Friction Factors
Future design tools intended for FKS-based heat exchanger applications would benefit greatly from a correlation between Nusselt numbers, friction factors and Reynolds numbers. To achieve this, the presented results of the CFD analysis of the friction factor and Nusselt numbers shown in Figure 8 and Figure 11 are used as a basis to establish such a correlation. Due to the scope of the present study, the validity of the correlation is confined to FKS structures with Reynolds numbers < 1000.
The selected Nusselt correlation follows an exponential fit function, expressed as
which calculates the Nusselt number as a function of the Reynolds number and the volume fraction of the FKS structure. A MATLAB script was employed to fit the parameters , , and to satisfy Equation (9), so that the maximal error of the difference in Nusselt values between the CFD results and the Nusselt fit for each volume fraction (25%…75%) is minimized.
Similarly to the Nusselt correlation, a correlation for the friction factor f was developed to best fit the numerical results of the CFD analysis. To this end, a fit function of the form
was established. Again, the error of the fit was minimized similarly to Equation (9):
In order to confine the parameter field of the fit Functions (8) and (10), parameters and were kept constant across all volume fractions, while parameter B was fitted as a function of the volume fraction.
The identified parameter values to best fit the Nusselt correlation and friction factor are listed in Table 2.
In a next step, a fit for the parameters and , which are dependent on the volume fraction of the FKS structure, are established.
Figure 13 displays the values of B in terms of the volume fraction for the Nusselt correlation and friction factor.
The results for the parameter display a fairly linear correlation with the volume fraction, whereas exhibits a non-linear increase with higher volume fractions. For this reason, a linear fit function for the parameter was defined in the form
The parameter , on the other hand, was fitted with the power function:
Similarly to the error Function (9), parameters and were fitted to minimize the error with
And
This approach resulted in the best fits listed in Table 3, and the resulting fit functions and are displayed in Figure 13.
With this, the Nusselt correlation and friction factor correlation and can be expressed as
Figure 14 shows the derived Nusselt and friction factor correlations for the FKS structure in comparison with their respective data points from the CFD analysis.
The agreement between the Nusselt correlation fit for the FKS structure and the results obtained from the CFD analysis is satisfactory. However, the maximum errors are noticeable at low (ε = 25%) and high (ε > 70%) volume fractions. When adding up the errors for each volume fraction, the maximum error amounts to 8.4% and occurs at the volume fraction of 25%.
At low Reynolds numbers and low volume fractions, the friction factor correlation tends to underestimate the actual f values, resulting in a maximum error of 22.8% at the volume fraction of 35%. However, at higher Reynolds numbers, the correlation’s predictive accuracy improves. Despite these discrepancies, the overall fit remains acceptable when employed as a simplified design tool.
3.4. Assessment of Heat Transfer Performance
The following paragraph provides a comparison between the heat transfer coefficients of a conventional plate heat exchanger with offset strip fins (OFS) and the Fischer Koch S (FKS) structure. To facilitate this comparison, the developed correlations for Nusselt numbers (Equation (16)) and friction factors (Equation (17)) were applied to determine the heat transfer coefficient and pressure drops for the FKS structure. The calculation for the OSF heat exchanger is based on [28]. In order to assess both heat exchanger performances, different designs with two fixed specific surface areas (AV = 100 m2/m3 and AV = 200 m2/m3) were examined. For the FKS structure, variations in volume fractions and unit cell lengths were considered, while the design variations of the OSF plate heat exchanger involved changes in fin sizes, fin heights, fin widths, and the distance between fins. A MATLAB script was set up to identify design combinations for both the FKS and OSF designs that meet the fixed specific surface areas. Consequently, a broad range of design combinations was identified, and the results are plotted in terms of heat transfer coefficients and pressure drops in Figure 15.
The findings indicate that the FKS structure achieves higher heat transfer coefficients compared to the plate heat exchanger. As the pressure drops increase, the disparity in the heat transfer coefficients expands further, favoring the FKS structure. Specifically, for a fixed specific surface area of 200 m2/m3 and pressure drops of 2500 Pa/m, the FKS structure exhibits heat transfer coefficients of approximately 130 W/m2K, representing an approximately 35% improvement compared to the equivalent plate heat exchanger performance.
4. Conclusions
The current research investigated the thermal performance and flow attributes of Fischer Koch S (FKS) structures, a particular variant of triply periodic minimal surface (TPMS) bodies, with a specific emphasis on their application potential in heat exchangers. These types of lattice structures are particularly well suited to additive manufacturing methods such as 3D printing, which enables the engineering of tailored design options for specific applications. The primary aim was to assess the influence of varying porosities (as in, unequal channel sizes) of the FKS structure, an aspect that has received limited attention in existing research. Compared to existing research, this work features a broad range of investigated volume fractions, between 25% and 75%, of the FKS fluid channels and gives unique insight into the geometrical dependencies of the flow and heat transfer characteristics of FKS unit cells. To achieve this, numerous Computational Fluid Dynamics (CFD) investigations were conducted across a range of different porosities for Reynolds numbers below 1000. The simulation study was carried out by simulating single 1 × 1 × 1 unit cells of the FKS structure. The findings revealed that lower volume fractions yielded superior Nusselt numbers compared to higher volume fractions, achieving maximum Nusselt numbers of approximately 20. However, this enhanced performance with lower volume fractions was accompanied by higher friction factors, peaking at friction factors of 17.
Based on the results of the CFD study, novel correlations were established, correlating the friction factor and Nusselt number to specific volume fractions. A comprehensive list of the fitted parameters is provided within this research. These correlations demonstrated a generally good agreement with the generated CFD data and could potentially serve as valuable tools in designing FKS structures for heat exchanger applications. Future studies aiming to expand the range of applicable Reynolds numbers or incorporating analyses with non-cubic TPMS cells could offer further insights.
To assess its thermal performance against established heat exchangers, the derived Nusselt and friction factor correlations were utilized to calculate the heat transfer coefficients of a heat exchanger application consisting of basic FKS cells. These coefficients were then compared with those of a plate heat exchanger of an equivalent specific surface area. The results yielded an increase in the FKS heat transfer coefficients of up to 35% compared to the plate heat exchanger. Future enhancements in the design of TPMSs, such as incorporating non-cubic unit cells or tailoring channel sizes to specific applications, have the potential to further improve their performance.
Author Contributions
Conceptualization, P.K.; software, P.K.; writing—original draft, P.K.; methodology, V.D.; writing—review and editing, V.D.; supervision, V.D. All authors have read and agreed to the published version of the manuscript.
Funding
This research received no external funding.
Data Availability Statement
Data are contained within the article.
Conflicts of Interest
The authors declare no conflict of interest.
References
- Yeranee, K.; Rao, Y. A Review of Recent Investigations on Flow and Heat Transfer Enhancement in Cooling Channels Embedded with Triply Periodic Minimal Surfaces (TPMS). Energies 2022, 15, 8994. [Google Scholar] [CrossRef]
- Jin, Y.; Kong, H.; Zhou, X.; Li, G.; Du, J. Design and Characterization of Sheet-Based Gyroid Porous Structures with Bioinspired Functional Gradients. Materials 2020, 13, 3844. [Google Scholar] [CrossRef]
- Kaur, I.; Singh, P. Critical evaluation of additively manufactured metal lattices for viability in advanced heat exchangers. Int. J. Heat Mass Transf. 2021, 168, 120858. [Google Scholar] [CrossRef]
- Feng, J.; Fu, J.; Yao, X.; He, Y. Triply periodic minimal surface (TPMS) porous structures: From multi-scale design, precise additive manufacturing to multidisciplinary applications. Int. J. Extrem. Manuf. 2022, 4, 022001. [Google Scholar] [CrossRef]
- Ouda, M.; Al-Ketan, O.; Sreedhar, N.; Hasan Ali, M.I.; Abu Al-Rub, R.K.; Hong, S.; Arafat, H.A. Novel static mixers based on triply periodic minimal surface (TPMS) architectures. J. Environ. Chem. Eng. 2020, 8, 104289. [Google Scholar] [CrossRef]
- Kladovasilakis, N.; Tsongas, K.; Tzetzis, D. Mechanical and FEA-Assisted Characterization of Fused Filament Fabricated Triply Periodic Minimal Surface Structures. J. Compos. Sci. 2021, 5, 58. [Google Scholar] [CrossRef]
- Fan, X.; Tang, Q.; Feng, Q.; Ma, S.; Song, J.; Jin, M.; Guo, F.; Jin, P. Design, mechanical properties and energy absorption capability of graded-thickness triply periodic minimal surface structures fabricated by selective laser melting. Int. J. Mech. Sci. 2021, 204, 106586. [Google Scholar] [CrossRef]
- Pan, C.; Han, Y.; Lu, J. Design and Optimization of Lattice Structures: A Review. Appl. Sci. 2020, 10, 6374. [Google Scholar] [CrossRef]
- Crossland, E.J.W.; Kamperman, M.; Nedelcu, M.; Ducati, C.; Wiesner, U.; Smilgies, D.-M.; Toombes, G.E.S.; Hillmyer, M.A.; Ludwigs, S.; Steiner, U.; et al. A Bicontinuous Double Gyroid Hybrid Solar Cell. Nano Lett. 2009, 9, 2807–2812. [Google Scholar] [CrossRef]
- Elliott, O.; Gray, S.; McClay, M.; Nassief, B.; Nunnelley, A.; Vogt, E.; Ekong, J.; Kardel, K.; Khoshkhoo, A.; Proaño, G.; et al. Design and Manufacturing of High Surface Area 3D-Printed Media for Moving Bed Bioreactors for Wastewater Treatment. J. Contemp. Water Res. Educ. 2017, 160, 144–156. [Google Scholar] [CrossRef]
- Ataee, A.; Li, Y.; Fraser, D.; Song, G.; Wen, C. Anisotropic Ti-6Al-4V gyroid scaffolds manufactured by electron beam melting (EBM) for bone implant applications. Mater. Des. 2018, 137, 345–354. [Google Scholar] [CrossRef]
- Simon, U.; Dimartino, S. Direct 3D printing of monolithic ion exchange adsorbers. J. Chromatogr. A 2019, 1587, 119–128. [Google Scholar] [CrossRef] [PubMed]
- Niknam, S.A.; Mortazavi, M.; Li, D. Additively manufactured heat exchangers: A review on opportunities and challenges. Int. J. Adv. Manuf. Technol. 2020, 112, 601–618. [Google Scholar] [CrossRef]
- Li, W.; Yu, G.; Yu, Z. Bioinspired heat exchangers based on triply periodic minimal surfaces for supercritical CO2 cycles. Appl. Therm. Eng. 2020, 179, 115686. [Google Scholar] [CrossRef]
- Kaur, I.; Singh, P. State-of-the-art in heat exchanger additive manufacturing. Int. J. Heat Mass Transf. 2021, 178, 121600. [Google Scholar] [CrossRef]
- Iyer, J.; Moore, T.; Nguyen, D.; Roy, P.; Stolaroff, J. Heat transfer and pressure drop characteristics of heat exchangers based on triply periodic minimal and periodic nodal surfaces. Appl. Therm. Eng. 2022, 209, 118192. [Google Scholar] [CrossRef]
- Kim, J.; Yoo, D.-J. 3D printed compact heat exchangers with mathematically defined core structures. J. Comput. Des. Eng. 2020, 7, 527–550. [Google Scholar] [CrossRef]
- Kelly, J.P.; Finkenauer, L.R.; Roy, P.; Stolaroff, J.K.; Nguyen, D.T.; Ross, M.S.; Hoff, A.T.; Haslam, J.J. Binder jet additive manufacturing of ceramic heat exchangers for concentrating solar power applications with thermal energy storage in molten chlorides. Addit. Manuf. 2022, 56, 102937. [Google Scholar] [CrossRef]
- Abu-Khader, M.M. Plate heat exchangers: Recent advances. Renew. Sustain. Energy Rev. 2012, 16, 1883–1891. [Google Scholar] [CrossRef]
- Kumar, V.; Saini, S.; Sharma, M.; Nigam, K.D.P. Pressure drop and heat transfer study in tube-in-tube helical heat exchanger. Chem. Eng. Sci. 2006, 61, 4403–4416. [Google Scholar] [CrossRef]
- Sadeghianjahromi, A.; Wang, C.-C. Heat transfer enhancement in fin-and-tube heat exchangers—A review on different mechanisms. Renew. Sustain. Energy Rev. 2021, 137, 110470. [Google Scholar] [CrossRef]
- Sayed Ahmed, S.A.E.; Mesalhy, O.M.; Abdelatief, M.A. Flow and heat transfer enhancement in tube heat exchangers. Heat Mass Transf. 2015, 51, 1607–1630. [Google Scholar] [CrossRef]
- Yang, Y.; Li, Y.; Si, B.; Zheng, J. Performance Evaluation of Heat Transfer Enhancement for Offset Strip Fins Used in Plate-Fin Heat Exchangers. J. Heat Transf. 2015, 137, 101901. [Google Scholar] [CrossRef]
- Gherasim, I.; Taws, M.; Galanis, N.; Nguyen, C.T. Heat transfer and fluid flow in a plate heat exchanger part I. Experimental investigation. Int. J. Therm. Sci. 2011, 50, 1492–1498. [Google Scholar] [CrossRef]
- Saeed, M.; Kim, M.-H. Thermal and hydraulic performance of SCO2 PCHE with different fin configurations. Appl. Therm. Eng. 2017, 127, 975–985. [Google Scholar] [CrossRef]
- Cheng, Z.; Li, X.; Xu, R.; Jiang, P. Investigations on porous media customized by triply periodic minimal surface: Heat transfer correlations and strength performance. Int. Commun. Heat Mass Transf. 2021, 129, 105713. [Google Scholar] [CrossRef]
- Al-Ketan, O.; Abu Al-Rub, R.K. Multifunctional Mechanical Metamaterials Based on Triply Periodic Minimal Surface Lattices. Adv. Eng. Mater. 2019, 21, 1900524. [Google Scholar] [CrossRef]
- Shah, R.K.; Sekulic, D.P. Shah—Fundamentals of Heat Exchanger Design; John Wiley & Sons, Inc.: Hoboken, NJ, USA, 2003. [Google Scholar]
Figure 1.
Various TPMS structures and their specific surface areas.
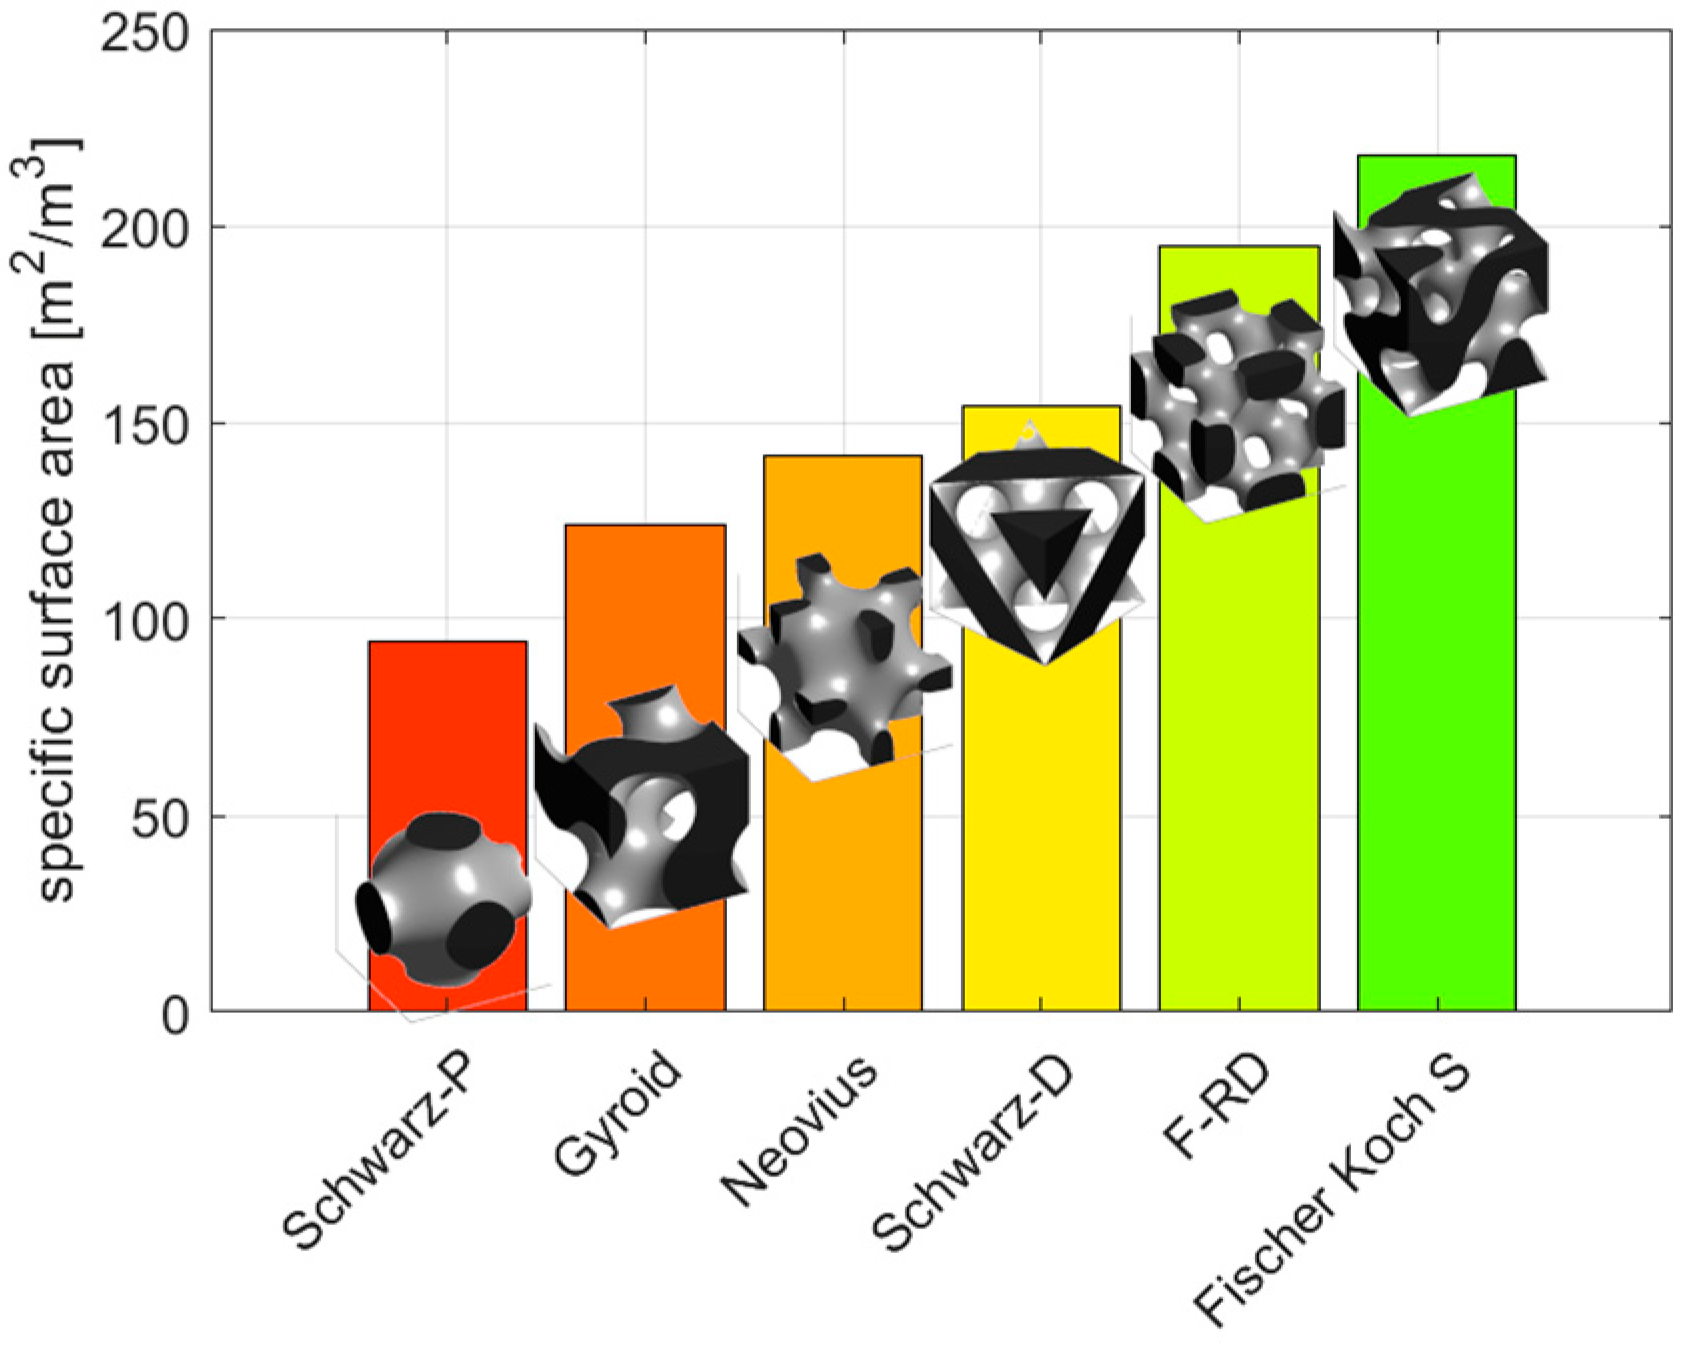
Figure 2.
Fischer Koch S structure at different volume fractions. Left to right: 25%, 45%, 60%, 75%.
Figure 2.
Fischer Koch S structure at different volume fractions. Left to right: 25%, 45%, 60%, 75%.
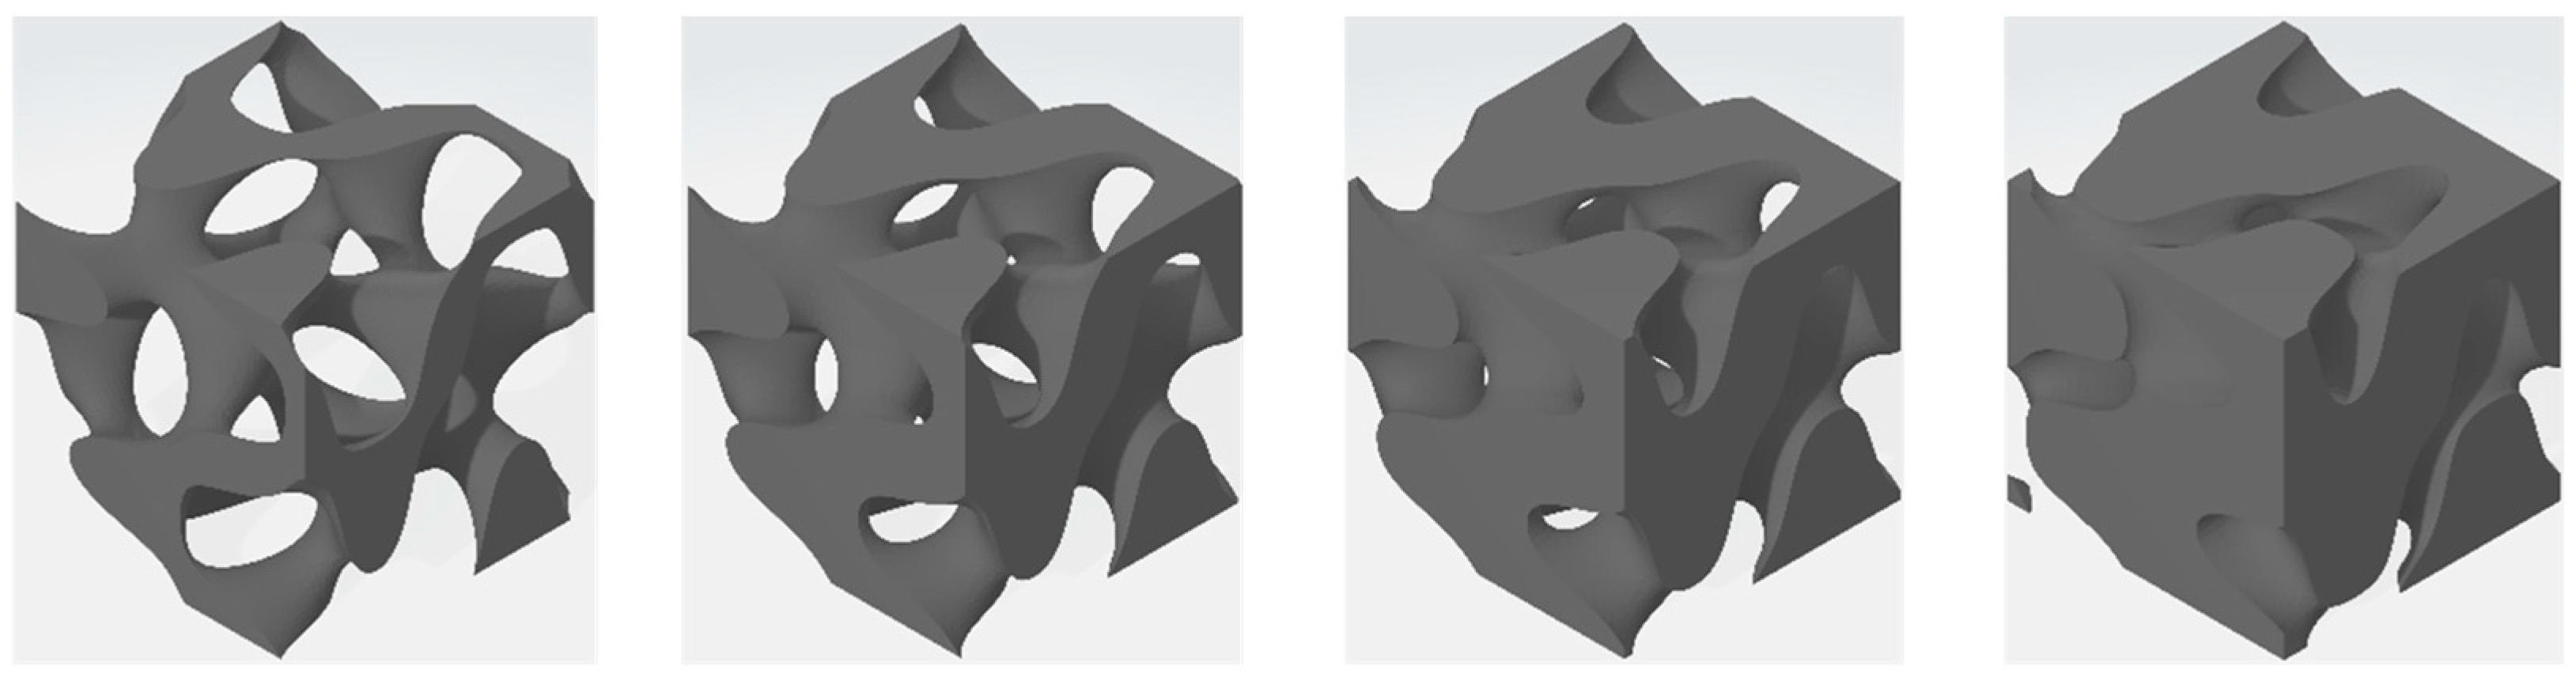
Figure 3.
Specific surface areas at different volume fractions for various unit cell lengths.

Figure 4.
(left) Geometry imported into ANSYS SPACECLAIM; (right) Fischer Koch S with fluid inlet (blue arrows) and fluid outlet (red arrows).
Figure 4.
(left) Geometry imported into ANSYS SPACECLAIM; (right) Fischer Koch S with fluid inlet (blue arrows) and fluid outlet (red arrows).

Figure 5.
Display of the simulation mesh: (left) cross section, showing polyhedral elements; (middle) top view; (right) close-up view of boundary layers.
Figure 5.
Display of the simulation mesh: (left) cross section, showing polyhedral elements; (middle) top view; (right) close-up view of boundary layers.
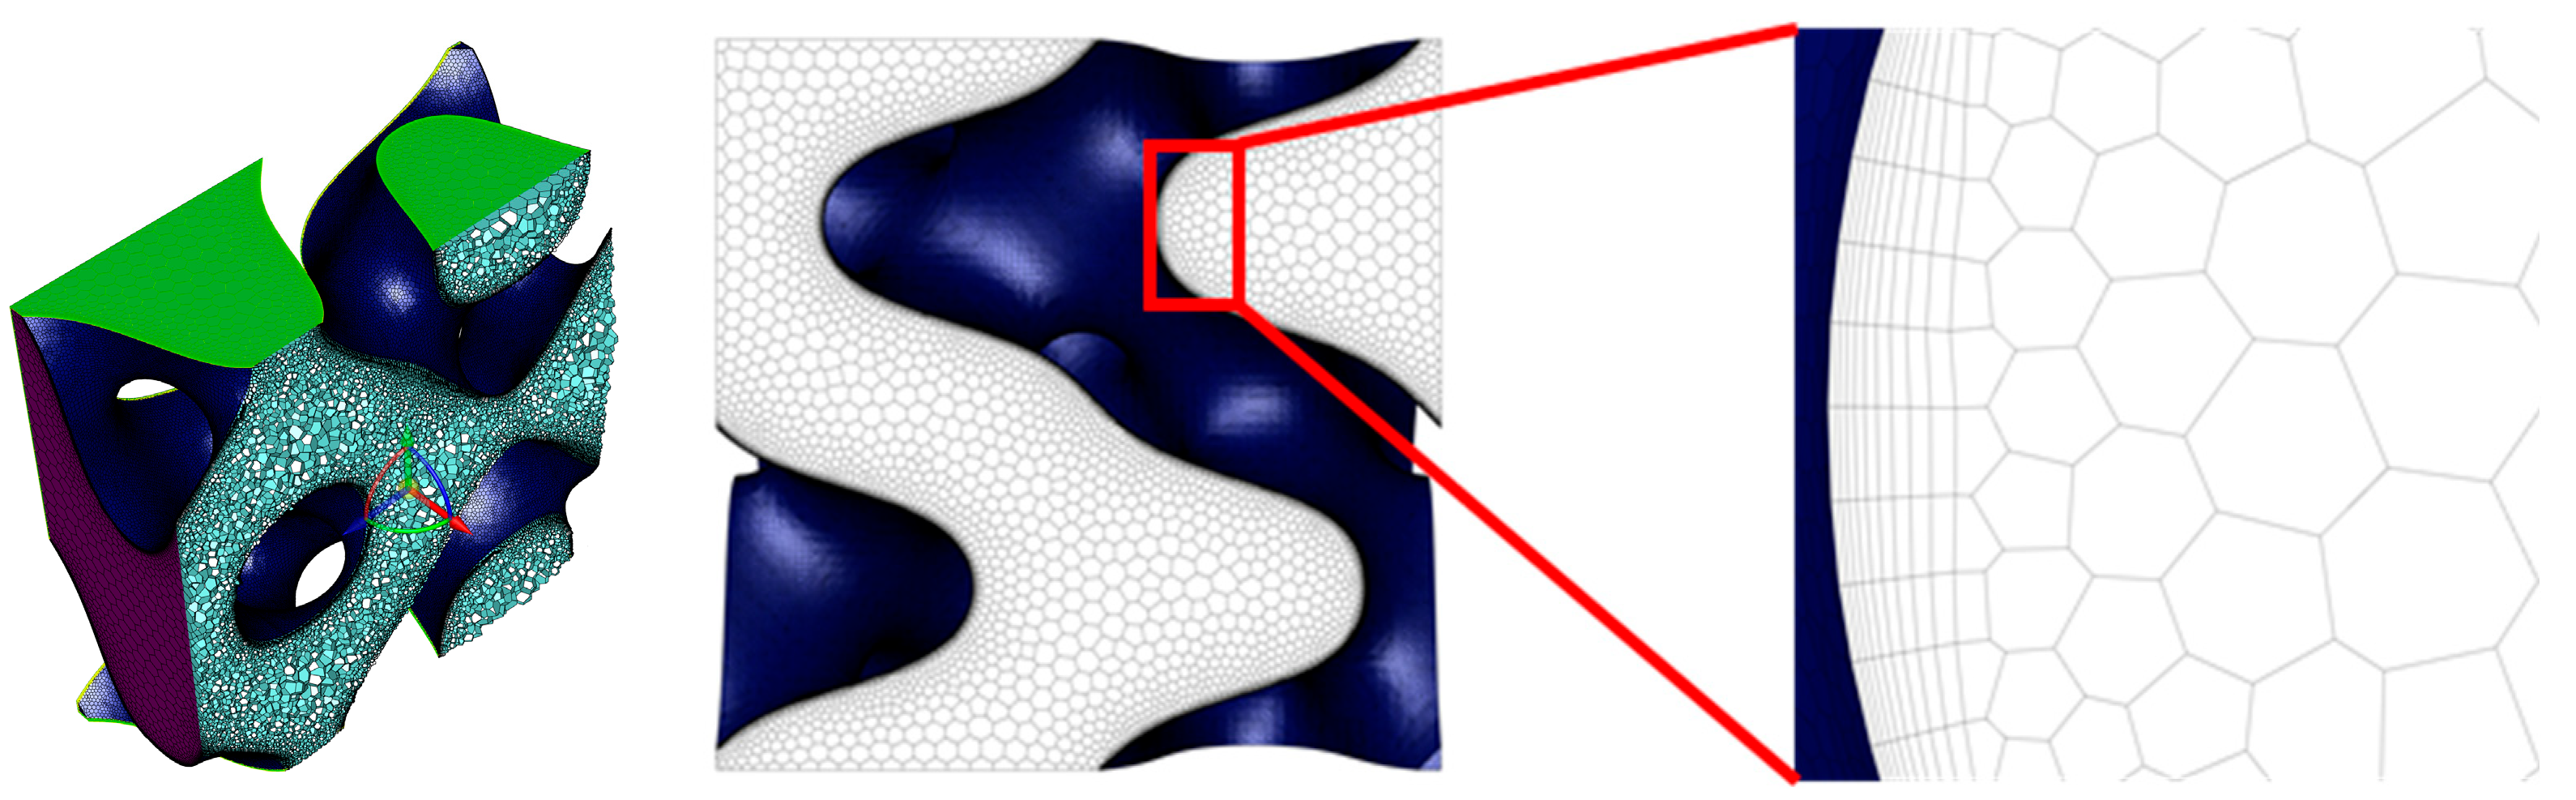
Figure 6.
Left to right: fluid inlet and outlet; outer wall symmetry; inner walls; entire fluid domain.
Figure 6.
Left to right: fluid inlet and outlet; outer wall symmetry; inner walls; entire fluid domain.
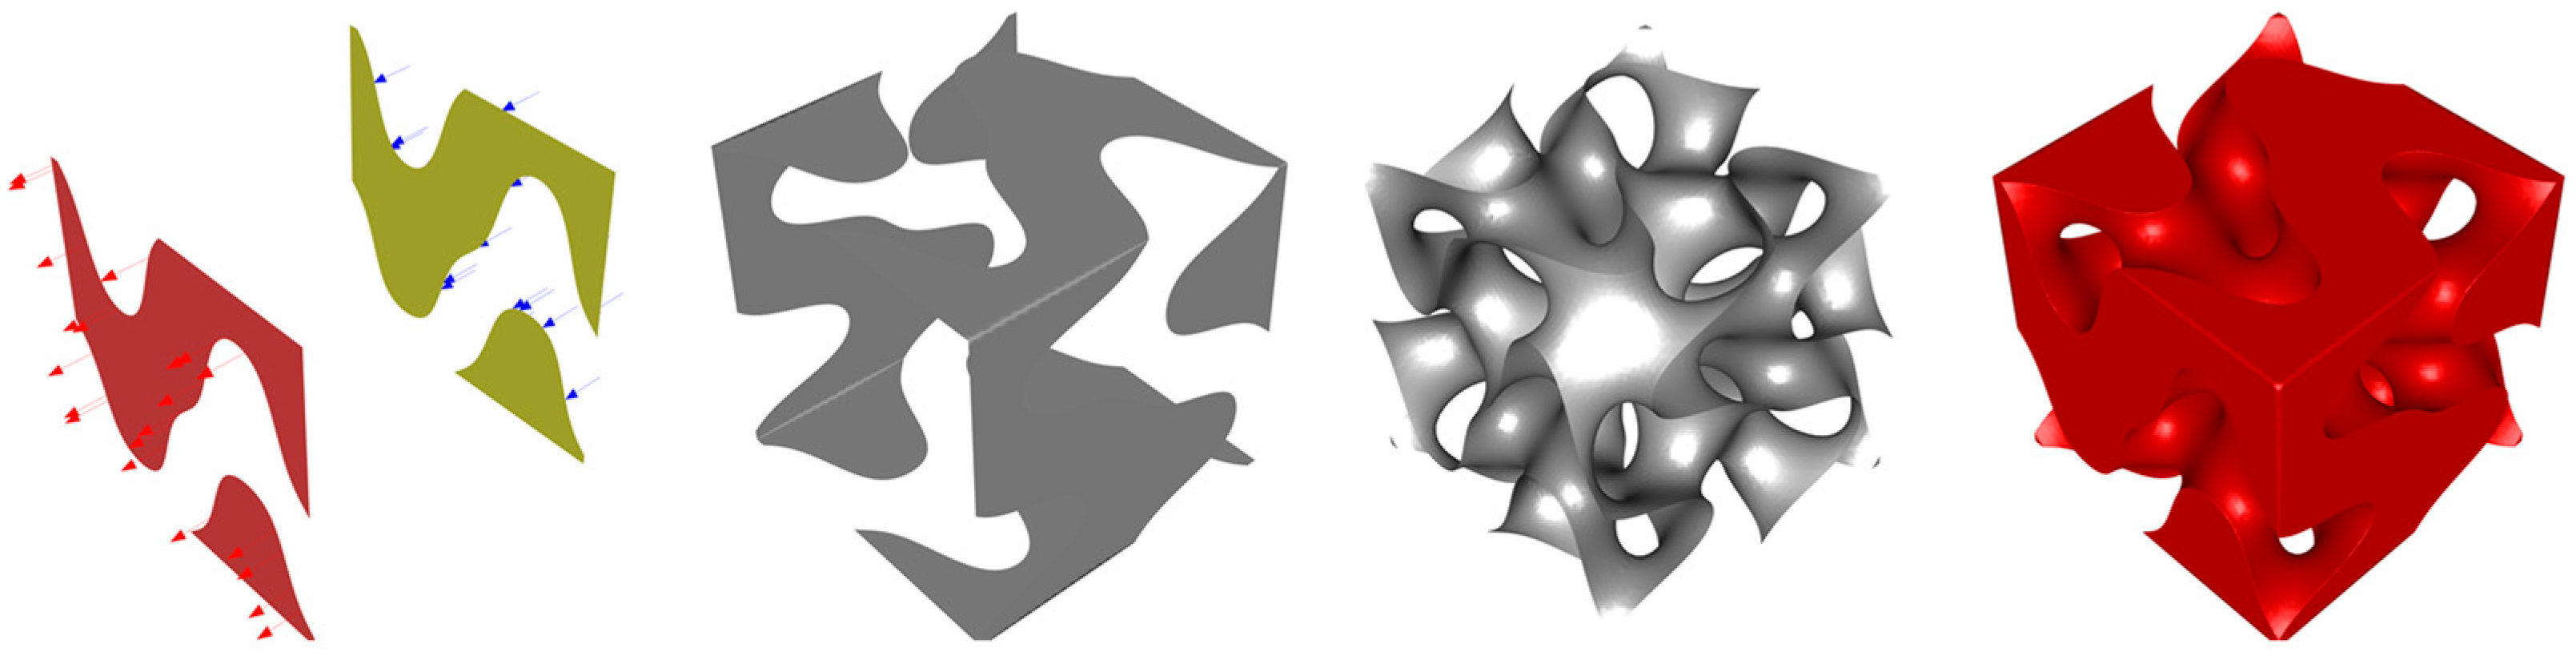
Figure 7.
Visualization of the simulation results for a specific FKS structure: (left) velocity streamlines; (middle) contour plot of velocity; (right) contour plot of absolute pressure.
Figure 7.
Visualization of the simulation results for a specific FKS structure: (left) velocity streamlines; (middle) contour plot of velocity; (right) contour plot of absolute pressure.

Figure 8.
Pressure drops vs. Reynolds numbers and inlet velocities.
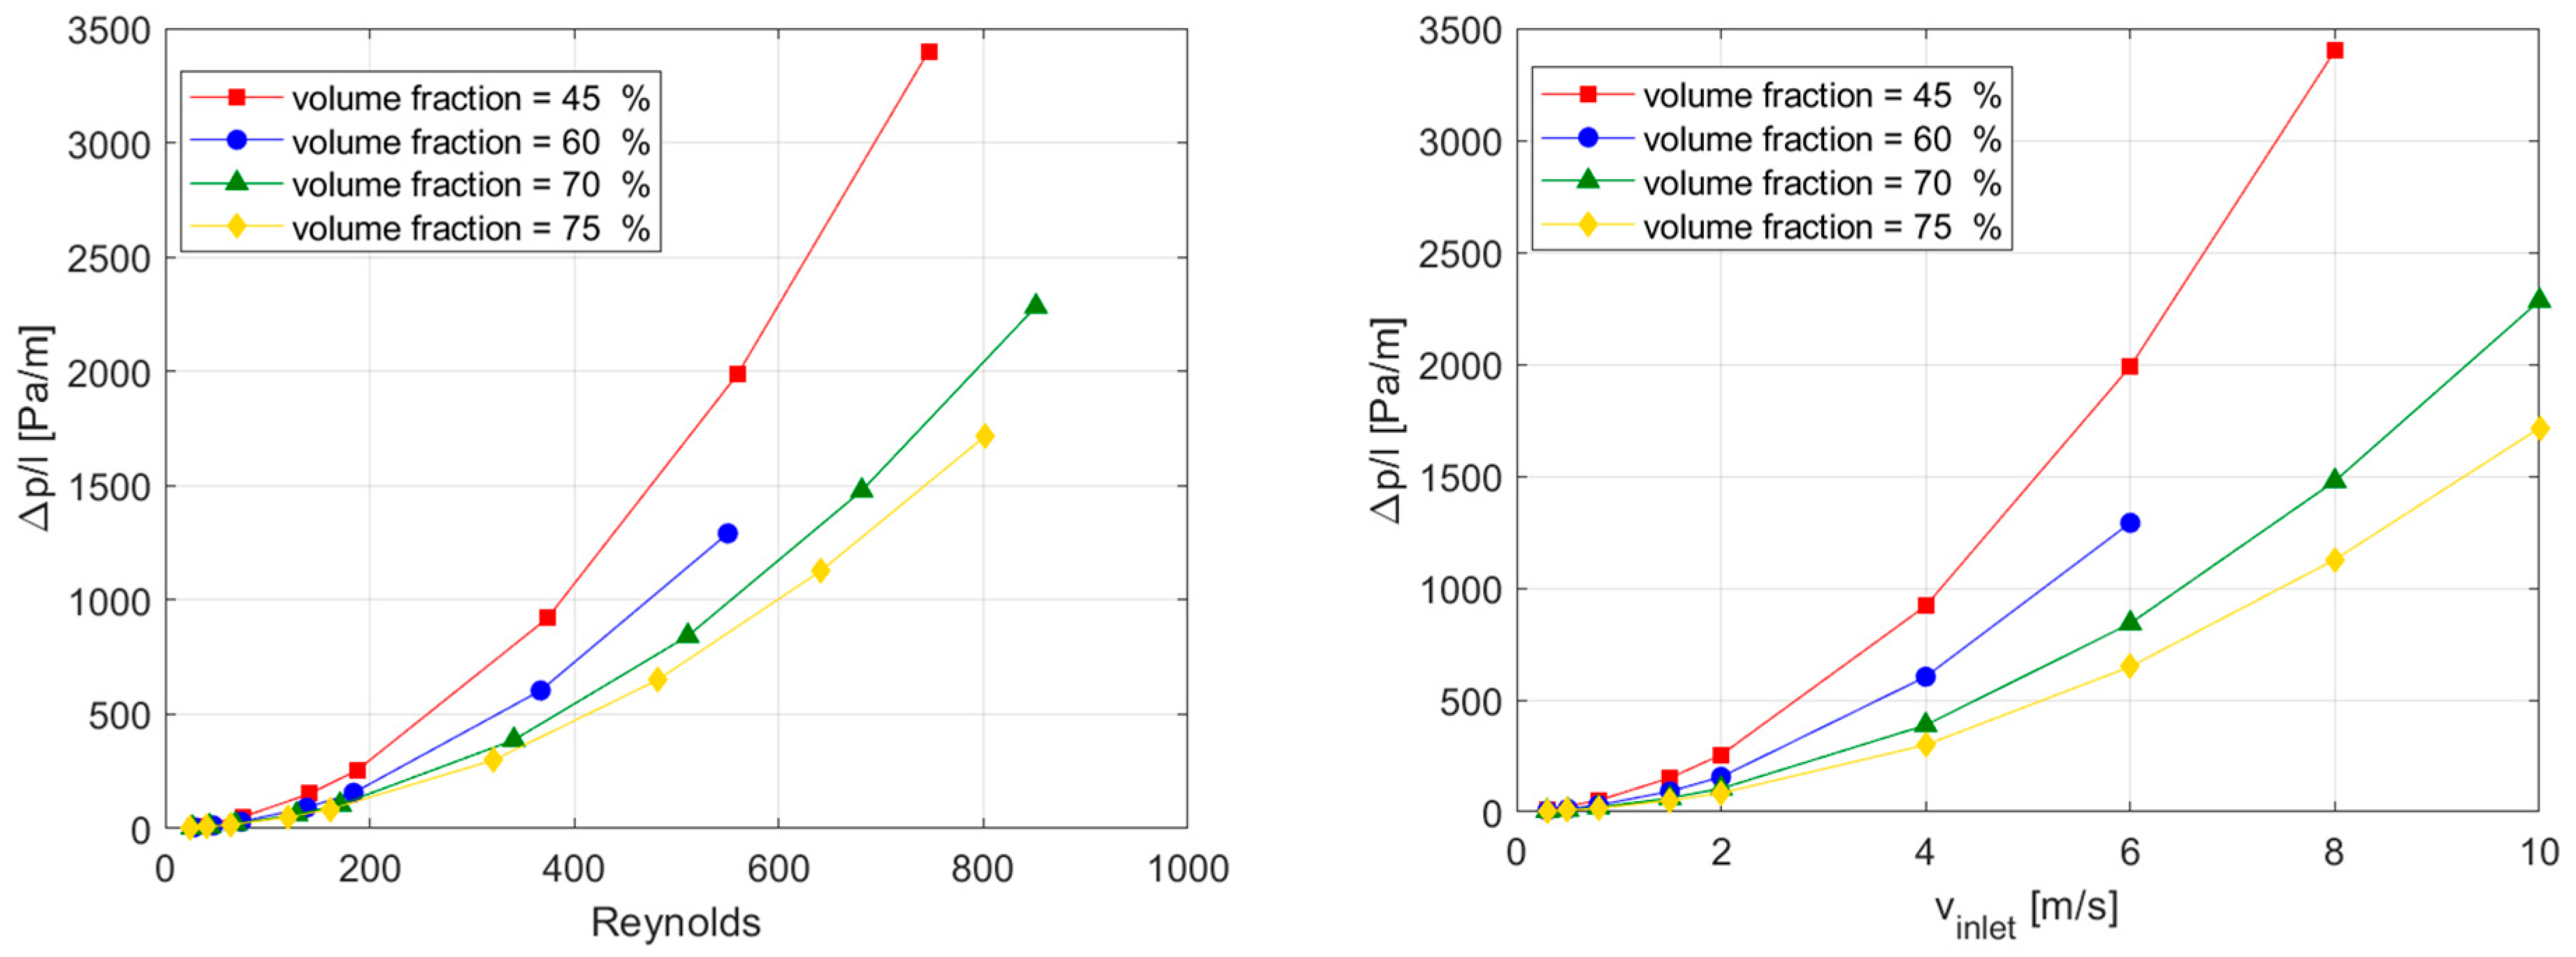
Figure 9.
Friction factor vs. Reynolds number for different volume fractions of the FKS structure.

Figure 10.
Heat transfer coefficients over pressure drops with a fixed unit cell length = 45 mm (a) or fixed volume fraction = 60% (b).
Figure 10.
Heat transfer coefficients over pressure drops with a fixed unit cell length = 45 mm (a) or fixed volume fraction = 60% (b).
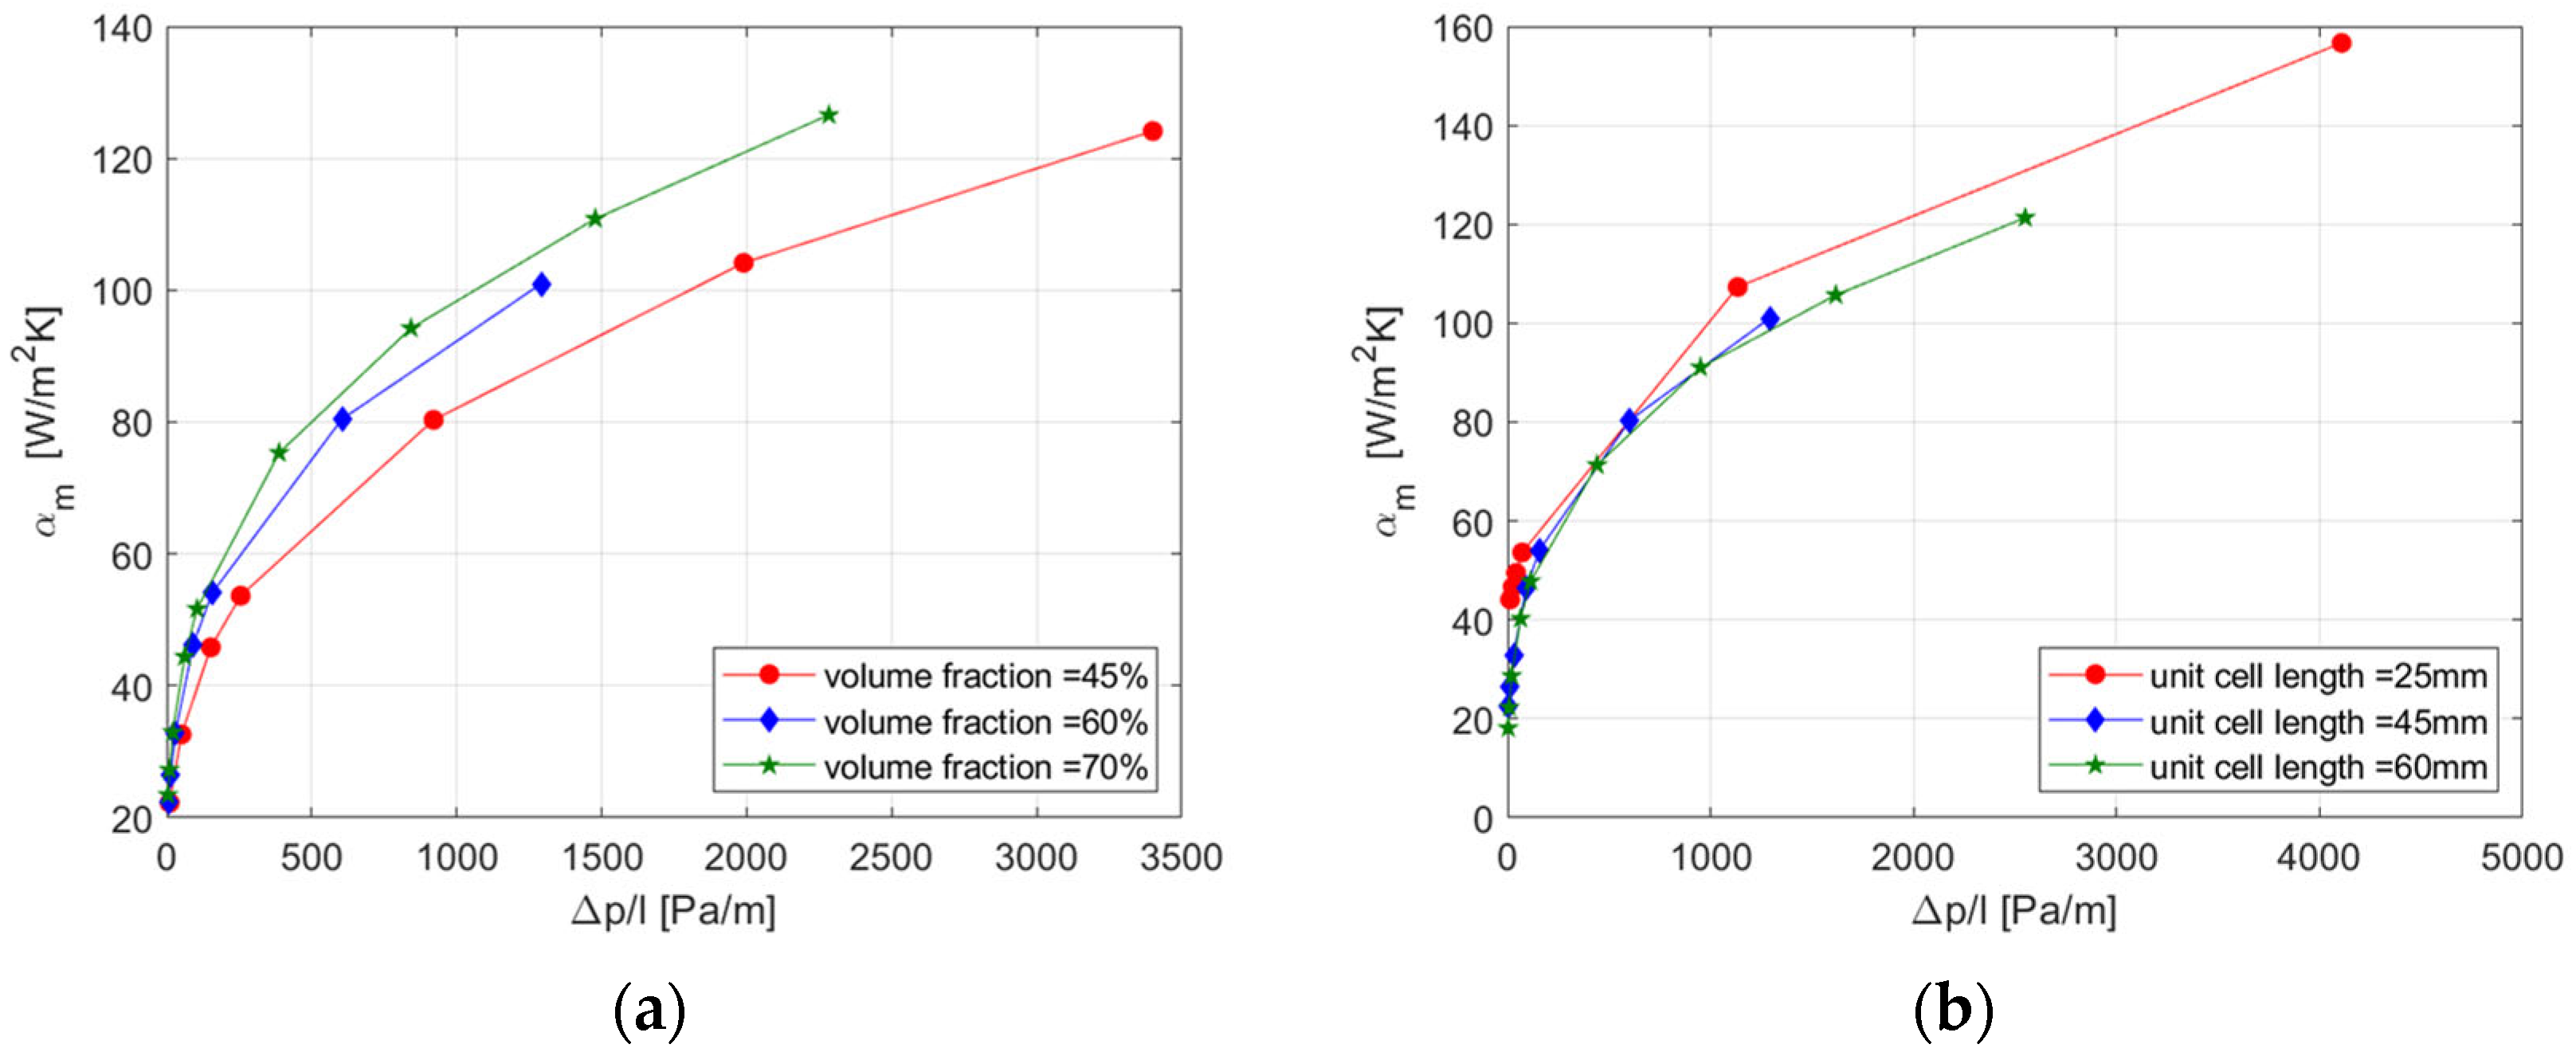
Figure 11.
Volumetric heat transfer coefficients vs. friction factors.
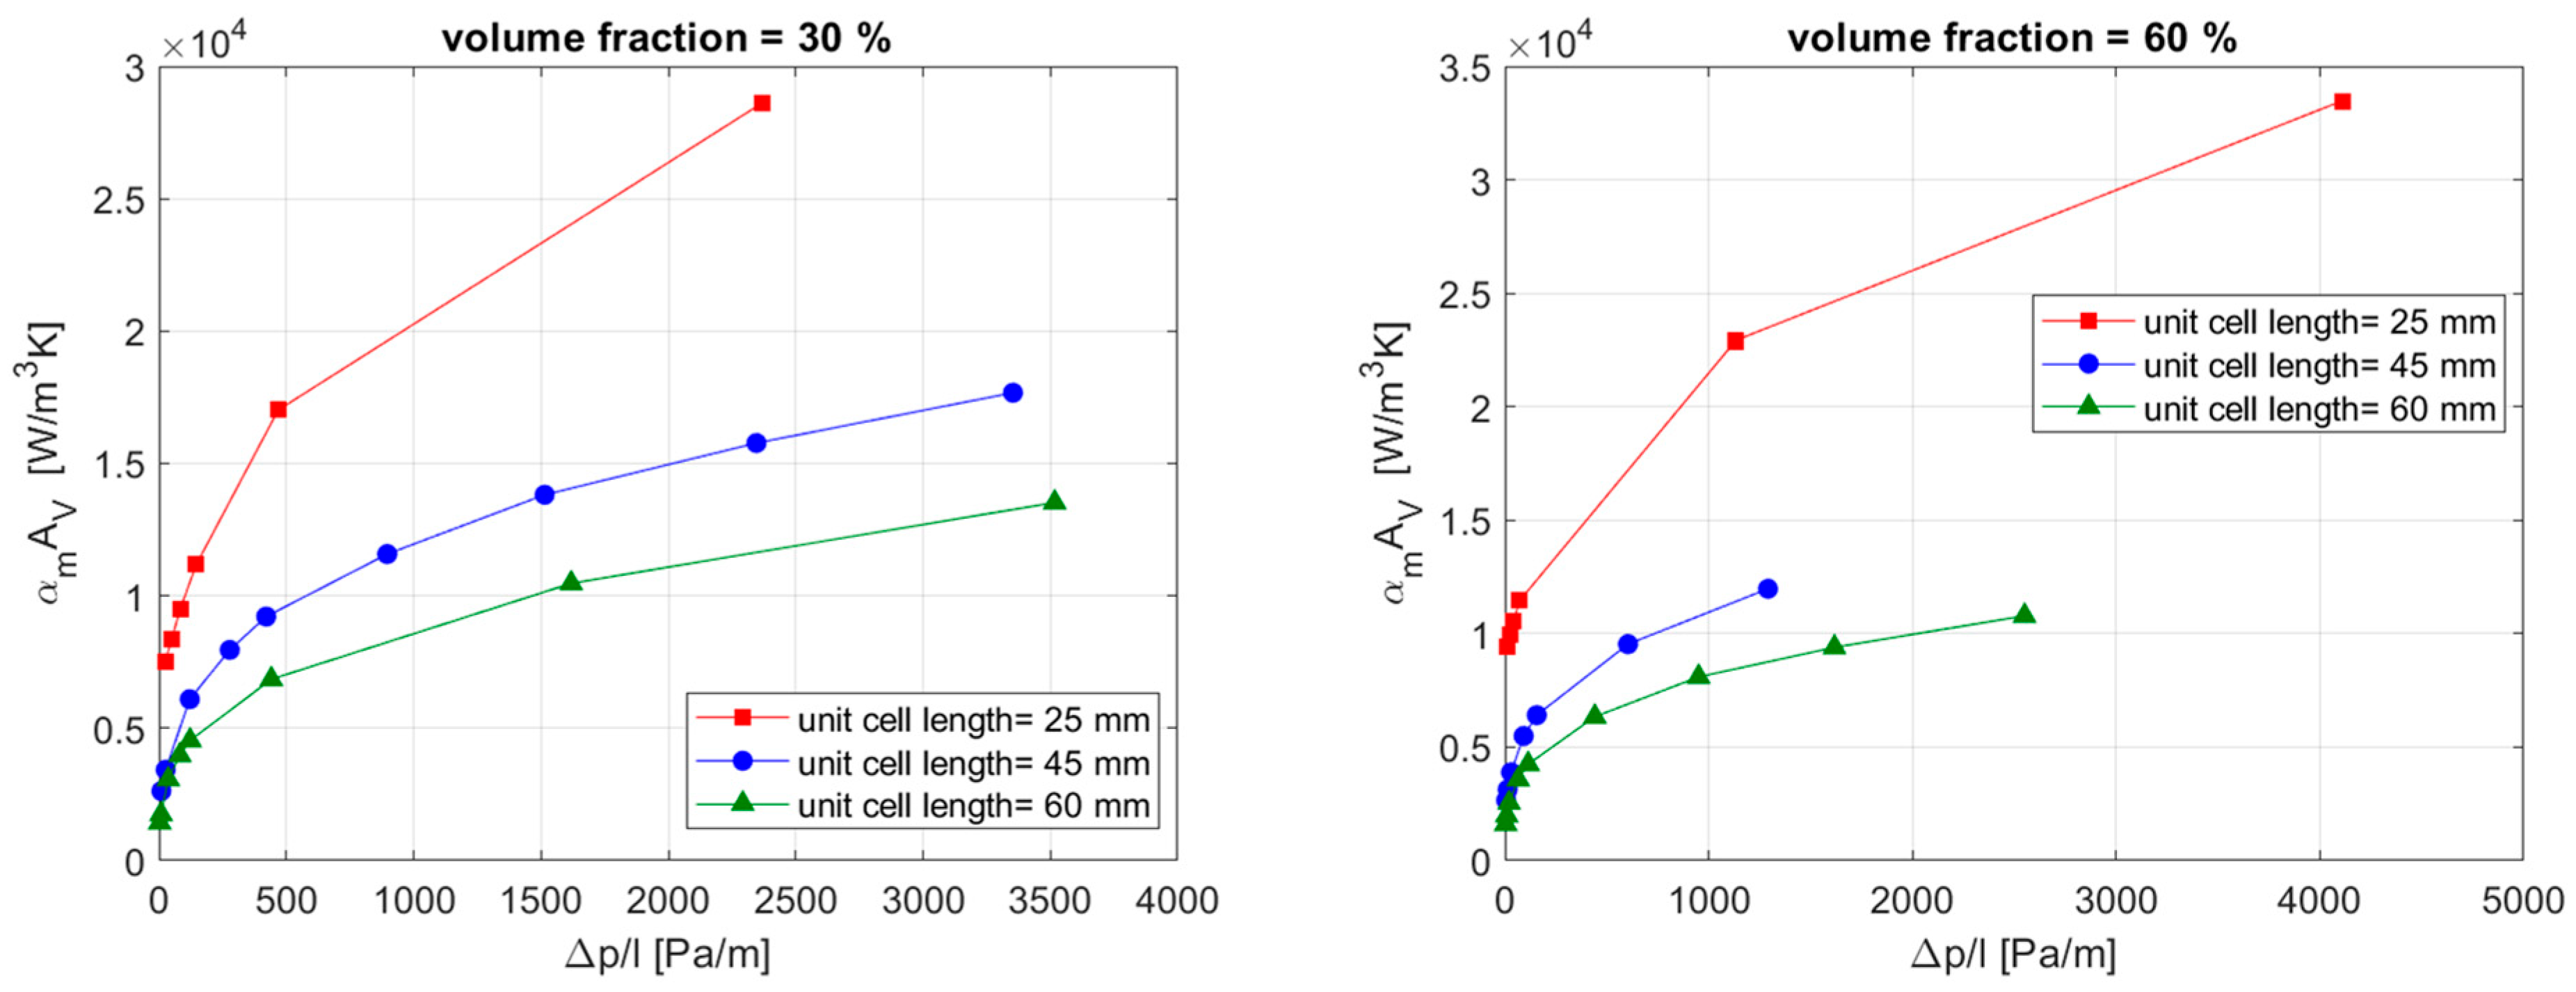
Figure 12.
Nusselt vs. Reynolds for different volume fractions of the FKS unit cell.

Figure 13.
Fit parameter B in terms of volume fraction ε: Nusselt correlation (left); friction factor (right).
Figure 13.
Fit parameter B in terms of volume fraction ε: Nusselt correlation (left); friction factor (right).
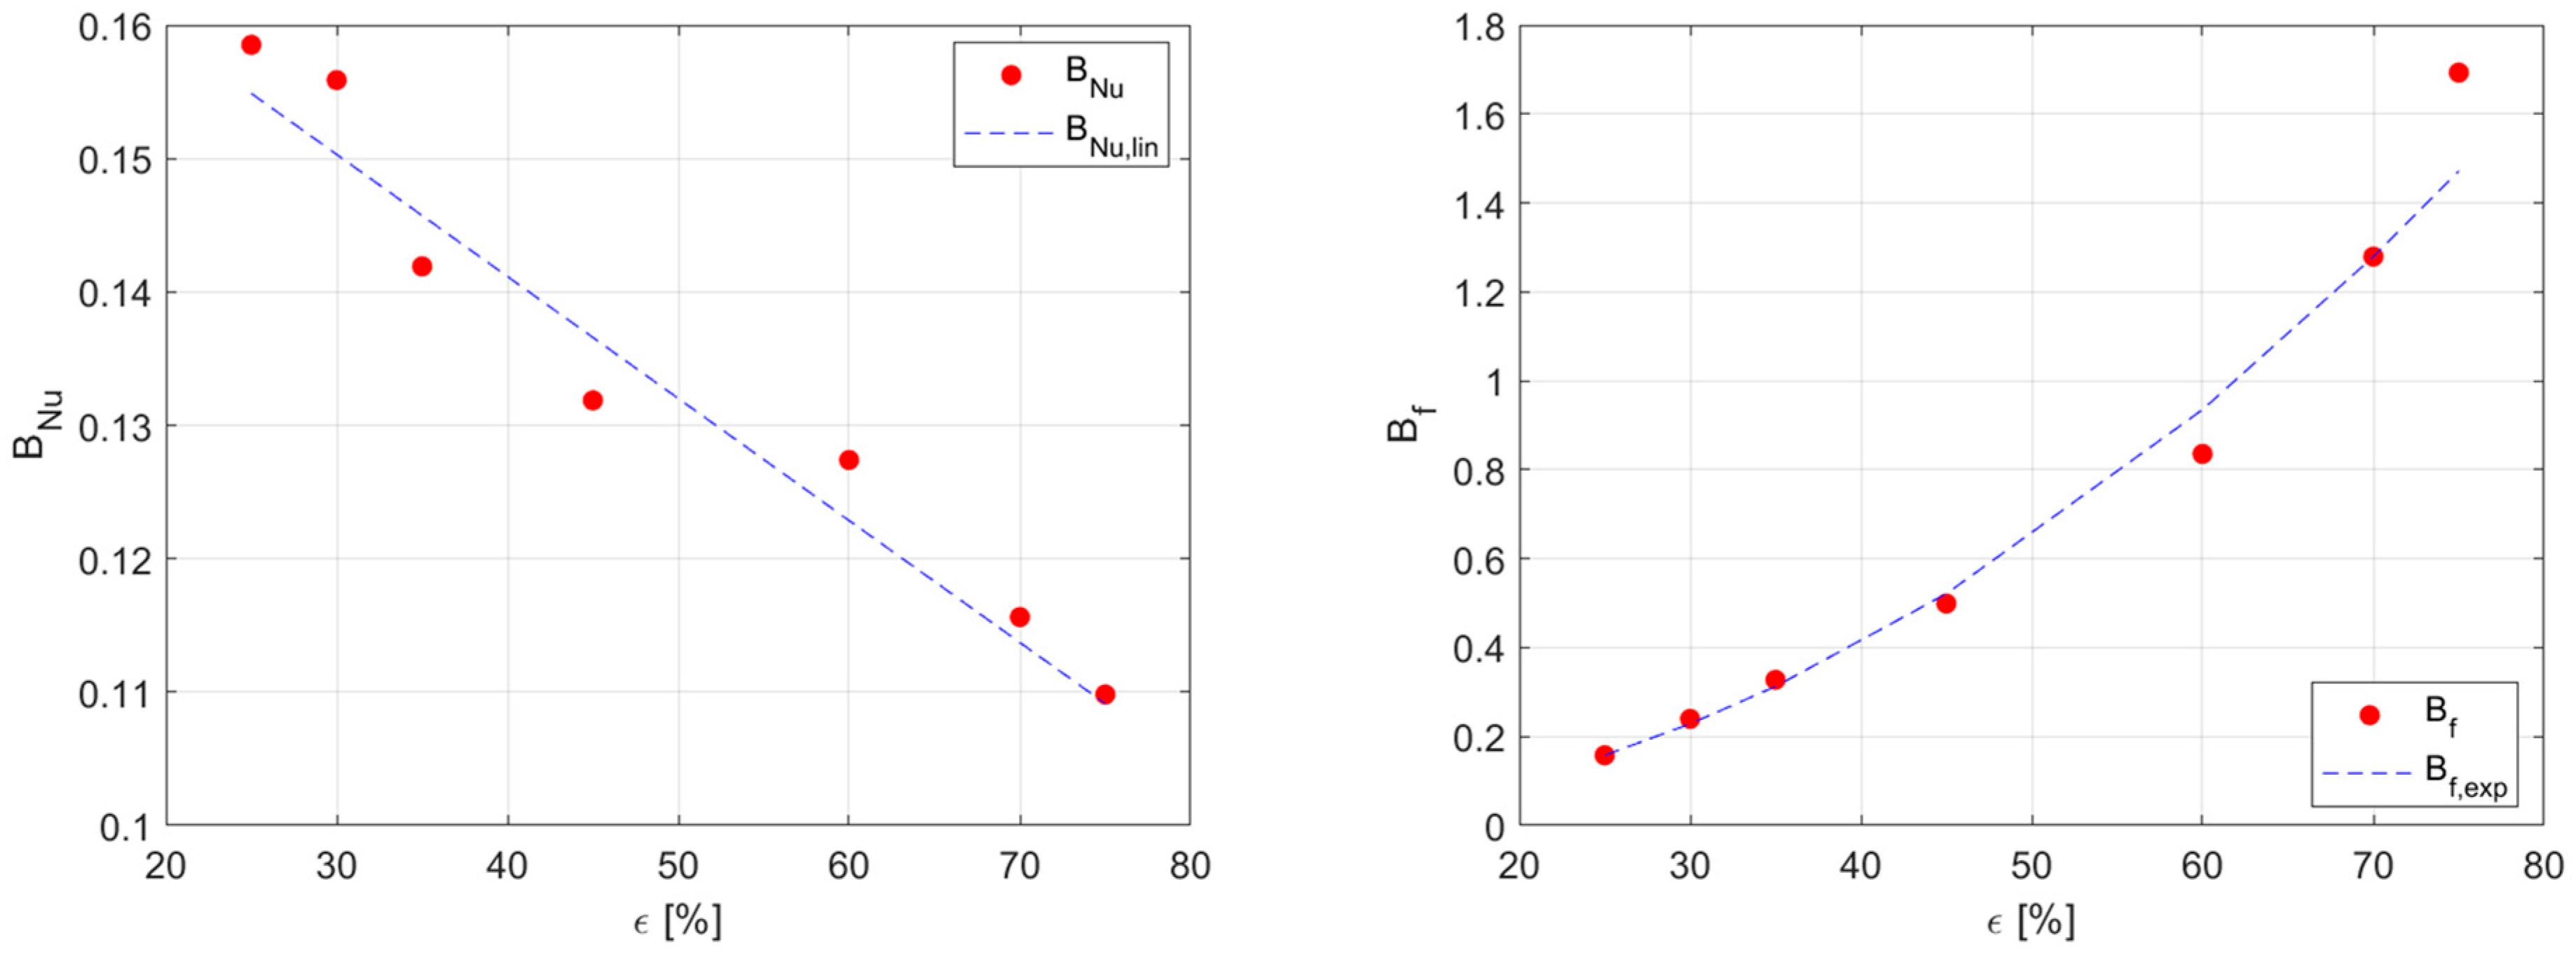
Figure 14.
(left) Fitted Nusselt functions; (right) fitted friction factor functions.
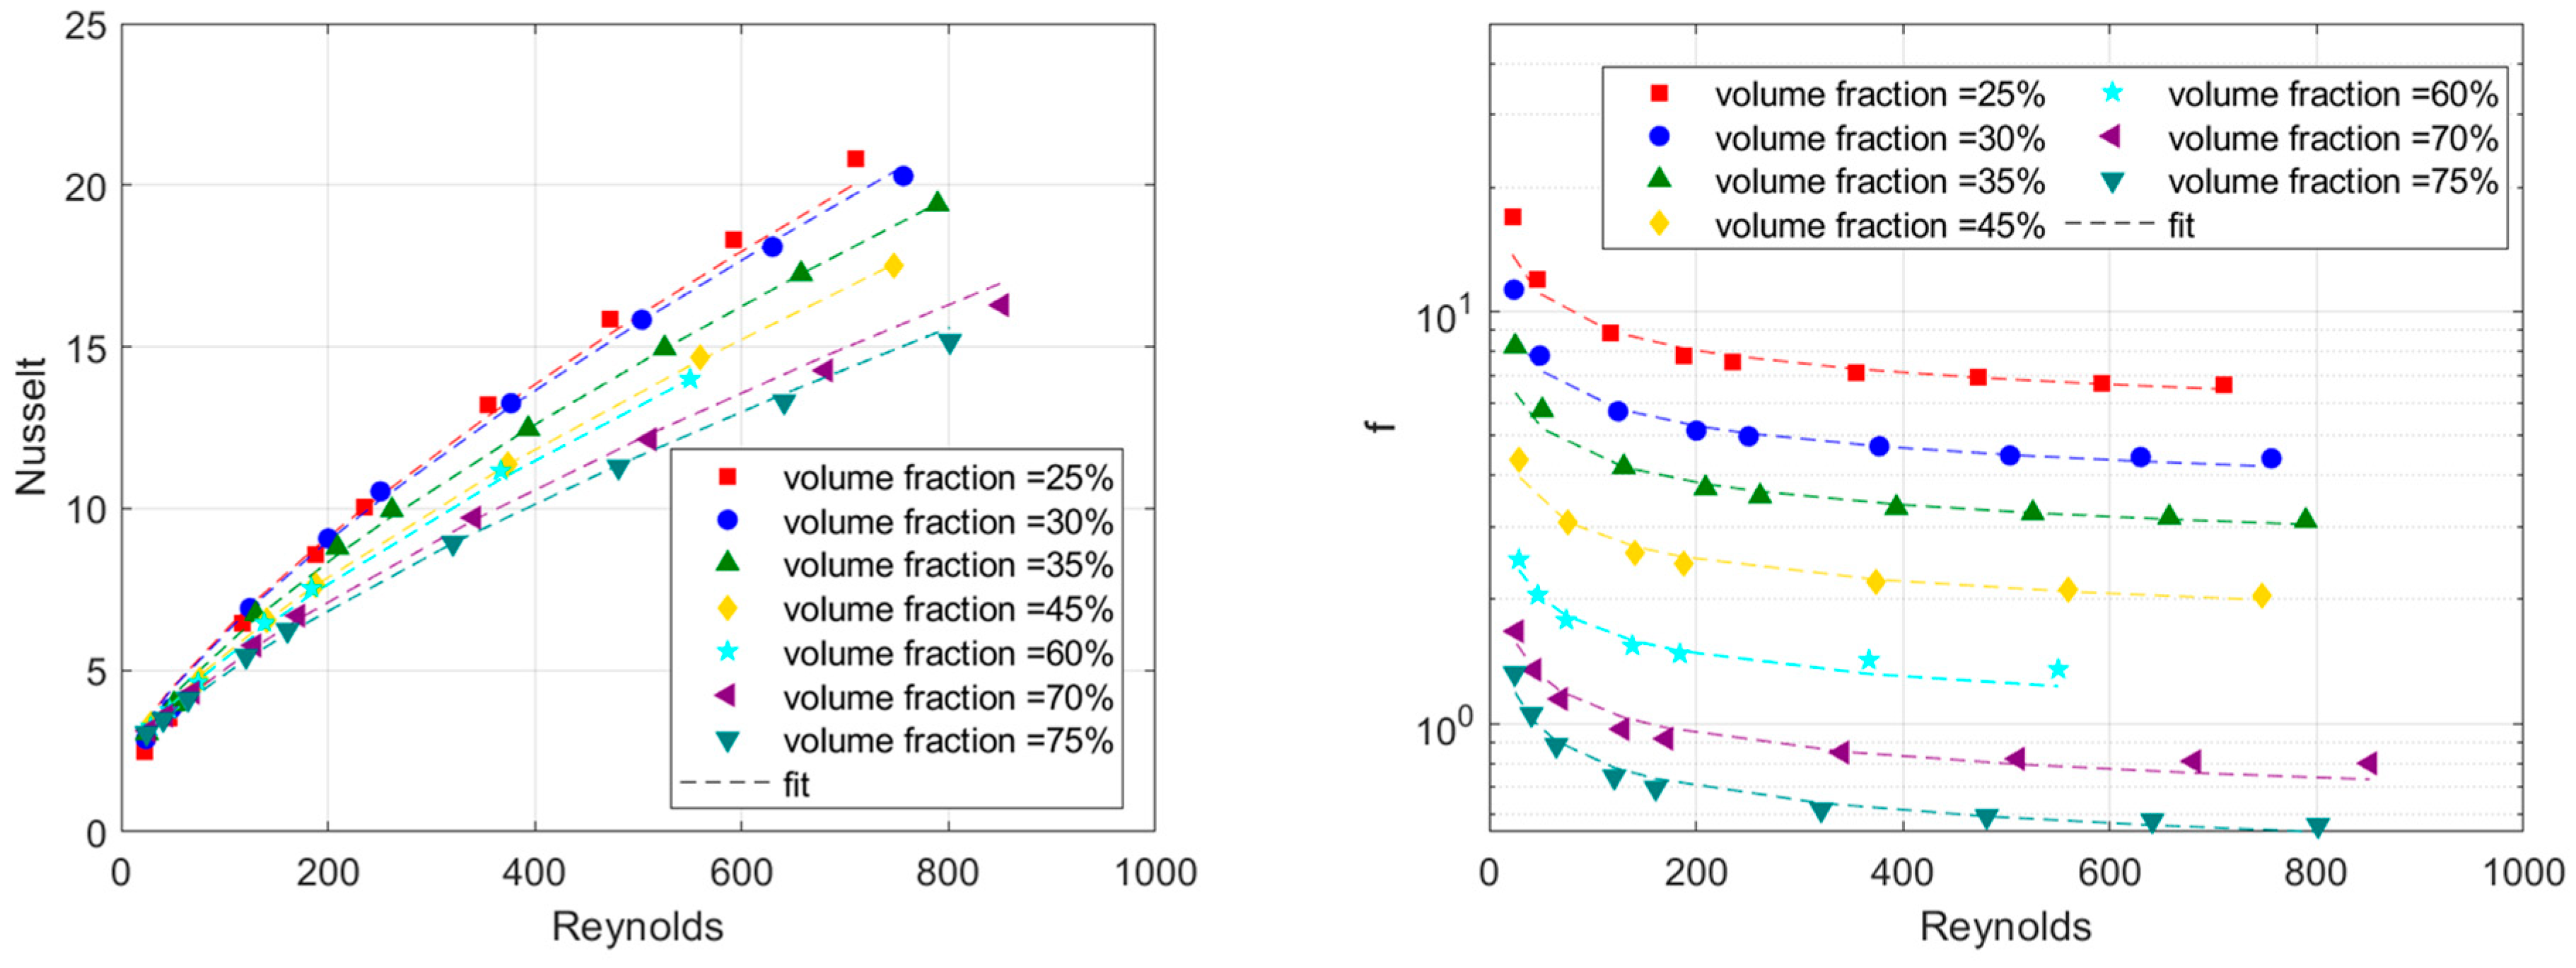
Figure 15.
Comparison between the FKS structure and a conventional plate heat exchanger: (a) specific surface area = 100 m2/m3; (b) specific surface area = 200 m2/m3.
Figure 15.
Comparison between the FKS structure and a conventional plate heat exchanger: (a) specific surface area = 100 m2/m3; (b) specific surface area = 200 m2/m3.


Table 1.
Simulated mass flows for different volume fractions.
| Volume Fraction [%] | Inlet Velocity vinlet [m/s] | |||||||
|---|---|---|---|---|---|---|---|---|
| 0.3 | 0.8 | 1.5 | 2 | 4 | 6 | 8 | 10 | |
| Mass Flow [kg/s] | ||||||||
| 45 | 1.21 × 10⁻⁴ | 3.23 × 10⁻⁴ | 6.06 × 10⁻⁴ | 8.08 × 10⁻⁴ | 1.62 × 10⁻³ | 2.42 × 10⁻³ | 3.24 × 10⁻³ | - |
| 60 | 1.48 × 10⁻⁴ | 2.47 × 10⁻⁴ | 3.96 × 10⁻⁴ | 7.42 × 10⁻⁴ | 9.90 × 10⁻⁴ | 1.98 × 10⁻³ | - | - |
| 70 | 1.68 × 10⁻⁴ | 2.79 × 10⁻⁴ | 4.47 × 10⁻⁴ | 8.38 × 10⁻⁴ | 1.12 × 10⁻³ | 2.23 × 10⁻³ | 3.35 × 10⁻³ | 4.47 × 10⁻³ |
| 75 | 1.78 × 10⁻⁴ | 2.97 × 10⁻⁴ | 4.75 × 10⁻⁴ | 8.90 × 10⁻⁴ | 1.19 × 10⁻³ | 2.37 × 10⁻³ | 3.56 × 10⁻³ | 4.75 × 10⁻³ |
Table 2.
Best fit parameters for and .
| Volume Fraction ε [%] | Fit Parameters Nusselt | Fit Parameters Friction Factor | ||||
|---|---|---|---|---|---|---|
| ANu | BNu | CNu | Af | Bf | Cf | |
| 25 | 1.818 | 0.159 | 0.722 | −0.051 | 0.158 | 0.148 |
| 30 | 1.818 | 0.156 | 0.722 | −0.051 | 0.240 | 0.148 |
| 35 | 1.818 | 0.142 | 0.722 | −0.051 | 0.328 | 0.148 |
| 45 | 1.818 | 0.132 | 0.722 | −0.051 | 0.499 | 0.148 |
| 60 | 1.818 | 0.127 | 0.722 | −0.051 | 0.836 | 0.148 |
| 70 | 1.818 | 0.116 | 0.722 | −0.051 | 1.279 | 0.148 |
| 75 | 1.818 | 0.110 | 0.722 | −0.051 | 1.693 | 0.148 |
Table 3.
Best fit parameters for and .
| Fit Parameters BNu,lin | Fit Parameters Bf,exp | ||
|---|---|---|---|
| mNu | kNu | mf | kf |
| −0.001 | 0.178 | 2.271 × 10⁻⁴ | 2.033 |
Disclaimer/Publisher’s Note: The statements, opinions and data contained in all publications are solely those of the individual author(s) and contributor(s) and not of MDPI and/or the editor(s). MDPI and/or the editor(s) disclaim responsibility for any injury to people or property resulting from any ideas, methods, instructions or products referred to in the content. |
© 2024 by the authors. Licensee MDPI, Basel, Switzerland. This article is an open access article distributed under the terms and conditions of the Creative Commons Attribution (CC BY) license (https://creativecommons.org/licenses/by/4.0/).
Share and Cite
MDPI and ACS Style
Knödler, P.; Dreissigacker, V. Fluid Dynamic Assessment and Development of Nusselt Correlations for Fischer Koch S Structures. Energies 2024, 17, 688. https://doi.org/10.3390/en17030688
AMA Style
Knödler P, Dreissigacker V. Fluid Dynamic Assessment and Development of Nusselt Correlations for Fischer Koch S Structures. Energies. 2024; 17(3):688. https://doi.org/10.3390/en17030688
Chicago/Turabian StyleKnödler, Philipp, and Volker Dreissigacker. 2024. "Fluid Dynamic Assessment and Development of Nusselt Correlations for Fischer Koch S Structures" Energies 17, no. 3: 688. https://doi.org/10.3390/en17030688
Note that from the first issue of 2016, this journal uses article numbers instead of page numbers. See further details here.