
Investigation of Energy Consumption of Office Spaces with Active Workstations

Department of Smart City Engineering, Inha University, Incheon 22212, Republic of Korea
*
Author to whom correspondence should be addressed.
Energies 2024, 17(3), 660; https://doi.org/10.3390/en17030660
Submission received: 21 December 2023
/
Revised: 19 January 2024
/
Accepted: 26 January 2024
/
Published: 30 January 2024
(This article belongs to the Section C: Energy Economics and Policy)
Abstract
:This study investigates the impact of an active workstation on heating and cooling energy consumption in commercial buildings. The improved performance and health of office workers are well-known and supported by several surveys and studies. However, the preferred and revised indoor air temperature for different activities of the employees, such as standing and walking, directly impacts the energy consumption of the building. Therefore, this study systematically quantifies the impact of indoor environments on building energy consumption using a simulation tool. Based on literature reviews with multidisciplinary fields, revised setpoint temperature, metabolic rate, and required outdoor air rate due to the level of active workstation (standing and walking) are applied to EnergyPlus reference building models. The impact on heating and cooling energy consumption is analyzed by considering several representative cities in the United States. Their average sensitivity was found to be 7.28% lower and 14.28% higher for heating and cooling energy, respectively. The total increment of $13,887 represents approximately 0.16% of the total profit of the corporation. This increment can be justified given the benefits to workers’ health, which include lower insurance costs and improved performance. This suggests that it is economically desirable to deploy active workstations widely.
1. Introduction
1.1. Background
1.1.1. Overview of Active Office Environment
A certain level of physical activity is crucial for reducing the risk of diseases, optimizing health, and preventing chronic conditions, including hypertension and osteoporosis [1]. According to a study in the United States, not meeting the recommended level of physical activity is associated with approximately $117 billion in annual healthcare costs and accounts for 10% of all premature deaths [2]. However, despite these risks, office workers—especially those with sedentary jobs—engage in relatively little physical activity at work, and this sedentary office culture has been identified as a significant health issue [3]. A systematic literature review demonstrated that designing active office spaces can encourage the increase in physical activity of office workers for their health management [4]. The implementation of active workstations or activity-based flex offices (AFOs) is increasing, and research on the impact of AFOs on productivity, satisfaction, workspace, and health is gaining momentum [5,6]. According to [7], the implementation of active workstations in static workspaces generally improved the overall health status. Studies on activity-based office environments have reported increased work efficiency [8,9]. Furthermore, the researchers investigated how cognitive abilities and typing skills change between sitting and active workstations [10]. They reported improved performance on the Paced Auditory Serial Addition Test (PASAT) and Flanker task using active workstations, whereas performance on the Rey Auditory Verbal Learning Test (AVLT) decreased. Regarding typing skills, participants showed better performance on active workstations, and there were no significant differences in cognitive abilities or typing skills between cycling and treadmill workstations. However, other studies have reported that decreased concentration and lack of privacy might reduce productivity [11,12]. Moreover, the impact of an active workstation on work efficiency depends on the workspace [13]. Similarly, there is a high correlation between work quality, productivity, and health [5]. They highlighted the importance of appropriately implementing active workstations considering job content and associated factors. In another research conducted on active chairs [14], it was deduced that while actions like standing or walking may not offer the benefits of micro-breaks, active chairs could increase the amount of blood supplied with oxygen without inducing physical fatigue. Additionally, since there might be tasks that cannot be performed while standing or walking, the use of active chairs could be a healthier option compared to standard office chairs. Various studies demonstrate the health benefits of implementing an active workstation compared to standard sitting. However, none of those discussed nor investigated the impact of the active workstation on building energy consumption and corresponding cost expenditure. Therefore, the motivation of this study is to present the economic feasibility of implementing active workstations in commercial buildings through a simulation study and cost assessment.
1.1.2. Recent Trends for Active Office Environment
Recently, many corporations have prioritized the implementation of active workstations [15]. Apple’s CEO, Tim Cook, coined the phrase “sitting is the new cancer” and promoted regular standing and movement, arguing that it is preferable to always being seated. Additionally, they have provided 100% of their employees with standing desks [16]. In her TED talk, Fast Company’s contributor Nilofer Merchant, referred to “sitting as the new smoking” because sitting for extended periods endangers one’s health [17]. Consequently, they adopted a standing workstation and reported positive health effects [18,19]. Furthermore, many companies emphasize the advantages of health programs and highlight their benefits for employee well-being [20].
1.2. Literature Review
1.2.1. Desired Temperature in Activity-Based Flex Office
When applying an active workstation to the office environment, the indoor setpoint temperature preferred by the employees may differ from that of standard operation. Gao et al. reported that the ideal temperature in the office environment for the TRD (walking and typing) condition was 23.2 °C, which was 2.7 °C lower than the SED (sitting and typing) condition [21]. Gao et al. reported the impact of exercise behavior on thermal comfort in winter. As the duration of exercise increased, the preferred temperature continuously decreased (14 °C) [22]. In one study, the researchers used experiments to report Metabolic (Met) variations based on various human behaviors [23]. Furthermore, according to the American Society of Heating, Refrigerating, and Air-conditioning Engineers (ASHRAE), the metabolic rates for seated activities, writing, typing, and walking are 55 W/m2, 60 W/m2, 65 W/m2, and 100 W/m2, respectively [24]. Another study reported the impact of employees’ behavior on indoor temperature stratification changes. Compared to sitting, there is an increase in temperature of approximately 1 to 2 °C from the floor up to 1 m in height when walking [25]. This increased temperature needs to be resolved by cooling, resulting in increased energy consumption in an active office environment.
1.2.2. Impact of Activity-Based Flex Office on Building Energy Consumption
As discussed above, the preferred temperature range of employees changes according to the active office environment. Typically, these environments increase the metabolic rate with more active behavior, thereby lowering the setpoint temperature during the summer, leading to increased cooling energy consumption. Conversely, during the winter, the lowered setpoint temperature results in reduced heating energy consumption [26]. reported that through EnergyPlus simulation, altering the setpoint temperature by 1 °C during cooling and heating seasons may save almost 10% on energy [26]. However, no research has been conducted on the energy consumption resulting from setpoint changes based on active workstations.
1.2.3. Energy Simulation Tools
It is appropriate to evaluate the impact of the variable changes on an actual building because the building is not a product manufactured or printed in a factory. For this purpose, building energy simulation can be used to simulate the impact of the room air temperature setpoint or heating, ventilation, and air conditioning (HVAC) operation. These simulation tools have been developed for a long period, starting with the 1970 energy crisis. More than 50 simulation tools that focus on the infiltration [27] and energy consumption [28] of commercial and residential buildings across the world have been invented. Most programs have evolved, united, and vanished as the main algorithm is based on heat transfers, including conduction, convection, radiation, and mass transfer for air/contaminant movement. One of the extant programs is EnergyPlus, developed by the U.S. Department of Energy [29], which has evolved from predecessors such as BLAST, DOE-2, and eQUEST.
EnergyPlus can perform dynamic simulations, allowing for hour-by-hour analysis throughout the year. This level of detail is particularly beneficial for studying the effects of variable weather conditions and operational schedules. Compared to relatively simplified tools such as Simplified Building Energy Model (SBEM) [30] or Building Energy Simulation Test (BESTEST) [31], which are quicker and thereby require less information, EnergyPlus needs more detailed information and a corresponding learning curve for the users, which might be the cons for those who need straightforward simulation results. Moreover, compared to its predecessors, EnergyPlus provides more detailed and dynamic simulations. While DOE-2 is effective for simpler and quicker energy analyses, EnergyPlus excels in detailed hour-by-hour simulations necessary for understanding the precise impacts of specific design or operational changes in buildings. In addition, this can combine building physics, such as heat transfer via the envelope between indoor and outdoor environments and HVAC systems [32]; therefore, it is widely used and adopted for various research works and studies [33,34,35]. Compared to other typical advanced energy simulation tools such as TRNSYS [36], this can leverage the reference building models developed based on the EnergyPlus file. Moreover, EnergyPlus is more focused on the building envelope while the development of TRNSYS is more oriented for the HVAC side.
1.2.4. Reference Building Models
In energy simulation, two different types of building energy models can be considered: a realistic building model and another is a reference building model. Selecting an appropriate model is crucial for achieving desired outcomes [37]. A realistic building model is appropriate to evaluate an energy simulation focusing on a specific target building. However, corresponding experiments may be needed to calibrate the building model with actual measured data. This requires engineering costs for installing sensors and measuring building energy/environment-related data. Moreover, a realistic building model cannot be applied to other buildings because the design and scale are exclusive to the target building [38]. However, the most commonly used method in building performance simulation is the reference building model. The U.S. Department of Energy developed reference-building models for 16 climate zones and several vintages between 2012 and 2019 [29]. Sixteen commercial and two residential models were developed, providing the general scale and floor plan. This approach has been applied in developing residential models in other countries, such as India [39] and South Korea [40]. By eliminating the need for 3D modeling and calibration, this approach can improve standardization and lower the engineering cost of modeling the building envelope [41]. While some believe that the reference building model’s application may vary based on the region [42], this approach may be the most effective and can be extended to other cases as long as the appropriate configuration of the variables and their weightings are applied [43]. Therefore, many studies use the reference building model to quantify and calculate the heating and cooling energy consumption of the buildings to assess the impact of the key variables [44].
1.3. Objectives
This study quantified the impact of an active workstation in an office on energy consumption and the cost of HVAC operation in commercial buildings. As discussed in the introduction, it has been established that the performance and health of employees can be improved with such an active workstation. However, the impact on the buildings’ energy consumption and corresponding operational costs is uncertain. Given that the building consumes almost 25% of all energy consumption in transportation and other industries, quantification of its impact is crucial considering the future workstation, where employee well-being will be critical. Commercial buildings, particularly office spaces, are significant consumers of energy due to their extensive use of heating, cooling, and lighting systems. Moreover, more active workstations could be deployed in office environments in commercial sectors than in residential ones. In this regard, we aim to focus on a sector that has a substantial impact on overall energy consumption and has considerable potential for energy efficiency improvements.
2. Methodology
2.1. Scope of This Study
This study focuses on quantifying the building’s energy consumption influenced by the active workstation. Figure 1 presents the research flow and scope of this study. The impact of each factor is connected by a black-lined arrow, whereas the results (increased or decreased) are shown by a gray-shaped arrow. The scope of this study is shown by a shaded rectangle titled “Building energy simulation”. The impact of the remaining part is not calculated or quantified but has been addressed in the introduction. Therefore, unfortunately, the total cost that could be regarded as the annual profit and expenditure for employee health insurance is not recorded.
2.2. Simulation Tool
We used the EnergyPlus simulation tool for building energy simulations. The reference building model of commercial medium-sized buildings was applied considering different climate zones in the United States, including Los Angeles, San Francisco, Chicago, Colorado, Boulder, and Phoenix [29]. Therefore, five individual energy files (Idf) with different envelope characteristics such as insulation for climate zones, were used. The corresponding typical meteorological year 3 weather packed with actual measured data for several years—each month’s data composed of the most representative data were used. The medium-sized office building has a default HVAC system packaged with a multi-zone variable air volume (VAV). To maintain the setpoint temperature, this air conditioning system adjusts the supply air volume via the air handling unit in the VAV terminal box for both heating and cooling loads.
3. Evaluation with Building Energy Simulation
3.1. Simulation Settings
This study quantifies the impact of an active workstation on building energy consumption using the EnergyPlus simulation tool. The reference building model of commercial medium-sized buildings is applied considering different climate zones in the U.S. with representative cities including Los Angeles, San Francisco, Chicago, Colorado, Boulder, and Phoenix. Figure 2 shows the 3D view and floor plan of the reference building model, which faces south. The medium-sized office building consists of three stories, a total floor area of 4982 sq. meters, and a 33% window-to-wall ratio. The thermal characteristics of the building envelope are structured with steel frame walls, a built-up flat roof (insulation above the deck), and a slab on the grade floor according to ASHRAE standard 90.1. The thermal performance of the envelope varies with climate zones. A total of 89 employees were considered for each floor, resulting in 268 employees for the building.
The simulations were performed with three activity levels at different times of the day, following a typical office schedule: sitting (2 h), standing (1 h), and walking (1 h) in the morning (8 a.m.–12 p.m.). These activities were then repeated in the afternoon (1 p.m.–5 p.m.). The metabolic rates for sitting, standing, and walking were individually set to accurately reflect the energy expenditure associated with each activity during the simulation, as reported by [29]. The heating and cooling setpoint temperatures were set following the guidelines in [45,46]. The cooling setpoint temperature ranged from 22 to 26 °C, while the heating setpoint temperature from 19 to 23 °C. The heating and cooling setpoint temperatures were associated with varying thermal comfort; thus, the setpoint temperature was adjusted based on the specific activities. Based on previous studies, there was around 2 °C decrease during the transition from sedentary to standing and walking, respectively [21,25]; specifically, a decrease from 26 °C to 24 °C for standing and 26 °C to 22 °C for walking in the cooling season, and 23 °C to 21 °C for standing and 23 °C to 19 °C for walking in the heating season, were assumed. There is a small deviation between the reference and our setting, but we applied the round-off to make the integers as typical HVAC systems only require the integer. This approach allowed a more realistic representation of employee thermal comfort and energy consumption in response to the dynamic nature of activities within the office space. The outdoor airflow required to maintain thermal comfort is influenced by several factors, including the number of employees and activity levels. During periods of high metabolic activity, such as walking or standing, employees generate more heat, increasing the demand for outdoor air to maintain indoor air quality and thermal comfort. Conversely, during periods of low metabolic activity, such as sitting, the outdoor airflow per person can be adjusted to a lower level to match the reduced metabolic rate and lower heat generation. Thus, the outdoor airflow per person varies for different activities, as summarized in Table 1.
3.2. Simulation Results and Analysis
The reference building model was simulated with a typical occupancy schedule, assuming that employees were seated, to compare the impact of building energy consumption on an active workstation. The corresponding metabolic rate and setpoint temperature were applied to the energy expenditure and associated thermal comfort as explained previously and summarized in Table 1. Several simulation cases were set to investigate the impact of each variable on heating and cooling energy consumption, as summarized in Table 2.
Those three key variables are essential for evaluating the energy impact of implementing the active workstation. Their impacts are independent in simulation, and quantification is carried out to investigate the individual impact for the systematic analysis. However, in reality, when the active workstation is applied, the three variables impact energy consumption simultaneously as long as the HVAC is operated, satisfying the thermal comfort of the occupants, and the metabolic rate of the occupants is in the normal range.
Figure 3 represents the impact of each variable—setpoint temperature, outdoor air requirement, and metabolic rate—on building energy consumption in an active workstation. The simulations were run with these separate cases to evaluate the impact of each variable change. During case 2, the setpoint temperature is only considered when it ranges from 22 to 26 °C in the case of cooling, while the heating setpoint temperature ranges from 19 to 23 °C (the setpoint temperature shifts for each type of activity during the day). For instance, while standing and typing, the cooling and heating setpoint temperatures are maintained at 24 °C and 21 °C, respectively, while they are maintained at 22 °C and 19 °C when walking and typing, respectively. In contrast to the baseline referred to as case 1, there was an average decrease of 12.78% in energy consumption during heating and a 12.93% increase during cooling. When only outdoor air was considered, as in case 3, energy consumption increased by an average of 2.7% and 1.17% for heating and cooling, respectively. It was observed that more outdoor air is introduced during the hours when activities with high metabolic rates and low setpoint temperatures, such as walking and typing, are performed. The impact of metabolic rate (case 4) on building energy was less pronounced. During the heating season, there was an average decrease of 0.5% in building energy consumption, whereas an average increase of 0.22% was recorded during the cooling season.
In case 5, the final active workstation where all variables, such as setpoint temperature, outdoor air, and metabolic rate, were considered, an average decrease of 7.28% and an average increase of 14.28% in building energy consumption during the heating season and cooling seasons were observed, respectively. During the heating season, an active workstation is advantageous because it generates internal heat gain by operating at a lower setpoint temperature and an increased metabolic rate, which is the opposite of the cooling season. A lower setpoint temperature increases the cooling requirement and increases the employees’ metabolic rate. In heating seasons, active workstations can lead to significant energy savings, whereas the impact is less pronounced in cooling seasons. This is because the metabolic heat generated by employees is more effective at offsetting the need for cooling energy in heating than in cooling. As the ventilation requirements increase, the heating and cooling requirements increase as more outside air is introduced. This is unfavorable regarding heating/cooling energy as the HVAC system will have to work to condition the outdoor air to the desired temperature.
Figure 4 represents the box plot of the effect of active workstations on building energy consumption. The reference building’s model of commercial medium-sized buildings is used in the simulation, considering several climate zones in the United States, including Los Angeles, San Francisco, Chicago, Colorado, Boulder, and Phoenix. The range of energy consumption for heating and cooling, regardless of an increase or decrease, is shown. For instance, it can be observed that, during the heating season, energy consumption falls between 10% and 13.32%, while across various climate zones, energy consumption increases between 10.04% and 18.06% when the setpoint temperature varies with different activity schedules. During active workstations, energy consumption increases up to 20.15% during cooling and decreases up to 12.87% during heating.
In the baseline scenario, the occupants were assumed to be sitting and working. Thus, a constant setpoint temperature is maintained for both heating and cooling, with a fixed metabolic rate of 120 W/m2 and a constant fresh outdoor air flow rate. However, in the active workstation, this set of variables changes based on the pre-defined activity schedules. For instance, during high metabolic activity with the active workstation, more heat is generated from the occupants and thus, more cooling is required for the cooling season to satisfy the thermal comfort. An average increase of 14.28% in cooling energy was observed among different cities. This negative impact is the opposite of that of the heating season. An average decrease of 7.28% in heating energy consumption was noted.
Furthermore, the analysis highlights the unfavorable increase in ventilation requirements, as more outside air is introduced when the active workstation is on. This leads to a proportional rise in heating and cooling demands, necessitating additional work from the HVAC system to condition the outdoor air to the desired indoor temperature.
3.3. Cost Analysis
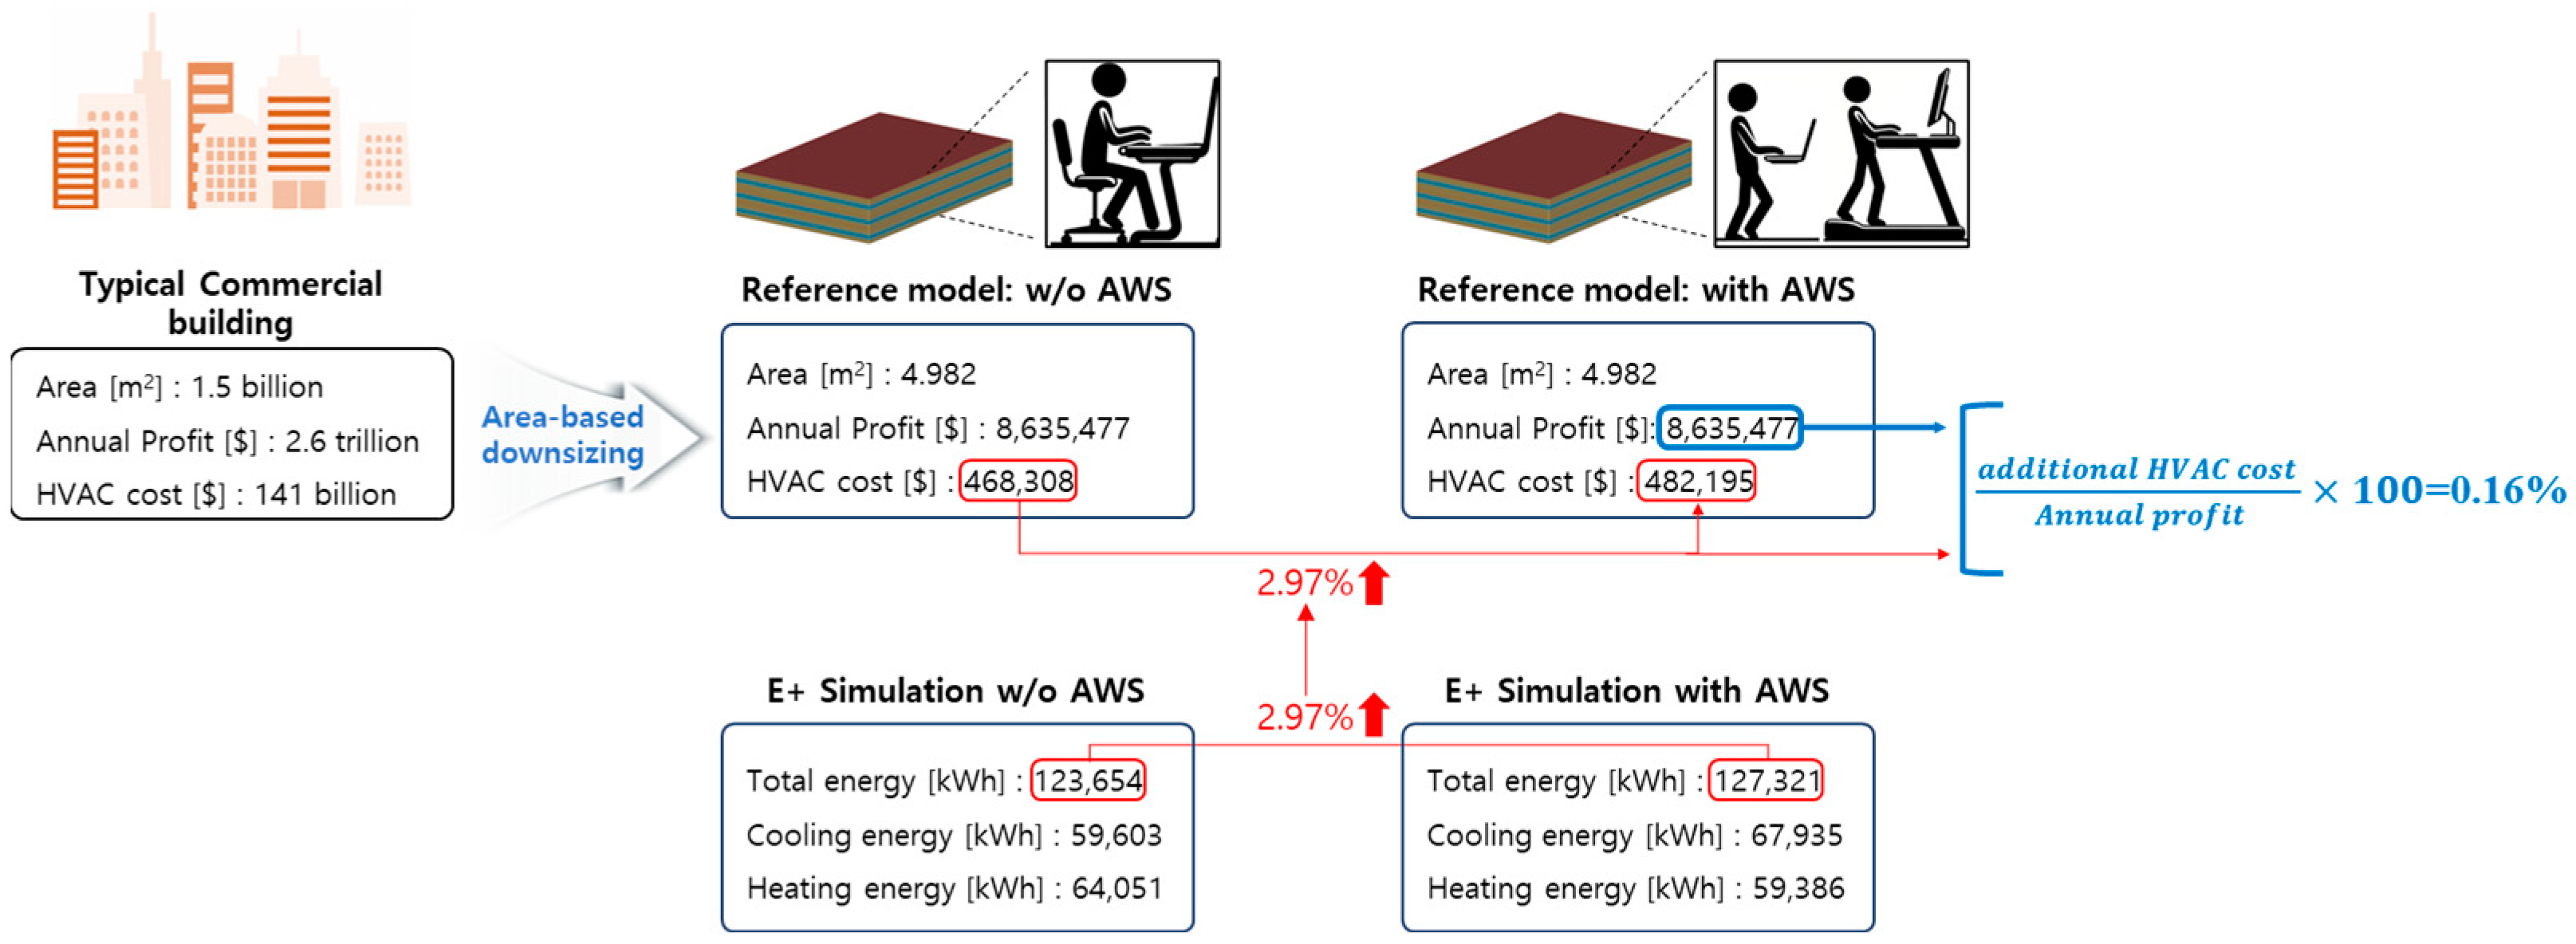
Figure 5 illustrates the cost analysis result of the active workstation. First, the annual profits of the average U.S. commercial buildings in the first quarter of 2023 were surveyed based on the information in literature [47] published by Trading Economics, U.S. Additionally, information on HVAC costs and areas in commercial buildings were investigated based on the U.S. Energy Information Administration [48,49] (Source Credibility: The HVAC cost and area data for commercial buildings were derived from the U.S. Energy Information Administration (EIA), a highly reputable and reliable source for energy-related information. The EIA is known for its comprehensive and up-to-date data on energy consumption, pricing, and utility costs, making it an appropriate source for our study) (Contextual Relevance: The EIA data reflect broad trends and averages across a wide range of commercial buildings in the U.S. These broad-based data provide a solid foundation for generalizing the HVAC costs to the type of medium-sized office buildings modeled in our study.). The findings revealed an annual profit of $2.6 trillion, HVAC costs of $141 billion, and an average area of 1.5 billion m2 for commercial buildings. The annual profits and HVAC costs per floor area were $1733/m2 and $94/m2. Then, the annual profit and HVAC cost were downsized following the floor area of the typical commercial building and reference building model. It was found that the annual profits (Pref) and HVAC cost (Cref) of the scale-downed reference model are $8,635,477 and $468,308 based on the following equations:
P and C refer to the annual profit and cost for HVAC operations, respectively. The subscript ref and typ refer to the reference model we are analyzing and the typical commercial building, respectively.
According to the EnergyPlus simulation with reference commercial building model, the average heating and cooling energy consumption of the five cities was 64,051 kWh and 59,603 kWh, respectively. When the active workstation is applied, the heating energy decreases to 59,386 kWh and cooling energy increases to 67,935, which yields 2.97% of the total energy increment. This ratio (EnoAWS/EAWS) is multiplied by the HVAC cost (Cref) ($468,308) of the reference model without an active workstation to calculate the HVAC cost of the reference model with an active workstation (Cref(AWS)) ($482,195) as follows:
Therefore, the additional HVAC cost resulting from the implementation of active workstations is approximately $13,887 (Cref(AWS) – Cref). This is only 0.16% of the company’s annual profits.
4. Conclusions and Discussion
This study investigated the energy impact of an active workstation in an office environment. To provide practical insight, a building energy simulation using the EnergyPlus reference building model was performed considering various climates and a realistic activity schedule. The simulation results are summarized as follows:
- Variables including setpoint temperature, outdoor air requirement, and metabolic rate were found to have different impacts on energy consumption.
- Implementing the active workstation, heating energy is decreased, while cooling is increased. The average variation from the simulation results for different cities was found to be 7.28% decreased heating and 14.28% increased cooling, respectively.
- The augmented cost from active workstations is negligible. It comprises about 0.16% of the annual operating profit of the commercial building.
Based on the simulation results, the contributions and limitations of this study are discussed as follows:
- Addressing a growing trend: The adoption of active workstations in office environments is an emerging trend, propelled by the need to mitigate health risks associated with sedentary lifestyles and improve work performance. Our study aligns with this shift in office culture and provides insights into how it influences energy consumption of the HVAC operations.
- Balancing benefits and energy costs: While the health benefits and improved work performance of active workstations are well-documented, their impact on energy consumption was less understood. Our study addresses this gap by quantifying the energy implications of these workstations, offering a practical perspective for businesses, building designers, and engineers to balance health benefits and improved work performance with energy efficiency.
- Informing policy: The comprehensive analysis of energy consumption patterns in offices with active workstations offers valuable data for policymakers. This information is crucial for developing strategies that optimize energy use while fostering healthier work environments. However, this optimized design and configuration, along with the appropriate policy, might need more health-related data collected from the workers over a long-term period. To gear the research in this direction, a more interdisciplinary approach involving various experts from different domains is required. This study is one of the initial steps for this research vision.
- Economic feasibility: The additional cost incurred from implementing active workstations is relatively small, amounting to about 0.16% of a commercial building’s annual operating profit. This finding highlights the economic feasibility of adopting active workstations, considering their health benefits. Therefore, this study provides a foundation for future research and practical applications in designing healthier and more energy-efficient office environments. However, the additional cost for implementing the active workstation needs to be considered when investigating the economic applicability compassing the life cycle cost or life cycle assessment.
- Limitations on analysis: This study applied synthetic schedules for active workstations based on assumptions. Moreover, the thermal performances of reference building models with different weather profiles might not be representative. Lastly, the economic analysis with the simulation results is based on a rough approximation from public data. Downsizing from a typical commercial building to a reference simulation model was conducted based on the total floor area, which entails an approximation. Therefore, the results of this study might be limited in their capacity to provide useful insight to researchers and practitioners potentially involved in active workstations.
Author Contributions
Conceptualization, J.J.; methodology, J.J.; writing—original draft preparation, J.J., J.P., K.C. and A.T.; writing—review and editing, J.J., J.P., K.C. and A.T.; visualization, J.J., J.P. and A.T. All authors have read and agreed to the published version of the manuscript.
Funding
This work was supported by an INHA University Research Grant.
Institutional Review Board Statement
Not applicable.
Informed Consent Statement
Not applicable.
Data Availability Statement
Data are contained within the article.
Conflicts of Interest
The authors declare no conflicts of interest.
References
- Physical Activity Guidelines Advisory Committee Scientific Report. Available online: https://health.gov/sites/default/files/2019-09/PAG_Advisory_Committee_Report.pdf (accessed on 27 July 2023).
- Carlson, S.A.; Fulton, J.E.; Pratt, M.; Yang, Z.; Adams, E.K. Inadequate Physical Activity and Health Care Expenditures in the United States. Prog. Cardiovasc. Dis. 2015, 57, 315–323. [Google Scholar] [CrossRef] [PubMed]
- Sawyer, A.; Smith, L.; Ucci, M.; Jones, R.; Marmot, A.; Fisher, A. Perceived office environments and occupational physical activity in office-based workers. Occup. Med. 2017, 67, 260–267. [Google Scholar] [CrossRef] [PubMed]
- Systematic Review of the Influence of Physical Work Environment on Office Workers’ Physical Activity Behavior. Workplace Health Saf. 2022, 70, 97–119. [CrossRef]
- Öhrn, M.; Wahlström, V.; Harder, M.S.; Nordin, M.; Pettersson-Strömbäck, A.; Bodin Danielsson, C.; Olsson, D.; Andersson, M.; Slunga Järvholm, L. Productivity, satisfaction, work environment, and health after relocation to an activity-based flex office—The active office design study. Int. J. Environ. Res. Public Health 2021, 18, 7640. [Google Scholar] [CrossRef]
- Tudor-Locke, C.; Schuna, J.M.; Frensham, L.J.; Proenca, M. Changing the way we work: Elevating energy expenditure with workstation alternatives. Int. J. Obes. 2014, 38, 755–765. [Google Scholar] [CrossRef]
- Meijer, E.M.; Frings-Dresen, M.H.W.; Sluiter, J.K. Effects of office innovation on office workers’ health and performance. Ergonomics 2009, 52, 1027–1038. [Google Scholar] [CrossRef] [PubMed]
- Appel Meulenbroek, R.; Janssen, I.; Groenen, P. An end user’s perspective on activity-based office concepts. J. Corp. Real Estate 2011, 13, 122–135. [Google Scholar] [CrossRef]
- Van der Voordt, T.J.M. Costs and benefits of flexible workspaces: Work in progress in The Netherlands. Facilities 2004, 22, 240–246. [Google Scholar] [CrossRef]
- Frodsham, K.M.; Randall, N.R.; Carbine, K.A.; Rodeback, R.E.; LeCheminant, J.D.; Larson, M.J. Does type of active workstation matter? A randomized comparison of cognitive and typing performance between rest, cycling, and treadmill active workstations. PLoS ONE 2020, 15, e0237348. [Google Scholar] [CrossRef] [PubMed]
- Arundell, L.; Sudholz, B.; Teychenne, M.; Salmon, J.; Hayward, B.; Healy, G.N.; Timperio, A. The impact of activity-based working (ABW) on workplace activity, eating behaviors, productivity, and satisfaction. Int. J. Environ. Res. Public Health 2018, 15, 1005. [Google Scholar] [CrossRef] [PubMed]
- de Been, I.; Beijer, M. The influence of office type on satisfaction and perceived productivity support. J. Facil. Manag. 2014, 12, 142–157. [Google Scholar] [CrossRef]
- Engelen, L.; Chau, J.; Young, S.; Mackey, M.; Jeyapalan, D.; Bauman, A. Is activity-based working impacting health, work performance, and perceptions? A systematic review. Build. Res. Inf. 2019, 47, 468–479. [Google Scholar] [CrossRef]
- Léger, M.C.; Cardoso, M.R.; Dion, C.; Albert, W.J. Does active sitting provide more physiological changes than traditional sitting and standing workstations? Appl. Ergon. 2022, 102, 103741. [Google Scholar] [CrossRef] [PubMed]
- Increasing Standing Desk. Available online: https://www.wsj.com/articles/SB10001424053111904199404576541011003270644 (accessed on 27 July 2023).
- Apple. All Apple Employees Now Get Standing Desks—And Tim Cook Has Said He Believes ‘Sitting Is the New Cancer’. Available online: https://www.businessinsider.com/apple-employees-standing-desks-tim-cook-sitting-cancer-2018-6 (accessed on 27 July 2023).
- Young, D.R.; Hivert, M.F.; Alhassan, S.; Camhi, S.M.; Ferguson, J.F.; Katzmarzyk, P.T.; Lewis, C.E.; Owen, N.; Perry, C.K.; Siddique, J.; et al. Sedentary behavior and cardiovascular morbidity and mortality: A science advisory from the American Heart Association. Circulation 2016, 134, e262–e279. [Google Scholar] [CrossRef]
- TED. Got a Meeting? Take a Walk. Available online: https://www.ted.com/talks/nilofer_merchant_got_a_meeting_take_a_walk (accessed on 27 July 2023).
- Fast Company. My Year at A Standing Desk and Why I’ll Never Go Back. Available online: https://www.fastcompany.com/3028686/my-year-at-a-standing-desk-and-why-ill-never-go-back (accessed on 27 July 2023).
- Health Fitness Revolution. The Fortune 100 and Their Fitness and Wellness Programs. Available online: https://www.healthfitnessrevolution.com/fortune-100-fitness-wellness-programs (accessed on 27 July 2023).
- Gao, S.; Zhai, Y.; Yang, L.; Zhang, H.; Gao, Y. Preferred temperature with standing and treadmill workstations. Build. Environ. 2018, 138, 63–73. [Google Scholar] [CrossRef]
- Gao, Y.; Gao, Y.; Shao, Z.; Ren, Y. The effects of indoor temperature and exercise behavior on thermal comfort in cold region: A field study on Xi’an, China. Energy 2023, 273, 127258. [Google Scholar] [CrossRef]
- Luo, M.; Wang, Z.; Ke, K.; Cao, B.; Zhai, Y.; Zhou, X. Human metabolic rate and thermal comfort in buildings: The problem and challenge. Build. Environ. 2018, 131, 44–52. [Google Scholar] [CrossRef]
- ANSI/ASHRAE Addendum g to ANSI/ASHRAE Standard 55-2010. 2013. Available online: www.ashrae.org (accessed on 27 July 2023).
- Feng, L.; Wu, Y.; Zhao, Y.; Li, R.; Dong, S.; Gao, N. Variation of temperature stratification during and after the human movement in displacement ventilation. Build. Environ. 2023, 239, 110426. [Google Scholar] [CrossRef]
- Hoyt, A.; Lee, T.; Ho Zhang, K.; Hoyt, T.; Ho Lee, K.; Zhang, H.; Arens, E. Energy Savings from Extended Air Temperature Setpoints and Reductions in Room Air Mixing. Environmental Ergonomics. 2005. Available online: https://escholarship.org/uc/item/28x9d7xj (accessed on 27 July 2023).
- Choi, K.; Park, S.; Joe, J.; Kim, S.; Jo, J.; Kim, E.; Cho, Y. Review of infiltration and airflow models in building energy simulations for providing guidelines to building energy modelers. Renew. Sustain. Energy Rev. 2023, 181, 113327. [Google Scholar] [CrossRef]
- Hong, T.; Chou, S.K.; Bong, T.Y. Building simulation: An overview of developments and information sources. Build. Environ. 2000, 35, 347–361. [Google Scholar] [CrossRef]
- Department of Energy (DOE). Available online: https://www1.eere.energy.gov/buildings/alliances/rooftop_specification.html (accessed on 27 July 2023).
- Johari, F.; Munkhammar, J.; Shadram, F.; Widén, J. Evaluation of simplified building energy models for urban-scale energy analysis of buildings. Build. Environ. 2022, 211, 108684. [Google Scholar] [CrossRef]
- National Renewable Energy Laboratory, Building Energy Simulation Test for Existing Homes (BESTEST-EX). Available online: https://www.nrel.gov/docs/fy11osti/52414.pdf (accessed on 19 January 2024).
- EnergyPlus. Input Output Reference. Available online: https://energyplus.net/assets/nrel_custom/pdfs/pdfs_v9.6.0/InputOutputReference.pdf (accessed on 27 July 2023).
- Im, P.; Joe, J.; Bae, Y.; New, J.R. Empirical validation of building energy modeling for multi-zones commercial buildings in cooling season. Appl. Energy 2020, 261, 114374. [Google Scholar] [CrossRef]
- Joe, J.; Choi, W.; Kwon, H.; Huh, J.-H. Load characteristics and operation strategies of building integrated with multi-story double skin facade. Energy Build. 2013, 60, 185–198. [Google Scholar] [CrossRef]
- Joe, J.; Choi, W.; Kwak, Y.; Huh, J.-H. Optimal design of a multi-story double skin facade. Energy Build. 2014, 76, 143–150. [Google Scholar] [CrossRef]
- TRNSYS 18, a Transient System Simulation Program. Available online: https://sel.me.wisc.edu/trnsys/features/trnsys18_0_updates.pdf (accessed on 19 January 2024).
- Reinhart, C.F.; Cerezo Davila, C. Urban building energy modeling—A review of a nascent field. Build. Environ. 2016, 97, 196–202. [Google Scholar] [CrossRef]
- Ham, Y.; Golparvar-Fard, M. Mapping actual thermal properties to building elements in gbXML-based BIM for reliable building energy performance modeling. Autom. Constr. 2015, 49, 214–224. [Google Scholar] [CrossRef]
- Bhatnagar, M.; Mathur, J.; Garg, V. Development of reference building models for India. J. Build. Eng. 2019, 21, 267–277. [Google Scholar] [CrossRef]
- Kim, H.J.; Choi, D.Y.; Seo, D. Development and verification of prototypical office buildings models using the national building energy consumption survey in Korea. Sustainability 2021, 13, 3611. [Google Scholar] [CrossRef]
- Arora, S.J.; Rabe, M. Approach to Reference Models for Building Performance Simulation: Establishing Common Understanding. SN Comput. Sci. 2023, 4, 267. [Google Scholar] [CrossRef]
- Foroushani, S.; Bernhardt, R.; Bernhardt, M. On the use of the reference building approach in modern building energy codes. Energy Build. 2022, 256, 111726. [Google Scholar] [CrossRef]
- Guolo, E.; Pistore, L.; Romagnoni, P. The role of the reference building in the evaluation of energy efficiency measures for large stocks of public buildings. E3S Web Conf. 2019, 111, 03017. [Google Scholar] [CrossRef]
- Joe, J.; Min, S.; Oh, S.; Jung, B.; Kim, Y.M.; Kim, D.W.; Lee, S.E.; Yi, D.H. Development of Simplified Building Energy Prediction Model to Support Policymaking in South Korea—Case Study for Office Buildings. Sustainability 2022, 14, 6000. [Google Scholar] [CrossRef]
- ANSI/ASHRAE/IES Standard 55-2013; Thermal Environmental Conditions for Human Occupancy. ASHRAE: Peachtree Corners, GA, USA, 2013. Available online: https://ierga.com/hr/wp-content/uploads/sites/2/2017/10/ASHRAE-55-2013.pdf (accessed on 27 July 2023).
- ISO 7730-2005; Ergonomics of the Thermal Environment-Analytical Determination and Interpretation of Thermal Comfort Using Calculation of the PMV and PPD Indices and Local Thermal Comfort Criteria. ISO: Geneva, Switzerland, 2005. Available online: https://www.iso.org/standard/39155.html (accessed on 27 July 2023).
- Trading Economics. United States Corporate Profits. Available online: https://tradingeconomics.com/united-states/corporate-profits (accessed on 27 July 2023).
- U.S. Energy Information Administration. Annual Energy Outlook 2023. Available online: https://www.eia.gov/tools/faqs/faq.php?id=1174&t=1 (accessed on 27 July 2023).
- U.S. Energy Information Administration. Energy Use in Commercial Buildings. Available online: https://www.eia.gov/energyexplained/use-of-energy/commercial-buildings.php (accessed on 27 July 2023).
Figure 1.
Schematic of this study.

Figure 2.
EnergyPlus commercial reference building of the medium office ((left): 3D view, (right): floor plan).
Figure 2.
EnergyPlus commercial reference building of the medium office ((left): 3D view, (right): floor plan).
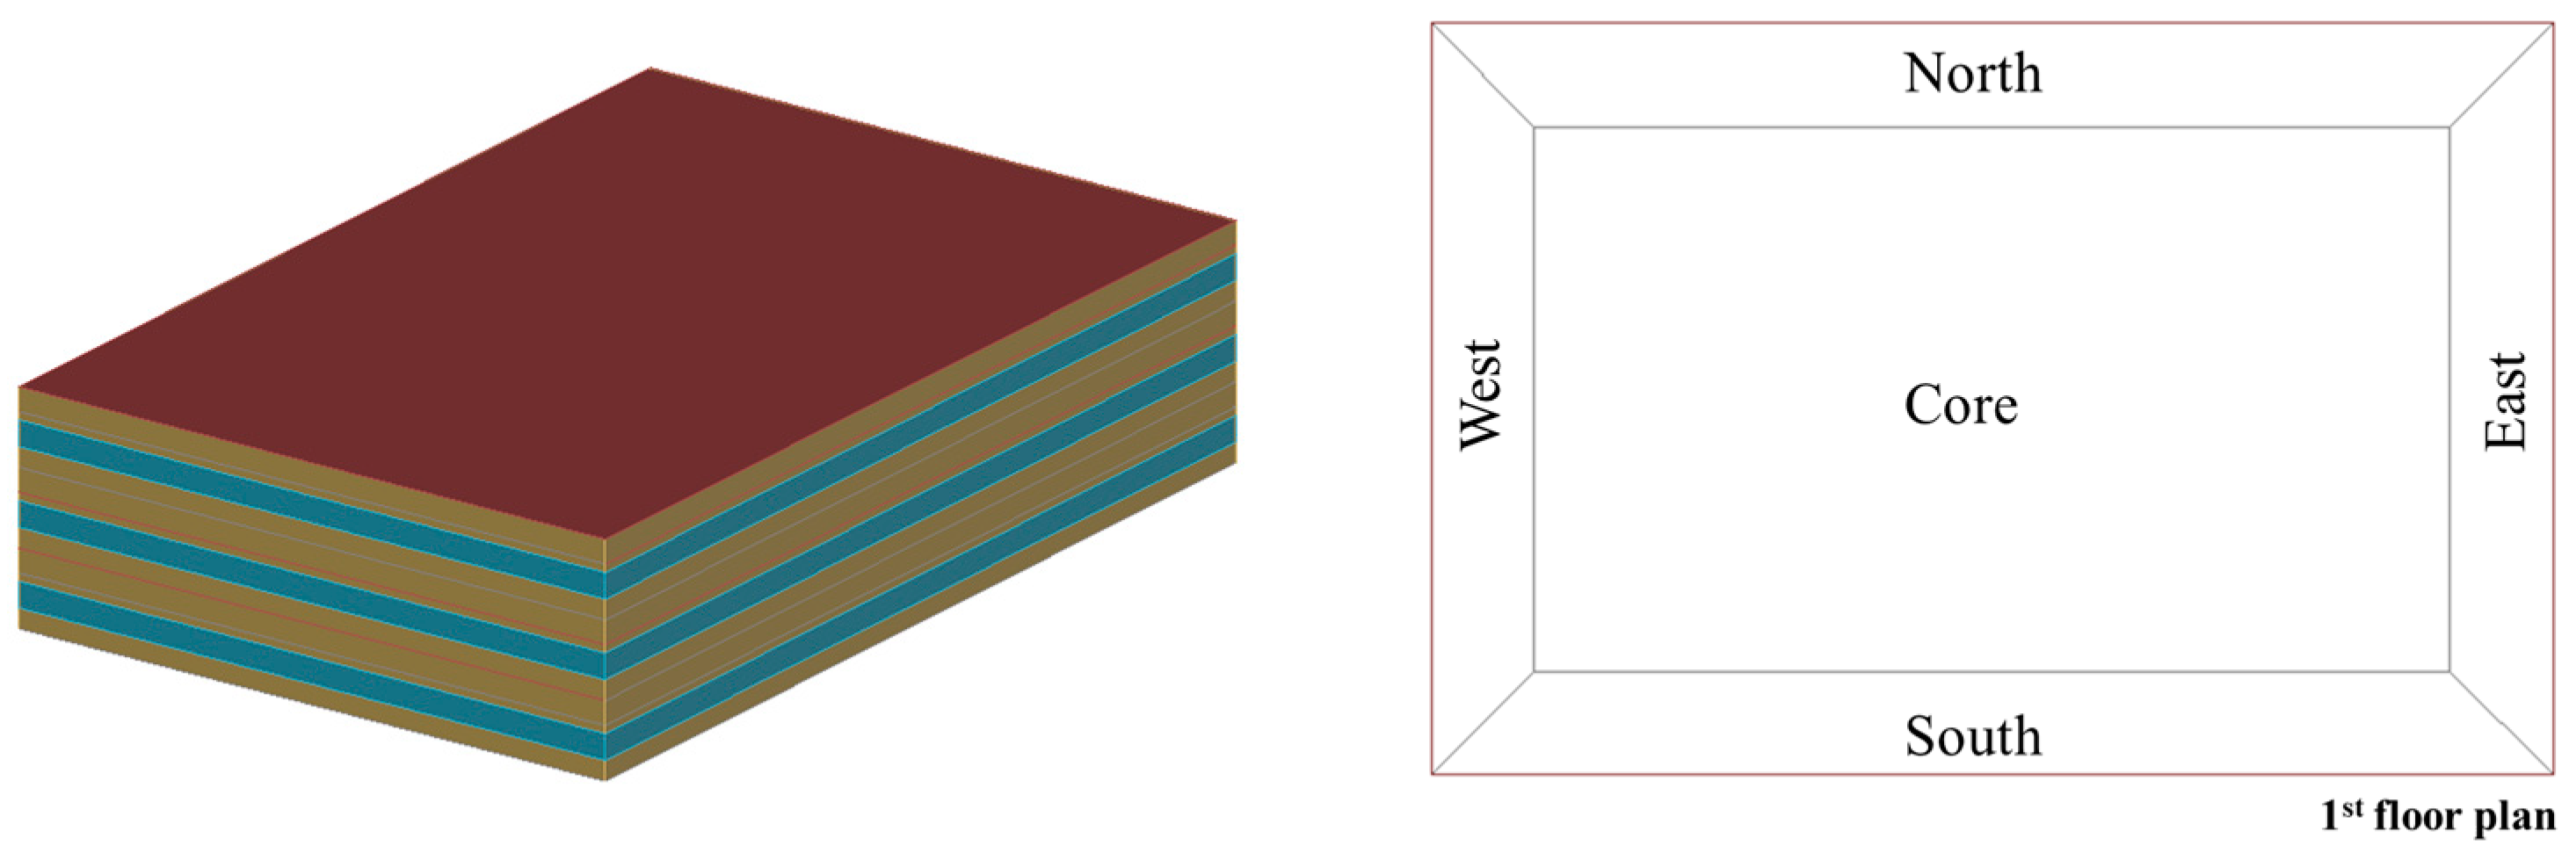
Figure 3.
Comparison of electricity and gas energy consumption of baseline and active workstations.
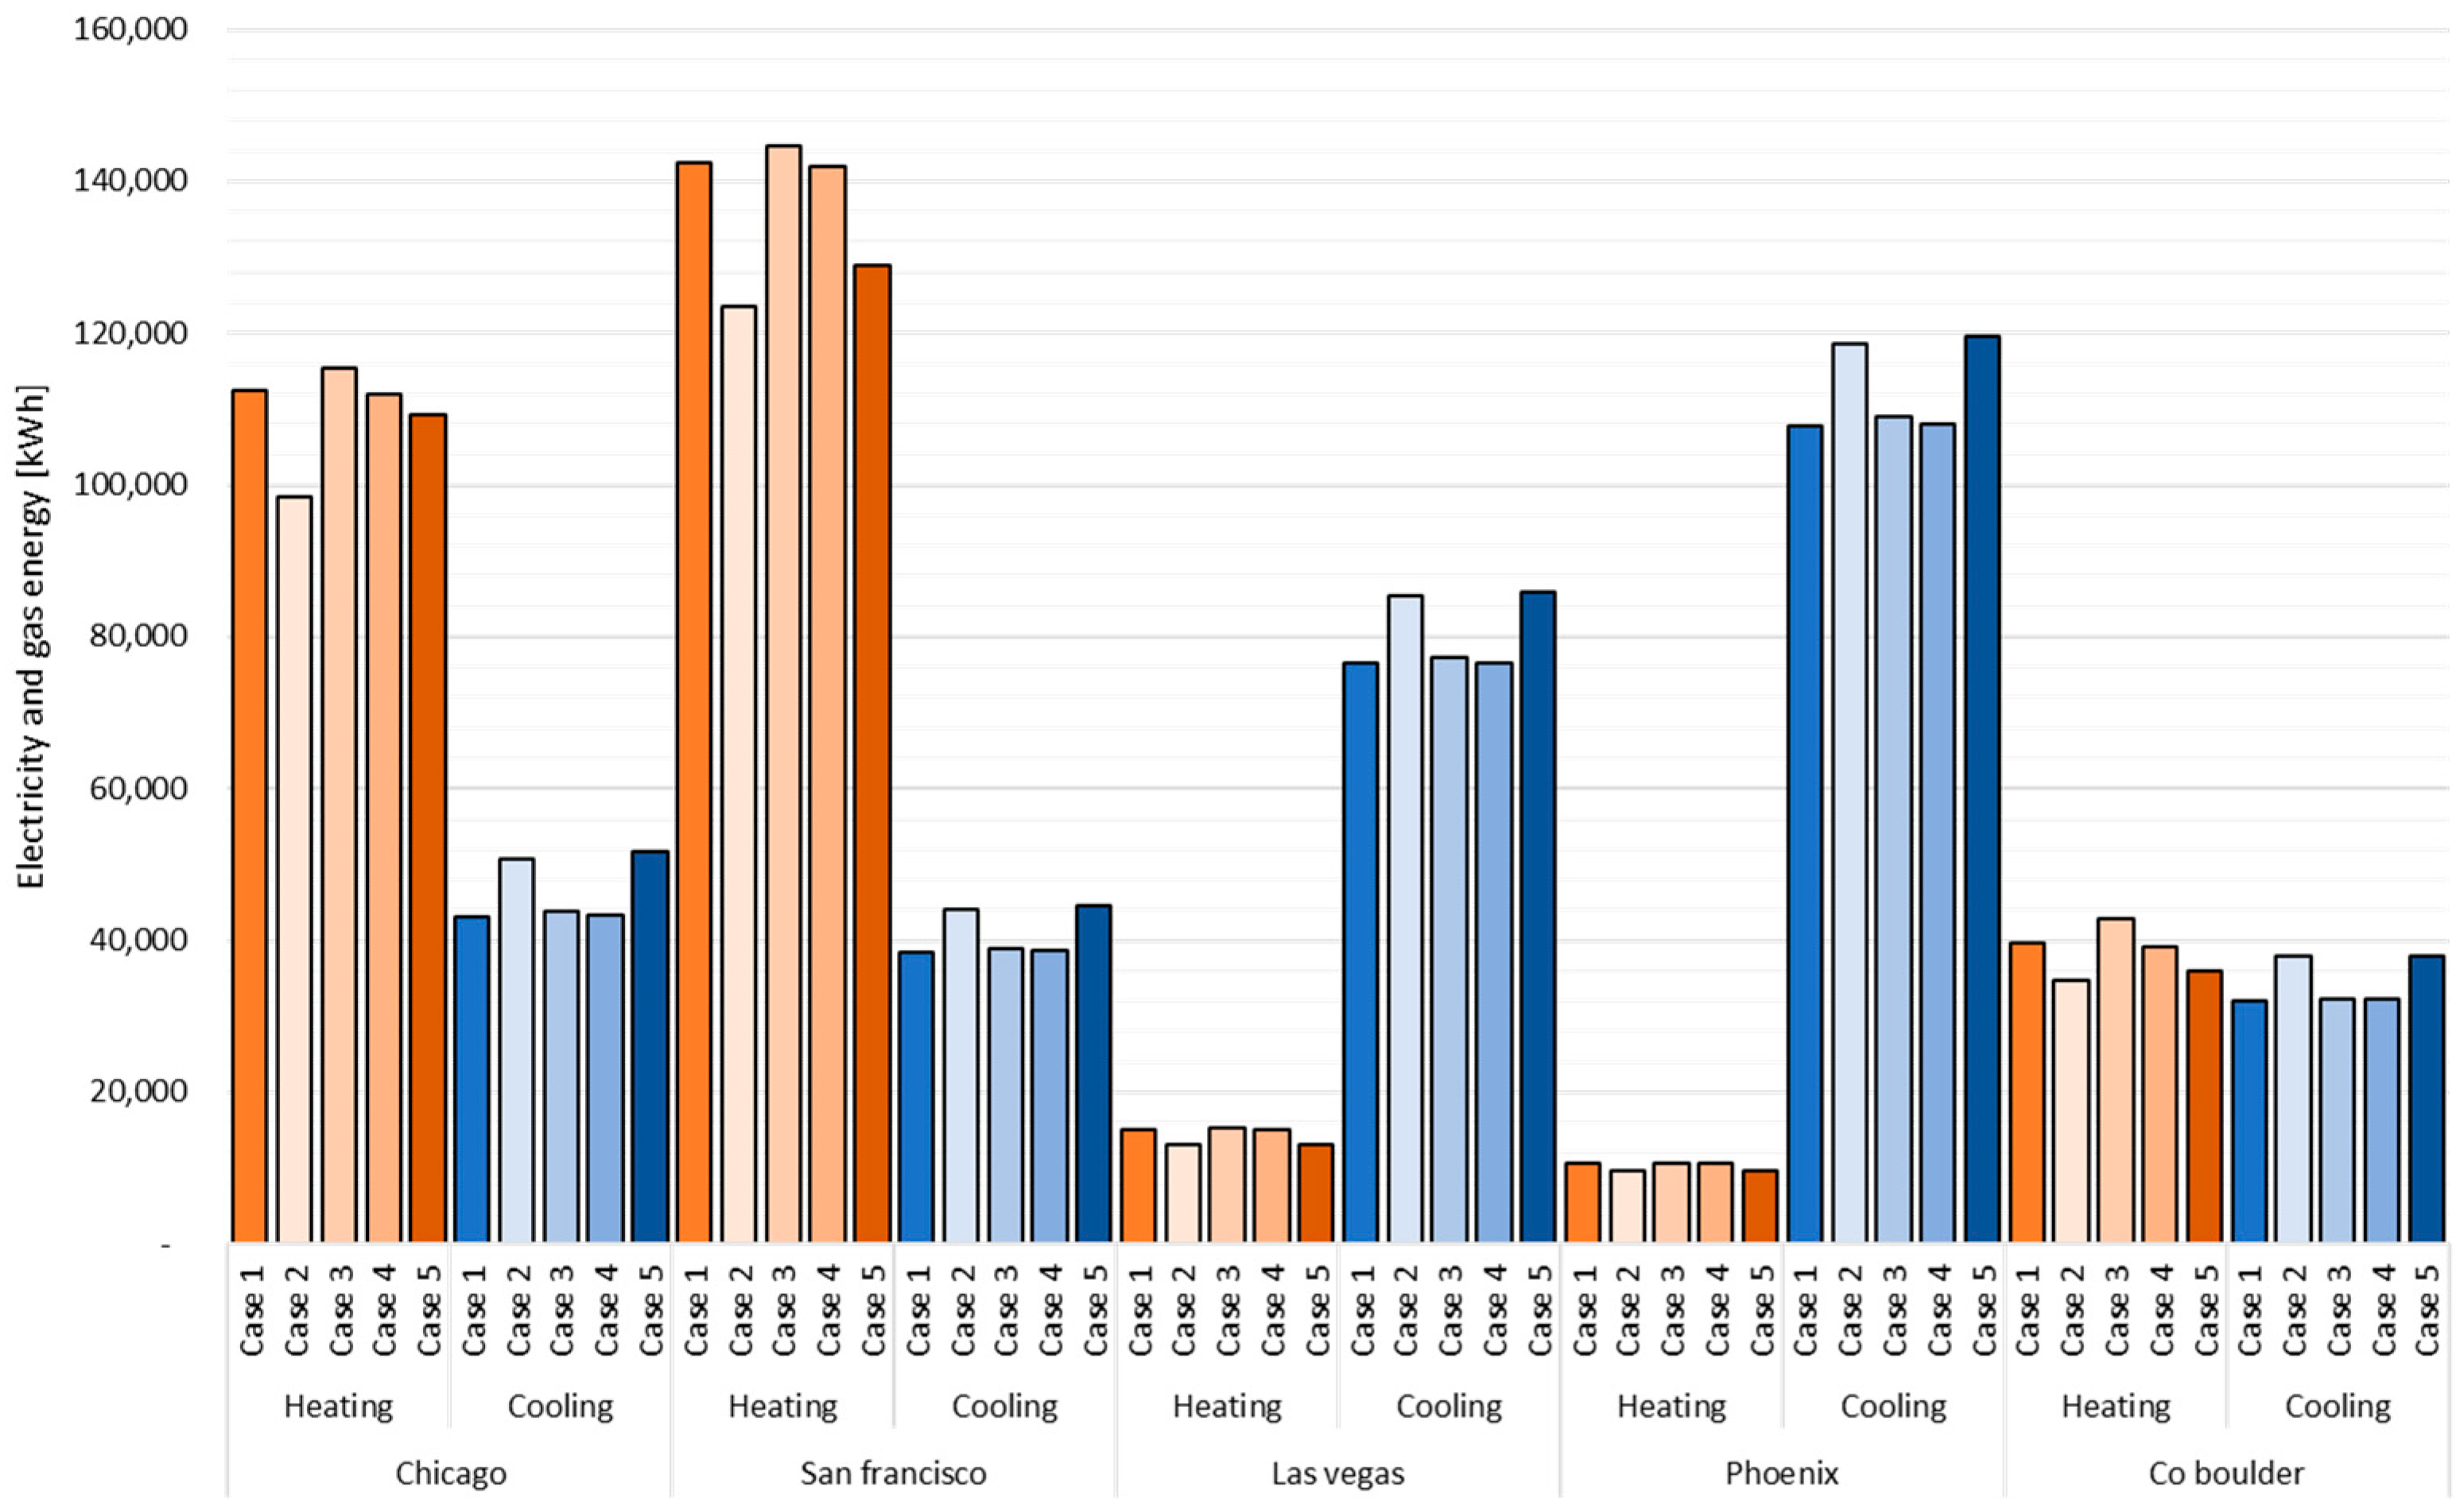
Figure 4.
Box plot depicted the range of heating and cooling energy consumption.
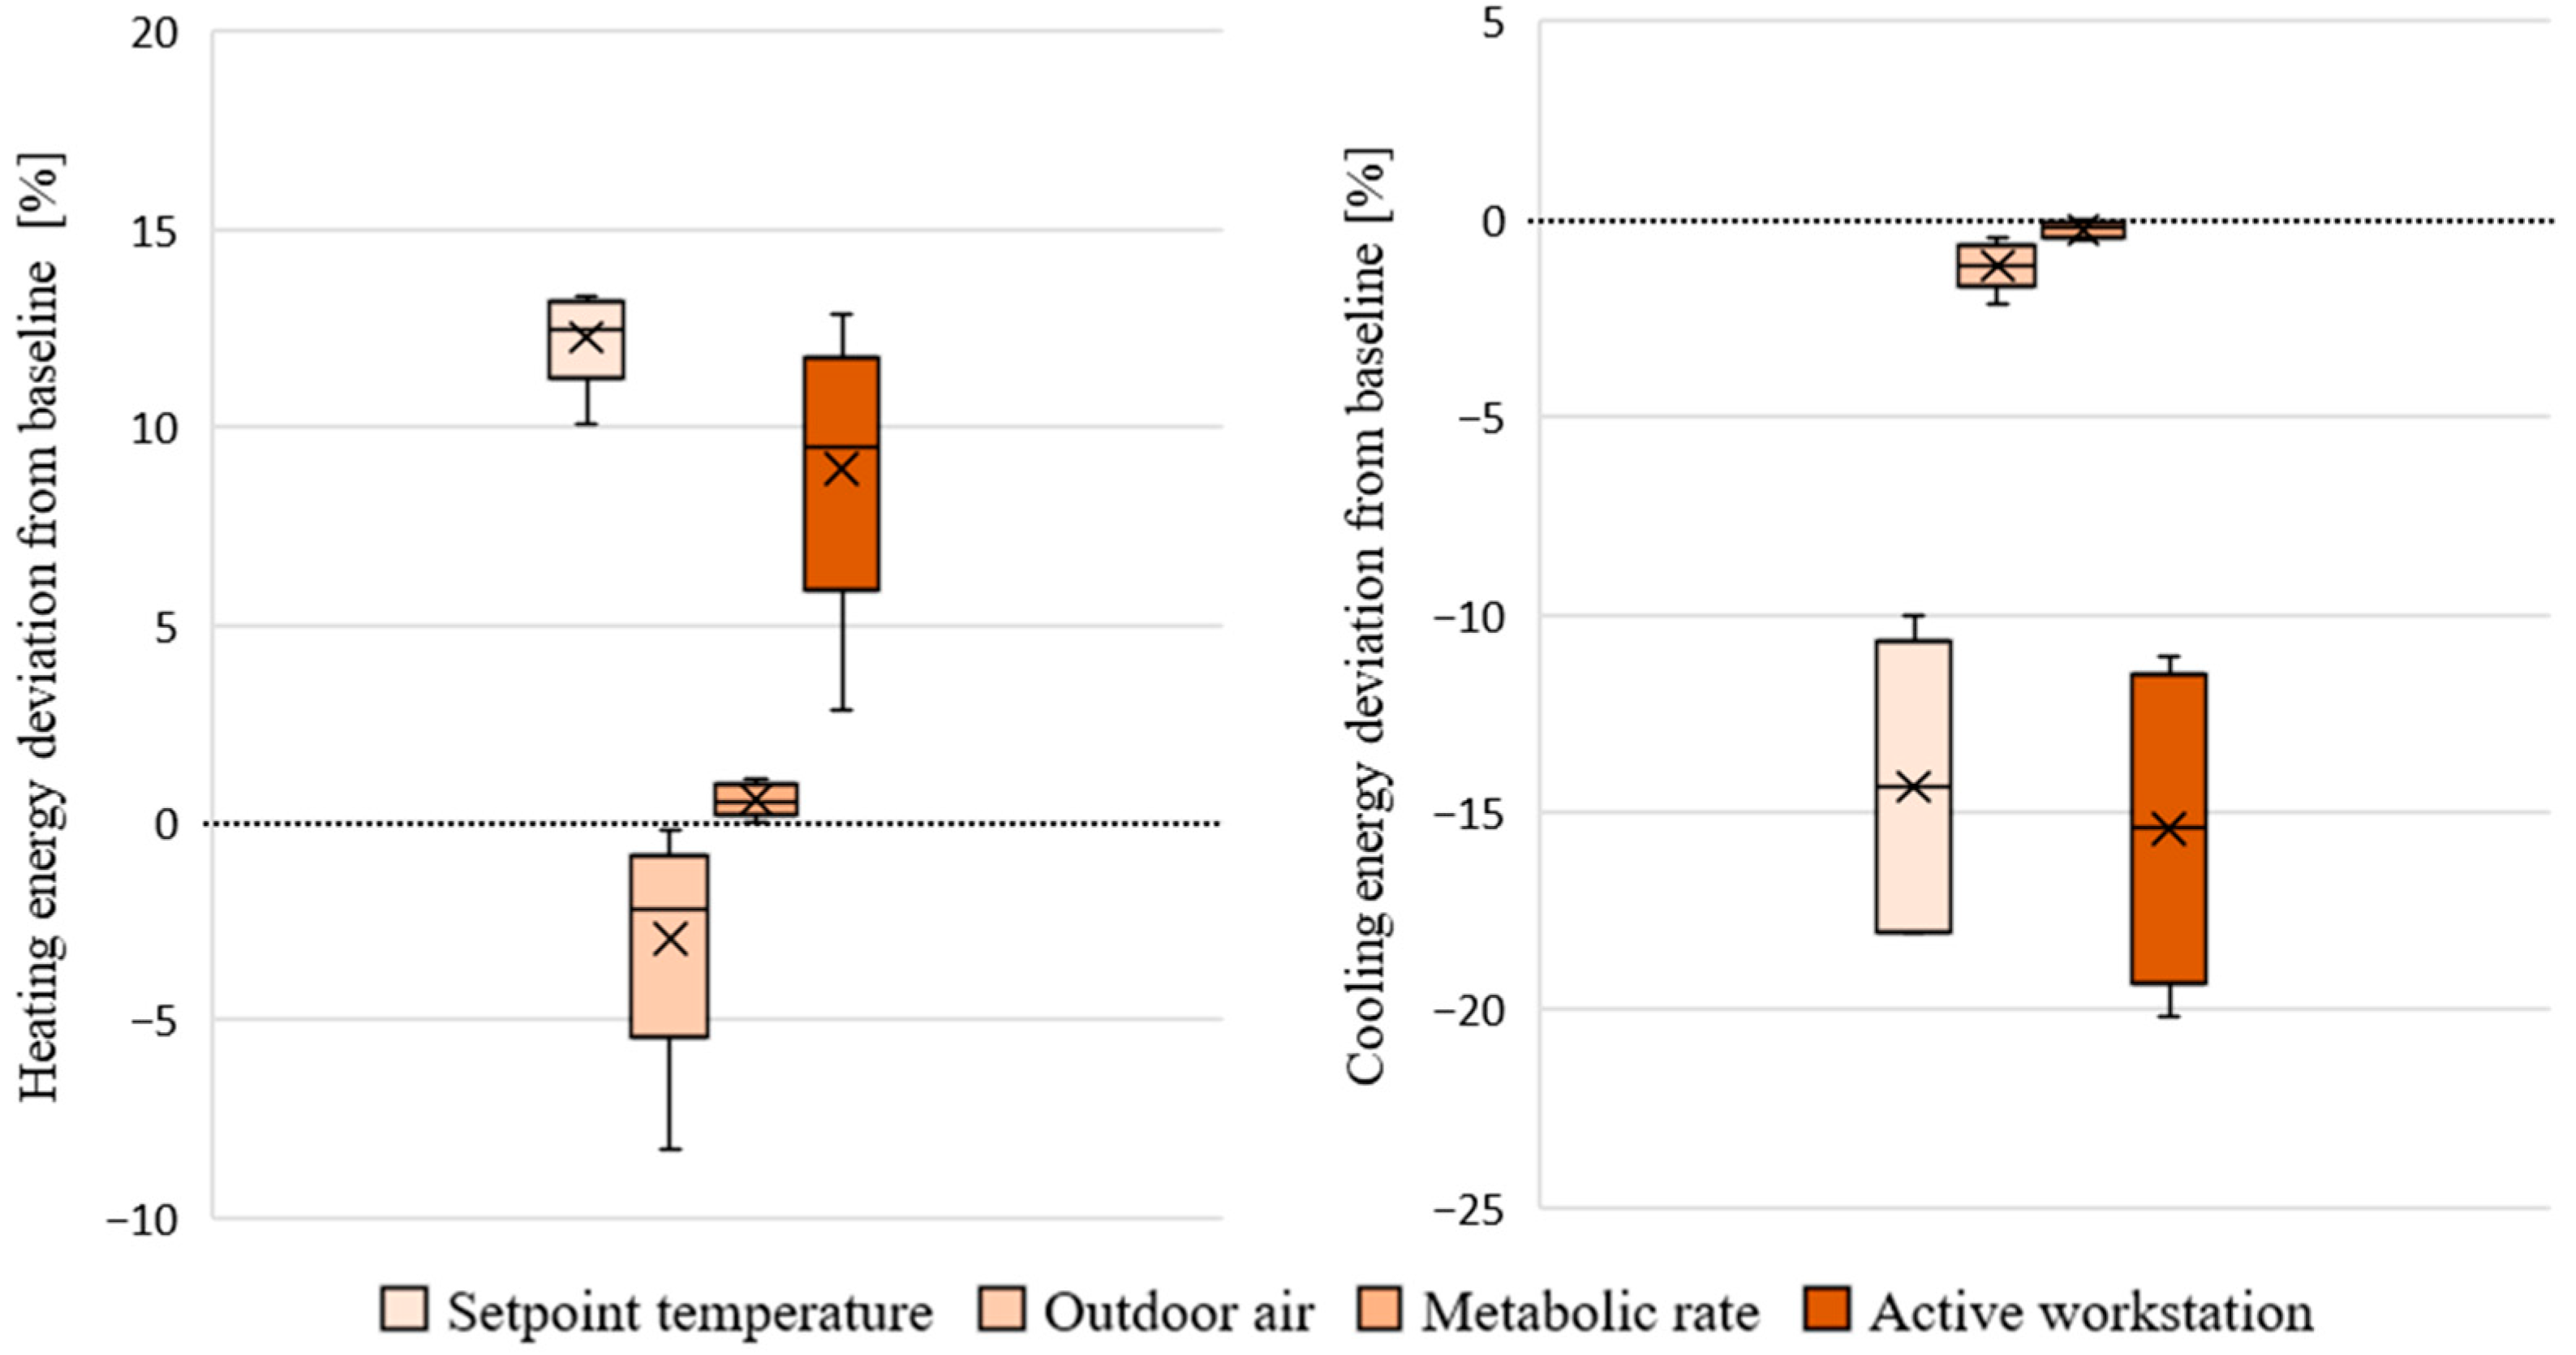
Figure 5.
Cost analysis of active workstation.

Table 1.
The activity schedules and variables.
| Active Workstation | Baseline | |||
|---|---|---|---|---|
| Schedules | 08:00~10:00 13:00~15:00 | 10:00~11:00 15:00~16:00 | 11:00~12:00 16:00~17:00 | 08:00~12:00 13:00~17:00 |
| Activity | Sitting & Typing | Standing & Typing | Walking & Typing | Sitting & Typing |
| Setpoint Temperature | Cooling 26 °C Heating 23 °C | Cooling 24 °C Heating 21 °C | Cooling 22 °C Heating 19 °C | Cooling 26 °C Heating 23 °C |
| Metabolic rate | 120 W/m2 | 144 W/m2 | 180 W/m2 | 120 W/m2 |
| Outdoor air | 0.00625 m3/s-person | 0.00875 m3/s-person | 0.01125 m3/s-person | 0.00625 m3/s-person |
Table 2.
Case with different variables (“–“ refers to not applied, “√” refers to applied).
| Decreased Setpoint Temperature | Increased Outdoor Air Requirement | Increased Metabolic Rate | |
|---|---|---|---|
| Case 1–baseline | – | – | – |
| Case 2 | √ | – | – |
| Case 3 | – | √ | – |
| Case 4 | – | – | √ |
| Case 5–active workstation | √ | √ | √ |
Disclaimer/Publisher’s Note: The statements, opinions and data contained in all publications are solely those of the individual author(s) and contributor(s) and not of MDPI and/or the editor(s). MDPI and/or the editor(s) disclaim responsibility for any injury to people or property resulting from any ideas, methods, instructions or products referred to in the content. |
© 2024 by the authors. Licensee MDPI, Basel, Switzerland. This article is an open access article distributed under the terms and conditions of the Creative Commons Attribution (CC BY) license (https://creativecommons.org/licenses/by/4.0/).
Share and Cite
MDPI and ACS Style
Park, J.; Choi, K.; Talib, A.; Joe, J. Investigation of Energy Consumption of Office Spaces with Active Workstations. Energies 2024, 17, 660. https://doi.org/10.3390/en17030660
AMA Style
Park J, Choi K, Talib A, Joe J. Investigation of Energy Consumption of Office Spaces with Active Workstations. Energies. 2024; 17(3):660. https://doi.org/10.3390/en17030660
Chicago/Turabian StylePark, Jinhyung, Kwangwon Choi, Abu Talib, and Jaewan Joe. 2024. "Investigation of Energy Consumption of Office Spaces with Active Workstations" Energies 17, no. 3: 660. https://doi.org/10.3390/en17030660
Note that from the first issue of 2016, this journal uses article numbers instead of page numbers. See further details here.