
A Performance Simulation Methodology for a Whole Turboshaft Engine Based on Throughflow Modelling

1
College of Energy and Power Engineering, Nanjing University of Aeronautics and Astronautics, Nanjing 210016, China
2
AECC Hunan Aviation Powerplant Research Institute, Zhuzhou 412007, China
*
Authors to whom correspondence should be addressed.
Energies 2024, 17(2), 494; https://doi.org/10.3390/en17020494
Submission received: 26 December 2023
/
Revised: 12 January 2024
/
Accepted: 15 January 2024
/
Published: 19 January 2024
(This article belongs to the Special Issue Thermal Design, Thermodynamic Analysis, and Optimization of Aero-Engines and Gas Turbines)
Abstract
:To accurately predict the matching relationships between the various components and the engine performance in the whole aero-engine environment, this study introduces a two-dimensional throughflow simulation method for the whole aero-engine. This method is based on individual throughflow solvers for the turbo-machinery and the combustor. It establishes a throughflow simulation model for the whole engine by integrating with the compressor-turbine co-operating equations and boundary conditions. The turbo-machinery throughflow solver employs a circumferentially averaged form of the time-dependent Navier–Stokes equations (N-S) as the governing equation. The combustor solver uses the Reynolds Average Navier–Stokes (RANS) method to solve flow and chemical reaction processes by constructing turbulence, combustion, and radiation models. The accuracy of the component solver is validated using Pratt and Whitney’s three-stage axial compressor (P&W3S1) and General Electric’s high-pressure turbine (GE-EEE HPT), and the predicted results are consistent with the experimental data. Finally, the developed throughflow method is applied to simulate the throttling characteristics of the WZ-X turboshaft engine. The results predicted by the throughflow program are consistent with the GasTurb calculations, including the trends of shaft power delivered, specific fuel consumption (SFC), inlet airflow, and total pressure ratio of the compressor. The developed method to perform throughflow simulation of the whole aero-engine eliminates the dependence on a general component map. It can quickly obtain the meridian flow field parameters and overall engine characteristics, which is expected to guide the design and modification of the engine in the future.
1. Introduction
The traditional aero-engine development mode usually relies on physical experiments and a serial development model of ‘design-test validation-modify design-retest’ to expose design problems, which leads to the problems of long development cycles, high costs, and elevated risks. The limitations of this traditional development model have become obvious in meeting the ever-increasing performance requirements and complexities of aircraft engines, while numerical simulation has emerged as a crucial tool driving the transformation of aircraft engine development models [1]. Throughout the pre-research plans published by developed countries and the current research and development systems [2,3,4], the transformation from the ‘traditional design’ by means of a large number of experiments to the ‘predictive design’ based on numerical simulation has basically been completed, which greatly reduces the development cycle and test cost of the engine [5].
Numerical simulation of aero-engine aerodynamic performance can include component levels and whole engine levels. The numerical simulation method has been dramatically developed for compressor and turbine components. From the one-dimensional average diameter calculation and the through-flow calculation of the S1 stream surface and S2 stream surface to the three-dimensional flow theory [6], and then to the full three-dimensional viscous calculation based on the Navier–Stokes equations, the mature multi-level analysis and design system have been initially formed. However, at the whole engine level, the performance evaluation of aero engines is mainly based on zero-dimensional (0D) thermodynamic cycle parameter calculations [7]. Due to the simplification of models, the accuracy of 0D depends on a large number of components and whole-engine test data and cannot reflect the flow field of the engine. There have been a few reports on three-dimensional whole-engine calculations [8] in recent years. Teixeira and colleagues from Numeca [9,10] conducted steady-state and unsteady-state three-dimensional numerical simulations of the micro turbojet engine KJ66. The total number of grids is approximately 19.2 million, of which the computational domain includes one blade passage for every turbomachinery blade row, a 60° sector for the combustion chamber, and a half exhaust hood. The steady calculation of the whole engine uses 288 cores and takes about 52 h to reach the convergence state. The fuel flow and speed are given as input parameters according to the experimental data. Arroyo et al. [11,12] employed Large Eddy Simulation (LES) methods to perform multi-component coupled simulations on a gas turbine with 360 azimuthal degrees, comprising over 2.1 billion grid cells, including the fan, radial compressor, and annular combustion chamber. The project obtained 31.6 million core hours of supercomputing resources to accomplish these computations through the Partnership for Advanced Computing in Europe (PRACE). Certainly, the computational cost of three-dimensional whole-engine simulations is still high, and it does not provide practical solutions for analyzing whole-engine performance in the preliminary design stage. Therefore, through-flow calculations remain crucial in the aero engine design process. The two-dimensional numerical simulation of the whole aero-engine can provide a large amount of meridional plane information while possessing advantages such as low computational cost and ease of implementation, making them highly promising for further development.
Compared to traditional streamline curvature or stream function methods, time-advancing throughflow methods offer numerous advantages [13], including the automatic capture of specific shock wave forms, the prediction of blockages, and the capability for transient simulations due to the introduction of a time term. Whole-engine two-dimensional throughflow simulation has been reported in previous literature. Nigmatullin and Ivanov [14] solved the unsteady Euler equations based on the axisymmetric assumption using the high-order accuracy finite difference Godunov scheme on the S2 stream surface. They used the body force model to simulate the blade row’s viscous loss and flow deflection effects. The concept of a digital test bench at the throughflow simulation level has been realized to a certain extent. Stewart [15] adopted a method to solve the axisymmetric Euler equations for integrated throughflow simulation of the E3 engine and nacelle. Petrovic et al. [16,17,18] employed the finite element method to solve the throughflow governing equations based on the stream function approach. They combined a series of empirical models to construct the whole engine throughflow simulation model. The combustion chamber simulation used a simplified zero-dimensional model, that is, the matching between the compressor and the turbine components adopted numerical zooming technology. Yang et al. [19,20] conducted a throughflow simulation of the KJ66 engine, employing artificially distributed fuel source terms for the combustion process in the combustion chamber without considering the true distribution of the temperature field within the combustion chamber. Liu et al. [21] conducted throughflow simulations for a turbojet engine at design and off-design operating points, but the calculation results showed oscillatory convergence.
Inspired by the discussions in the previous sections, this paper introduces a novel approach for steady-state two-dimensional throughflow simulation of the whole aero engines. The approach is based on individual throughflow solvers for turbo-machinery components and the combustion chamber, and it establishes the whole aero-engine throughflow simulation platform with co-operating equations and boundary conditions as constraints for the iterative simulation of the characteristics of the full engine and components. The present study assesses publicly available compressor and turbine test cases to verify the accuracy of the throughflow solver. Subsequently, a turboshaft engine is used as a case to test the overall performance of the engine and the simulation capacity of the meridian flow field by the whole-engine simulation platform. The throughflow results are compared with zero-dimensional thermodynamic cycle analysis results demonstrating consistency in the predicted outcomes of both approaches.
2. Throughflow Simulation Methods
2.1. Throughflow Methods for Components
The whole engine throughflow simulation platform developed in this study includes a turbo-machinery throughflow solver and a combustor throughflow solver. The turbo-machinery throughflow solver is developed based on the time-marching Navier–Stokes throughflow modeling proposed by Dawes [22] and Simon [23]. However, it includes many new details and extensions [24,25], which can be used for axial compressors, centrifugal compressors, and axial turbines. The combustor throughflow solver solves the two-dimensional N-S equations on the center plane of the swirler, as well as combustion chemical reactions and thermal radiation effects, which can be used for straight-flow combustors and reverse-flow combustors [26].
2.1.1. Turbo-Machinery Modeling
The governing equations for the through-flow modeling of the turbomachinery are strictly derived from the three-dimensional Navier–Stokes equations in the cylindrical coordinate system by the circumferentially averaged method, which can be written as Equation (1).
where
and
and
Here, Q denotes the vector of conservative variables, F and H are the inviscid flux vectors, and Fv and Hv are the viscous flux vectors. S and Sv are the vectors of the source term brought by the transformation of the equations from an absolute Cartesian coordinate system to a relative cylindrical coordinate system. Sbv is the source term vector of viscous blade force that represents the loss generation through the blade row. Sb1 and Sb2 are the source term vectors of inviscid blade force simulating the impact of blade passage area changes and the deflection effect of the blades on the flow. ρ is density; x and r are axial and radial coordinates, respectively; ω is the angular velocity; w represents the relative velocity; p is static pressure; E is total internal energy; τ is the shear stress that contains molecular and turbulence shear stress; q is heat flux per unit area; fb is the inviscid blade body force, and fv is the viscous blade force. Subscripts x, θ, and r denote the axial, tangential, and radial directions. b is a blockage factor because of the circumferential blade thickness and denotes as
where θs and θp are the angular coordinates on the suction and pressure sides of the blade respectively, and N is the number of blades. The blockage factor is less than 1 in the blade row and equal to 1 in the bladeless area. Furthermore, if the tip clearance is considered, the blockage coefficient in the clearance region is set to 1.
The closure of the viscous blade force term and the inviscid blade force term in the governing equation is very important. The Sb2 and Sbv on the right side of Equation (1) cannot be directly solved and require modeling. The modeling of Sb2 is based on the assumption of an average flow surface and is solved using an implicit computational method [27]. The average flow surface is determined by summing up the deflecting angles along the blade camber, where the deflecting angles at the inlet of the blade are equal to the incidence (i), and the deviation (δ) is taken at the exit of the blade. The blade region is distributed in the form of a Bézier curve between the two. The viscous blade force Sbv is modeled using the distributed loss model proposed by Horlock [28] to establish the relationship between the loss coefficient and entropy increase, where the loss coefficient is given by experimental data or empirical models [29,30,31,32,33].
The numerical solution of the governing equations is performed using a finite volume method based on the grid center. The Roe scheme is employed for convection flux calculation, and the TVD scheme is applied for flux correction based on MUSCL interpolation. The viscous flux is calculated using a second-order central difference, and a multi-step Runge–Kutta method is utilized for time-marching solution [34]. The time-marching flow method can automatically capture specific forms of shock waves without adding a shock wave model. The Baldwin–Lomax algebraic model (B-L) [35] has the advantages of computational efficiency, low storage requirements, and easy application. The B-L model with wake correction function [36] solves the turbulent eddy viscosity coefficient. The grids near the endwalls satisfy the thin-layer assumption [37], and the modified method proposed in Reference [38] is used to limit the search range of the length scale in the separation zone.
2.1.2. Combustor Modeling
When simulating the two-dimensional combustor, it is necessary to simplify the three-dimensional combustor into a two-dimensional structure based on the following considerations:
- Retain the main structural characteristics of the flame tube and the main flow features in the flame tube, including swirler jets, primary hole jets, mixing hole jets, etc.;
- Maintain the flow distribution in the combustion zone and mixing zone;
- Neglect detailed processes such as fuel atomization and evaporation.
The simplified geometric model of the combustion chamber is illustrated in Figure 1, where the air intake structures such as the swirler, primary holes, and mixing holes are simplified into annular slots. Only the flow inside the flame tube is simulated to maintain the flow distribution in the combustor. Based on the combustion organization within the combustor, the flow inside the flame tube is divided into the combustion zone and the mixing zone. The air in the combustion zone enters through the head swirler; the cooling gas in the middle zone that does not participate in the combustion process enters through the main combustion hole. The air in the mixing zone enters through the mixing hole. The fuel is simplified as a gaseous fuel, which enters the combustion zone through the inlet of the swirler. It mixes with the air in the combustion zone and reacts chemically.
The total air flow in the combustion zone, , includes the air flow entering from the head swirler, , the cooling air flow at the head, , the cooling air flow in front of the primary hole cross section, , the air flow entering from the primary hole, , and the portion of the cooling air in the intermediate zone that participates in the combustion process, (usually taken as 50%).
The total airflow in the mixing zone includes the amount of air entering from the mixing hole, , and the amount of cooling air, ,
The simplified two-dimensional combustor in this study is an axisymmetric structure, and its grid is generated in the body-fitted coordinate system. The general governing equations for the two-dimensional combustor in cylindrical coordinates can be expressed as Equation (5):
Depending on the value of ϕ, this equation represents the continuity, momentum, turbulence kinetic energy, turbulence kinetic energy dissipation rate, enthalpy, species mass fractions, and radiation flux. To better capture the complex turbulent flow structures in the combustor (i.e., swirling flow, jet penetration through holes), the k-ε two-equation model is adopted as the turbulence model [39,40].
The present work employs the EBU–Arrhenius model [41] to consider the turbulence-chemistry interactions. The time-averaged turbulent reaction rate is defined as:
where the reaction rates estimated using the EBU model and Arrhenius model are calculated using the following expressions, respectively:
where is the EBU model constant, g is the local mean square fluctuation of the fuel [42], is the pre-exponential constant, E is the activation energy, and is the universal gas constant of the mixture. The four-flux radiation model [43] is adopted to consider the radiation effect.
According to the compressor outlet parameters and the flow distribution law of the combustion chamber, the boundary conditions for the inlet of the two-dimensional combustion chamber are generated. On the solid wall, the non-slip wall condition is used for the momentum equation, and the zero-gradient boundary condition is used for other scalar equations. A two-layer wall function method [44] is adopted as the near-wall treatment. The pressure-velocity coupling algorithm is solved using the SIMPLE algorithm. The governing equations are discretized using a hybrid difference scheme, and the discretized linear equations are solved using the TDMA algorithm, with under-relaxation applied to enhance the stability of the solution.
2.2. Whole Engine Simulation Platform
The turboshaft engine simulation platform consists of the turbo-machinery solver for the compressor/turbine and the combustor solver described above. Taking a single-shaft turboshaft engine with a power turbine as an example, the overall engine can be divided into six major components: the inlet, compressor, combustion chamber, gas turbine, power turbine, and exhaust nozzle. The station divisions for each component are shown in Figure 2, where 0–0 represents the engine inlet section; 3–3 is the compressor outlet section; 41–41 is the inlet section of the gas turbine; 5–5 is the exit section of the gas turbine; 6–6 is the exit section of the power turbine; and 9–9 is the exit section of the nozzle.
Figure 3 shows input parameters and thermodynamic cycle parameters in the throughflow simulation platform, in which the variables listed within each component represent the input values, and the variables outside each component represent the output values. The arrows indicate the direction of information transmission between components. Since the whole turboshaft engine throughflow simulation provides thermodynamic cycle parameter information, there is no need for compressor and turbine component performance maps.
Due to the different physical characteristics of the compressor, turbine, and combustor, different boundary conditions are applied for solving. The boundary condition of the turbomachinery solver is that at a certain speed, the inlet total pressure, total temperature, airflow angle, and outlet backpressure are specified. The boundary conditions of the combustor solver are given total pressure, total temperature, static pressure, static temperature, inlet flow rate, and fuel/air ratio at the inlet, and the outlet is a zero-gradient condition. Taking Figure 3 as an example, the engine operating speed is Nc, and the inlet total temperature Tt1 and total pressure Pt1 are converted according to the atmospheric environment and flight conditions. Simultaneously, the compressor outlet static pressure P3 is specified to complete the calculation for the intake–compressor component combination. The compressor outlet parameters, including total temperature Tt3, total pressure Pt3, static temperature T3, static pressure P3, and outlet flow W3, are assigned to the combustor inlet, and the fuel/air ratio φ is given to calculate the combustor of the combustion chamber. Subsequently, the total temperature Tt4, total pressure Pt4, and flow angle of the combustion chamber outlet are assigned to the gas turbine inlet, and atmospheric pressure P0 is specified at the nozzle outlet to complete the turbine-nozzle component calculation. For steady-state simulation of a single-shaft turboshaft engine, the cooperative operation of the compressor and turbine must satisfy mass flow continuity and power balance conditions; that is, the combustion chamber outlet flow W4 and turbine inlet flow W41, gas turbine power Lgas and compressor power Lcom need to meet the constraints in Equation (9):
where Lex is power offtake and ηmech is spool mechanical efficiency.
For a certain operating speed of the engine, based on the co-operating equations of the engine and the parameter values of the critical section, the steady-state operating point of the whole engine can be solved using the Newton–Raphson iteration method. Therefore, for a certain compressor speed Nc, the power turbine speed Np is a fixed value, and the compressor backpressure P3 and the fuel/air ratio ϕ are taken as the independent variables. Combined with Equation (9), the residual equation zi (i = 1, 2) is obtained:
Define as the residual matrix, and as the trial value vector, then the residual value vector Z is a function of the trial value vector X, i.e., . Determining the co-operating point is finding the trial value X that makes Z tend to 0. The Newton–Raphson method is used to solve this system of nonlinear equations. Assume that the trial value vector and residual vector of the nth step have been calculated; then the trial value vector of the (n + 1)th step is , where J is the Jacobian matrix. The equation can be expanded as:
where the calculation formula of partial derivative is
where is the perturbation value of the trial value. The new trial value is recalculated until the residual meets , which can be considered to complete the flow calculation of the engine cooperating point. Each solver is connected to each other and controlled by the external system of Fortran program so as to transmit data between codes and establish the engine simulation platform, as shown in Figure 4.
3. Component Validation Cases
3.1. P&W3S1 Axial Compressor
The P&W3S1 three-stage axial compressor is an experimental unit designed by Pratt & Whitney Company in the late 1970s to study the aerodynamic performance of the rear stage of a high-load axial compressor. The model has inlet guide vanes, and its rotor and stator blade profiles are non-standard, featuring a circular arc for the mean camber line. Additionally, the thickness distribution follows the NACA 65 series. According to references [45,46], the design parameters of P&W3S1 are a speed of 5455 r/min, a pressure ratio of 1.357, a flow rate of 4.30 kg/s, and a rotor tip clearance of 0.33 mm. The flow calculation grid is shown in Figure 5. Cell clustering is applied to the leading and trailing edges of the blades to capture changes in blade forces better. It is also performed near the hub and shroud to calculate shear stress near the endwalls. The distance of the first mesh layer near the endwalls is set to 0.002 mm to satisfy the y+ requirements of the B-L model. Due to limited experimental data in the references, this study also employed Numeca software (NUMECA FINE/Turbo 9.1 version) for three-dimensional single-passage viscous simulations under the same conditions to verify the prediction accuracy of the meridional flow field using the throughflow method. The three-dimensional calculations use the Spalart–Allmaras (S-A) turbulence model, and the Full Non-Matching (FNM) method is used for the rotor–stator interface. Grid clustering is used near the solid walls, with the first layer cell width set at 0.002 mm, ensuring that y+ remains below 10 to satisfy turbulence model requirements. A butterfly mesh structure is utilized for modeling the rotor tip clearance.
To eliminate errors caused by grid resolution, grid independence verification is performed separately for the throughflow and three-dimensional calculational mesh. The throughflow computation grids are uniformly refined along the axial and radial directions for each blade row, inlet, and outlet, with four sets of grids set at 350 × 41, 450 × 80, 548 × 80, and 628 × 120 elements. In the three-dimensional computational domain, the grids for each stage of the stator and rotor are uniformly refined in the circumferential, axial, and spanwise directions. In contrast, the inlet and outlet computational domains are uniformly refined in the circumferential, axial, and spanwise directions. The number of cells for the three-dimensional computation is 2.83 million, 4.46 million, 6.72 million, and 8.77 million. Figure 6 shows the grid-independence verification outcomes. The upper x-axis represents the number of three-dimensional cells, while the lower x-axis represents the number of throughflow cells. The error bands indicated in the figure are ±0.1% of the calculated value. The throughflow calculation grid with 450 × 80 cells and the three-dimensional grid with 4.46 million cells meet the grid independence requirements. They are used for all further analyses. In terms of computation time, Numeca executed the case with 4.46 million cells until complete convergence, requiring 127 min in an Intel (R) Xeon (R)-Gold 6226R CPU @ 2.90 GHz.
A comparison of the computed and experimental results [46] for the design speed condition is presented in Table 1. The throughflow results show a computational error of less than 1% compared to Numeca simulation results. Compared with experimental results, the efficiency and the mass flow rate are higher by approximately 1.4% and 0.6%, respectively, and the pressure ratio is higher by 0.1%. The results show that the throughflow results are consistent with the experimental results and the 3D calculation results under the design conditions.
The predicted relative Mach number distributions obtained from the throughflow calculations and the circumferentially averaged results from the three-dimensional simulations are presented at the design point condition in Figure 7. It can be observed that the trend of relative Mach number distribution from throughflow calculations is similar to that from three-dimensional computations. The maximum relative Mach number in the passage occurs near the leading edge of the first-stage rotor, reaching approximately 0.52. This indicates that the internal flow within the compressor is predominantly subsonic.
Figure 8 presents the radial profiles of total pressure and temperature at the P&W3S1 outlet under the design condition, compared with the experimental data and Numeca results. It can be seen that the throughflow results are consistent with the overall distribution trend of the experimental values [46] and the Numeca results. The pressure measurement accuracy in the experiment is within +0.10% of full-scale reading, and the temperature measurement accuracy is ±0.14 °C. The total temperature distribution obtained by the throughflow calculation is steeper in the endwall region, slightly higher in the tip region, and slightly lower. However, the maximum temperature difference is within 0.5 K compared with the experimental data. It shows that the throughflow model developed in our study can simulate the radial mixing phenomenon more accurately.
In order to evaluate the capacity of the solver to predict the off-design point performance of the compressor, the performance of P&W3S1 at 85%, 100%, and 105% design speed is simulated, respectively. The obtained compressor speed characteristics are shown in Figure 9. Test data were derived from reference [46], and the efficiency measurements’ scatter can generally be within ±0.35 percentage points. Comparing the total pressure ratio obtained by the throughflow calculation and the experiment, the two results are consistent at 100% design speed, and the maximum relative error under off-design speed conditions does not exceed 2%. Additionally, comparing the efficiency characteristics, the relative error between the flow results and the test results is about 2% at the design speed, and the relative error between the non-design speed and the test value is about 3%. One possible reason is that the rotor tip clearance correction is not considered in this paper, and the loss estimation needs to be revised, which leads to slightly higher efficiency for most working conditions of the compressor. Another reason may be that the off-design speed exceeds the estimated range of the empirical correlations. The throughflow solver developed in this paper can naturally predict the mass flow rate under chock conditions. However, the predicted near-stall flow rate is slightly higher than the experimental value.
3.2. GE-EEE High-Pressure Turbine
The GE-EEE high-pressure turbine is one of the research results of NASA’s Energy Efficient Engine program. In this study, this turbine component is chosen as the simulation object to validate the predictive capability of the throughflow solver for turbine characteristics. Rotor tip clearance and film cooling are not considered in the calculation. The computational grid is shown in Figure 10, where the black and red regions represent bladeless zones and the green region is the blade zone. The cell clustering is applied near the hub and shroud and the leading and trailing edges of the blades. After grid independence verification, the final total number of cells is 240 × 120, and the width of the first grid layer satisfies the requirements of the turbulence model calculations.
The NASA report [47] provides lots of detailed experimental data. The researchers complete a characteristic line calculation by fixing the ratio of inlet total pressure to outlet static pressure πTS and adjusting the physical rotational speed, and the inlet total pressure and total temperature are fixed values. Figure 11 shows the total-to-total pressure ratio in function of the corrected speed for a varying downstream static pressure. Under a wide range of rotational speeds, the expansion ratio predicted by the throughflow model is quite consistent with the test results, and the two are almost completely coincident at low speeds. As the corrected speed increases, the calculated value is slightly lower than the test value, and the maximum error is still within 2%, indicating that the throughflow model is more accurate for turbine performance prediction.
In order to verify the prediction accuracy of the throughflow model to the radial distribution of parameters, Numeca software is used for three-dimensional viscosity numerical simulation. We select the 11th operating point from Appendix G in Reference [47] for the calculation. The point is near the design conditions, with the boundary conditions set at an inlet total pressure of 345.951 kPa, an inlet total temperature of 711.5 K, a backpressure of 61.941 kPa, and a rotational speed of 8279.5 rpm. The Numeca calculations use the S-A turbulence model, and the FNM method is used for the rotor–stator interface. Grid clustering is used near the solid walls, and the first layer cell width is set at 0.001 mm so that y+ does not exceed 5, which meets the requirements of the turbulence model. The final number of three-dimensional computational cells is 3.345 million. Table 2 shows the comparison of the performance parameters obtained by throughflow and Numeca calculations. Under this condition, the flow rate and expansion ratio obtained by the throughflow and three-dimensional calculation are basically consistent, and the isentropic efficiency is 1.16% higher.
Figure 12 shows the radial distribution of the exhaust flow angle and Mach number of each blade obtained from the throughflow solver (TF) and Numeca near the design condition. The absolute value is taken in the stator, and the relative value is taken in the rotor. The unmarked solid line represents the calculation result of the throughflow model, and the solid line with triangular markers represents the Numeca result. The calculation results of the inlet and outlet flow angles of each row of blades in the main flow area are basically consistent with the three-dimensional calculation values, and the maximum error is within 3°. The difference near the endwall area is slightly larger, especially at the rotor tip. The main reason is that the three-dimensional flow characteristics of the area near the endwall are obvious, and the current empirical model system is deficient. From Figure 12c,d, it can be seen that the trend of the inlet and outlet Mach number of each blade row calculated by the TF is basically consistent with the three-dimensional calculation circumferential average result. The TF results are generally high, especially the Mach number at the outlet of the inlet guide vane, which is 0.1 higher than that of the three-dimensional results, and the Mach number at the inlet of the first-stage rotor is also correspondingly high during the downstream value transfer process.
Figure 13 shows the radial distribution of the total pressure ratio and the total temperature ratio at the outlet of the GE-EEE high-pressure turbine near the design condition. The total pressure ratio obtained with the throughflow and the three-dimensional calculation is basically consistent with the test results [47], and it is only slightly higher than the experimental value above 60% of the blade height. The total temperature ratios predicted using the two calculation methods are higher than the experimental results. The main reason is that the throughflow calculation and the three-dimensional calculation do not consider the influence of film cooling.
The two verification cases in this section preliminarily indicate that the throughflow solver developed in this study can accurately predict components’ design and off-design characteristics. It has captured the main flow features and demonstrates reasonable consistency compared with experimental results and three-dimensional simulations. Next, we apply the throughflow model to the simulation of the whole engine.
4. Whole Engine Validations Case
4.1. Case Background
In this study, a single-shaft turboshaft engine, WZ-X, was selected as a case of the whole aero-engine throughflow simulation. Its main components include an axial–radial combined compressor, a combustion chamber, a two-stage uncooled gas turbine, and a two-stage power turbine. Due to the lack of a geometric model of the prototype engine combustion chamber and the combustor solver only simulating the flow in the flame tube, this study uses a straight flow combustor instead of the prototype combustor to provide a reasonable inlet parameter distribution for the gas turbine.
When generating the whole aero-engine throughflow calculation grid, the engine model is divided into three grid sub-areas: axial–radial combined compressor, combustor, and turbine component combination. The throughflow calculation grids of each sub-region are generated, respectively. Table 3 gives an overview of the cell count of each part of the mesh, and the computational domain of throughflow simulations is shown in Figure 14. The turboshaft engine is a single-shaft and geometrically fixed structure, and there is no need to change its mesh when calculating different working states.
The throttling characteristics of the maximum emergency, maximum power rating, intermediate emergency, and maximum continuous condition of the engine are calculated. Table 4 shows the corrected speed of the gas generator corresponding to each working state of the engine, in which the maximum power rating is at the WZ-X design condition. The engine inlet and outlet boundaries are given according to the sea level standard atmospheric environment. The initial compressor backpressure and fuel/air ratio are given according to the design value, and the off-design condition calculations take the design operating condition result as the initial field to reduce the iteration loop. In order to ensure the convergence of each component solution, the power matching between the compressor and the gas turbine and the mass flow continuity between the combustor and the turbine are adjusted by means of iterations of two parameters: the compressor output static pressure and the fuel/air ratio.
4.2. Results and Analysis
Figure 15 shows the convergence history of the whole turboshaft engine simulation at the maximum power rating. As shown in Figure 15a, after four iterations of the whole-engine simulations, the relative error between the combustor outlet flow and the turbine inlet flow (Z1) and the relative error between the compressor power and turbine power (Z2) are less than 1%. At the same time, it can be seen from Figure 15b that the mass flow rate of each component has reached complete convergence in the last iteration loop of the whole engine simulation. It indicates that the throughflow calculation of the turboshaft engine meets the co-working conditions.
The aerodynamic parameter distribution calculated by the simulation of the whole engine can better describe the flow field details of each component. Figure 16 shows the meridional plane distributions of the dimensionless static temperature, static pressure, and relative Mach number of the WZ-X turboshaft engine under the maximum power rating. After the air enters the compressor, it gradually decelerates and diffuses, and shock waves appear in the axial flow rotor and the centrifugal impeller channel, respectively. After the shock waves, the static pressure further rises and reaches the maximum static pressure at the axial diffuser outlet. The Mach number changes drastically within a small range at the radial diffuser inlet, and there are obvious low-speed areas and separation areas in the axial diffuser. The combustion process in the combustor mainly occurs at the head of the swirler. Under the influence of the adverse pressure gradient, multiple backflow zones are formed behind the swirler, filled with high-temperature gas. On the one hand, it contributes to the evaporation of fuel; on the other hand, it can provide a stable ignition source. The temperature of hot gas decreases gradually through mixing with the downstream cold air and the radiation heat transfer and convective heat transfer effect of the high-temperature zone on the surrounding gas. Finally, the air injected from the mixing hole and the film hole on the wall adjusts the temperature distribution at the combustor outlet to a reasonable range. Although the combustor exit temperature exhibits significant variations, the velocity changes are relatively small. High-temperature and high-pressure gas expands in the turbine to perform work, and the relative Mach numbers in the turbine are both less than 1, indicating that both the gas turbine and the power turbine operate in a subcritical state.
Due to the lack of experimental data in the WZ-X engine model, this section also uses the traditional zero-dimensional engine overall performance calculation software Gasturb 11 version to calculate the engine thermodynamic cycle. GasTurb is a powerful and flexible overall performance calculation software for gas turbine engines developed by Dr. Joachim Kurzke [48] of the German MTU Aeroengine Company. The component characteristic diagram (compressor, gas turbine, and power turbine) adopts the test characteristics of prototype engine components, and the corresponding aerodynamic parameter design values of the WZ-X engine compressor, combustion chamber, gas turbine, and power turbine need to be used as input conditions for the zero-dimensional overall performance calculation. The input conditions of the throughflow simulation platform only require the engine inlet and outlet conditions and engine speed, as described above.
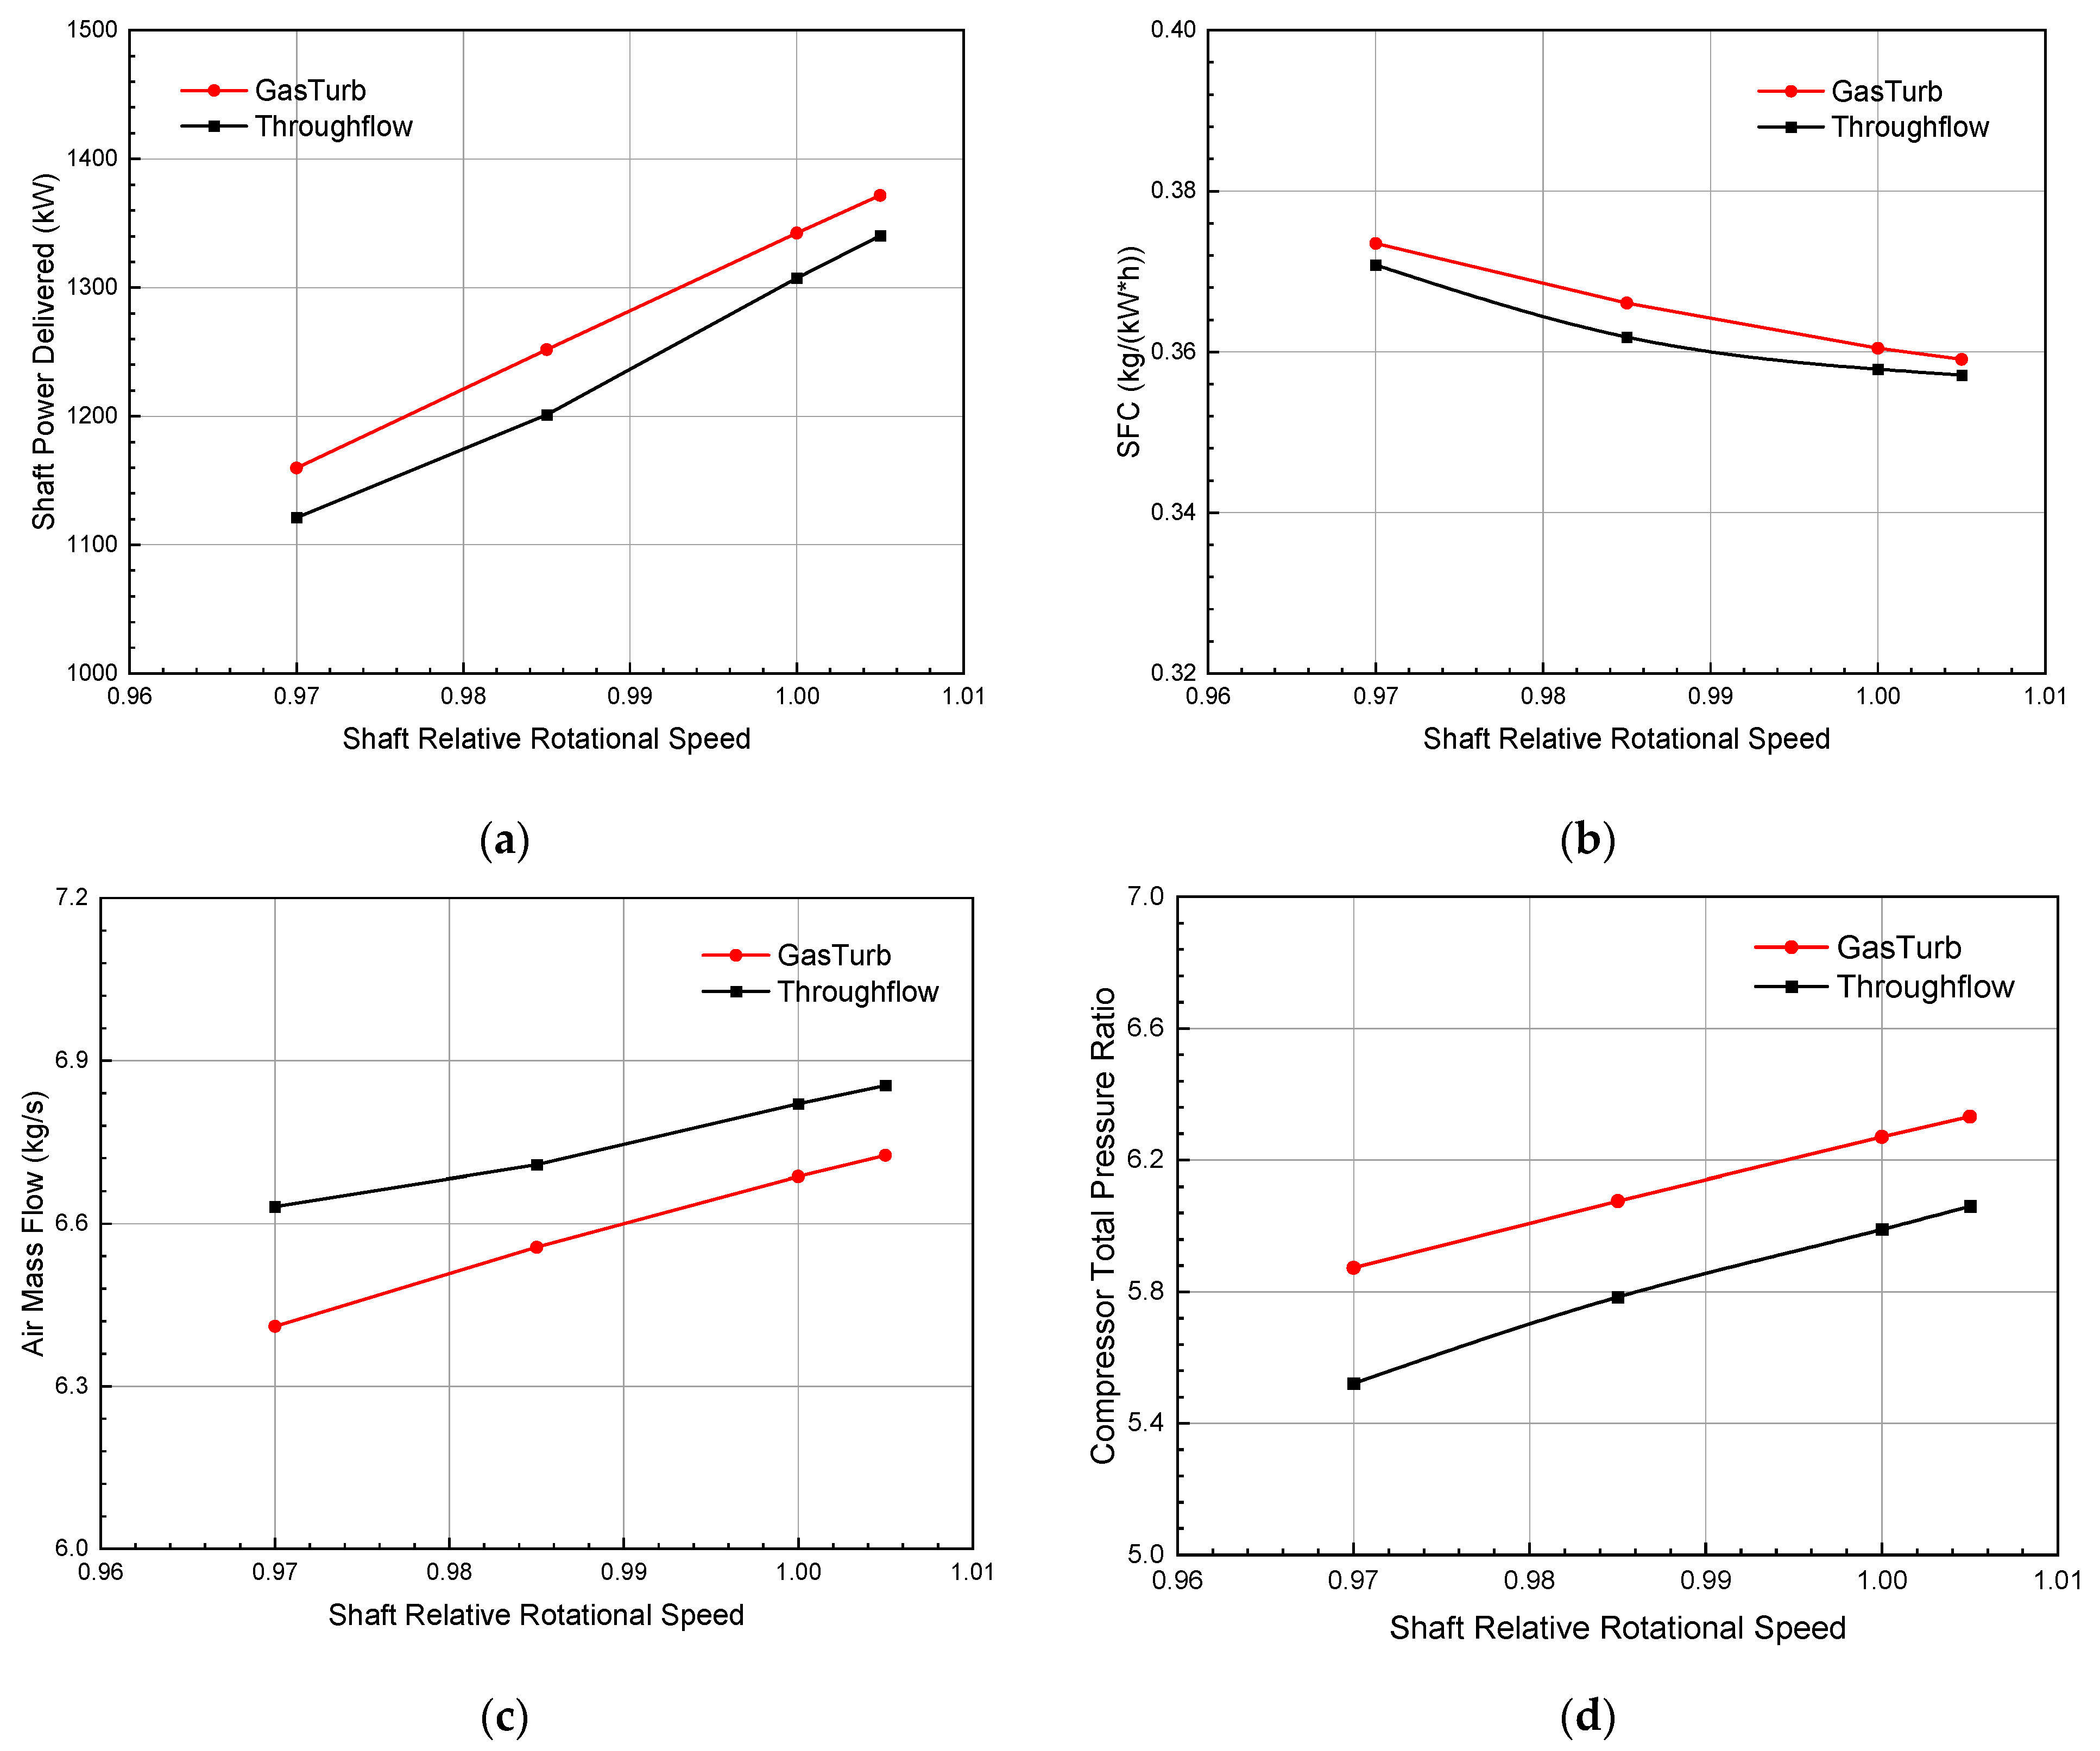
Figure 17 shows the variation in shaft power delivered, SFC, inlet air mass flow, and compressor pressure ratio of the WZ-X engine with different speed. In all operating conditions, the inlet air flow, compressor pressure ratio, and engine shaft power increase monotonously with the increase in gas generator speed, which is consistent with the trend in the 0D calculation results. The SFC decreases nonlinearly with the increase in the gas generator speed, and the downward trend gradually slows down at high speeds. In summary, the throughflow simulation platform has the potential to simulate the whole turboshaft engine along the matching line, which can be used to guide the design and modification of the turboshaft engine.
5. Conclusions
This article developed and evaluated a method for a steady-state two-dimensional throughflow simulation method of the whole turboshaft engine above idle power conditions. The approach is based on component flow-through models and utilizes the Newton–Raphson method to iteratively calculate the compressor backpressure and fuel/air ratio required for the turboshaft engine matching operation, so as to build the whole-engine throughflow calculation platform and realize the serial iterative simulation of engine components. Through the research in this article, the following conclusions can be drawn:
(1) The throughflow solver developed in this article can be applied to both the design point and off-design point characteristics of the compressor and turbine, as well as meridional flow field prediction. The calculation error is less than 2% compared with the experimental results, and it can automatically predict component blockage conditions.
(2) Compared with the traditional 0D overall performance simulation method, the throughflow simulation platform no longer requires a common characteristic diagram and can be used as an independent analysis and calculation tool.
(3) The throttling characteristics obtained using throughflow simulation of the WZ-X turboshaft engine are consistent with the results of the zero-dimensional thermodynamic cycle, which can truly and accurately reflect the flow details on the meridional plane of the engine.
The key to this calculation method is to maintain the accuracy of component flow in the two-dimensional simulation of the full engine while ensuring the effectiveness of the whole aero-engine balance algorithm. The introduction of this method provides a more accurate and comprehensive analysis method for whole-engine simulation and is expected to have a positive impact on aero-engine design and performance evaluation.
Author Contributions
Conceptualization, S.Z. and X.H.; methodology, S.Z., X.H. and T.Z.; software, S.Z., A.M. and T.Z.; formal analysis, S.Z. and A.M.; investigation, S.Z.; writing—original draft preparation, S.Z.; writing—review and editing, N.G.; project administration, N.G.; funding acquisition, N.G. All authors have read and agreed to the published version of the manuscript.
Funding
This research was funded by the Fundamental Research Funds for the Central Universities, grant number 1002-XBC22003.
Data Availability Statement
Data is contained within the article.
Conflicts of Interest
The authors declare no conflicts of interest.
References
- Cao, J.G. Development Opportunities and Application Prospects of Aero-Engine Simulation Technology under Digital Transformation. J. Syst. Simul. 2021, 1, 1. (In Chinese) [Google Scholar] [CrossRef]
- Nichols, L.D.; Chamis, C.C. Numerical Propulsion System Simulation: An Interdisciplinary Approach. In Proceedings of the AIAA/NASA/OAI Conference on Advanced SEI Technologies, Cleveland, OH, USA, 4–6 September 1991. [Google Scholar]
- Homsi, P.; Tobias, L. VIVACE-Value Improvement through a Virtual Aeronautical Collaborative Enterprise; Technical Leaflet Final; VIVACE Public: Helsinki, Finland, 2007. [Google Scholar]
- Alexiou, A.; Tsalavoutas, T. Introduction to Gas Turbine Modelling with PROOSIS, 1st ed.; Empresarios Agrupados Internacional, S.A.: Madrid, Spain, 2011. [Google Scholar]
- Cao, J.G. Status, Challenges and Perspectives of Aero-Engine Simulation Technology. J. Propul. Techno. 2018, 39, 961–970. (In Chinese) [Google Scholar] [CrossRef]
- Wu, C.H. A General Theory of Three-Dimensional Flow in Subsonic and Supersonic Turbomachines of Axial-, Radial-, and Mixed-Flow Type; Technical Note; NASA: Washington, DC, USA, 1952.
- Hosseinimaab, S.M.; Tousi, A.M. A New Approach to Off-Design Performance Analysis of Gas Turbine Engines and Its Application. Energy Conv. Manag. 2021, 243, 114411. [Google Scholar] [CrossRef]
- Wen, Q.; Li, Y.J.; Liu, T.; Wei, G.; Fu, Q. Advances in the Research of 3D Full Engine Aerodynamics Simulation. Aerosp. Power 2021, 2, 46–51. (In Chinese) [Google Scholar]
- Teixeira, M.; Romagnosi, L.; Mezine, M.; Yannick, B.; Anker, J.; Claramunt, K.; Hirsch, C. A Methodology for Fully-Coupled CFD Engine Simulations, Applied to a Micro Gas Turbine Engine. In Proceedings of the ASME Turbo Expo 2018 Turbomachinery Technical Conference and Exposition, Oslo, Norway, 11–15 June 2018. [Google Scholar]
- Romagnosi, L.; Li, Y.C.; Mezine, M.; Teixeira, M.; Vilmin, S.; Anker, J.E.; Claramunt, K.; Baux, Y.; Hirsch, C. A Methodology for Steady and Unsteady Full-Engine Simulations. In Proceedings of the ASME Turbo Expo 2019 Turbomachinery Technical Conference and Exposition, Phoenix, AZ, USA, 17–21 June 2019. [Google Scholar]
- Pérez Arroyo, C.; Dombard, J.; Duchaine, F.; Gicquel, L.; Martin, B.; Odier, N.; Staffelbach, G. Towards the Large-Eddy Simulation of a Full Engine: Integration of a 360 Azimuthal Degrees Fan, Compressor and Combustion Chamber. Part I: Methodology and Initialisation. J. Glob. Power Propuls. Soc. 2020, 133115. [Google Scholar] [CrossRef] [PubMed]
- Pérez Arroyo, C.; Dombard, J.; Duchaine, F.; Gicquel, L.; Martin, B.; Odier, N.; Staffelbach, G. Towards the Large-Eddy Simulation of a Full Engine: Integration of a 360 Azimuthal Degrees Fan, Compressor and Combustion Chamber. Part II: Comparison Against Stand-Alone Simulations. J. Glob. Power Propuls. Soc. 2020, 133116. [Google Scholar] [CrossRef]
- Ricci, M.; Pacciani, R.; Marconcini, M. The exploitation of CFD legacy for the meridional analysis and design of modern gas and steam turbines. In Proceedings of the E3S Web of Conferences, Virtual Event, 15–16 September 2020. [Google Scholar] [CrossRef]
- Nigmatullin, R.Z.; Ivanov, M.J. The Mathematical Models of Flow Passage for Gas Turbine Engines and Their Components. In Proceedings of the AGARD Lecture Series, Paris, France, 15–16 December 1994. [Google Scholar]
- Stewart, E.M. Axisymmetric Aerodynamic Numerical Analysis of a Turbofan Engine. In Proceedings of the ASME 1995 International Gas Turbine and Aeroengine Congress and Exposition, Houston, TX, USA, 5–8 June 1995. [Google Scholar] [CrossRef]
- Petrovic, M.V.; Ahmed, A.-R.; Wiedermann, A. A Quick Method for Full Flange-to-Flange Industrial Gas Turbine Analysis Based on Through-Flow Modelling. J. Gas. Propuls. Power 2015, 8, 9–18. [Google Scholar] [CrossRef]
- Wiedermann, A.; Petrovic, M.V. Through-Flow Modeling of Single- and Two-Shaft Gas Turbines at Wide Operating Range. In Proceedings of the ASME Turbo Expo 2018 Turbomachinery Technical Conference and Exposition, Oslo, Norway, 11–15 June 2018. [Google Scholar]
- Petkovic, D.; Banjac, M.; Milic, S.; Petrovic, M.V.; Wiedermann, A. Modeling the Transient Behavior of Gas Turbines. J. Turbomach. 2020, 142, 081005. [Google Scholar] [CrossRef]
- Yang, C.; Wu, H.; Du, J.; Zhang, H.W.; Yang, J.G. Full-Engine Simulation of Micro Gas Turbine Based on Time-Marching Throughflow Method. Appl. Therm. Eng. 2022, 217, 119213. [Google Scholar] [CrossRef]
- Yang, C.; Wu, H.; Du, J.; Zhang, H.W.; Yang, J.G. Numerical Study on Throughflow Simulation of Components and Full Engine of Aero-Engine. J. Eng. Thermophys. 2023, 44, 894–902. (In Chinese) [Google Scholar]
- Liu, X.H.; Zhou, C.H.; Song, M.X.; Jin, D.H.; Gui, X.M. Overall Simulation of a Turbojet Engine Based on Throughflow Modeling. Acta Aeronaut. Astronaut. Sin. 2020, 41, 123199. (In Chinese) [Google Scholar]
- Dawes, W.N. Toward Improved Throughflow Capability: The Use of Three-Dimensional Viscous Flow Solvers in a Multistage Environment. J. Turbomach. Trans. ASME 1992, 114, 8–17. [Google Scholar] [CrossRef]
- Simon, J.F. Contribution to Throughflow Modelling for Axial Flow Turbomachines. Ph.D. Thesis, University of Liege, Liege, Belgium, 2007. [Google Scholar]
- Yang, X.F. Analysis and Design of Combined Compressor with Throughflow Model. Master’s Thesis, Nanjing University of Aeronautics and Astronautics, Nanjing, China, 2016. (In Chinese). [Google Scholar]
- Zhu, L.S.; Zhang, S.; Ge, N. Application Research of Two Different Turbulence Models in Through-Flow Calculation. J. Propul. Techno. 2021, 42, 1223–1234. (In Chinese) [Google Scholar] [CrossRef]
- Hou, K.X. Research on Numerical Simulation of Reactive Flow in Combustor with Detailed Chemical Kinetic. Master’s Thesis, Nanjing University of Aeronautics and Astronautics, Nanjing, China, 2007. (In Chinese). [Google Scholar]
- Jin, H.L.; Jin, D.H.; Li, X.J.; Gui, X.M. A Time-marching Throughflow Model and Its Application in Transonic Axial Compressor. J. Therm. Sci. 2010, 19, 519–525. [Google Scholar] [CrossRef]
- Horlock, J.H. On Entropy Production in Adiabatic Flow in Turbomachines. J. Basic Eng. 1971, 93, 587–593. [Google Scholar] [CrossRef]
- Wright, P.I.; Miller, D.C. An Improved Compressor Performance Prediction Model; Rolls-Royce Report; Rolls-Royce Ltd.: Manchester, UK, 1991. [Google Scholar]
- Dunham, J. Compressor Off-Design Performance Prediction Using an Endwall Model. In Proceedings of the ASME 1996 International Gas Turbine and Aeroengine Congress and Exhibition, Birmingham, UK, 10–13 June 1996. [Google Scholar] [CrossRef]
- Wiesner, F.J. A Review of Slip Factors for Centrifugal Impellers. J. Eng. Power 1967, 89, 558–566. [Google Scholar] [CrossRef]
- Zhu, J.Q.; Sjolander, S.A. Improved Profile Loss and Deviation Correlations for Axial-turbine Blade Rows. In Proceedings of the GT2005 ASME Turbo Expo 2005: Power for Land, Sea and Air, Reno-Tahoe, NV, USA, 6–9 June 2005. [Google Scholar]
- Kacker, S.C.; Okapuu, U. A Mean Line Prediction Method for Axial Flow Turbine Efficiency. J. Eng. Power 1982, 104, 111–119. [Google Scholar] [CrossRef]
- Blazek, J. Computational Fluid Dynamics: Principles and Applications, 3rd ed.; Hayton, J., Ed.; Butterworth-Heinemann: Oxford, UK, 2015. [Google Scholar] [CrossRef]
- Baldwin, B.S.; Lomax, H. Thin Layer Approximation and Algebraic Model for Separated Turbulent Flows. In Proceedings of the AIAA 16th Aerospace Sciences Meeting, Huntsville, AL, USA, 16–18 January 1978. [Google Scholar] [CrossRef]
- Gatlin, B. An Implicit, Upwind Method for Obtaining Symbiotic Solutions to the Thin-Layer Navier-Stokes Equations. Ph.D. Thesis, Mississippi State University, Starkville, MS, USA, 1987. [Google Scholar]
- Chen, J.P. Unsteady Three-Dimensional Thin Layer Navier-Stokes Solutions for Turbomachinery in Transonic Flow. Ph.D. Thesis, Mississppi State University, Starkville, MS, USA, 1991. [Google Scholar]
- Degani, D.; Schiff, L.B. Computation of Turbulent Supersonic Flows around Pointed Bodies Having Crossflow Separation. J. Comput. Phys. 1986, 66, 173–196. [Google Scholar] [CrossRef]
- Hamer, A.; Roby, R.J. CFD Modeling of a Gas Turbine Combustor Using Reduced Chemical Kinetic Mechanisms. In Proceedings of the 33rd Joint Propulsion Conference and Exhibit, Seattle, WA, USA, 6–9 July 1997. [Google Scholar] [CrossRef]
- Yan, Y.W.; Song, S.W.; Hu, H.S.; Wang, Y.Y.; Lei, Y.B.; Zhao, J.X.; Lin, Z.Y. Numerical Investigations of Two-Phase Spray Combustion Flow Fields in Slinger Annular Combustor. J. Aerosp. Power 2011, 26, 1003–1010. (In Chinese) [Google Scholar] [CrossRef]
- Xu, R.; Li, J.H.; Zhao, J.X.; Liu, Y.; Wang, S.F. Effects of Turbulent Combustion Models on Spray Combustion Flow of Dual-Stage Swirl Combustor. J. Propuls. Technol. 2013, 34, 375–382. (In Chinese) [Google Scholar] [CrossRef]
- Zhao, J.X. An Analytical Design Methodology for an Annular Combustor. Int. J. Comput. Fluid Dyn. 1995, 5, 231–243. [Google Scholar] [CrossRef]
- Hoffmann, N.; Markatos, N.C. Thermal Radiation Effects on Fires in Enclosures. Appl. Math. Model. 1988, 12, 129–140. [Google Scholar] [CrossRef]
- Amano, R.S. Development of a Turbulence Near-Wall Model and Its Application to Separated and Reattached Flows. Numer. Heat Transf. 1984, 7, 59–75. [Google Scholar] [CrossRef]
- Burdsall, E.A.; Canal, E., Jr.; Lyons, K.A. Core Compressor Exit Stage Study-I Aerodynamic and Mechanical Design; NASA Lewis Research Center: Cleveland, OH, USA, 1979.
- Behlke, R.F.; Burdsall, E.A.; Canal, E., Jr.; Korn, N.D. Core Compressor Exit Stage Study-II Final Report; NASA Lewis Research Center: Cleveland, OH, USA, 1979.
- Timko, L.P. Energy Efficient Engine High Pressure Turbine Component Test Performance Report; NASA Lewis Research Center: Cleveland, OH, USA, 1990.
- Kurzke, J.; Halliwell, I. Propulsion and Power: An Exploration of Gas Turbine Performance Modeling, 1st ed.; Springer International Publish: Cham, Switzerland, 2018; pp. 213–247. [Google Scholar] [CrossRef]
Figure 1.
Flow distribution model of the two-dimensional combustor.
Figure 2.
Schematic diagram of a single-shaft turboshaft engine flow path, where 2–2 represents the intake outlet section, 4–4 is the combustor outlet section.
Figure 2.
Schematic diagram of a single-shaft turboshaft engine flow path, where 2–2 represents the intake outlet section, 4–4 is the combustor outlet section.
Figure 3.
Schematic of input parameters and thermodynamic cycle analysis in a single-shaft turboshaft engine simulation platform.
Figure 3.
Schematic of input parameters and thermodynamic cycle analysis in a single-shaft turboshaft engine simulation platform.
Figure 4.
Flow chart of whole aero engine calculation.
Figure 5.
Throughflow computational mesh of P&W 3S1.
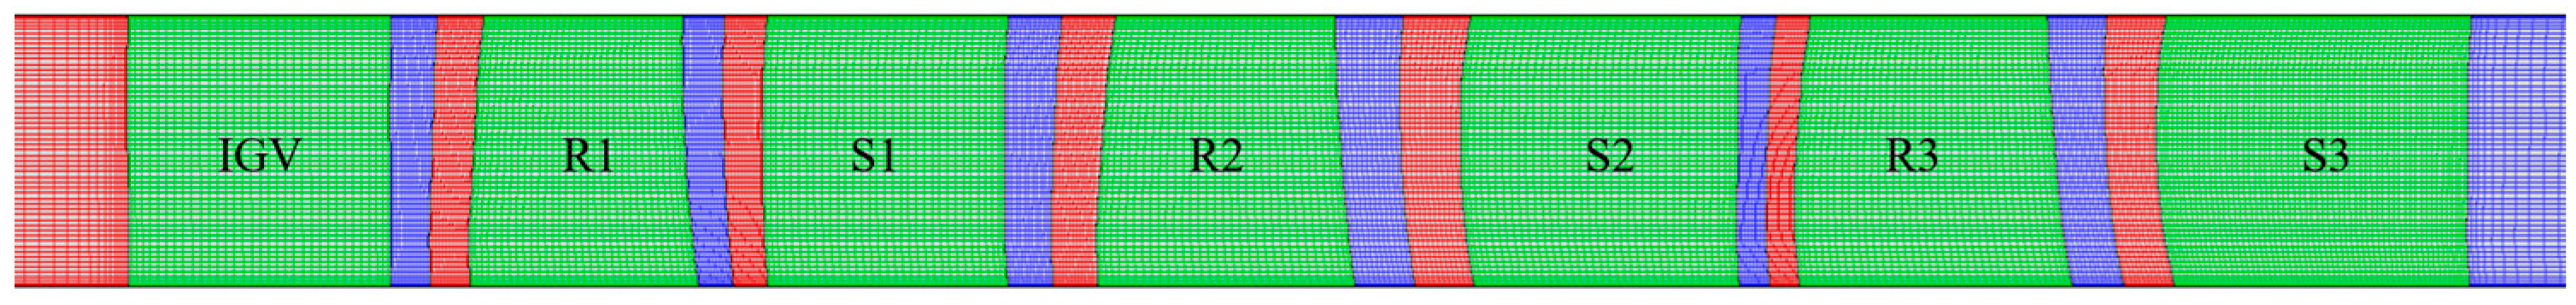
Figure 6.
Grid independence verification of the calculation of P&W3S1.
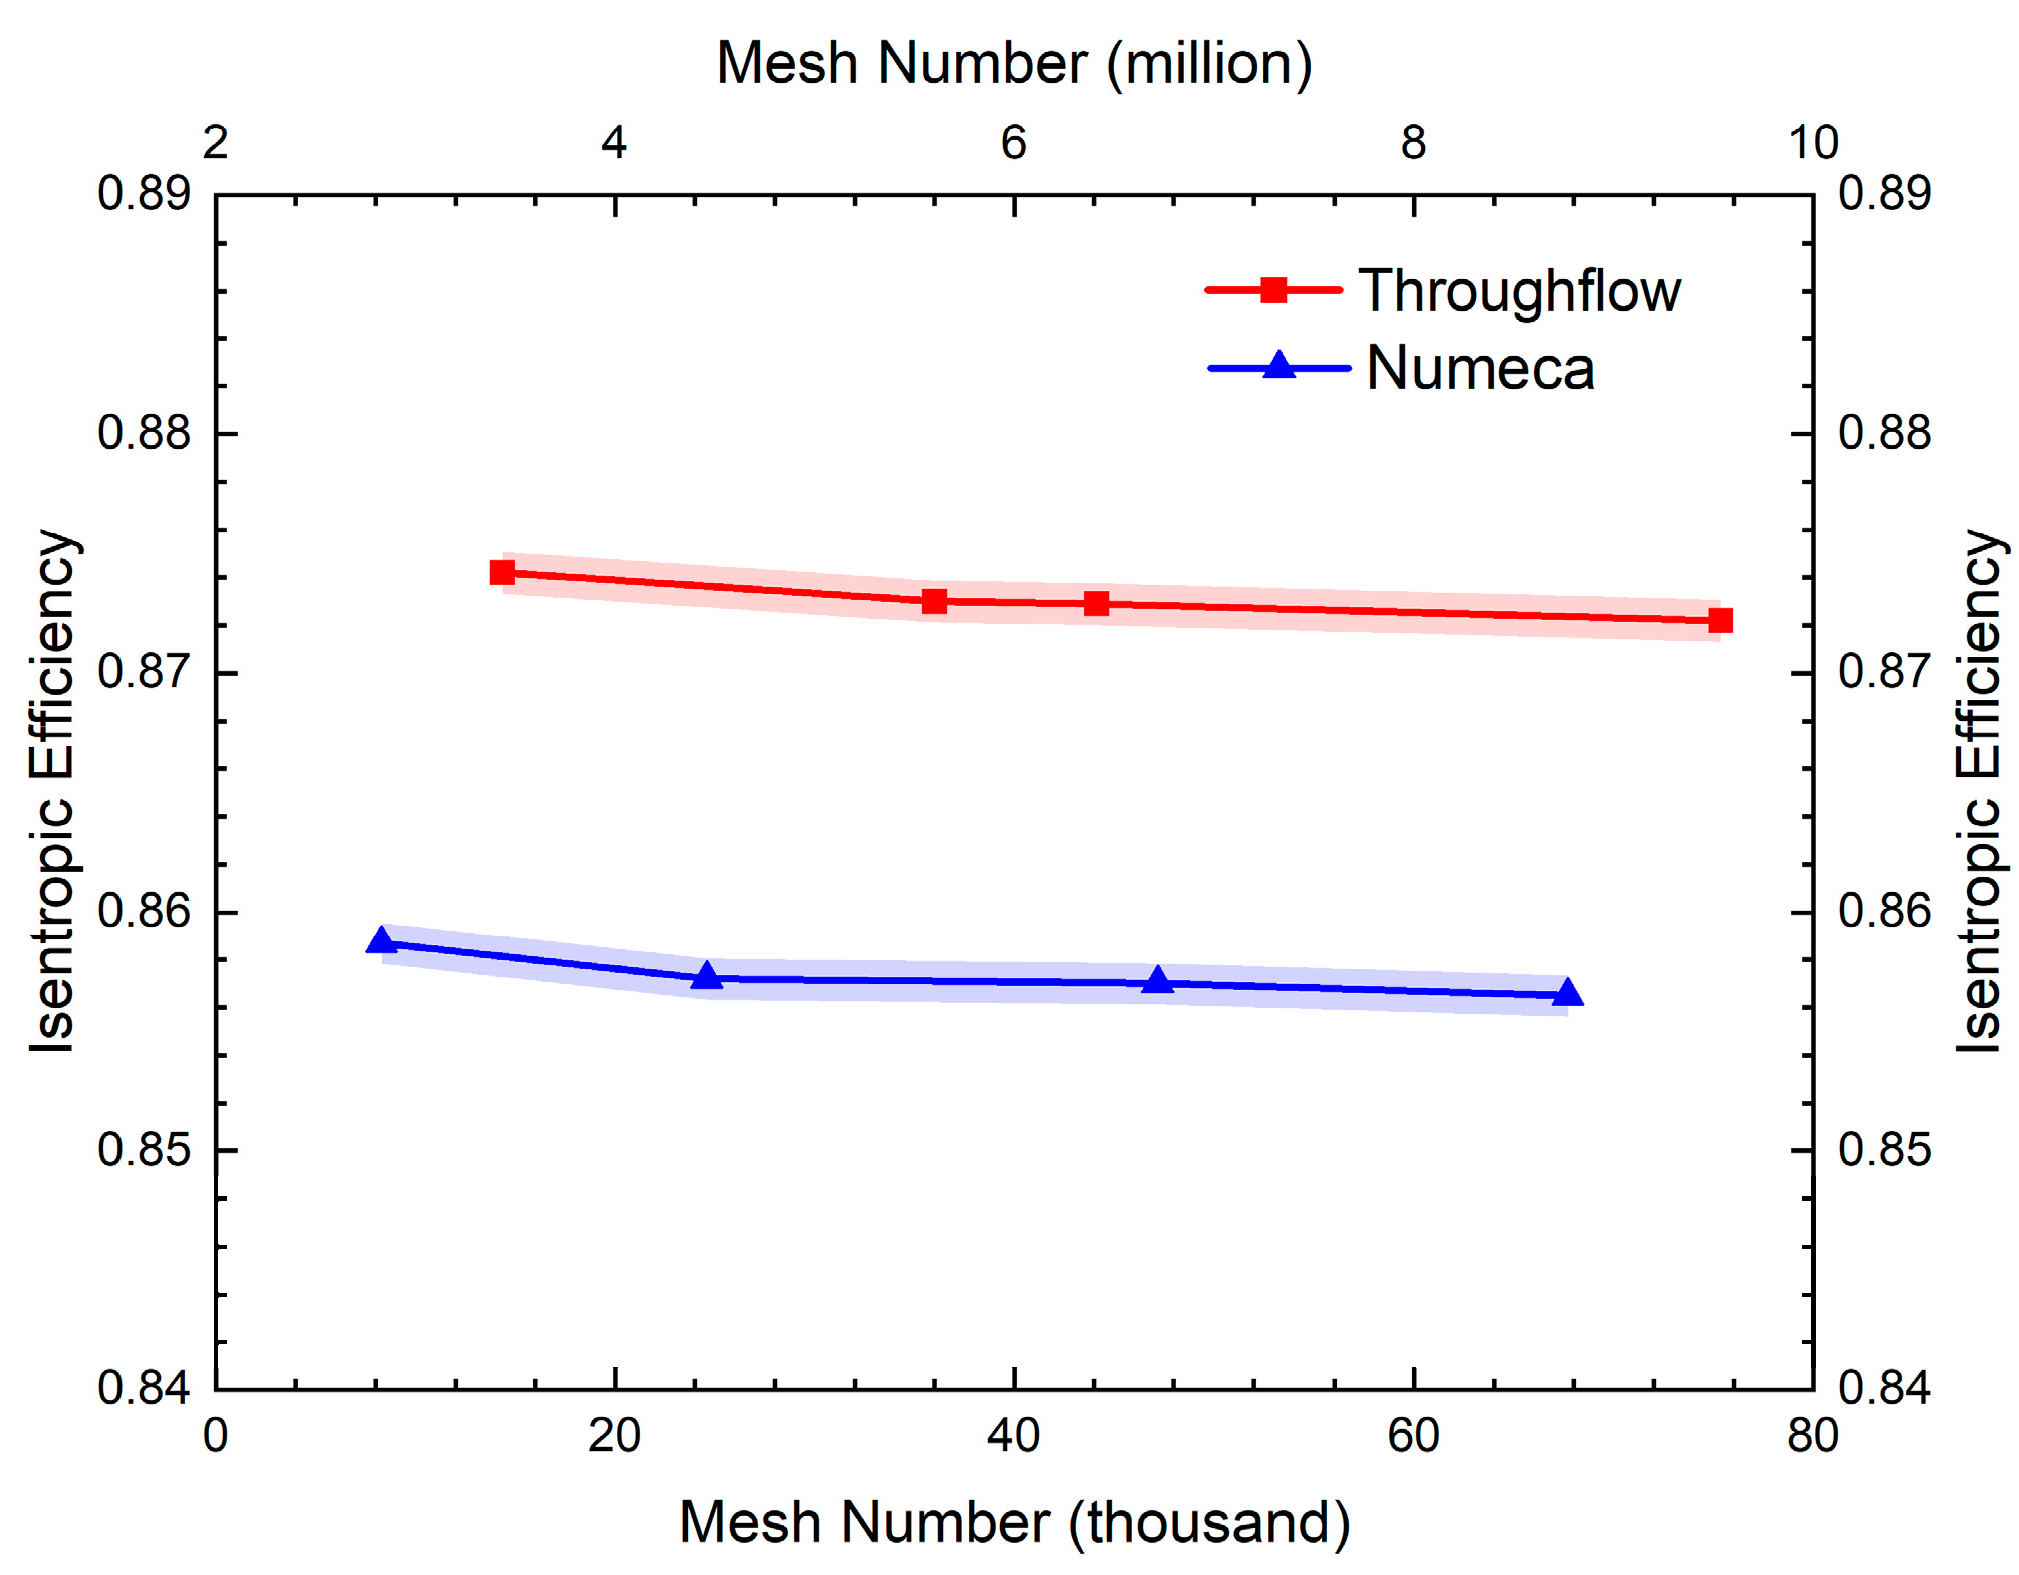
Figure 7.
Relative Mach number contours in the P&W3S1 under design conditions. (up) Throughflow; (down) Numeca.
Figure 7.
Relative Mach number contours in the P&W3S1 under design conditions. (up) Throughflow; (down) Numeca.
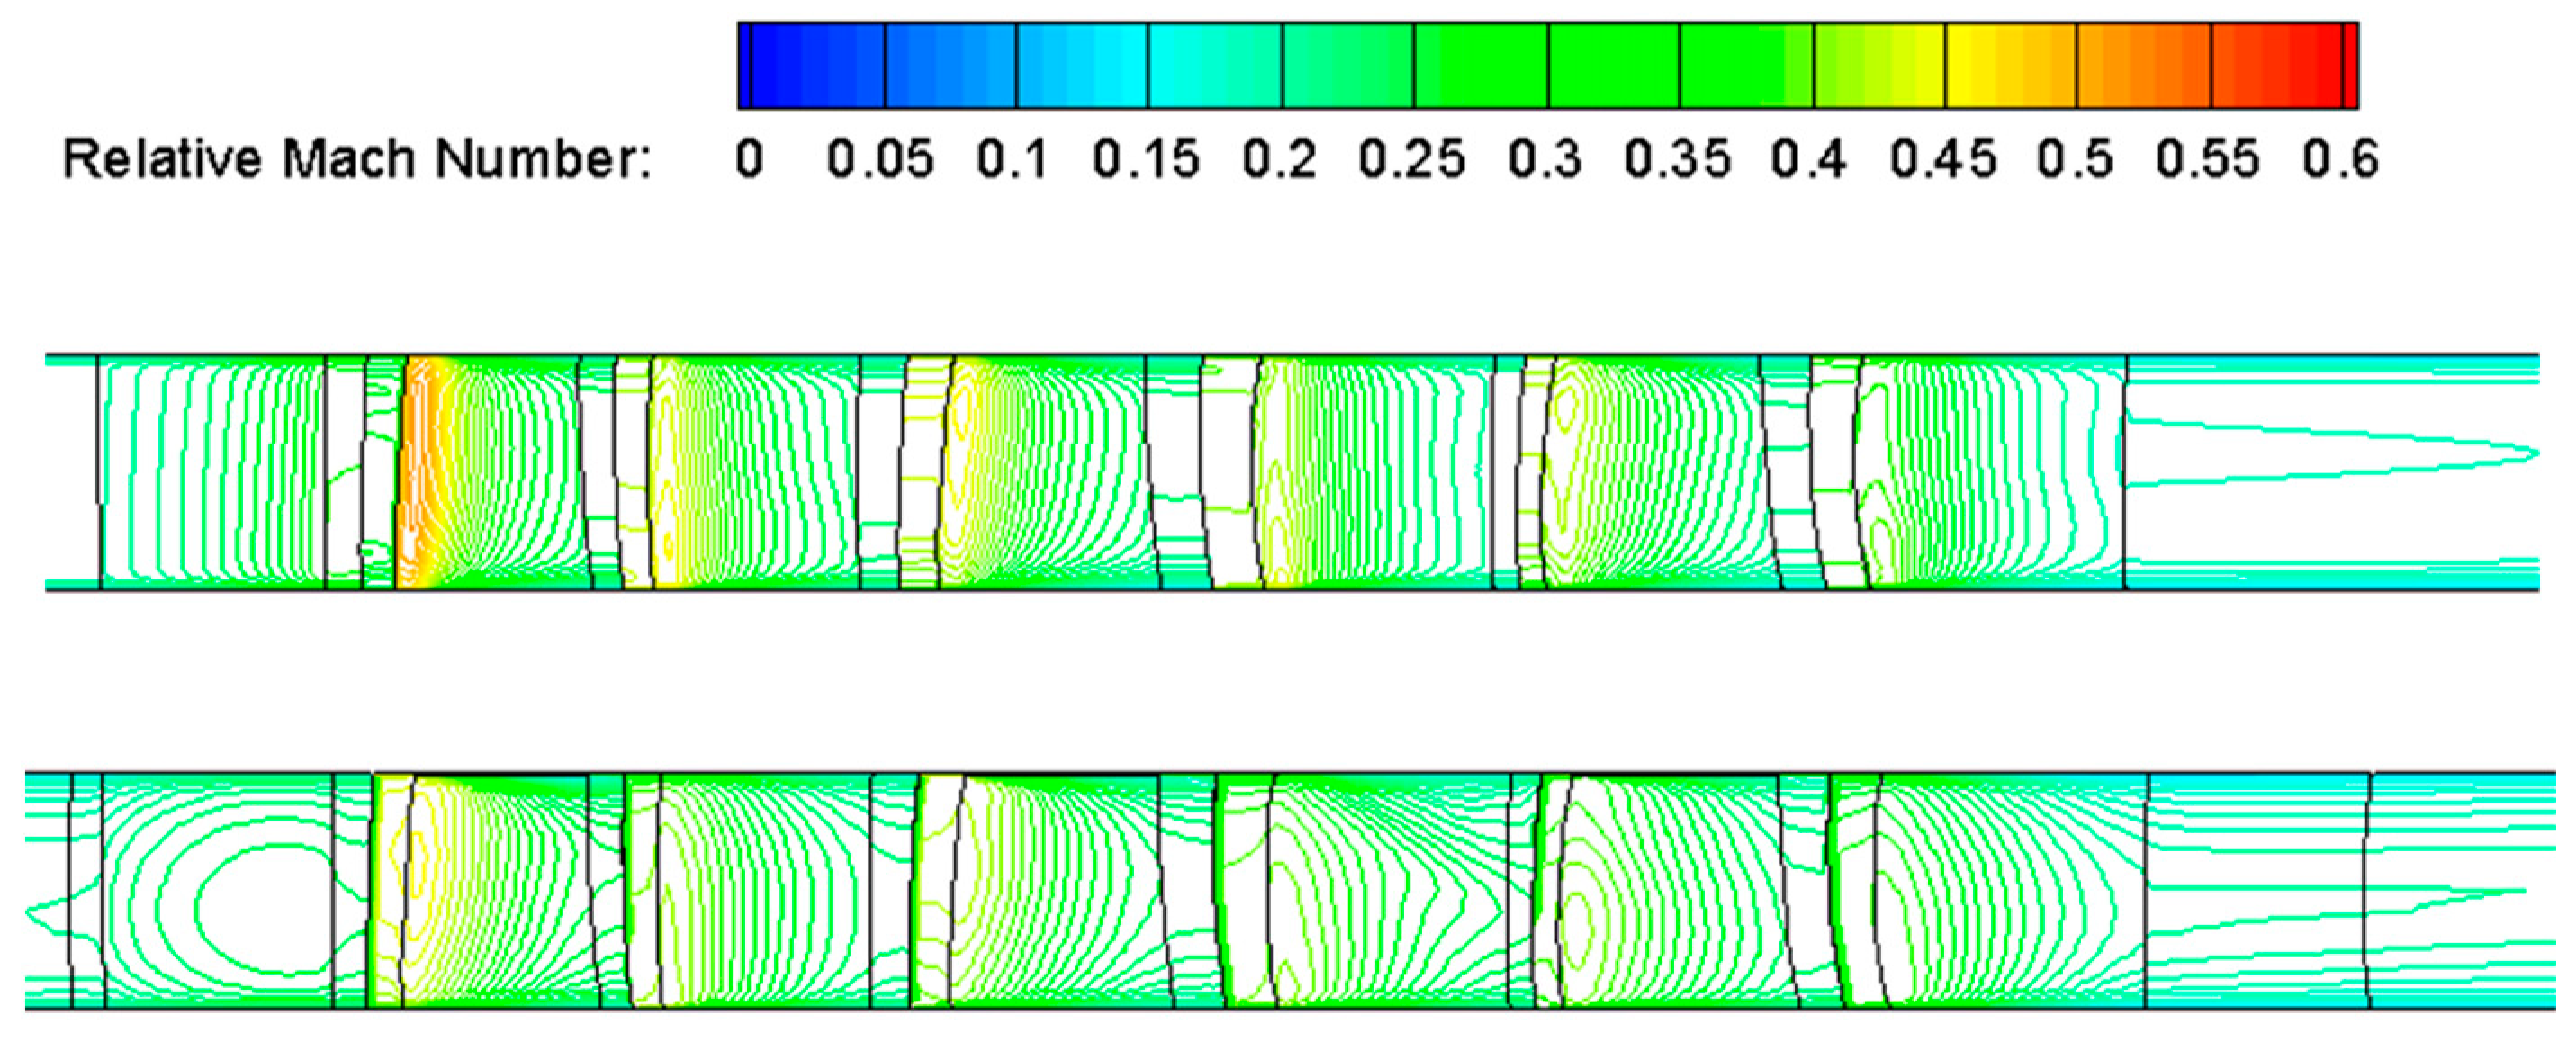
Figure 8.
Radial distributions of (a) outlet total temperature and (b) outlet total pressure under design conditions.
Figure 8.
Radial distributions of (a) outlet total temperature and (b) outlet total pressure under design conditions.
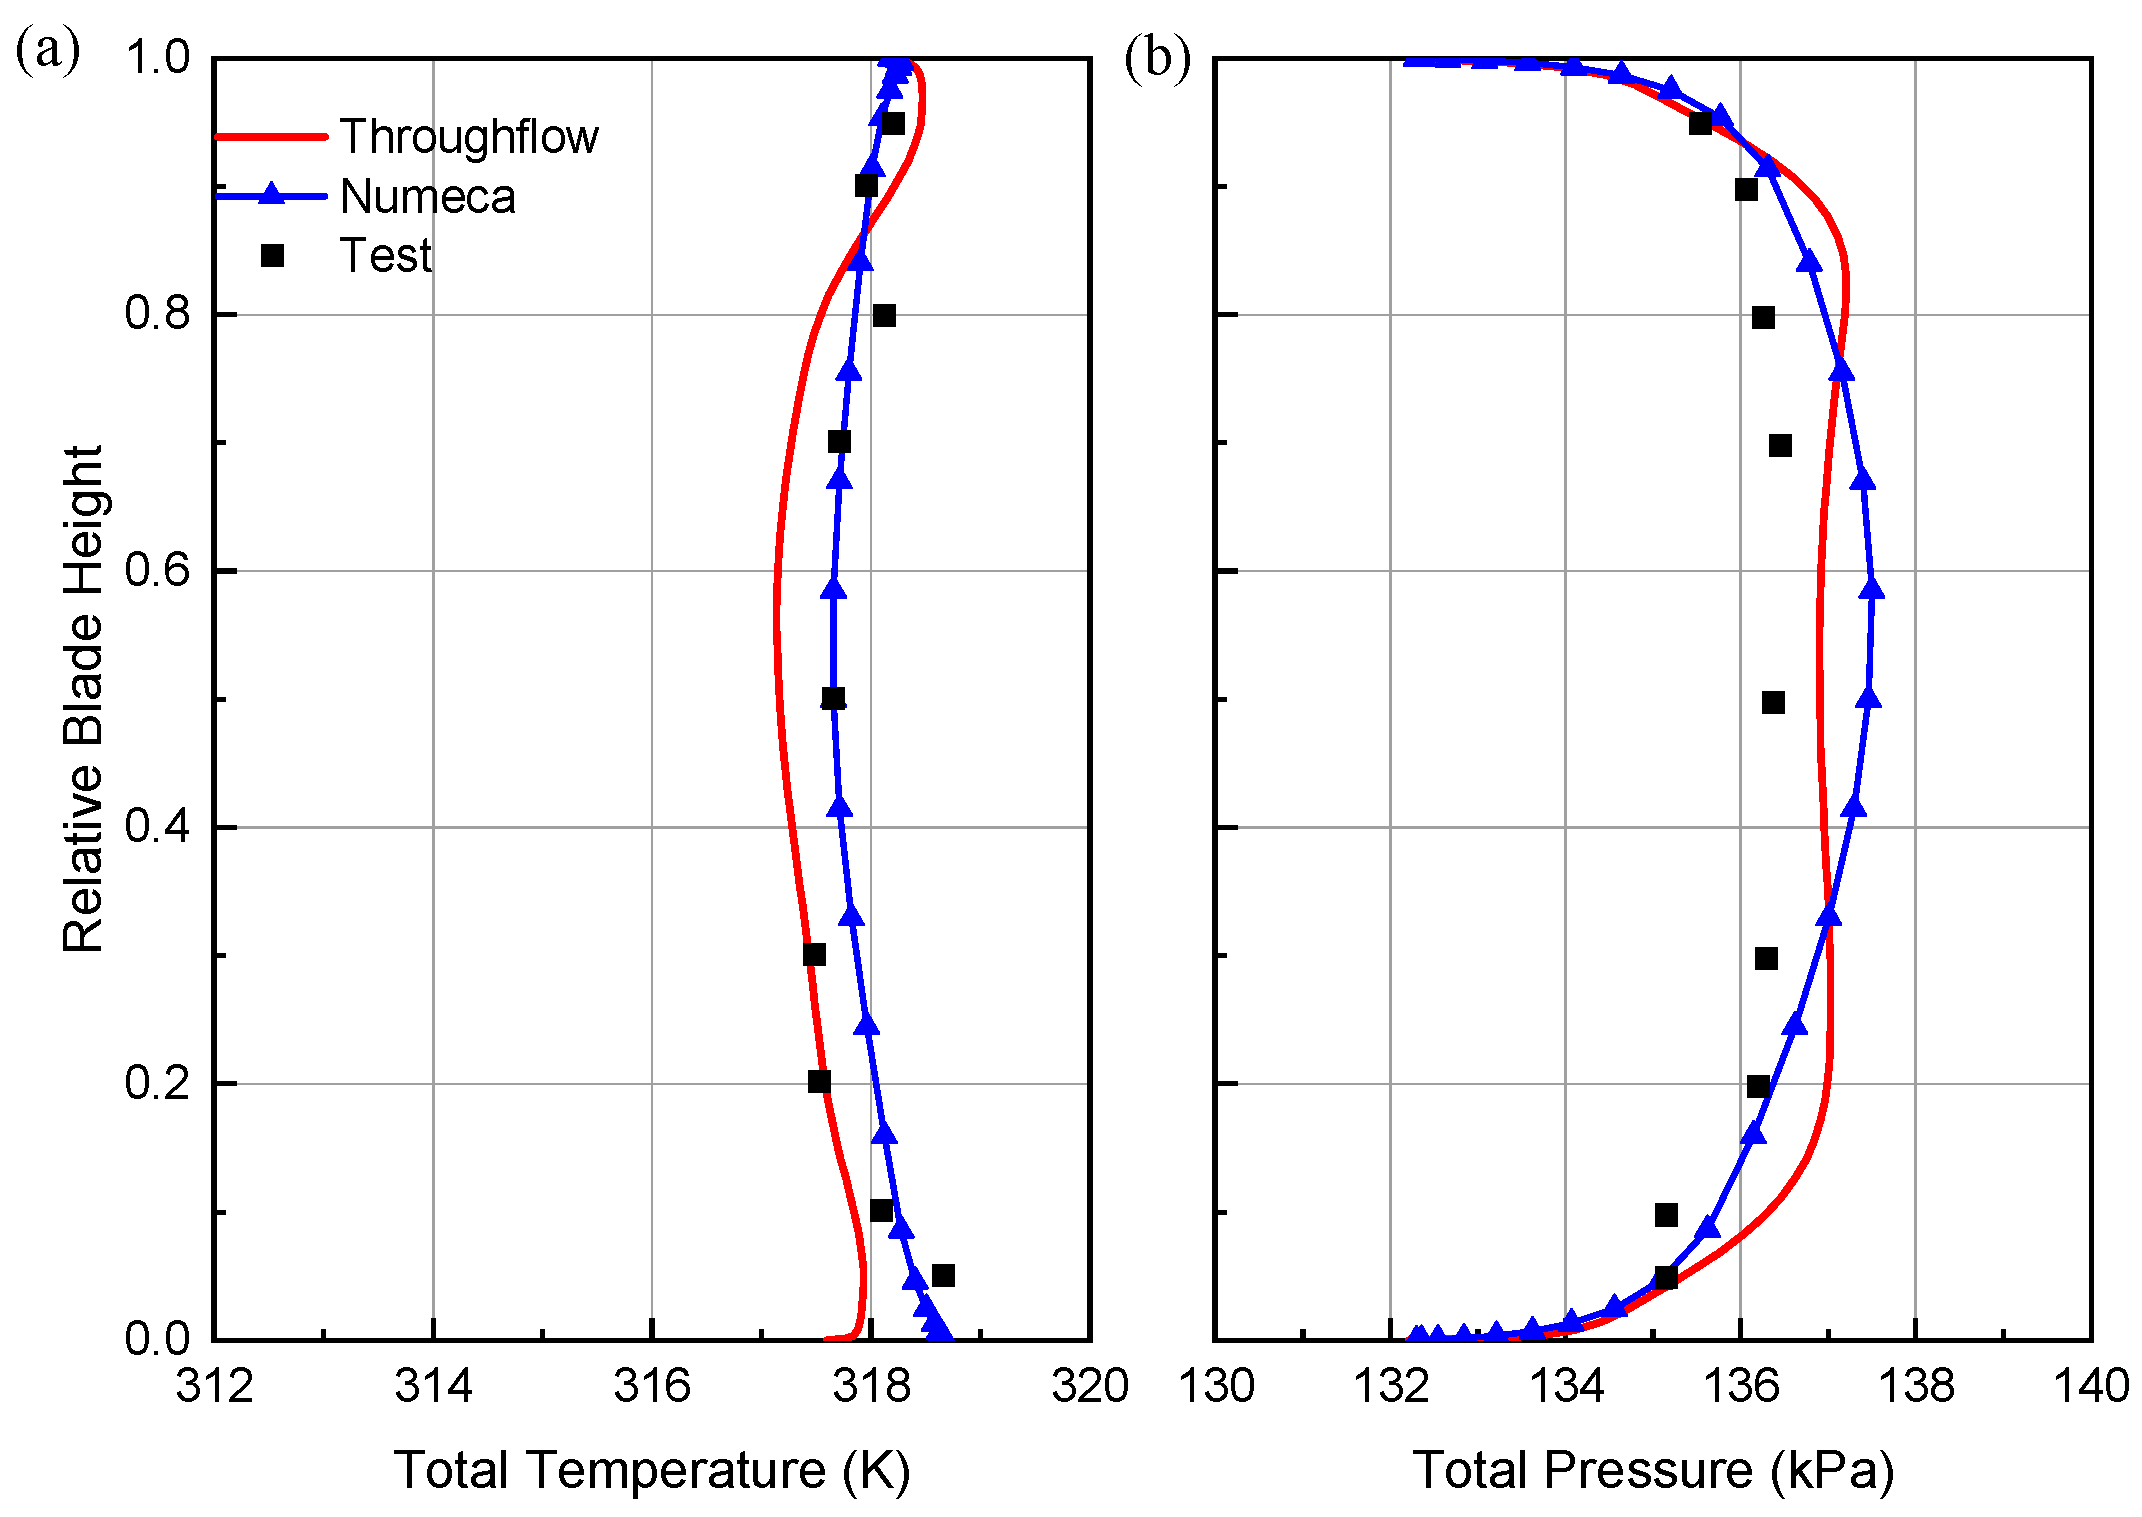
Figure 9.
Performance characteristics of P&W3S1 at different speeds. (a) Total pressure ratio; (b) isentropic efficiency.
Figure 9.
Performance characteristics of P&W3S1 at different speeds. (a) Total pressure ratio; (b) isentropic efficiency.
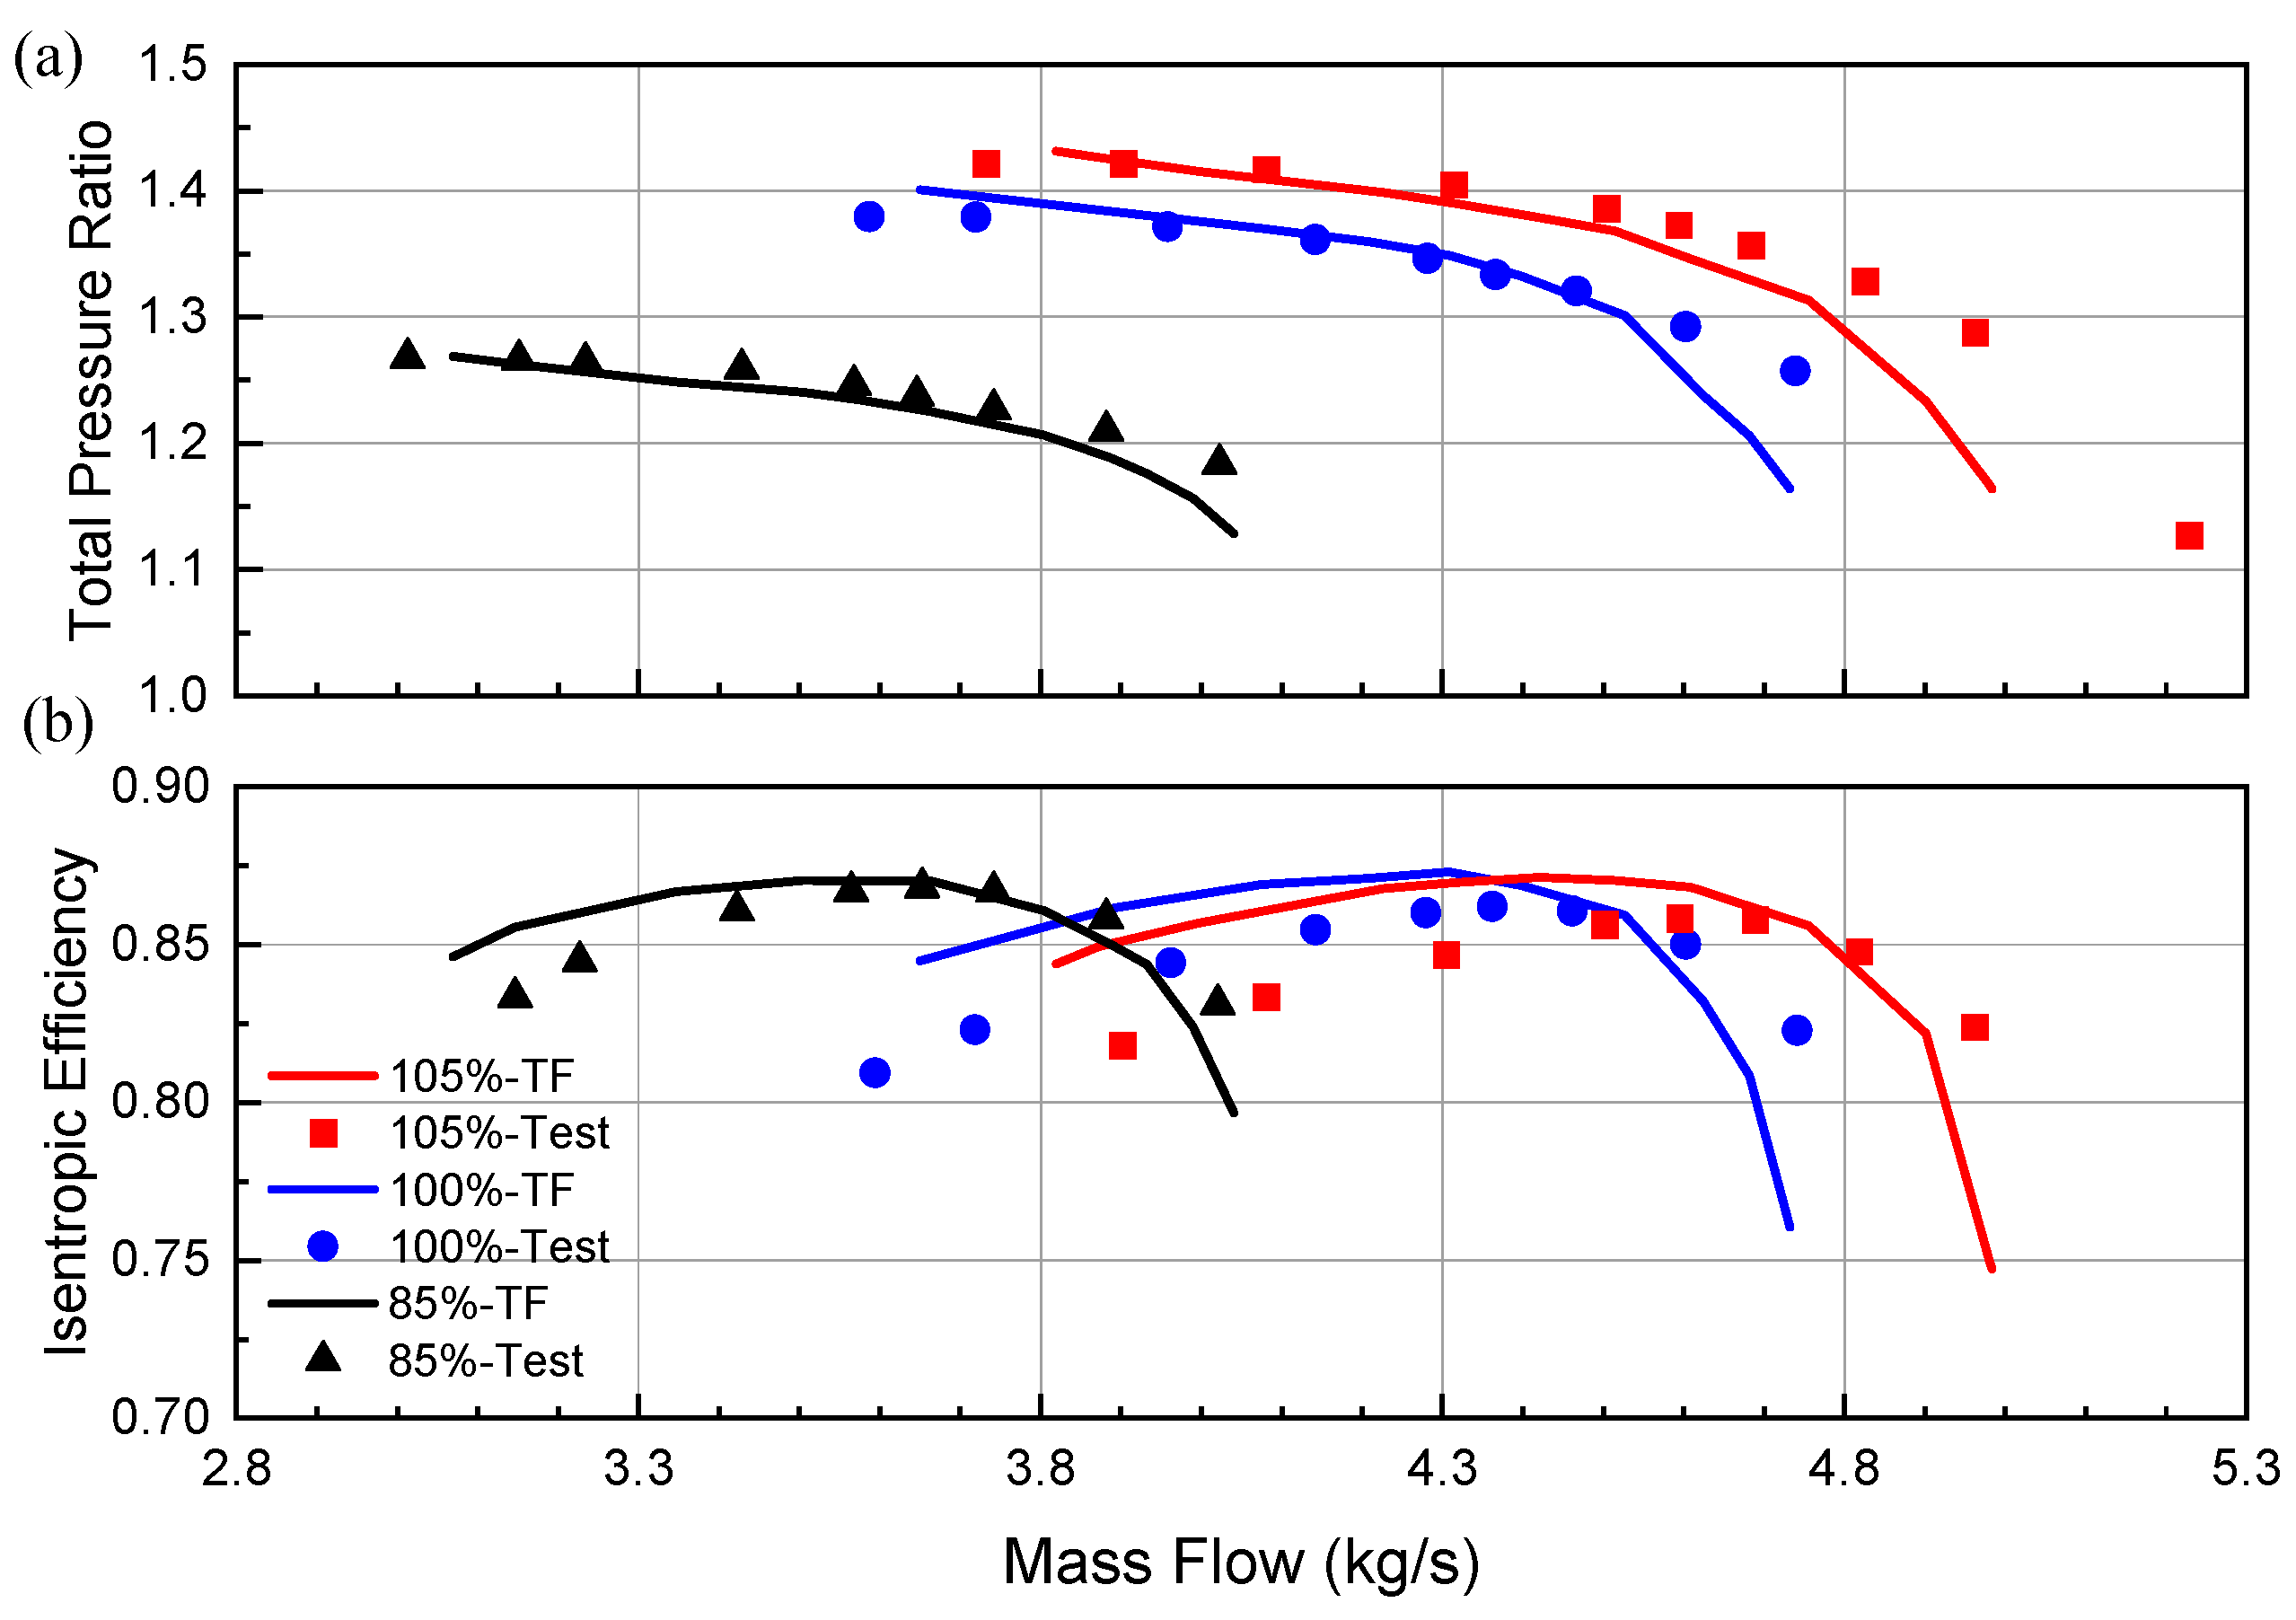
Figure 10.
Computational mesh of GE EEE high-pressure turbine.
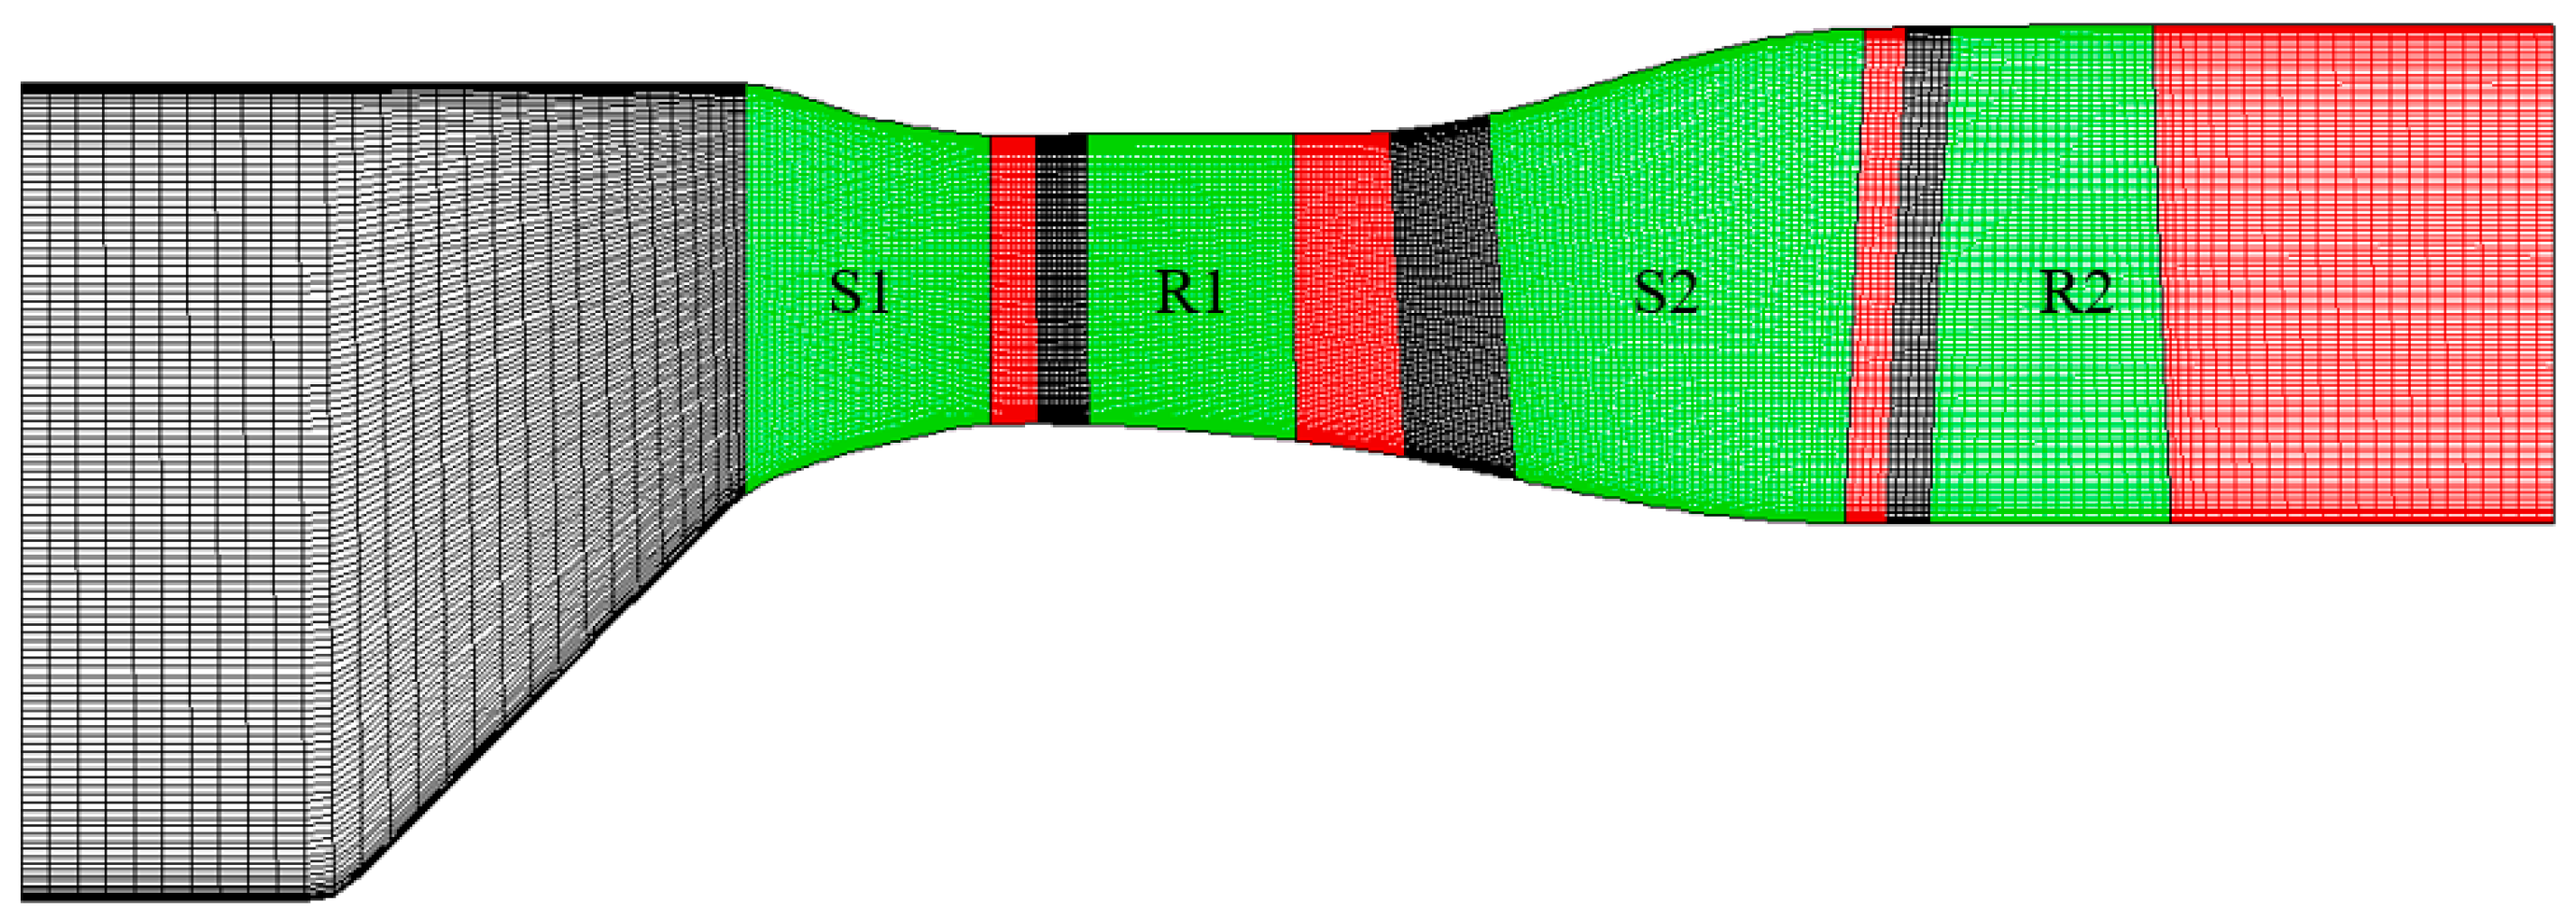
Figure 11.
Expansion ratio varies with the corrected speed.
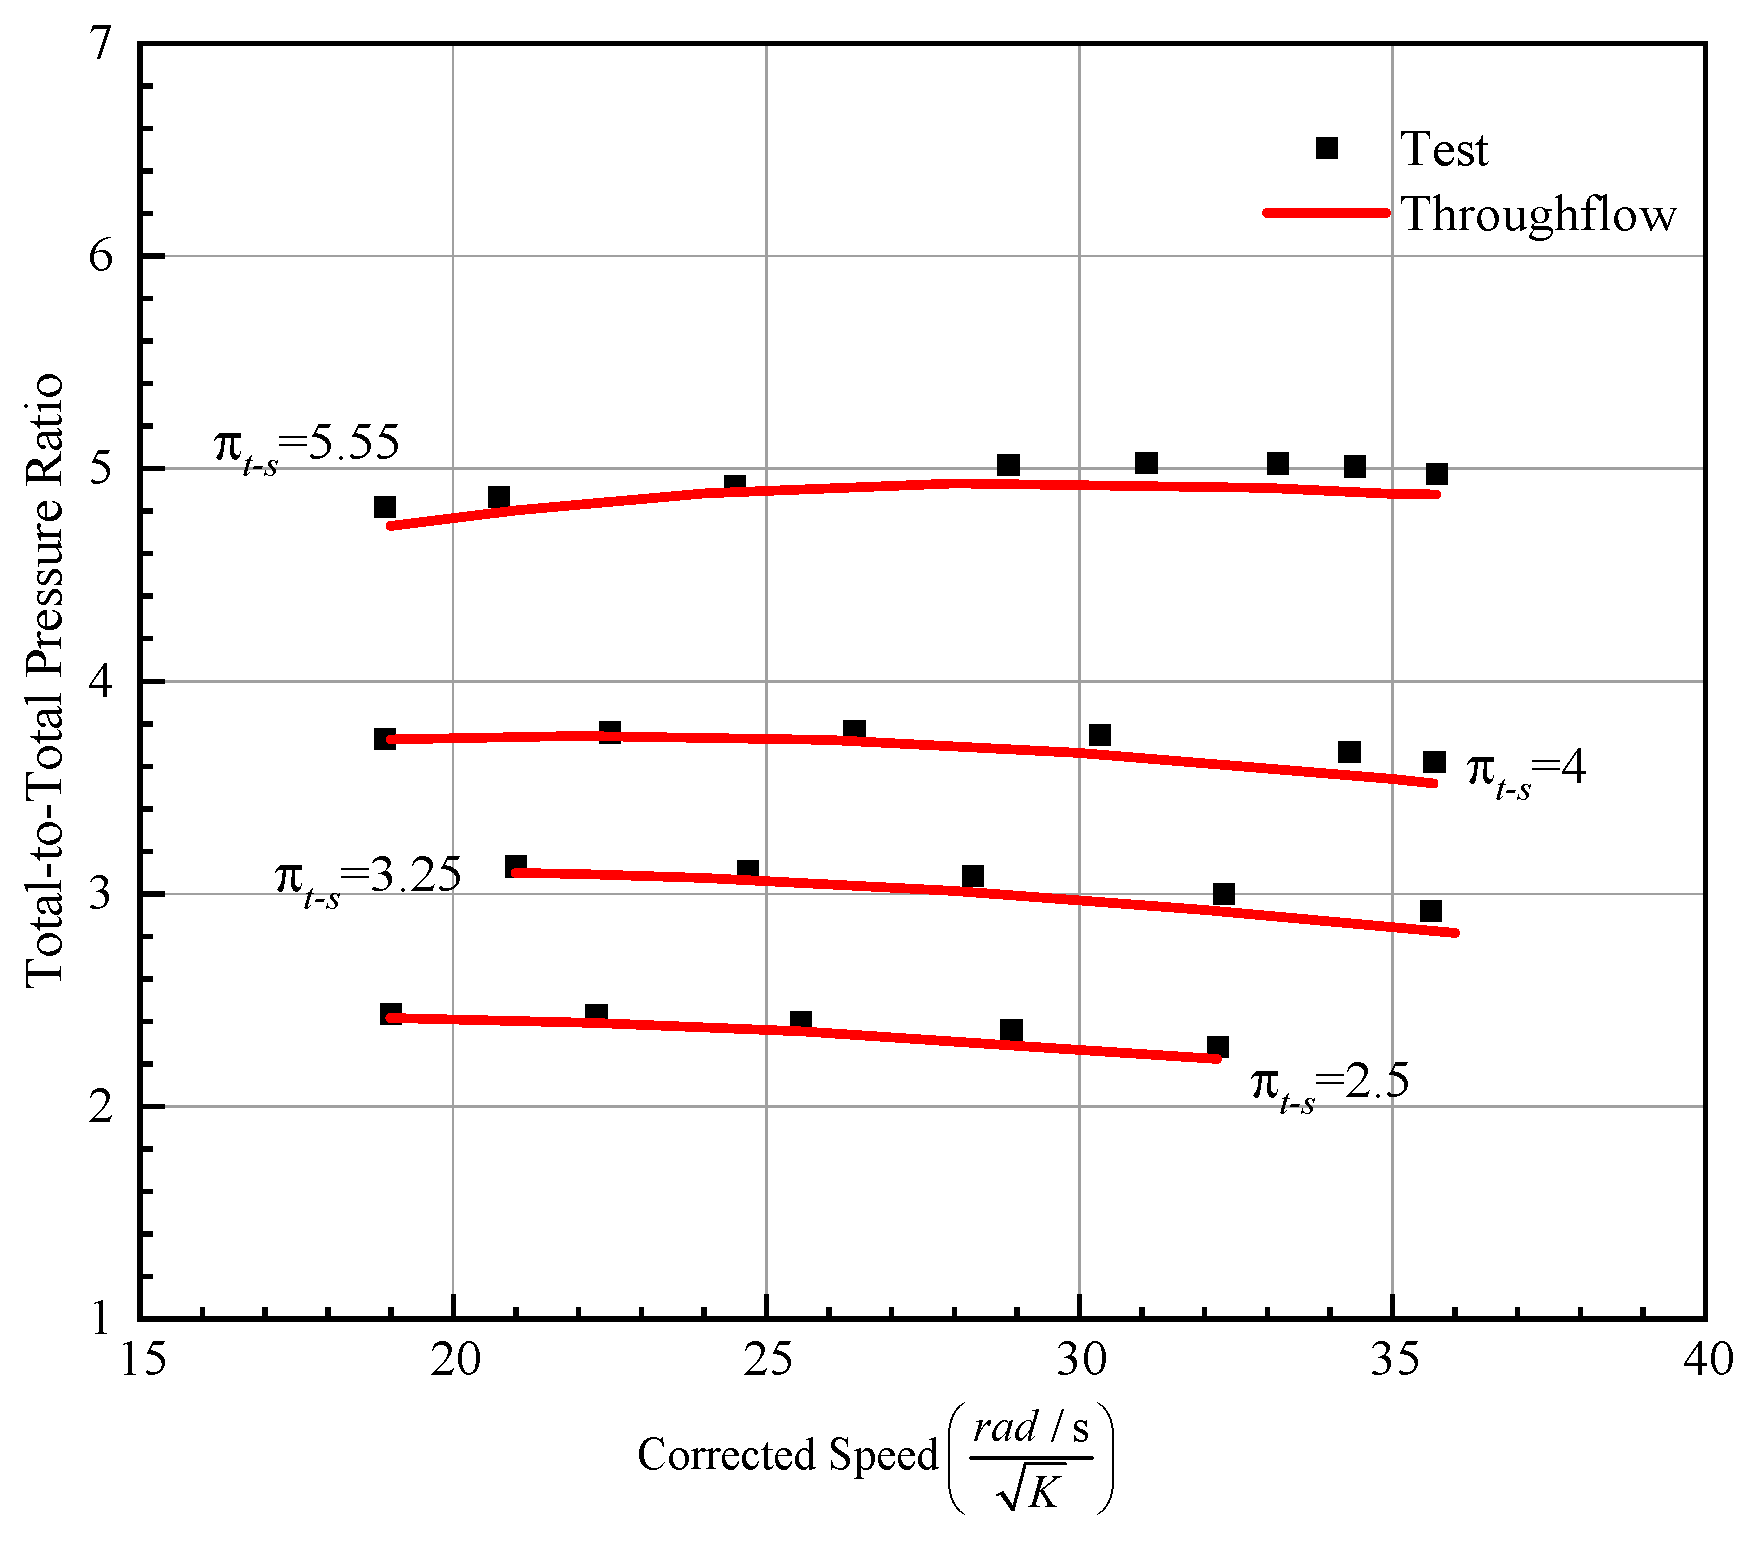
Figure 12.
Comparison of the radial profiles calculated by throughflow and Numeca. (a) Inlet flow angle; (b) outlet flow angle; (c) inlet Mach number and (d) outlet Mach number.
Figure 12.
Comparison of the radial profiles calculated by throughflow and Numeca. (a) Inlet flow angle; (b) outlet flow angle; (c) inlet Mach number and (d) outlet Mach number.
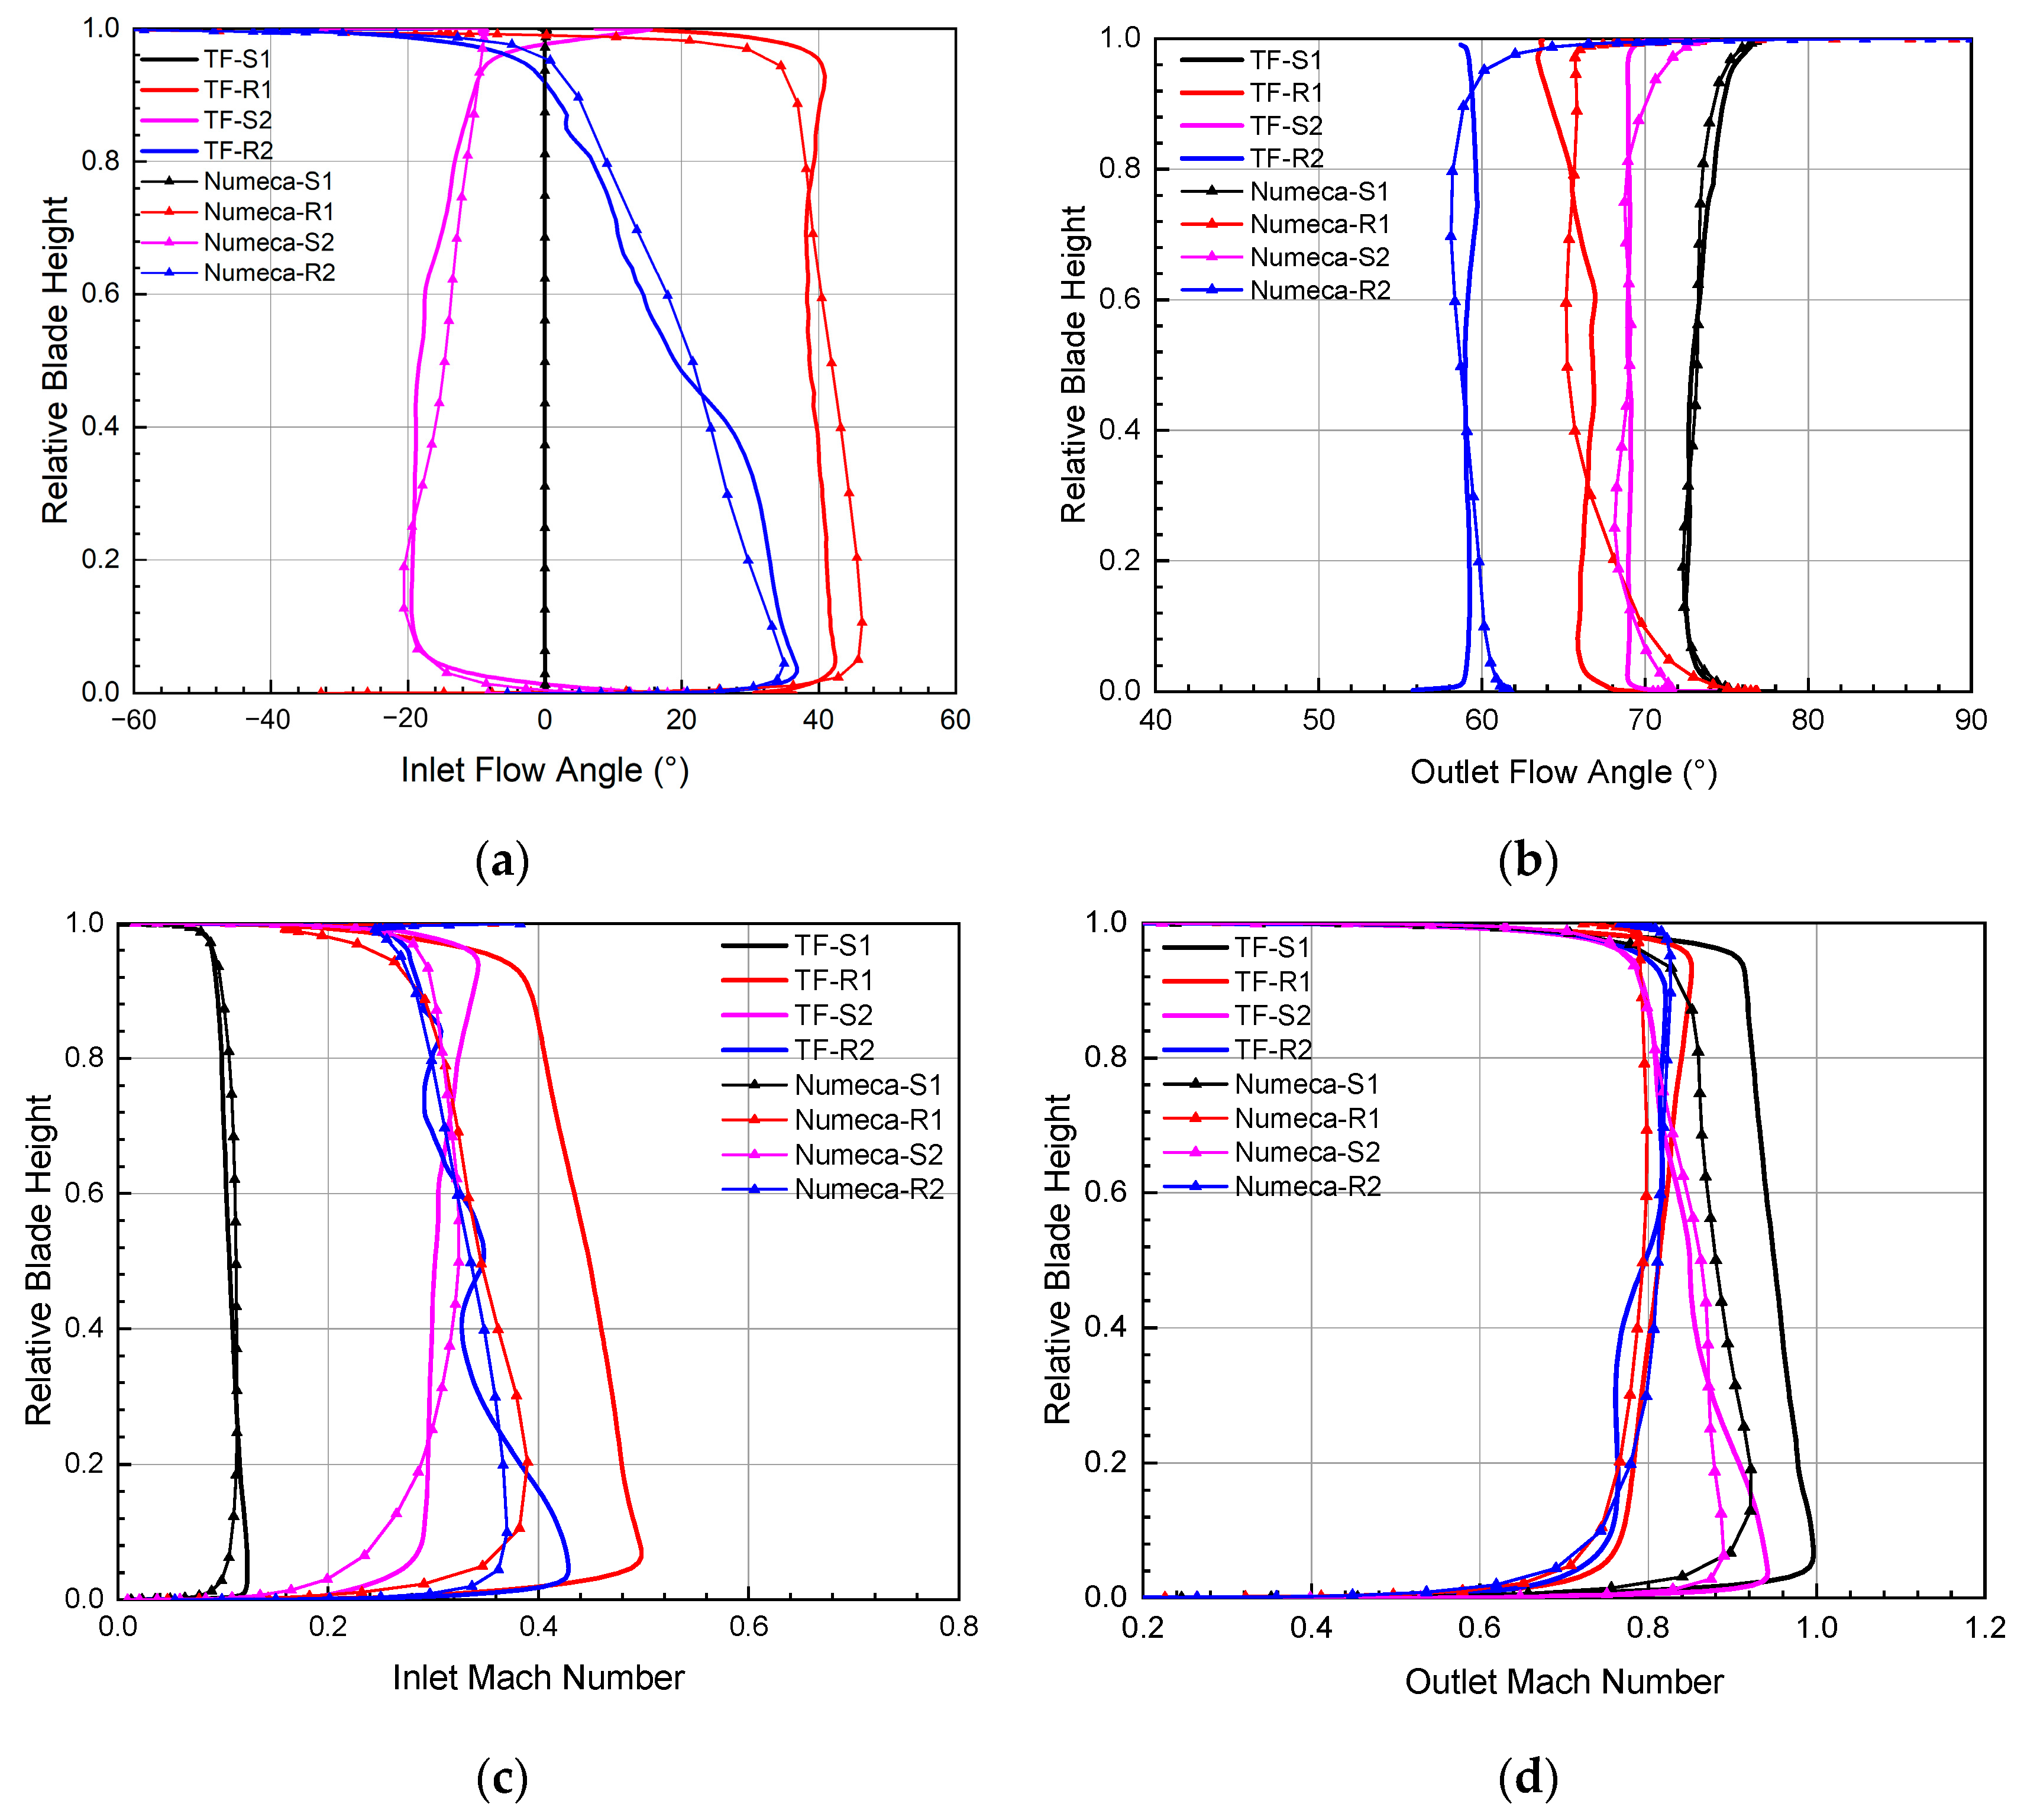
Figure 13.
Radial distribution of (a) total pressure ratio and (b) total temperature ratio at the tur-bine exit plane.
Figure 13.
Radial distribution of (a) total pressure ratio and (b) total temperature ratio at the tur-bine exit plane.
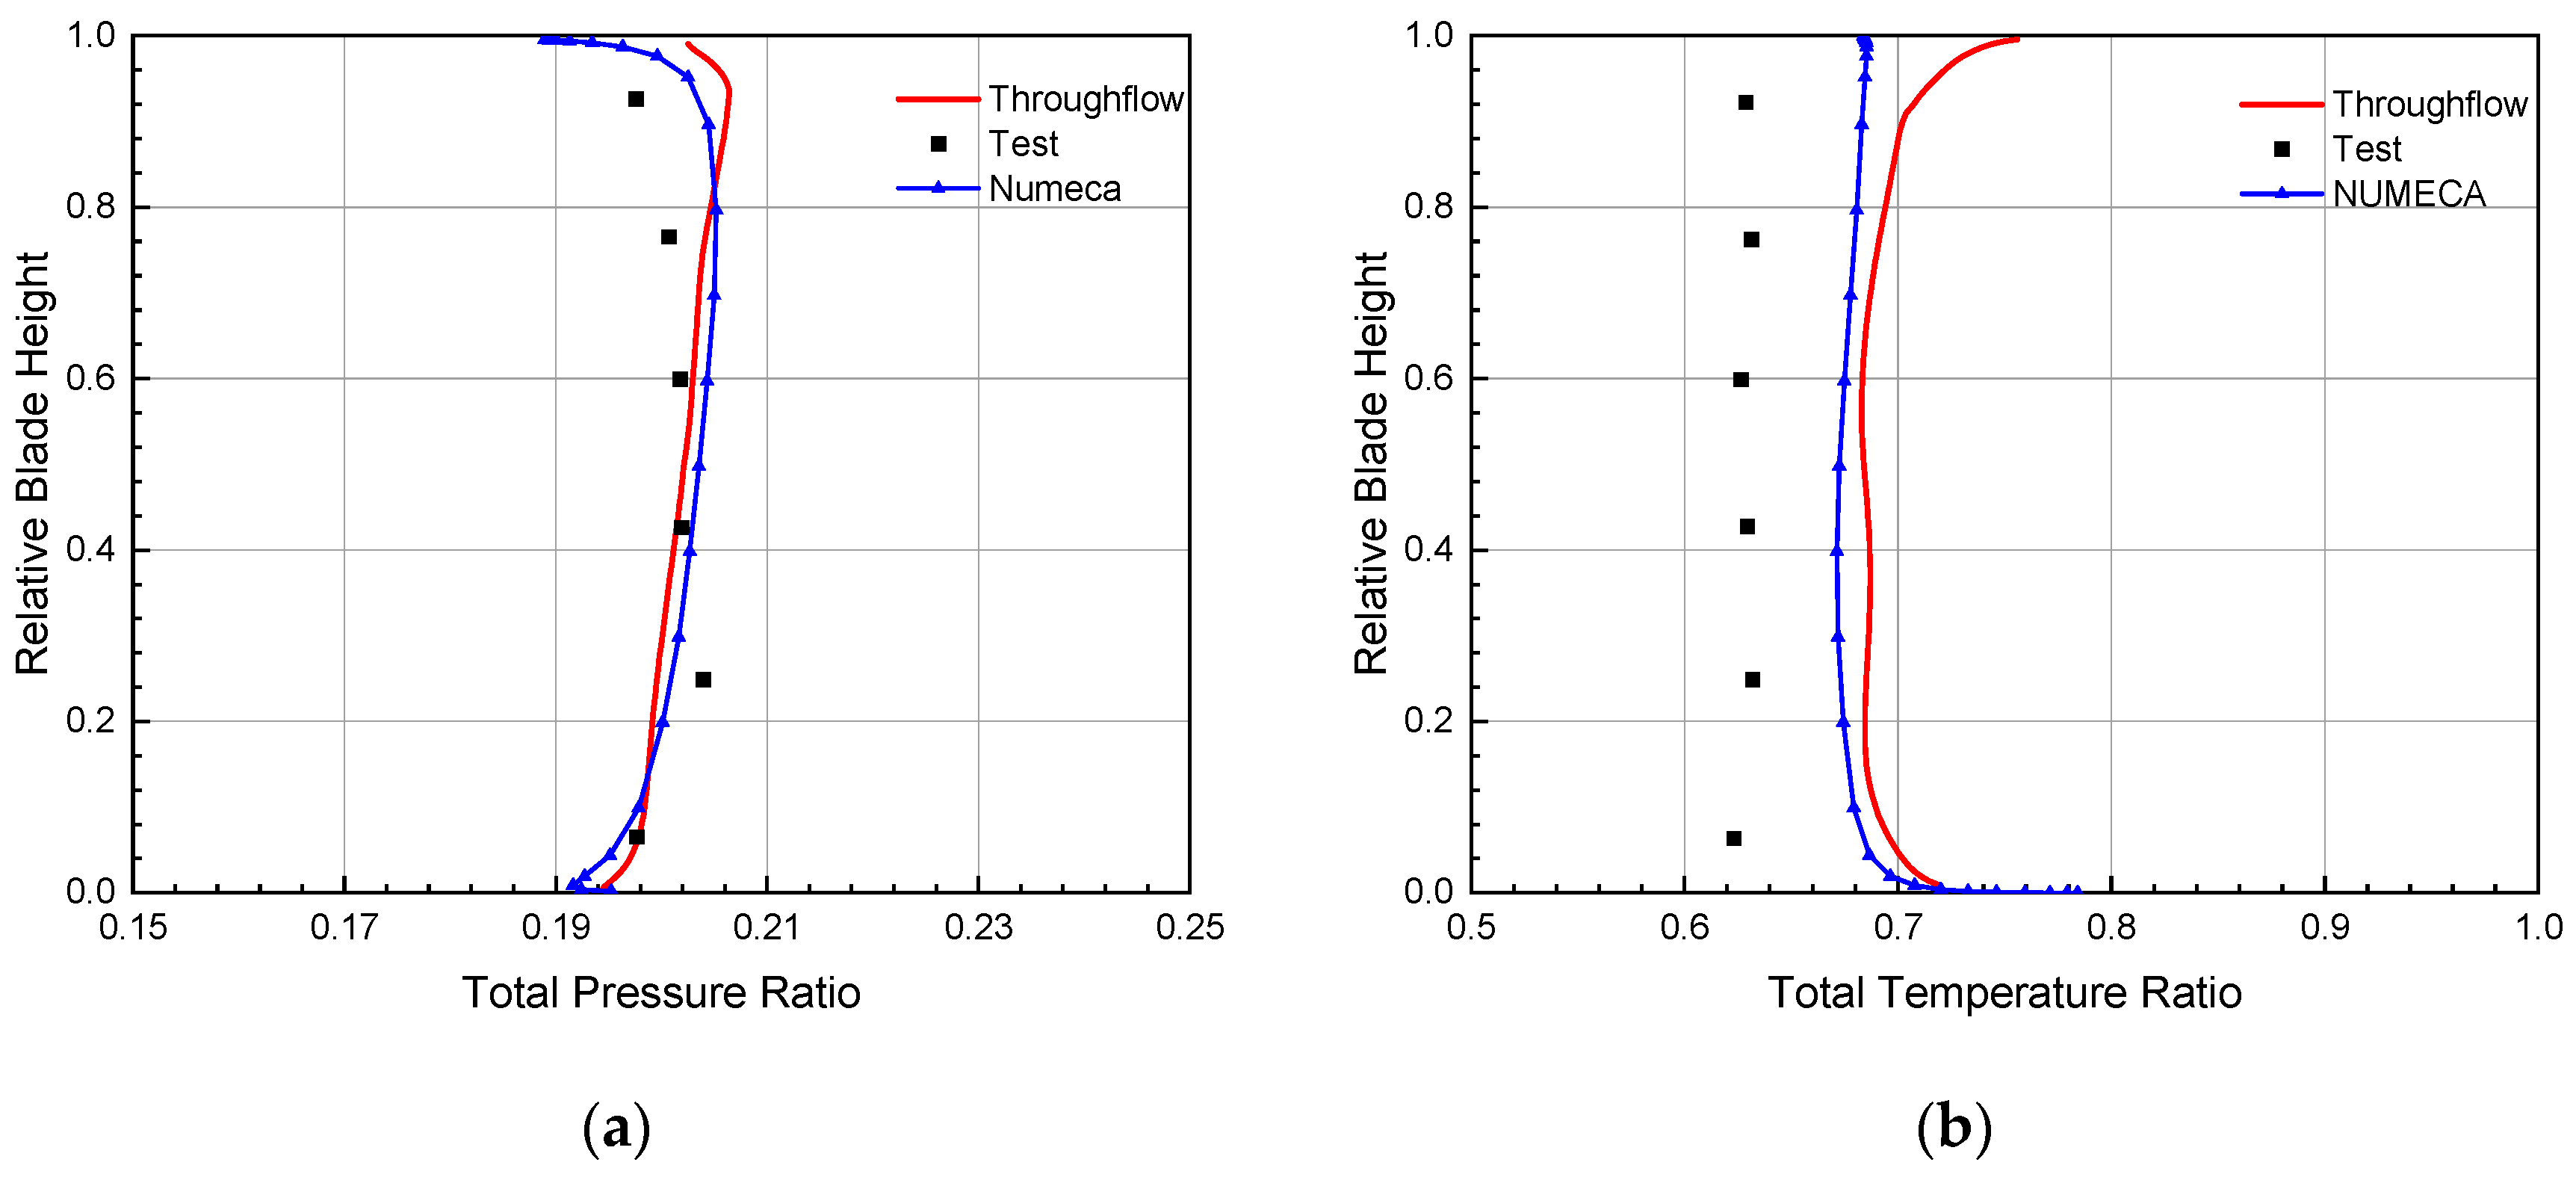
Figure 14.
Computational mesh of the WZ-X engine.
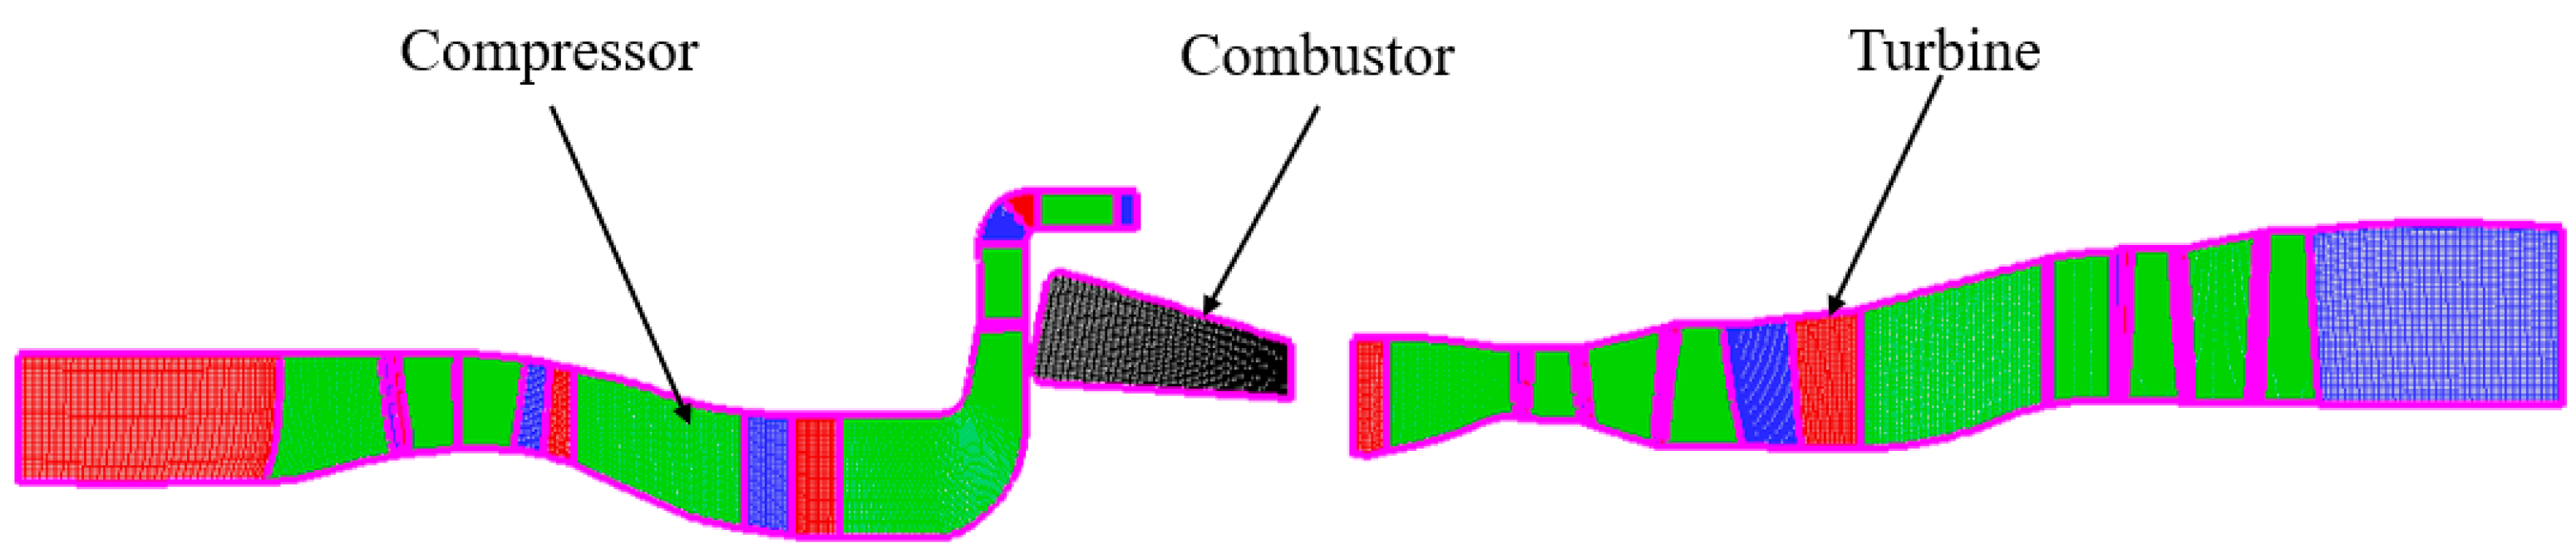
Figure 15.
Convergence history of the whole turboshaft engine simulation for under the maximum power rating. (a) The variation of Z1 and Z2 with iteration times of the whole-engine calculation platform; (b) mass flow of each component in the last time iteration loop.
Figure 15.
Convergence history of the whole turboshaft engine simulation for under the maximum power rating. (a) The variation of Z1 and Z2 with iteration times of the whole-engine calculation platform; (b) mass flow of each component in the last time iteration loop.

Figure 16.
Meridional flow field contours of the WZ-X engine under the maximum power rating. (a) Dimensionless static temperature; (b) dimensionless static temperature; (c) relative Mach number.
Figure 16.
Meridional flow field contours of the WZ-X engine under the maximum power rating. (a) Dimensionless static temperature; (b) dimensionless static temperature; (c) relative Mach number.
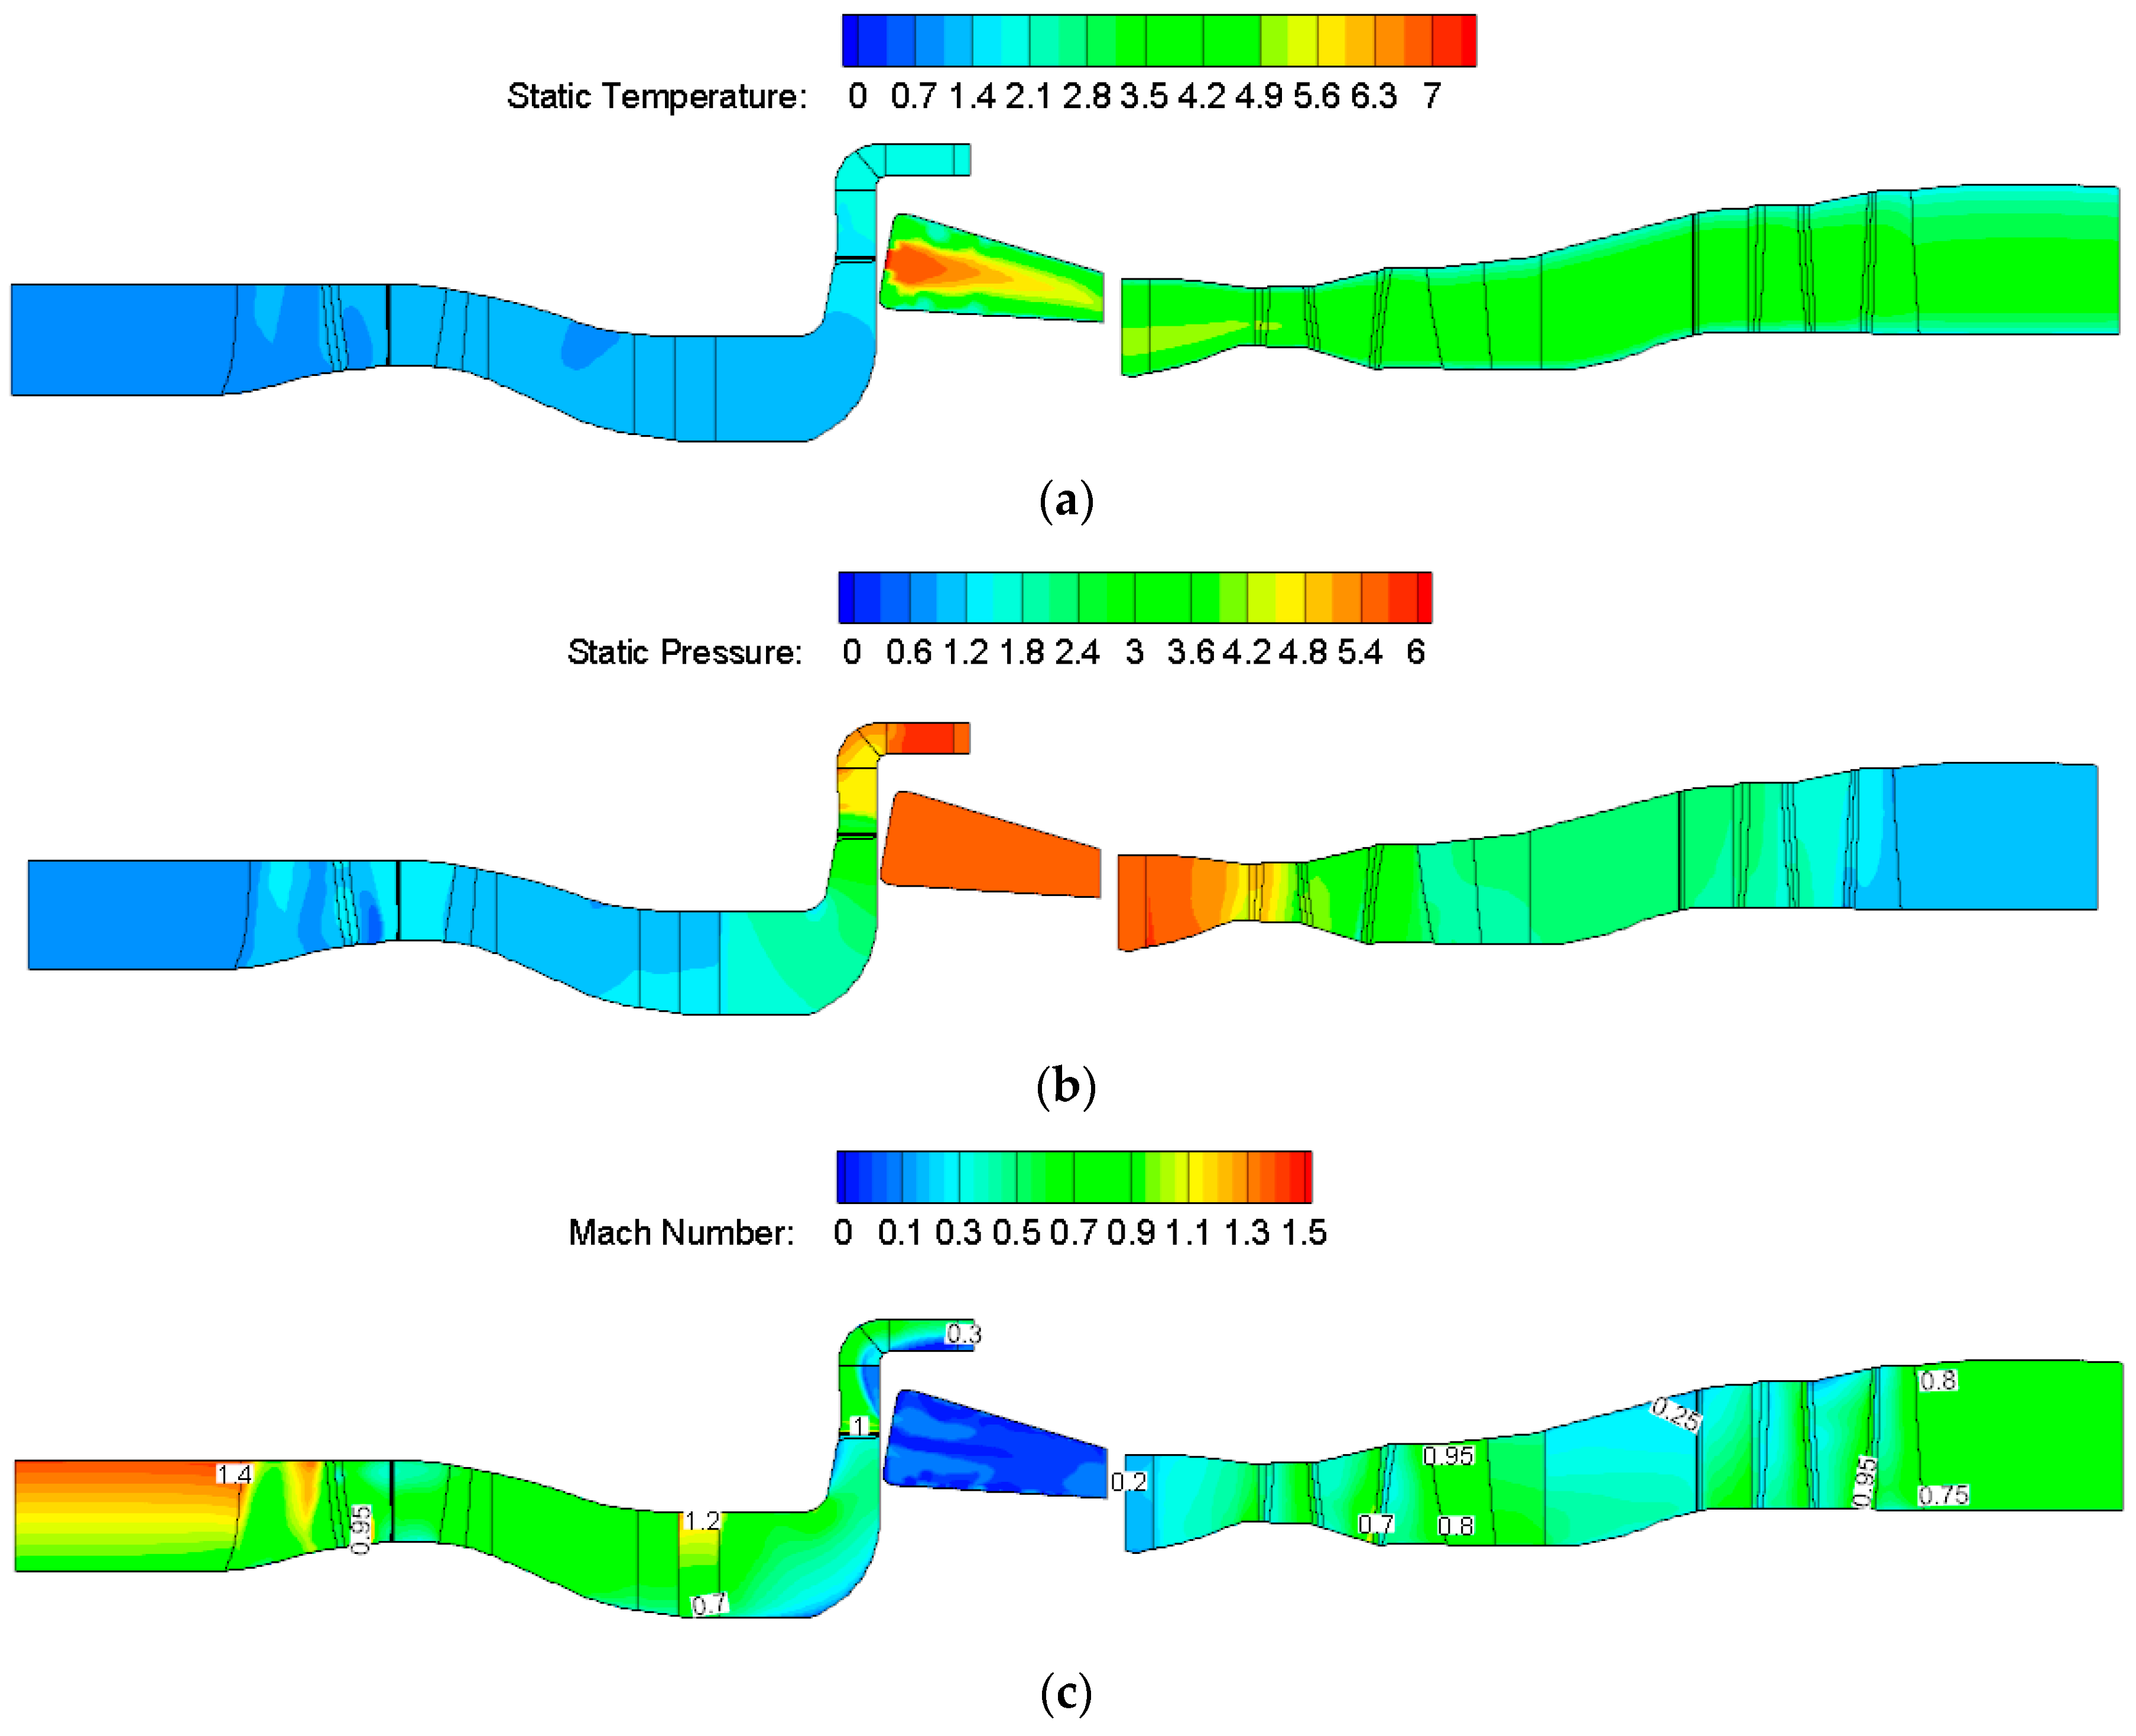
Figure 17.
Comparison of partial throttling characteristics of the WZ-X turboshaft engine. (a) Shaft power delivered; (b) SFC; (c) air mass flow; (d) compressor total pressure ratio.
Figure 17.
Comparison of partial throttling characteristics of the WZ-X turboshaft engine. (a) Shaft power delivered; (b) SFC; (c) air mass flow; (d) compressor total pressure ratio.

Table 1.
Comparison of calculated and tested results at the design condition.
| Parameter | Experiment [46] | Throughflow | Numeca |
|---|---|---|---|
| Mass flow (kg/s) | 4.28 | 4.308 | 4.307 |
| Total pressure ratio | 1.346 | 1.349 | 1.347 |
| Isentropic efficiency | 0.861 | 0.873 | 0.8572 |
| Total temperature ratio | / | 1.102 | 1.1036 |
Table 2.
Comparison of the throughflow and Numeca results.
| Mass Flow (kg/s) | Expansion Ratio | Isentropic Efficiency | |
|---|---|---|---|
| Throughflow | 11.91 | 4.944 | 0.9317 |
| Numeca | 12.01 | 4.938 | 0.9213 |
| Error (%) | 0.8 | 0.2 | 1.16 |
Table 3.
Cell count of WZ-X engine.
| Zone | Cell Count |
|---|---|
| Compressor | 507 × 41 |
| Combustor | 41 × 41 |
| Turbine | 525 × 41 |
Table 4.
Partial throttling characteristic speed setting.
| Working Condition | Engine Speed |
|---|---|
| Maximum emergency | 1.005 |
| Maximum power rating | 1.0 |
| Intermediate emergency | 0.985 |
| Maximum continuous condition | 0.97 |
Disclaimer/Publisher’s Note: The statements, opinions and data contained in all publications are solely those of the individual author(s) and contributor(s) and not of MDPI and/or the editor(s). MDPI and/or the editor(s) disclaim responsibility for any injury to people or property resulting from any ideas, methods, instructions or products referred to in the content. |
© 2024 by the authors. Licensee MDPI, Basel, Switzerland. This article is an open access article distributed under the terms and conditions of the Creative Commons Attribution (CC BY) license (https://creativecommons.org/licenses/by/4.0/).
Share and Cite
MDPI and ACS Style
Zhang, S.; Ma, A.; Zhang, T.; Ge, N.; Huang, X. A Performance Simulation Methodology for a Whole Turboshaft Engine Based on Throughflow Modelling. Energies 2024, 17, 494. https://doi.org/10.3390/en17020494
AMA Style
Zhang S, Ma A, Zhang T, Ge N, Huang X. A Performance Simulation Methodology for a Whole Turboshaft Engine Based on Throughflow Modelling. Energies. 2024; 17(2):494. https://doi.org/10.3390/en17020494
Chicago/Turabian StyleZhang, Shuo, Aotian Ma, Teng Zhang, Ning Ge, and Xing Huang. 2024. "A Performance Simulation Methodology for a Whole Turboshaft Engine Based on Throughflow Modelling" Energies 17, no. 2: 494. https://doi.org/10.3390/en17020494
Note that from the first issue of 2016, this journal uses article numbers instead of page numbers. See further details here.