

Assessing the Additional Benefits of Thailand’s Approaches to Reduce Motor Vehicle Emissions


1
Faculty of Public Health, Thammasat University, Lampang 52190, Thailand
2
Thammasat University Research Unit in Environment, Health and Epidemiology, Lampang 52190, Thailand
*
Author to whom correspondence should be addressed.
Energies 2024, 17(10), 2336; https://doi.org/10.3390/en17102336
Submission received: 17 March 2024
/
Revised: 6 May 2024
/
Accepted: 10 May 2024
/
Published: 12 May 2024
(This article belongs to the Topic Enabling Strategies and Policies toward a Sustainable Environment)
Abstract
:Air pollutants and greenhouse gases (GHGs) represent major challenges in our era, contributing to climate change and global health issues. These problems arise from a variety of well-known sources, including motor vehicles. Almost all nations, Thailand included, have formulated and implemented policies to curb greenhouse gas (GHG) emissions in line with the requirements and commitments of the Paris Agreement. The evaluation of specific air pollutants and GHG emissions originating from road vehicles utilises the Thailand database, referencing the year 2019. Data intersections from 2019 to 2022 are grounded in actual data collected from relevant departments in Thailand, while projections for 2023–2030 are forecasted based on the baseline year. The secondary database used in the International Vehicle Emission model is adjusted according to real-world driving data to accurately reflect country-specific emission factors. Dynamic emission factors for specific air pollutants and GHGs are evaluated and integrated with the average Vehicle Kilometres Travelled (VKT) for each vehicle category. The Business-As-Usual (BAU) scenario is then examined, based on existing policies aimed at reducing air pollutants and GHG emissions in Thailand’s transport sector. These policies include strategies for the adoption of electric vehicles and the promotion of public transport to reduce VKT. Under the BAU scenario, the overall number of road vehicles in Thailand, including passenger cars, motorcycles, pickups, vans, trucks, and buses, is expected to increase by approximately 6.58% by 2030, leading to a rise in specific air pollutants and GHG emissions compared to the 2019 baseline. However, by adhering to Thailand’s strategies and transitioning to new electric passenger cars and buses, greenhouse gas emissions and specific air pollutants from the road transport sector will be significantly reduced.
1. Introduction
Climate change represents the most significant health threat currently facing humanity, and healthcare professionals worldwide are actively addressing the health consequences of this unfolding crisis. The Intergovernmental Panel on Climate Change (IPCC) has conveyed a clear and resolute message: in order to mitigate severe health impacts and avert the potential for millions of climate change-related fatalities, it is imperative for the world to take decisive action to limit the temperature rise to 1.5 °C. Regrettably, historical emissions have already initiated a certain degree of global temperature increase and triggered other climate changes that are now unavoidable. However, it is crucial to recognise that even a global warming of up to 1.5 °C falls short of a safe threshold; every additional tenth of a degree of warming will exact a profound toll on the well-being and lives of people [1,2,3,4]. Furthermore, 930 million individuals, representing approximately 12% of the global population, devote a significant portion of their household budgets, at least 10%, to cover healthcare expenses. Among them, the most economically disadvantaged individuals often lack insurance, leaving them susceptible to unforeseen health-related financial burdens. Consequently, an estimated 100 million people are pushed into poverty annually due to health shocks and stresses. The worrying reality is that the impacts of climate change are worsening this troubling trend, adding to the challenges experienced by these vulnerable communities [5,6,7].
The main driver of climate change is the greenhouse effect caused by greenhouse gas emissions (GHGs). However, it is not just greenhouse gas (GHG) emissions that affect the environment and health; ambient air pollution also poses a significant environmental health challenge, impacting populations across all income levels, from low- to high-income nations [8,9,10,11]. The World Health Organization (WHO) has shed light on the specific health impacts of ambient air pollution. In 2019, it estimated that approximately 37% of premature deaths linked to ambient air pollution were due to ischaemic heart disease and stroke, with chronic obstructive pulmonary disease and acute lower respiratory infections contributing 18% and 23%, respectively, to these deaths. Additionally, 11% of the fatalities were associated with cancer of the respiratory tract. This detailed breakdown illustrates the complex and widespread health risks posed by outdoor air pollution. Moreover, the burden of outdoor air pollution falls disproportionately on those living in low- and middle-income countries, where an alarming 89% of the 4.2 million premature deaths occurred [12,13,14,15,16,17,18,19,20].
The road transport sector, which includes mobile sources, is a major contributor to GHGs, with carbon dioxide (CO2) being the most significant. CO2 plays a key role in worsening climate change and global warming. Alongside CO2, vehicles also emit other GHGs like methane (CH4) and nitrous oxide (N2O), released during the production and transportation of fossil fuels. Additionally, mobile sources are significant emitters of air pollutants, including particulate matter (PM), nitrogen oxides (NOx), carbon monoxide (CO), and sulfur dioxide (SO2) [21,22,23,24,25].
Globally, the road transport sector accounts for roughly 14% (8.1 GtCO2eq) of total GHG emissions and around 20% of CO2 emissions as of 2022. Moreover, GHG emissions from transport experienced the largest reduction compared to the pre-COVID-19 period, decreasing by approximately 14.1% in 2020. However, in 2022, this sector saw a significant rebound, with emissions increasing by 4.7% [26,27]. In Thailand, the nation’s total GHG emissions, excluding those from land use, land-use change, and forestry, amounted to 372,716.86 GgCO2eq. In 2019, Thailand’s primary source of GHG emissions remained the energy sector, contributing 69.96% (260,772.69 GgCO2eq) of the country’s overall GHG emissions. Within this sector, a significant share of emissions originated from fuel combustion, particularly in the energy industries, which accounted for roughly 103,356.15 GgCO2eq (39.63%) of the total. The transport sector was the second largest contributor, representing 76,923.02 GgCO2eq (29.50%) of the energy sector’s total emissions [28].
As previously mentioned, the road transport sector significantly contributes to ambient air pollution in many countries [29,30,31,32,33,34], including Thailand. The main challenge concerning air pollution revolves around the concentration of particulate matter, including particles smaller than 2.5 μm in diameter (PM2.5) and those smaller than 10 μm in diameter (PM10). Emission sources vary across geographic areas, with urban and suburban regions primarily facing air pollution from mobile sources and open burning activities. Notably, open burning is more prevalent during specific periods, particularly before agricultural production cycles, while mobile sources consistently impact air quality throughout the year [35,36,37]. Therefore, the management of mobile emission sources for reducing GHGs and specific air pollutants should be reviewed nationwide.
Updating the mobile source emission inventory with dynamic emission factors is crucial for improving measures to mitigate GHG and air pollutant emissions. Numerous studies have assessed emission inventories using bottom-up, top-down, or combined approaches to develop inventories of air pollutants. Mobile emission sources offer valuable insights into local pollutant emission characteristics, aiding air quality simulations and the development of pollution control measures, as observed in regions such as South America [38], China [39], India [40], and Ecuador [41].
In addressing climate change, Thailand has outlined its nationally determined contribution (NDC) roadmap for 2021–2030. Thailand submitted its second updated NDC in 2022, demonstrating a strong commitment to reducing GHG emissions by 30% compared to the Business-As-Usual (BAU) level by 2030 [28]. The NDC roadmap prioritises the transportation sector, aiming to improve transportation and logistics efficiency, develop low-carbon transport infrastructure, and incorporate sustainable practices to manage transportation demand. This involves not only reducing GHG emissions but also curbing air pollutants [42,43,44]. Therefore, to effectively tackle climate change and air pollution resulting from the rapid growth of urban traffic, it is crucial to evaluate the additional benefits of reducing GHG emissions and air pollutants in the urban transport sector.
Currently, co-benefits are often emphasised in discussions about reducing GHG emissions and promoting human health. The co-benefit analysis approach provides a novel method for quantitatively evaluating and developing comprehensive policies related to regional environmental management and climate change. This approach has increasingly become an essential policy tool for promoting sustainable development in the modern era [45,46,47,48,49,50,51].
In the coming years, as urbanisation accelerates, achieving sustainable transportation development has become a crucial objective in global urban infrastructure planning. Several studies have evaluated the co-benefits of reducing GHG and air pollutant emissions in the transportation sector, from the national and regional levels down to the city level, in the pursuit of sustainable development goals [46,52,53]. Kim et al. (2020) conducted a comprehensive investigation, merging an air quality model, economic model, and health assessment model to assess the health-related advantages of climate change mitigation across various scenarios in South Korea [47]. Wei et al. (2020) assessed the potential co-benefits of air pollution control and climate mitigation policies within China’s electricity sector [50]. In a separate study, Jiao et al. (2020) examined the impact of energy-related measures outlined in the action plan on emissions of major air pollutants and CO2 within the urban transport sector, focusing on the case of Guangzhou [46].
In Thailand, measures of specific air pollutants and GHGs have been implemented to improve air quality in line with established regulations and to meet the commitments made under the Paris Agreement to combat climate change. It is important to note that the sources of emissions for both GHGs and specific air pollutants are often the same. Therefore, it is essential to implement management strategies concurrently, leveraging co-benefits from mitigation measures to improve air quality and reduce the impacts of climate change simultaneously.
Consequently, this study aims to update and evaluate the dynamic emission factors of both GHGs, such as CO2, N2O, and CH4, as well as specific air pollutants, including CO, VOC, VOCevap, NOx, SO2, and PM10 from mobile sources using a vehicle emission model. Subsequently, the study examines the emission inventory of each vehicle type by linking the emission factors (g/km) to the annual average vehicle kilometre travel (km/year). Additionally, emissions are modelled for each scenario to evaluate the impact of various measures outlined in the policies. The contributions of different measures within the policies to the co-benefits are further quantified, aiding in the identification of measures with significant potential for reducing emissions of GHGs and specific air pollutants in Thailand.
2. Materials and Methods
To explore efficient tactics for diminishing GHG and specific air pollutant emissions within the urban transportation sector, a vehicle emission model has been formulated as a valuable instrument for conducting assessments of vehicle emission inventories in diverse developing Asian urban areas, such as Hanoi, Vietnam [54]; Bandung, Indonesia [55]; alongside cities in Ecuador [38,56] and India [57].
2.1. Vehicle Emission Model
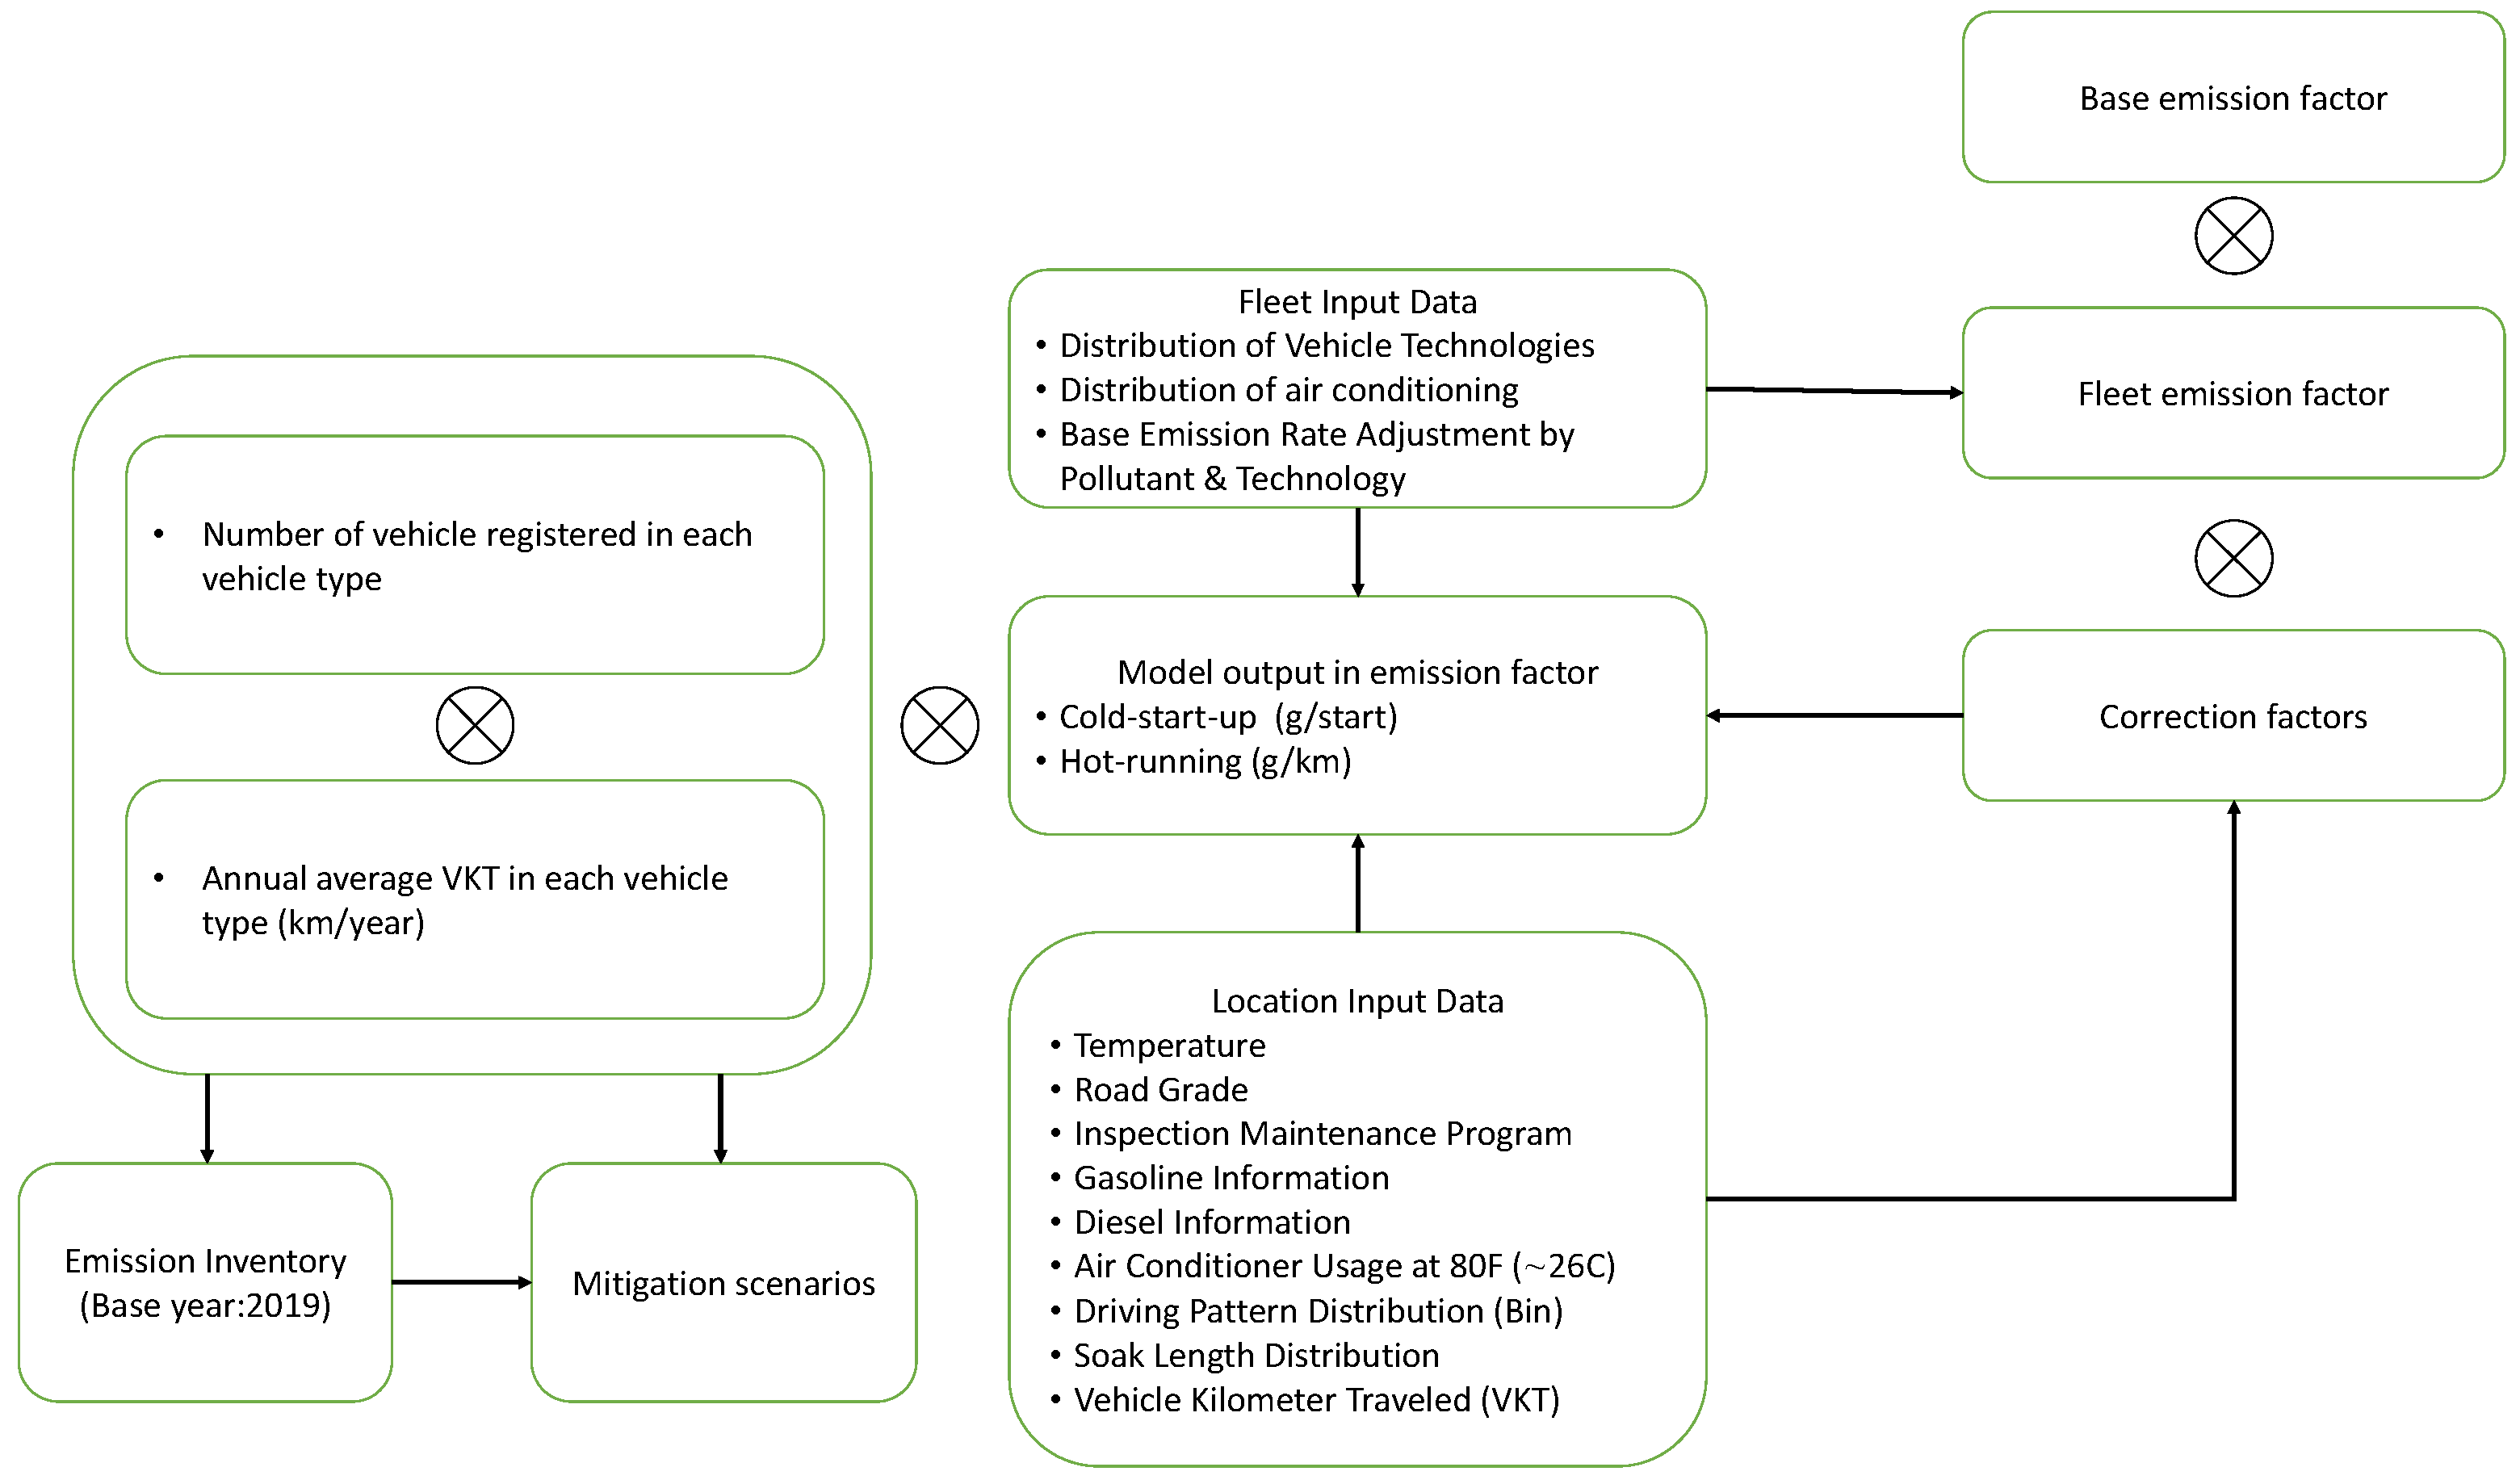
The research utilised the International Vehicle Emissions (IVE) Model version 2.0 to compile an inventory of emissions estimated from mobile sources in Thailand, using 2019 as the base year. Figure 1 illustrates the overarching methodology employed to assess emissions through the IVE model in the study. To accurately compile inventories of emissions from mobile sources, three key elements are essential: vehicle emission rates, vehicle usage patterns, and the distribution of the vehicle fleet. The IVE model is specifically designed to utilise readily available local data and relevant existing information to quantify these crucial inputs.
The IVE model employs a method to estimate emissions by multiplying the base emission rate for each technology with correction factors adjusted for specific vehicle technologies. These correction factors, defined for each vehicle type, are then multiplied by the amount of vehicle travel associated with each technology, resulting in the total emitted emissions. Equation (1) within the model illustrates the internal calculation process for determining the adjusted emission rate. Equations (2) and (3) further explain the process by multiplying the base emission rate (B) with a series of correction factors (K) to estimate the adjusted emission rate (Q) for each vehicle type. Furthermore, the correction factors can be grouped into distinct categories, encompassing location-related variables (such as ambient temperature, humidity, altitude, inspection or maintenance programmes, and base emission adjustments), fuel quality, and power- and driving-related variables (including vehicle specific power or VSP, road grade, air conditioning usage, and start distribution) [58,59].
where
Q(hot/cold)(t) = the emission factor for each vehicle type and technology, either for hot-running conditions in grams per kilometre (g/km) or cold-start conditions in grams per start;
B(hot/cold)(t) = the base emission factor for each vehicle type and technology t, (hot-running in g/km or cold-start in g/start);
K(1,2,…n), t = a set of correction factors specific to each vehicle type and technology t;
ft = the fraction of travel attributed to a particular technology;
f(dt) = the fraction of time associated with different types of driving or the proportion of soaks attributed to a specific technology;
UDC = the average velocity of the test procedure driving cycle, maintained as a constant value in kilometres per hour (km/h);
UC = the average velocity derived from the specific driving cycle, as input by the user within the location file, expressed in kilometres per hour (km/h).
Creating input data for the IVE model entails producing the location file, fleet file, and base adjustments file, all pivotal elements for assessing emissions. Guaranteeing precise emissions estimation within a designated area necessitates compiling accurate data pertaining to driving habits and local environmental circumstances. Subsequently, these gathered data are input into the IVE location file, which contains particulars regarding the driving behaviours prevalent in the region. This encompasses variables like the frequency and manner of driving, incorporating details about speed and acceleration profiles.
The driving behaviours within the IVE model are elucidated through the characterisation of VSP and engine stress parameters. These parameters are derived from fundamental vehicle type information and a comprehensive velocity trace recorded on a per-second basis. VSP is determined based on the velocity and acceleration data recorded instantaneously. Engine stress, in tandem with VSP, plays a crucial role in enhancing the accuracy of emission estimates for pollutants such as CO, NOx, and HC. Research indicates that engine stress demonstrates the strongest correlation with vehicle power load demands over the previous 20 s of operation, implying a close relationship with the inferred engine RPM [38,60]. Equations (4) and (5) then outline a method for estimating VSP and engine stress, providing a systematic approach to quantify these pivotal parameters [58].
where
grade = (ht=0 − ht=−1)/v(t=−1 to 0 s);
v = velocity (m/s);
a = acceleration (m/s2);
h = altitude (m).
where
Preaverage Power = Average (VSPt=−5 s to −25 s) (kW/ton);
RPMIndex = Velocityt=0/SpeedDivider (unitless);
Minimum RPMIndex = 0.9.
Figure 1.
Scope of the study (adapted from [61]).
Figure 1.
Scope of the study (adapted from [61]).
Stress levels are classified into three categories—low, medium, and high—while VSP is divided into 20 categories, resulting in a total of 60 bins that incorporate both VSP and stress. Low engine stress typically characterises scenarios where the vehicle has experienced low speeds and accelerations in the preceding 20 s of operation, resulting in a low engine RPM. Conversely, high engine stress occurs during periods of high speeds and accelerations in the most recent 20 s, coinciding with a high engine RPM [59,60].
Moreover, the location file logs commencement patterns, requiring information on the frequency of vehicle starts and the duration of engine idle periods prior to restarts. It also meticulously documents essential environmental factors such as altitude, road gradient, and temperature. Finally, it considers fuel attributes like quality and the levels of pollutants and additives. These precise data form the foundation for accurately assessing emissions within the chosen geographical region.
The fleet file serves as a repository for the proportion of vehicle travel associated with each technology. In the IVE model, there are a total of 1372 predefined technologies, supplemented by an additional 45 undefined technologies. These technologies are systematically classified based on diverse parameters, including vehicle size (including trucks), fuel type, vehicle application, fuel supply system, evaporative control system, and exhaust control system/standards. For this study, 71 technologies of specific vehicle types were selected for estimating emission factors.
Furthermore, the IVE model employs base emission rates for both hot-running and cold-start emissions associated with each vehicle technology integrated into the model. These base emissions are determined through dynamometer testing conducted under specific cycles and standard conditions. Most of the current data used to establish these base emission factors originate from research conducted in the United States. Consequently, the base emission rates are modified using vehicle emissions data obtained under the Bangkok driving patterns or driving cycles (345BKKDV) in this study.
Ultimately, the emission factors for conventional air pollutants and GHGs are evaluated, and the emission inventory is calculated based on the vehicle kilometres travelled (VKT) per year and the number of registered vehicles for each specific vehicle type.
2.2. Data Collection
2.2.1. Vehicle Technology and Fuel Type
Improving air quality and protecting public health requires regulating emission sources through the enforcement of emission standards, including those for mobile sources. In Thailand, vehicle emission standards align with European standards and testing procedures. The Euro emission standard includes regulations that govern vehicle emissions for new vehicles in the European Union.
Introduced with the Euro 1 emission standard taking effect in 1992 in Europe [61,62], Thailand adopted the Euro 1, 2, and 3 emission standards in 1998, 2001, and 2005, progressively raising these standards over the years to enforce the Euro 4 standard since 2012 [35,61,62,63]. These mobile source regulations are complemented by public awareness campaigns promoting the use of public transport and vehicles powered by alternative fuels, such as natural gas and electricity. Additionally, the introduction of the Euro 5 and Euro 6 standards is poised to further enhance emissions control by targeting reductions in nitrogen oxide and hydrocarbon emissions, while also introducing a particulate number standard [64]. Furthermore, Thailand implemented the Euro 5 fuel standard in January 2024 [65].
Additional vehicle data were obtained from the Transportation Statistics Group, Planning Division, Department of Land Transport [66]. Engine technology and emission control for each vehicle type in Thailand are determined based on their specific technological specifications and adherence to emission standards. Passenger cars, vans, and pickups use Euro 1–4 engine standards, equipped with three-way catalysts but lacking exhaust gas recirculation (EGR) technology, while buses and trucks employ EGR technology.
Fuel injection (FI) and multi-point fuel injection (MPFI) technologies are utilised for air and fuel control across all vehicle types except motorcycles, which may feature four-cycle engines. Additionally, gasoline, diesel, natural gas for vehicles (NGV), and liquefied petroleum gas (LPG) fuels are used in all vehicle types except motorcycles, which exclusively use gasoline. In 2019, gasoline was the primary fuel type used in vehicles (61%), followed by diesel (29%), LPG (7%), compressed natural gas (CNG) (2%), and hybrid (1%).
2.2.2. Number of Vehicles and Mobility in Thailand
Thailand has experienced a significant increase in its vehicle population in recent years, reflecting the country’s rapid urbanisation and economic growth. Official statistics from the Thai Ministry of Transport reveal that the number of registered vehicles in Thailand has steadily risen over the past decade. This growth includes various vehicle types, with motorcycles making up the largest share, followed by passenger cars, pickups, trucks, vans, and buses [66].
The increase in vehicle ownership has been linked to the significant impact of economic growth on vehicle ownership trends, characterised by two main patterns. Firstly, with rising income levels, there is a general increase in private vehicle ownership, indicative of improved affordability and accessibility. Secondly, once individuals reach a certain level of personal income, there is often a shift from motorcycle ownership to private car ownership [67,68,69].
The annual breakdown of registered motor vehicle types in Thailand from 2018 to 2021 shows that motorcycles made up the largest proportion (52.25–53.89%), followed by passenger cars (25.36–26.77%), pickups (16.72–17.21%), trucks (2.03–2.89%), vans (1.05–1.07%), and buses (0.31–0.42%). Consequently, the investigation focuses on assessing vehicle emissions for motorcycles, passenger cars, pickups, trucks, vans, and buses. Additionally, there was a consistent increase in the total number of registered vehicles in Thailand from 2008 to 2022.
2.2.3. Vehicle Kilometres Travelled (VKT) Calculation
The data on VKT across various vehicle categories in Thailand have been estimated through comprehensive literature reviews and information from the Pollution Control Department (PCD) database. Estimating emissions from mobile sources in Thailand requires considering the VKT of each vehicle, measured in kilometres per year. This calculation incorporates emission factors derived from model outputs specific to each vehicle type, along with the annual count of registered vehicles.
Furthermore, for the input data required for the vehicle emission model, vehicles are grouped into three categories based on their mileage: up to 79,000 km, 80,000–161,000 km, and over 161,000 km. This classification applies to various vehicle types, including passenger cars, vans, pickups, buses, and trucks. Similarly, motorcycles are segmented into three categories based on their annual VKT: up to 25,000 km, 25,000–50,000 km, and over 50,000 km. Additionally, the size of all vehicles is determined by their gross weight and engine capacity, which are classified into small, medium, and large groups according to the emission model. However, only engine capacity is considered for motorcycles.
The expected mileage for each vehicle type is calculated using vehicle age data provided by the Department of Land Transport (DLT) in Thailand. The mileage categories are then determined by multiplying the vehicle’s age (in years) by the average annual VKT in kilometres. For the base year 2019, the breakdown of vehicle ages is broadly as follows: most vehicles are 6 years old, followed by those that are 7 years and 15 years old, respectively. In this research, vehicles older than 20 years are not taken into account, except for buses, as they are still in operation.
2.3. Vehicle Emission Model Input Data
2.3.1. Driving Pattern
Driving patterns, also known as driving behaviours, encompass the various habits and actions of drivers while operating vehicles. These patterns are significantly influenced by factors such as revolutions per minute (RPM), acceleration, deceleration, and speed. Additionally, external factors like traffic congestion and road slope directly impact fuel consumption, air pollutant emissions, and GHG emissions [70,71]. The speed profile measures both speed (km/h) and time (seconds; s).
Figure 2 illustrates the Bangkok driving patterns or driving cycles (345BKKDC) of vehicles used in the study. The average driving speed for buses and trucks is approximately 23.37 km/h, while passenger cars and motorcycles maintain an average speed of 33.47 km/h, and vans and pickups travel at around 35.34 km/h. Additionally, the maximum speeds recorded for these categories are approximately 66.90 km/h, 90.92 km/h, and 86.42 km/h, respectively.
The data align with findings from the Intelligent Traffic Information Center Foundation (iTIC) regarding average speeds in Bangkok and surrounding areas. Between 2011 and 2016, the average speeds, covering both urban and rural regions, declined from 36.29 km/h to 30.92 km/h [72]. Furthermore, the 345BKKDC typically conducts vehicle emissions tests, providing a representation of emissions across a range of vehicle speeds, including low, medium, and high. These tests are conducted at the Automotive Emission Laboratory (AEL) within the Pollution Control Department, Ministry of Natural Resources and Environment in Thailand.
2.3.2. Fleet Characteristics
Table 1 presents the fleet characteristics input for the base year (2019), including fuel type, vehicle technology, and vehicle size. Gasoline is the primary fuel type for passenger cars and motorcycles, while trucks, vans, and pickups predominantly use diesel fuel. Additionally, alternative fuels such as CNG, LPG, and hybrid technologies are also considered.
Vehicle technology includes both exhaust and air/fuel control systems. The exhaust system encompasses Euro 1–4 engine standards, with the use of exhaust gas recirculation (EGR) varying depending on the specific vehicle technology [73] currently utilised in Thailand. For motorcycles, four-cycle technology is currently employed. Moreover, air/fuel control encompasses fuel injection (FI), multi-point fuel injection (MPFI), and carburettor systems.
Furthermore, vehicles are classified based on size into three distinct groups. The first group comprises light-duty vehicles, such as passenger cars, vans, and pickups, categorised as follows: those weighing between 5000 and 6600 lbs. with engines smaller than 1.5 litres (small size), those weighing between 6601 and 9000 lbs. with engines less than 3 litres (medium size), and those exceeding 9001 lbs. with engines larger than 3 litres (large size).
The second group consists of heavy-duty vehicles, including buses and trucks, categorised as follows: those weighing between 9000 and 14,000 lbs, those weighing between 14,001 and 33,000 lbs, and those exceeding 33,000 lbs, classified as small, medium, and large sizes, respectively.
The last group encompasses motorcycles and is classified as follows: engines with less than 100 cc, engines with less than 300 cc, and engines exceeding 301 cc, also categorised as small, medium, and large sizes, respectively [60].
Additionally, the input data for location vary for each vehicle, but parameters such as temperature, humidity, and fuel properties remain consistent. The average temperature is set at 28 degrees Celsius, with humidity averaging approximately 76%, and the fuel characteristics, for both gasoline and diesel, adhere to the Euro 4 standard [24]. Furthermore, the distribution of technology within each vehicle type is provided as input data, with approximately 25%, 3%, 18%, 18%, 14%, and 10% representing different vehicle technologies allocated to passenger cars, motorcycles, vans, pickups, buses, and trucks, respectively, in the base year.
2.3.3. Base Adjustment
To evaluate vehicle emissions of specific air pollutants and GHGs, a chassis dynamometer test was conducted following the Bangkok driving cycle (345BKKDV), a protocol developed by the Pollution Control Department (PCD) of the Ministry of Natural Resources and Environment in Thailand. These experiments took place at the Automotive Emission Laboratory (AEL) within the PCD.
Vehicle emission factors were established through chassis dynamometer testing, with test conditions closely aligned to regulatory standards, including Thai Industrial Standard 2560-2554 [74]. The emissions database, which records data on CO, NOx, PM10, CO2, and CH4 emissions from vehicles classified by technology and VKT, is used to provide input for the base adjustment rate.
2.4. Emission Inventory Calculation
The specific air pollutants, encompassing CO, VOC, VOCevap, NOx, SOx, and PM10, alongside GHGs such as CO2, CH4, and N2O emitted by motor vehicles, are assessed using the IVE model. These emissions are subsequently calculated based on the total annual VKT. The results are presented in Equation (6).
where
i = type of pollutant or GHG;
j = type of vehicle;
EI = emission inventory;
EF = emission factor;
N = total number of vehicles.
2.5. Scenario Analysis
In line with Thailand’s policies addressing air pollutants and GHGs from mobile sources, there is a strong emphasis on mitigation strategies aimed at reducing emissions at their source. The National Climate Change Policy Committee (NCCC) has tasked the Energy Policy and Planning Office (EPPO) with leading the development of the national action plan for reducing GHG emissions in the energy sector from 2021 to 2030. This initiative involves collaboration with the Office of Natural Resources and Environmental Policy and Planning (ONEP) and the Thailand Greenhouse Gas Management Organisation (TGO). Moreover, the Office of Transport and Traffic Policy and Planning (OTP) has developed the NDC Sectoral Action Plan for the Transport Sector for the same period, aiming to achieve significant reductions in GHG emissions, equivalent to millions of tonnes of carbon dioxide.
The focus is on creating effective and sustainable transportation systems to reduce energy consumption in the transport sector, alleviate traffic congestion, develop liveable urban areas, and mitigate GHG emissions. To achieve this goal, three key measures are recommended: Firstly, developing policies that discourage unnecessary travel and reduce travel distances by seamlessly integrating urban planning with appropriate transportation planning. Secondly, promoting a shift from private vehicle use to more environmentally friendly and efficient modes of travel, such as public transport, cycling, and walking. Lastly, implementing policies to improve the energy efficiency of motor vehicles and optimise fuel efficiency. This includes adopting automotive energy-saving technologies, exploring alternative energy sources, promoting gasohol use, and popularising electric vehicles (EVs) and bicycles [28].
These action plans include specific measures aimed at reducing air pollution, such as converting diesel bus engines to NGV and Evs [75]. Moreover, promoting public transport [76] and adopting alternative vehicle engines, such as Evs, are seen as strategies for mitigating GHG emissions [77]. Additionally, Evs represent a continuously evolving transportation technology that has emerged over the last decade, characterised by zero emissions [78,79]. Therefore, this study focuses on evaluating scenarios involving encouraging measures such as promoting the use of public transport, transitioning new passenger cars to Evs, and converting buses from diesel engines to Evs.
3. Results and Discussion
3.1. VKT Estimation
The updated PCD database and relevant research [80] provide estimates for the annual average VKT within each primary vehicle category, as shown in Table 2. Buses have the highest average annual VKT per vehicle, followed by trucks, vans, pickups, passenger cars, and motorcycles, respectively. However, the total VKT during the base year was the highest for passenger cars, followed by pickups, motorcycles, trucks, buses, and vans, respectively. This discrepancy can be attributed to the number of vehicles, which affects the assessment of the emission inventory [24,54].
3.2. Emission Factor and Emission Inventory in the Base Year
The IVE model evaluates emission factors for both specific air pollutants and GHGs across all vehicle categories. Table 3 shows the total emission factors for the base year, 2019. Updated emission factors for specific air pollutants and GHGs for each vehicle type and technology in the base year 2019 are also available in the Supplementary Material. Notably, the highest CO emission factors are attributed to passenger cars during cold starts (g/start) and hot running (g/km). The highest VOC emission factors are primarily associated with motorcycles during both cold starts and hot running. The VOCevap emission factor during hot running is predominantly linked to buses, while during cold starts it is highest in passenger cars. Additionally, SOx and NOx emission factors are primarily emitted during cold starts by passenger cars and during hot running by buses. The PM10 emission factors are highest in buses during both cold starts and hot running.
Additionally, significant CO2 emission factors occur during both starts and running for pickups, while N2O emission factors during cold starts and running are the primary source of emissions for buses and trucks, respectively. Lastly, regarding CH4 emission factors, motorcycles exhibit higher emissions than other vehicles during cold starts, and buses have higher emissions during hot running. Subsequently, emission inventories for all vehicle types are compiled based on the average VKT and emission factors.
Moreover, pickups exhibit notable CO2 emission factors during both starts and running. Cold starts and running are the primary sources of N2O emission factors for buses and trucks, respectively. Lastly, regarding CH4 emission factors, motorcycles have higher emissions than other vehicles during cold starts, while vans have the highest emission factor during hot running. Consequently, emission inventories for all vehicle types are established based on the average VKT and emission factors.
The emission inventory for specific air pollutants and GHGs in the base year is outlined in Table 4. The analysis revealed that CO emissions were primarily linked to motorcycles, with passenger cars, trucks, pickups, buses, and vans following in descending order of contribution. Conversely, VOC emissions were predominantly associated with motorcycles, with passenger cars, trucks, buses, pickups, and vans following in sequence. Moreover, passenger cars were identified as the primary sources of VOCevap emissions, with motorcycles, buses, pickups, trucks, and vans subsequently ranking in terms of contribution. Additionally, NOx emissions were primarily emitted by pickups, with trucks, buses, passenger cars, motorcycles, and vans following, respectively. For SOx emissions, passenger cars were the main contributors, followed by trucks, pickups, motorcycles, buses, and vans.
However, the variation observed among vehicle types can be attributed to differences in fuel type, which include gasoline and diesel fuel, all conforming to the Euro 4 standard and containing low sulfur levels (<50 ppm). Regarding PM10 emissions, trucks were identified as the primary contributors, followed by motorcycles, pickups, buses, passenger cars, and vans, respectively. This trend can be attributed to older technology and the large VKT of vehicles still in operation within the region.
The analysis revealed that pickups are the primary source of CO2 emissions, followed by passenger cars, trucks, motorcycles, vans, and buses in that order. N2O emissions were most significant from trucks, followed by pickups, passenger cars, buses, vans, and motorcycles, respectively. In terms of CH4 emissions, motorcycles were identified as the largest emitters, with passenger cars, buses, pickups, vans, and trucks following in descending order.
The calculation of GHG emissions in the Fifth Assessment Report (AR5) is expressed in carbon dioxide equivalent (CO2eq). This standardises the measurement of various gases by their global warming potential (GWP) over a specific timeframe, typically 100 years. GWP serves as an index, with CO2 assigned a value of 1. Comparatively, other GHGs are evaluated based on how much more warming they induce relative to CO2. For instance, over a 100-year period, CH4 has a GWP of 28, while N2O has a GWP of 265 [45]. Hence, the GHG emissions attributable to pickups amount to 46,779.96 GgCO2eq, representing the highest emissions category. Subsequently, passenger cars, trucks, motorcycles, vans, and buses display emissions of approximately 9800.10, 8604.74, 4363.43, 2034.94, and 1911.10 GgCO2eq, respectively, resulting in a cumulative total of 73,494.27 GgCO2eq. These findings indicating the predominant contribution of air pollutants and GHGs align with previous studies conducted in Myanmar [81], Ecuador [38], and Indonesia [55].
3.3. Uncertainty Analysis
Generally, uncertainty in emission inventories primarily arises from data concerning emission factors and activity data [82,83,84]. The main sources of uncertainty in the emission inventory include variations in the number of registered vehicles, emission factors, the annual average VKT, and the driving pattern. Data on the number of registered vehicles were obtained from official statistics. The dynamic emission factor is determined by multiplying the correction factor with the base emission factor, which has been adjusted using laboratory-measured emission factors for specific air pollutants and GHGs from vehicles. However, vehicle emission testing in Thailand does not encompass all vehicle technologies. Hence, the default correction factors within the vehicle emission model were collectively employed. Regarding the annual average VKT, due to the lack of accurate local statistics, the data used in this study were obtained from official channels, including the PCD and other references.
3.4. BAU Scenario
Vehicle estimates from 2023 to 2030 are based on the growth rates of specific vehicle classifications recorded in the data provided by the DLT from 2010 to 2022. The average annual growth rate for all vehicle types during this period was approximately 3.42%. The specific growth rates for each vehicle category were as follows: 5.27% for passenger cars, 2.93% for vans, −0.36% for pickups, 0.0015% for motorcycles, −0.03% for buses, and 5.36% for trucks. Figure 3 provides a graphical representation of the cumulative vehicle count.
The data highlight a notable increase in the cumulative number of trucks, accompanied by rises in the counts of passenger cars and vans, between 2021 and 2030. Conversely, the figures for pickups, motorcycles, and buses remained relatively stable during this period. In 2020 and 2021, all vehicle categories experienced declines due to the impact of the COVID-19 pandemic, except for vans, which saw growth in 2020, and passenger cars and motorcycles, which saw increases in 2021.
The results from the BAU scenario concerning dynamic emission factors and emissions of specific air pollutants from 2019 to 2030 indicate a general rise in CO, VOC, VOCevap, PM10, NOx, SOx, CO2, CH4, and N2O across various vehicle categories when compared to the base year. Noteworthy is the decline in emissions from buses across all pollutants. This trend may be linked to the cumulative number of buses deployed across different technologies. Furthermore, motorcycles are recognised as the primary contributors to specific pollutant emissions, constituting 46.58%, followed by passenger cars (40.39%), pickups (7.14%), trucks (4.12%), buses (1.32%), and vans (0.45%), all of which also have a significant impact. Most vehicle emissions are mainly comprised of CO and NOx, accounting for 85.93% and 10.61% respectively, with VOC (2.33%), PM10 (0.65%), VOCevap (0.47%), and SOx (0.01%) following closely. Motorcycles are the main contributors to CO and VOC emissions, while passenger cars play a significant role in CO, VOCevap, and SOx emissions. Additionally, PM10 emissions primarily originate from a significant portion of diesel engines, with trucks being the largest contributors.
Regarding GHG emissions, CO2 is the main contributor from vehicles, accounting for 99.92% of the total. Pickups are identified as the largest emitters of CO2, followed by trucks, passenger cars, motorcycles, vans, and buses, respectively. Moreover, most CH4 emissions are linked to motorcycles, constituting 86.09% of total CH4 emissions. This can be attributed to the widespread use of petrol in motorcycles, which have the highest cumulative numbers among vehicle types, making up approximately 52.25% of the total vehicle count. Additionally, N2O emissions are mainly associated with trucks, albeit relatively low at around 17.57 Gg/year, representing about 0.01% of total GHG emissions.
Furthermore, there has been a general upward trend in GHG emissions from vehicles since the base year. The total GHG emissions (GgCO2eq) are predominantly attributed to pickups (51.81%), with trucks (18.59%), passenger cars (18.13%), vans (2.67%), buses (2.20%), and motorcycles (6.60%) following in descending order of emissions.
3.5. Mitigation Measures Scenario and Co-Benefit
The NDC roadmap outlines strategies to mitigate GHG emissions in the transportation sector from 2021 to 2030, focusing on targeted measures to combat air pollution. Two specific scenarios have been evaluated: bus scenarios and passenger car scenarios. Regarding buses, the scenarios entail transitioning from diesel engines, including those less than 1 year old and phasing out those that are 20 years old, to EVs with adoption rates of both 50% and 100%. Similarly, concerning new passenger cars (less than 1 year old), the focus shifts from reliance on gasoline and diesel fuel to the adoption of EVs at rates around 50% and 100%. This transition is accompanied by a potential 20% reduction in VKT, facilitated by the promotion of public transportation usage.
- (1)
- Passenger car scenarios
The passenger car scenarios include four different plans, each involving the transition of new passenger cars from petrol and diesel engines to EVs. The adoption rates are set at 50%, either with or without a 20% reduction in VKT, and at 100% adoption with the same VKT reduction. In the scenario where 50% of new passenger cars transition to EVs, CO emissions are observed to slightly increase from 2023 to 2030. Specifically, in 2023, the emissions of specific air pollutants and GHGs in this scenario exceed those of the BAU scenario.
Additionally, CO emissions decrease from 2024 to 2030, except for 2025, compared to the BAU scenario. VOC emissions also decrease from 2024 to 2030, except for 2028, while VOCevap emissions exceed the base year from 2023 to 2024, except for 2026. Furthermore, PM10 emissions surpass those of the BAU scenario in 2027 and 2028. Moreover, GHG emissions from 2025 to 2030 decrease compared to the BAU scenario. The variations in emission levels can be attributed to differences in the cumulative number of passenger cars across various technologies.
In the first scenario, the most significant reduction in emissions compared to the BAU scenario is observed in CO at 12.00%, followed by GHG at 10.63%, SOx at 9.09%, NOx and VOC at 5.75%, PM10 at 3.38%, and VOCevap at 1.74%. In the second scenario, involving the transition of 100% of new passenger cars to EVs, all specific air pollutants and GHG emissions show a slight increase from 2023 to 2030. However, they remain lower than the BAU scenario, except for VOCevap emissions in 2027 and 2028, which exceed those of the BAU case. Furthermore, the most significant reduction in emissions compared to the BAU scenario is observed in GHG at 24.63%, followed by SOx at 17.66%, CO at 12.44%, NOx at 10.88%, VOC at 6.59%, PM10 at 5.74%, and VOCevap at 2.85%.
Furthermore, in the final two scenarios, involving the transition of new passenger cars from petrol and diesel engines to EVs at both 50% and 100% adoption rates, with a 20% reduction in VKT, emissions of all types show a slight increase from 2023 to 2030. Nevertheless, these scenarios exhibit a significant decrease compared to the BAU scenario. Therefore, mitigation strategies aimed at reducing GHG emissions require not only the transition from fossil fuel engines to EVs in passenger cars but also initiatives to reduce VKT, such as promoting the use of public transport and minimising the use of private cars.
In the third scenario, which involves transitioning new passenger cars from petrol and diesel engines to EVs at a 50% adoption rate with a 20% reduction in VKT, the most notable reduction in emissions compared to the BAU scenario is observed in CO at 29.60%, followed by GHG at 28.50%, SOx at 27.27%, NOx at 24.70%, VOC at 24.60%, PM10 at 22.70%, and VOCevap at 21.38%.
Finally, in the last scenario concerning passenger cars, which entails transitioning new vehicles from petrol and diesel engines to EVs at a 100% adoption rate with a 20% reduction in VKT, the most significant reduction in emissions compared to the BAU scenario is observed in GHG at 39.70%, followed by SOx at 32.12%, CO at 29.95%, NOx at 28.70%, VOC at 25.27%, PM10 at 24.59%, and VOCevap at 22.27%. The emissions of air pollutants and GHGs within the passenger car scenarios from 2019 to 2030 are illustrated in Figure 4.
- (2)
- Bus scenarios
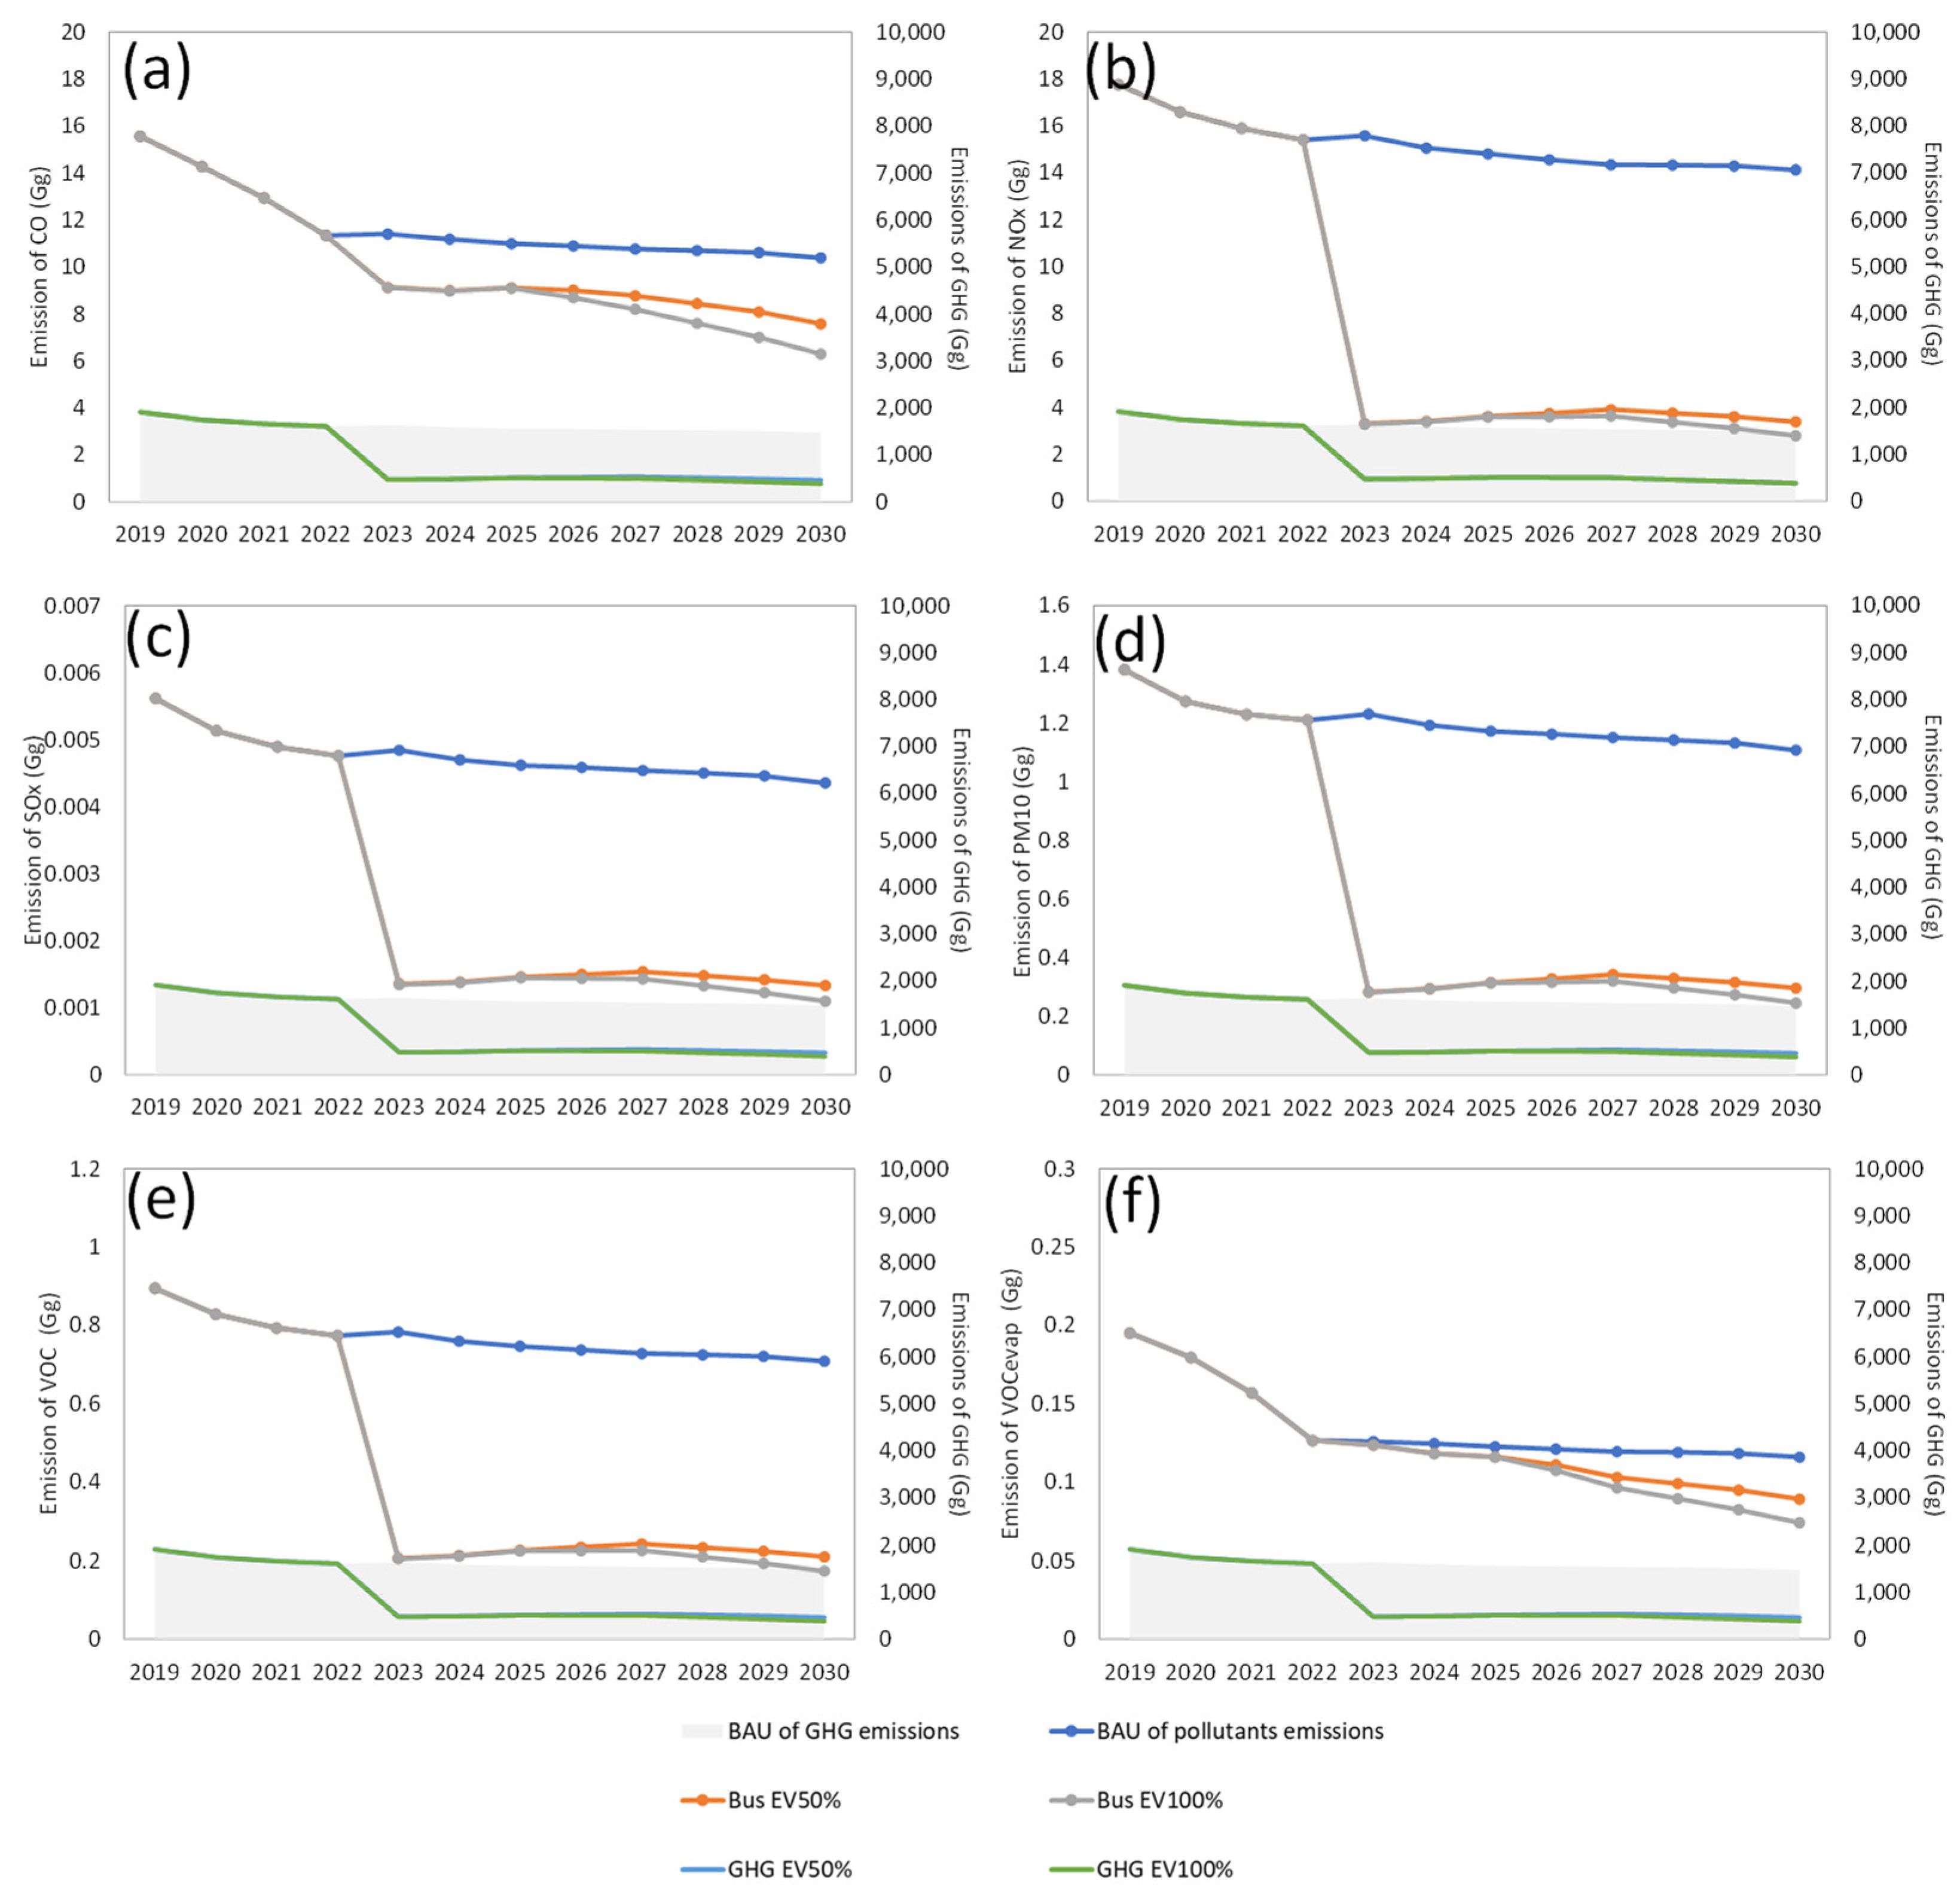
In the context of bus transportation, two scenarios are considered: one involves replacing existing 20-year-old diesel buses, while the other entails transitioning new diesel buses to electric buses at adoption rates of 50% and 100%, respectively. The outcomes indicate a noticeable decreasing trend from 2023 to 2030. Additionally, emissions of specific air pollutants and GHGs show a significant decrease compared to the BAU scenario. For CO and VOCevap, there is a marginal reduction in emissions, while emissions of other pollutants and GHGs exhibit a significant decrease compared to the BAU scenarios.
In the initial bus scenario, where the shift from new diesel buses to electric buses occurs at a 50% adoption rate, the most significant reduction in emissions compared to the BAU scenario is noticeable in NOx at 78.72%, followed by PM10 at 77.02%, VOC at 73.57%, SOx at 72.04%, GHG at 70.74%, CO at 26.98%, and VOCevap at 23.18%. In the ultimate bus scenario, involving the complete transition of new diesel buses to electric buses at a 100% adoption rate, the most notable decrease in emissions compared to the BAU scenario is observed in NOx at 80.24%, followed by PM10 at 77.83%, VOC at 75.44%, SOx at 74.82%, GHG at 74.03%, CO at 39.41%, and VOCevap at 36.17%. This scenario could initially be implemented in specific areas such as the Bangkok Metropolitan Area, Pattaya City, Phuket City, Chiang Mai City, and other urban centres under the authority of the Ministry of Transport of the Thai government [85].
Moreover, the National Electric Vehicle Policy Committee of Thailand has provisionally approved tax incentives to promote the acquisition of electric buses and electric trucks, with the aim of supporting the business sector’s efforts to reduce carbon emissions. Under this initiative, companies purchasing domestically manufactured vehicles will qualify for an expense deduction equal to twice the actual price of the vehicles, without a price cap [86]. The emissions of air pollutants and GHGs under the bus scenarios from 2019 to 2030 are illustrated in Figure 5.
The results of the mitigation scenarios, compared to the BAU scenario, indicate that plans incorporating strategies to reduce GHG emissions and specific air pollution, aimed at replacing diesel fuel with EVs in new passenger cars and new buses, led to decreases across all scenarios. In particular, transitioning from new petrol and/or diesel vehicles to EVs at a 100% adoption rate, alongside a reduction in VKT, resulted in the greatest reductions in specific air pollutants and GHG emissions, at 13.65% and 11.11%, respectively. Table 5 illustrates the percentage reductions of specific air pollutants and GHG emissions for each scenario.
3.6. Limitations
The limitations of this study require further refinement and exploration. Firstly, to reduce complexity, this paper focused on the co-benefits of GHG emissions and specific air pollutant emissions. However, GHG mitigation also brings additional advantages in terms of health impacts, ecosystems, economic systems, and resource-use efficiency [87,88], which may vary significantly across different areas, thus necessitating further investigations. Future studies should provide a more comprehensive assessment of the human health impacts resulting from emissions reduction.
4. Conclusions
The assessment of specific air pollutants and GHG emissions from road vehicles in Thailand relies on data from the Thailand database, with the reference year of 2019. Actual data from 2019 to 2022 are used, while projections for 2023–2030 are based on the baseline year. The IVE model incorporates secondary database input adjusted to real driving data for emission factors related to Thai vehicle characteristics. Dynamic emission factors for air pollutants and GHGs are evaluated alongside the average VKT for each vehicle type. The BAU scenario, reflecting current policies to mitigate emissions in the transportation sector, considers strategies such as EV adoption and the promotion of public transportation to reduce VKT.
In the BAU scenario, the total number of road vehicles in Thailand, including passenger cars, motorcycles, pickups, vans, trucks, and buses, is projected to rise by around 6.59% by 2030, leading to an increase in specific air pollutants and GHG emissions compared to the reference year. Nevertheless, adopting new EV passenger cars and buses in line with Thailand’s outlined strategies will significantly reduce GHG emissions and specific air pollutants from the road transportation sector.
Furthermore, in potential scenarios where the transition to EVs occurs at rates of 50% and 100%, GHG emissions could be reduced by 7940.16 and 7859.03 GgCO2eq, respectively, by the year 2030. These reductions represent decreases of 10.80% and 10.69% compared to the BAU scenario, respectively.
Moreover, the largest emission factors for certain vehicles may not necessarily result in the highest emissions, as this depends on the annual average VKT and the various vehicle technologies each year. Consequently, specific air pollutant and GHG inventories will be crucial factors supporting the sustainable development of Thailand’s transportation sector strategies in the future.
Scenario analysis has the potential to reduce GHG emissions and yield additional benefits by lowering local air pollutant emissions. Electric vehicles, particularly passenger cars and buses, demonstrate significant potential for reducing GHG emissions as well as associated air pollutants such as CO, VOCs, VOCevap, NOx, SOx, and PM10. However, a more effective strategy for both GHG reduction and air quality improvement involves not only promoting the adoption of EVs but also encouraging the public to use public transport.
Furthermore, the introduction of policies targeting GHG emissions reduction is expected to significantly reduce air pollution emissions, leading to a maximum co-benefit of 11.11% for GHG reduction and 6.58% for PM10 emissions reduction. However, the government must provide support and encouragement for EV adoption. Nevertheless, a high penetration rate of EVs will affect Thailand’s energy system, particularly the road transport sector. This impact includes changes in the overall energy demand trend, the load profile of electricity demand, and the indirect GHG emissions generated from energy production for vehicles.
Future scenarios can be explored through long-term strategies, such as setting objectives to achieve carbon neutrality by 2050 and net-zero GHG emissions by 2065 in Thailand. Additionally, other co-benefits, such as health improvements, increased economic outcomes, and the reduction of negative impacts on ecosystems, should be investigated.
Supplementary Materials
The following supporting information can be downloaded at: https://www.mdpi.com/article/10.3390/en17102336/s1. 2019 Baseline Emission Factors for Specific Air Pollutants and GHGs by Vehicle Type and Technology
Author Contributions
Conceptualisation, P.T. and D.S.; methodology, P.T.; software, P.T.; validation, P.T.; formal analysis, P.T.; investigation, P.T.; resources, P.T.; data curation, P.T.; writing—original draft preparation, P.T. and D.S.; writing—review and editing, P.T. and D.S.; visualisation, P.T.; supervision, P.T.; project administration, P.T. and D.S.; funding acquisition, P.T. All authors have read and agreed to the published version of the manuscript.
Funding
This research was funded by the Thailand Science Research and Innovation Fundamental Fund, grant number TUFF15/2564 and the APC was supported by Thammasat University Research Unit in Environment, Health, and Epidemiology.
Data Availability Statement
The original contributions presented in the study are included in the article/Supplementary Material, further inquiries can be directed to the corresponding author.
Acknowledgments
The authors express sincere appreciation to the Automotive Emission Laboratory (AEL) within the Pollution Control Department (PCD), Ministry of Natural Resources and Environment in Thailand. Their invaluable assistance in supplying data and research facilities for evaluating air pollutants and greenhouse gas emissions in this study is deeply valued. This work was supported by the Thammasat University Research Unit in Environment, Health, and Epidemiology, and the Faculty of Public Health at Thammasat University.
Conflicts of Interest
The authors declare no conflicts of interest.
References
- Apergis, N.; Bhattacharya, M.; Hadhri, W. Health care expenditure and environmental pollution: A cross-country comparison across different income groups. Environ. Sci. Pollut. Res. 2020, 27, 8142–8156. [Google Scholar] [CrossRef] [PubMed]
- Baumgartner, J.; Brauer, M.; Ezzati, M. The role of cities in reducing the cardiovascular impacts of environmental pollution in low-and middle-income countries. BMC Med. 2020, 18, 1–11. [Google Scholar] [CrossRef] [PubMed]
- Badida, P.; Krishnamurthy, A.; Jayaprakash, J. Meta analysis of health effects of ambient air pollution exposure in low-and middle-income countries. Environ. Res. 2023, 216, 114604. [Google Scholar] [CrossRef] [PubMed]
- Ferguson, L.; Taylor, J.; Davies, M.; Shrubsole, C.; Symonds, P.; Dimitroulopoulou, S. Exposure to indoor air pollution across socio-economic groups in high-income countries: A scoping review of the literature and a modelling methodology. Environ. Int. 2020, 143, 105748. [Google Scholar] [CrossRef] [PubMed]
- Bowe, B.; Xie, Y.; Li, T.; Yan, Y.; Xian, H.; Al-Aly, Z. Estimates of the 2016 global burden of kidney disease attributable to ambient fine particulate matter air pollution. BMJ Open 2019, 9, e022450. [Google Scholar] [CrossRef] [PubMed]
- Combes, A.; Franchineau, G. Fine particle environmental pollution and cardiovascular diseases. Metab. 2019, 100, 153944. [Google Scholar] [CrossRef]
- Filippelli, G.; Anenberg, S.; Taylor, M.; van Geen, A.; Khreis, H. New approaches to identifying and reducing the global burden of disease from pollution. GeoHealth 2020, 4, e2018GH000167. [Google Scholar] [CrossRef] [PubMed]
- Kateja, A. Looming Threat of Vehicular Pollution to Human Health. In Urban Growth and Environmental Issues in India; Kateja, A., Jain, R., Eds.; Springer: Singapore, 2021; pp. 157–171. [Google Scholar] [CrossRef]
- Li, W.W. Air Pollution, Air Quality, Vehicle Emissions, and Environmental Regulations; Traffic-Related Air Pollution; Elsevier: Amsterdam, The Netherlands, 2020; Chapter 2; pp. 23–49. [Google Scholar] [CrossRef]
- Pompilio, A.; Di Bonaventura, G. Ambient air pollution and respiratory bacterial infections, a troubling association: Epidemiology, underlying mechanisms, and future challenges. Crit. Rev. Microbiol. 2020, 46, 600–630. [Google Scholar] [CrossRef] [PubMed]
- Prasad, R.R.; Paudel, S. Impacts of Air Pollution on Epidemiology and Cardiovascular Systems; Air Pollution and Environmental Health; Springer: Singapore, 2020; pp. 179–207. [Google Scholar] [CrossRef]
- Tiotiu, A.I.; Novakova, P.; Nedeva, D.; Chong-Neto, H.J.; Novakova, S.; Steiropoulos, P.; Kowal, K. Impact of air pollution on asthma outcomes. Int. J. Environ. Res. Public Health 2020, 17, 6212. [Google Scholar] [CrossRef]
- World Health Organization (WHO) Website. Available online: https://www.who.int/news-room/fact-sheets/detail/ambient-(outdoor)-air-quality-and-health?gclid=CjwKCAjw4P6oBhBsEiwAKYVkq1PnhGQCeb1TGAaP6aourfQo4IVbVojqU10HM4d3-421e55kc2KfiBoC_iIQAvD_BwE (accessed on 10 October 2023).
- Abbass, K.; Qasim, M.Z.; Song, H.; Murshed, M.; Mahmood, H.; Younis, I. A review of the global climate change impacts, adaptation, and sustainable mitigation measures. Environ. Sci. Pollut. Res. 2022, 29, 42539–42559. [Google Scholar] [CrossRef]
- Ebi, K.L.; Vanos, J.; Baldwin, J.W.; Bell, J.E.; Hondula, D.M.; Errett, N.A.; Hayes, K.; Reid, C.E.; Saha, S.; Spector, J.; et al. Extreme weather and climate change: Population health and health system implications. Annu. Rev. Public Health 2021, 42, 293–315. [Google Scholar] [CrossRef]
- Hoegh-Guldberg, O.; Jacob, D.; Taylor, M.; Guillén Bolaños, T.; Bindi, M.; Brown, S.; Camilloni, I.A.; Diedhiou, A.; Djalante, R.; Ebi, K.; et al. The human imperative of stabilizing global climate change at 1.5 C. Science 2019, 365, eaaw6974. [Google Scholar] [CrossRef] [PubMed]
- Jessel, S.; Sawyer, S.; Hernández, D. Energy, poverty, and health in climate change: A comprehensive review of an emerging literature. Front. Public Health 2019, 7, 357. [Google Scholar] [CrossRef]
- Milner, J.; Hamilton, I.; Woodcock, J.; Williams, M.; Davies, M.; Wilkinson, P.; Haines, A. Health benefits of policies to reduce carbon emissions. BMJ 2020, 368, l6758. [Google Scholar] [CrossRef]
- Romanello, M.; McGushin, A.; Di Napoli, C.; Drummond, P.; Hughes, N.; Jamart, L.; Kennard, H.; Lampard, P.; Rodriguez, B.S.; Arnell, N.; et al. The 2021 report of the Lancet Countdown on health and climate change: Code red for a healthy future. Lancet 2021, 398, 1619–1662. [Google Scholar] [CrossRef]
- World Health Organization (WHO) Website. Available online: https://www.who.int/news-room/fact-sheets/detail/climate-change-and-health?gclid=CjwKCAjwyY6pBhA9EiwAMzmfwYqp1wJnVOIq1Tk3ihKhon54ov0e2rxk5aeIZBDRI4h7LZ3KkrW-1BoC2BQQAvD_BwE (accessed on 15 October 2023).
- Albuquerque, F.D.; Maraqa, M.A.; Chowdhury, R.; Mauga, T.; Alzard, M. Greenhouse gas emissions associated with road transport projects: Current status, benchmarking, and assessment tools. Transp. Res. Proc. 2020, 48, 2018–2030. [Google Scholar] [CrossRef]
- Cheng, L.; Ji, D.; He, J.; Li, L.; Du, L.; Cui, Y.; Zhang, H.; Zhou, L.; Li, Z.; Zhou, Y. Characteristics of air pollutants and greenhouse gases at a regional background station in southwestern China. Aerosol Air Qual. Res. 2019, 19, 1007–1023. [Google Scholar] [CrossRef]
- World Resources Institute Website. Available online: https://www.wri.org/insights/4-charts-explain-greenhouse-gas-emissions-countries-and-sectors?ref=thesustainableinvestor.org.uk (accessed on 15 December 2023).
- Sirithian, D.; Thanatrakolsri, P.; Pongpan, S. CO2 and CH4 Emission Factors from Light-Duty Vehicles by Fuel Types in Thailand. Atmosphere 2022, 13, 1588. [Google Scholar] [CrossRef]
- United States Environmental Protection Agency (USEPA), Website. Available online: https://www.epa.gov/greenvehicles/greenhouse-gas-emissions-typical-passenger-vehicle (accessed on 15 October 2023).
- Crippa, M.; Guizzardi, D.; Pagani, F.; Banja, M.; Muntean, M.; Schaaf, E.; Becker, W.; Monforti-Ferrario, F.; Quadrelli, R.; Risquez Martin, A.; et al. GHG Emissions of All World Countries; Publications Office of the European Union: Luxembourg, 2023. [Google Scholar] [CrossRef]
- United Nations Environment Programme (UNEP) Website. Available online: https://wedocs.unep.org/bitstream/handle/20.500.11822/43922/EGR2023.pdf?sequence=3&isAllowed=y (accessed on 15 December 2023).
- Ministry of Natural Resources and Environment (MONRE) Website. Available online: https://unfccc.int/sites/default/files/resource/Thailand_BUR4_final_28122022.pdf (accessed on 10 September 2023).
- Mbandi, A.M.; Malley, C.S.; Schwela, D.; Vallack, H.; Emberson, L.; Ashmore, M.R. Assessment of the impact of road transport policies on air pollution and greenhouse gas emissions in Kenya. Energy Strategy Rev. 2023, 49, 101120. [Google Scholar] [CrossRef]
- Duan, L.; Hu, W.; Deng, D.; Fang, W.; Xiong, M.; Lu, P.; Li, Z.; Zhai, C. Impacts of reducing air pollutants and CO2 emissions in urban road transport through 2035 in Chongqing. China Environ. Sci. Ecotechnol. 2021, 8, 100125. [Google Scholar] [CrossRef]
- Aslam, A.; Ibrahim, M.; Shahid, I.; Mahmood, A.; Irshad, M.K.; Yamin, M.; Ghazala, T.M.; Shamshiri, R.R. Pollution characteristics of particulate matter (PM2. 5 and PM10) and constituent carbonaceous aerosols in a South Asian future megacity. Appl. Sci. 2020, 10, 8864. [Google Scholar] [CrossRef]
- Bajwa, A.U.; Sheikh, H.A. Contribution of Road Transport to Pakistan’s Air Pollution in the Urban Environment. Air 2023, 1, 237–257. [Google Scholar] [CrossRef]
- Anenberg, S.; Miller, J.; Henze, D.A.V.E.N.; Minjares, R. A Global Snapshot of the Air Pollution-Related Health Impacts of Transportation Sector Emissions in 2010 and 2015; International Council on Clean Transportation: Washington, DC, USA, 2019; pp. 1–48. [Google Scholar]
- Baayoun, A.; Itani, W.; El Helou, J.; Halabi, L.; Medlej, S.; El Malki, M.; Moukhadder, A.; Aboujaoude, L.K.; Kabakian, V.; Mounajed, H.; et al. Emission inventory of key sources of air pollution in Lebanon. Atmos. Environ. 2019, 215, 116871. [Google Scholar] [CrossRef]
- Pollution Control Department (PCD). Thailand State of Pollutant Report 2022; Ministry of Natural Resources and Environment: Bangkok, Thailand, 2023. [Google Scholar]
- Narita, D.; Oanh, N.T.K.; Sato, K.; Huo, M.; Permadi, D.A.; Chi, N.N.H.; Ratanajaratroj, T.; Pawarmart, I. Pollution characteristics and policy actions on fine particulate matter in a growing Asian economy: The case of Bangkok Metropolitan Region. Atmosphere 2019, 10, 227. [Google Scholar] [CrossRef]
- Chirasophon, S.; Pochanart, P. The Long-term Characteristics of PM10 and PM2.5 in Bangkok, Thailand. Asian J. Atmos. Environ. 2020, 14, 73–83. [Google Scholar] [CrossRef]
- Castesana, P.; Diaz Resquin, M.; Huneeus, N.; Puliafito, E.; Darras, S.; Gómez, D.; Granier, C.; Osses Alvarado, M.; Rojas, N.; Dawidowski, L. PAPILA dataset: A regional emission inventory of reactive gases for South America based on the combination of local and global information. Earth Syst. Sci. Data 2022, 14, 271–293. [Google Scholar] [CrossRef]
- Zhou, M.; Jiang, W.; Gao, W.; Gao, X.; Ma, M.; Ma, X. Anthropogenic emission inventory of multiple air pollutants and their spatiotemporal variations in 2017 for the Shandong Province, China. Environ Pollut. 2021, 288, 117666. [Google Scholar] [CrossRef] [PubMed]
- 40 Prakash, J.; Vats, P.; Sharma, A.K.; Ganguly, D.; Habib, G. New emission inventory of carbonaceous aerosols from the on-road transport sector in India and its implications for direct radiative forcing over the region. Aerosol Air Qual. Res. 2020, 20, 741–761. [Google Scholar] [CrossRef]
- Patiño-Aroca, M.; Parra, A.; Borge, R. On-road vehicle emission inventory and its spatial and temporal distribution in the city of Guayaquil, Ecuador. Sci. Total Environ. 2020, 848, 157664. [Google Scholar] [CrossRef]
- Limmeechokchai, B.; Dul, D. Achievement of Paris Agreement in selected Greater Mekong Sub-region countries: Analyses of renewable electricity and emissions gap. Energy 2023, 1, 29–66. [Google Scholar]
- Meeros, W.; Wichakul, S. Thailand Nationally Determined Contributions (NDCs): Analysis of climate policy for enhancing climate resilience in infrastructure construction sector. In Proceedings of the 2022 International Conference and Utility Exhibition on Energy, Environment and Climate Change (ICUE), Pattaya, Thailand, 26–28 October 2022; pp. 1–8. [Google Scholar] [CrossRef]
- Muangjai, P.; Wongsapai, W.; Jaitiang, T.; Ritkrerkkrai, C.; Daroon, S.; Thepsaskul, W. The Pathway to NDC and Carbon Neutrality: Roles of Optimum Degree between Marginal Abatement Cost and Social Cost of Carbon in the Thai Power and Industrial Sector. Sustainability 2023, 16, 160. [Google Scholar] [CrossRef]
- Intergovernmental Panel on Climate Change (IPCC). Climate Change 2014: Synthesis Report; Core Writing Team, Pachauri, R.K., Meyer, L.A., Eds.; Contribution of Working Groups I, II and III to the Fifth Assessment Report of the Intergovernmental Panel on Climate Change; IPCC: Geneva, Switzerland, 2014; p. 151. [Google Scholar]
- Jiao, J.; Huang, Y.; Liao, C. Co-benefits of reducing CO2 and air pollutant emissions in the urban transport sector: A case of Guangzhou. Energy Sustain. Dev. 2020, 59, 131–143. [Google Scholar] [CrossRef]
- Kim, S.E.; Xie, Y.; Dai, H.; Fujimori, S.; Hijioka, Y.; Honda, Y.; Hashizume, M.; Masui, T.; Hasegawa, T.; Xu, X.; et al. Air quality co-benefits from climate mitigation for human health in Sout Korea. Environ. Int. 2020, 136, 105507. [Google Scholar] [CrossRef] [PubMed]
- Liu, Q.; Gao, J. Co-benefits of reducing greenhouse gas emissions. In Health of People, Health of Planet and Our Responsibility: Climate Change, Air Pollution and Health; Al-Delaimy, W.K., Ramanathan, V., Sorondo, M.S., Eds.; Springer: Cham, Switzerland, 2020; pp. 295–307. [Google Scholar] [CrossRef]
- Lu, Z.; Huang, L.; Liu, J.; Zhou, Y.; Chen, M.; Hu, J. Carbon dioxide mitigation co-benefit analysis of energy-related measures in the Air Pollution Prevention and Control Action Plan in the Jing-Jin-Ji region of China. Resour. Conserv. Recycl. X 2019, 1, 100006. [Google Scholar] [CrossRef]
- Wei, X.; Tong, Q.; Magill, I.; Vithayasrichareon, P.; Betz, R. Evaluation of potential co-benefits of air pollution control and climate mitigation policies for China’s electricity sector. Energy Econ. 2020, 92, 104917. [Google Scholar] [CrossRef]
- Yang, X.; Yang, X.; Zhu, J.; Jiang, P.; Lin, H.; Cai, Z.; Huang, H. Achieving co-benefits by implementing the low-carbon city pilot policy in China: Effectiveness and efficiency. Environ. Technol. Innov. 2023, 30, 103137. [Google Scholar] [CrossRef]
- Bamwesigye, D.; Hlavackova, P. Analysis of sustainable transport for smart cities. Sustainability 2019, 11, 2140. [Google Scholar] [CrossRef]
- Economic and Social Commission for Asia and the Pacific (ESCAP) Website. Available online: https://www.unescap.org/sites/default/files/publications/bulletin87_Fulltext.pdf (accessed on 8 September 2023).
- Nguyen, Y.L.T.; Nghiem, T.D.; Le, A.T.; Duc, K.N.; Nguyen, D.H. Emission characterization and co-benefits of bus rapid transit: A case study in Hanoi, Vietnam. Atmos. Pollut. Res. 2021, 12, 101148. [Google Scholar] [CrossRef]
- Kim Oanh, N.T.; Huy, L.N.; Didin, D.A.; Zusman, E.; Nakano, R.; Nugroho, S.B.; Lestari, P.; Sofyan, A. Assessment of urban passenger fleet emissions to quantify climate and air quality co-benefits resulting from potential interventions. Carbon Manag. 2018, 9, 367–381. [Google Scholar] [CrossRef]
- Viteri, R.; Borge, R.; Paredes, M.; Pérez, M.A. A high resolution vehicular emissions inventory for Ecuador using the IVE modelling system. Chemosphere 2023, 315, 137634. [Google Scholar] [CrossRef]
- Chaudhry, S.K.; Elumalai, S.P. Assessment of sustainable school transport policies on vehicular emissions using the IVE model. J. Clean. Prod. 2024, 434, 140437. [Google Scholar] [CrossRef]
- International Sustainable Systems Research Center (ISSRC). IVE Model Users Manual Version 2.0; International Sustainable Systems Research Center: La Habra, CA, USA, 2008. [Google Scholar]
- Wei, Y.; Yu, Y.; Xu, L.; Huang, W.; Guo, J.; Wan, Y.; Cao, J. Vehicle emission computation through microscopic traffic simulation calibrated using genetic algorithm. J. Artif. Intell. Soft Comput. Res. 2019, 9, 67–80. [Google Scholar] [CrossRef]
- International Sustainable Systems Research Center (ISSRC) Website. Available online: http://www.issrc.org/ive/downloads/manuals/AttachC_DA.pdf (accessed on 10 May 2023).
- Awad, O.I.; Ma, X.; Kamil, M.; Ali, O.M.; Zhang, Z.; Shuai, S. Particulate emissions from gasoline direct injection engines: A review of how current emission regulations are being met by automobile manufacturers. Sci. Total Environ. 2020, 718, 137302. [Google Scholar] [CrossRef] [PubMed]
- Hooftman, N.; Messagie, M.; Van Mierlo, J.; Coosemans, T. A review of the European passenger car regulations–Real driving emissions vs local air quality. Renew. Sustain. Energy Rev. 2018, 86, 1–21. [Google Scholar] [CrossRef]
- Cheewaphongphan, P.; Hanaoka, T.; Chatani, S. Long-term trend of regional passenger road transport demand and emission estimation under exhaust emission regulation scenario in Thailand. Environ. Res. Commun. 2020, 2, 051009. [Google Scholar] [CrossRef]
- Pollution Control Department (PCD) Website. Available online: https://www.pcd.go.th/wp-content/uploads/2020/06/pcdnew-2020-06-05_03-22-03_837433.pdf (accessed on 10 September 2023).
- Dutta, A.; Chavalparit, O. Assessment of health burden due to the emissions of fine particulate matter from motor vehicles: A case of Nakhon Ratchasima province, Thailand. Sci. Total Environ. 2023, 872, 162128. [Google Scholar] [CrossRef] [PubMed]
- Ministry of Transport Website. Available online: https://web.dlt.go.th/statistics/ (accessed on 15 April 2023).
- Pongthanaisawan, J.; Sorapipatana, C. Relationship between level of economic development and motorcycle and car ownerships and their impacts on fuel consumption and greenhouse gas emission in Thailand. Renew. Sustain. Energy Rev. 2010, 14, 2966–2975. [Google Scholar] [CrossRef]
- Prabnasak, J.; Taylor, M.A.P.; YUE, W.L. An Investigation of Vehicle Ownership and the Effects of Income and Vehicle Expenses in Mid-Sized City of Thailand. In Proceedings of the 9th International Conference of Eastern Asia Society for Transportation Studies, Jeju, Republic of Korea, 20–23 June 2011; Volume 8. [Google Scholar] [CrossRef]
- Thaithatkul, P.; Chalermpong, S.; Laosinwattana, W.; Liang, J.; Kato, H. The relationship between RHA use and car purchases: Trends emerging in Bangkok, Thailand. Asian Transp. Stud. 2023, 9, 100095. [Google Scholar] [CrossRef]
- Giraldo, M.; Huertas, J.I. Real emissions, driving patterns and fuel consumption of in-use diesel buses operating at high altitude. Transp. Res. D Trans. Environ. 2019, 77, 21–36. [Google Scholar] [CrossRef]
- Lois, D.; Wang, Y.; Boggio-Marzet, A.; Monzon, A. Multivariate analysis of fuel consumption related to eco-driving: Interaction of driving patterns and external factors. Transp. Res. D Trans. Environ. 2019, 72, 232–242. [Google Scholar] [CrossRef]
- The Intelligent Traffic Information Center Foundation (iTIC) Website. Available online: https://itic.longdo.com/averagespeed (accessed on 5 September 2023).
- de Oliveira, A.; Bernardes, A.P.; Ferreira, F. Reduction of a Diesel Engine NO Emissions Using the Exhaust Gas Recirculation Technique; SAE Technical Paper, No. 2019-36-0067; SAE: Brasilia, Brazil, 2020. [Google Scholar] [CrossRef]
- TIS.2560-2554; Exhaust Emissions from Motor Vehicles: Test Method. The Thai Industrial Standards Institute (TISI) Department, Ministry of Industry: Bangkok, Thailand, 2012.
- Pollution Control Department (PCD) Website. Available online: https://www.pcd.go.th/wp-content/uploads/2021/02/pcdnew-2021-02-18_08-03-46_086635.pdf (accessed on 17 October 2023).
- Zhao, P.; Tian, B.S.; Yang, Q.; Zhang, S. Influencing Factors and Their Spatial–Temporal Heterogeneity of Urban Transport Carbon Emissions in China. Energies 2024, 17, 756. [Google Scholar] [CrossRef]
- Office of Transport and Traffic Policy and Planning (OTP) Website. Available online: https://www.otp.go.th/uploads/tiny_uploads/PDF/2562-04/25620314-NDCPlan.pdf (accessed on 5 September 2023).
- Kwan, S.K.; Zakaria, S.B.; Ibrahim, M.F.; Mahiyuddin, W.R.W.; Sofwan, N.M.; Wahab, M.I.A.; Ahmad, R.D.R.; Abbas, A.R.; Woon, W.K.; Sahani, M. Health impacts from TRAPs and carbon emissions in the projected electric vehicle growth and energy generation mix scenarios in Malaysia. Environ. Res. 2023, 216, 114524. [Google Scholar] [CrossRef] [PubMed]
- Aiello, G.; Quaranta, S.; Inguanta, R.; Certa, A.; Venticinque, M. A Multi-Criteria Decision-Making Framework for Zero Emission Vehicle Fleet Renewal Considering Lifecycle and Scenario Uncertainty. Energies 2024, 17, 1371. [Google Scholar] [CrossRef]
- Thanatrakolsri, P.; Siritian, D.; Pongpan, S. Evaluation of Greenhouse Gas Emissions from Motor Vehicles in Bangkok, Thailand. BUSCIJ 2023, 28, 223–247. [Google Scholar]
- Huy, L.N.; Oanh, N.T.K.; Htut, T.T.; Hlaing, O.M.T. Emission inventory for on-road traffic fleets in Greater Yangon, Myanmar. Atmos. Pollut. Res. 2020, 11, 702–713. [Google Scholar] [CrossRef]
- Gong, M.; Yin, S.; Gu, X.; Xu, Y.; Jiang, N.; Zhang, R. Refined 2013-based vehicle emission inventory and its spatial and temporal characteristics in Zhengzhou, China. Sci. Total Environ. 2017, 599, 1149–1159. [Google Scholar] [CrossRef] [PubMed]
- Yang, W.; Yu, C.; Yuan, W.; Wu, X.; Zhang, W.; Wang, X. (2018). High-resolution vehicle emission inventory and emission control policy scenario analysis, a case in the Beijing-Tianjin-Hebei (BTH) region, China. J. Clean. Prod. 2018, 203, 530–539. [Google Scholar] [CrossRef]
- Gao, C.; Gao, C.; Song, K.; Xing, Y.; Chen, W. Vehicle emissions inventory in high spatial–temporal resolution and emission reduction strategy in Harbin-Changchun Megalopolis. Process Saf. Environ. Prot. 2020, 138, 236–245. [Google Scholar] [CrossRef]
- Office of Transport and Traffic Policy and Planning (OTP) Website. Available online: https://www.otp.go.th/uploads/tiny_uploads/ProjectOTP/2561/Project10/FinalReport.pdf (accessed on 20 December 2023).
- The board of investment of the prime minister (BOI) Website. Available online: https://www.boi.go.th/upload/content/PR20_2567EN.pdf (accessed on 29 February 2024).
- Wu, P.; Guo, F.; Cai, B.; Wang, C.; Lv, C.; Liu, H.; Huang, J.; Huang, Y.; Cao, L.; Pang, L.; et al. Co-benefits of peaking carbon dioxide emissions on air quality and health, a case of Guangzhou, China. J Environ Manag. 2021, 282, 111796. [Google Scholar] [CrossRef]
- Deng, H.M.; Liang, Q.M.; Liu, L.J.; Anadon, L.D. Co-benefits of greenhouse gas mitigation: A review and classification by type, mitigation sector, and geography. Environ. Res. Lett. 2018, 12, 123001. [Google Scholar] [CrossRef]
Figure 2.
The Bangkok driving cycle (345BKKDC): (a) truck and bus driving cycle; (b) passenger car and (c) motorcycle driving cycle; (d) van and pickup driving cycle.
Figure 2.
The Bangkok driving cycle (345BKKDC): (a) truck and bus driving cycle; (b) passenger car and (c) motorcycle driving cycle; (d) van and pickup driving cycle.
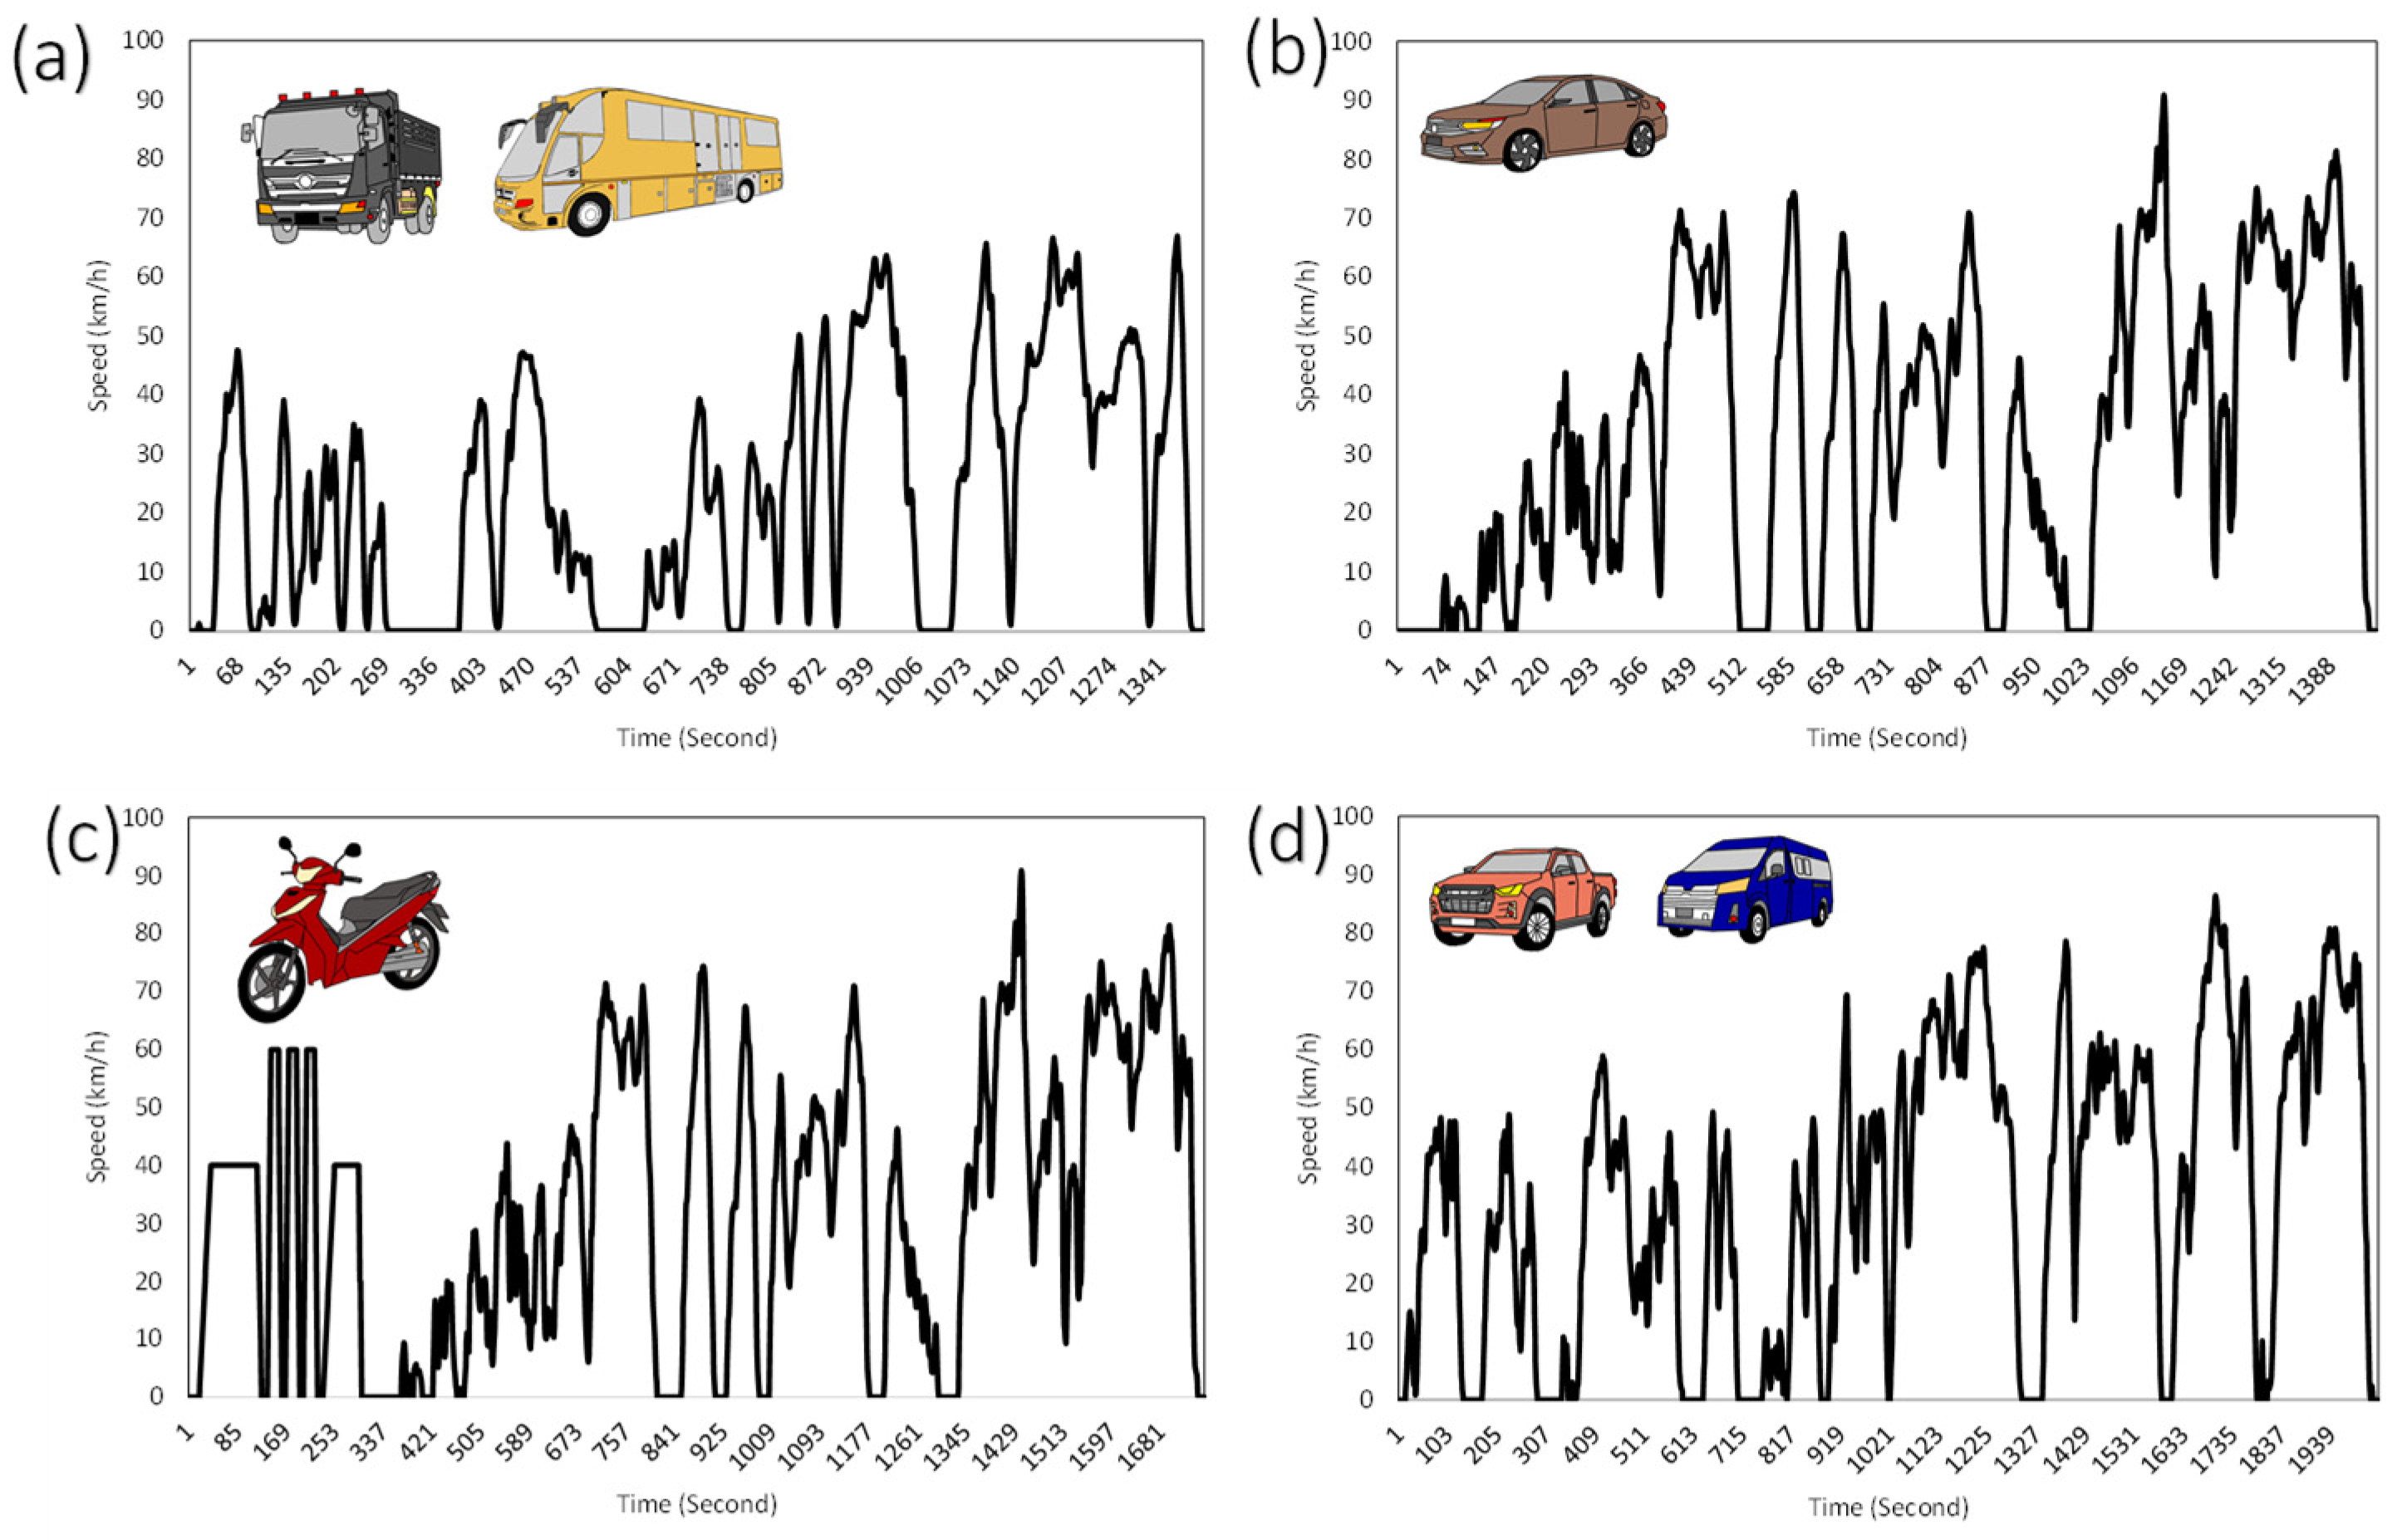
Figure 3.
The total number of vehicle types between 2019 and 2030 under the BAU scenario.
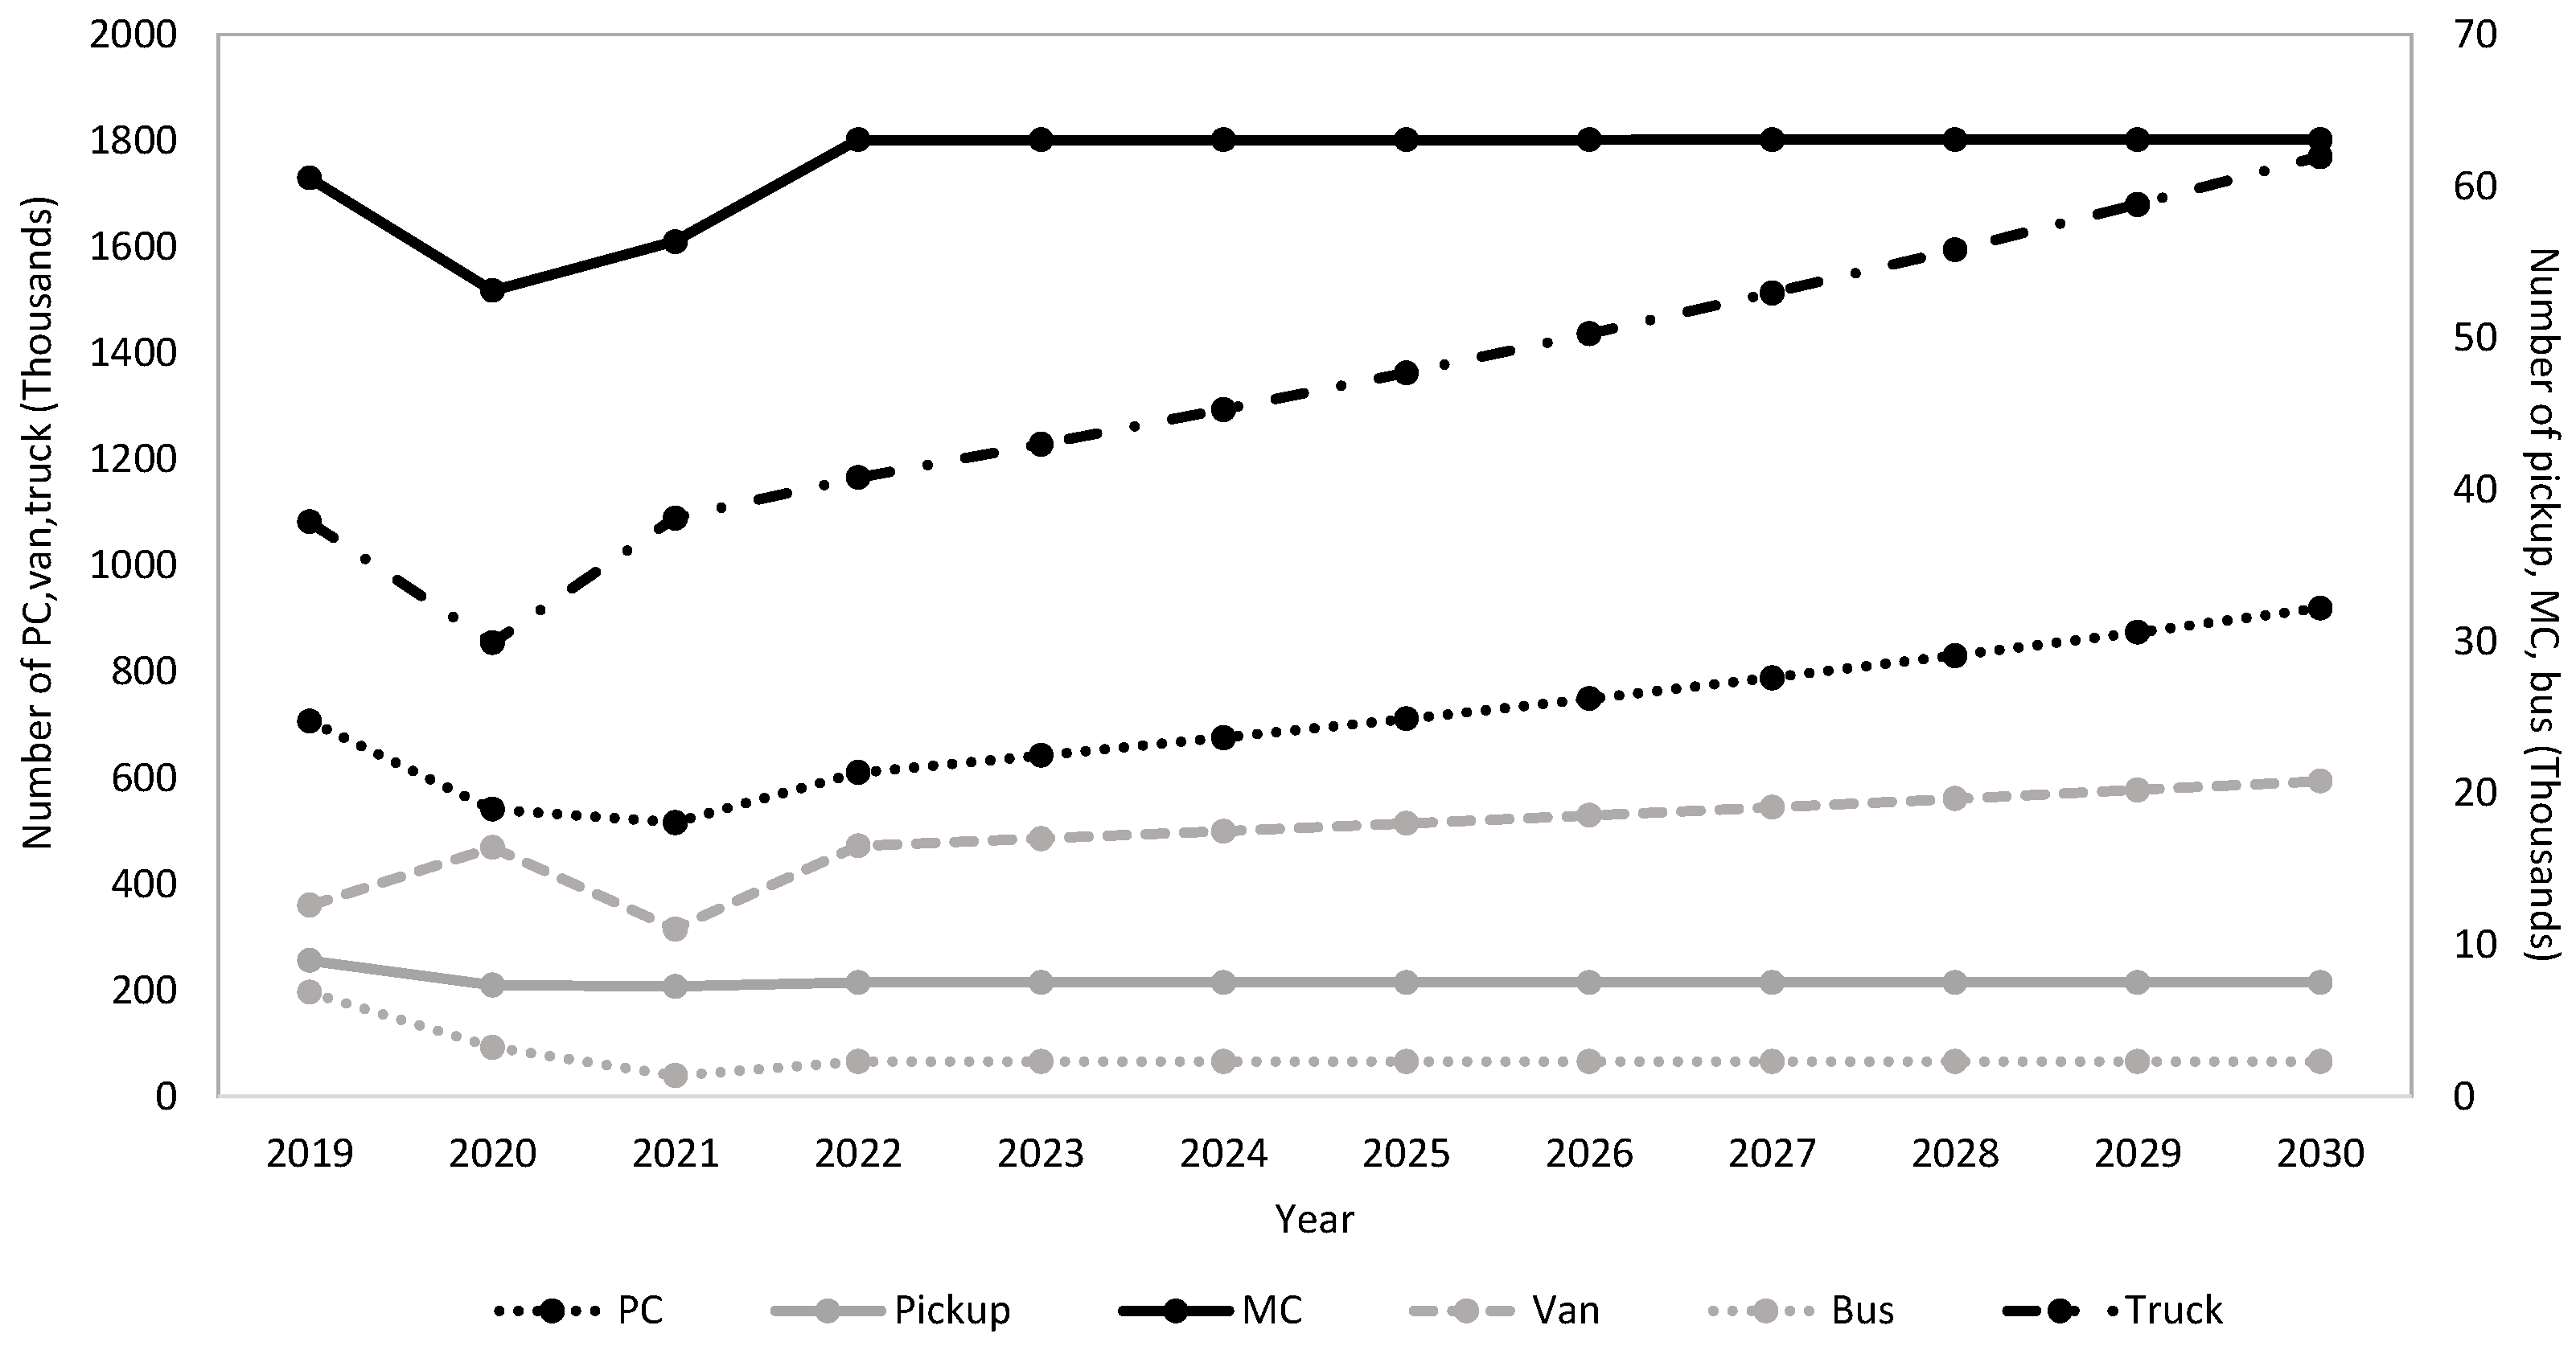
Figure 4.
Emissions of air pollutants and greenhouse gases under the passenger car scenarios from 2019 to 2030 include: (a) CO emissions; (b) NOx emissions; (c) SOx emissions; (d) PM10 emissions; (e) VOC emissions; (f) VOCevap emissions.
Figure 4.
Emissions of air pollutants and greenhouse gases under the passenger car scenarios from 2019 to 2030 include: (a) CO emissions; (b) NOx emissions; (c) SOx emissions; (d) PM10 emissions; (e) VOC emissions; (f) VOCevap emissions.
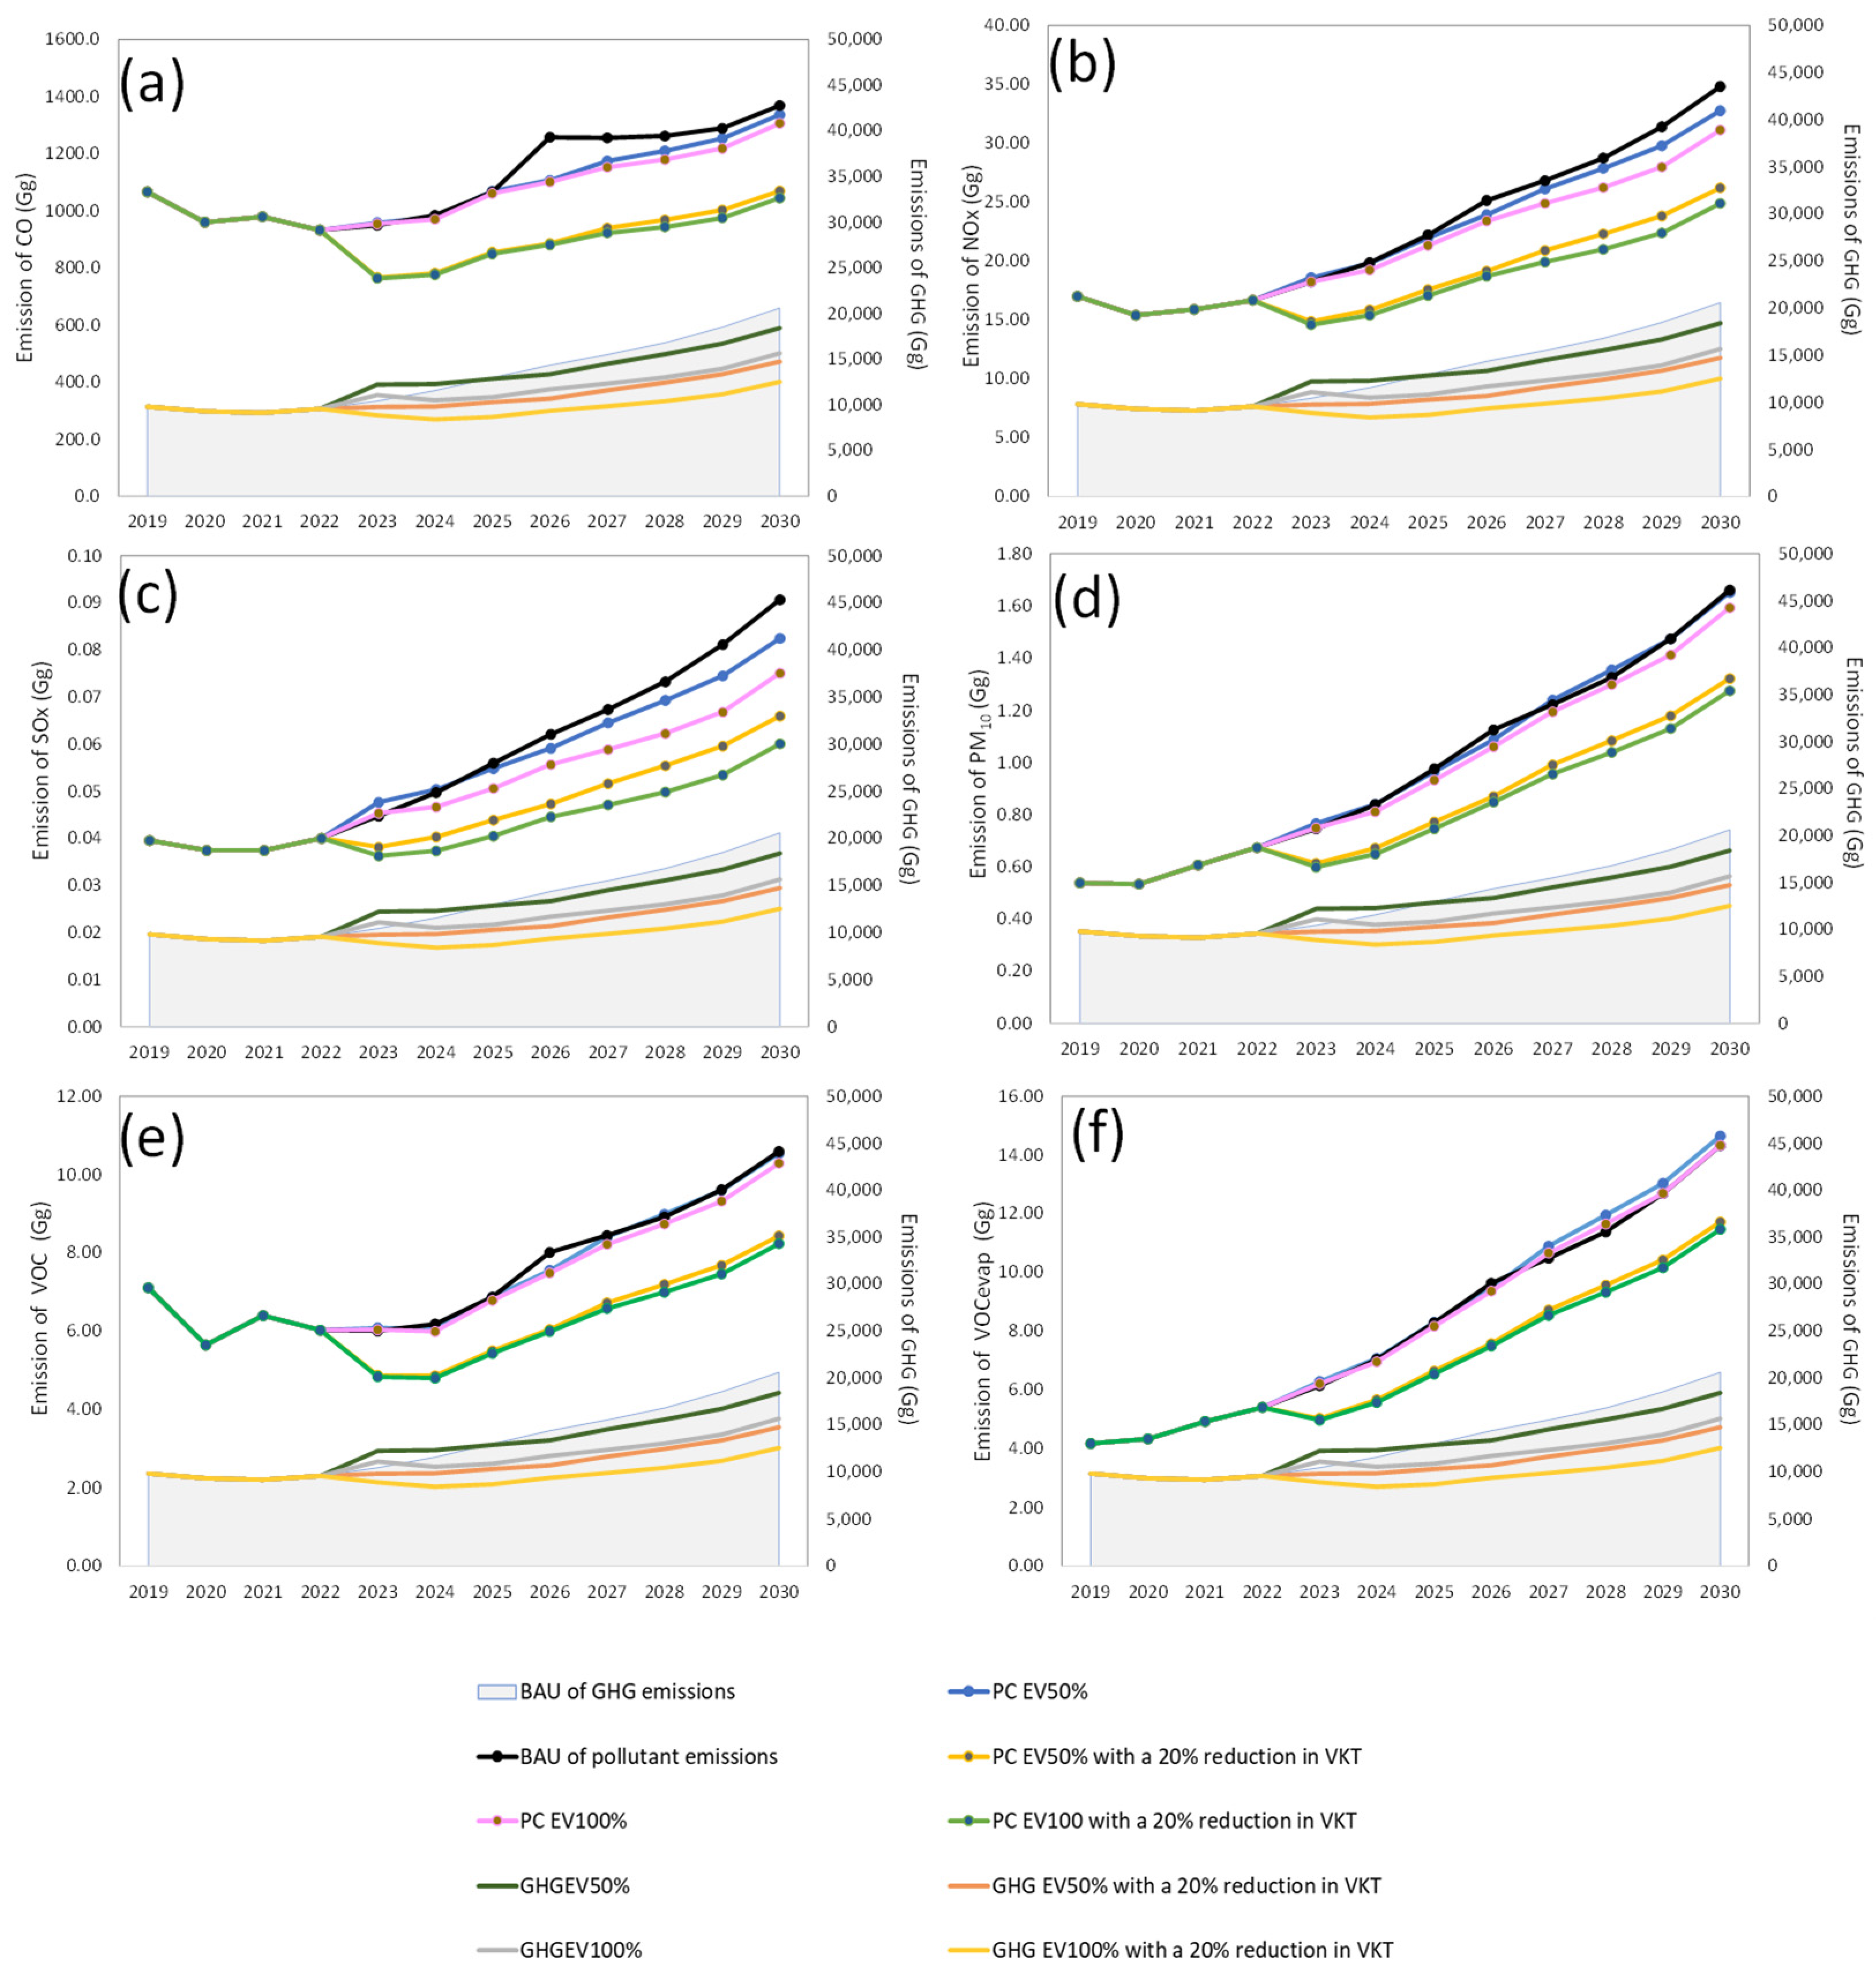
Figure 5.
Emissions of air pollutants and greenhouse gases under the bus scenarios from 2019 to 2030 include: (a) CO emissions; (b) NOx emissions; (c) SOx emissions; (d) PM10 emissions; (e) VOC emissions; (f) VOCevap emission.
Figure 5.
Emissions of air pollutants and greenhouse gases under the bus scenarios from 2019 to 2030 include: (a) CO emissions; (b) NOx emissions; (c) SOx emissions; (d) PM10 emissions; (e) VOC emissions; (f) VOCevap emission.

Table 1.
The fleet characteristics input to the IVE model for the base year (2019).
| Vehicle Type | Passenger Car | Van | Pick up | Motorcycle | Bus | Truck |
|---|---|---|---|---|---|---|
| 1. Fuel type | ||||||
| 61% | 7% | 3% | 100% | 3% | - |
| 29% | 86% | 94% | - | 78% | 77% |
| 2% | 3% | 1% | - | 17% | 3% |
| 7% | 4% | 2% | - | 2% | - |
| 1% | - | - | - | - | - |
| 2. Technology | ||||||
| 2.1 Exhaust | Euro 1-/3Way | Euro 1-/3Way | Euro 1-/3Way | Catalyst | Euro 2–3/3Way/EGR | Euro 2–3/3Way/EGR |
| 2.2 Air/fuel control | FI/MPFI/Carburettor | FI/MPFI/Carburettor | FI/MPFI/Carburettor | FI/Carburettor/4 cycle | FI/MPFI/Carburettor | FI/MPFI/Carburettor |
| 3. Vehicle size | Light/Medium | Medium | Medium | Medium | Medium | Medium |
Table 2.
The annual average mileage and the total mileage of passenger cars, motorcycles, vans, pickups, buses, and trucks in Thailand.
Table 2.
The annual average mileage and the total mileage of passenger cars, motorcycles, vans, pickups, buses, and trucks in Thailand.
| Vehicle Type | Annual Average VKT (Thousands of Kilometres) | N | Total VKT (2019) (Billions of Kilometres) |
|---|---|---|---|
| Passenger car | 23.98 | 747 | 210.93 |
| Motorcycle | 4.24 | 687 | 86.64 |
| Van and pickup | 26.85 | 559 | 7.20 (Van); 132.92 (Pickup) |
| Bus | 74.53 | 508 | 8.81 |
| Truck | 62.33 | 404 | 38.14 |
Table 3.
Emission factors for all vehicle categories in Thailand during the base year of 2019.
| Pollutant and GHG | Emission Factor (Unit) | Vehicle Type | |||||
|---|---|---|---|---|---|---|---|
| Passenger Car | Motorcycle | Van | Pickup | Bus | Truck | ||
| CO | g/start | 28.64 | 16.83 | 12.81 | 6.57 | 1.70 | 0.45 |
| g/km | 90.37 | 33.49 | 37.73 | 13.70 | 31.71 | 2.78 | |
| VOC | g/start | 1.75 | 3.98 | 0.48 | 0.32 | 0.06 | 0.04 |
| g/km | 0.63 | 1.73 | 0.22 | 0.10 | 0.64 | 0.30 | |
| VOCevap | g/start | 1.19 | 0.54 | 0.35 | 0.13 | 0.63 | 0.07 |
| g/km | 0.18 | 0.15 | 0.04 | 0.02 | 0.20 | 0.02 | |
| NOx | g/start | 1.05 | 0.78 | 0.57 | 0.38 | 0.76 | 0.70 |
| g/km | 1.30 | 0.32 | 5.59 | 5.93 | 6.96 | 6.12 | |
| SOx | g/start | 5.96 × 10⁻⁴ | 1.04 × 10⁻⁴ | 4.67 × 10⁻⁴ | 4.62 × 10⁻⁴ | 2.81 × 10⁻⁴ | 2.23 × 10⁻⁴ |
| g/km | 1.62 × 10⁻³ | 4.86 × 10⁻⁴ | 1.21 × 10⁻³ | 1.19 × 10⁻³ | 2.51 × 10⁻³ | 1.98 × 10⁻³ | |
| PM10 | g/start | 0.18 | 0.14 | 0.59 | 0.63 | 0.64 | 0.59 |
| g/km | 0.04 | 0.10 | 0.09 | 0.09 | 0.48 | 0.44 | |
| CO2 | g/start | 65.95 | 21.17 | 105.05 | 111.13 | 87.50 | 71.61 |
| g/km | 446.86 | 114.32 | 1590.40 | 1714.83 | 815.22 | 651.27 | |
| N2O | g/start | 0.04 | 3.34 × 10⁻³ | 0.03 | 0.03 | 0.06 | 0.05 |
| g/km | 0.01 | N.A. * | 0.01 | 0.01 | 0.07 | 0.08 | |
| CH4 | g/start | 0.66 | 0.85 | 0.63 | 0.16 | 0.04 | 0.01 |
| g/km | 0.50 | 0.57 | 0.67 | 0.15 | 0.54 | 0.08 | |
* N.A. = not applicable.
Table 4.
The emission inventory for conventional air pollutants and greenhouse gases in the base year (2019).
Table 4.
The emission inventory for conventional air pollutants and greenhouse gases in the base year (2019).
| Pollutants and Greenhouse Gas | Emissions (Gg) | |||||
|---|---|---|---|---|---|---|
| Passenger Car | Motorcycle | Van | Pickup | Bus | Truck | |
| CO | 1065.80 | 1192.80 | 4.61 | 18.94 | 15.57 | 20.89 |
| VOC | 7.10 | 52.42 | 0.05 | 0.87 | 0.89 | 4.01 |
| VOCevap | 4.16 | 3.46 | 0.01 | 0.02 | 0.20 | 0.02 |
| NOx | 17.00 | 10.59 | 7.29 | 171.08 | 17.76 | 80.39 |
| SOx | 0.04 | 0.02 | 1.41 × 10⁻³ | 0.03 | 0.01 | 0.03 |
| PM10 | 0.54 | 3.19 | 0.12 | 2.69 | 1.38 | 6.47 |
| CO2 | 9672.55 | 3893.96 | 2029.32 | 46,707.89 | 1859.68 | 8397.76 |
| N2O | 0.25 | 2.96 × 10⁻⁵ | 0.01 | 0.26 | 0.14 | 0.77 |
| CH4 | 2.16 | 16.77 | 0.08 | 0.09 | 0.56 | 0.07 |
Table 5.
GHG emissions reduction (%) of passenger car and bus scenarios from 2023 to 2030.
| Pollutant and GHG | Passenger Car Scenarios (A) (% Reduction) | Bus Scenarios (B) (% Reduction) | (A) and (B) (% Reduction) | ||||
|---|---|---|---|---|---|---|---|
| (1) EV 50% | (2) EV 50% with a 20% Reduction in VKT | (3) EV 100% | (4) EV 100 with a 20% Reduction in VKT | (5) EV 50% | (6) EV 100% | (4) + (6) | |
| CO | 0.31–5.44 | 8.23–13.41 | 0.59–5.64 | 8.37–13.57 | 0.07–0.10 | 0.13–0.23 | 8.48–13.65 |
| VOC | 0.02–0.64 | 1.89–2.73 | 0.13–0.73 | 1.95–2.81 | 0.58–0.95 | 0.71–1.06 | 2.90–3.52 |
| VOCevap | 0–1.05 | 9.45–12.92 | 0.71–1.72 | 10.72–13.46 | 0.02–0.11 | 0.06–0.45 | 10.87–13.54 |
| NOx | 0.02–0.52 | 1.12–2.27 | 0.20–1.02 | 1.21–2.70 | 2.74–4.10 | 3.17–4.38 | 5.09–6.06 |
| SOx | 0.69–3.51 | 4.80–10.52 | 2.05–6.64 | 6.16–13.03 | 1.29–2.53 | 2.26–3.77 | 8.71–14.41 |
| PM10 | 0.03–0.18 | 0.80–1.13 | 0.11–0.30 | 0.88–1.49 | 3.12–5.69 | 3.54–5.97 | 4.70–6.58 |
| GHG | 0.14–2.65 | 0.96–7.12 | 1.45–5.99 | 2.26–9.79 | 1.22–1.67 | 1.32–1.67 | 3.93–11.11 |
Disclaimer/Publisher’s Note: The statements, opinions and data contained in all publications are solely those of the individual author(s) and contributor(s) and not of MDPI and/or the editor(s). MDPI and/or the editor(s) disclaim responsibility for any injury to people or property resulting from any ideas, methods, instructions or products referred to in the content. |
© 2024 by the authors. Licensee MDPI, Basel, Switzerland. This article is an open access article distributed under the terms and conditions of the Creative Commons Attribution (CC BY) license (https://creativecommons.org/licenses/by/4.0/).
Share and Cite
MDPI and ACS Style
Thanatrakolsri, P.; Sirithian, D. Assessing the Additional Benefits of Thailand’s Approaches to Reduce Motor Vehicle Emissions. Energies 2024, 17, 2336. https://doi.org/10.3390/en17102336
AMA Style
Thanatrakolsri P, Sirithian D. Assessing the Additional Benefits of Thailand’s Approaches to Reduce Motor Vehicle Emissions. Energies. 2024; 17(10):2336. https://doi.org/10.3390/en17102336
Chicago/Turabian StyleThanatrakolsri, Pantitcha, and Duanpen Sirithian. 2024. "Assessing the Additional Benefits of Thailand’s Approaches to Reduce Motor Vehicle Emissions" Energies 17, no. 10: 2336. https://doi.org/10.3390/en17102336
Note that from the first issue of 2016, this journal uses article numbers instead of page numbers. See further details here.