Article

Using Transfer Learning and XGBoost for Early Detection of Fires in Offshore Wind Turbine Units

1
Department of Mechanical Engineering, Hangzhou City University, Hangzhou 310015, China
2
Huadian Electric Power Research Institute, Hangzhou 310030, China
3
School of Civil Engineering, Southwest Jiaotong University, Chengdu 610031, China
4
Guangdong Huadian Fuxin Yangjiang Offshore Wind Power Co., Ltd., Yangjiang 529500, China
*
Authors to whom correspondence should be addressed.
Energies 2024, 17(10), 2330; https://doi.org/10.3390/en17102330
Submission received: 14 January 2024 / Revised: 14 April 2024 / Accepted: 1 May 2024 / Published: 11 May 2024
(This article belongs to the Section A3: Wind, Wave and Tidal Energy)

Abstract

:
To improve the power generation efficiency of offshore wind turbines and address the problem of high fire monitoring and warning costs, we propose a data-driven fire warning method based on transfer learning for wind turbines in this paper. This paper processes wind turbine operation data in a SCADA system. It uses an extreme gradient-boosting tree (XGBoost) algorithm to build an offshore wind turbine unit fire warning model with a multiparameter prediction function. This paper selects some parameters from the dataset as input variables for the model, with average cabin temperature, average outdoor temperature, average cabin humidity, and average atmospheric humidity as output variables. This paper analyzes the distribution information of input and output variables and their correlation, analyzes the predicted difference, and then provides an early warning for wind turbine fires. This paper uses this fire warning model to transfer learning to different models of offshore wind turbines in the same wind farm to achieve fire warning. The experimental results show that the prediction performance of the multiparameter is accurate, with an average MAPE of 0.016 and an average RMSE of 0.795. It is better than the average MAPE (0.051) and the average RMSE (2.020) of the prediction performance of a backpropagation (BP) neural network, as well as the average MAPE (0.030) and the average RMSE (1.301) of the prediction performance of random forest. The transfer learning model has good prediction performance, with an average MAPE of 0.022 and an average RMSE of 1.469.

1. Introduction

Energy conservation and emission reduction have become important issues in social development [1]. As the largest energy consumer in the world, China is optimizing its energy structure and upgrading its energy industry following the “two-carbon” policy. Therefore, it is imperative to vigorously develop and use sustainable new energy sources [2]. As a kind of new energy, wind power has become an important part of new energy development due to its green, pollution-free, and sustainable nature [3]. As the largest wind power country in the world, China’s onshore wind power has developed rapidly, but the development of offshore wind power is still in the initial stage [4]. Due to the decreasing availability of onshore wind energy resources and the higher utilization rate of offshore wind power facilities compared with onshore wind power, the power generation of offshore wind turbines is 20–40% higher than that of onshore wind turbines [5]. Therefore, the study of offshore wind power is urgent. The global installed capacity of wind turbines is growing at an annual rate of 20–30% [6]. Offshore wind turbines are also developing in the direction of large-scale grids, and the probability of failure has correspondingly increased [7]. Although the wind power industry in China is developing rapidly, the fault monitoring and early warning of offshore wind power units are weak points in the research [8], especially the fire warning research of wind power units [9]. Wind farms are usually located in areas with good ventilation and abundant wind resources. Once a fire breaks out, it will spread quickly. Compared with onshore wind farms, offshore wind farms are mostly located in remote coastal areas, and some offshore wind farms are even situated tens of kilometers away from the coast, with extremely inconvenient traffic, which is not conducive to timely firefighting and disaster protection for wind turbines. The fire accident rate of wind turbines has also gradually increased in recent years, becoming the second largest disaster after lightning strikes [10]. Due to difficulties in firefighting, multiple fire hazards, and complex fire types in wind turbines, once a wind turbine catches fire, it will cause the loss of the whole unit, which easily causes great economic losses, and the rescue possibility is almost zero [11]. In addition, due to the complexity of the operating conditions of offshore wind turbines and the severity of the operating environment [12], the main fire-extinguishing agents and water mist technology used at present are limited and cannot achieve good fire control effects [13]. Therefore, a fire warning for offshore wind turbines is crucial to protecting the security of on-site staff and the safe operation of the wind turbines. Kim et al. [14] proposed using a vacuum circuit breaker, a vacuum interrupter combined with the main circuit breaker, and a vacuum degree change analysis method of partial discharge to monitor and control overcurrent in real time to prevent fire caused by overcurrent in wind turbines. This method can warn of fires caused by overcurrent, but it has difficulty warning of other types. Sun et al. [15] used Fourier transform infrared spectroscopy to analyze the effect of functional group changes in hydraulic oil, gear oil, and transformer oil on temperature during wind turbine operation to provide early warnings of fire. However, an entire wind turbine has not been studied. However, it is challenging to provide early warnings of fires caused by other factors using this method. Chen et al. [16] made a quantitative analysis of the importance of factors affecting wind turbine cabin fires and proposed methods to improve the safety of wind turbine cabins. However, some factors (such as inappropriate laws and regulations, low technical levels, and illegal operations) are difficult to analyze quantitatively, and these factors can be eliminated. To provide early warnings of fires in wind turbines, it is necessary to analyze all of the operation data of wind turbines. However, traditional data analysis cannot effectively process such huge amounts of data [17]. Therefore, a machine learning algorithm [18] is introduced to process, analyze, and predict wind turbine operation data. Thus, a wind turbine unit fire can be predicted. Ma et al. [19] used the XGBoost model to predict outdoor air temperature and humidity. This model had great prediction performance, with an R2_score > 0.73 and an RMSE < 1.77 for an outdoor air temperature prediction model and an R2_score > 0.81 and an RMSE < 6.33 for an air humidity prediction model. However, indoor air temperature and humidity could not be predicted, so the effect of indoor and outdoor temperature and humidity cannot be comprehensively judged. Trizoglou et al. [20] used the XGBoost model and the LSTM model to predict wind turbine gearbox temperature, generator internal air temperature, and generator stator temperature; the average MAE of the temperature prediction of the LSTM model was 2.75, and the average MAE of the temperature prediction of the XGBoost model was 0.31, indicating that the prediction performance of the model was great. The prediction performance of the XGBoost model was better than that of the LSTM model. Kaligambe et al. [21] used the XGBoost model to predict indoor temperature and relative humidity. The RMSE of the temperature and humidity prediction model were 0.3 and 2.7, and the MAPE of the temperature and humidity prediction model were 0.7% and 2.6%, which showed that the models had excellent prediction performance. However, they only predicted indoor and relative humidity without predicting outdoor temperature and humidity. Thus, they have difficulty judging indoor and outdoor temperature and humidity changes comprehensively.
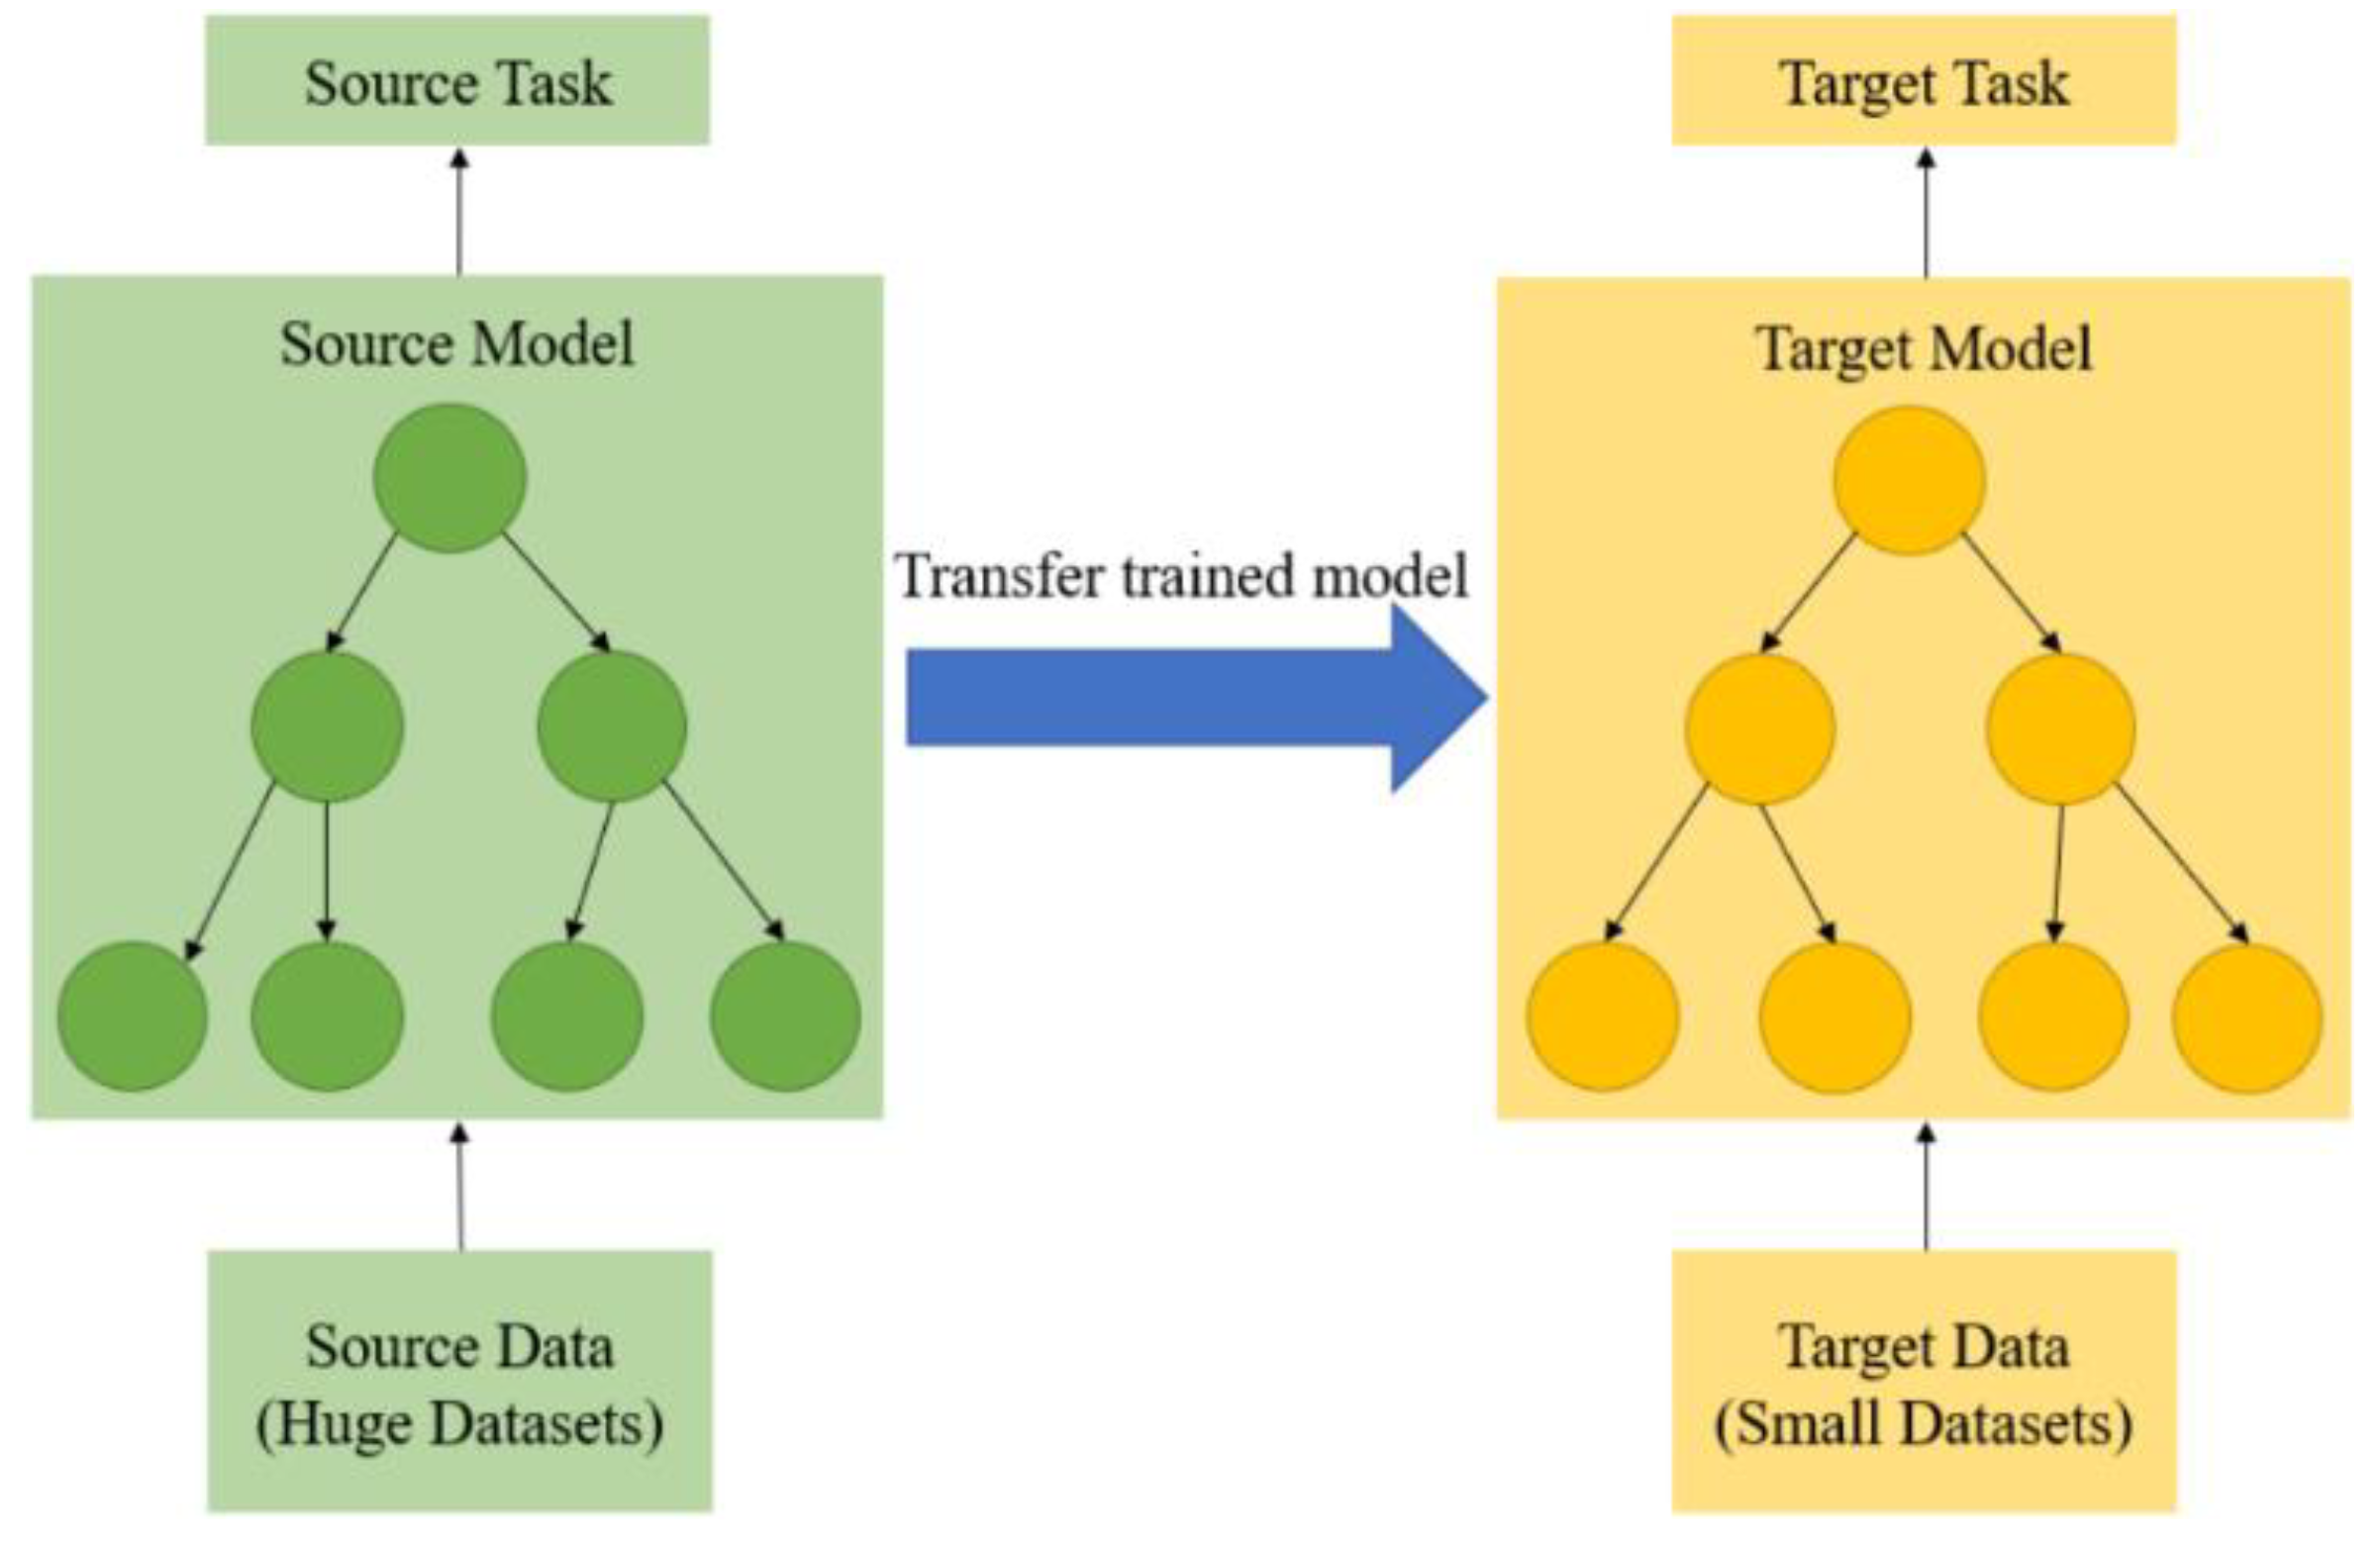
In addition, due to the wide variety and large number of offshore wind turbines, if separate model designs, data processing, and feature prediction are carried out for each wind turbine to provide early warnings of fires, the implementation cost may be very high [22]. Moreover, historical operation data for some newly installed wind turbines may be limited or unavailable [23], making it difficult to train a model with reliable prediction performance for fire early warning. Therefore, transfer learning [24] is introduced to carry out fire warnings for different numbers and types of wind turbines. Guo et al. [25] used XGBoost and transfer learning to predict the effect of antenna assembly error on gain, and the results showed that the prediction performance was better than that of the ANN and SVM models. Tang et al. [26] used XGBoost to predict photovoltaic power based on transfer learning. They analyzed the similarity between different and target prediction models to carry out mobility analysis and selected models with high similarity for transfer learning. The results showed that this model improves the prediction accuracy of photovoltaic power generation. Liu et al. [27] used XGBoost and transfer learning methods to predict water absorption based on jointly distributed adaptation. The experimental results showed that transfer learning and XGBoost can be used to predict water absorption. Yang et al. [
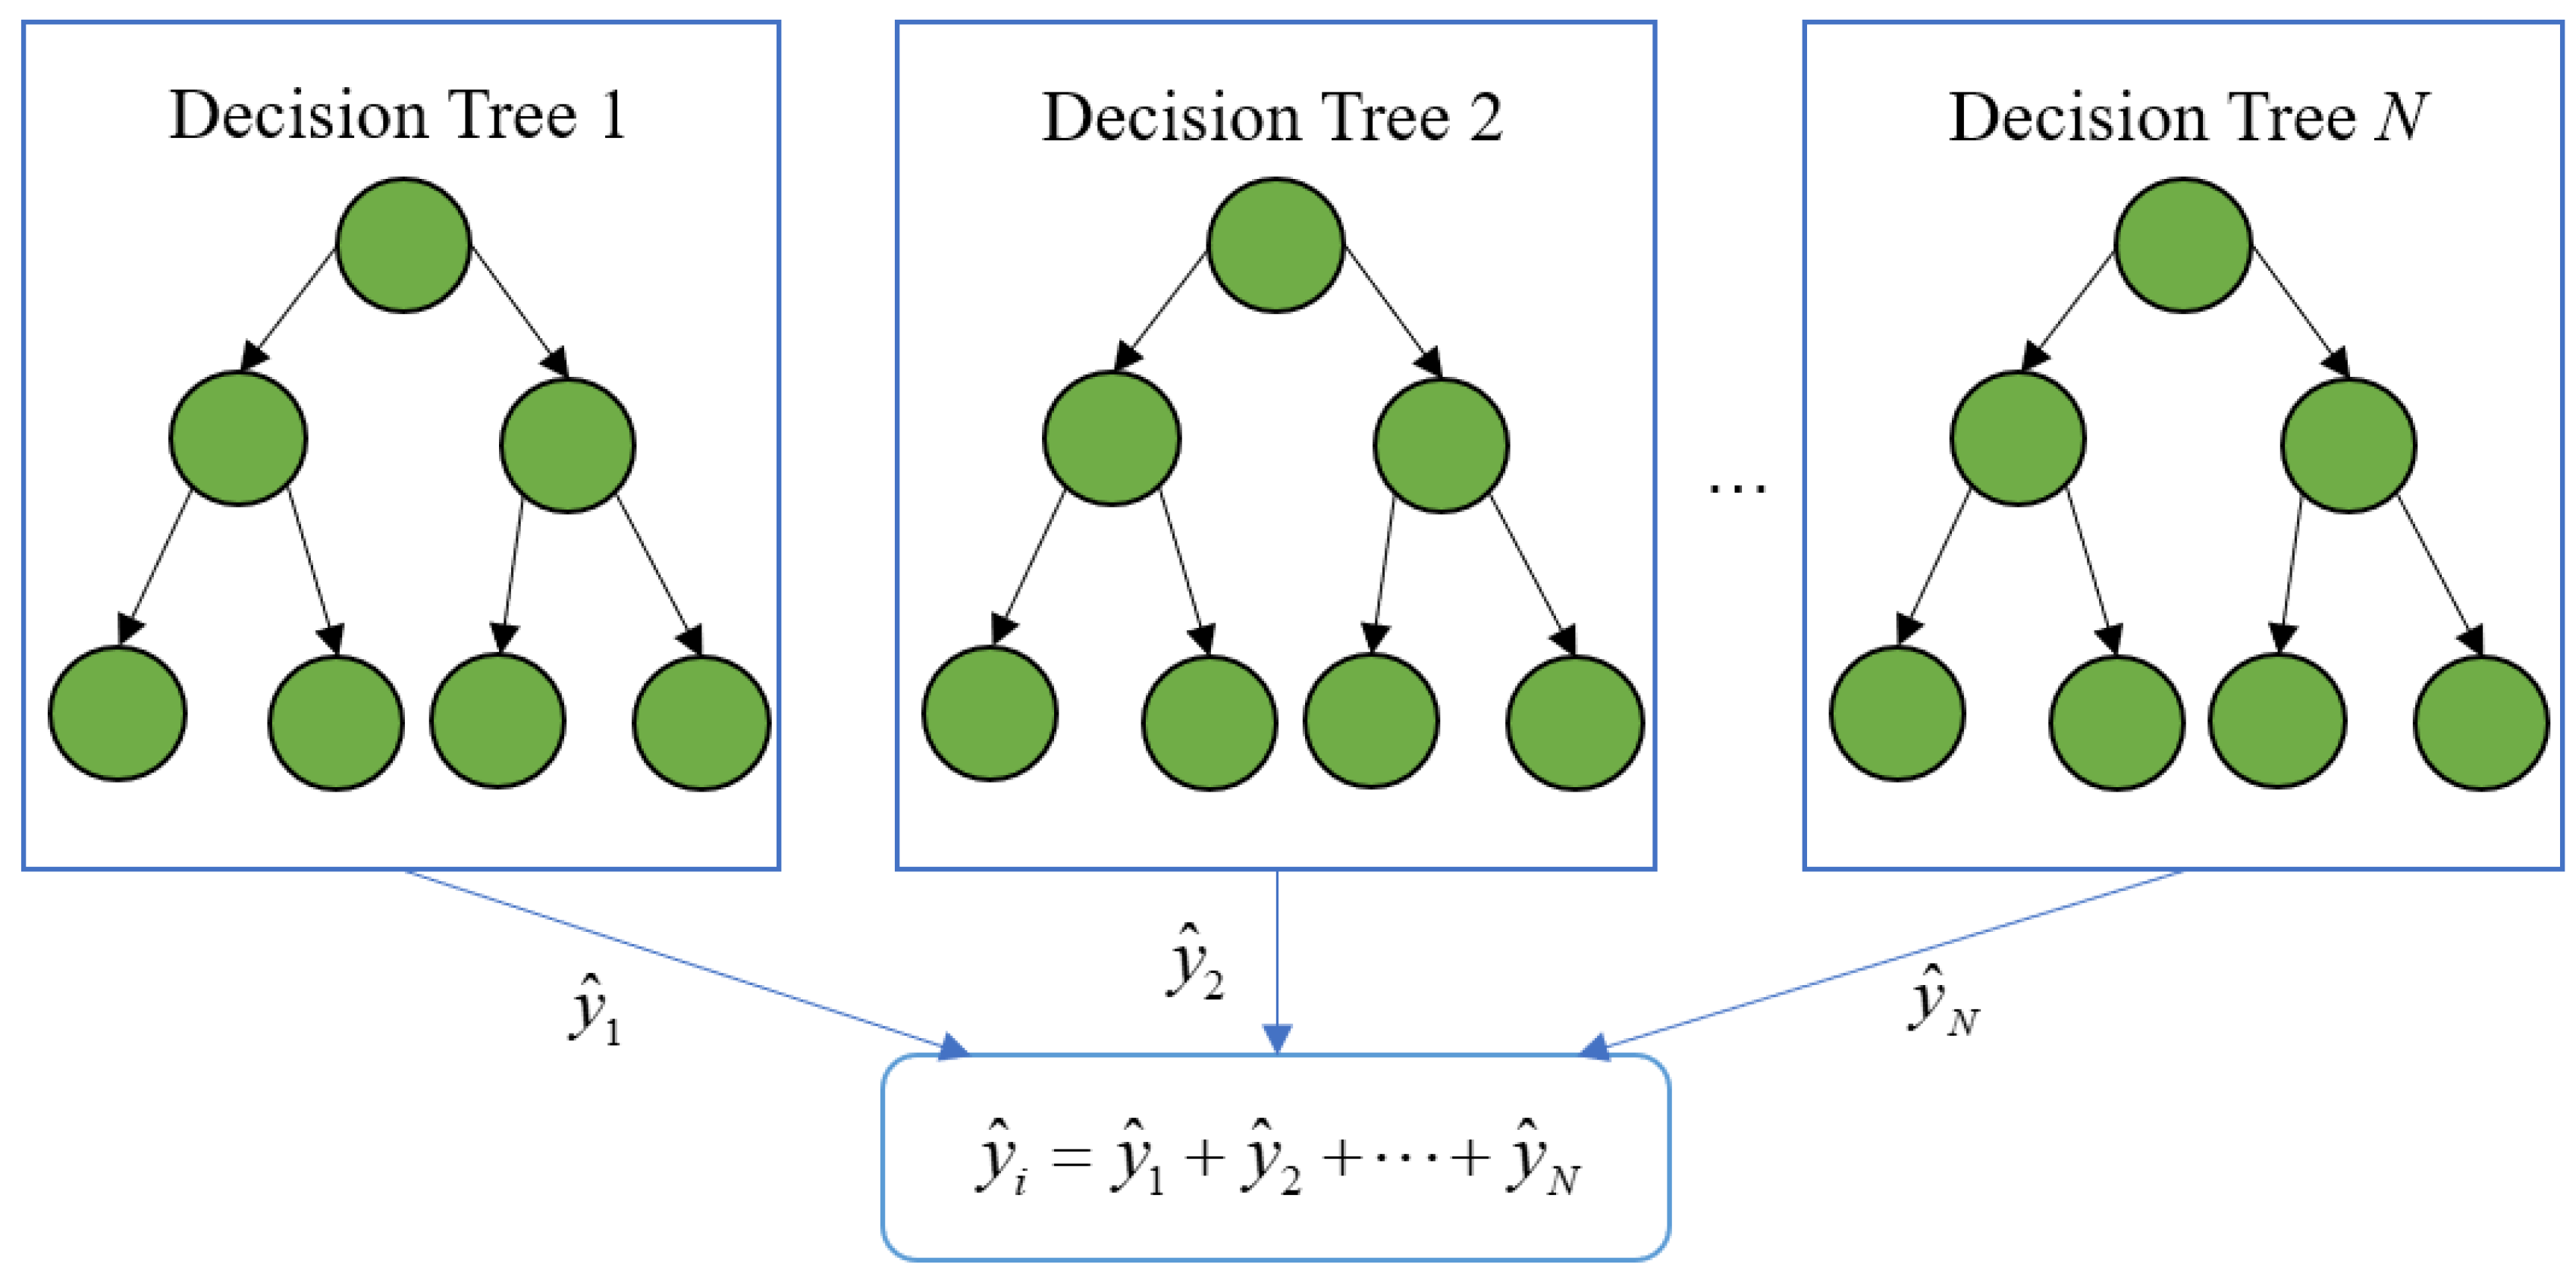
28] predicted the short-term loads in data-poor regions based on transfer learning and XGBoost. The experimental results showed that transfer learning can significantly reduce prediction error and improve prediction accuracy. In view of the above situations, this paper proposes an offshore wind turbine unit fire warning model based on XGBoost [29] and transfer learning. We predict the average cabin temperature, average outdoor temperature, average cabin humidity, and average atmospheric humidity of one particular wind turbine unit by constructing different XGBoost prediction models, which can not only quantitatively analyze the factors affecting fires in a wind turbine unit but can also conduct fire analysis on the entire wind turbine unit. Then, the prediction models are transferred to other types of units, and the prediction performance of the transfer learning models is analyzed to complete a fire warning system for wind turbine units.

2. Boosting Fire Warnings for Offshore Wind Turbines

2.1. Principles of the XGBoost Model

The XGBoost model is an improved boosting algorithm based on a gradient-boosting decision tree (GBDT) [30] that sets several weak classifiers to form a strong classifier with a better learning ability. A regularization term is introduced to make the trained model less easy to overfit. The first and second derivatives of the loss function are introduced for optimization, and parallel computation is supported. A structure diagram of the XGBoost model is shown in Figure 1.
Since the XGBoost model is theoretically an ensemble learning model, the overall prediction result for a feature parameter is the integration of each tree prediction result, and the integration function is shown in Equation (1).
y ^ i = k = 1 K f k ( x i ) , f k F
In Equation (1), i represents the i-th sample in the dataset; y ^ i is the predicted value of the i-th sample; x i ,   k represents the total number of trees in the model; k is the index for each individual tree; f k is the k-th regression tree; and f k ( x i ) represents the score of the i-th sample in the k-th tree. XGBoost is a model formed by accumulating k sub-models, and the predicted results are obtained through its objective function. The objective function is shown in Equation (2).
O b j = i = 1 n l ( y i , y ^ i ) + k = 1 K Ω ( f k )
In Equation (2), O b j is the objective function, i is the i-th sample in the dataset, y i is the measured value of the i-th sample, y ^ i is the predicted value of the i-th sample, l ( y i , y ^ i ) is the loss function, and Ω ( f k ) is the regularization term. As shown in Equation (2), the objective function consists of two parts, namely, the loss function [31] and the regularization term [32]. The first term, l ( y i , y ^ i ) , represents the loss function, which is used to evaluate the difference between the predicted and measured values of the model. The loss function used in this paper is the squared loss function, which is shown in Equation (3).
l ( y i , y ^ i ) = ( y i y ^ i ) 2
The second term, Ω ( f k ) , represents the regularization term, which can reduce the complexity of the model and the probability of overfitting. In this paper, it means tree pruning. During the construction of the model, the regularization results of all k trees will be accumulated and summed, and the accumulated results will be used as the regularization term for the objective function, as shown in Equation (4).
Ω ( f k ) = γ T + 1 2 λ ω 2
In Equation (4), T is the number of leaf nodes in the decision tree, and ω represents each leaf node’s score and defines regularization parameters. As seen above, the objective function of the XGBoost model obtained from the t-th learning is shown in Equation (5).
O b j ( t ) = i = 1 n l [ y i , y ^ i ( t 1 ) + f t ( x i ) ] + Ω ( f t ) + C
In Equation (5), O b j t is the objective function of the model obtained from the t-th learning; Ω f t is the regularization term of the model during the t-th learning; y i is the measured value of the i-th sample; y ^ i ( t 1 ) + f t ( x i ) is the predicted value of the model for the i-th sample, x i , during the t-th learning; and C is a constant. During the model training process, the decision tree [33] grows from the root and divides the node into left and right leaf nodes based on the conditions in the node. The weight of the original leaf node is then distributed to the left and right nodes according to the node’s rules, and the gain brought by the new split node to the loss function is calculated. The gain function formula is shown in Equation (6).
G a i n = O b j ( L + R ) ( O b j L + O b j R )
In Equation (6), G a i n is the gain function, O b j L is the objective function of left leaf node prediction, O b j R is the objective function of right leaf node prediction, and O b j L + R is the objective function of parent node prediction. Then, the above steps are repeated to evaluate the potential split nodes for all the characteristic parameters. The XGBoost model incorporates several mechanisms to prevent overfitting and limit the complexity of the generated trees. The tree stops growing when one of the following conditions is met: (1) the gain value is less than 0, indicating that further splitting does not improve the objective function; (2) the depth of the tree reaches the preset maximum depth; or (3) the number of samples in a leaf node falls below a specified threshold. These stopping criteria help to control the model’s complexity and prevent overfitting.

2.2. Transfer Learning Concept

Transfer learning is transferring some relevant knowledge from trained and learned tasks to the target task to improve the target task. Through this kind of learning, the dependence of the target task on data can be greatly reduced, and the training and learning of the target task can be completed. The concepts of target domain and source domain are essential in transfer learning. In the two types of domains, the target domain contains the relevant data of the target task, which are very limited and insufficient for completing the corresponding training. The source domain has all the data for the related task, and the data in this domain are sufficient. Obtaining operation data for equipment such as offshore wind turbines is difficult. By using the operation data of one wind turbine with sufficient data and XGBoost to build a model and conduct learning and training and then using the trained model to conduct fire warnings for other units, the accuracy of fire warnings for other units can be improved, and the cost of data acquisition can be reduced. The security of the wind turbine unit is also guaranteed. The idea of transfer learning is illustrated in Figure 2.

3. Fire Warning Methodology

3.1. Model Prediction Process

When offshore wind turbine units operate normally, their average cabin temperature, average outdoor temperature, average cabin humidity, and average atmospheric humidity are normal, but when the temperature increases or the humidity decreases, the probability of a fire occurring will increase. By predicting the four parameters of average cabin temperature, average outdoor temperature, average cabin humidity, and average atmospheric humidity and analyzing the difference between their predicted and measured values, early warnings of wind turbine unit fires can be provided. The trained model is then used to perform transfer learning on the data of other wind turbine units to provide fire warnings for other units. The fire warning flowchart is shown in Figure 3.
In this paper, we utilize data in the SCADA dataset for feature screening. First, we delete the feature parameters containing many zero and missing values. Then, we use the “3σ criterion” to deal with the outliers of the parameters to complete the data cleaning work. Afterward, we use the max–min normalization and the feature importance score to filter features and complete the data preprocessing work. We obtain the optimal model by adjusting the hyperparameters of the XGBoost model. We evaluate the model prediction results after the model prediction is completed. Then, we use a BP neural network and random forest to compare the prediction performance with XGBoost on dataset 1 to verify the superiority of the prediction method. We determine the alarm threshold of the offshore wind turbine unit based on error distribution analysis and complete a fire warning system for the offshore wind turbine unit. Finally, we use dataset 2 in the SCADA system as an input by transferring the trained offshore wind turbine unit, which is a 6.8 MW fire warning model, to the 8.3 MW offshore wind turbine unit to realize an 8.3 MW offshore wind turbine unit fire warning system and to test the performance of transfer learning model.

3.2. Model Tuning Methods

After the preprocessing step, the model reads the dataset and uses Python to split 70% of the dataset into the training set, with the remaining data being the prediction set. Then, we set hyperparameters in the XGBoost model that focus on influencing the performance of the model, and in this paper, we choose to adjust max_depth [34], learning_rate [35], and n_estimators [36] to obtain the model with the best prediction performance. Max_depth is the maximum depth of the decision tree, which can limit the maximum depth of the decision tree. Learning_rate is used to determine the speed of model learning. A higher learning rate will assign greater weight to the contribution of each tree in the set, which can accelerate training time. However, this may lead to overfitting, and a lower learning rate will reduce learning speed to improve the robustness of the decision tree. N_estimators are the number of weak classifiers, a parameter that estimates the model’s accuracy. Increasing the parameter can generate more trees but also increase the model’s complexity and the risk of overfitting.
In addition, we tune the hyperparameters of the XGBoost model using GridSearchCV [37]. GridSearchCV is a technique for exhaustive searches of specified parameter values for an estimator. It works by defining a grid of hyperparameter values and performing a thorough search of this grid to find the best combination of hyperparameters to maximize the model’s performance. GridSearchCV was chosen for this study due to its ability to systematically explore the hyperparameter space and identify the optimal combination of hyperparameters. Max_depth is searched in an interval of (5, 15) with a step size of 2; the learning_rate is searched in an interval of (0.1, 1) with a step size of 0.1; and the search interval of n_estimators is searched in an interval of (1, 100) with a step size of 10. These ranges and step sizes were chosen based on the authors’ experience and initial experiments to balance computational efficiency and thoroughly explore the hyperparameter space. If the optimal value is obtained at the boundary, the search continues to the following intervals until the optimal solution is found. The model’s performance is assessed using the root mean squared error (RMSE) as the evaluation metric during the hyperparameter tuning process. The RMSE is chosen as it measures the average magnitude of the residuals, providing more weight to larger errors. By minimizing the RMSE, the model’s predictive accuracy is optimized. To obtain a robust estimate of the model’s performance during hyperparameter tuning, k-fold cross-validation is employed in conjunction with GridSearchCV. In this study, 5-fold cross-validation is used, where the dataset is divided into 5 equally sized subsets. The model is trained on 4 subsets and validated on the remaining subset, and this process is repeated 5 times, with each subset serving as the validation set once. The average performance across the 5 folds is then used to assess the model’s performance for each combination of hyperparameters. One limitation encountered during the hyperparameter optimization process is the computational cost of searching over a large hyperparameter space. To address this, the authors carefully selected the hyperparameter ranges and step sizes to balance computational efficiency and model performance. The performance of the XGBoost model with the optimized hyperparameters is compared with a baseline model without hyperparameter tuning in Section 5.3 (Comparison of Prediction Results of Other Models). This comparison highlights the benefits of the optimization technique in improving the model’s predictive accuracy. Then, we repeat these steps multiple times until the model learns all of the training set data. After the model training is completed, the model reads the data divided into the prediction set for prediction.

3.3. Evaluation Indicators for Model Prediction

After the model prediction is completed, the model’s prediction performance is judged by evaluation indicators. In this paper, we choose to calculate the root mean squared error (RMSE) [38] and mean absolute percentage error (MAPE) [39] to evaluate the prediction performance of the model. The calculation formulas for each are shown in Equations (7) and (8), respectively.
R M S E = 1 n i = 1 n ( y ^ i y i ) 2
M A P E = 100 % n i = 1 n y i y ^ i y i
In Equations (7) and (8), n represents the number of predicted samples; y i represents the parameter’s measured value and y ^ i represents the parameter’s predicted value. The closer the RMSE is to 0, and the closer the MAPE is to 0%, the better the model’s prediction performance.

4. Data Processing and Feature Selection

4.1. Data Sources

The data used in this paper for the offshore wind turbine unit comes from a specific offshore wind farm project located near Yangjiang, Guangdong Province. The SCADA system used in this project enables the collection, monitoring, and storage of production data, which cover multiple dimensions of data, such as the operating conditions, environment, and the operational status of mechanical and electrical equipment during turbine operations. This project is arranged with 37 units of 6.8 MW wind turbines and 30 units of 8.3 MW wind turbines. We extracted 190 characteristic parameters from the SCADA system, including the temperature and pressure parameters of the generator, the gearbox, the hydraulic system, the average generator speed, the average atmospheric humidity, the average ambient temperature, and the wind speed and direction. The timespan of the data selection was from 26 December 2021 to 28 October 2023, with a collection frequency of once every 10 min. There is a total of 84,633 running data.

4.2. Data Preprocessing

Due to the harsh operating environment of offshore wind turbine units, they are susceptible to turbine failures, damaged sensors, and disruptions in data transmission networks. Therefore, the data collected by the SCADA system are often mixed with many abnormal data, due to sensor damage or failure to read the data collected by the sensor into the system, a large number of missing values may appear in individual feature parameter data, so preprocessing the SCADA system data is necessary before training the model. Firstly, we check the original data, remove most of the zero-data missing feature parameters, and “set values” that only retain the measured values. The 6.8 MW wind turbine unit is taken as the experimental object, and 63 feature parameters are deleted. Afterward, we remove outliers from the data by treating them as gross errors based on the “3σ criterion”. The “3σ criterion” [40] is a statistical theory of probability based on normal distribution. In a normal distribution, 68.27% of the data should fall within the range of the mean plus or minus one standard deviation; 95.45% of the data should fall within the range of the mean plus or minus two standard deviations; and 99.73% of the data should fall within the range of the mean plus or minus three standard deviations. According to this theory, a numerical value should be within three standard deviations plus or minus the mean. When a data point exceeds this range, there is a significant deviation in this data, and it should be deleted. The maximum, minimum, average, and standard deviation of the preprocessed wind turbine unit data are shown in Table 1.
In Table 1, the parameters closely related to the average cabin temperature, average outdoor temperature, average cabin humidity, and average atmospheric humidity are mostly each component’s temperature and pressure parameters. The average blade angle reflects the operating conditions of the wind turbine unit, the utilization rate of wind power, and the operation of the internal components of the wind turbine unit, and it affects the overall internal and external temperature and humidity of the wind turbine unit. We choose to use the ten-minute average of each parameter to reduce the impact of sample noise and fluctuations on model training. We use the average values to average the sampling error, which can also reduce the risk of overfitting, improve the generalization ability, and enhance the robustness of the model.

4.3. Feature Selection

During the model training process, some feature parameters may not significantly improve the model’s prediction performance and may even negatively impact model prediction. So, it is necessary to perform feature selection on the data, which is a crucial step in machine learning. Feature selection involves selecting feature parameters that contribute the most to the model’s prediction performance, optimizing the model structure, reducing the required data dimensions, and accelerating the learning and training speed of the model. It is necessary to perform feature selection on these preprocessed data.
This paper takes the 6.8 MW wind turbine unit as the experimental object, and 190 characteristic parameters are collected from this wind turbine. Numerous feature parameters have different dimensions, and many data have significant differences in magnitude, which can affect the effect of model training and have adverse effects on subsequent data analysis. Therefore, after the data preprocessing step, the data of the remaining 127 feature parameters need to be normalized. We use the min–max normalization method [41] to convert each feature into dimensionless data between [0,1]. The function of the min–max normalization method is shown in Equation (9).
x = x m i n x m a x x m i n x
In Equation (9), min(x) represents the minimum value of specific feature parameter data, max(x) represents the maximum value, x represents the value before the normalization of these data, and x′ is the value after normalization. The distribution curve of some feature parameters after normalization is shown in Figure 4. The influence of each feature parameter on the average cabin temperature varies in the model.
To optimize the training effect of the model, reduce the data dimension, and accelerate the model running speed, it is necessary to perform feature selection on the normalized data. We use the Pearson correlation coefficient method [42] to calculate the correlation coefficient between feature parameters. The closer the absolute value is to zero, the more uncorrelated the two variables are. The closer the absolute value is to one, the stronger the correlation between the two variables is. Less than zero indicates a negative correlation, and greater than zero indicates a positive correlation. The correlation coefficients between some characteristic parameters and the average cabin temperature are shown in Figure 5. As shown in Figure 5, when constructing the correlation coefficient matrix of the characteristic parameters of a wind turbine unit, if the absolute value of the correlation coefficient between a pair of characteristic parameters is greater than 0.95, it is considered that these two characteristic parameters have a high correlation and similar information contents.
One of the characteristic parameters should be deleted, and after correlation analysis, the model characteristic parameters are reduced to 34. Due to the varying degrees of influence of these feature parameters on the prediction of average cabin temperature during model training, to optimize the training effect of the model, reduce the required data dimensions, and accelerate the prediction speed of the model, these preliminarily screened data with different information contents are re-screened. We use the “gain” weight calculation method in XGBoost to evaluate the feature parameters after preliminary feature selection based on the average information gained from splitting. The higher the score, the greater the contribution of this feature parameter to the final prediction result. Then, we delete the feature parameters with lower contributions and select the top ten feature parameters with the highest contributions for model training after screening. Figure 6 shows the importance ranking of feature parameters with higher scores in the filtered model. Figure 6 shows the correlation coefficients between the two characteristic parameters of average wind speed and average wind direction, and the average cabin temperature is relatively low. However, XGBoost obtained the highest score in the model feature importance score, indicating that XGBoost can mine the hidden correlations between the data. The faster the average generator speed, the higher the power of each piece of equipment in the wind turbine, which will increase the temperature inside the cabin. The remaining high-scoring feature parameters are all temperature parameters of various wind turbine unit components, which correlate with the average cabin temperature. When predicting the average cabin temperature, they can play a role in mutual verification and prevent the false triggering of abnormal data. The average inlet pressure of frequency converter 2 and the average side current of inverter 1 have low data variation amplitude, and the feature importance score is low in model training.
These feature parameters can be removed. The selected model feature parameters are shown in Table 2.

5. Analysis and Verification

5.1. XGBoost Model Prediction Results

After training and teaching the XGBoost model using data from the offshore wind turbine unit’s SCADA system, we test the model’s prediction performance on the test set. A comparison between the measured and predicted values of average cabin temperature, average outdoor temperature, average cabin humidity, and average atmospheric humidity is shown in Figure 7. As shown in Figure 7, there is a significant similarity between the predicted and measured values of average cabin temperature, average outdoor temperature, average cabin humidity, and average atmospheric humidity, indicating that the model trained in this paper performs very well in early warning. In addition, the evaluation indicators for the prediction performance of these four feature parameters by the model are shown in Table 3.
Table 3 shows that the model trained in this paper has small MAPE values for predicting the four feature parameters, and the RMSE values are at a low level, indicating that the XGBoost model has good prediction performance. The RMSE values of XGBoost for humidity prediction are slightly higher than those for temperature prediction, but overall, they are in a relatively low range. The average RMSE value of the four characteristic parameters is 0.795, and the average MAPE value is 0.016. This indicates that the model trained in this paper has excellent overall prediction performance and can be used for early warnings in wind turbine unit fires.

5.2. Fire Warning

In order to improve the accuracy of predicting wind turbine units catching fire, we perform error calculations between the predicted and measured values of average cabin temperature, average outdoor temperature, average cabin humidity, and average atmospheric humidity. By setting specific threshold values for the error calculations, we determine whether a wind turbine unit is at risk of catching fire.The error distribution map of its predicted difference is shown in Figure 8. As shown in Figure 8, the horizontal axis represents the error value between the predicted and measured values, and the vertical axis represents the probability of this error value accounting for the total error values. Due to the 99.4% error values of temperature prediction being within a range of −2~2 °C, we set −3~3 °C as the threshold for fire warnings regarding average cabin temperature and outdoor temperature. For humidity parameters, 99.2% of the error values between predicted and measured values are between −5 and 5 (%RH). Therefore, we set −6~6 (%RH) as the fire warning threshold for average cabin humidity and average atmospheric humidity. The model sends out a fire alarm signal after the error exceeds the threshold for three time points to prevent the false triggering of the fire alarm.
In summary, the XGBoost models used in this paper have good performance in predicting the average cabin temperature, outdoor temperature, cabin humidity, and atmospheric humidity of offshore wind turbine units. The data preprocessing, feature selection, and hyperparameter adjustment used in this paper all play important roles in achieving fire warnings for offshore wind turbine units.

5.3. Comparison of Prediction Results of Other Models

To verify the superiority of the method selected in this paper, random forest and BP neural networks are used for comparative verification to predict the average cabin temperature, outdoor temperature, cabin humidity, and atmospheric humidity of a 6.8 MW offshore wind turbine unit. The comparison of prediction results is shown in Figure 9. In Figure 9, the horizontal axis represents the measured values of average cabin temperature, average outdoor temperature, average cabin humidity, and average atmospheric humidity collected in the SCADA system. In contrast, the vertical axis represents the predicted values of each model for the target parameters. The diagonal shows that the measured value is equal to the predicted value, and the closer the scatter distribution is to the diagonal, the better the model’s prediction performance. In addition, the two dashed lines represent auxiliary lines with a 10% error from the measured values. As shown in Figure 9, XGBoost performs slightly better than BP neural network and random forest in predicting the average cabin temperature and average outdoor temperature [43]. However, regarding the prediction performance of average cabin humidity and average atmospheric humidity, the BP neural network and random forest have a significant gap compared with the XGBoost prediction results. The predicted values of XGBoost are mostly still within a range of ±90%, while the BP neural network and random forest have a majority of predicted values below 90%. This indicates that using XGBoost prediction in complex environments has a greater advantage and can better provide fire warnings for wind turbine units.
Then, we also use evaluation indicators to compare the prediction performance of the models. The MAPE and RMSE of the comparative models are shown in Table 4. Table 4 shows that the XGBoost model has better prediction performance for average cabin temperature, outdoor temperature, cabin humidity, and atmospheric humidity than the BP neural network and random forest.
In summary, the XGBoost model has excellent prediction performance and is superior to random forest and BP neural networks, especially in predicting humidity. It has successfully utilized SCADA system data and developed more effective fire warning methods based on the actual operating conditions of wind turbine units. The prediction method chosen in this paper is more suitable for predicting the operational parameters of offshore wind turbine units operating in complex environments. It can effectively provide fire warning for the entire offshore wind turbine unit.

5.4. Transfer Learning Prediction Performance of Other Units

To provide fire warning for other wind turbine units, the XGBoost model trained in this paper was transferred to other units, and its data were used in the model to predict its average cabin temperature, average outdoor temperature, average cabin humidity, and average atmospheric humidity in order to carry out the fire warning of other wind turbine unit. In the transfer learning, the source domain dataset is sourced from 6.8 MW. The trained 6.3 MW fire warning model is transferred to 8.3 MW to achieve a fire warning for the 8.3 MW wind turbine unit. Due to insufficient data for the 8.3 MW wind turbine unit, only 4320 pieces of data were collected from 1 September 2023 to 1 October 2023, with a collection frequency of 10 min. We use 1000 pieces of data in the dataset as the training set and the remaining data as the testing set. First, we use the data preprocessing method of the 6.8 MW wind turbine unit fire warning model to preprocess the operating data of the 8.3 MW wind turbine unit. Furthermore, we analyze the operational data of an 8.3 MW wind turbine unit and calculate the average and standard deviation of the parameters, and the results are shown in Table 5. Table 5 shows significant differences in the average of various parameters for the operating data of the two offshore wind turbine units. Moreover, because different offshore wind turbine units operate in other areas and are affected by rapid changes in wind speed and harsh operating environments, there is a significant difference in the standard deviation between the two wind turbine units.
In addition, parameters such as the average inlet temperature of inverter 1’s water cooling were removed, as they were not connected to the SCADA system. We input 1000 pieces of data from an 8.3 MW offshore wind turbine unit into the trained 6.8 MW offshore wind turbine unit fire warning model, let the model learn from these data, and then predict the average cabin temperature, average outdoor temperature, average cabin humidity, and average atmospheric humidity of the 8.3 MW offshore wind turbine unit. The prediction performance is shown in Figure 10, and the prediction evaluation indicators are shown in Table 6.
As shown in Figure 10 and Table 6, by transferring the early fire warning model of the 6.8 MW offshore wind turbine unit, the prediction performance of various parameters of the 8.3 MW offshore wind turbine unit becomes very good, with prediction accuracy greater than 97%. In addition, this also indicates that using small-sample-labeled data to teach the model can achieve high prediction accuracy [44], which can meet the needs of an offshore wind turbine unit’s fire warning system.

6. Limitations

One limitation of this study is a reliance on historical data from a specific offshore wind farm project. While the study dataset covers a substantial time period and includes a wide range of operating conditions, it is important to recognize that the performance of the model may vary when applied to different wind farm locations or turbine types. Factors such as geographical location, environmental conditions, and turbine specifications could influence the model’s accuracy and generalizability.

7. Conclusions

This paper proposes a comprehensive fire warning model for offshore wind turbine units based on XGBoost and transfer learning. By predicting average cabin temperature, average outdoor temperature, average cabin humidity, and average atmospheric humidity, the wind turbine fire is comprehensively monitored, and the overall fire for the wind turbine unit is predicted. In addition, in the case of limited data, applying the fire warning model to other types of offshore wind units through transfer learning can also effectively achieve fire warnings for them. The approach developed in this study first performs data screening and feature selection from the historical data of the SCADA system and then uses the “3σ criterion” to complete data preprocessing. After that, the feature parameters are selected using min–max normalization, Pearson correlation coefficient, and XGBoost, and these suitable feature parameters are combined to form a feature parameter vector. Finally, XGBoost is used to construct a relationship between feature parameter vectors and prediction parameters, achieving fire warnings for offshore wind turbine units. In addition, transfer learning is used to transfer the fire warning model of one wind turbine unit to another with insufficient historical operating data. In cases where the model can only learn limited data, it relies on other wind turbine units with sufficient historical operating data to achieve a fire warning for this wind turbine unit. The average MAPE and RMSE of the fire warning model based on XGBoost reached 0.016 and 0.795, respectively. The average MAPE and RMSE of the BP neural network prediction performance are 0.051 and 2.020, respectively, and the average MAPE and RMSE of the prediction performance of random forest are 0.030 and 1.301, respectively. The fire warning model trained in this paper has excellent prediction performance and is superior to the BP neural network and random forest model. Moreover, the model’s prediction performance after transfer learning is great as well; the average MAPE of its prediction reaches 0.022, and the average RMSE reaches 1.469. According to the model’s prediction performance, the model used in this paper can complete fire warning work very well, which proves that the use of transfer learning in this scenario is correct.
The deployment of studies of early fire detection technology in offshore wind turbines offers significant environmental and economic benefits by minimizing fire risks, preventing ecological damage, reducing financial losses, enhancing safety, and supporting the growth of sustainable energy production.
In conclusion, our study proposes a novel fire warning model for offshore wind turbine units using XGBoost and transfer learning techniques. The model demonstrates significant early detection potential by comprehensively monitoring multiple fire risk parameters. However, we acknowledge the limitations of our study, such as the reliance on historical data from a specific wind farm project and the need for further validation across diverse settings. Additionally, practical application challenges, including data collection, integration, and compatibility with existing systems, must be addressed through future research and industry collaborations. Despite these limitations, our approach represents a valuable advancement in ensuring the safety and reliability of offshore wind turbine operations, and we encourage further exploration and refinement of our model.

8. Future Work

In the plan for this work, the authors recommend addressing these points:
  • Predictive Maintenance: Applying transfer learning and XGBoost to predict potential component failures or degradation, enabling proactive maintenance strategies and reducing downtime.
  • Power Output Optimization: Utilizing our approach to predict wind turbine power output based on various environmental and operational parameters, facilitating optimal control strategies and maximizing energy production.
  • Anomaly Detection: Extending the application of transfer learning and XGBoost to detect anomalies in wind turbine behavior, enabling the early identification of potential issues and preventing costly repairs.
By exploring these additional domains, this study can demonstrate the versatility and potential of its approach in enhancing various aspects of offshore wind turbine operations. Also, it can highlight how transfer learning and XGBoost can be leveraged to improve efficiency, reliability, and overall performance in these areas.

Author Contributions

Conceptualization, A.W. and C.D.; methodology, C.D.; software, Y.J.; validation, S.M. and K.A.-B.; formal analysis, W.G.; investigation, K.A.-B. and L.A.; resources, L.A.; data curation, C.D.; writing—original draft preparation, A.W.; writing—review and editing, A.W., C.W. and K.A.-B.; visualization, F.Y.; supervision, A.W.; project administration, A.W.; funding acquisition, A.W. and C.W. All authors have read and agreed to the published version of the manuscript.

Funding

This research was funded by the Special Support for Marine Economic Development of Guangdong Province (GDNRC [2022]28) and the National Natural Science Foundation of China (52372420).

Data Availability Statement

The datasets used and analyzed during the current study are available from the corresponding authors upon reasonable request.

Conflicts of Interest

The authors declare no conflicts of interest.

References

  1. Wu, W.; Ma, X.; Wang, Y.; Cai, W.; Zeng, B. Predicting China’s energy consumption using a novel grey Riccati model. Appl. Soft Comput. 2020, 95, 106555. [Google Scholar] [CrossRef]
  2. Abbasi, K.R.; Shahbaz, M.; Zhang, J.; Irfan, M.; Alvarado, R. Analyze the environmental sustainability factors of China: The role of fossil fuel energy and renewable energy. Renew. Energy 2022, 187, 390–402. [Google Scholar] [CrossRef]
  3. Stergaard, P.A. Renewable energy for sustainable development. Renew. Energy 2022, 199, 1145–1152. [Google Scholar] [CrossRef]
  4. Li, Y.; Huang, X.; Tee, K.F.; Li, Q.; Wu, X.-P. Comparative study of onshore and offshore wind characteristics and wind energy potentials: A case study for southeast coastal region of China. Sustain. Energy Technol. Assess. 2020, 39, 100711. [Google Scholar] [CrossRef]
  5. Li, J.; Wang, G.; Li, Z.; Yang, S.; Chong, W.T.; Xiang, X. A review on offshore wind energy conversion system development. Int. J. Energy Res. 2020, 44, 9283–9297. [Google Scholar] [CrossRef]
  6. Singh, U.; Rizwan, M.; Malik, H.; García Márquez, F.P. Wind energy scenario, success and initiatives towards renewable energy in India—A review. Energies 2022, 15, 2291. [Google Scholar] [CrossRef]
  7. Ahmed, S.D.; Al-Ismail, F.S.M.; Shafiullah; Al-Sulaiman, F.A.; El-Amin, I.M. Grid Integration Challenges of Wind Energy: A Review. IEEE Access 2020, 8, 10857–10878. [Google Scholar] [CrossRef]
  8. Kou, L.; Li, Y.; Zhang, F.; Gong, X.; Hu, Y.; Yuan, Q.; Ke, W. Review on monitoring, operation and maintenance of smart offshore wind farms. Sensors 2022, 22, 2822. [Google Scholar] [CrossRef] [PubMed]
  9. Zhang, Y.; You, F.; Sun, W.; Li, P.; Lin, W.; Shu, C. Fire hazard analyses of typical wind turbine nacelle oil based on single and composite indices. In Proceedings of the 2019 9th International Conference on Fire Science and Fire Protection Engineering (ICFSFPE), Chengdu, China, 18–20 October 2019; IEEE: Piscataway, NJ, USA, 2019; pp. 1–5. [Google Scholar]
  10. Rengel, B.; Pastor, E.; Hermida, D.; Gómez, E.; Molinelli, L.; Planas, E. Computational analysis of fire dynamics inside a wind turbine. Fire Technol. 2017, 53, 1933–1942. [Google Scholar] [CrossRef]
  11. Mou, J.; Jia, X.; Chen, P.; Chen, L. Research on operation safety of offshore wind farms. J. Mar. Sci. Eng. 2021, 9, 881. [Google Scholar] [CrossRef]
  12. You, F.; Shaik, S.; Rokonuzzaman; Rahman, K.S.; Tan, W.-S. Fire risk assessments and fire protection measures for wind turbines: A review. Heliyon 2023, 9, e19664. [Google Scholar] [CrossRef] [PubMed]
  13. Rohilla, M.; Saxena, A.; Tyagi, Y.K.; Singh, I.; Tanwar, R.K.; Narang, R. Condensed aerosol based fire extinguishing system covering versatile applications: A review. Fire Technol. 2021, 58, 327–351. [Google Scholar] [CrossRef]
  14. Kim, J.-H.; Park, S.-H.; Park, S.-J.; Yun, B.-J.; Hong, Y.-S. Wind Turbine Fire Prevention System Using Fuzzy Rules and WEKA Data Mining Cluster Analysis. Energies 2023, 16, 5176. [Google Scholar] [CrossRef]
  15. Sun, W.; Lin, W.-C.; You, F.; Shu, C.-M.; Qin, S.-H. Prevention of green energy loss: Estimation of fire hazard potential in wind turbines. Renew. Energy 2019, 140, 62–69. [Google Scholar] [CrossRef]
  16. Chen, T.; Liu, Y.; Han, X. FIRE Risk Analysis of Wind Turbine Nacelle Based On AHP. In Proceedings of the 2017 Asia-Pacific Computer Science and Application Conference, Nanjing, China, 11–13 December 2017; Volume 5, pp. 75–79. [Google Scholar]
  17. Rajula, H.S.R.; Verlato, G.; Manchia, M.; Antonucci, N.; Fanos, V. Comparison of conventional statistical methods with machine learning in medicine: Diagnosis, drug development, and treatment. Medicina 2020, 56, 455. [Google Scholar] [CrossRef] [PubMed]
  18. Jordan, M.I.; Mitchell, T.M. Machine learning: Trends, perspectives, and prospects. Science 2015, 349, 255–260. [Google Scholar] [CrossRef] [PubMed]
  19. Ma, X.; Fang, C.; Ji, J. Prediction of outdoor air temperature and humidity using Xgboost. In IOP Conference Series: Earth and Environmental Science; IOP Publishing: Bristol, UK, 2020; p. 012013. [Google Scholar] [CrossRef]
  20. Trizoglou, P.; Liu, X.; Lin, Z. Fault detection by an ensemble framework of Extreme Gradient Boosting (XGBoost) in the operation of offshore wind turbines. Renew. Energy 2021, 179, 945–962. [Google Scholar] [CrossRef]
  21. Kaligambe, A.; Fujita, G.; Tagami, K. Indoor Room Temperature and Relative Humidity Estimation in a Commercial Building Using the XGBoost Machine Learning Algorithm. In Proceedings of the 2022 IEEE PES/IAS PowerAfrica, Kigali, Rwanda, 22–26 August 2022; pp. 1–5. [Google Scholar]
  22. Dao, C.; Kazemtabrizi, B.; Crabtree, C. Wind turbine reliability data review and impacts on levelised cost of energy. Wind. Energy 2019, 22, 1848–1871. [Google Scholar] [CrossRef]
  23. Martinez-Luengo, M.; Shafiee, M.; Kolios, A. Data management for structural integrity assessment of offshore wind turbine support structures: Data cleansing and missing data imputation. Ocean Eng. 2019, 173, 867–883. [Google Scholar] [CrossRef]
  24. Torrey, L.; Shavlik, J. Transfer learning. In Handbook of Research on Machine Learning Applications and Trends: Algorithms, Methods, and Techniques; IGI Global: Hershey, PA, USA, 2010; pp. 242–264. [Google Scholar]
  25. Guo, F.; Liu, Z.; Hu, W.; Tan, J. Gain prediction and compensation for subarray antenna with assembling errors based on improved XGBoost and transfer learning. IET Microw. Antennas Propag. 2020, 14, 551–558. [Google Scholar] [CrossRef]
  26. Tang, Z.; Tang, Y.; Qiao, A.; Liu, J.; Gao, J. Transfer Learning Based Photovoltaic Power Forecasting with XGBoost. In Proceedings of the 2023 Panda Forum on Power and Energy (PandaFPE), Chengdu, China, 27–30 April 2023; pp. 1781–1785. [Google Scholar]
  27. Liu, W.D.; Gu, J. Predictive model for water absorption in sublayers using a Joint Distribution Adaption based XGBoost transfer learning method. J. Pet. Sci. Eng. 2020, 188, 106937. [Google Scholar] [CrossRef]
  28. Yang, Q.; Lin, Y.; Kuang, S.; Wang, D. A Novel Short-Term Load Forecasting Approach for Data-Poor Areas Based on K-MIFS-XGBoost and Transfer-Learning. Electr. Power Syst. Res. 2024, 229, 110151. [Google Scholar] [CrossRef]
  29. Chen, T.; He, T.; Benesty, M.; Khotilovich, V.; Tang, Y.; Cho, H.; Zhou, T. Xgboost: Extreme Gradient Boosting. R Package Version 0.4-2 2015, 1, 1–4. [Google Scholar]
  30. Chen, T.; Guestrin, C. Xgboost: A scalable tree-boosting system. In Proceedings of the 22nd Acm Sigkdd International Conference on Knowledge Discovery and Data Mining, San Francisco, CA, USA, 13–17 August 2016; pp. 785–794. [Google Scholar]
  31. Ma, B.; Yan, G.; Chai, B.; Hou, X. XGBLC: An improved survival prediction model based on XGBoost. Bioinformatics 2022, 38, 410–418. [Google Scholar] [CrossRef] [PubMed]
  32. Budholiya, K.; Shrivastava, S.K.; Sharma, V. An optimized XGBoost based diagnostic system for effective prediction of heart disease. J. King Saud Univ.-Comput. Inf. Sci. 2020, 34, 4514–4523. [Google Scholar] [CrossRef]
  33. Rodriguez-Alvarez, J.L.; Lopez-Herrera, R.; Villalon-Turrubiates, I.E.; Grijalva-Avila, G.; Alcaraz, J.L.G. Modeling and parameter optimization of the papermaking processes by using regression tree model and full factorial design. TAPPI J. 2021, 20, 123–137. [Google Scholar] [CrossRef]
  34. Islam, S.F.N.; Sholahuddin, A.; Abdullah, A.S. Extreme gradient boosting (XGBoost) method in making forecasting application and analysis of USD exchange rates against rupiah. J. Physics: Conf. Ser. 2021, 1722, 012016. [Google Scholar] [CrossRef]
  35. Topic, A.; Russo, M. Emotion recognition based on EEG feature maps through deep learning network. Eng. Sci. Technol. Int. J. 2021, 24, 1442–1454. [Google Scholar] [CrossRef]
  36. Ogunleye, A.; Wang, Q.-G. XGBoost model for chronic kidney disease diagnosis. IEEE/ACM Trans. Comput. Biol. Bioinform. 2019, 17, 2131–2140. [Google Scholar] [CrossRef] [PubMed]
  37. Ranjan, G.S.K.; Kumar Verma, A.; Radhika, S. K-Nearest neighbors and grid search CV based real time fault monitoring system for industries. In Proceedings of the 2019 IEEE 5th International Conference for Convergence in Technology, I2CT 2019, Bombay, India, 29–31 March 2019; p. 5. [Google Scholar]
  38. Hodson, T.O. Root-mean-square error (RMSE) or mean absolute error (MAE): When to use them or not. Geosci. Model Dev. 2022, 15, 5481–5487. [Google Scholar] [CrossRef]
  39. De Myttenaere, A.; Golden, B.; Le Grand, B.; Rossi, F. Mean absolute percentage error for regression models. Neurocomputing 2016, 192, 38–48. [Google Scholar] [CrossRef]
  40. Xia, J.; Zhang, J.; Wang, Y.; Han, L.; Yan, H. WC-KNNG-PC: Watershed clustering based on k-nearest-neighbor graph and Pauta Criterion. Pattern Recognit. 2021, 121, 108177. [Google Scholar] [CrossRef]
  41. Henderi, H.; Wahyuningsih, T.; Rahwanto, E. Comparison of Min-Max Normalization and Z-Score Normalization in the K-nearest neighbor (kNN) Algorithm to Test the Accuracy of Types of Breast Cancer. Int. J. Inform. Inf. Syst. 2021, 4, 13–20. [Google Scholar] [CrossRef]
  42. Cohen, I.; Huang, Y.; Chen, J.; Benesty, J. Pearson Correlation Coefficient. In Noise Reduction in Speech Processing; Springer: Berlin/Heidelberg, Germany, 2009. [Google Scholar]
  43. Wan, A.; Gong, Z.; Chen, T.; Al-Bukhaiti, K. Mass flow characteristics prediction of refrigerants through electronic expansion valve based on XGBoost. Int. J. Refrig. 2024, 158, 345–352. [Google Scholar] [CrossRef]
  44. Wan, A.; Chang, Q.; Al-Bukhaiti, K.; He, J. Short-term power load forecasting for combined heat and power using CNN-LSTM enhanced by attention mechanism. Energy 2023, 282, 128274. [Google Scholar] [CrossRef]
Figure 1. XGBoost model structure diagram.
Energies 17 02330 g001
Figure 2. Idea of transfer learning.
Energies 17 02330 g002
Figure 3. Flowchart of offshore wind turbine unit fire warnings.
Energies 17 02330 g003
Figure 4. The data distribution curve of some feature parameters after normalization.
Energies 17 02330 g004
Figure 5. Correlation analysis.
Energies 17 02330 g005
Figure 6. Importance ranking of feature parameters.
Energies 17 02330 g006
Figure 7. Comparison chart between measured and predicted values of XGBoost.
Energies 17 02330 g007
Figure 8. Error distribution map between XGBoost measured and predicted values.
Energies 17 02330 g008
Figure 9. Comparison charts between measured and predicted values of multiple models.
Energies 17 02330 g009
Figure 10. Comparison between measured and predicted values of transfer learning models.
Energies 17 02330 g010
Table 1. Statistics list of wind turbine unit data.
ParametersMaximumMinimumAverageStandard Deviation
Average Cabin Temperature (°C)54.3025.8040.782.703
Average Outdoor Temperature (°C)33.588.34023.615.006
Average Cabin Humidity (%RH)58.4415.5331.606.821
Average Atmospheric Humidity (%RH)58.4515.5334.606.821
Average Blade Angle 2B (°C)66.98−0.1101.6053.951
Average Gearbox Oil Temperature (°C)55.0833.2553.222.582
Average Gearbox Main Bearing Temperature (°C)53.8026.2148.872.730
Average Converter 1 Water-Cooled Inlet Temperature (°C)49.6725.4634.803.348
Average Hydraulic Pump Outlet Pressure (MPa)179.30.000140.820.72
Average Gearbox Water Pump 1 Outlet Pressure (MPa)4.5901.7103.8360.421
Average Cabin Circuit Breaker Cabinet 1 Temperature (°C)63.6627.6947.053.624
Average Tower Second Floor Platform Temperature (°C)48.8425.1538.953.939
Average Cabin Air-cooled Internal Circulation Outlet Temperature (°C)56.3926.2941.503.342
Average Hub Temperature (°C)38.0018.0029.963.970
Table 2. Input and output parameters of the model.
Input ParametersOutput Parameters
Average Blade Angle 2B (°)
Average Gearbox Oil Temperature (°C)
Average Gearbox Main Bearing Temperature (°C)
Average Converter 1 Water-Cooled Inlet Temperature (°C)Average Atmospheric Humidity (%RH)
Average Hydraulic Pump Outlet Pressure (MPa)Average Cabin Temperature (°C)
Average Gearbox Water Pump 1 Outlet Pressure (MPa)Average Outdoor Temperature (°C)
Average Cabin Circuit Breaker Cabinet 1 Temperature (°C)Average Cabin Humidity (%RH)
Average Tower Second Floor Platform Temperature (°C)
Average Cabin Air-cooled Internal Circulation Outlet Temperature (°C)
Average Hub Temperature (°C)
Table 3. Evaluation indicators of prediction performance of XGBoost.
ParametersMAPERMSE
Average Cabin Temperature (°C)0.00810.5165
Average Outdoor Temperature (°C)0.01320.4447
Average Cabin Humidity (%RH)0.02511.2518
Average Atmospheric Humidity (%RH)0.01870.9671
Table 4. Evaluation indicators of prediction performance of the comparative models.
ParametersMAPE (XGBoost)MAPE (BP)MAPE (Random Forest)RMSE (XGBoost)RMSE (BP)RMSE (Random Forest)
Average Cabin Temperature (°C)0.00810.01760.01130.51650.96410.6421
Average Outdoor Temperature (°C)0.01320.03960.02270.44471.15080.7007
Average Cabin Humidity (%RH)0.02510.07270.04311.25182.98241.9357
Average Atmospheric Humidity (%RH)0.01870.07300.04270.96712.98451.9236
Table 5. Statistics of characteristic parameters of other wind turbine units.
ParametersAverage (6.8 MW)Standard Deviation (6.8 MW)Average (8.3 MW)Standard Deviation (8.3 MW)
Average Blade Angle 2B (°)1.6023.95023.6939.14
Average Gearbox Oil Temperature (°C)53.212.58954.220.568
Average Gearbox Main Bearing Temperature (°C)48.882.73452.023.883
Average Hub Temperature (°C)29.973.97636.543.631
Average Gearbox Water Pump 1 Outlet Pressure (MPa)3.8380.4203.5350.705
Average Converter 1 Water-Cooled Inlet Temperature (°C)34.813.3490.0000.000
Average Hydraulic Pump Outlet Pressure (MPa)140.820.70173.71.700
Average Tower Second Floor Platform Temperature (°C)38.953.94439.502.086
Average Cabin Circuit Breaker Cabinet 1 Temperature (°C)47.063.61843.724.809
Average Cabin Air-cooled Internal Circulation Outlet Temperature (°C)41.503.34742.741.213
Average Cabin Temperature (°C)40.782.70739.881.665
Average Outdoor Temperature (°C)23.625.01131.052.148
Average Cabin Humidity (%RH)31.626.84455.753.428
Average Atmospheric Humidity (%RH)31.626.84455.753.428
Table 6. Transfer model prediction effect evaluation.
ParametersMAPERMSE
Average Cabin Temperature0.0150.876
Average Outdoor Temperature0.0281.593
Average Cabin Humidity0.0221.708
Average Atmospheric Humidity0.0221.700
Disclaimer/Publisher’s Note: The statements, opinions and data contained in all publications are solely those of the individual author(s) and contributor(s) and not of MDPI and/or the editor(s). MDPI and/or the editor(s) disclaim responsibility for any injury to people or property resulting from any ideas, methods, instructions or products referred to in the content.

