
Techno-Economic and Environmental Analysis of the Integration of PV Systems into Hybrid Vessels


Department of Naval Architecture, Ocean and Marine Engineering, University of Strathclyde, Glasgow G4 0LZ, UK
*
Author to whom correspondence should be addressed.
Energies 2024, 17(10), 2303; https://doi.org/10.3390/en17102303
Submission received: 4 April 2024
/
Revised: 5 May 2024
/
Accepted: 7 May 2024
/
Published: 10 May 2024
(This article belongs to the Section B: Energy and Environment)
Abstract
:Solar energy is one type of clean energy resource, and currently the IMO, EU and UK are targeting net zero carbon emissions by 2050. This paper delves into the integration of photovoltaic (PV) systems into hybrid vessels in order to meet their strategies and targets. The technical challenges that come with designing such systems as well as their economic and environmental impacts are examined. By optimizing the usage of harnessed solar energy, we discover the operational strategy that provides maximal benefits through day-to-day savings as well as over the 25 year lifespan of solar panels. It demonstrates impressive economic viability, with cost savings of up to GBP 4.55 per day and a payoff period as short as 9 years. It also displays a modest emission reduction of up to 8.002 kg of CO2, which serves as proof for a pathway to greener practices in the maritime industry. This report highlights the operational flexibility that a hybrid vessel possesses once paired with a PV system through the ability to withstand regulatory and market changes. Also, when looking ahead, further adoption of PV technology creates opportunities for innovation in adopting renewable energy solutions in maritime transportation.
1. Introduction
The focus of this project was to research and determine how solar panels can be integrated into existing and new hybrid ships. It covers key areas related to this topic and addresses this process’s technical, economic and environmental concerns.
This paper aims to evaluate the following:
- How effectively can PV systems be adopted for existing hybrid ships?
- How much will it cost to integrate these systems, and how economically beneficial can they be?
- How effective will these systems be at reducing emissions for the ship?
- How efficient can these systems be on ships?
The answers to each of these questions will influence shipbuilding companies and contractors when deciding if they want to adopt solar panels for their current and future hybrid vessels. It will also benefit future research, informing them of the benefits and downsides of solar energy in the given context.
The world is currently facing a global environmental crisis with climate change. It is a real, pressing issue that everyone is aware of currently. The effects of climate change have started to show over the last few decades, with rising temperatures melting the polar caps, causing sea levels to rise, and the increased frequency of natural disasters which have been catastrophic across the globe. The United Nations stated that the world’s emissions must be cut in half by 2030 to meet their target of keeping warming under 1.5 °C, yet under the current regime, it is expected that this value may be closer to 3 °C by 2030 [1].
One of the main contributors to this environmental change is the maritime sector. As most ships are powered by diesel engines, it is obvious that there is going to be a large amount of greenhouse gases emitted by ships. It is estimated that 3% of the world’s greenhouse gases are emitted by the maritime sector, which if it were a country would make it the eighth highest emitting country in the world [2].
The slowing of global warming is a goal that much of the world is working toward, with different countries applying different strategies. However alternative green energy sources seem to be at the forefront of these plans. The World Economic Forum stated that it expected to see total clean energy investments reach USD 1.4 trillion by 2022 stating that since 2020, the amount of money being invested has been increasing by 12% per year, which shows extreme promise. However, due to rising costs, the amount of energy being produced is not increasing proportionally with the money being spent. Another real issue is that most of the money being invested is coming from first-world countries, and emerging market investments into clean energy are still around 2015 levels, proving that only the more developed countries are contributing and benefitting from this [3].
When looking into renewable energies, there is a wide variety of sources and methods for using all the world’s natural sources. Wind, sun, water and geothermal energy are all renewable sources, with nuclear energy also contributing, even though it is defined as a low-carbon energy and not renewable. Hydropower leads the way. With it being the oldest method, it accounts for over 60% of the energy produced by renewables, followed by wind and solar power and any other sources [4].
From the graph in [4], it is evident that solar power is the youngest and most rapidly expanding renewable energy of them all. This can be attributed to the falling costs of installing solar panels and the benefits of installing them for one’s home. Between 2010 and 2019, it is estimated the price of purchasing PV systems dropped by 82% [5]. While this sounds drastic, the number one reason for people deciding to not install solar panels for their properties is the startup costs. A survey completed by Forbes presented that 36% of the 48% of people who took part in the survey and wanted to install solar panels in the future stated that the upfront cost was the main reason for their hesitance, which made it the most stated reason for not installing solar panels [6].
By the end of 2022, it was reported that the total globally installed photovoltaic capacity reached 1177 GW, with 239 GW being installed that year [7]. While this is a substantial feat, unfortunately, to meet the net zero emissions goal, the production and installation of these systems still require improvement.
By 2050, solar power is expected to amount to 25% of all the total energy being generated. This would most likely make it the primary energy source for the world and the most abundant renewable energy, according to the International Energy Agency (IEA) [8,9]. It is evident that solar power will play a key role in the future and is going to be a tool that will be adopted by many industries across the globe.
PV systems have an intricate design where there is ‘more than meets the eye’, and to harness the energy from the sun, one needs more than just a solar panel. To install a PV system, in a house or onto a ship, as well as solar panels, one will need solar inverters to convert the current from the sun’s energy (DC) into a usable alternating current (AC), a battery so that one can store the energy due to solar power’s intermittent nature, a charge controller to make sure the battery is charged at the right voltage, maximizing the battery life, monitoring equipment to ensure the panels are working and staying efficient, and finally mounting equipment to set up the panels in a reasonable area and direction. The photovoltaic cells in the panels convert sunlight into DC electricity. This occurs when the photons from the rays of the sun knock electrons off atoms in the panel, which creates a flow of electrons otherwise known as electricity. Usually, silicon plates are used in the panel as they are non-metal semiconductors. They create a junction where each plate is doped to create a negative and positive plate, which allows an electric field to be created and the electrons to flow through the wires [10].
While solar power is quite promising in the search for clean energy, unfortunately, it does have some drawbacks. The end-of-life treatment for solar panels needs to be improved, as currently there are few regulations or systems in place to ensure solar panels are being disposed of safely or correctly. Some of the materials used in constructing solar panels are hazardous, which makes the recycling process tougher than one might think. In addition to this, there is no second-hand market currently available, therefore leading to unnecessary waste. A research paper on end-of-life treatment for solar panels revealed that by 2050, it is estimated that there will be 78 million tons of waste related to solar PV [11]. This presents clear information on why there needs to be an upgraded system in place to ensure these systems do not undermine the positive impact they currently make and create an additional environmental problem.
The current applications of solar panels across the globe are far-ranging. However, a portion of the global application of solar panels happens to be in the maritime sector. Floating solar farms account for most of this application, but there are also onboard PV systems, with countless ships integrating solar panels into their onboard electrical systems to aid their auxiliary power consumption.
However, some ships have also been adapting the technology to supplement their engine power. Now, it is extremely rare that ships are fully powered by solar power due to the significant amount of energy required, but it exists for smaller ships that do not need to travel at substantial speeds and are only traveling short distances. It is a requirement that these ships are electrically powered or, more commonly, hybrid-powered, meaning they are powered by both a diesel engine and an electric motor. The electric motor is usually only used at lower speeds or when docking or undocking. It is powered by a battery that is charged by the excess energy provided by the diesel motor or by external sources like an onshore grid or onboard renewable systems. The electric motor and battery are essential in utilizing solar power, as they are what allow the electricity provided by solar energy to be used to power the ship. While this form of hybrid propulsion is somewhat new, it provides an answer in the search for green ship propulsion. In November 2020, it was estimated that there were around 250 ships fitted with battery systems, with half of them being ferries [12]. This number has risen since 2020 to a much larger number. However, the application of solar panels in supplementing engine power remains a rudimentary problem.
A real-world example would be the Tûranor PlanetSolar (Figure 1), which is the largest fully solar-powered ship to date. It is 31 m long and 15 m wide, weighing in at 85 tons. Covered by 537 m2 of solar panels, it produces a max power of 93.5 kW [13]. It has set numerous records and is one of the trailblazers in the world of solar-powered ships.
2. Literature Review
The maritime sector plays a key role in the global trade sector. However, it is also a key contributor to environmental pollution. With the increasing emphasis on sustainability, the integration of solar panels on ships has gained researchers’ attention due to its extremely green and sustainable nature. However, at present, a comprehensive understanding of the economic and environmental implications of such integration is lacking. This literature review aims to establish the current and past research on this subject and demonstrate why there is a need for focused study on this subject.
2.1. Economic Implications
Solar panels are expensive in initial costs, making them impractical to invest in for the maritime industry. In fact, for smaller systems, the installation costs can even exceed the price of the panels themselves [14]. This cost barrier is further amplified in the case of marine solar panels, as these need to be waterproof.
A 200 W system for a small boat can cost upwards of GBP 600 to purchase and install [15]. This is exemplified by the case of Auriga Leader, one of the pioneering ships to use solar power, which contains 328 solar panels only covering a mere 10% of the electricity usage [16].
In a recent study [17], the economic feasibility of residential solar photovoltaic (PV) systems in College Park, Maryland was assessed. The analysis considered local weather patterns as well as the federal solar investment tax credit, which provides a 30% reduction in initial costs and gradually decreases until 2023, revealing a potential ROI of 23.6% and a payback period of approximately 4.25 years for consumers.
In the ever-evolving world of ship operations, high fuel consumption has been a persistent challenge. To tackle this problem, the authors of [18] delved into the possibility of using solar panels and wind turbines as alternative energy sources for lighting on a 2000 GT roll-on/roll-off ferry. Through their comprehensive study, they found that these renewable sources could generate a whopping 55.68 kW and 17.48 kW of power, respectively, resulting in annual fuel savings of 17.53%. Moreover, a thorough feasibility analysis revealed that the system would reach its break-even point in a mere 3 years and 10 months of operation.
2.2. Environmental Implications
Solar panel integration has been extensively studied, with the primary goal of reducing greenhouse gas emissions. Various methods of integration, from PV systems connected to the grid to those used on ships, have been thoroughly explored. The core principle, however, remains unchanged. In fact, the IMO has recently released a strategy to combat GHG emissions from ships, highlighting the importance of alternative fuels and energy sources such as solar panels in achieving their goals [19].
In their paper, the authors of [20] unveiled a control strategy for the hybrid power systems of ships. This system incorporates a diverse set of power sources such as diesel generators, solar panels and battery packs, with the goal of achieving optimal efficiency and minimal emissions. The team harnessed the power of microgrids to intelligently combine these sources, giving top priority to renewable energy. Through rigorous simulations using MATLAB 2018a and experiments on real-life rigs, this strategy has been proven to significantly reduce CO2 emissions by a staggering 3 × 10⁶ kg over the ship’s lifespan. This exemplifies the crucial role that solar panels can play in mitigating greenhouse gas emissions. Further exploration into the reduction of all forms of GHGs and not just CO2 would further validate the efficacy of solar panels in achieving this crucial goal.
In [21], the authors explored the rapidly evolving landscape of concentrated photovoltaic (CPV) technologies, with a specific focus on both high-concentration photovoltaic (HCPV) and low-concentration photovoltaic (LCPV) systems. The analysis revealed that CPV modules are significantly more efficient than traditional silicon-based panels, owing to the use of concentrator optics. In addition to discussing recent advancements in multijunction solar cells and tracking systems, the authors also investigated the environmental impact of CPV systems through a comprehensive life cycle assessment. They carefully considered important factors such as the energy payback time and CO2 footprint. By conducting this assessment, they found that while concentrated photovoltaic systems offer much greater efficiency compared with average PV systems, the use of materials to create the focusing optics may lead to a higher carbon footprint.
2.3. Optimization and Efficiency
Unlike on-shore PV systems, PV systems on ships have many more constraints and operate in more extreme conditions. Optimization of the actual panel itself is important, but optimization of the space and areas one can place the panels on a ship is equally important. There are various factors to consider when optimizing the placement of the panels, such as information about the orientation and routes of the ship or shading on the boat. For the panels, the technology is constantly improving at a faster rate. The higher the panel’s efficiency, the more energy can be harnessed in a given timeframe. This could reduce the number of panels required for a ship or mean more power can be supplemented, leading to a greener form of propulsion for ships.
In a recent study [22], the potential for solar energy in Iraq was examined by identifying the optimal tilt angles for solar panel placement. By analyzing 19 years of data collected across 18 cities, the researchers determined that the best tilt angle ranged from 0° to 64°, with variations depending on the season and location. This study highlights the crucial role of the tilt angle in maximizing solar irradiance and its effect on system efficiency. However, finding the ideal tilt angle can pose a challenge due to seasonal changes. To address this, adjustable frames rotating on an axis can be installed to allow for tilt angle adjustments as needed. However, without automation of the tilt change, it would become quite a chore to manually adjust the angle of the tilt for every panel. Nevertheless, this would all come at an additional cost and may not be a feasible solution for all installations.
In their recent research, the authors of [23] explored an innovative strategy for boosting energy production from solar photovoltaic panels. Their work presents a new spatial optimization problem, the maximal PV panel coverage problem (MPPCP), which utilizes geographic information systems (GISs) to identify suitable areas for panel installation. By considering various orientations and alignments, the model effectively addresses installation constraints. Notably, when tested on a limited rooftop space, the model was able to increase energy production by up to 6%. Although this methodology has not yet been applied to ship installations, this concept can easily be adapted and applied in this context, as limited space is a common factor.
In their paper, the authors of [24] examined the effect of sea salt soiling on the performance of solar photovoltaic (PV) panels, with a specific focus on coastal and marine areas such as fishing villages. Through their research, they discovered that the deposition of sea salt can significantly decrease the electrical output of PV panels. Their simulation results showed a difference of 2.09 W in power generation between normal and sea salt-soiled settings. Additionally, their experiment, which involved floating a PV panel above brackish water for 29 days, confirmed that sea salt buildup can deteriorate a panel’s electrical properties over time. This issue is especially concerning for solar panels integrated onto ships, as they are constantly exposed to seawater. This could ultimately lead to the panels needing to be replaced sooner than expected, resulting in higher costs and raising questions about the feasibility of such systems.
2.4. Research Gaps
The existing literature on the integration of solar panels in maritime transport shows promising environmental benefits but leaves many questions unanswered. Some gaps that were identified from each section are given below.
2.4.1. Economic Implications
Existing research establishes a clear understanding of solar panels and the costs surrounding them. It looks at the cost-saving ability of solar panels, their lifespan and end-of-life solutions and especially their application on ships for powering lighting systems. However, a clear gap in the current literature is their application for propulsion on hybrid ships. It would be extremely interesting to investigate and see how much of the required power for propulsion can be provided by PV systems.
2.4.2. Environmental Implications
The presented literature examines the environmental impact of solar panels and shows an evident understanding of how integral they can be in reducing the release of GHGs. It shows that the use of solar panels is extremely effective in reducing the release of CO2, and their efficiencies are constantly increasing, resulting in an improvement in the reduction of these harmful gases. However, the literature does not show how well all GHGs can be reduced and only presents data on CO2. It also provides information which shows that increased efficiency in solar panels does not necessarily mean that they are better for the environment. With all this information gathered, it is evident that there is a clear gap in the research on all forms of GHG reduction and the trade-off between efficiency and being environmentally beneficial.
2.4.3. Optimization and Efficiency
The literature presented delves into some interesting topics that provide valid methods for optimizing the energy provided by PV systems. The literature provides some useful information on optimizing the tilt and placement of solar panels in a given space and shows how effective these methods can be. However, with the tilt, it struggles to convey how to keep the panels at a constantly changing optimal tilt angle and what costs come along with this. The other paper on layout space optimization provides a rather applicable and relevant method, and even though it is not specialized for ship application, it would transfer over quite effectively. Finally, the last paper on sea salt spoiling shows the detrimental effect of salt on solar panels. It provides an active challenge in the application of solar panels on ships, and research to quantify how much salt can affect solar panels on ships is an interesting gap that could also be researched.
3. Materials and Methods
3.1. Techno-Economic and Environmental Analysis
This methodology analyzes a topic from three dimensions. It allows the user to cover all bases when researching a topic. The technical side can be addressed by looking at elements such as efficiency and recent advancements in technology as well as how the technology can be applied in different environments, such as solar panels on seagoing ships. This can include a theoretical design of a system to help the reader have a greater understanding of the technology. The economics can be covered by looking at the money involved in constructing and installing the technology, but it also covers the money that can be made back by implementing this technology. Finally, the environmental impact can be studied to see how beneficial or non-beneficial the technology can be for the environment, and this can be quantified by how many emissions are released in production as well as how much the emissions can be reduced by the implementation of such technology.
For this study, a theoretical design of a PV system for the case study was created which took the space, orientation and type of solar panel into consideration so that the system could be as efficient as possible. With this design, a strategy was be defined to calculate how much the system would cost to install and run, alongside calculations to figure out how much fuel the solar panels would save a ship and the economic repercussions of this. Finally, the reduction in emissions for the ship was quantified, and all this information will provide valuable insight into how effective solar panels can be for hybrid ships.
Since this ship possesses a hybrid system, the calculations were split up into two different parts, where the electrical energy production and expenditure were accounted for and then the diesel energy production was accounted for. The electrical side included the energy produced from the solar panels alongside the net battery usage to evaluate the economic and environmental impacts as well as consider the best strategy to distribute the energy so that the system was as efficient as possible. The mechanical side focused on the engine operations and quantified the cost to run the engine and how many emissions were released in doing so.
For the solar panel energy output, the followed equation was adopted [25]:
where is the daily energy output of the solar panel system (in Wh/day); is the maximum power rating of a given solar panel (in W); is the number of solar panels in the solar array; is the number of solar panel system operational hours in a day (in h); and η is 0.75, which accounts for the losses in the system through inverters, cables, the environment and temperature.
The solar irradiance of the sun averages at least 1000 W/m2 per hour. This parameter of the maximum power rating was much more convenient for calculations, as solar irradiance varies largely over a day and does not have sufficient data for specific locations. The values for this parameter were obtained from an online source [26] which used data from the National Renewable Energy Laboratory PVWatts Calculator to calculate the number of solar hours based on the location, azimuth angle and tilt angle. The azimuth angle is the angle of the direction in which the solar panel faces with respect to due north. This angle was already decided by the placement onboard the vessel, and therefore an optimum angle could not be used. The tilt angle is the angle at which a solar panel tilts toward the sky, with 0° implying the solar panel is lying flat on the floor. This angle was optimized using a similar website created by the same person, in which the optimum tilt angle was gauged by just one’s location [27].
Regarding the battery energy usage, Equation (2) below will be used:
Here, is the energy used from the battery (in kWh); is the power demands of the ship (in kW); and is the operational hours of the ship (in h).
This equation covers a simple energy equation which would aid the report in determining how much battery capacity is used at the three different phases of the crossing and allow an optimization process of where and when the battery is best used. This would also be used for the energy consumption of the engine as the exact same principle applied. The power demands are available from the CMAL Hybrid Ferries report.
To estimate the fuel consumption of the ship, the main engine data were retrieved from the engine manufacturer, and the engine load was estimated as follows:
where is the main engine load as a percentage and is the installed main engine’s power (in kW).
This would indicate the amount of available power being used which is mandatory to be able to find out the specific fuel consumption (SFOC) from the engine data, therefore assisting in the fuel and emission calculations using the following equations:
where FC is the fuel oil consumption of the ship in liters; SFOC is the specific fuel oil consumption of the main engine (in g/kWh); is the energy demand from the main engine (in kWh); and is the density of the fuel (g/L).
The amount of fuel used would be determined through this simple method. The SFOC was found in the engine data [28] alongside the density of the fuel (840 g/L), which can be seen in the above equation. This would directly be used for fuel costs and to evaluate the amount of CO2 emitted as followed:
where is the quantity of the CO2 emissions from the burnt fuel (in g) and EFf is the fuel-based CO2 emission factor (in g CO2/g of fuel) [29].
For the engine onboard MV Hallaig, the value for marine diesel oil (MDO) was used. This value, alongside a conversion to kilograms, provided an estimated answer for how many kilograms of CO2 were released.
Regarding NOx emissions, MV Hallaig is labeled as a tier II vessel, meaning it was constructed on or after 1 January 2011. The total weighted cycle emission limit was also determined by the vessel’s RPMs. The vessel’s RPMs fells in the 130–1999 RPMs range, which allowed the equation below to be identified [30]:
where is the quantity of NOx emissions from burnt fuel (in g) and RPM is the speed of the main engine (in RPMs).
Regarding SOx emissions, the sulfur content of the fuel was considered to estimate the SOx emissions using the equation below:
where is the quantity of the SOx emissions from burnt fuel (in g) and s is the sulfur content based on the type of fuel (in ppm).
To calculate the quantity of SOx released, the sulfur content (parts per million, ppm) for the stated fuel is identified considering the engine in the case study. From the engine data, it was revealed that EN 590 was the preferred fuel choice [28]. This fuel is identified as ultra-low sulfur diesel and therefore has an extremely low sulfur content of 10 ppm [31].
3.2. Case Study
The selected case study ship for this methodology was the CalMac short-route ferry MV Hallaig, shown in Figure 2 and Table 1. It is a notable example of a series of hybrid short-route ferries designed by CalMac. It was launched in 2012 by Ferguson Marine and cost around GBP 20 million to construct. It was the first passenger-carrying Ro-Ro vessel to equip a hybrid powering system, making it an important milestone in the maritime world.
It boasts 3 Volvo Penta marine diesel generators that provide 360 kW each, and the SFOC is available from the manual published by the engine manufacturer (Table 2). They are accompanied by 2350 kWh lithium-ion batteries, which under the current operational strategy are either charged by onshore power overnight or by the engine in periods of low power demand to ensure that the engine operates at increased efficiency. Both components provide power to the electric propulsion motors, which drive the propellers to provide propulsion.
MV Hallaig operates 6 days a week between the ports of Raasay and Sconser on the Isle of Skye, as shown in Figure 3. It is roughly a 30 min, 5 km journey, and the ship performs 9 round trips per day (Monday–Friday), with reduced service on Sundays.
The journey is split up into three sections: transit, maneuvering, and slip, when the ship is stationary (Table 3). The transit section is when the ship is traveling at service speed between ports, which takes roughly 20 min to complete. The maneuvering section is the time allowed for the ship to dock at each port safely. Finally, when the ship is at slip, this is the section that allows the current passengers to alight the vessel and allows new passengers to board. For some trips, this section may be longer. This is assumed to account for the changeover of staff or any breaks required.
The current 2024 summer timetable for the case vessel is shown in Figure 4. Each trip is split up into the previously described sections, and the time for each section is totaled for the day. Sunday was discounted due to the abnormality of its trips per day.
To accompany the hybrid system, an alternate fuel source in the form of renewable energy was required. With solar energy being the chosen renewable energy source, for this ship, a photovoltaic system was therefore to be designed and configured to integrate seamlessly into the existing framework of the ship. There was much more than just solar panels that needed to be thought through, and this provided numerous challenges along the way.
Before starting the design stage, some key points were defined to focus on as they played a large role in defining how effective the system could be. These were as follows:
- Orientation: This determines how much sunlight can be harnessed over a day. This includes the direction in which the panels are facing as well as the tilt angle of the panels. With the case study ship operating in the Isle of Skye, which is in an extremely northern part of the hemisphere, the solar panels would need to be south-facing with a relatively large tilt angle.
- Location: This is an important decision in maximizing the efficiency of the system. Mainly to avoid shading, in a ship setting, things like saltwater spoiling and wind loads need to be considered.
- Available Space: This is the main restrictive parameter onboard ships.
- Electrical Integration: This provides how the new PV system connects to the existing system onboard the ship.
- Type of Vessel: This is a double ended roll-on roll-off (Ro-Ro) ferry. This means the ship never turns around, and the solar panels are required to be south-facing. Then, no solar panels can be placed on the front half of the ship without being shaded, and only around half of the available space is actually available.
In this section, the selected components for the PV system will be presented. An explanation of their role in the system alongside some specifications for the precise model chosen will be provided and explained.
3.3. Solar Panels
This component is pivotal in harnessing solar energy and converting it into usable electricity. Solar panels, also known as photovoltaic (PV) panels, consist of numerous solar cells made of semiconductor materials like silicon. These cells absorb sunlight and generate direct current (DC) electricity through the photovoltaic effect. They come in many variations with varying power and sizes. The average lifespan of solar panels is approximately 25 years [35].
The authors of [36] showed the selected solar panel for this project. It was a monocrystalline panel produced by LG. The further specifications are listed below in Table 4.
To store the energy harnessed by the solar panels, a battery is mandatory. The sun only shines for so many hours a day, and therefore if one wants to use the energy outside of these hours, then one must use a battery.
The role of a charge controller in a PV system is to regulate the flow of electricity between the solar panels and the battery, making sure the battery is overcharged or under too high of a voltage. This is to protect the battery and prolong its life. It also optimizes the charging process by maximizing the efficiency and performance of the battery through charging it as fast and as safely as possible. The selected charge controller was the SmartSolar MPPT RS 450/100 model [37], which has an operating voltage range of 80–450 V and can handle PV arrays of up to 7200 W (450 V × 20 A). It uses maximum power point tracking to continuously adjust the electrical operating point by altering the current and voltage received from the source to provide the most optimal amount of power to the battery and protect the battery.
The current that is created by the solar panel when the sun’s energy is harnessed is in the form of DC. An inverter is applied to convert between DC and AC. In [38], the inverter chosen was the one for this PV system. It can handle PV arrays of up to 9 kW and has a voltage operating range of 90–520 V, making it more than capable for the proposed system.
Due to the limiting factor of space onboard the vessel, mounting brackets are an essential component for the installation of solar panels. Two different types of corrosion-resistant brackets would be used for this system as the panels would be rail-mounted [39] and wall-mounted [40]. Both brackets provided sufficient space and support to hold the chosen solar panels.
A 2D line diagram presents how the PV system was integrated into the hybrid system in Figure 5. A 2D general arrangement CAD drawing shows how the solar panels were positioned on the exterior of the vessel in Figure 6.
The 2D diagram line diagram shows the PV system connecting to the AC bus. One of the considerations was whether to connect the PV system directly to the battery or to the AC bus. When connecting it into the battery, this removes the need for an inverter, as the battery is charged with DC electricity. This would result in a cost reduction for the initial installation, which would reduce the payoff period. However, when connecting to the AC bus, this allows for flexible power distribution, meaning the electricity can be distributed to other onboard systems when the battery is fully charged or, in the case of an emergency, when the generators are shut off. This would further reduce the reliance on fossil fuels for electricity generation and further reduce emissions. The solar panel layout in the orthographic drawing shows how each panel is connected to either the wall or the railings on the bridge of the ship.
The costs of each component were found using online stores (Table 5). These prices were quoted at the time of our research, may have been subject to change and did not include delivery costs. The installation costs (Table 6) included an extra day for the estimated time from the information source to allow for the complex nature of installation onto a ship. The maintenance costs are listed in Table 7.
3.4. Assumptions
To simplify some calculations and reduce the sensitivity of certain values, some educated assumptions were made. They were made with the aim to keep the results as accurate as possible without making them too detailed and intricate. The following list summarizes the assumed scenarios and values:
- The batteries had the capability to charge and discharge simultaneously.
- The results were determined as the average solar hours per day over a given year, and therefore the real daily value would vary depending on the season.
- The fuel prices utilized in the calculations were based on last year’s average from GlobalPetrolPrices [43], but fuel prices are constantly changing, and the provided results are subject to change based on this price difference.
- The required power loads at the transit, maneuvering and slip stages are available from the CMAL report [49].
- Zero shading was assumed.
- The majority of the crossing was on the north-south axis. Therefore, the azimuth angle of the solar panels for determining the solar hours was assumed to be when the ship was traveling on this axis.
- The operational profile was determined by the current route and timetable, which is subject to change in the future.
- Battery and solar panel degradation were accounted for.
- Additional wind loads resulting from solar panels being in place were accounted for.
- An operational week was defined as 6.25 days, with Sunday’s reduced service being accounted for.
- An operational year was defined as 363 days, with Christmas and New Years Day being taken out.
- The emissions reduction value for analysis was taken to mean CO2 reduction, as other emissions stayed relatively constant and were too insignificant to sum up.
3.5. Strategies
To evaluate the economic and environmental impact of integrating a PV system onboard MV Hallaig, a strategy was formed to discover which way the solar energy harnessed was best spent, namely by using some form of energy management scheme to decide when the battery power should be utilized and how much of the battery capacity should be used. Multiple scenarios needed to be created so that the most efficient and impactful strategy could be found. This needed to include a mix of economic and environmental benefits and not just one or the other. For this case study, two operational strategies were defined, and calculations using these strategies were completed to verify which one provided a more positive outcome. Both strategies had many similarities but had a minute difference that separated the two.
3.5.1. Strategy 1
After looking at the operational loads for each phase of the passing from port to port, it became obvious that operating on only battery power was not possible. However, when thinking about emission reduction, a key area for reduction was in and around each port. If the ship was still utilizing engine power when parked or when maneuvering, then the resultant emissions and efficiency would be greatly increased due to operating at lower and less efficient engine loads. Therefore, for this strategy, it was decided that for the maneuvering and slip phases, all the required power would be supplied by the battery and PV system. This focuses on reducing emissions in and around the port as well as improving the air quality for locals, which will greatly benefit the local environment and community.
For charging the battery, it was determined that shore power would be utilized to charge the battery to full at the start of the day, and solar power would minimally replenish the battery’s charge throughout the day. This was decided based on evidence that the solar panels did possess the ability to supply sufficient energy to charge the battery enough in a day. Using the engine to charge the battery was also investigated, but due to the economic and environmental implications of using fuel to create energy compared with utilizing grid energy in Scotland, this idea did not prove to be worthwhile.
3.5.2. Strategy 2
This strategy came to fruition as an extension of the previous strategy. When analyzing the results from the previous strategy, a small issue was evident with the engine load in the transit phase, where the engine was operating extremely close to 100%. This is an issue, as the fuel consumption at this load is not optimal and results in an increase in emissions. However, the battery still had available capacity. Therefore, to reduce the engine load, it was decided that the spare battery capacity would be consumed to aid with the engine in powering the ship for the transit phase.
4. Results
This portion of the report will reveal the numerical outcomes of this research project. Then, through a meticulous and measured analysis, the provided values will be used to provide an explanation and insight into whether PV systems can make a positive or negative impact on hybrid vessels. Table 8 shows the costs and emissions of the hybrid ship under the two designs and two operation strategies. With the support of a solar panel system plus a battery (Table 9), and by adopting the second strategy, the operational cost was the lowest, as well as the emissions following the same assumed operational profile and changing intervals (Table 10 and Table 11). In Table 12, a comparison of the total cost for four cases is conducted, considering the operational cost and initial investment at the end of life of the service.
4.1. Economic Analysis
After inspection, the cost savings from fuel costs showed a stark difference between the two strategies, due to the fact that strategy 1 did not alter any engine operations. However, the results from strategy 2 highlight the impact of utilizing solar panels to power the vessel, especially when they are used to help power the transit phase. Cost savings of GBP 4.54 per day may not sound like much, but when it accumulates for a year, it proves to be substantial savings.
Then, when the battery charging costs are dissected, strategy 1 shows its dividends, where at the start of the day it requires less charging due to the excess energy from the day before. While it reduced costs, it did not prove to be as effective as the second strategy.
The payback period (Figure 7) and EOL profits highlight the impact of strategy 2, with strategy 2 breaking even almost 3 years before strategy 1 and creating almost double the profit at the end of the solar panels’ 25 years.
Strategy 2’s upper hand can be attributed to the reduction of a more expensive energy source compared with strategy 1.
Strategy 1 could prove to reduce costs more easily if the PV system were based onshore at the port, where a larger, more efficient array could be designed to supply onshore electricity to the vessel.
4.2. Environmental Analysis
Like the economic results, strategy 2 proved to be the more beneficial method of operation. Strategy 2 reduced emissions by more than three times the amount strategy 1 did. Overall, the emission reduction was not major, with only a reduction of 0.5% with strategy 2, which is not amazing. However, the ship was already made with the intention of being a greener ship. Therefore, maybe the PV system could create more of an impact on emissions for a different ship.
4.3. Further Considerations
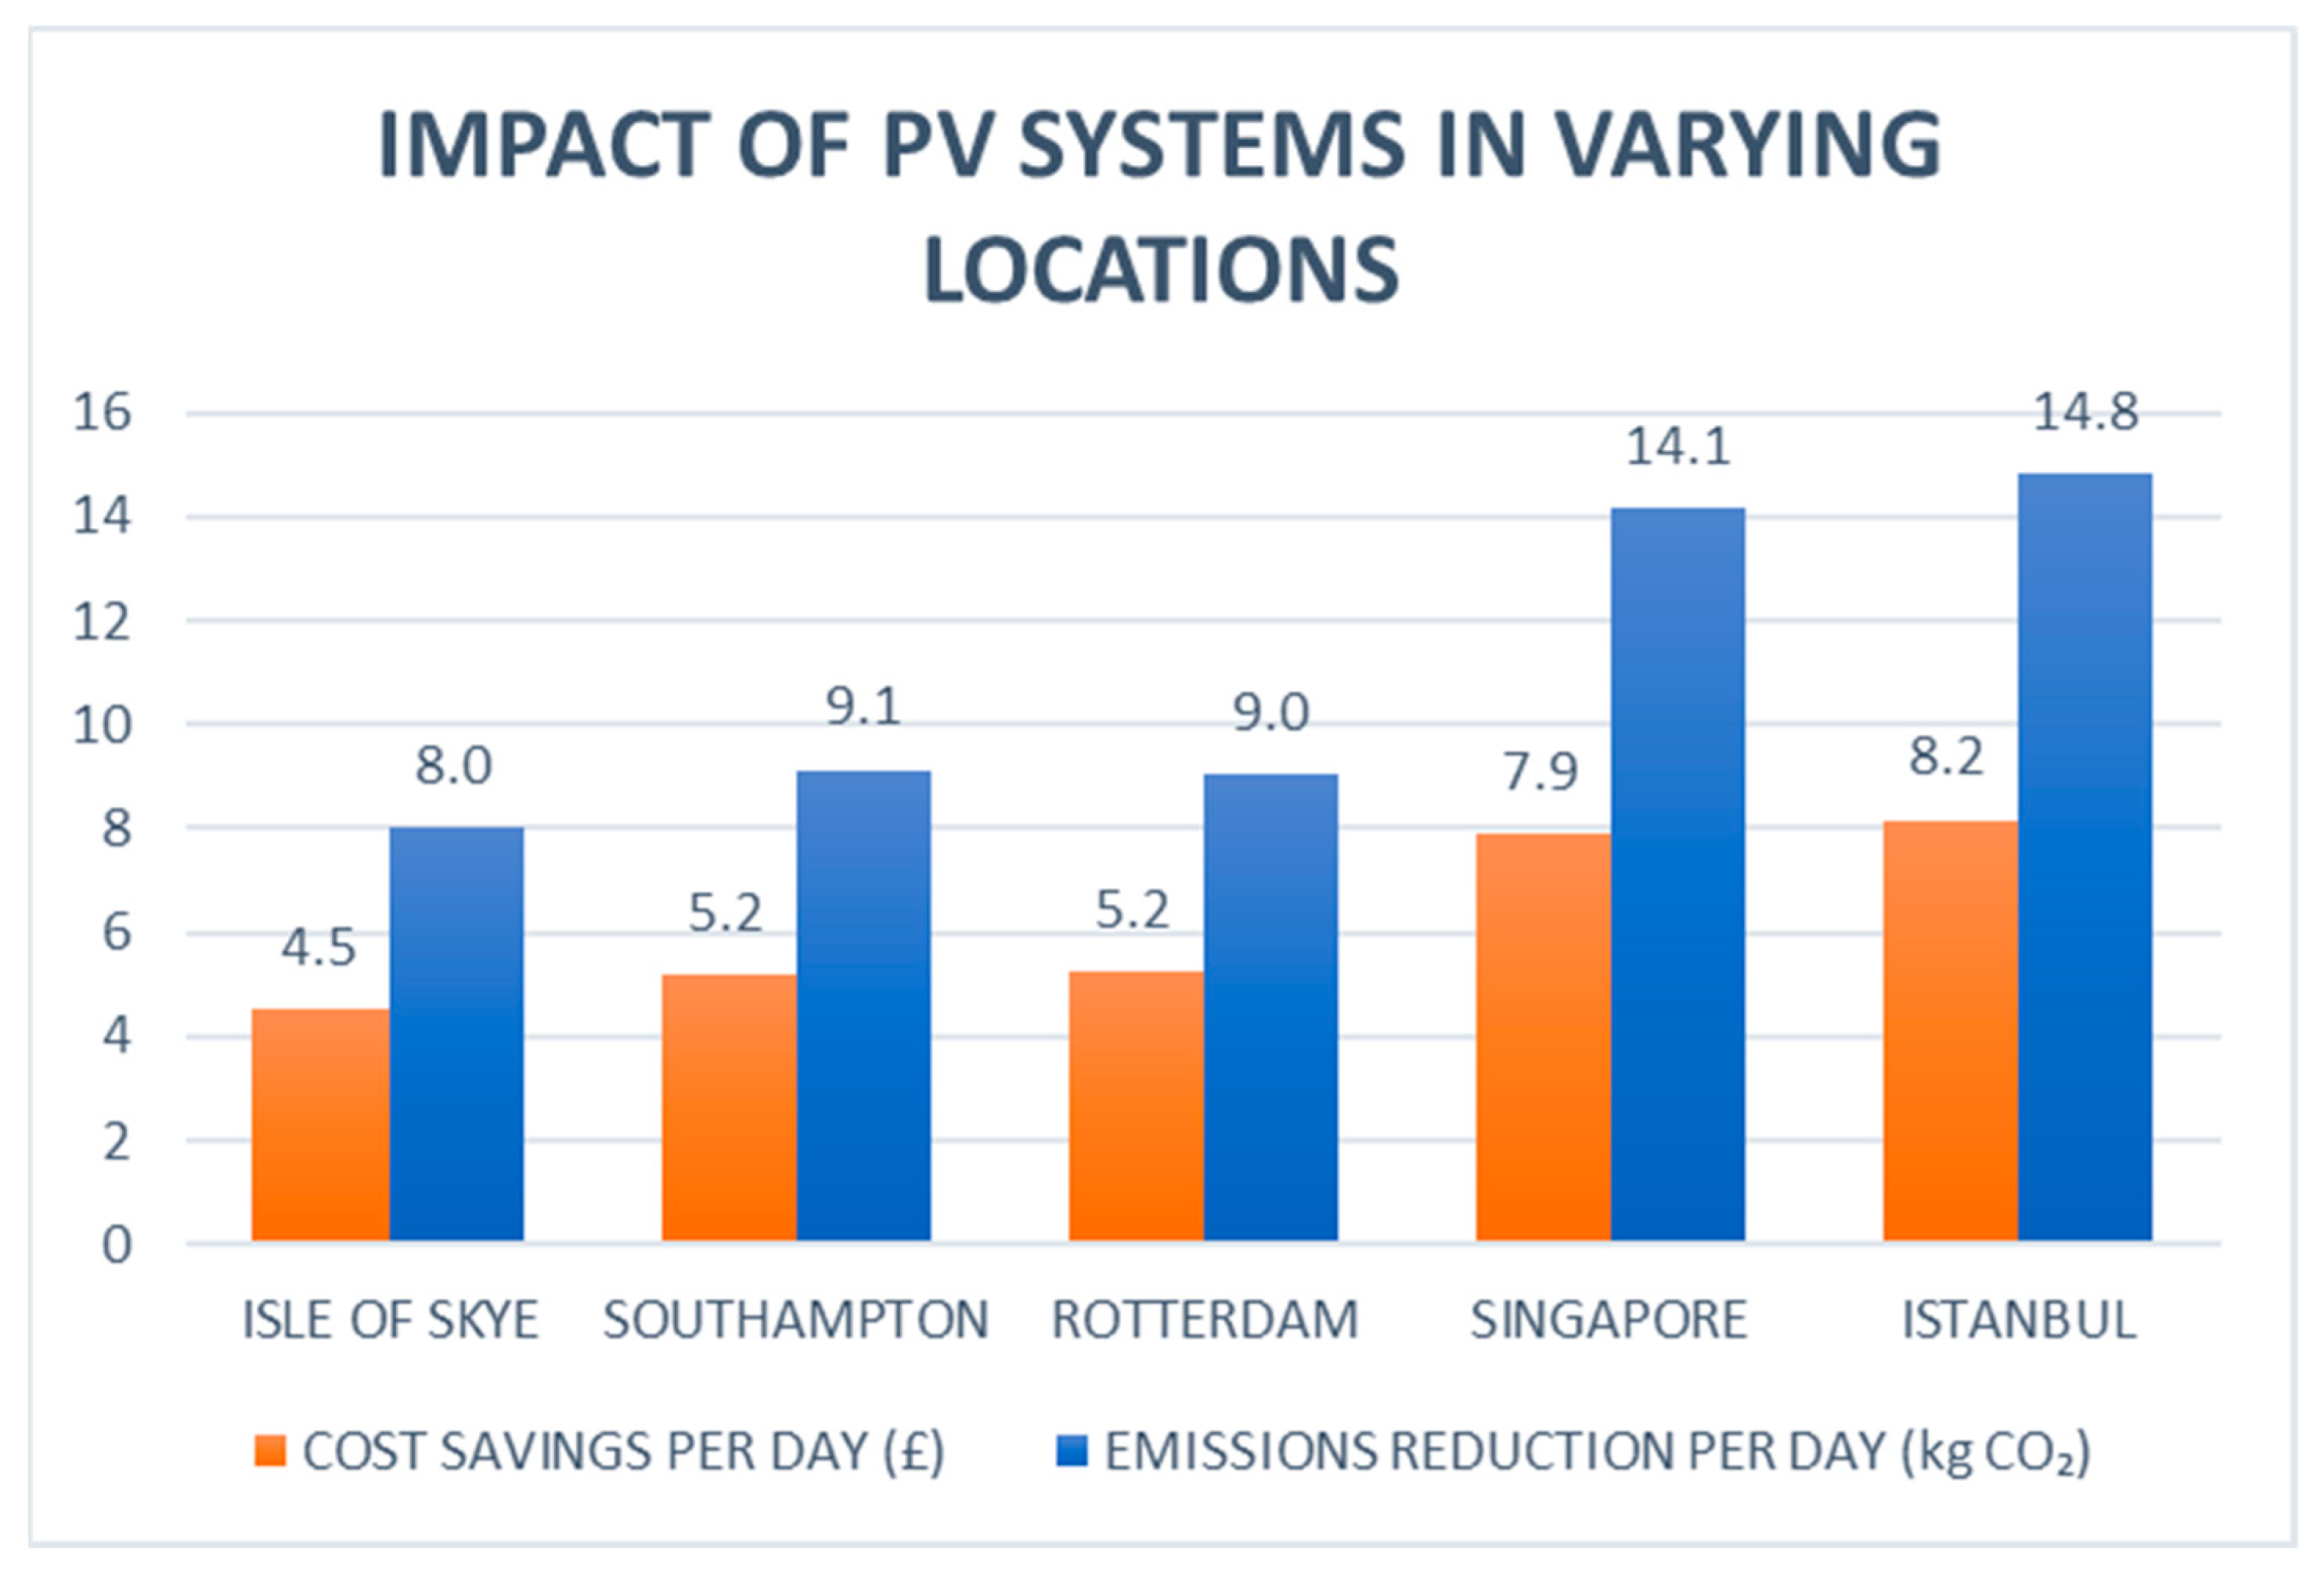
A key factor for PV systems is the amount of available sunshine. For this project, the case study operated in the northern parts of Scotland. This part of the world is not exactly notorious for its sunshine and is more known for its extensive rain. Therefore, further work to evaluate the impact of this factor would provide insightful information into how important the location is for the operation of such systems.
Figure 8 was created using calculations to show how much of a difference the location makes. These results were created with the assumption that everything was the same (e.g., ship, operational profile, route apart from the solar hours, fuel cost, electricity cost and generation were altered for the respective locations) (Table 13). Strategy 2 was applied to provide the optimal results.
5. Conclusions, Recommendations and Future Work
Overall, this report shows clear evidence of PV systems making a positive impact on board the chosen hybrid vessel. It reveals numerous benefits that underscore the potential of renewable energy in the maritime sector.
Economically, these systems proved themselves to be cost-effective and highlighted themselves as a profitable gateway for shipowners to strive toward a more eco-friendly operation of their vessels while not compromising their finances.
The chosen case study ship does not truly show the magnitude of environmental benefits these systems offer, but it does pave the way for positive findings, as it showed it makes a difference, regardless of its amount.
By harnessing the power of the sun to promote a shift away from traditional propulsion systems, hybrid vessels can reduce their reliance upon fossil fuels, in turn reducing the emission of harmful pollutants and striving toward greener practices in this sector.
It also provides an avenue of operational versatility for hybrid systems equipped with renewable energy sources, as it serves as a strategic advantage in being flexible with ever-changing market conditions and regulatory changes.
The use of advanced mounting techniques has proven that integration of these systems can be a relatively seamless transition with any vessel possessing the capability to produce solar power, therefore hurdling any sort of prerequisites for the feasibility of designing these systems for existing vessels. The design process for systems onboard new vessels proves to be even easier with the opportunity to designate areas of open space for this exact purpose, which would further the potential for energy production using solar panels even more.
Proven integration of such systems holds promise for further innovation and technological advancements within the maritime industry. With investors scouring the world for renewable energy solutions, the opportunity for increased optimization for hybrid vessels becomes ever so attainable as the sector moves forward.
Based on the findings, some recommendations for optimal application and further research have been developed:
- When looking at where PV systems would be best deployed onto hybrid ships, many factors contribute toward what the ideal scenario would look like. The first is the geological location, as PV systems heavily rely on available sunlight. These systems would be most effective in areas where the solar irradiance is greater, which is most likely to occur in equatorial areas. This is not to say that they cannot be beneficial in regions where solar irradiance is not optimal but that these systems will not be as effective.
- Another factor that heavily impacts how effective these systems can be is the available deck space. The availability of sufficient deck space is essential for installing PV panels on ships. Larger deck areas provide more surface area for solar panel installation, allowing for greater solar energy capture. The layout and design of a ship’s deck space must be considered to ensure the optimal positioning and orientation of PV panels for maximum sunlight exposure.
Regarding further research, some key areas have been identified where research could be extremely beneficial in informing industry stakeholders and accelerating the adoption of these systems globally:
- Research efforts should focus on analyzing market trends and regulatory frameworks to identify opportunities and barriers to the widespread adoption of PV systems in the maritime sector. This includes looking at financial incentives, subsidies and policy mechanisms that promote renewable energy integration.
- In addition, research on a lifecycle analysis of a PV system would greatly benefit the understanding of the environmental and economic attributes for extracting the raw materials and manufacturing the components, as well as the end-of-life procedure. This would give a more conclusive understanding of how beneficial or harmful these systems are for the world.
Author Contributions
Conceptualization, L.M. and H.W.; methodology, L.M. and H.W.; software, L.M.; validation, H.W.; formal analysis, L.M.; investigation, L.M. and H.W.; resources, H.W.; data curation, H.W.; writing—original draft preparation, L.M.; writing—review and editing, L.M. and H.W.; visualization, L.M.; supervision, H.W.; project administration, L.M. and H.W. All authors have read and agreed to the published version of the manuscript.
Funding
This research received no external funding.
Data Availability Statement
The original contributions presented in the study are included in the article, further inquiries can be directed to the corresponding author.
Conflicts of Interest
The authors declare no conflicts of interest.
Abbreviations
| 2D | Two-dimensional |
| AC | Alternating current |
| CAD | Computer-aided design |
| CALMAC | Caledonian Macbrayne |
| CMAL | Caledonian Maritime Assets Limited |
| CO2 | Carbon dioxide |
| CPV | Concentrated photovoltaics |
| DC | Direct current |
| DoD | Depth of discharge |
| EFf | Emissions-based fuel factor |
| EOL | End of life |
| GHG | Greenhouse gases |
| GIS | Geographic information system |
| GT | Gross tonnage |
| HCPV | High-concentration photovoltaics |
| IMO | In my opinion |
| kg | Kilogram |
| kW | Kilowatt |
| LCPV | Low-concentration photovoltaics |
| ME | Main engine |
| MDO | Marine diesel oil |
| MPPT | Maximum power point tracking |
| MPPCP | Maximum PV panel coverage problem |
| MV | Merchant vessel |
| MW | Megawatt |
| NOx | Nitrogen oxides |
| PPM | Parts per million |
| PV | Photovoltaic |
| RPM | Revolutions per minute |
| ROI | Return on investment |
| Ro-Ro | Roll-on/roll-off |
| SFOC | Specific fuel oil consumption |
| SOx | Sulfur Oxides |
References
- Nations, U. What Is Climate Change? 2023. Available online: https://www.un.org/en/climatechange/what-is-climate-change (accessed on 18 December 2023).
- Department of Transport. The Rt Hon Mark Harper MP Maritime Sector given Green Boost with Major COP27 Pledge. Available online: https://www.gov.uk/government/news/maritime-sector-given-green-boost-with-major-cop27-pledge (accessed on 18 December 2023).
- Stephen Hall These Charts Show Record Renewable Energy Investment in 2022. Available online: https://www.weforum.org/agenda/2022/07/global-renewable-energy-investment-iea/ (accessed on 20 December 2023).
- Ritchie, H.; Roser, M.; Rosado, P. Renewable Energy. 2020. Available online: https://ourworldindata.org/renewable-energy (accessed on 20 December 2023).
- Molly Lempriere Solar PV Costs Fall 82% over the Last Decade. Available online: https://www.solarpowerportal.co.uk/solar_pv_costs_fall_82_over_the_last_decade_says_irena/ (accessed on 20 December 2023).
- Lexie Pelchen Nearly Half of Americans Plan to Install Solar, But over a Third Worry about Upfront Cost. 2022. Available online: https://www.forbes.com/home-improvement/features/will-americans-go-solar/ (accessed on 20 December 2023).
- Lucía Fernández Global Cumulative Installed Solar PV Capacity 2000–2022. Available online: https://www.statista.com/statistics/280220/global-cumulative-installed-solar-pv-capacity/ (accessed on 21 December 2023).
- Ameli, N.; Nijsse, M.; Mercure, J. Solar Power Expected to Dominate Electricity Generation by 2050. 2023. Available online: https://theconversation.com/solar-power-expected-to-dominate-electricity-generation-by-2050-even-without-more-ambitious-climate-policies-215367 (accessed on 20 December 2023).
- IEA. World Energy Outlook 2022; International Energy Agency: Paris, France, 2022; Available online: https://www.iea.org/reports/world-energy-outlook-2022 (accessed on 20 December 2023).
- Vikram Aggarwal How Do Solar Panels Work? Solar Power Explained. Available online: https://www.energysage.com/solar/solar-panels-work/ (accessed on 22 December 2023).
- Chowdhury, M.S.; Rahman, K.S.; Chowdhury, T.; Nuthammachot, N.; Techato, K.; Akhtaruzzaman, M.; Tiong, S.K.; Sopian, K.; Amin, N. An Overview of Solar Photovoltaic Panels’ End-of-Life Material Recycling. Energy Strategy Rev. 2020, 27, 100431. [Google Scholar] [CrossRef]
- The Marine Times Battery and Hybrid Ships. How Do They Work and How Many Are in Operation. Available online: https://themarinetimes.com/battery-and-hybrid-ships-how-do-they-work-and-how-many-are-in-operation/#:~:text=Currently%20there%20are%20almost%20250%20ships%20fitted%20with,a%20similar%20number%20under%20construction%20or%20on%20order (accessed on 4 January 2024).
- Lidija Grozdanic Tûranor PlanetSolar: World’s Largest Solar-Powered Boat Sets Transatlantic Speed Record. Available online: https://inhabitat.com/turanor-planetsolar-worlds-largest-solar-powered-boat-sets-transatlantic-speed-record/ (accessed on 5 January 2024).
- Sodhi, M.; Banaszek, L.; Magee, C.; Rivero-Hudec, M. Economic Lifetimes of Solar Panels. Procedia CIRP 2022, 105, 782–787. [Google Scholar] [CrossRef]
- Tom Gill Marine Solar Panels. Available online: https://www.theecoexperts.co.uk/solar-panels/marine#:~:text=They%20function%20just%20like%20ordinary%20solar%20panels%20you%E2%80%99d,to%20withstand%20the%20harsh%20conditions%20of%20the%20sea (accessed on 30 September 2023).
- INHABITAT World’s First Cargo Ship Propelled by Solar Panels. Available online: https://inhabitat.com/auriga-leader-cargo-ship-gets-power-from-solar-panels/ (accessed on 4 October 2023).
- Formica, T.; Pecht, M. Return on Investment Analysis and Simulation of a 9.12 Kilowatt (KW) Solar Photovoltaic System. Solar Energy 2017, 144, 629–634. [Google Scholar] [CrossRef]
- Saragih, H.C.R.; Masroeri, A.A.; Prananda, J. Technical and economic analysis of the use of solar panel and wind turbine as source of electrical power to fulfill the need for lighting in the 2000gt pioneer ship. In Proceedings of the Marine Safety and Maritime Installation (MSMI 2018), Bali, Indonesia, 9–11 July 2018; Clausius Scientific Press: Ottawa, ON, Canada, 2018. [Google Scholar]
- IMO. 2023 IMO Strategy on Reduction of GHG Emissions from Ships; IMO: London, UK, 2023. [Google Scholar]
- Yu, W.; Zhou, P.; Wang, H. Evaluation on the Energy Efficiency and Emissions Reduction of a Short-Route Hybrid Sightseeing Ship. Ocean. Eng. 2018, 162, 34–42. [Google Scholar] [CrossRef]
- Ziemińska-Stolarska, A.; Pietrzak, M.; Zbiciński, I. Application of LCA to Determine Environmental Impact of Concentrated Photovoltaic Solar Panels. Energies 2021, 4, 3143. [Google Scholar] [CrossRef]
- Hassan, Q.; Abbas, M.K.; Abdulateef, A.M.; Abdulateef, J.; Mohamad, A. Assessment the Potential Solar Energy with the Models for Optimum Tilt Angles of Maximum Solar Irradiance for Iraq. Case Stud. Chem. Environ. Eng. 2021, 4, 100140. [Google Scholar] [CrossRef]
- Zhong, Q.; Tong, D. Spatial Layout Optimization for Solar Photovoltaic (PV) Panel Installation. Renew Energy 2020, 150, 1–11. [Google Scholar] [CrossRef]
- Dewi, T.; Taqwa, A.; Kusumanto, R.D.; Sitompul, C.R. The Investigation of Sea Salt Soiling on PV Panel. In 4th Forum in Research, Science, and Technology (FIRST-T1-T2-2020); Atlantis Press: Amsterdam, The Netherlands, 2021. [Google Scholar] [CrossRef]
- The Greenwatt How to Calculate Solar Panel Output. Available online: https://thegreenwatt.com/how-to-calculate-solar-panel-output/ (accessed on 6 February 2024).
- Alex Beale Peak Sun Hours Calculator. Available online: https://footprinthero.com/peak-sun-hours-calculator (accessed on 6 February 2024).
- Beale, A. Solar Panel Tilt Angle Calculator. Footprint Hero 2022. Available online: https://footprinthero.com/solar-panel-tilt-angle-calculator (accessed on 6 February 2024).
- Volvo Penta. D13-MG (FE); Volvo Penta: Göteborg, Sweden, 2021. [Google Scholar]
- IMO. Fourth Greenhouse Gas Study; IMO: London, UK, 2020. [Google Scholar]
- IMO Nitrogen Oxides (NOx)—Regulation 13. Available online: https://www.imo.org/en/OurWork/Environment/Pages/Nitrogen-oxides-(NOx)-%E2%80%93-Regulation-13.aspx (accessed on 28 February 2024).
- Crown Oil EN 590 Diesel Fuel Specifications (ULSD). Available online: https://www.crownoil.co.uk/fuel-specifications/en-590/#:~:text=EN%20590%20is%20the%20current%20standard%20for%20all,fuel%20is%20also%20called%20ultra-low%20sulphur%20diesel%20%28ULSD%29 (accessed on 28 February 2024).
- CalMac MV Hallaig. Available online: https://www.calmac.co.uk/fleet/mv-hallaig (accessed on 11 March 2024).
- Wikipedia MV Hallaig. Available online: https://en.wikipedia.org/wiki/MV_Hallaig (accessed on 11 March 2024).
- Calmac (Sconser—Raasay)—Summer Timetable 2024. Available online: https://www.calmac.co.uk/summer-timetables/sconser-raasay (accessed on 11 March 2024).
- Emily Glover; Corinne Tynan How Long Do Solar Panels Last? Available online: https://www.forbes.com/home-improvement/solar/how-long-do-solar-panels-last/ (accessed on 13 February 2024).
- Renugen Renugen—LG 360W Mono Neon R Prime V5 Black. Available online: https://www.renugen.co.uk/lg-360w-mono-neon-r-prime-v5-black/ (accessed on 6 February 2024).
- Ebay Victron Energy SmartSolar MPPT RS 450/100-Tr Solar Charge Controller. Available online: https://www.ebay.co.uk/itm/155970618327?hash=item245092c3d7:g:aLAAAOSw7qplifTo&amdata=enc%3AAQAIAAAA8MHjYDqGociXGWIpIbbuWEK%2FfsTF%2BAXOou4FoVimsqVrrfRbFCocVsEk%2FZH%2B%2FBrCyJ8ccKmEUX%2F0wzcDbd0O1SusKoPlnK7U9VQbK%2FJPPKRKRBRkbt8yuXClyXQwZLQW%2FD09BYPFy0k0rxtMDKd9pltINOtX0ks9PIvmmBo%2Bv8%2BgNb2lsenSmFV8IYjEftrpAgXV5nSNvov2ZUyvyfEtVZ0%2FkCtXqPCVa7H5UuQ6nOQftDZg41OoFEUNc9kr4GJnO7JcqmUipsBh03%2BOT5D%2FQV1WgUcWdahWFLjfgyy0PbR2PX2KSjrbcHy0otkbd0M1gw%3D%3D%7Ctkp%3ABk9SR8qelumzYw (accessed on 13 February 2024).
- Solar Sparky Solis S6-GR1P6K-DC Inverter Dual MPPT 6kW Single Phase. Available online: https://www.tradesparky.com/solarsparky/inverters/solis/single-phase/solis-s6-gr1p6k-dc-inverter-dual-mppt-6kw-single-phase?affiliate=product_feed&utm_source=product_feed&utm_medium=product_feed&utm_campaign=product_feed&utm_source=bing&utm_medium=cpc&utm_campaign=shopping&utm_source=bing&utm_medium=cpc&utm_campaign=shopping&msclkid=430262e178da16bacb89072ae5649276# (accessed on 21 February 2024).
- Low Energy Super Market Solar Panel Pole Mounting PV Adjustable Size Lamp Post Side Utility Post Mount. Available online: https://www.ebay.co.uk/itm/233235197979?chn=ps&norover=1&mkevt=1&mkrid=710-153316-527457-8&mkcid=2&itemid=233235197979&targetid=4585513252137476&device=c&mktype=&googleloc=&poi=&campaignid=554609237&mkgroupid=1310618964595038&rlsatarget=pla-4585513252137476&abcId=9320693&merchantid=87779&msclkid=31483637151a170595c353d829ea6d5f (accessed on 6 February 2024).
- OnBuy Adjustable Solar Panel Tilt Mount Brackets for 100–600 W Solar Panels, 15 to 30 Degrees, RV Roof Flat Surface Aluminum Mounting Set. Available online: https://www.onbuy.com/gb/p/adjustable-solar-panel-tilt-mount-brackets-for-100w-600w-solar-panels-15-to-30-degrees-rv-roof-flat-surface-aluminum-mounting-set~p79622533/?exta=bingsh&lid=113817202&stat=eyJpcCI6IjY1LjM3MDAiLCJkcCI6IjAuMDAwMCIsImxpZCI6MTEzODE3MjAyLCJzIjoiMiIsInQiOjE3MDc1Mjg0MDcsImJtYyI6IjEwLjAifQ==&exta=bingsh&utm_source=bing&utm_campaign=579768981&utm_medium=pmax&utm_content=&msclkid=6cde52e28a0d15d6cf7b3728ae769441&utm_term=4575136624653874 (accessed on 13 February 2024).
- Checkatrade How Much Does Solar Panel Installation Cost? Available online: https://www.checkatrade.com/blog/cost-guides/cost-of-solar-panel-installation/ (accessed on 12 March 2024).
- Skills Training Group Solar Panels Maintenance Cost: How Much Do You Need to Pay for One? Available online: https://www.skillstg.co.uk/blog/solar-panels-maintenance-cost/ (accessed on 13 February 2024).
- GlobalPetrolPrices Diesel Prices in Europe. Available online: https://www.globalpetrolprices.com/diesel_prices/Europe/ (accessed on 4 March 2024).
- GlobalPetrolPrices Greece Electricity Prices. Available online: https://www.globalpetrolprices.com/Greece/electricity_prices/ (accessed on 4 March 2024).
- EU Energy Electricity Prices Rotterdam. Available online: https://euenergy.live/electricity-prices/netherlands/rotterdam#:~:text=The%20latest%20energy%20price%20in%20Rotterdam%20is,%E2%82%AC%2069.83%20MWh%2C%20or%20%E2%82%AC%200.07%20kWh (accessed on 4 March 2024).
- Electricity Prices ScottishPower Tariffs, Prices & Reviews. Available online: https://www.electricityprices.org.uk/scottishpower-tariffs/#:~:text=Average%20ScottishPower%20Prices%20per%20Property%20Last%20Updated%3A%2018%2F02%2F2024,These%20figures%20are%20correct%20as%20of%20January%202024 (accessed on 21 February 2024).
- NCCS Singapores Climate Action—Mitigation Efforts—Power. Available online: https://www.nccs.gov.sg/singapores-climate-action/mitigation-efforts/power/ (accessed on 4 March 2024).
- Nowtricity Netherlands Emissions. Available online: https://www.nowtricity.com/country/netherlands/ (accessed on 4 March 2024).
- Anderson, J. CMAL HYBRID FERRIES Hybrid Ferries Project Developing the World’s First Sea Going Roll on Roll off Vehicle and Passenger Diesel Electric Hybrid Ferries, 2012.
Figure 1.
Tûranor PlanetSolar [13].
Figure 1.
Tûranor PlanetSolar [13].
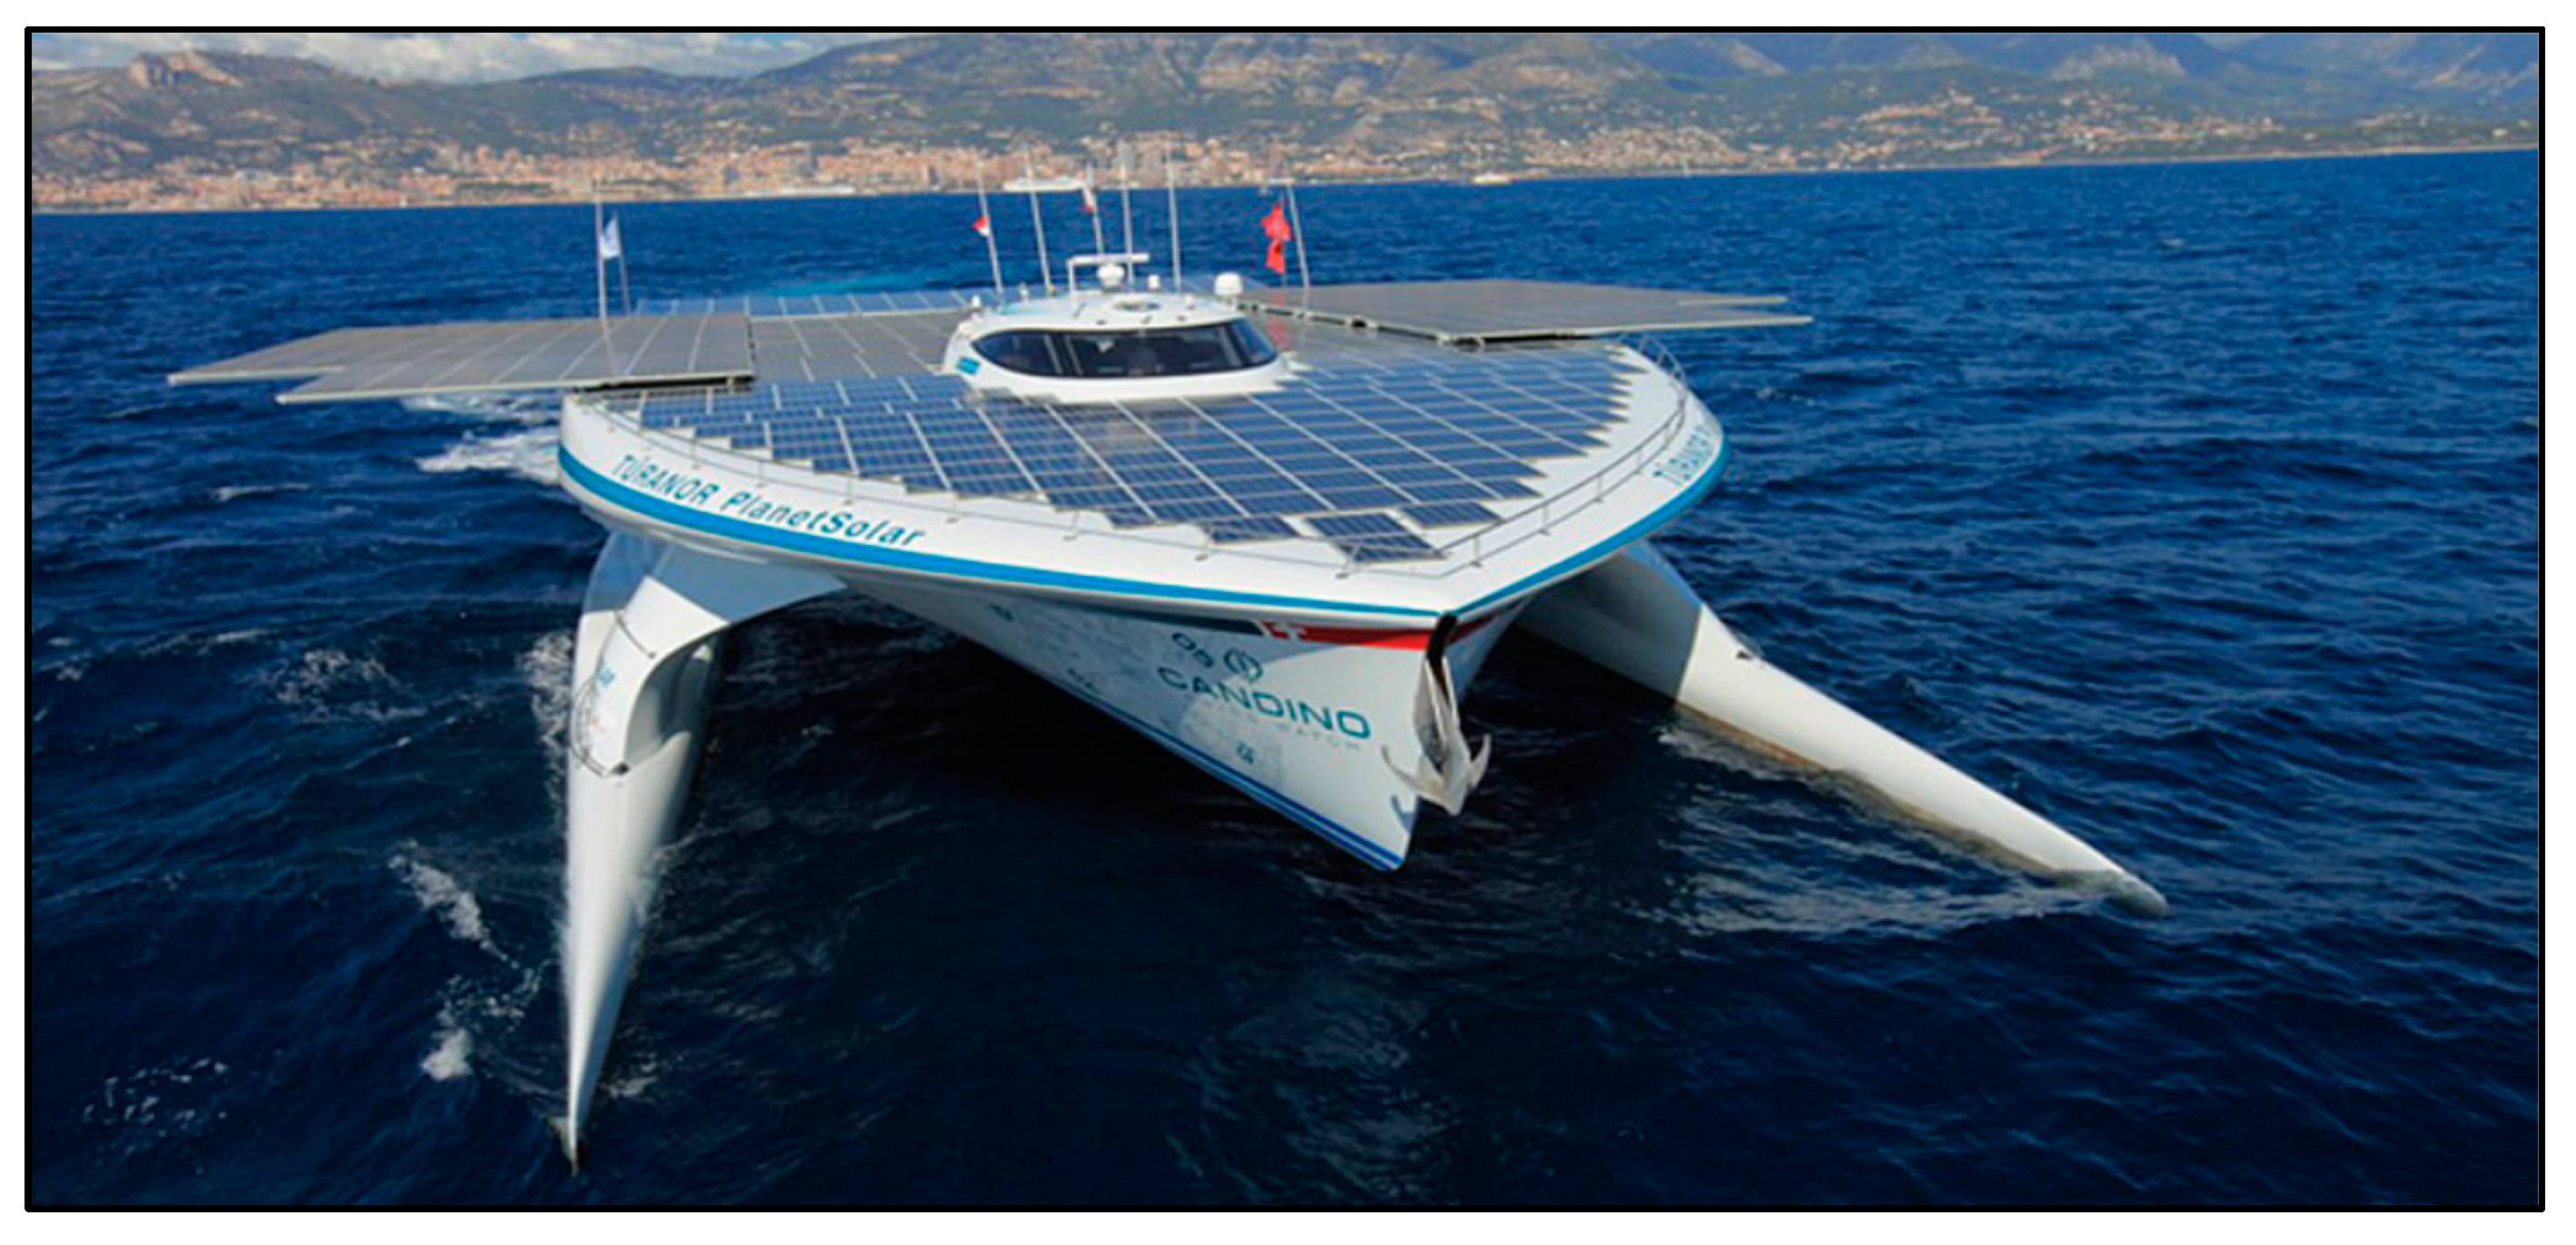
Figure 2.
MV Hallaig [32].
Figure 2.
MV Hallaig [32].
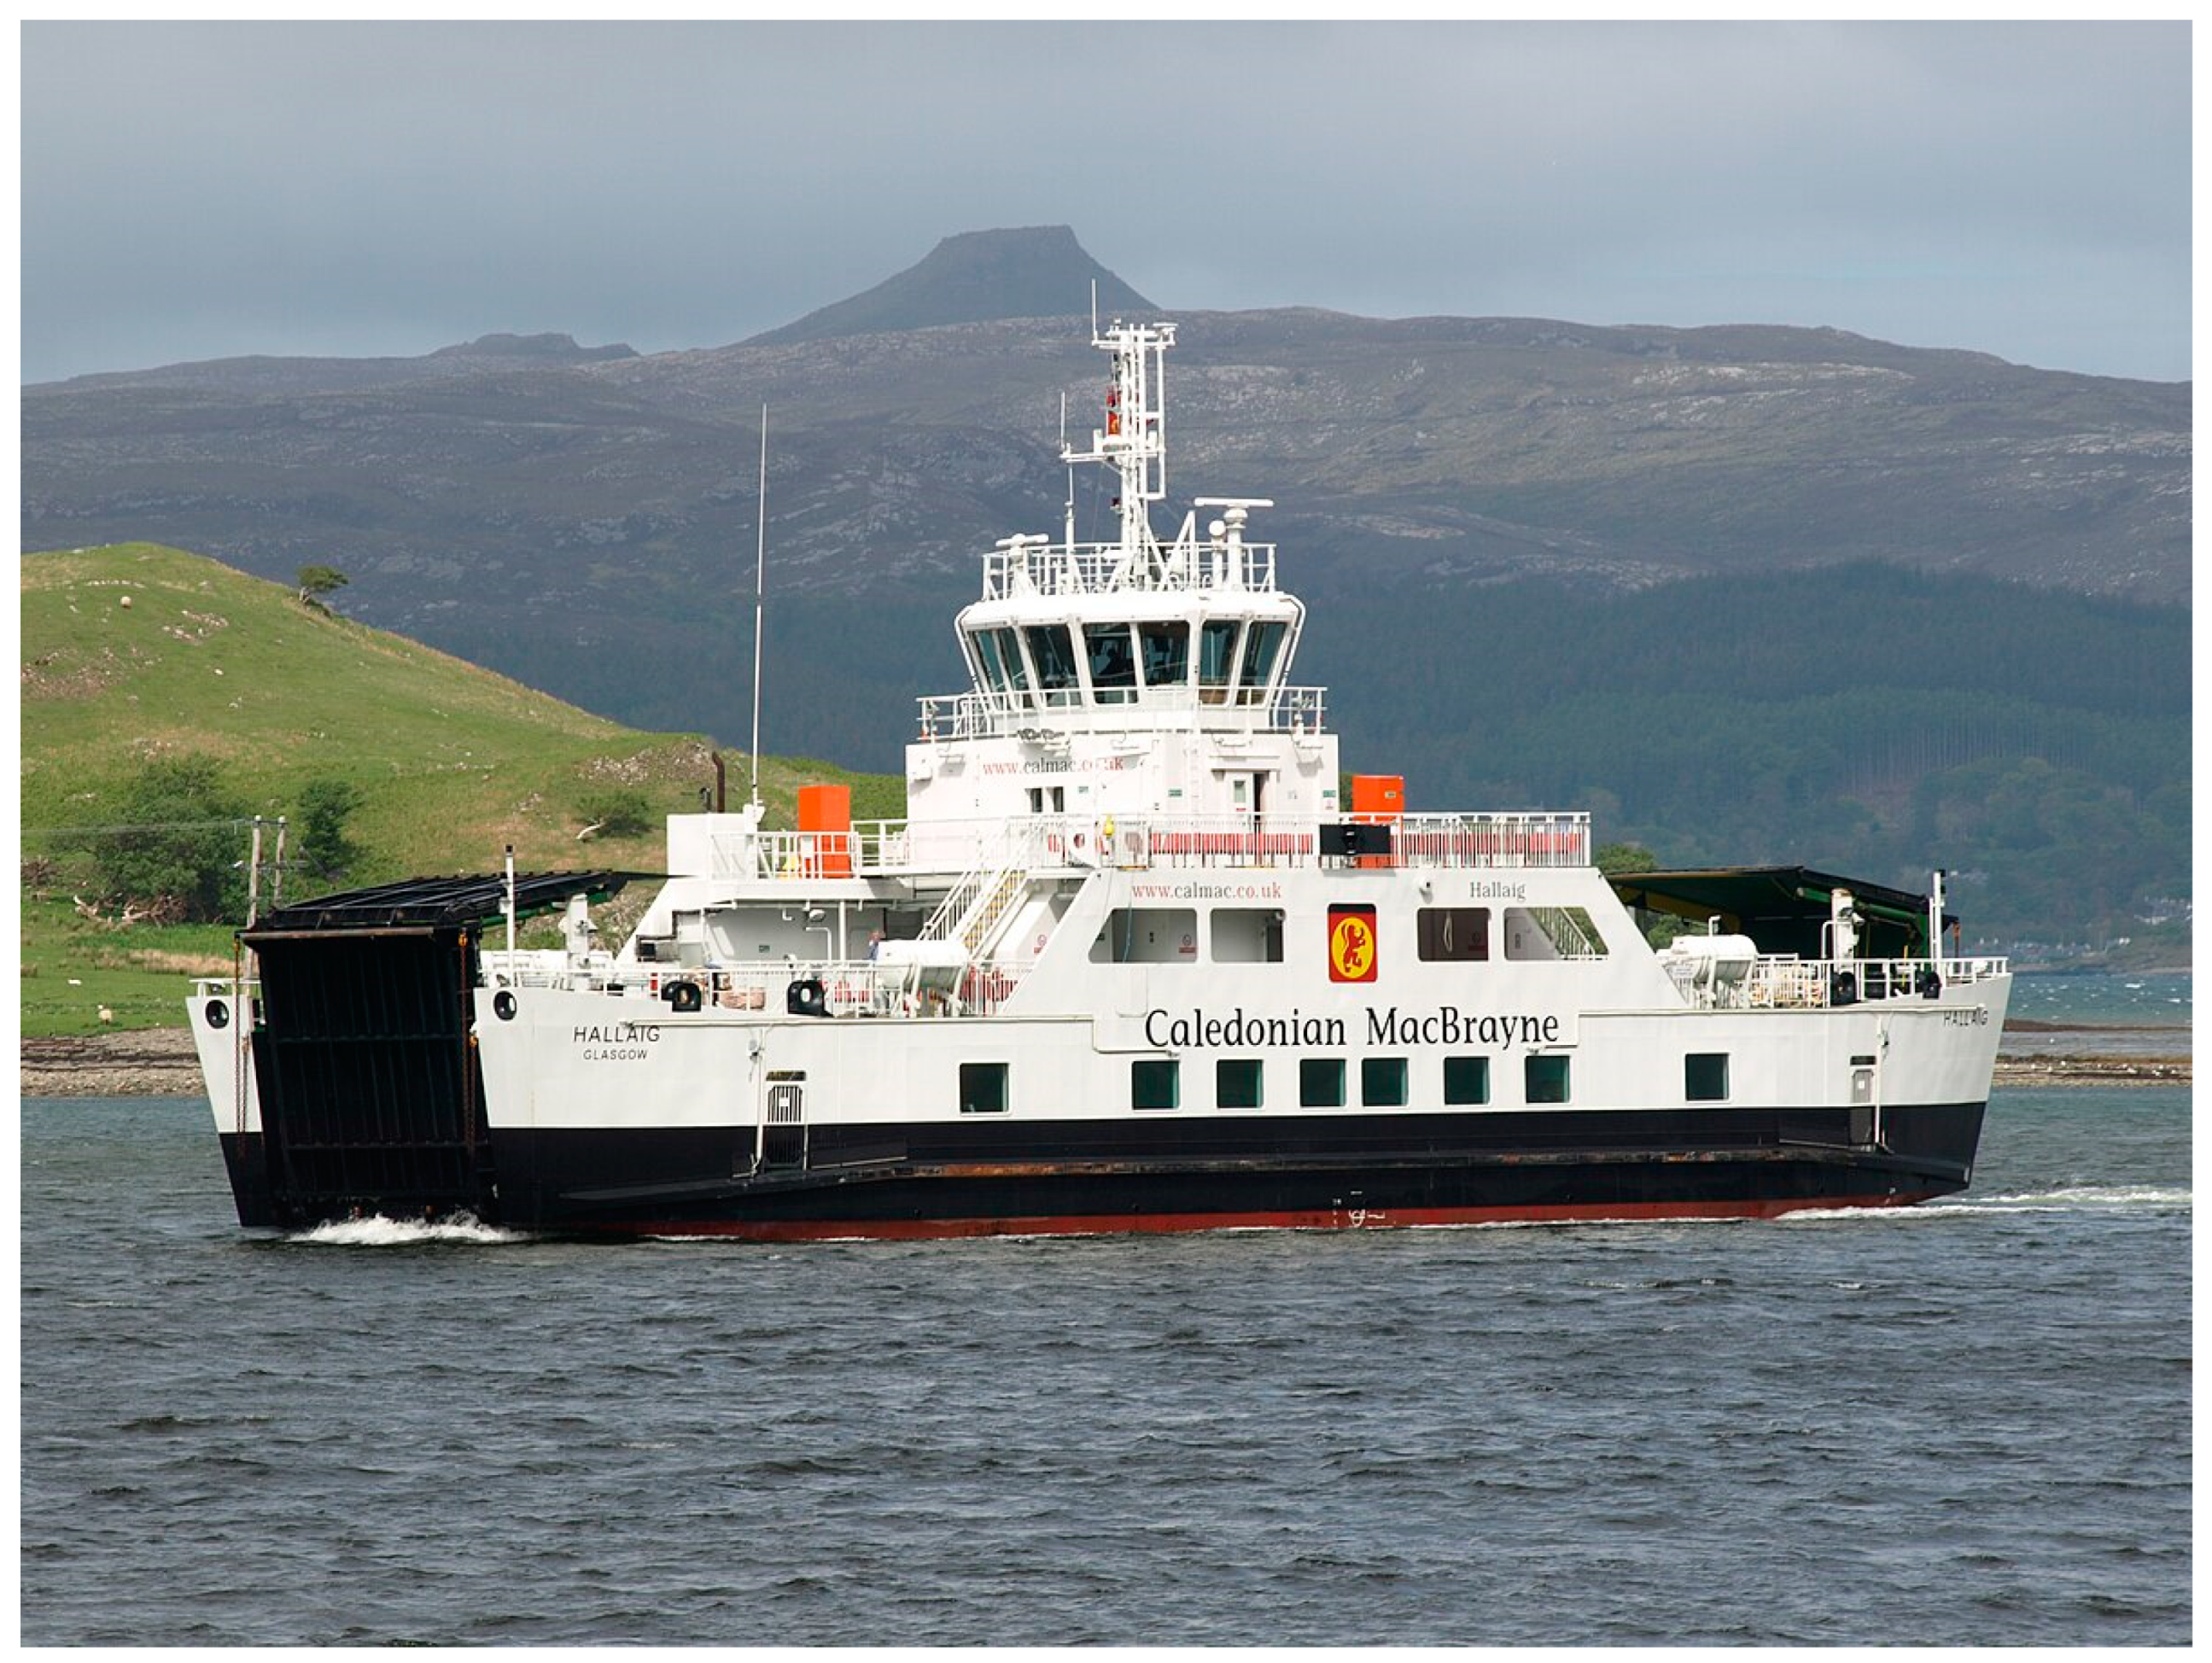
Figure 3.
Operational route.
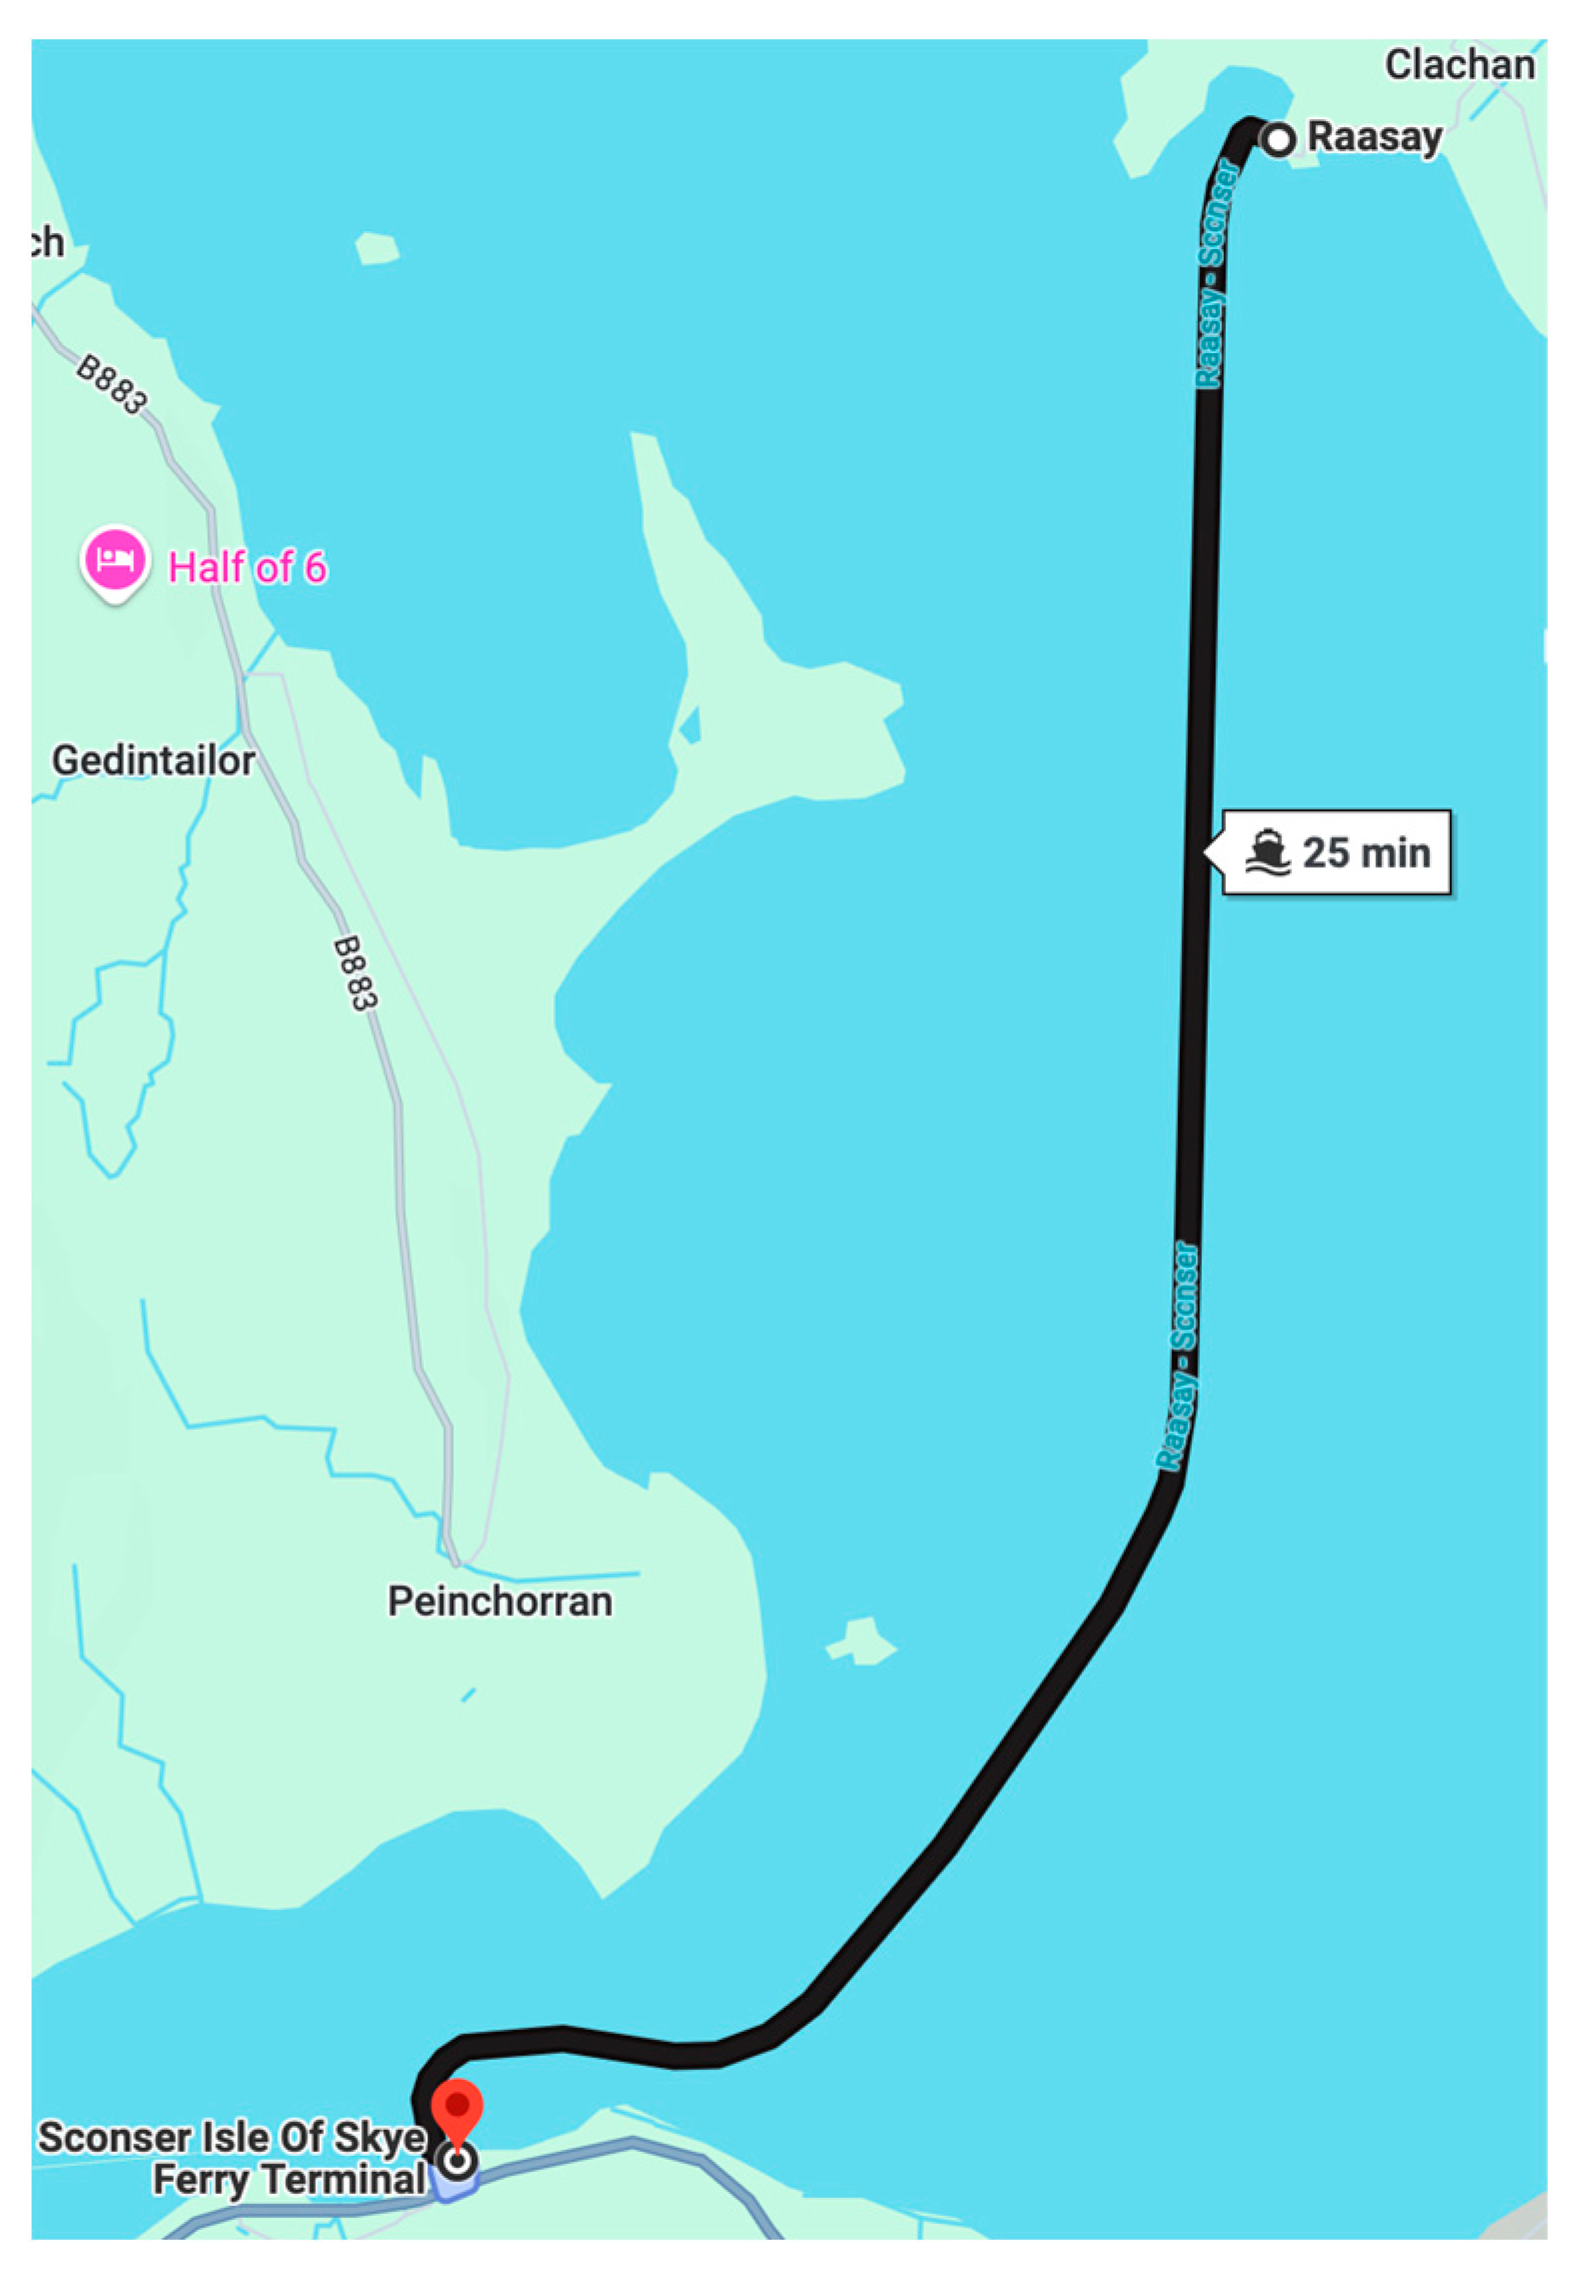
Figure 4.
Sconser to Raasay summer timetable [34].
Figure 4.
Sconser to Raasay summer timetable [34].
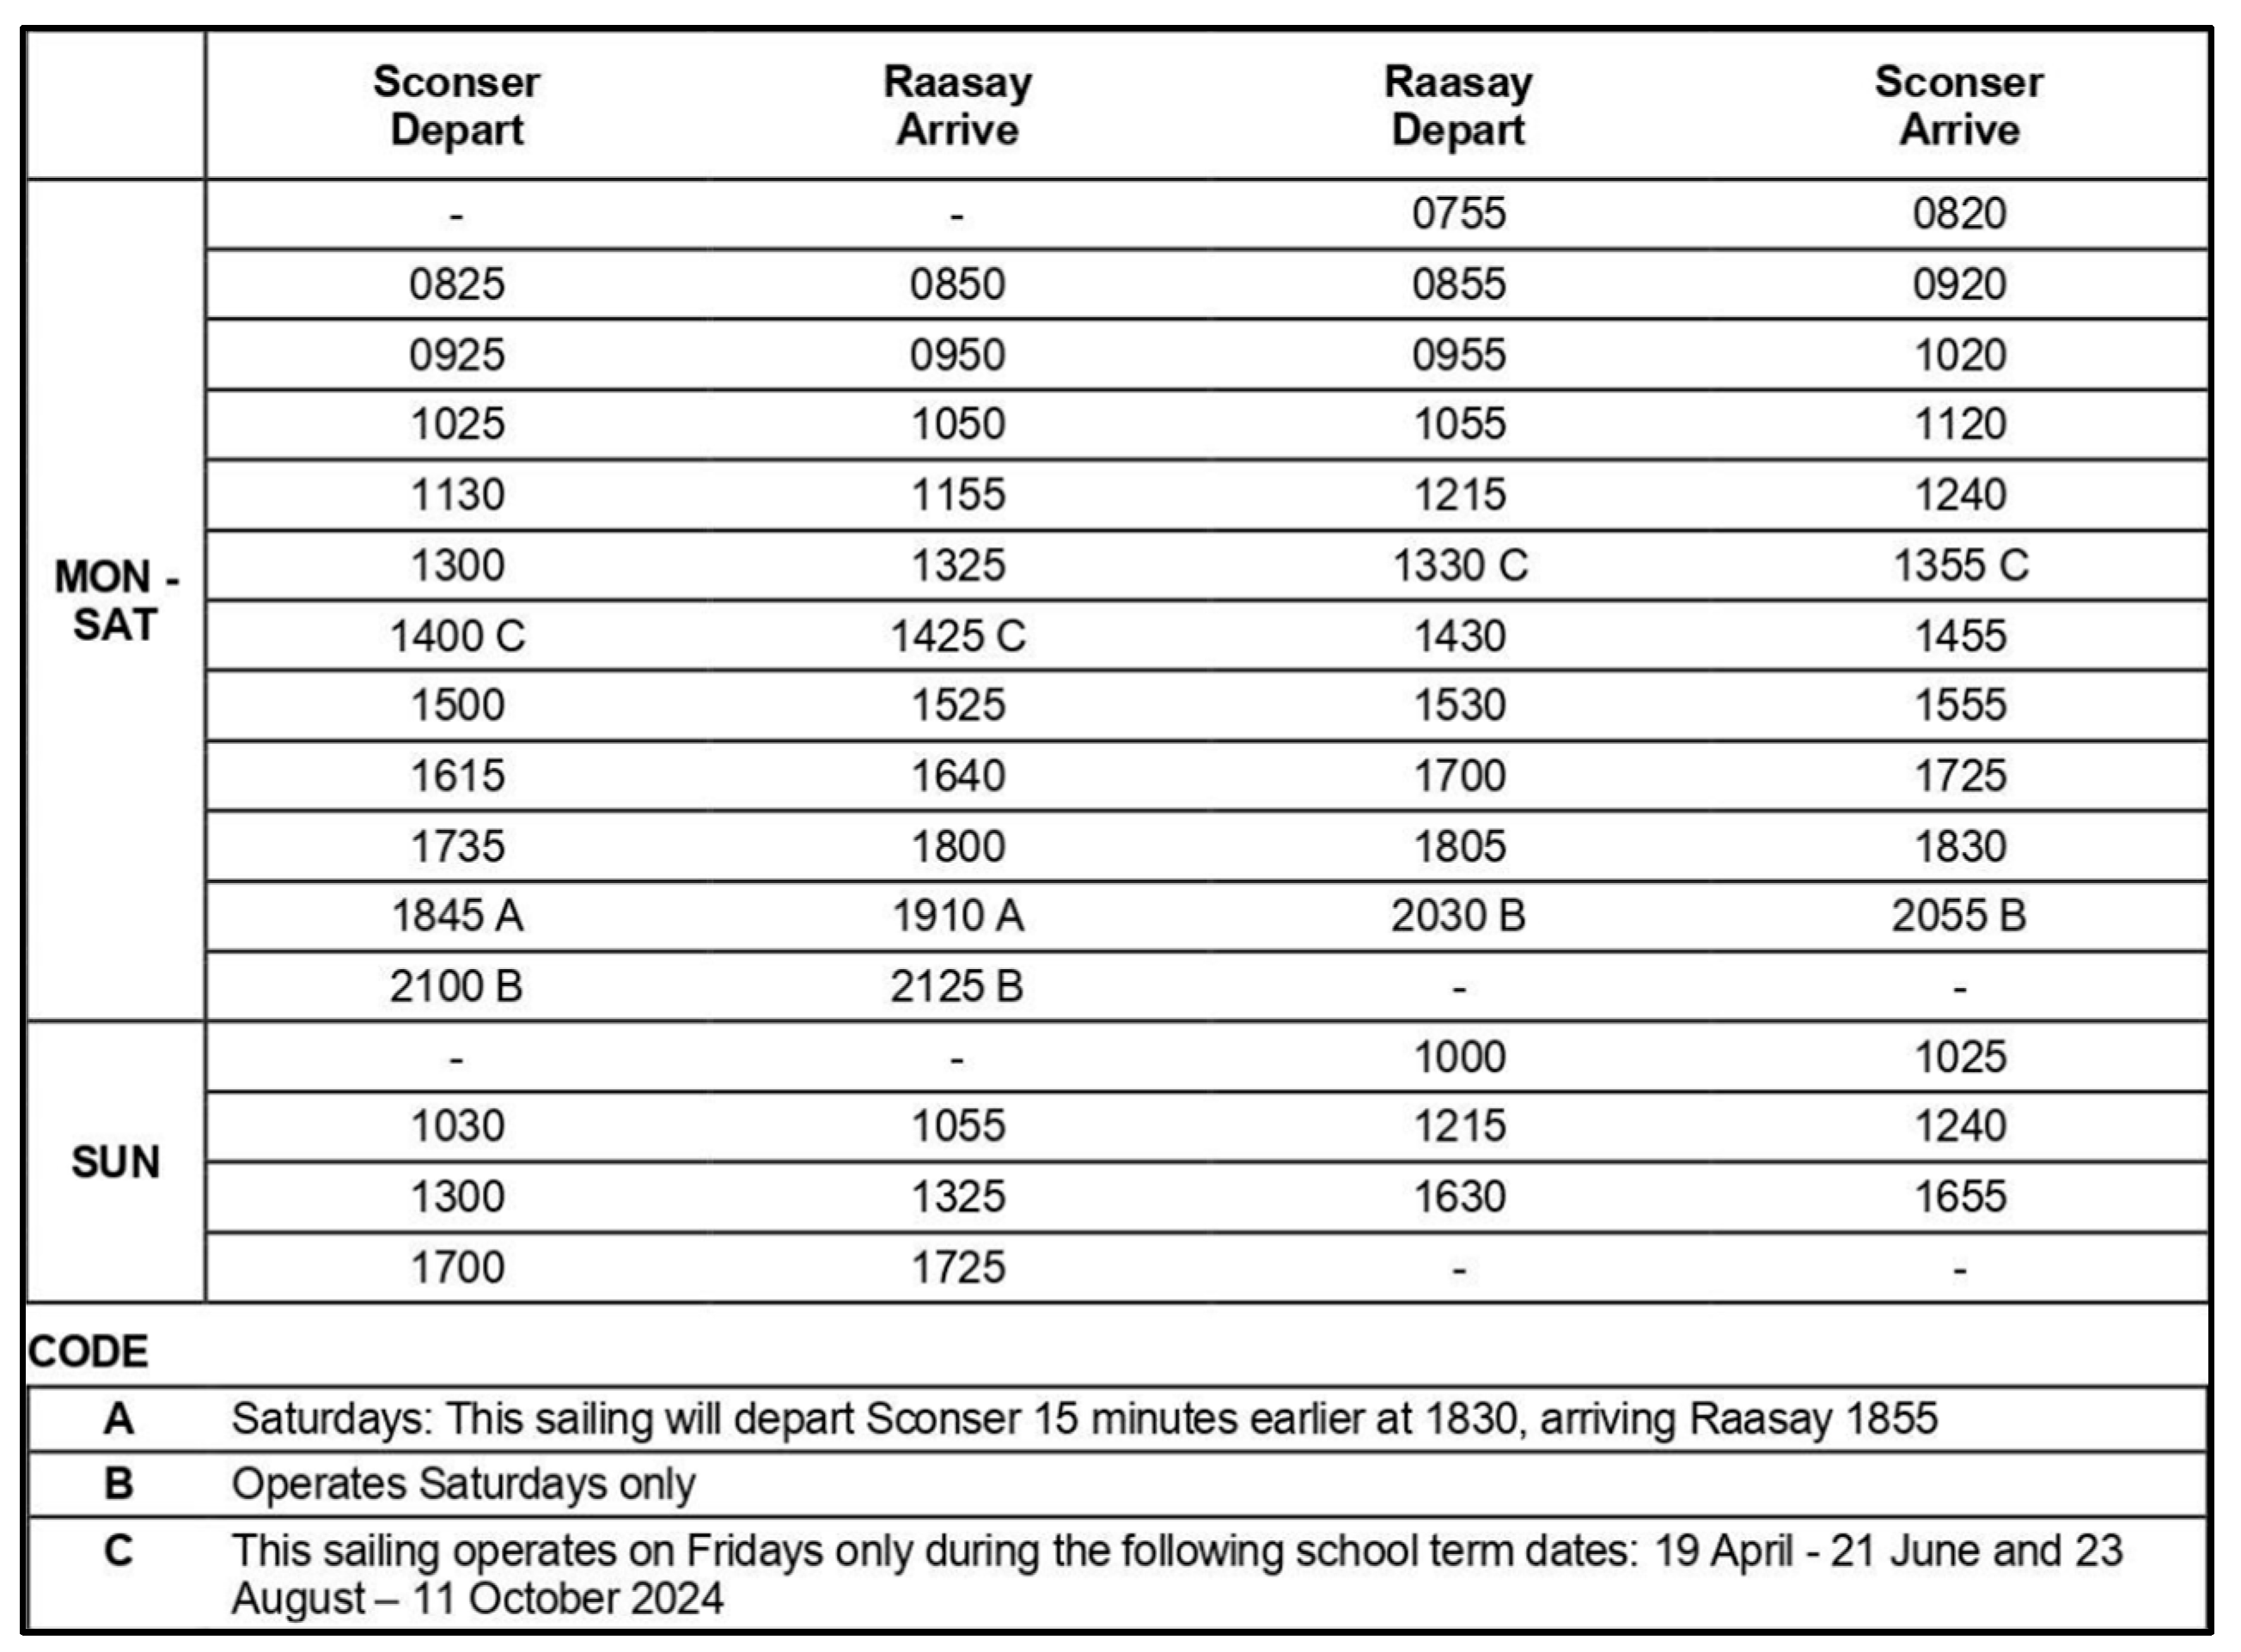
Figure 5.
New hybrid system 2D line diagram.

Figure 6.
A 2D general arrangement solar panel layout drawing.

Figure 7.
Payback period.
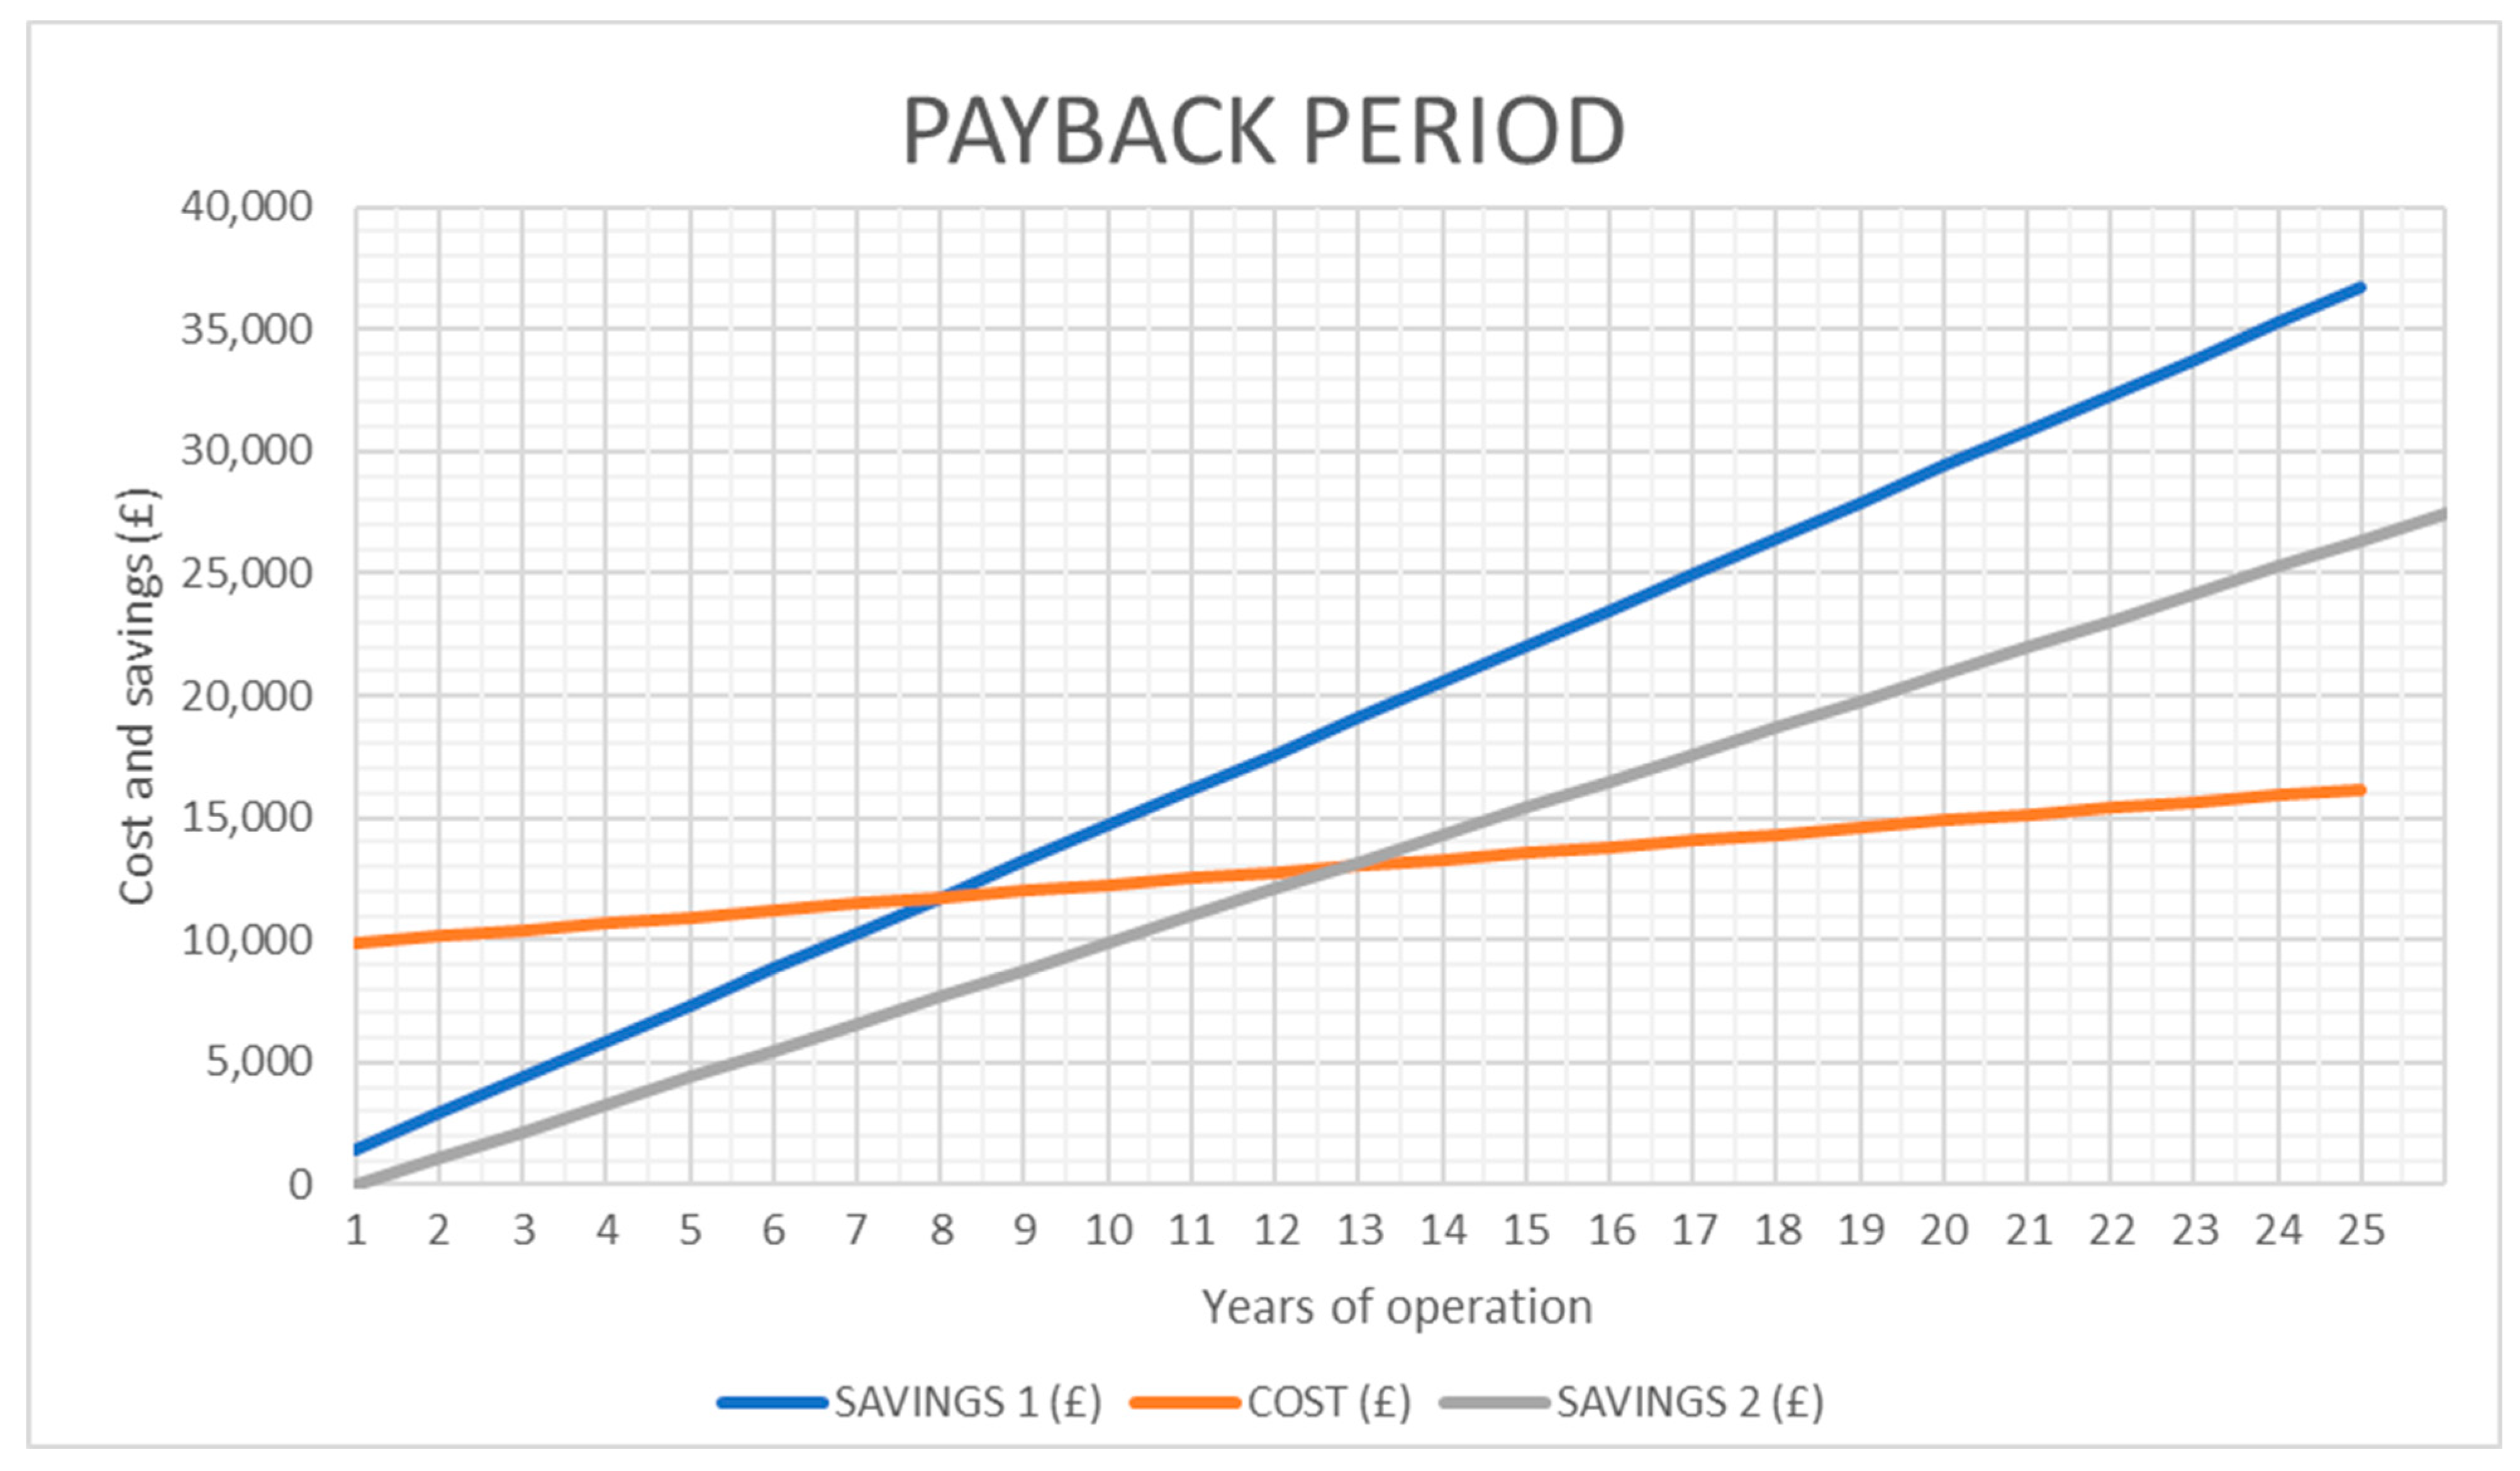
Figure 8.
Impact of PV systems in varying countries.

Table 1.
MV Hallaig’s specifications [33].
Table 1.
MV Hallaig’s specifications [33].
| Type of Vessel | Ro-Ro Ferry |
|---|---|
| Gross tonnage | 499 t |
| Deadweight (DWT) | 135 t |
| Length | 43.5 m |
| Beam | 12.2 m |
| Draught | 1.73 m |
| Speed | 9 kts |
| Capacity | 150 passengers, 23 cars, 2 HGVs |
Table 2.
Engine performance and fuel consumption.
| Engine Load | SFOC |
|---|---|
| 50% | 197 g/kWh |
| 75% | 190 g/kWh |
| 100% | 191 g/kWh |
Table 3.
Operational hours.
| Hours/Day | Power Demands | |
|---|---|---|
| Transit | 7 | 354 kW |
| Maneuvering | 0.7 | 152 kW |
| At slip | 4.01 | 104 kW |
Table 4.
LG 360 W Mono Neon R Prime V5 Black specifications.
| LG 360 W Mono Neon R Prime V5 Black | |
|---|---|
| Rated Power | 360 W |
| Weight | 17.5 kg |
| Length | 1.7 m |
| Width | 1.016 m |
| Depth | 0.04 m |
| Efficiency | 20.8% |
Table 5.
Component costs.
| Component | No. of Units | Cost/Unit (GBP) | Total Cost (GBP) |
|---|---|---|---|
| Solar panels [36] | 17 | 185.60 | 3155.20 |
| Rail brackets [39] | 13 | 79.99 | 1039.87 |
| Wall brackets [40] | 4 | 65.37 | 261.48 |
| Charge controller [37] | 1 | 1288 | 1288 |
| Inverter [38] | 1 | 553.88 | 553.88 |
Table 6.
Installation costs.
| Installation Cost | No. of Laborers | No of Days | Cost Per Day/Laborer | Total Cost (GBP) |
|---|---|---|---|---|
| Labor [41] | 3 | 4 | 300 | 3600 |
Table 7.
Maintenance Costs [42].
Table 7.
Maintenance Costs [42].
| Maintenance Cost | Lifetime (Years) | Cost Per Year (GBP) | Total Lifetime Cost (GBP) |
|---|---|---|---|
| Yearly service | 25 | 150 | 3750 |
| Yearly maintenance | 25 | 161.50 | 4037.50 |
Table 8.
Engine costs and emissions.
| First Strategy | Second Strategy | |||
|---|---|---|---|---|
| Propulsion system | diesel electric | diesel electric + solar | diesel electric | diesel electric + solar |
| Phase of crossing | transit: 9 knots | transit: 9 knots | transit: 9 knots | transit: 9 knots |
| Daily hours | 7 | 7 | 7 | 7 |
| Number connected | 1 | 1 | 1 | 1 |
| Installed ME power (kW) | 360 | 360 | 360 | 360 |
| Estimated ME power demand (kW) | 354 | 354 | 339.77 | 338.07 |
| Main engine load )%_ | 98.33 | 98.33 | 94.38 | 93.91 |
| SFOC (g/kWh) | 190.7 | 190.7 | 190.1 | 190 |
| Energy consumption (kWh) | 2478 | 2478 | 2378.37 | 2366.49 |
| Fuel consumed (liters) | 562.57 | 562.565 | 538.25 | 535.25 |
| Fuel cost (£) | 860.73 | 860.73 | 823.52 | 818.97 |
| Emissions produced (kg CO2) | 1515.01 | 1515.01 | 1449.52 | 1441.52 |
| Emissions produced (kg NOx) | 20.28 | 20.28 | 19.46 | 19.37 |
| Emissions produced (mg SOx) | 4725.55 | 4725.55 | 4521.28 | 4496.32 |
Table 9.
Battery capacity.
| Battery Capacity (kwh) | Battery DOD | Available Capacity (kwh) |
|---|---|---|
| 700 | 80% | 560 |
Table 10.
Maneuvering and slip energy demands.
| Man. | Slip | |
|---|---|---|
| Power demand (kW) | 144 | 87 |
| Hours of operation | 00:42 | 04:08 |
| Energy usage (kWh) | 100.8 | 359.57 |
| Total energy usage (kWh) | 460.37 | |
Table 11.
Battery charging.
| First Strategy | Second Strategy | |||
|---|---|---|---|---|
| Propulsion system | Diesel electric | Diesel electric + solar | Diesel electric | Diesel electric + solar |
| Charging energy produced (kWh) | 0 | 11.89 | 0 | 0 |
| Net battery usage at end of day (kWh) | 460.37 | 448.49 | 560 | 560 |
| Cost to recharge battery for next day (GBP) | 131.76 | 128.36 | 160.27 | 160.27 |
| Emissions produced in recharging (kg CO2) | 99.90 | 97.32 | 121.52 | 121.52 |
Table 12.
Comparison of two strategies: emissions and savings.
| First Strategy | Second Strategy | |||
|---|---|---|---|---|
| Propulsion system | Diesel electric | Diesel electric + solar | Diesel electric | Diesel electric + solar |
| Total daily emissions (kg CO2) | 1614.91 | 1612.33 | 1571.04 | 1563.04 |
| Total daily cost (GBP) | 992.48 | 989.08 | 983.79 | 979.25 |
| CO2 reduction per year (kg CO2) | - | 833.06 | - | 2584.77 |
| Cost savings per day (GBP) | - | 3.40 | - | 4.55 |
| Cost savings per year (GBP) | - | 1098.72 | - | 1468.49 |
| Total profit at EOL (GBP) | 11,032 | 20,276.26 | ||
Table 13.
Location information.
| Location | Isle of Skye | Southampton | Rotterdam | Singapore | Athens |
|---|---|---|---|---|---|
| Solar panel tilt angle (degrees) | 38 | 35.8 | 36.2 | 3 | 30.6 |
| Daily solar energy (Wh/day) | 11,885.4 | 13,875.3 | 13,597.2 | 21,586.5 | 22,594 |
| Fuel price (GBP/liter) | 1.53 | 1.53 | 1.563 | 1.507 | 1.484 |
| Electricity price (GBP/kWh) | 0.286 | 0.286 | 0.07 | 0.247 | 0.162 |
| CO2 from electricity generation (g/kWh) | 0.217 | 0.217 | 0.421 | 0.406 | 0.136 |
Disclaimer/Publisher’s Note: The statements, opinions and data contained in all publications are solely those of the individual author(s) and contributor(s) and not of MDPI and/or the editor(s). MDPI and/or the editor(s) disclaim responsibility for any injury to people or property resulting from any ideas, methods, instructions or products referred to in the content. |
© 2024 by the authors. Licensee MDPI, Basel, Switzerland. This article is an open access article distributed under the terms and conditions of the Creative Commons Attribution (CC BY) license (https://creativecommons.org/licenses/by/4.0/).
Share and Cite
MDPI and ACS Style
McAllister, L.; Wang, H. Techno-Economic and Environmental Analysis of the Integration of PV Systems into Hybrid Vessels. Energies 2024, 17, 2303. https://doi.org/10.3390/en17102303
AMA Style
McAllister L, Wang H. Techno-Economic and Environmental Analysis of the Integration of PV Systems into Hybrid Vessels. Energies. 2024; 17(10):2303. https://doi.org/10.3390/en17102303
Chicago/Turabian StyleMcAllister, Lewis, and Haibin Wang. 2024. "Techno-Economic and Environmental Analysis of the Integration of PV Systems into Hybrid Vessels" Energies 17, no. 10: 2303. https://doi.org/10.3390/en17102303
Note that from the first issue of 2016, this journal uses article numbers instead of page numbers. See further details here.