

Piezoelectric Sensors Pressed by Human Footsteps for Energy Harvesting
by
 , , and
Kyrillos K. Selim
1,* ,
,
Idris H. Smaili
2,*,
Hossam M. Yehia
3,
M. M. R. Ahmed
4 and
Demyana A. Saleeb
5 1
Department of Electronics Technology, Faculty of Technology and Education, Helwan University, Cairo 11795, Egypt
2
Department of Electrical and Electronic Engineering, College of Engineering and Computer Science, Jazan University, P.O. Box114, Jazan 45142, Saudi Arabia
3
Department of Production Technology, Faculty of Technology and Education, Helwan University, Cairo 11795, Egypt
4
Department of Electrical Technology, Faculty of Technology and Education, Helwan University, Cairo 11795, Egypt
5
Faculty of Engineering, Kafrelsheikh University, Kafrelsheikh 33516, Egypt
*
Authors to whom correspondence should be addressed.
Energies 2024, 17(10), 2297; https://doi.org/10.3390/en17102297
Submission received: 24 March 2024
/
Revised: 24 April 2024
/
Accepted: 7 May 2024
/
Published: 10 May 2024
(This article belongs to the Special Issue Analysis of Energy Efficiency: Perspectives and Policies towards Sustainable Development)
Abstract
:Human footsteps are a sustainable energy source that is derived from kinetic energy. As a result, in this study, piezoelectric sensors placed beneath floor tiles were excited by human footsteps to provide practical electrical energy. A simple rectifying circuit with a filter was used to capture electrical power. The floor tile is 455 mm in length and 405 mm in width. Two light-emitted diodes were lit up as the actual load by utilising electrical energy obtained from the kinetic energy generated by human footsteps. The greatest attainable power that could be extracted from the suggested floor tile was 249.6 milliwatts, with an approximate cost of $10.2.
1. Introduction
There is an increasing demand for daily electrical energy due to the emergence of electrical and electronic devices that rely on electricity. There are clean renewable energy sources, such as sound energy, vibration energy, wind energy, sea wave energy, and kinetic energy. Proper exploitation of such sources helps reduce the burden of the increasing demand for traditional energy sources while at the same time benefiting from sources that are permanently and freely available. Human footsteps are available where people live. Furthermore, human footsteps are a waste of energy. Given the global scarcity of energy resources, it is imperative to actively seek alternative sources, such as harnessing the power generated by human footsteps, rather than considering it a choice. Piezoelectric transduction is an up-and-coming technology for harvesting ambient energy. It has been successfully applied in various fields such as structures, transportation, wireless electronics, microelectromechanical systems (MEMS), the Internet of Things (IoT), and wearable and implantable biomedical devices. Piezoelectric materials are used in one of these energy harvesting methods to transform kinetic energy or mechanical vibrations in the surrounding environment into electrical power. Pedestrian energy harvesting utilises the piezoelectricity phenomenon to convert the kinetic energy created by individuals walking, jogging, and leaping into electricity. This technology has the potential to power a wide range of applications, from powering small sensors to illuminating streets, to even charging electric vehicles as a future dream [1,2].
Researchers have used a variety of designs to embed piezoelectric components for mechanical-to-electric energy conversion in floor tiles. These designs are roughly categorised into three primary types: cantilever type [1,2,3,4,5,6,7,8], curved type [9,10,11], and array/stacked type [12,13,14,15,16,17,18,19,20,21,22], depending on the type of piezoelectric element utilised. However, the most readily accessible piezoelectric energy harvesters are piezoelectric diaphragms, which are simple to attach to any planar surface using an adhesive. This kind of element in piezoelectric tiles has been the subject of several research studies [23].
Regarding the electrical design, different techniques have been adopted. Chew et al. [24] showed an adaptive self-configuring rectifier that uses MOSFET tubes to switch between the voltage doubler and the full-bridge rectifier. This technique allows for the harvesting of lower-voltage charges. Lefeuvre et al. [25] suggested a synchronous electric charge extraction interface based on the chopper circuit, which uses a nonlinear method to increase the harvested electrical power. Hong Jiang et al. [26] proposed a circuit to control the extraction of electric charges. The circuit is composed of an energy-harvesting circuit and a control circuit. The control circuit was used to create control signals for the switch to turn on and off, allowing the energy-harvesting circuit portion to function correctly.
Based on the aforementioned details, some studies have focused on the mechanical design of pedestrian energy harvesters [5,6,27,28] to efficiently convert pedestrian pressure into electrical power. Other studies have concentrated on electrical design to ensure stable management of the harvested power [26,29]. However, some literature has addressed mechanical and electrical designs [7,30,31].
It is possible to generate higher power by connecting multiple piezoelectric energy harvesters. However, piezoelectric energy harvester cannot be directly connected to electrical loads because the high output voltage changes based on how people walk and how much pressure there is over time. Furthermore, a simple full-wave bridge rectifier is insufficient because of the unstable waveform that results from the rectification stage. As a result, a suitable control circuit is needed to solve these problems [7,26]. This study examines the practicality of producing power from piezoelectric crystals and provides a detailed plan for the mechanical and electrical components of the proposed energy harvesting system. Furthermore, it incorporates experimental validation to assess the mechanical aspects. The manuscript is organised as follows: Section 2 is the Design and Experimental Validation, Section 3 presents the Results and Discussion, and Section 4 covers the Conclusion of this study.
2. Design and Experimental Validation
The structure has three plates placed in a sandwich-like form. Plate No. 1 depicts the frontal plate, measuring 455 mm × 405 mm × 15 mm, as illustrated in Figure 1. Plate No. 2 is a substrate plate with dimensions of 455 mm × 405 mm × 3 mm. Plate No. 3 is positioned between plates 1 and 2, with dimensions of 420 mm × 380 mm × 12 mm.
Fourteen hot melt glue sticks, each measuring 10 mm in length, were evenly spaced on plate No. 1 to form a circle with a circumference of 300 mm, as shown in Figure 1. The hot-melt adhesive sticks were used to apply direct pressure to each piezoelectric sensor in the cavity whenever there was movement from human footsteps on the floor tile. The technique employed hot-melt adhesive sticks and foam materials that possessed sufficient flexibility to endure elevated pressures.
Our experiments used a ceramic piezoelectric diaphragm with a circular form. This sensor contains certain technical features, as follows: The metal plate size diameter is 20 mm, the piezoelectric element size diameter is 14 mm, the electrode size diameter is 12.8 mm, the piezoelectric material thickness is 0.42 mm, the metal plate thickness is 0.2 mm, and the metal plate material is composed of brass with lead wire. Figure 2 depicts the circuit that is equivalent to a piezoelectric element. The piezoelectric current () and voltage () can be expressed using Equations (1) and (2), respectively. In these equations, represents the piezoelectric resistance, represents the piezoelectric capacitance, and represents the angular frequency.
The 14 piezoelectric generators connected in parallel can be represented by the equivalent current () and voltage (), which are provided in Equations (3) and (4) respectively, as shown in Figure 2.
Figure 1 illustrates the distribution of the fourteen piezoelectric harvesters around the rectangular floor tile, whereas Figure 3 shows the experimental configuration of the suggested footstep energy harvesting system. In this study, the researchers utilised the bridge rectifier circuit and opted for the 1N60P Schottky diode. The choice was made based on the diode’s low forward voltage of 0.24 V under low current conditions, which is significantly lower compared to silicon diodes. Table 1 presents the key properties of the 1N60P Schottky diode.
The rectifier circuit consisted of four Schottky diodes of the 1N60P type, which are linked in conjunction with a 2.2 µF filter capacitor, as illustrated in Figure 4.
The rectified output voltage, denoted as (), is determined by Equation (5). The average voltage () can be determined using Equations (6) and (7).
where t is the variable for time. The formulas for the instantaneous power () and average power () in the bridge rectifier are provided in Equations (8) and (9), respectively.
The insertion of a filter capacitor alongside the bridge rectifier results in the expected DC output voltage () across the load and the harvested power (), as indicated by Equations (10) and (11).
As f is the frequency.
The output voltage level produced by the typical rectifier and filter was not stable due to the random pressure of humans on the energy-harvesting floor tile. Moreover, this rectified voltage varied from 0 V to around 20 V in the open circuit condition. A DC–DC buck converter with a control system was needed to export a stable voltage to the electrical load (the desired application). The DC–DC buck converter was adopted in this work to step down the high voltage generated by piezoelectric generators to fit low-power applications such as wireless sensors. In addition, the two-loop cascade control was utilized to fix the output voltage at a constant level (5 V). The proposed control system was built on the Simulink platform. Moreover, as the piezoelectric sensor is not listed in the library of Simulink, the electrical equivalent circuitof the piezoelectric sensor was built and utilised in simulations. The piezoelectric sensor was represented by a voltage source connected in series with a resistor () and internal capacitance (), as shown in Figure 2 and Figure 5. The values of and were extracted from the piezoelectric sensor datasheet. However, due to the stochastic nature of the energy-harvesting process of human footsteps, this frequency depends on the situation and the place where the system is applied. For the Simulink model, we used 10 Hz as an average value.
Two cases were considered regarding the input voltage variation of the voltage generator () in this study; the first case handled the voltage variation from −20 V to +20 V, whereas the second case handled the voltage variation from −10 V to +10 V.
The system proposed in this study involved a series equivalent circuit for piezoelectric, connected to a buck converter, and controlled using the Two-Loop Cascade Control (TLCC) method. This system is illustrated in Figure 5. The alternating voltage was rectified into a direct current (DC) voltage by the use of a full-wave rectifier. The value was subsequently rendered uniform by employing a filter capacitor, leading to a stable direct current (DC) value. The DC-DC converter step, specifically a buck converter, was tasked with reducing the input voltage to 5 V. The stable and uniform output was obtained by adopting a two-loop cascade control (TLCC) system.
The suggested control system for the DC-DC buck converter consists of two loops: the voltage outer loop and the current inner loop. The system produces an inductor reference current by comparing the output voltage with a voltage reference. The inner loop calculates the duty cycle for the pulse width modulation. Figure 5 illustrates the suggested PI-TLCC Simulink model for the DC–DC buck converter. The control system’s objective is to accurately follow the reference signal, which is an intended external signal provided to the outer control loop. The outer loop controller is a proportional-integral (PI) controller that adjusts the output voltage of the converter. The inner loop consists of a proportional-integral (PI) controller that is specifically intended to regulate the current flowing through the inductor [32,33]. The controller gains were computed using Ziegler–Nichol’s approach to ensuring precise tuning of the PI controller parameters [34]. The formulae for the reference current and controller output (U) in the PI-TLCC approach are provided in Equations (12) and (13) correspondingly.
where and are the PI control gain parameters. reference voltage output voltage reference current inductor current
The purpose of using this method is to stabilise the output value at 5 V when any changes or fluctuations occur in the input voltage or the applied load.
The system output depends on the applied load, and in this article, there is a linear load consisting of resistors whose value changes from 100 ohms to 200 ohms. In order to enhance the converter’s performance, the Ziegler–Nichols approach was applied in this design to ascertain the control parameters, namely the proportional and integral gains. The buck converter was tuned to have a switching frequency of 40 kHz. In addition, a MOSFET was employed as a switch due to its capability of high-speed switching at very high frequencies. It is widely used in switch-mode power supply (SMPS) circuits and provides a unique advantage.
Parameters of the Buck Converter
1. Input voltage range: and
2. Rated output voltage:
3. Maximum output current:
The duty cycle of the maximum input voltage is determined first before calculating the switch current. The maximum input voltage was selected because it produces the highest switch current.
where is the maximum input voltage, is the desired output voltage, and is the converter efficiency. The maximum switch current is then calculated by determining the inductor ripple current.
where is the converter’s minimum switching frequency, and L is the specified inductor value. For components with no inductor range specified, the following equation is a fair estimate for the appropriate inductor:
where is the typical input voltage and is the estimated inductor ripple current. An accurate estimate for the inductor ripple current is 20% to 40% of the output current.
is the maximum output current required in the application. The following formula could be applied to change the output capacitor values to obtain the appropriate output voltage ripple with external compensation:
is the minimum output capacitance, and is the required output voltage ripple. The output capacitor’s ESR adds slightly more ripple, as shown by the equation below:
is the additional output voltage ripple caused by capacitors’ ESR, and ESR is the output capacitor’s equivalent series resistance.
The energy harvesting scheme simulated in Simulink is pictured in Figure 5. The system consisted of four parts. The first part is the piezoelectric equivalent circuit, which consists of the AC voltage source (A = 20 v, F = 10 Hz), a first capacitor (10 nF), and a resistor (1000 Ω) in series. The second part is the rectifier bridge, which consists of four diodes and a parallel capacitor (3000 µF). The third part is the buck converter, with a reference voltage of 5 V. The last part is the load, represented as a parallel resistor (100 Ω).
3. Results and Discussion
The output voltage and current of the bridge rectifier circuit were measured and recorded under different conditions. Table 2 presents the most noteworthy findings. In relation to the open-loop state, the bridge rectifier circuit produced a significantly elevated output voltage, as depicted in Table 2. The bridge rectifier experienced a peak voltage of 33.7 V.
Moreover, when the LED was employed as a practical load, whether with one LED (a single load) or two LEDs (two loads connected in series or in parallel), the voltage generated at the terminals of the load was equal to the LED’s operating voltage. This suggests that the generated voltage was adequate to supply power to both single and two loads.
Figure 6 illustrates the practical load measurement (at the condition of a single load). The output voltage across the load of two series LEDs varied between 4.6 V and 4.8 V at a speed of around 80 pedestrians per minute. The generated current was recorded as 0.052 A, whereas the maximum harvested power was 249.6 mW.
Moreover, an AC input voltage of 10 volts was used as the maximum value, resulting in a rectifier voltage of 8.4 V and an output voltage of 5 V, as shown in Figure 7, Figure 8 and Figure 9. When a maximum input voltage of 20 V was applied, the voltage outside the bridge was 18.4 V, and the output voltage remained at 5 V, as shown in Figure 10, Figure 11 and Figure 12. We used a linear load, such as resistors with a 100 to 200 ohms value, and the results were satisfactory. Overall, a two-loop cascade control was adopted in this study, which improved the output voltage level and resulted in a stable voltage waveform.
Simulation parameter specifications of the buck converter are listed in Table 3. The simulation of the proposed system was done in 2 s.
The expected energy from one tile during one hour is
The expected energy from one tile during 8 h is
The entrance gate to the college building is 8 m2, so 30 tiles can be installed in the entrance gate. Therefore, the expected energy generated by 30 tiles within an hour is
Hence, the expected energy from 30 tiles in 8 h is
A security CCTV camera, model TP-Link Tapo C310, has a power consumption of 5.4 watts and can be installed on the entrance gate of the college building for security purposes. So, the energy harvested can operate the security CCTV camera for around 11 h. The average number of students per day in the faculty is around 2000. The energy harvesting technology, once adopted, has a price of approximately $10.2 per individual tile.
Finally, a comparison with similar methods of using piezoelectric elements to generate energy and this study were illustrated in Table 4 concerning the harvester type, floor tile dimensions, and amount of harvested power.
4. Conclusions
A piezoelectric generator-based energy harvesting device was developed that relies on human footsteps. The bridge rectifier achieved a peak output voltage of 33.7 V. The prototype could light up two LEDs and had dimensions of 455 mm in length and 405 mm in width. Further, the proposed control achieved the stability of the output voltage of the harvested power at a level of 5 V over any variation at the input due to the stochastic nature of the mechanical excitation source. An assembly of 30-floor tiles can be placed at the entrance gate of the Faculty of Technology at Helwan University, which is anticipated to generate 60 watt-hours of energy over 8 h.
Author Contributions
Conceptualization, K.K.S., I.H.S., H.M.Y., M.M.R.A. and D.A.S.; methodology, K.K.S.; software, K.K.S. and H.M.Y.; validation, K.K.S., I.H.S., H.M.Y., M.M.R.A. and D.A.S.; formal analysis, K.K.S., I.H.S., H.M.Y., M.M.R.A. and D.A.S.; investigation, K.K.S., I.H.S., H.M.Y., M.M.R.A. and D.A.S.; resources, K.K.S., I.H.S., H.M.Y., M.M.R.A. and D.A.S.; data curation, K.K.S., I.H.S., H.M.Y., M.M.R.A. and D.A.S.; writing—original draft preparation, K.K.S., I.H.S., H.M.Y., M.M.R.A. and D.A.S.; writing—review and editing, K.K.S., I.H.S., H.M.Y., M.M.R.A. and D.A.S.; visualization, K.K.S., I.H.S., H.M.Y., M.M.R.A. and D.A.S. All authors have read and agreed to the published version of the manuscript.
Funding
This research received no external funding.
Data Availability Statement
The original contributions presented in the study are included in the article, further inquiries can be directed to the corresponding author.
Conflicts of Interest
The authors declare no conflicts of interest.
References
- Hwang, S.J.; Jung, H.; Kim, J.; Ahn, J.; Song, D.; Song, Y.; Lee, H.; Moon, S.; Park, H.; Sung, T. Designing and manufacturing a piezoelectric tile for harvesting energy from footsteps. Curr. Appl. Phys. 2015, 15, 669–674. [Google Scholar] [CrossRef]
- El-Etriby, A.E.; Abdel-Meguid, M.E.; Hatem, T.M.; Bahei-El-Din, Y.A. A multiscale-based approach for composite materials with embedded PZT filaments for energy harvesting. In Behavior and Mechanics of Multifunctional Materials and Composites; SPIE: Bellingham, WA, USA, 2014; Volume 9058, pp. 294–305. [Google Scholar]
- Kim, K.-B.; Cho, J.Y.; Jabbar, H.; Ahn, J.; Hong, S.; Woo, S.B.; Sung, T. Optimized composite piezoelectric energy harvesting floor tile for smart home energy management. Energy Convers. Manag. 2018, 171, 31–37. [Google Scholar] [CrossRef]
- Panthongsy, P.; Isarakorn, D.; Janphuang, P.; Hamamoto, K. Fabrication and evaluation of energy harvesting floor using piezoelectric frequency up-converting mechanism. Sens. Actuators A Phys. 2018, 279, 321–330. [Google Scholar] [CrossRef]
- Panthongsy, P.; Isarakorn, D.; Hamamoto, K.; Janphuang, P. Performance and behavior analysis of piezoelectric energy harvesting floor tiles. In Proceedings of the 2019 5th International Conference on Engineering, Applied Sciences and Technology (ICEAST), Luang Prabang, Laos, 2–5 July 2019; pp. 1–4. [Google Scholar]
- Isarakorn, D.; Jayasvasti, S.; Panthongsy, P.; Janphuang, P.; Hamamoto, K. Design and evaluation of double-stage energy harvesting floor tile. Sustainability 2019, 11, 5582. [Google Scholar] [CrossRef]
- Jabbar, H.; Hong, S.D.; Hong, S.K.; Yang, C.H.; Jeong, S.Y.; Sung, T.H. Sustainable micro-power circuit for piezoelectric energy harvesting tile. Integr. Ferroelectr. 2017, 183, 193–209. [Google Scholar] [CrossRef]
- Jhun, J.P.; Hong, S.D.; Jeon, D.H.; Sung, T.H. The effectiveness of different width piezoelectric energy harvester in the pedestrian floor tile energy harvesting system for internet of things sensors. J. Korean Phys. Soc. 2021, 78, 81–88. [Google Scholar] [CrossRef]
- Liu, Z.; Ding, G.; Wang, J.; Cai, G.; Qin, X.; Shi, K. Fabrication and performance of Tile transducers for piezoelectric energy harvesting. AIP Adv. 2020, 10, 045326. [Google Scholar] [CrossRef]
- Kathpalia, B.; Tan, D.; Stern, I.; Valdes, F.; Kim, S.; Erturk, A. Modeling and characterization of a curved piezoelectric energy harvester for smart paver tiles. Procedia Comput. Sci. 2017, 109, 1060–1066. [Google Scholar] [CrossRef]
- Wang, J.; Cai, Y.; Liu, Z.; Ding, G.; Cai, G.; Fu, H. Preparation and performance study of a new type of Tile transducer for roadway applications. J. Intell. Mater. Syst. Struct. 2020, 31, 2020–2028. [Google Scholar] [CrossRef]
- Kamal, P.N.M.; Buniyamin, N. Using piezoelectric elements as footsteps energy harvester: An investigation. In Proceedings of the 2018 IEEE 8th International Conference on System Engineering and Technology (ICSET), Bandung, Indonesia, 15–16 October 2018; pp. 1–6. [Google Scholar]
- Puscasu, O.; Counsell, N.; Herfatmanesh, M.R.; Peace, R.; Patsavellas, J.; Day, R. Powering Lights with Piezoelectric Energy-Harvesting Floors. Energy Technol. 2018, 6, 906–916. [Google Scholar] [CrossRef]
- Abadi, P.B.; Darlis, D.; Suraatmadja, M.S. Green energy harvesting from human footsteps. MATEC Web Conf. 2018, 197, 11015. [Google Scholar] [CrossRef]
- Cascetta, F.; Schiavo, A.L.; Minardo, A.; Musto, M.; Rotondo, G.; Calcagni, A. Analysis of the energy extracted by a harvester based on a piezoelectric tile. Curr. Appl. Phys. 2018, 18, 905–911. [Google Scholar] [CrossRef]
- Saifan, R.; Ali, L.A.; Shreikh, A.A.; Alnabelsi, S.H. Smart walk: Case studies on hybrid power generation system of piezoelectricity and solar power. In Proceedings of the 2019 International Conference on Electrical and Computing Technologies and Applications (ICECTA), Ras Al Khaimah, United Arab Emirates, 19–21 November 2019; pp. 1–6. [Google Scholar]
- Covaci, C.; Porobic, I.; Gontean, A. Setup for Piezoelectric Energy Harvesting System. In Proceedings of the 2019 IEEE 25th International Symposium for Design and Technology in Electronic Packaging (SIITME), Cluj-Napoca, Romania, 23–26 October 2019; pp. 78–81. [Google Scholar]
- Ruman, M.R.; Das, M.; Mahmud, S.I. Human footsteps for energy generation by using piezoelectric tiles. In Proceedings of the 2019 Innovations in Power and Advanced Computing Technologies (i-PACT), Vellore, India, 22–23 March 2019; Volume 1, pp. 1–6. [Google Scholar]
- Ahmed, S.U.; Sabir, A.; Ashraf, T.; Ali Haider, M.; Perveen, F.; Farooqui, Z.; Uddin, R. Energy Harvesting through Floor Tiles. In Proceedings of the 2019 International Conference on Innovative Computing (ICIC), Lahore, Pakistan, 1–2 November 2019; pp. 1–6. [Google Scholar]
- Selim, K.K.; Haggag, A.; Amer, F.A.; Rady, W.; El-Garhy, A.M. A proposed technique for power extraction from acoustic energy scavenging. Int. J. Electron. 2018, 105, 1236–1247. [Google Scholar] [CrossRef]
- Selim, K.K.; Haggag, A.; Yehia, H.; Amer, F.Z. Acoustic energy conversion into useful electric energy from Disk Jockey by using piezoelectric transducers. In Proceedings of the 2016 Eighteenth International Middle East Power Systems Conference (MEPCON), Cairo, Egypt, 27–29 December 2016; pp. 871–876. [Google Scholar]
- Selim, K.K.; Yehia, H.M.; Abdalfatah, S. Human footsteps-based energy harvesting using piezoelectric elements. In Proceedings of the 2023 International Telecommunications Conference (ITC-Egypt), Alexandria, Egypt, 18–20 July 2023. [Google Scholar]
- Sharma, S.; Kiran, R.; Azad, P.; Vaish, R. A review of piezoelectric energy harvesting tiles: Available designs and future perspective. Energy Convers. Manag. 2022, 254, 115272. [Google Scholar] [CrossRef]
- Chew, Z.J.; Zhu, M. Adaptive self-configurable rectifier for extended operating range of piezoelectric energy harvesting. IEEE Trans. Ind. Electron. 2019, 67, 3267–3276. [Google Scholar] [CrossRef]
- Lefeuvre, E.; Badel, A.; Richard, C.; Guyomar, D. Piezoelectric energy harvesting device optimization by synchronous electric charge extraction. J. Intell. Mater. Syst. Struct. 2005, 16, 865–876. [Google Scholar] [CrossRef]
- Jiang, H.; Wang, Y.; Wu, G.; Li, B.; Li, X. A novel control method of electric charge extraction circuit for piezoelectric energy harvesters. Ferroelectrics 2022, 599, 58–71. [Google Scholar] [CrossRef]
- Fu, H.; Xu, R.; Seto, K.; Yeatman, E.; Kim, S. Energy harvesting from human motion using footstep-induced airflow. J. Phys. Conf. Ser. 2015, 660, 012060. [Google Scholar] [CrossRef]
- Yingyong, P.; Thainiramit, P.; Jayasvasti, S.; Thanach-Issarasak, N.; Isarakorn, D. Evaluation of harvesting energy from pedestrians using piezoelectric floor tile energy harvester. Sens. Actuators A Phys. 2021, 331, 113035. [Google Scholar] [CrossRef]
- Abidin, N.A.K.Z.; Nayan, N.M.; Ali, A.; Azli, N.; Nordin, N. Analysis of AC-DC Converter Circuit Performance with Difference Piezoelectric Transducer Array Connection. Int. J. Integr. Eng. 2020, 12, 20–27. [Google Scholar]
- Chand, A.A.; Arefin, A.S.M.S.; Islam, F.; Prasad, K.; Singh, S.; Cirrincione, M.; Mamun, K. Design simulation of a novel fluid based footstep energy harvesting system. Sustain. Energy Technol. Assess. 2020, 39, 100708. [Google Scholar] [CrossRef]
- Jeong, S.Y.; Cho, J.Y.; Hong, S.D.; Hwang, W.; Jabbar, H.; Ahn, J.H.; Jhun, J.P.; Sung, T.H. Self-powered operational amplifying system with a bipolar voltage generator using a piezoelectric energy harvester. Electronics 2019, 9, 41. [Google Scholar] [CrossRef]
- Galeano, N.M.; Lezama, J.M.L.; Quintero, J.B.C. A Methodology for Tunning Cascade PI Controllers for Power Electronics Converters. Int. J. Eng. Res. Technol. 2020, 13, 3997–4003. [Google Scholar] [CrossRef]
- Azarastemal, S.; Hejri, M. Cascade Control System Design and Stability Analysis for a DC–DC Boost Converter with Proportional Integral and Sliding Mode Controllers and Using Singular Perturbation Theory. Iran. J. Sci. Technol. Trans. Electr. Eng. 2021, 45, 1445–1462. [Google Scholar] [CrossRef]
- Mohanty, P.R.; Panda, A.K. Fixed-frequency sliding-mode control scheme based on current control manifold for improved dynamic performance of boost PFC converter. IEEE J. Emerg. Sel. Top. Power Electron. 2016, 5, 576–586. [Google Scholar] [CrossRef]
Figure 1.
Dimensions of wood plate No. 1 (a): different views and (b) 3D wood plate.
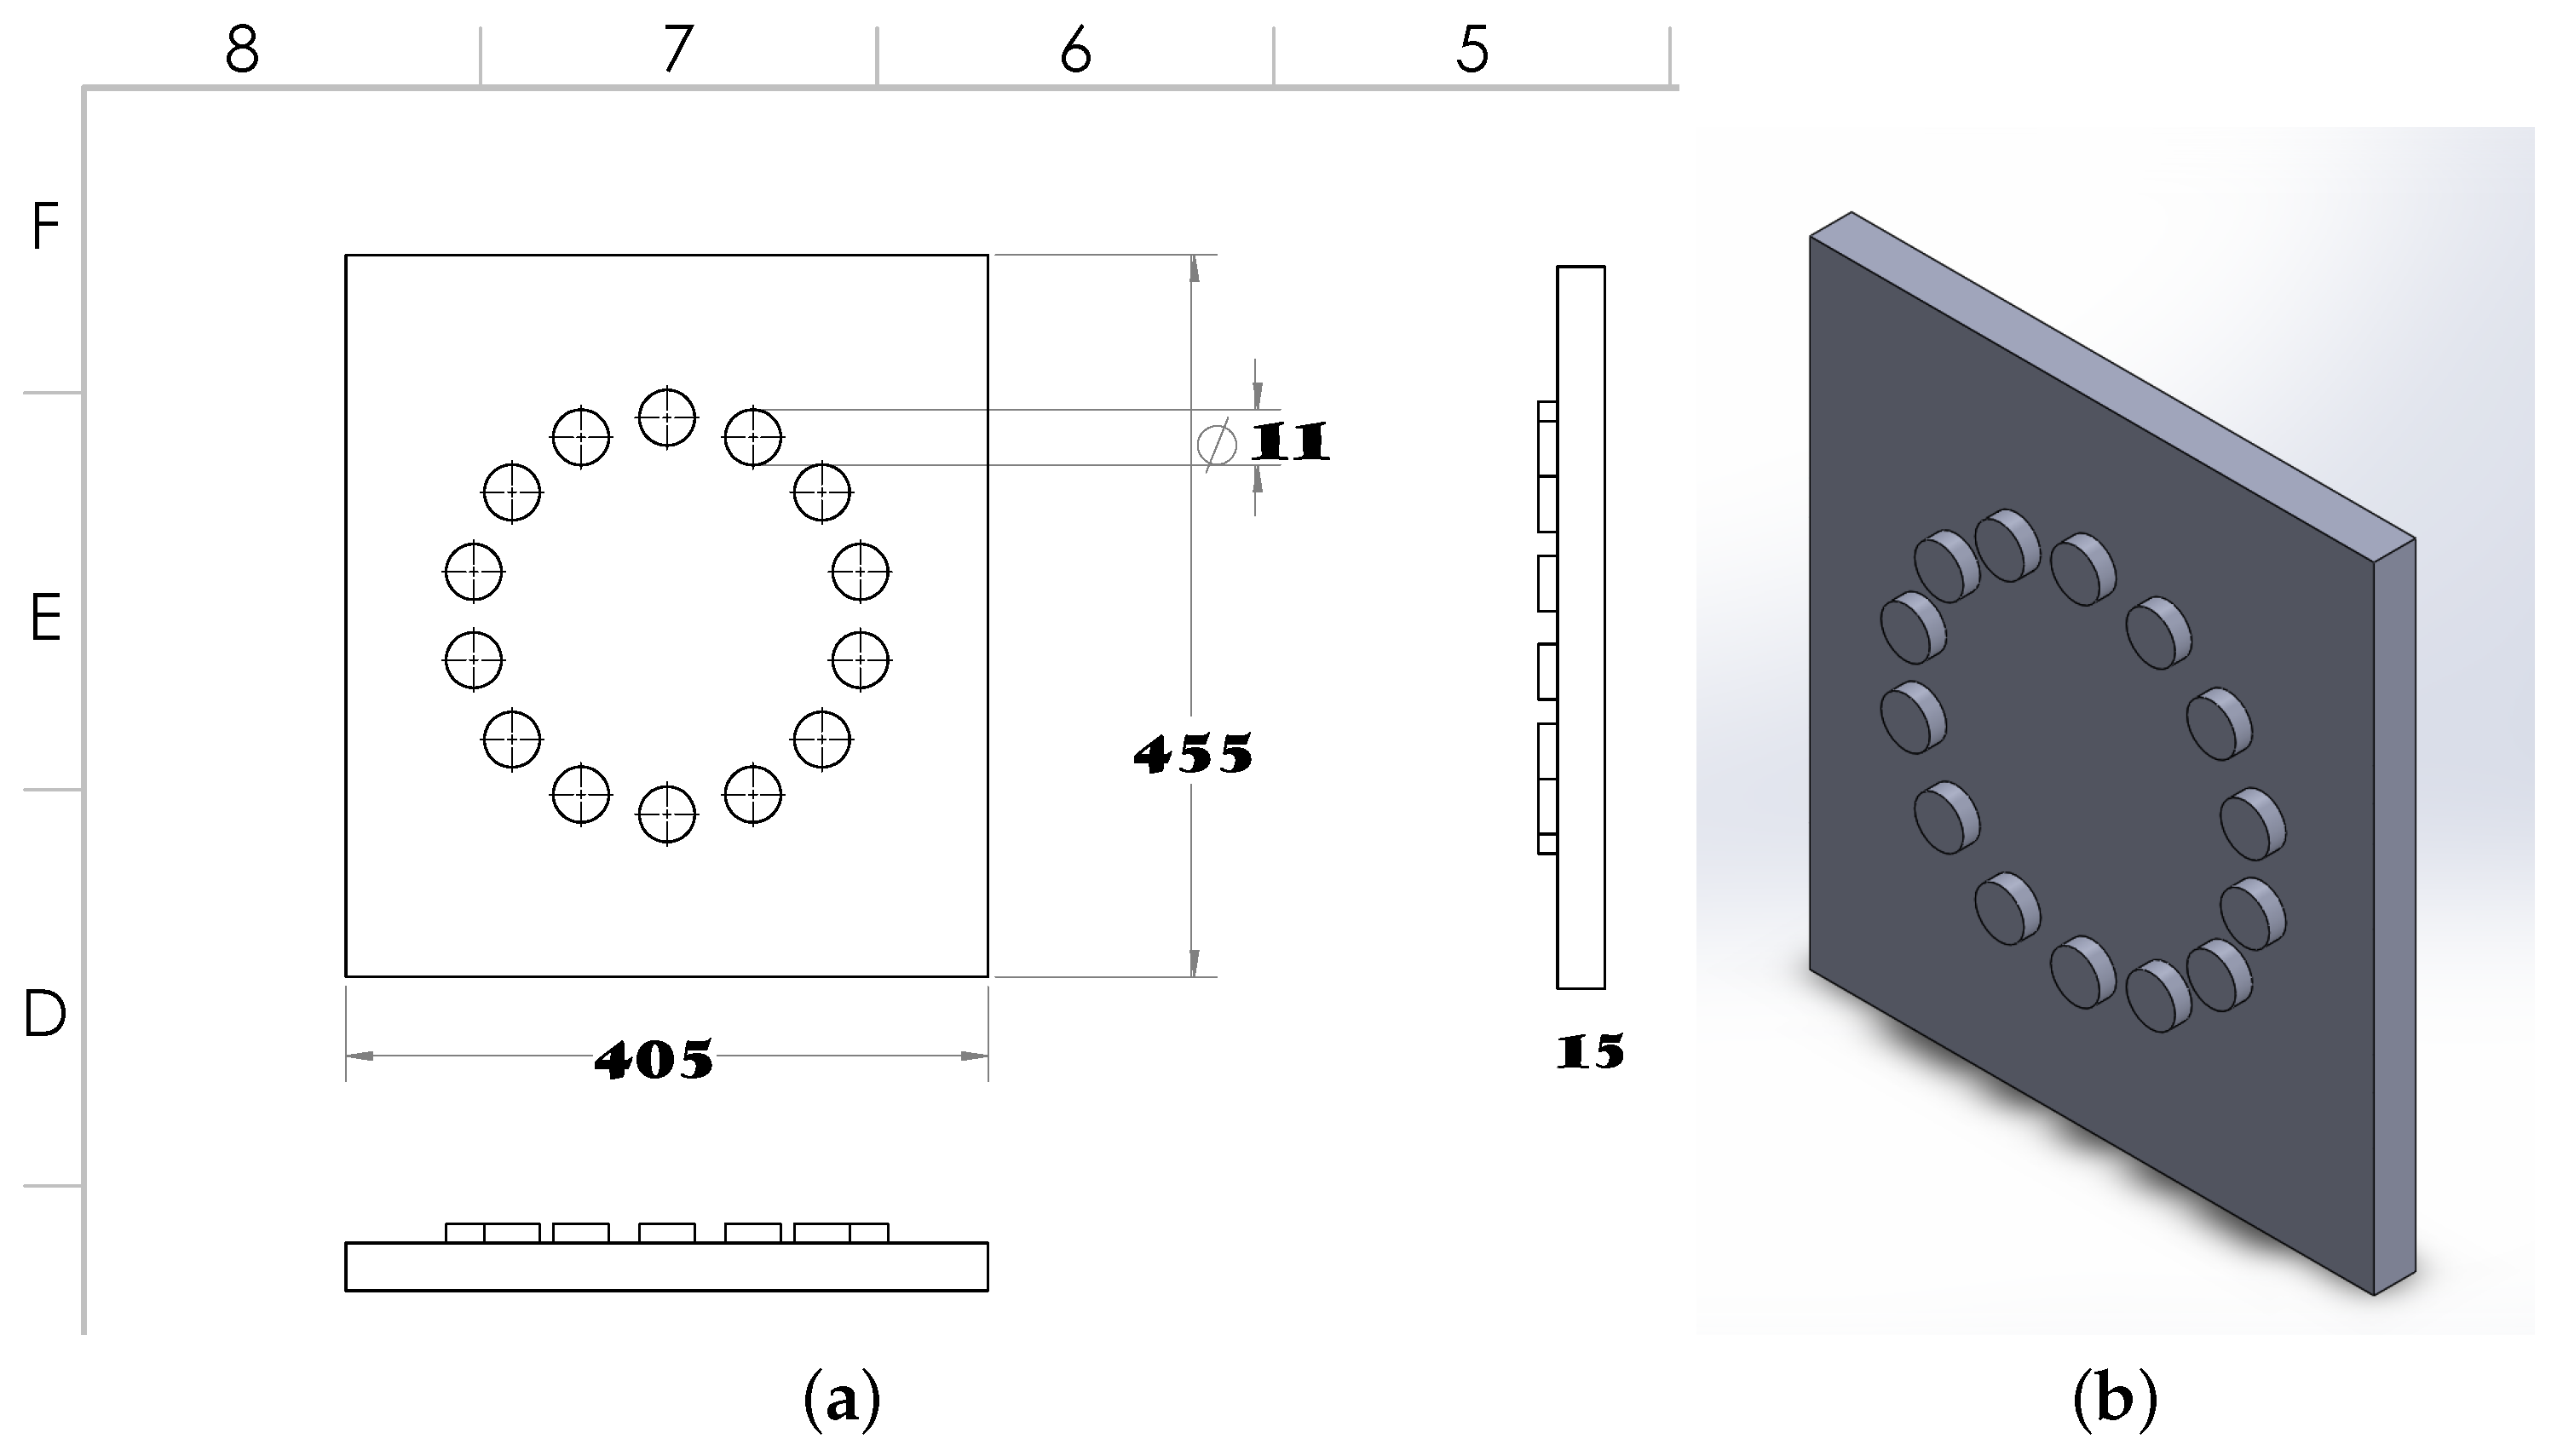
Figure 2.
Piezoelectric equivalent circuit.
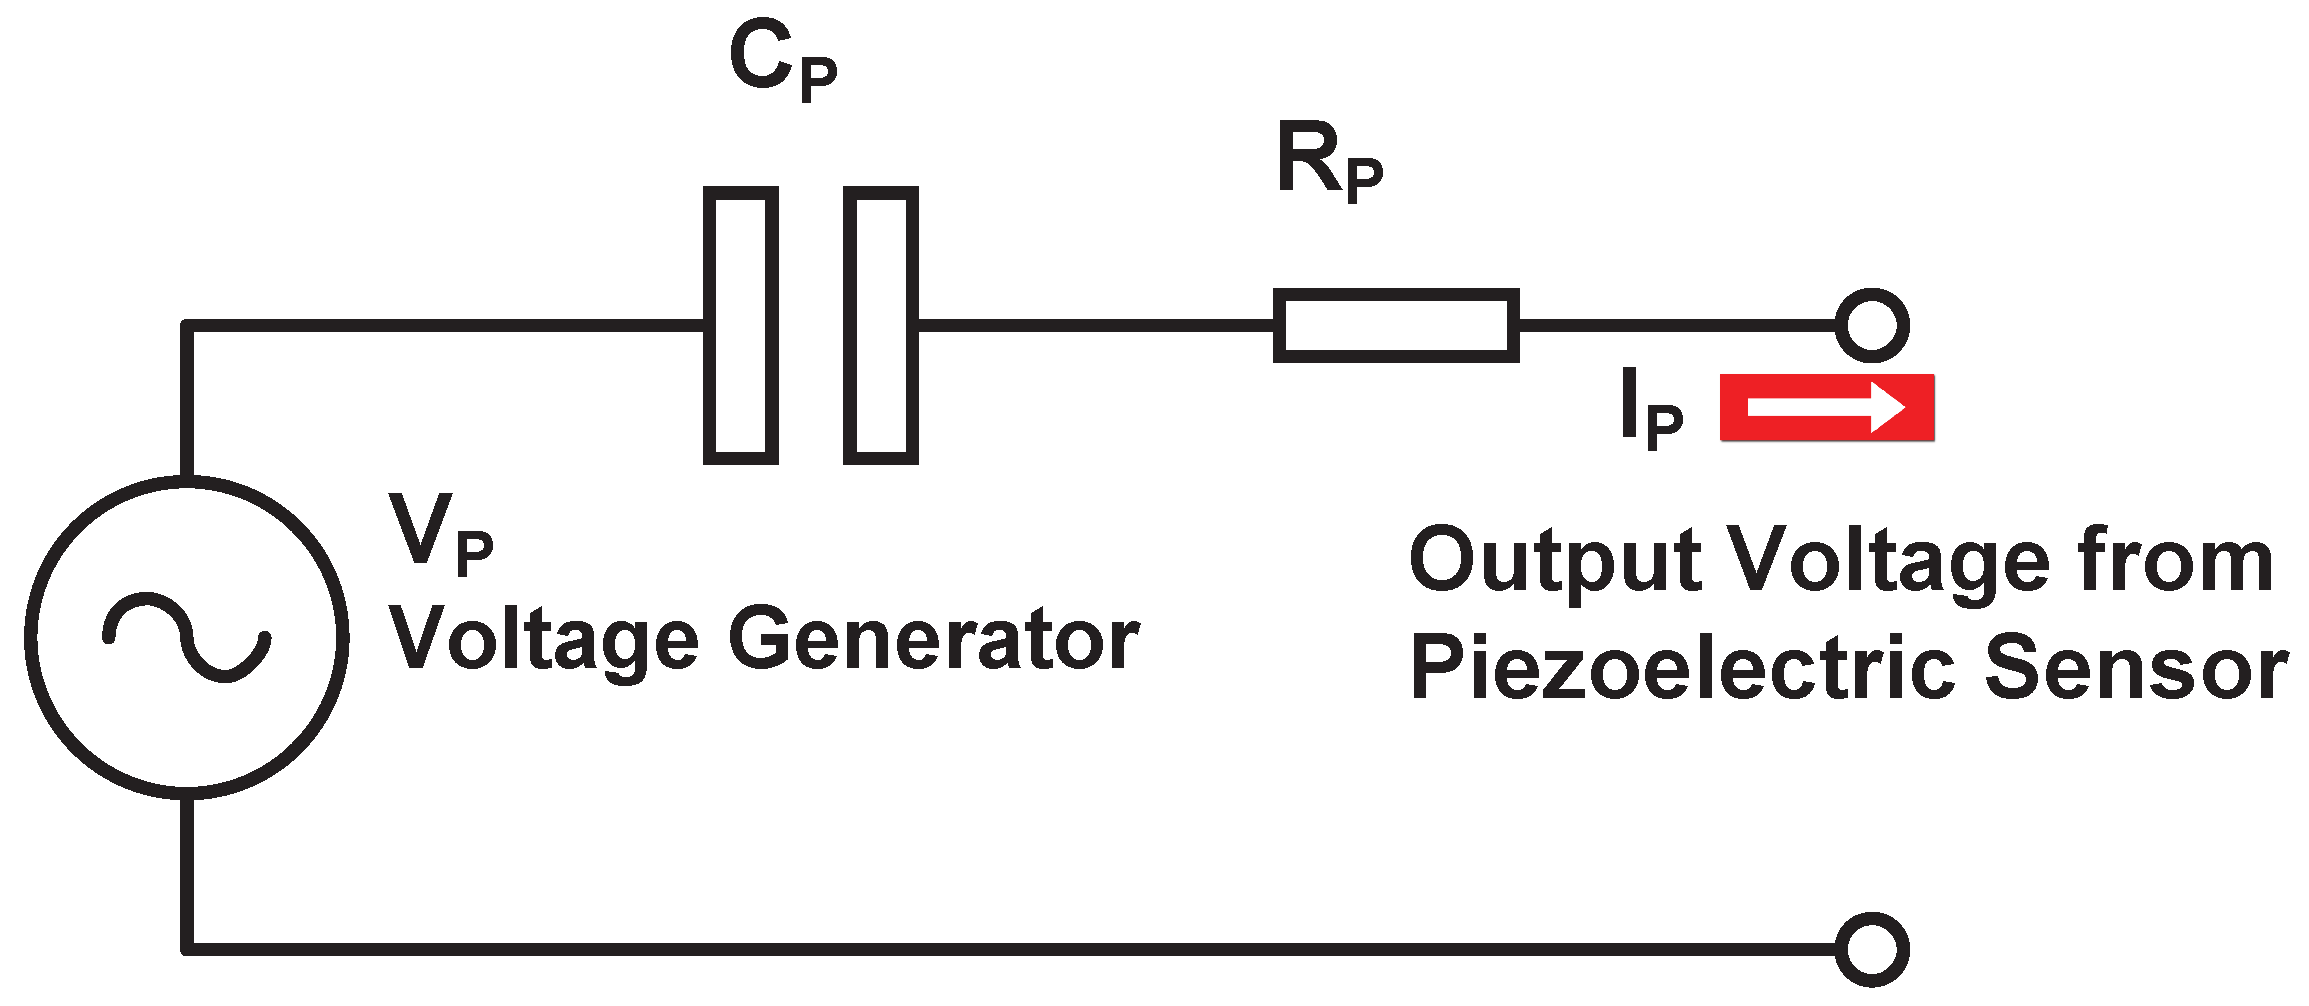
Figure 3.
The experimental configuration of the suggested footstep energy harvesting system consists of three main components: (a) wood plate No. 1; (b) piezoelectric elements mounted on foam and wood substrate plates; and (c) plates No. 1, 2, and 3.
Figure 3.
The experimental configuration of the suggested footstep energy harvesting system consists of three main components: (a) wood plate No. 1; (b) piezoelectric elements mounted on foam and wood substrate plates; and (c) plates No. 1, 2, and 3.
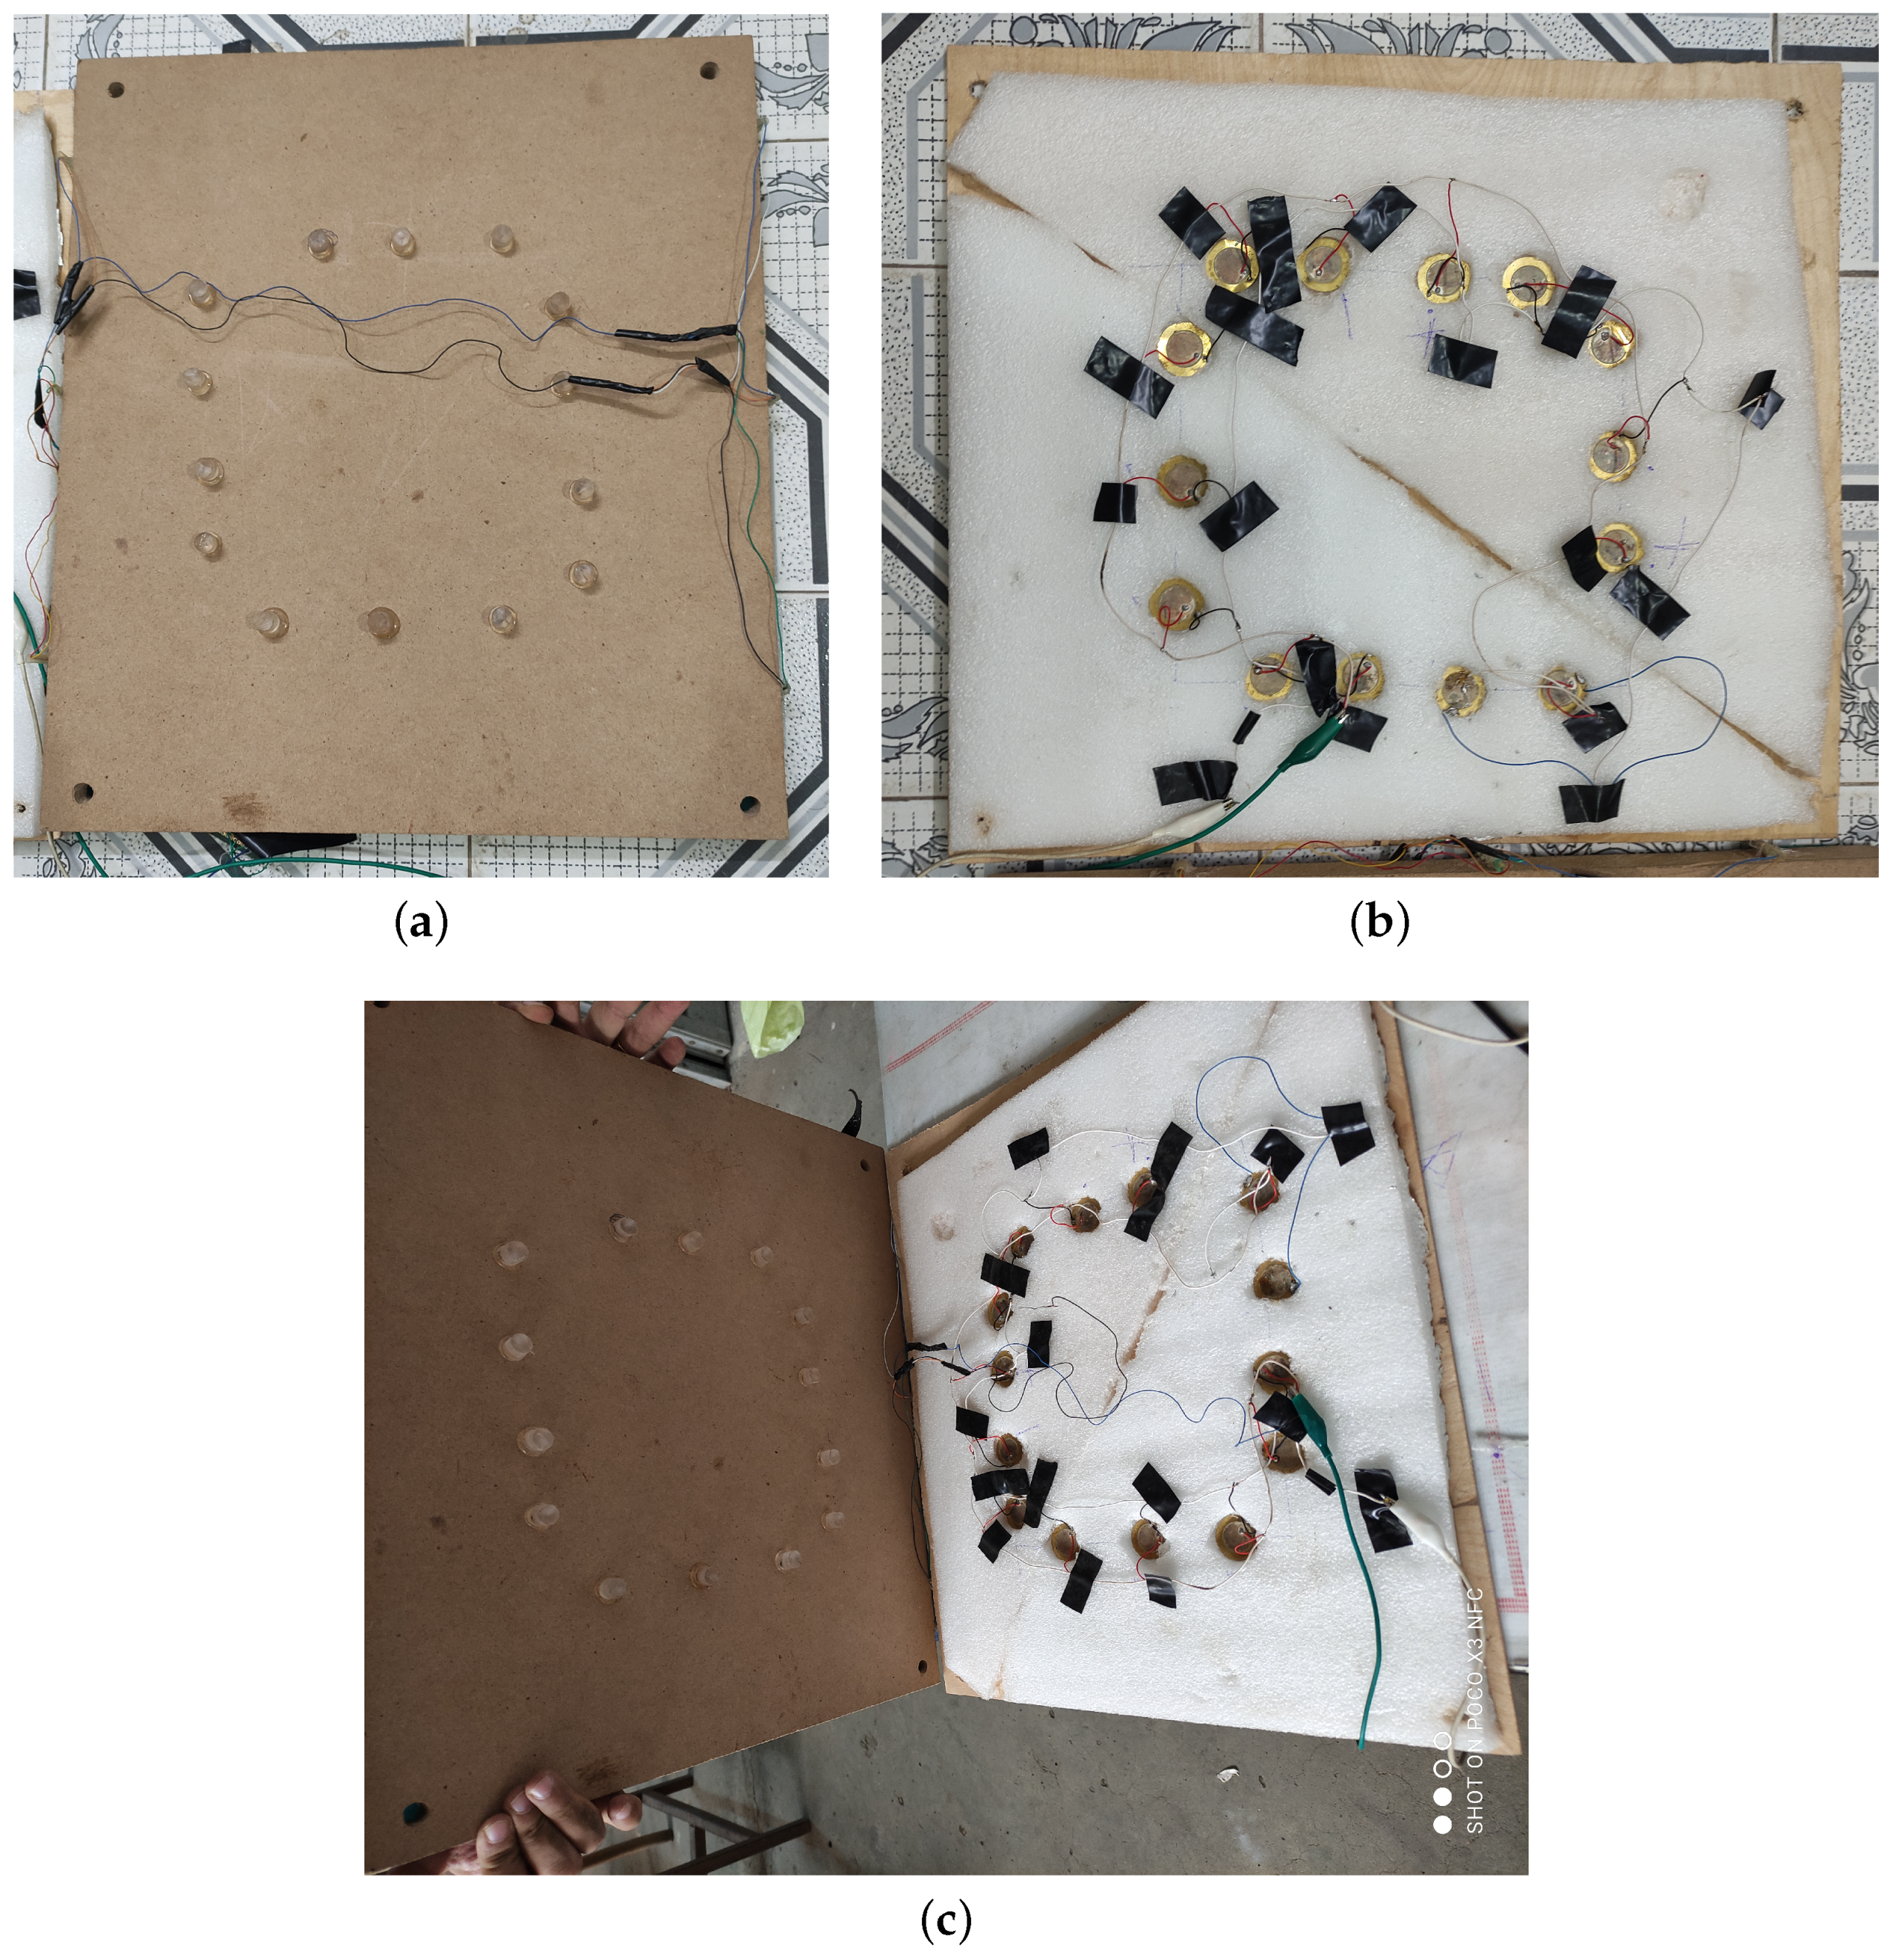
Figure 4.
Quantitative assessments of various states of bridge rectifier circuits: The measurements include: (a) open loop voltage measurement, (b) single load voltage measurement, (c) single load current measurement, (d) two parallel load voltage measurement, (e) two series load voltage measurement, and (f) two series load current measurement.

Figure 5.
The piezoelectric energy harvesting system model in Simulink with the control circuit.

Figure 6.
The voltage doubler circuit is coupled to the multimeter and oscilloscope to measure the practical load.
Figure 6.
The voltage doubler circuit is coupled to the multimeter and oscilloscope to measure the practical load.
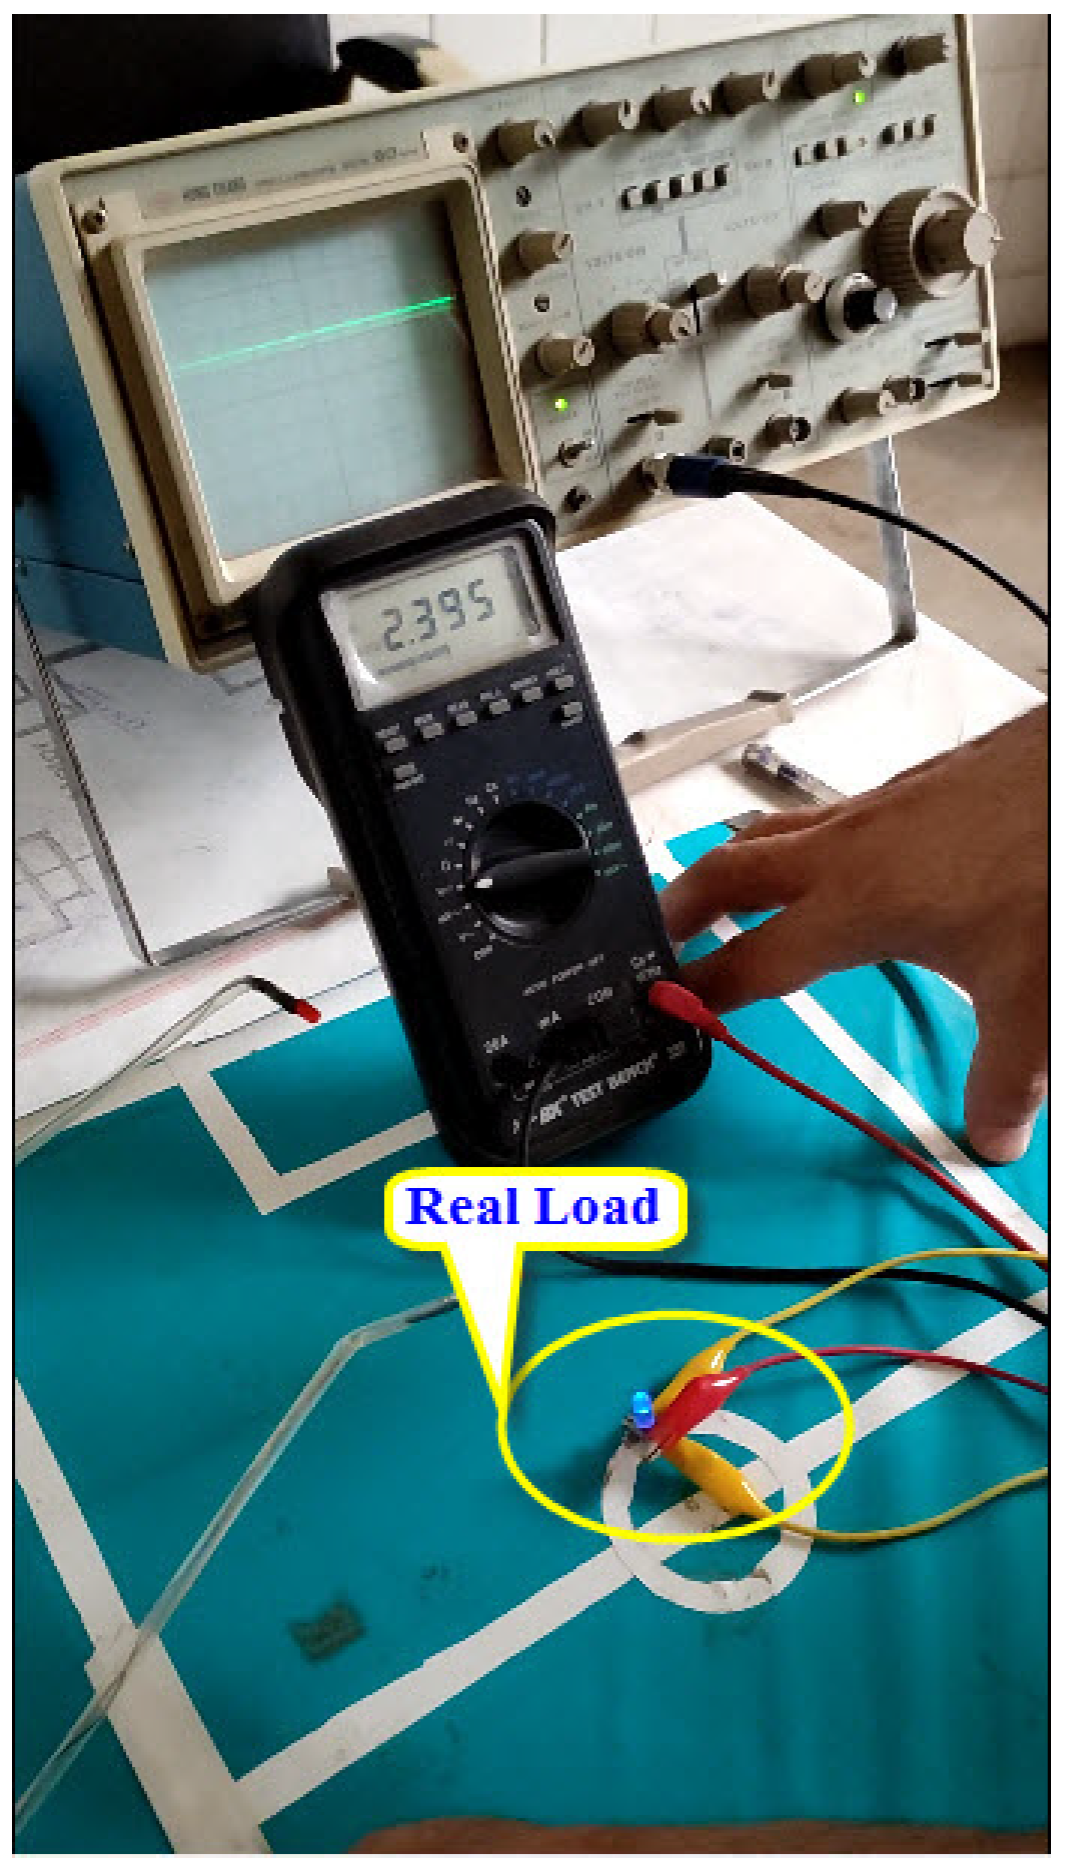
Figure 7.
Input voltage waveform produced by the piezoelectric array for case No. 1.
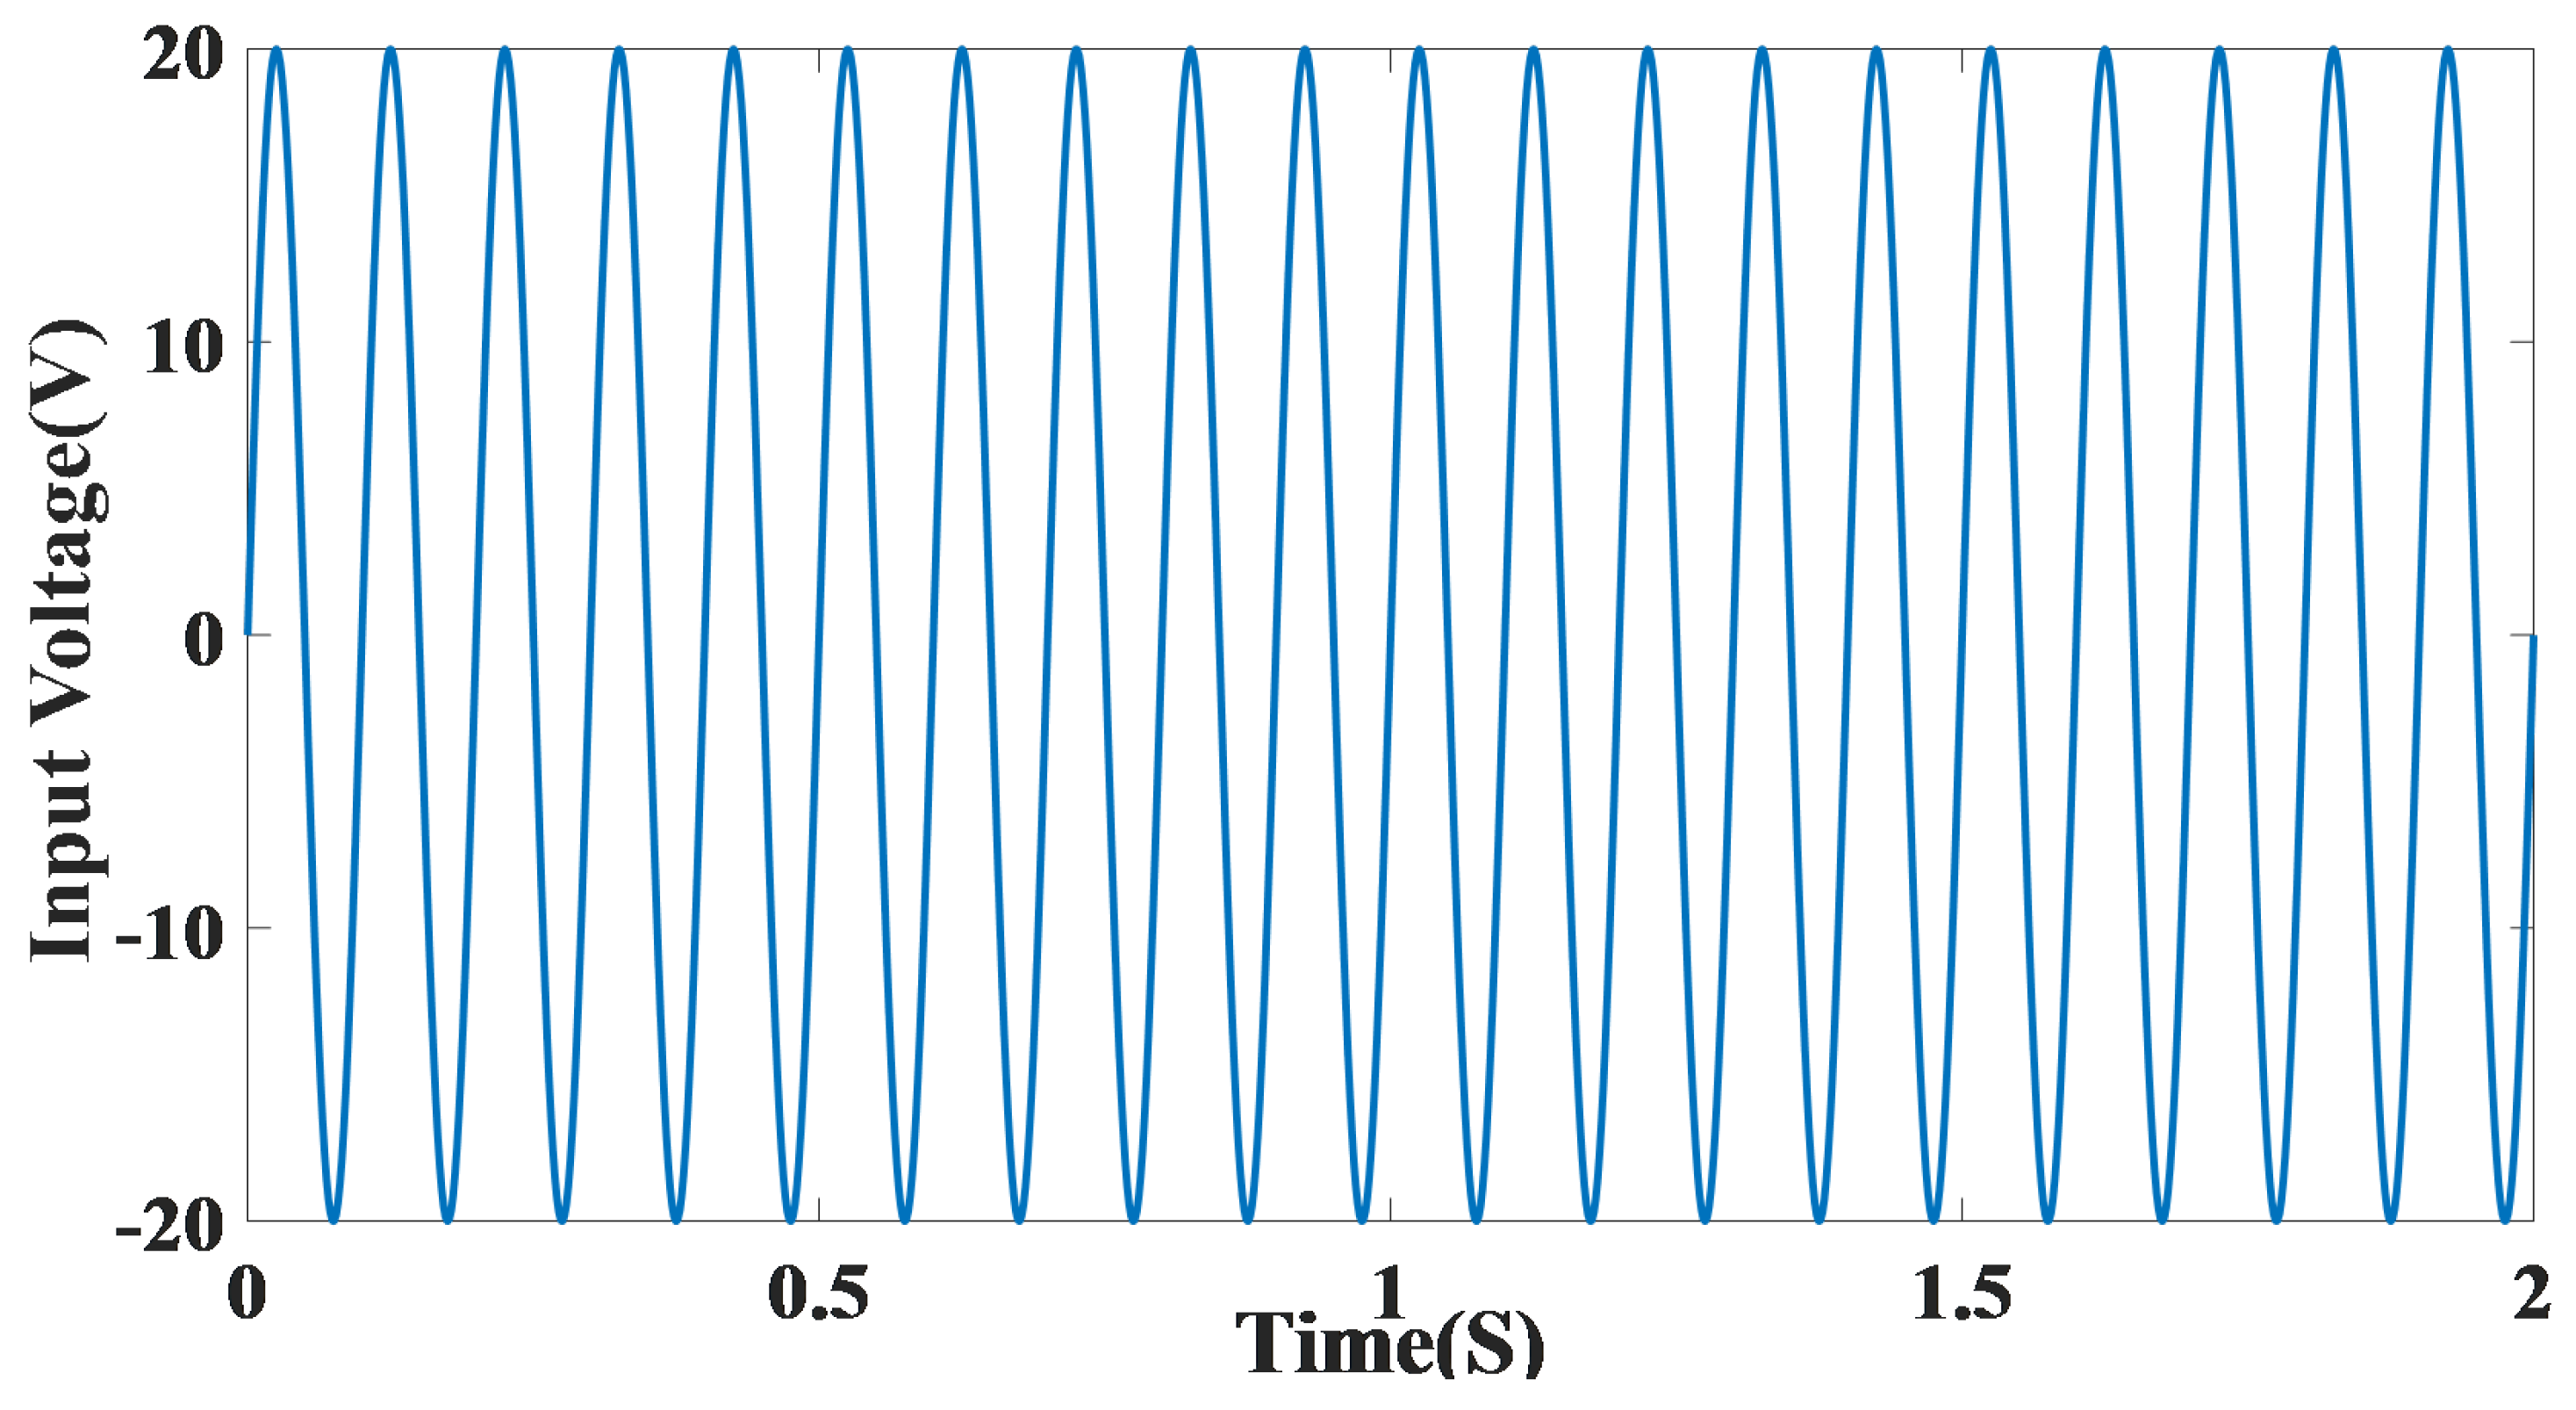
Figure 8.
Output voltage waveform produced by the bridge and filter for case No. 1.

Figure 9.
Output voltage waveform produced by the control system for case No. 1.
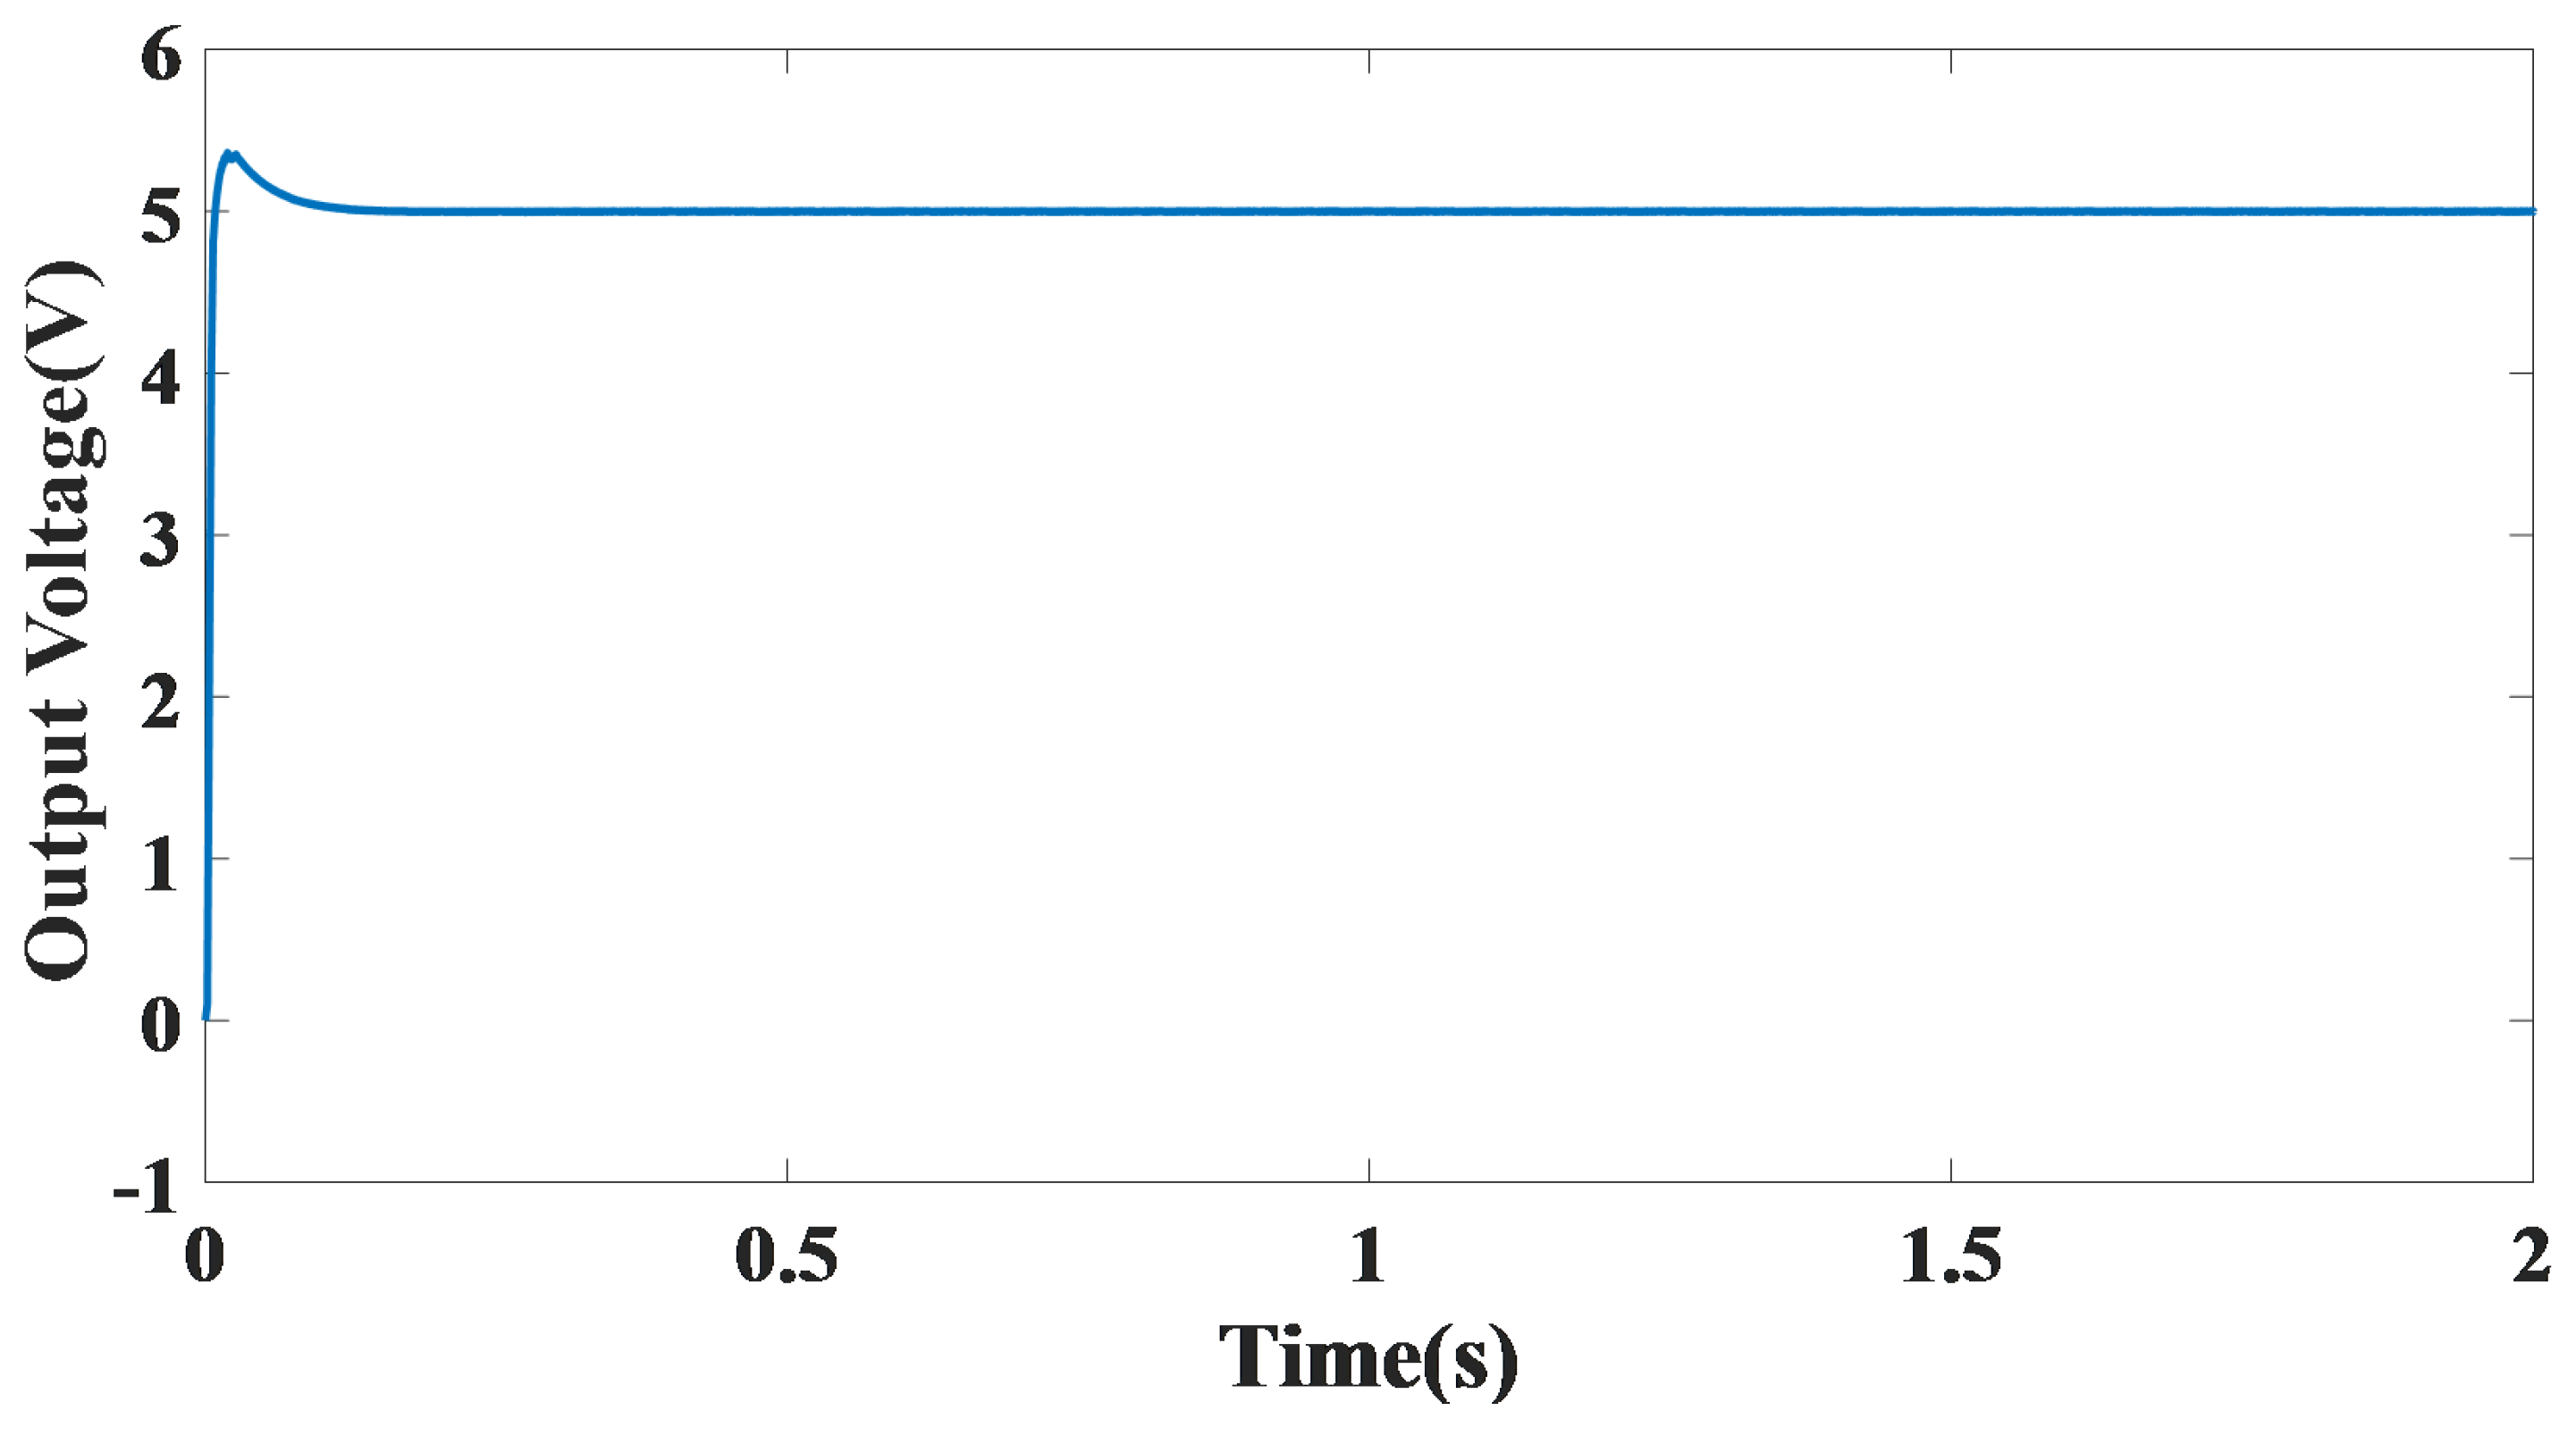
Figure 10.
Input voltage waveform produced by the piezoelectric array for case No. 2.

Figure 11.
Output voltage waveform produced by the bridge and filter for case No. 2.
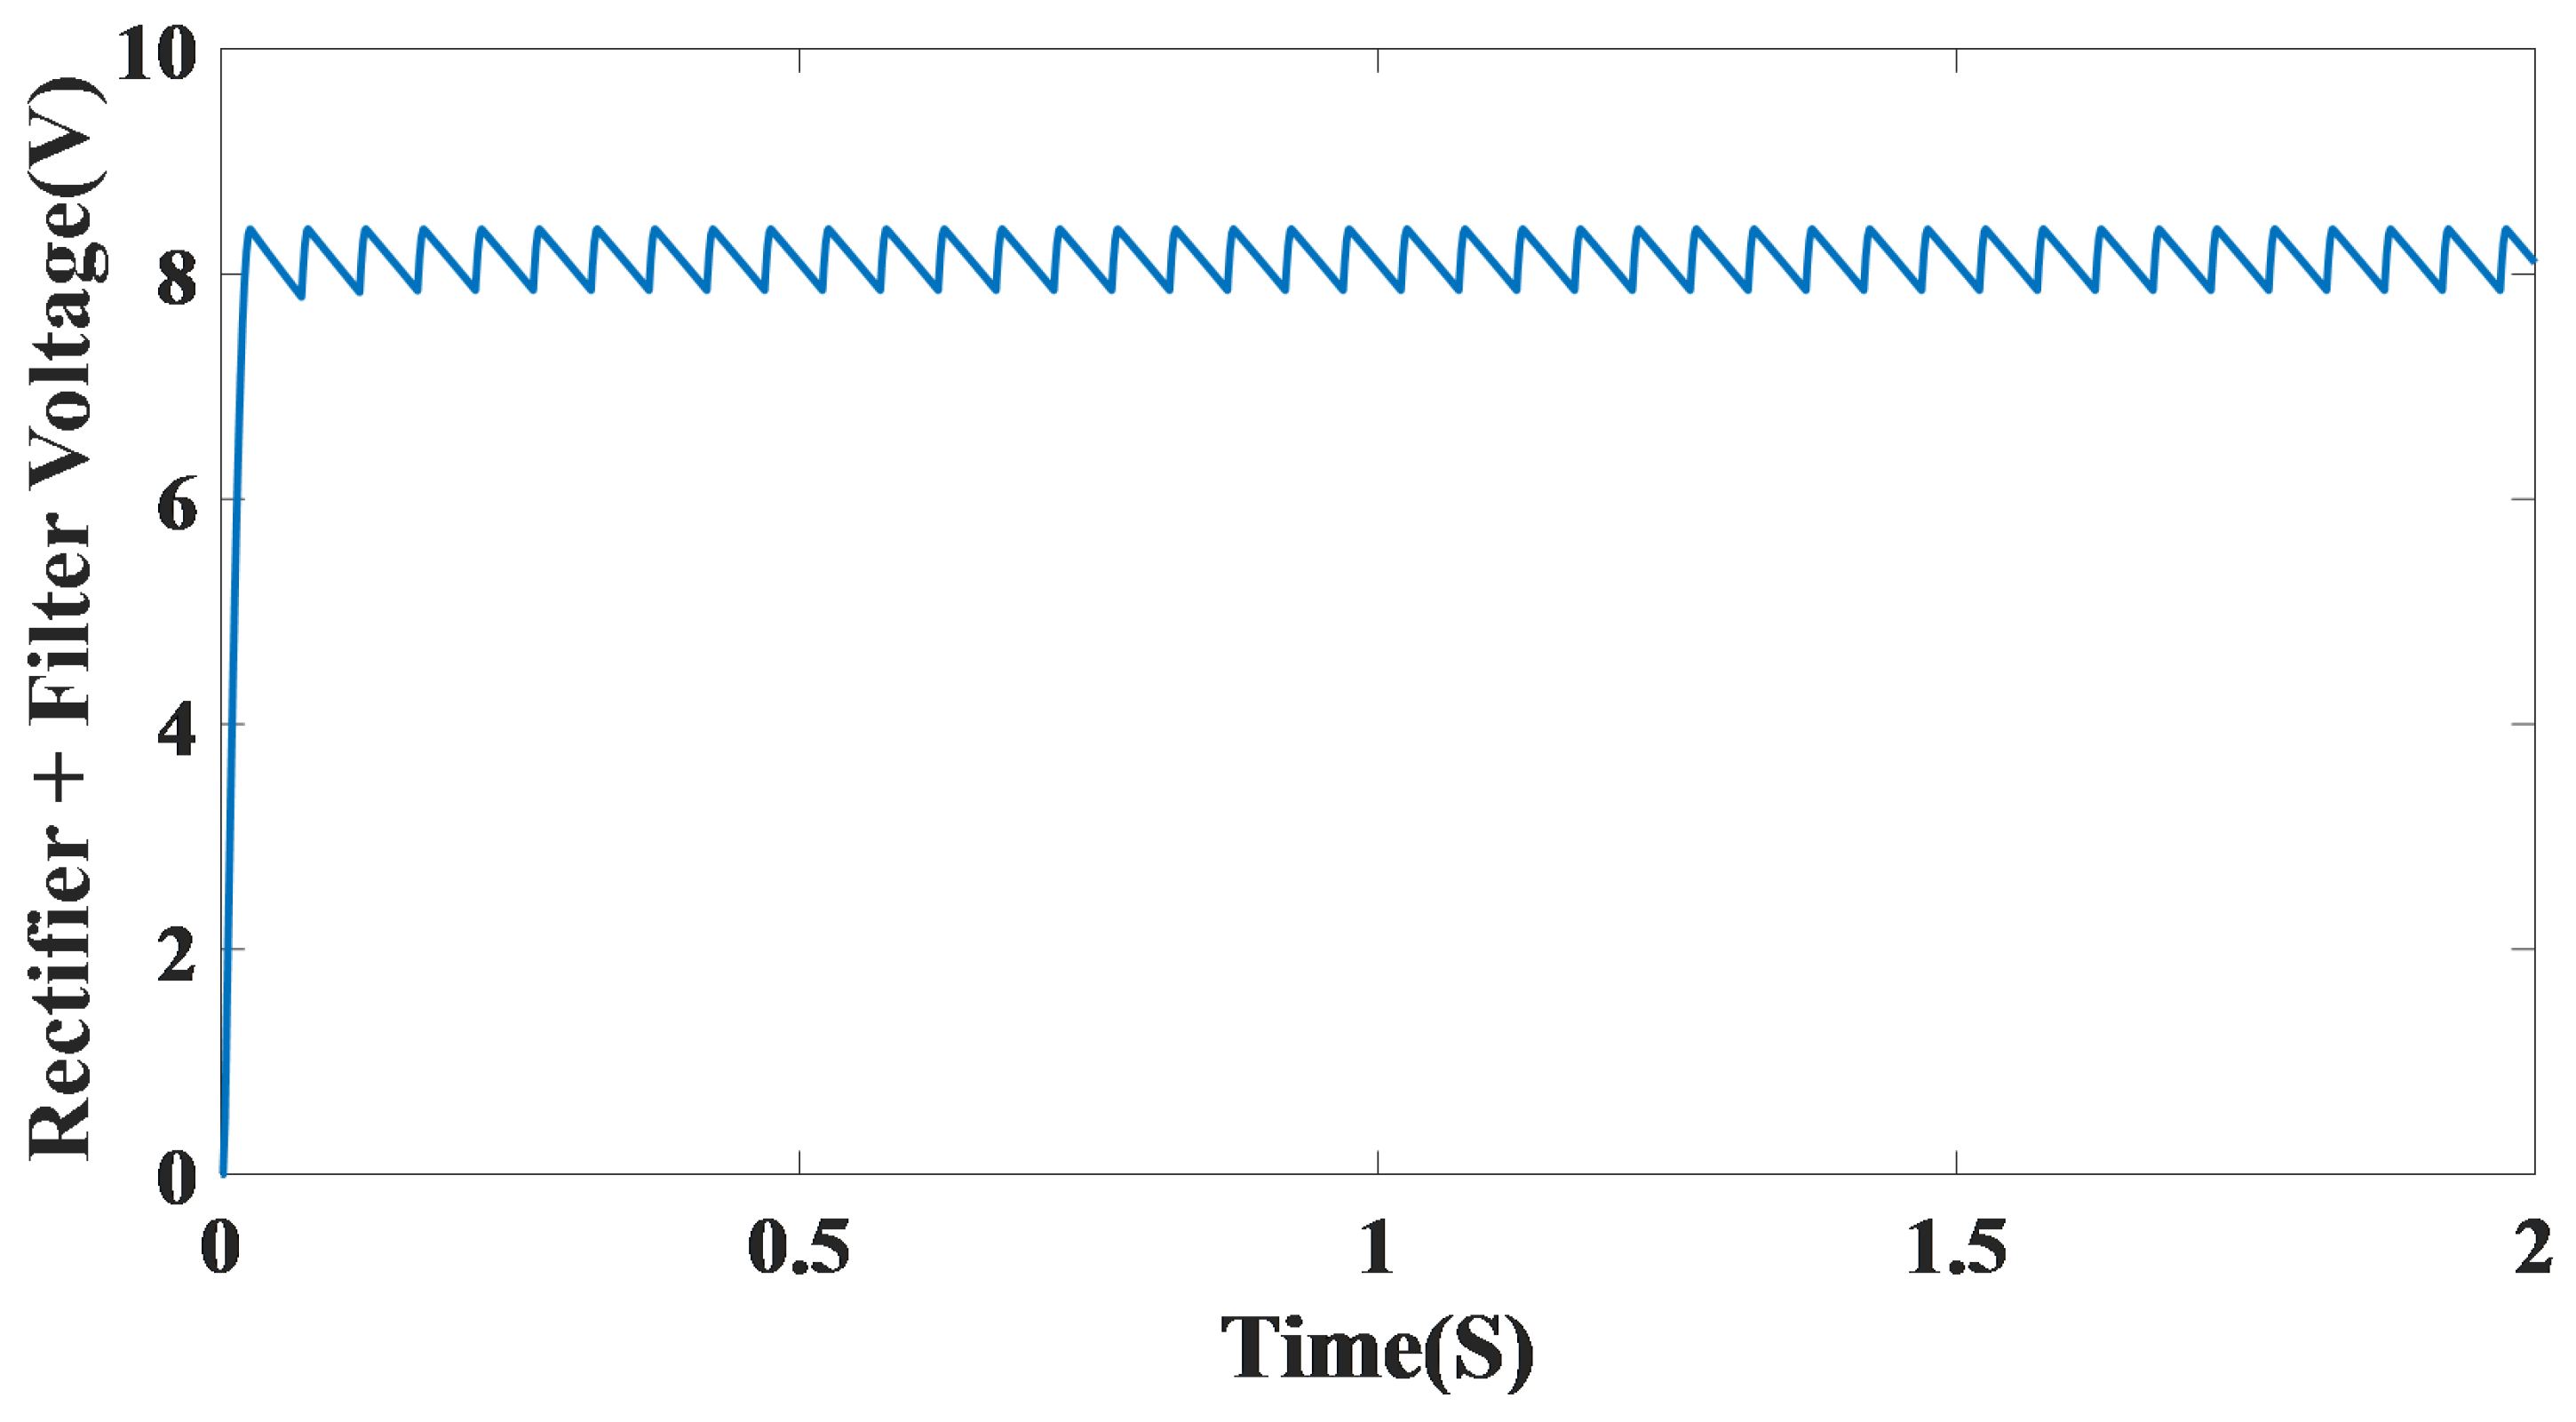
Figure 12.
Output voltage waveform produced by the control system for case No. 2.


Table 1.
1N60P diode Characterestics.
| Symbol | Parameter | Condition | Value | Unit | |
|---|---|---|---|---|---|
| Typ. | Max. | ||||
| VRRM | Repetitive Peak Reverse Voltage | − | 45 | − | V |
| Forward Continuous Current | = 25 C | 50 | − | mA | |
| Forward Voltage | = 1 mA | 0.24 | 0.5 | V | |
| Reverse Current | = 15 V | 5 | 10 | A | |
| Junction Capacitance | = 10 V & F = 1 MHz | 6 | − | pF | |
Table 2.
Quantitative data obtained from applying pressure from a single footstep on the tile using the rectifier.
Table 2.
Quantitative data obtained from applying pressure from a single footstep on the tile using the rectifier.
| Circuit Test Condition | Quantity | Measured | Unit |
|---|---|---|---|
| Open loop condition | Output Voltage | 33.7 | V |
| 1 LED as a load | Output Voltage | 2.4 | V |
| 1 LED as a load | Output Current | 0.079 | A |
| 2 series LEDs as a load | Output Voltage | 4.8 | V |
| 2 parallel LEDs as a load | Output Voltage | 2.4 | V |
Table 3.
Simulation parameter specifications of a buck converter.
| Parameter | Value |
|---|---|
| 10 V and 20 V | |
| L | 740 µH |
| C | 100 µF |
| 100:200 | |
| 5 V | |
| Switching Frequency | 40 kHz |
| Piezoelectric excitation frequency | 10 Hz |
Table 4.
An analysis of the proposed work in relation to existing literature.
| Reference | Harvester Type | Tile Size (mm) | Power Produced (mW) |
|---|---|---|---|
| [14] | Piezoelectric | 300 × 4300 | 6.04 |
| [3] | PZN 0.5C Thick Film Cantilever | 200 × 200 | 12 |
| [4] | PZT Cantilever | 430 × 430 | 1.24 |
| [28] | PZT Cantilever | 450 × 450 | 35 |
| Proposed work | Piezoelectric Ceramic Diaphragm | 455 × 405 | 249.6 |
Disclaimer/Publisher’s Note: The statements, opinions and data contained in all publications are solely those of the individual author(s) and contributor(s) and not of MDPI and/or the editor(s). MDPI and/or the editor(s) disclaim responsibility for any injury to people or property resulting from any ideas, methods, instructions or products referred to in the content. |
© 2024 by the authors. Licensee MDPI, Basel, Switzerland. This article is an open access article distributed under the terms and conditions of the Creative Commons Attribution (CC BY) license (https://creativecommons.org/licenses/by/4.0/).
Share and Cite
MDPI and ACS Style
Selim, K.K.; Smaili, I.H.; Yehia, H.M.; Ahmed, M.M.R.; Saleeb, D.A. Piezoelectric Sensors Pressed by Human Footsteps for Energy Harvesting. Energies 2024, 17, 2297. https://doi.org/10.3390/en17102297
AMA Style
Selim KK, Smaili IH, Yehia HM, Ahmed MMR, Saleeb DA. Piezoelectric Sensors Pressed by Human Footsteps for Energy Harvesting. Energies. 2024; 17(10):2297. https://doi.org/10.3390/en17102297
Chicago/Turabian StyleSelim, Kyrillos K., Idris H. Smaili, Hossam M. Yehia, M. M. R. Ahmed, and Demyana A. Saleeb. 2024. "Piezoelectric Sensors Pressed by Human Footsteps for Energy Harvesting" Energies 17, no. 10: 2297. https://doi.org/10.3390/en17102297
Note that from the first issue of 2016, this journal uses article numbers instead of page numbers. See further details here.