
Sand-Laden Wind Erosion Pair Experimental Analysis of Aerodynamic Performance of the Wind Turbine Blades
School of Energy and Transportation Engineering, Inner Mongolia Agricultural University, Hohhot 010018, China
*
Author to whom correspondence should be addressed.
Energies 2024, 17(10), 2279; https://doi.org/10.3390/en17102279
Submission received: 25 March 2024
/
Revised: 20 April 2024
/
Accepted: 6 May 2024
/
Published: 9 May 2024
(This article belongs to the Section A3: Wind, Wave and Tidal Energy)
Abstract
:In the Inner Mongolia region, sand and dust storms are prevalent throughout the year, with sand erosion having a particularly significant impact on the performance of wind turbine blades. To enhance the performance stability of wind turbines and reduce operation and maintenance costs, this study delves into the specific impact of sand-laden wind erosion on the aerodynamic performance of scaled-down wooden wind turbine blades. The experiment conducts vehicle-mounted tests on scaled models of 1.5 MW wind turbine blades that have been eroded by wind-sand flows from different zones, analyzing the changes in aerodynamic performance of wind turbines caused by the erosion. The results indicate that with an increase in the angle of installation, both the overall power output and the wind energy utilization coefficient of the wind turbines show a declining trend. The power outputs of both the partially eroded group and the fully eroded group are unable to reach the rated power level of 100 W. Compared to the uneroded group, the leading-edge eroded group demonstrated higher power output and wind energy utilization coefficients across most wind speed ranges. This finding verifies the possibility that the drag-reducing effect caused by pits from leading-edge erosion has a positive impact on the aerodynamic performance of the blades. It also provides a new research perspective and strong evidence for the study of erosion effects on wind turbine blades and the optimization of their aerodynamic performance.
1. Introduction
Wind energy is one of the most promising renewable energy sources [1]. The blade of a wind turbine is the key component of wind power generation. The serious erosion or stratification of the leading edge of the blade has an adverse impact on the power generation of the wind turbine. Wang et al. [2] analyzed the influence of different levels of leading edge stratification on the flow characteristics of the S809 airfoil. Through data and mechanism analysis, it is concluded that the aerodynamic performance of wind turbines decreases with an increase in stratification depth.
Sun et al. [3] put forward a method to identify blade damage and verified it by experiments on a small wind turbine, which can accurately identify several blade damages and realize remote health monitoring of blades. The eroded blade leading edge is considered to significantly reduce the power generation of wind turbines. Kelly et al. [4] studied the effect of blade roughness on wind turbine performance and annual power generation numerically, and Cappugi et al. [5] proposed and demonstrated a technique that can quickly and accurately estimate the power generation lost by the wind turbine due to the leading edge being eroded. Mishnaevsky et al. [6] studied the microscopic mechanism of a wind turbine blade leading edge eroded by X-ray tomography and computational micromechanical simulation and concluded that increasing the thickness of the polymer coating can delay the damage.
An increase in blade surface roughness reduces the aerodynamic performance of blades. Zhang et al. [7] proposed a bionic vortex generator to adjust the fluid flow in the boundary layer and reduce the adverse effect of roughness increases on the aerodynamic performance of blades. Nikolov et al. [8] put forward a classification method that uses sandpaper particle size to classify the roughness of turbine blades. Jung et al. [9] used a numerical simulation method to study the influence of blade surface roughness on the aerodynamic performance of a certain wind turbine rotor. The experiment shows that the influence of surface roughness on performance varies with wind speed, and the roughness is beneficial to the improvement of performance at higher wind speeds. Low temperatures will also affect the erosion performance of the leading edge and protective leading edge coating. Solid particle erosion is caused by dust, sand, and hail hitting the leading edge. Godfrey et al. [10] studied the erosion effect of the blade leading edge surface at different temperatures through modified equipment for simulating sand erosion and concluded that the erosion rate increased significantly at cold temperatures. Blade coating materials will also affect the life of blades. Kuthe et al. [11] determine the local stress distribution in the coating by establishing a finite element model and study the stress concentration of different blade materials by calculating experiments so as to determine the appropriate coating materials to effectively cope with the impact and prolong the life of the coating.
Sinner et al. [12] used a wind tunnel to test a feedforward control algorithm suitable for the wind turbine equivalent mode. Zhao et al. [13] designed the chord length and blade pitch distribution of the wind turbine and conducted wind tunnel tests on the prototype to verify the effectiveness of the design method. Fontecha et al. [14] determined the aerodynamic damping of wind turbine towers by wind tunnel testing. Guo [15] designed and manufactured the icing wind tunnel experiment system. In the icing wind tunnel, Li [16] studies a method to prevent the blade surface from icing by using heat pipe technology. In recent years, in addition to wind tunnel test methods, vehicle-mounted methods have also been widely used in wind turbine aerodynamic performance research. Li et al. [17] analyzed the influence of natural wind on the wind turbine test and verified the feasibility of the vehicle-mounted method by comparing it with the wind tunnel test results. Li et al. [18] referred to the wind tunnel test and, combined with the characteristics of the wind generated by vehicle movement, put forward a new vehicle-mounted test method.
Existing research has confirmed that blade surface abrasion will definitely affect aerodynamic performance; however, the influence of wear characteristics in different areas of the leading edge, trailing edge, and spanwise on aerodynamic performance has not been systematically studied. Therefore, combined with the characteristics of heavy wind and sand in Inner Mongolia, taking the scaled model of the real blade as the object, the erosion device is designed and processed to carry out wind-sand erosion on different areas of the blade pressure surface along tangential and spanwise directions. The blades, whose surface characteristics are closer to those of the actual natural environment after erosion by sand-laden wind, were obtained. The aerodynamic performance changes under dynamic testing are obtained by the vehicle-mounted method, and the aerodynamic performance changes of blades after erosion in different areas are studied. This study not only helps to improve the performance and stability of wind turbines and reduce operation and maintenance costs, but also promotes the innovative development of wind turbine technology and the sustainable development of the wind power industry.
2. Materials and Methods
2.1. Blade Model
The aerodynamic performance of 1.5 MW wind turbine blades is prepared for the test. However, the blade size of this wind turbine is large, the test cycle is long, the design of the test device needs to occupy a large space, the manufacturing cost is high, and the test conditions are strict. Therefore, a 1.5 MW blade model is designed to meet the test conditions, and the blade model is tested using a generator with a rated power of 100 W and the corresponding device, with a rated wind speed of 12 m/s and a blade tip speed ratio of 7. According to the similarity theory and geometric similarity Formula (1), a similar model of the blade is designed as a test blade.
where k is scale proportional coefficient; L is prototype blade length; Lt is model blade length.
Taking k = 1/38.5, the blade radius, chord length, and thickness are reduced according to this scaling coefficient to become the shape of a 1.5 MW model blade. The blade scaling model is shown in Figure 1. The installation angle and blade number of the scaling model are the same as those of the prototype blade. The wind wheel diameter of the blade scaling model is 2 m, and the turbine operates with three blades. The blade material is made of camphor pine wood, and the surface coating material is epoxy resin to enhance the corrosion resistance of the blade. The uniform range of coating thickness is required to be between 30 and 50 microns.
2.2. Blade-Erosion Wear Device
The blade erosion device adopts the test device designed and developed by the research group, which consists of nine parts, including a sand collector, an erosion pipe support frame, an erosion pipe, a sand feeding device (sandbox, screw propeller, sandbox support), an erosion box with an angle regulator, a test bench, an erosion pipe support seat, and a stepping motor, and a control cabinet. The overall structure diagram of the blade and the blade erosion device are shown in Figure 2 and Figure 3, respectively. The blade erosion device is powered by compressed air. The air source generated by the air compressor is connected with the erosion pipe in front of the mixing acceleration pipe. Air flows forward in the glass pipe with a circular cross-section through the pressure-regulating valve, and the erosion pressure is generated in the mixing acceleration pipe. After the air and sand are fully mixed, a simulated sand-laden wind with high speed is formed, which is sprayed into the sandbox through the erosion pipe, and the erosion wear test on the surface of the wind turbine blade model is carried out. The control cabinet adopts a PLC that controls the speed of the stepping motor, and the stepping motor drives the screw propeller. By establishing the relationship between the sediment concentration and the speed of the screw propeller, the control of the sediment concentration in the wind speed can be accurately realized. The erosion system is equipped with a blade installation angle adjustment device, which can realize the multi-stage adjustment of the blade in the range of zero to 90 perpendicular to the impact direction of wind-blown sand flow, thus realizing the wind-blown sand erosion effect in different areas of the blade. The working principle and flow of the erosion device are shown in Figure 4.
2.3. Sand Grain Size Selection and Blade Erosion Zoning
In order to determine the appropriate size of sand in the experiment, three piles of sand with the same quality were randomly sampled from a wind farm in western Inner Mongolia under the natural environment, which were screened by sieves with large to small apertures, respectively. The average values of the three groups of particle size mass percentages are shown in Table 1.
According to Table 1, it can be concluded that the sand particle size carried by natural wind is mainly concentrated in ultra-fine sand and fine sand, so the sand particles in Hobq Desert in Inner Mongolia Autonomous Region were selected to screen out the sand particles in the area with a sand particle size of 0.075 mm–0.25 mm for testing.
During the working process of the wind turbine, the leading edge of the blade is stressed first. Sand erosion generally starts from the front, because the blade shape adopts a streamline design, the windward side of the blade has a large stress area. The degree of wear is serious. Therefore, in this test, the blades are eroded on the windward side. The test is divided into three kinds of blade erosion modes: leading edge eroded (spanwise full-eroded, chord erosion from leading edge to trailing edge 0 ≤ l/L ≤ 1/4), half erosion (spanwise 1/2 ≤ r/R ≤ 1) and chord erosion from leading edge to trailing edge 1/4 ≤ l/L ≤ 1) and full erosion (chord erosion from leading edge to trailing edge 1/4 ≤ l/L ≤ 1). The windward surface (blade pressure surface) is divided into three parts: tip, leading edge, and root, and its distribution in each area is shown in Figure 5. When the self-designed erosion device is used for erosion, wear the test, and every three blades are in a group, the non-eroded blades are the control group, as shown in Figure 1, and the other eroded blades are shown in Figure 6.
2.4. Generator Characteristic Test
According to the national standard GB/T10760.2-2017 [19] the battery is used as the load, and the output voltage and current of the generator at each speed are measured by direct load method at the specified speed, and the load characteristic curve of the generator is obtained. Test equipment mainly includes a generator comprehensive test system, a three-phase rectifier bridge, a storage battery, a digital multimeter, a thermometer, an atmospheric pressure gauge, a 100 W generator, and so on. After adding measuring points, the input torque, speed, output voltage, and current of the generator are measured, and the input power and output power are calculated to obtain the generator power curve and efficiency curve shown in Figure 7.
According to the momentum theorem and leaf element theory, the wind force acting on the blades, the wind energy captured by the blades, and the lift and drag in the airfoil are all related to the air density, which is affected by the temperature and air pressure of the environment. In order to make the performance of wind turbines in different conditions and regions comparable, it is necessary to modify the measured generator data to the values under standard environmental conditions. The standard power corresponds to ambient conditions of 15 °C, a standard atmospheric pressure of 1013.3 hPa, and an air density of 1.225 kg/m3. Bringing in the standard parameters results in the following correction equation:
where, is air density at the time of the test, kg/m3; pt is atmospheric pressure at the time of the test, kPa; T is the ambient temperature, K.
The measured power is converted into standard power according to Equation (3), according to the parameters under standard environmental conditions.
where Pst is the corrected standard power, W; Pte is the measured output power, W.
2.5. Wind Turbine Blade Power Characteristic Test
Combined with the natural environmental conditions in Inner Mongolia, the vehicle-mounted method is used to obtain the output power of blade wind turbines after erosion in different areas. The main instruments and equipment include a generator set, a three-phase rectifier bridge, a multimeter, a telemetry wind speed and a direction meter, a load, an atmospheric pressure meter, etc. Figure 8 shows the power test scheme of the generator set. The generator, hub, blades and bracket form the generator set. The blades for the test are installed at the output shaft end of the generator through the hub, and the generator is connected with the base and fixed on the bracket.
The test was carried out in a north–south lane in Hohhot and Linger County, Inner Mongolia. The road had a straight route and low traffic flow, which was conducive to maintaining a stable speed. In order to reduce the influence of Reynolds number on the test, the natural wind speed is strictly controlled to be less than 2 m/s, and the angle between the wind direction and the direction of truck travel is less than 15° during the test. As shown in Figure 9, both the wind turbine and the generator set are located inside the freight car. The wind turbine, composed of three blades and wheels of the same group, is connected to the generator set. Different wind speeds are generated by driving the vehicle at different speeds, causing the wind turbine to rotate and promoting the generator to generate electricity. When the wind turbine system starts, two multimeters are used to measure voltage and current data simultaneously and record them. The power testing system is installed at a position consistent with the centerline of the freight car. In order to avoid the influence of the cab on the wind speed in front of the wind wheel, the center position of the wind wheel hub should be 1600 mm higher than the cab. According to the requirements of GB/T 18451.2-2003/IEC 61400-12:1998 [20] an anemometer should be installed at 4250 mm in front of the power testing system to measure the wind speed. The driving should be adjusted to change the wind speed while recording the output power of the generator.
According to the two-dimensional airfoil theory and force analysis of blade elements, the change in pitch angle will lead to a change in angle of attack, and the lift and drag in the airfoil will change during the change in angle of attack, which will affect the aerodynamic performance of blades. The installation angle refers to the inclination angle of the blade relative to its rotation plane. This angle determines the relative position of the blade with the incoming wind during rotation, thereby affecting the efficiency of the blade in capturing wind energy. The change in installation angle can affect the angle of attack of the blade. The angle of attack is the angle between the chord of the blade and the direction of the incoming wind, which determines the magnitude of lift and drag on the blade surface. By adjusting the installation angle, the aerodynamic performance of the blades can be changed, and their energy capture efficiency can be optimized at different wind speeds. Therefore, the experiment selected four specific installation angles of 22.7°, 31.7°, 40.7°, and 49.7°, covering the aerodynamic performance of the blades at different installation angles from smaller to larger angles. Comprehensively and systematically study the aerodynamic performance of blades under different installation angles and wear states in vehicle tests in order to provide an experimental basis for the design and optimization of wind turbines.
3. Results and Analysis
3.1. Output Power of the Turbine after the Blade Eroded in Different Areas
The Bean method is used to calculate the average wind speed and power according to Formulas (4) and (5) for the wind speed less than 15 m/s with 0.5 m/s as the Bean interval and the wind speed greater than 15 m/s with 1 m/s as the Bean interval.
where is average wind speed, m/s; is average power, W; Vi is wind speed for group i data, m/s; Pi is the power of group i data, W; m is the number of data in the average period.
According to the environmental parameters such as atmospheric pressure and temperature of each group of tests, the test power results under different environmental conditions are modified to the standard environment by using Equations (2) and (3), and the power-wind speed relationship curves under different installation angles under the wear characteristics of corresponding areas are obtained. Figure 10, Figure 11, Figure 12 and Figure 13 show the output characteristic curves of four groups of wind turbines under different installation angles, using vehicle-mounted tests and correcting the results to the standard environment.
When the installation angle is 22.7 degrees, the semi-eroded group starts to build pressure first and produces output power, with a starting wind speed of 6.9 m/s, while the non-eroded group has the maximum building pressure wind speed, with a starting wind speed of 7.7 m/s. The rated power of the semi-eroded group and the full-eroded group is less than 100 W, and the power growth range is not large. The power of the semi-eroded group is slightly greater than that of the full-eroded group in the same wind speed range.
When the wind speed is in the range of 7.2 m/s to 11.8 m/s, the output power of the four groups of turbines increases with the increase in wind speed; among them, the output power of the leading edge eroded group is greater than that of the other three groups of turbines and rises faster. When the wind speed is in the range of 11.9 m/s to 13.6 m/s, the power of the three erosion groups is lower than that of the non-eroded groups; the output power of the leading edge eroded group increases first, then decreases, and then rises with the increase in wind speed. The wind speed is 12.7 m/s to 13.2 m/s, and the output power of the other three groups increases with the increase in wind speed. When the wind speed is in the range of 13.7 m/s to 14.2 m/s, the leading edge eroded group and the non-eroded group reach the rated power, and the leading edge eroded group reaches the rated power slightly before the non-eroded group. When the wind speed ranges from 14.3 m/s to 17.8 m/s, the power of the leading edge eroded group is higher than that of the non-eroded group and increases obviously in the same wind speed range. When the wind speed ranges from 14.8 m/s, the power of the leading edge eroded group increases most significantly compared with that of the non-eroded group, and the value can reach 1.4 times. After the wind speed is 17.9 m/s, the wind speed of the leading edge eroded group does not continue to increase, but the maximum wind speed and the maximum power of the non-eroded group can reach 19.2 m/s and 280.3 W, respectively. The wind speed of the semi-eroded group and the full-eroded group can continue to increase, but the power is not high and the change is small.
When the installation angle is 31.7 degrees, the semi-eroded group starts to build pressure first and produces output power, with a starting wind speed of 8.9 m/s, while the full-eroded group has the maximum building pressure wind speed, with a starting wind speed of 9.9 m/s. The rated power of the semi-eroded group and the full-eroded group is less than 100 W, and the power growth range is not large. The power of the semi-eroded group is slightly greater than that of the full-eroded group in the same wind speed range.
When the wind speed is in the range of 9.2 m/s to 12.3 m/s, the output power of the four groups of turbines increases with the increase in wind speed, and the output power of the leading edge eroded group is greater than that of the other three groups and rises faster. When the wind speed is in the range of 12.3 m/s, the power of the leading edge eroded group increases most significantly compared with that of the non-eroded group, and the value can reach 4.5 times. When the wind speed ranges from 12.4 m/s to 12.8 m/s, the power of the front erosion group is still greater than that of the other three groups in the same wind speed range, but the value decreases, showing a downward trend as a whole, while the other three groups show an upward trend as a whole, with the non-eroded group rising rapidly, while the semi-eroded group and the full-eroded group rising slowly. When the wind speed ranges from 12.9 m/s to 18.5 m/s, the power of the leading edge eroded group is greater than that of the other three groups in the same wind speed range. The output power of the leading edge eroded group increases first, then decreases and then rises with the increase in wind speed, while the output power of the non-eroded group decreases first and then rises with the increase in wind speed, and the other two groups show an upward trend as a whole. When the wind speed ranges from 18.5 m/s to 18.7 m/s, the leading edge eroded group and non-eroded group reach the rated power, and the leading edge eroded group reaches the rated power slightly before the non-eroded group. After the wind speed is 18.7 m/s, the output power of the four groups increases with the increase in wind speed, the front erosion group and the non-eroded group increase rapidly, and the semi-eroded group and the full-eroded group increase slowly. In the same wind speed range, the power value of the leading edge eroded group is the largest, followed by the non-eroded group. The maximum wind speed of the leading edge eroded group and the non-eroded group can reach 20.5 m/s, and the maximum power of the leading edge eroded group reaches 136.9 W.
When the installation angle is 40.7°, the leading edge eroded group starts to build pressure first and produces output power, and the starting wind speed is 11.6 m/s, while the full-eroded group has the maximum building pressure wind speed, which is 13.4 m/s. The rated power of the four groups is less than 100 W, and the maximum power is generated in the leading edge eroded group, with a size of 43.8 W.
When the wind speed is in the range of 11.6 m/s to 13.8 m/s, the output power of the four groups of turbines increases with the increase in wind speed, among which the output power of the leading edge eroded group is greater than that of the other three groups and rises faster. When the wind speed is in the range of 13.8 m/s, the power of the leading edge eroded group increases most significantly compared with that of the non-eroded group, and the value can reach 3.5 times. After the wind speed is 13.8 m/s, the power of the leading edge eroded group is still greater than that of the other three groups in the same wind speed range. With the increase in wind speed, the output power of the leading edge eroded group decreases first and then rises, while the other three groups show an overall upward trend. The non-eroded group rises rapidly, while the semi-eroded group and the full-eroded group rise slowly. When the wind speed is 17.6 m/s, the power of the front-edge erosion group is 2.9 times that of the non-eroded group.
When the installation angle is 49.7°, the leading edge eroded group starts to build pressure first and produces output power, with a starting wind speed of 13.7 m/s, while the full-eroded group has the maximum building pressure wind speed, with a starting wind speed of 17.8 m/s. The rated power of the four groups is less than 100 W, and the maximum power is generated in the leading edge eroded group, with a size of 26.4 W.
The output power of the four groups of turbines increases with the increase in wind speed as a whole, among which the output power of the leading edge eroded group is greater than that of the other three groups and rises faster, and the wind speed is 20.6 m/s. Compared with the non-eroded group, the power of the leading edge eroded group increases most significantly, and the value can reach 1.7 times. The power growth of the semi-eroded group and the full-eroded group is not large, and the power of the semi-eroded group is slightly greater than that of the full-eroded group in the same wind speed range.
To sum up, the overall power of the wind turbine decreases with the increase in installation angle, which shows that the change in installation angle will reduce the aerodynamic performance of the wind turbine. When the installation angle is small, the semi-eroded group starts first, and when the installation angle is large, the leading edge eroded group starts first. No matter what installation angle, the power increase in the semi-eroded group and the full-eroded group is not large, but the power of the semi-eroded group is slightly greater than that of the full-eroded group in the same wind speed range. It shows that the aerodynamic performance of wind turbine blades deteriorates irreversibly when they reach a semi-eroded state, and they need to be replaced with new blades at this time.
Under the same installation angle, the influence of blades eroded in different zones on output power characteristics is obviously different; the power of the semi-eroded group and the full-eroded group decreased obviously, both of which could not reach 100 W rated power. When the installation angle was small, the power of the leading edge eroded group was higher than that of the non-eroded group in other wind speed ranges, except that it was lower than that of the non-eroded group in the 11.9 m/s to 13.6 m/s wind speed range and reached the rated power first than that of the non-eroded group. When the installation angle is large, the power of the leading edge eroded group is higher than that of the other three groups in the same wind speed range, which shows that the chord erosion, especially the tip erosion, obviously reduces the aerodynamic performance, while the leading edge pit has an obvious drag reduction effect, which can enhance the aerodynamic performance of the wind turbine after counteracting some of the erosion reduction on the aerodynamic performance. In addition, more blade coatings are retained in the leading edge eroded group, and the protective effect of coatings on blades has a positive impact on aerodynamic performance.
3.2. Wind Energy Coefficient of Performance under Different Blade Abrasion Characteristics
There is energy loss in the process of the wind turbine capturing wind energy from a natural wind field and converting it into electric energy. The wind energy coefficient of performance is commonly used to characterize the efficiency of the wind turbine converting wind energy into electric energy, and its formula is:
where Cp is the wind energy coefficient of performance; Pw is the output power of the wind turbine, W; is the generator efficiency; is the air density, kg/m3; v is the incoming wind speed, m/s; and A is the sweep area of wind wheel, m2.
According to the generator power curve and efficiency curve, the efficiency value under the corresponding output power can be obtained. By substituting air density, incoming wind speed, and wind wheel sweeping area into Equation (6), the wind energy coefficient of performance of each group of blade wind turbines can be obtained. Taking the non-eroded group as a reference, the change in the wind energy coefficient of the performance of the wind turbine was compared.
Figure 14 shows the variation of the wind energy coefficient of performance of four groups of erosion blade wind turbines with different areas relative to the reference group when the installation angles are 22.7, 31.7, 40.7, and 49.7, respectively. The normal range of the wind energy coefficient of performance is 24–45%. On the whole, the wind energy coefficient of performance of the wind turbine with a small installation angle is more in the normal range, mainly concentrated in the leading edge eroded group and the non-eroded group, and the highest value of the wind energy coefficient of performance reaches 32.6%. In most wind speed ranges, the wind energy coefficient of performance of the leading edge eroded group is higher than that of the Reference Group. However, the wind energy coefficient of performance of wind turbines at large installation angles is lower than that of the normal range; the highest is only 7.5%.
As can be seen from Figure 14a, when the installation angle is 22.7, the average wind energy coefficient of performance of the leading edge eroded group and the semi-eroded group is higher than that of the non-eroded group at the beginning of start-up, and only the full-eroded group is lower than that of the non-eroded group. When the wind speed ranges from 7.2 m/s to 8.3 m/s, the average wind energy coefficient of performance of the leading edge eroded group, the non-eroded group, and the full-eroded group shows an upward trend, while that of the semi-eroded group shows a downward trend. In the same wind speed range, the average wind energy coefficient of performance of the leading edge eroded group is the highest and higher than that of the non-eroded group, while the average wind energy coefficient of performance of the semi-eroded group and the full-eroded group is lower than that of the non-eroded group. When the wind speed ranges from 8.4 m/s to 8.6 m/s, the average wind energy coefficient of performance of the leading edge eroded group shows an upward trend, while the other three groups show a downward trend. In the same wind speed range, the average wind energy coefficient of performance of the leading edge eroded group is the highest and higher than that of the non-eroded group, while the average wind energy coefficient of performance of the semi-eroded group and the full-eroded group is lower than that of the non-eroded group. When the wind speed is in the range of 8.7 m/s to 9.1 m/s. In the same wind speed range, the average wind energy coefficient of performance of the leading edge eroded group is the highest and higher than that of the non-eroded group, while the average wind energy coefficient of the performance of the semi-eroded group and the full-eroded group is lower than that of the non-eroded group. The average wind energy coefficient of the performance of the leading edge eroded group reaches 2.5 times that of the semi-eroded group when the wind speed is 8.7 m/s; when the wind speed ranges from 9.2 m/s to 10.7 m/s, the average wind energy coefficient of performance of the four groups shows an upward trend. In the same wind speed range, the average wind energy coefficient of performance of the front erosion group are the highest and higher than those of the non-eroded group, while the average wind energy coefficient of performance of the semi-eroded group and the full-eroded group are lower than those of the non-eroded group; when the wind speed is in the range of 10.8 m/s to 14 m/s, the wind energy coefficient of performance of the leading edge eroded group is higher than that of the non-eroded group except that in the range of 11.1 m/s to 12.2 m/s and 13.2 m/s to 14.1 m/s, the wind energy coefficient of performance of the leading edge eroded group is lower than that of the non-eroded group, and the wind energy coefficient of performance of the semi-eroded group and the full-eroded group shows a downward trend, with little change; when the wind speed ranges from 14.1 m/s to 14.8 m/s, the leading edge eroded group shows an upward trend, while the non-eroded group, semi-eroded group and full-eroded group show a downward trend. In the same wind speed range, the average wind energy coefficient of performance of the leading edge eroded group is higher than the other three groups, and when the wind speed ranges from 14.8 m/s, the average wind energy coefficient of performance of the leading edge eroded group reaches its peak; when the wind speed ranges from 14.9 m/s to 18 m/s, the non-eroded group shows an upward trend, while the front-edge erosion group, semi-eroded group, and full-eroded group show a downward trend. When the wind speed ranges from 17.4 m/s to 17.9 m/s, the average wind energy coefficient of performance of the front-edge erosion group is lower than that of the non-eroded group, and in other wind speed ranges, the average wind energy coefficient of performance of the leading edge eroded group is higher than that of the other three groups.
From Figure 14b–d, it can be seen that the wind energy coefficient of performance of the semi-eroded group and the full-eroded group are lower than that of the non-eroded group in the maximum wind speed range, so the change laws of the wind energy coefficient of performance of the front erosion group and the non-eroded group is mainly compared. When the installation angle is 31.7, the wind energy coefficient of performance of the non-eroded group shows an overall upward trend with the increase in wind speed, but in the wind speed range of 13.3 m/s to 14.1 m/s and 19.6 m/s to 20.5 m/s, before the wind speed reaches 12 m/s, the wind energy coefficient of performance of the leading edge eroded group shows an overall upward trend with the increase in wind speed, but it shows a downward trend in the wind speed range of 10.8 m/s to 11.3 m/s. When the wind speed is greater than 12 m/s, the wind energy coefficient of performance fluctuates with the increase in wind speed. Except that the wind energy coefficient of performance is lower than that of the non-eroded group in the wind speed range of 15.8 m/s to 16.6 m/s and 19.4 m/s to 19.8 m/s, the wind energy coefficient of performance of the leading edge eroded group is 2.2 times higher than that of the non-eroded group when the wind speed reaches 12.8 m/s.
When the installation angle is 40.7°, the wind energy coefficient of performance of the leading edge eroded group and the non-eroded group increases with the wind speed but decreases in the wind speed ranges of 13.8 m/s to 14.3 m/s, 14.7 m/s to 15.3 m/s, and 17.6 m/s to 18.6 m/s. In the same wind speed range, the average wind energy coefficient of performance of the leading edge eroded group is higher than that of the non-eroded group.
When the installation angle is 49.7°, the wind energy coefficient of performance of the leading edge eroded group and the non-eroded group shows an overall upward trend with the increase in wind speed. In the same wind speed range, the average wind energy coefficient of performance of the leading edge eroded group is higher than that of the non-eroded group.
4. Discussion
There is no doubt that the aerodynamic performance of the wind turbine blades will decrease after erosion, but the experimental results show that the aerodynamic performance of the wind turbine blades after erosion is higher than that of the blades without erosion, it shows that there are other factors after erosion have a positive impact on the aerodynamic performance of the wind turbine. The aerodynamic performance of a wind turbine blade is closely related to its overall shape, surface roughness, and material characteristics. In addition, in-vehicle testing in a real-world environment can only partially reduce the Reynolds number effect, which is often difficult to completely eliminate. Therefore, the cause of the aerodynamic performance enhancement is uncertain. Because of the erosion of the leading edge, there are many pits on the turbine blades, which may be explained by the pit drag reduction theory.
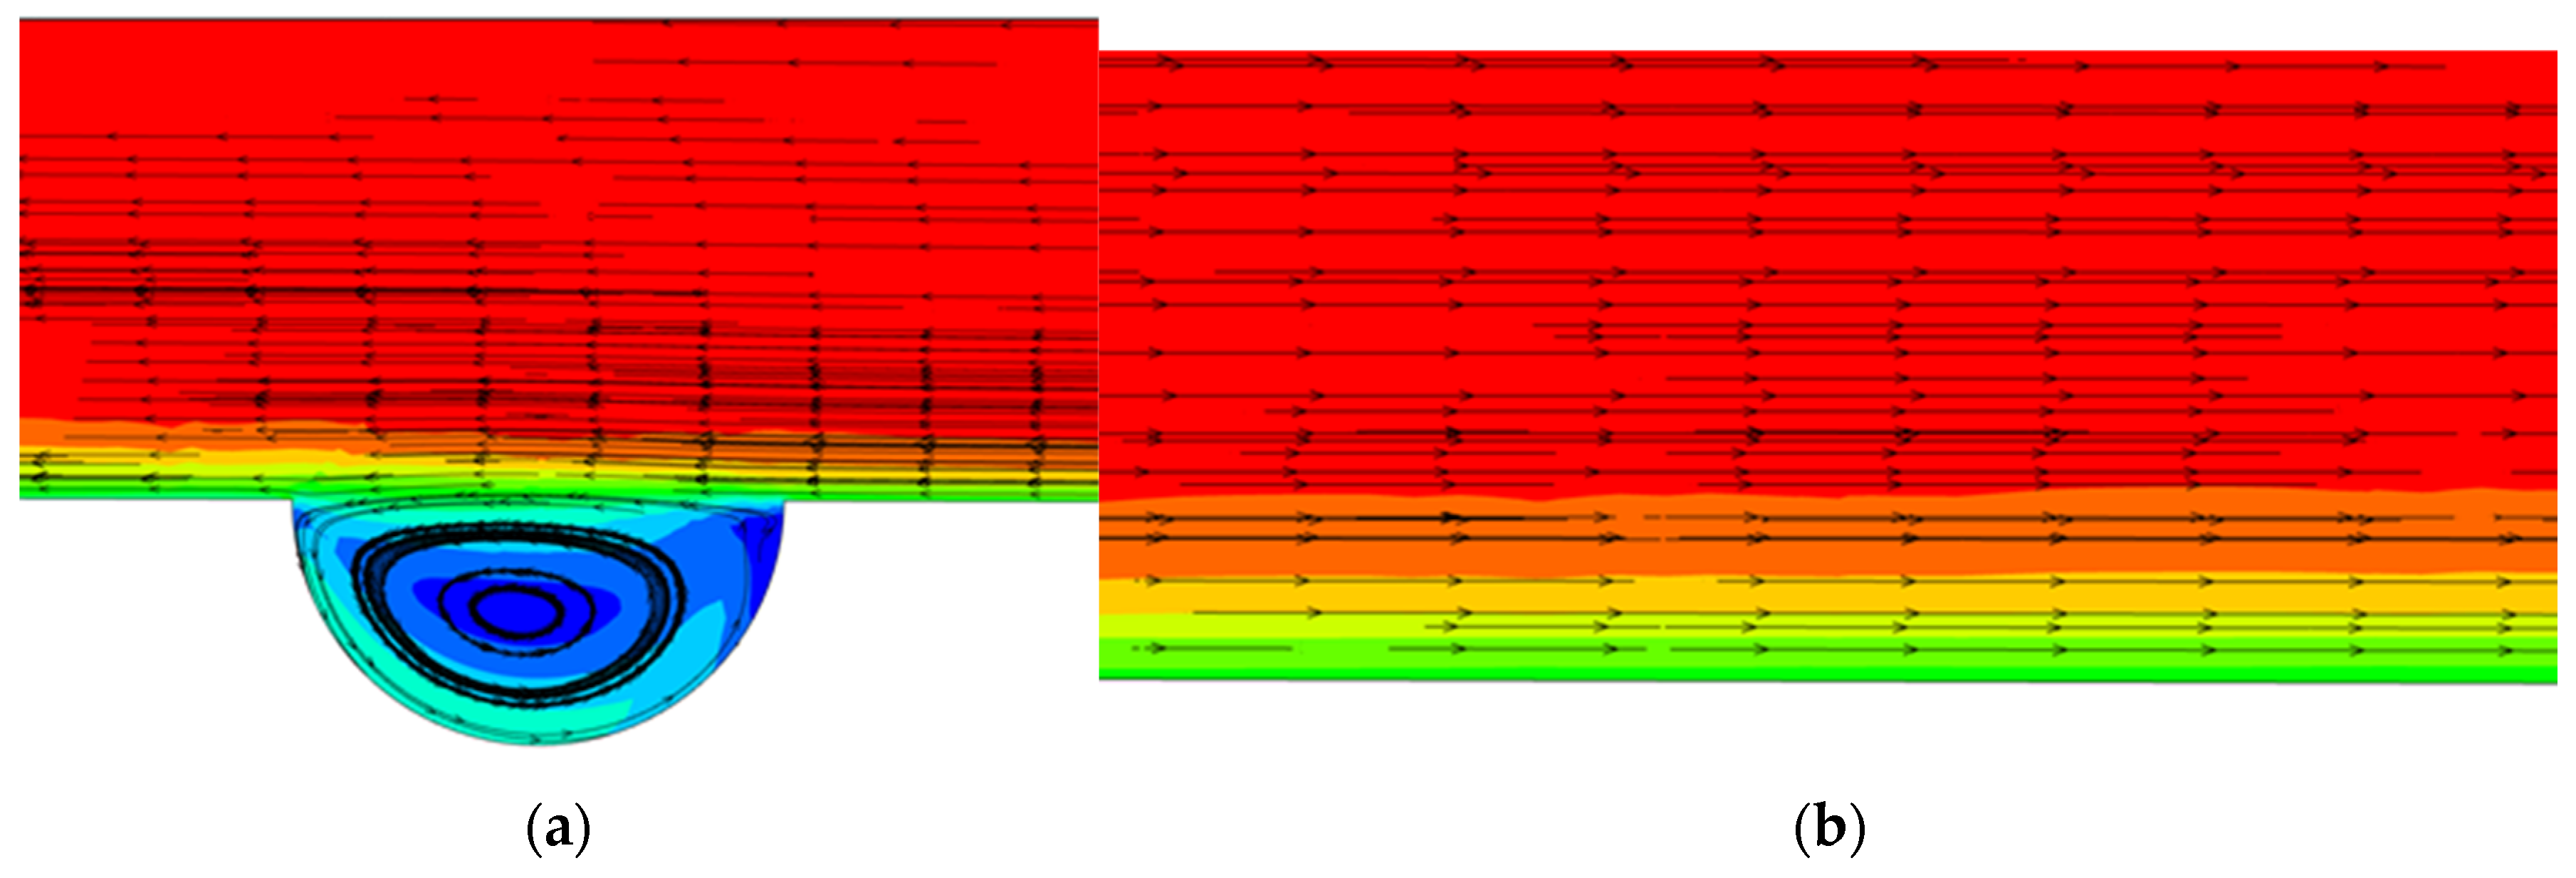
The drag reduction theory of pit structure is a kind of drag reduction theory of the non-smooth surface. Drag reduction is achieved by controlling the boundary layer on the nonsmooth surface. The pit’s non-smooth structure has a significant drag reduction effect, as can be seen in Figure 15. As shown in Figure 15a, a relatively distinct vortex will form at the bottom of the pit surface structure, with the upper part of the vortex in the same direction as the incoming flow and the lower part in the opposite direction. Therefore, the air flow inside and outside the pit structure forms an eddy current buffering effect, and the rotating air flow transforms the sliding friction of the fluid near the wall into rolling friction, which greatly reduces the friction resistance of the fluid surface. The surface structure of the pit is not smooth, and low-speed air flow forms in the pit. The low-speed air flow adsorbs the high-speed air flow on the surface of the fluid, which makes the separation point between the wall and the fluid moves backward, thus reducing the pressure drop resistance of the fluid. The blade of the turbine will form many pits after erosion. The effects of drag reduction by pits on the aerodynamic performance of blades were verified by the comparative tests of blades in different erosion zones.
In the simulation experiment of blade erosion, it is impossible to ensure that the wear rate and wear degree of three blades in the same group are exactly the same, so many experiments can be carried out to obtain the average value so as to make the results more accurate.
At present, many scholars have found that the nonsmooth surface structure has dragged reduction characteristics through the research of bionics [21,22,23]. The pit drag reduction theory is one of the drag reduction theories of nonsmooth surfaces, and the wind turbine blades will have pits after being eroded by solid particles. Yuan et al. [24] studied the wind turbine with the theory of drag reduction on a nonsmooth surface, mainly studying the influence of different sizes of pits on the drag reduction effect of the wind turbine. Wang et al. [25] numerically simulated the blades with fluent 15.0 software, analyzed the flow field distribution, and concluded that the lift coefficient can be improved by 6.9% by arranging pits with a radius of 10 mm at a 60–82% chord length. Through numerical simulation software, Zhong et al. [26] established a theoretical model of pits, analyzed the flow field of pit surfaces compared with smooth surfaces, and concluded that a 0.05 mm pit surface has a better drag reduction effect. Aziz et al. [27] reduced the resistance by introducing a series of pits on the blade surface and proved that their results were consistent through the comparison between wind tunnel experiments and simulation results.
Anyway, by analyzing the two important indexes of power and wind energy coefficient of performance, it is proved that the aerodynamic performance of wind turbine blades with the compressed proportion of wood after the leading edge abrasion is enhanced. Whether it is due to the drag reduction effect of the pit still needs further simulation and experimental analysis, which interested researchers can further study.
5. Conclusions
The paper simulates the wind and sand environments in the central and western regions of Inner Mongolia, conducts zonal erosion on the scale model of 1.5 MW wind turbine blades through erosion and wear devices, and completes the vehicle test after installing the eroded blades to form a small turbine. Through the test, the main conclusion is that the aerodynamic performance of the leading edge eroded group is higher than that of the non-eroded group, which verifies that the pit drag reduction theory has a significant impact on the aerodynamic performance of the turbine and provides foundational support for future wind turbine blade design and optimization. The paper analyzes in detail the influence of blades with different erosion effects on wind turbine power at different installation angles, and the relationship between wind speed and wind energy coefficient of performance at different installation angles. The results are as follows:
- (1)
- The overall power of the wind turbine decreases with the increase in installation angle, which indicates that the change in installation angle will reduce the aerodynamic performance of the wind turbine.
- (2)
- No matter what installation angle, the power increase in the semi-eroded group and the full-eroded group is not big, and the power decreases obviously with the increase in wind speed, which is less than 100 W rated power, but the power of the semi-eroded group is slightly greater than that of the full-eroded group in the same wind speed range.
- (3)
- The leading edge eroded group has the same effect on the output power of wind turbines. When the installation angle is large, the output power is larger than that of the non-eroded group and reaches the rated power first in the same wind speed range, which improves the aerodynamic performance. When the installation angle is small, the output power of the leading edge eroded group is lower than that of the non-eroded group except in the wind speed range of 11.9 m/s to 13.6 m/s, and the other wind speed ranges are higher than that of the non-eroded group and reach the rated power first than that of the non-eroded group.
- (4)
- The erosion in the chordal direction, especially at the blade tip, significantly degrades the aerodynamic performance. However, the aerodynamic performance of the wind turbine after leading-edge erosion has been enhanced. This discovery initially suggests that leading-edge erosion may, to some extent, enhance the aerodynamic performance of the blade. Although this study preliminarily explores the positive impact of pit degradation on this phenomenon, the exact mechanism requires further investigation through more detailed simulation modeling and experimental research.
- (5)
- The wind energy coefficient of performance of wind turbines decreases with the increase in installation angle, and the wind energy coefficient of performance of semi-eroded group and full-eroded group decreases obviously and has little change. Under large installation angles, the wind energy coefficient of performance of the leading edge eroded group and the non-eroded group showed an overall upward trend with the increase in wind speed but showed a downward trend in the wind speed ranges of 13.8 m/s to 14.3 m/s, 14.7 m/s to 15.3 m/s, and 17.6 m/s to 18.6 m/s. In the same wind speed range, the average wind energy coefficient of performance of the leading edge eroded group was higher than that of the non-eroded group. When the installation angle is small, the wind energy coefficient of performance of the leading edge eroded group is lower than that of the non-eroded group in the wind speed ranges of 11.1 m/s to 12.2 m/s, 13.2 m/s to 14.1 m/s, 15.8 m/s to 16.6 m/s, 17.4 m/s to 17.9 m/s, and 19.4 m/s to 19.8 m/s, but higher than that of the non-eroded group in other wind speed ranges.
Author Contributions
Conceptualization, S.C.; methodology, D.W.; software, D.L.; validation, Q.Z. and B.Z.; writing—original draft preparation, D.W. All authors have read and agreed to the published version of the manuscript.
Funding
This research was funded by the Basic Research Operating Fund Projects for Colleges and Universities Directly Under the Inner Mongolia Autonomous Region (BR231508),the Inner Mongolia Autonomous Region Natural Science Foundation Joint Fund Project (2023LHMS03040), and the National Natural Science Foundation of China (51766017).
Data Availability Statement
Data are contained within the article.
Conflicts of Interest
The authors declare no conflicts of interests.
References
- Miliket, T.A.; Ageze, M.B.; Tigabu, M.T. Aerodynamic performance enhancement and computational methods for H-Darrieus vertical axis wind turbines: Review. Int. J. Green Energy 2022, 19, 1428–1465. [Google Scholar] [CrossRef]
- Wang, Y.; Zhou, Y.; Duan, C.; Wang, L.; Jia, A. Insight into the effects of leading edge delamination on the aerodynamic performance of an airfoil and wind turbine. J. Renew. Sustain. Energy 2022, 14, 023305. [Google Scholar] [CrossRef]
- Sun, S.; Wang, T.; Yang, H.; Chu, F. Damage identification of wind turbine blades using an adaptive method for compressive beamforming based on the generalized minimax-concave penalty function. Renew. Energy 2022, 181, 59–70. [Google Scholar] [CrossRef]
- Kelly, J.; Vogel, C.; Willden, R. Impact and mitigation of blade surface roughness effects on wind turbine performance. Wind Energy 2021, 25, 660–677. [Google Scholar] [CrossRef]
- Lorenzo, C.; Alessio, C.; Aldo, B.; Edmondo, M.; Sergio, C.M. Machine learning-enabled prediction of wind turbine energy yield losses due to general blade leading edge erosion. Energy Convers. Manag. 2021, 245, 114567. [Google Scholar]
- Mishnaevsky, L.; Fæster, S.; Mikkelsen, L.P.; Kusano, Y.; Bech, J.I. Micromechanisms of leading edge erosion of wind turbine blades: X-ray tomography analysis and computational studies. Wind Energy 2020, 23, 547–562. [Google Scholar] [CrossRef]
- Zhang, Z.; Li, W.; Jia, X. CFD Investigation of a Mobula Birostris-Based Bionic Vortex Generator on Mitigating the Influence of Surface Roughness Sensitivity of a Wind Turbine Airfoil. IEEE Access 2020, 8, 223889–223896. [Google Scholar] [CrossRef]
- Nikolov, I.A.; Madsen, C.B. Quantifying Wind Turbine Blade Surface Roughness using Sandpaper Grit Sizes: An Initial Exploration. In Proceedings of the VISIGRAPP, Virtual, 8–10 February 2021. [Google Scholar]
- Su, J.Y.; James, B. Simulations for Effect of Surface Roughness on Wind Turbine Aerodynamic Performance. J. Phys. Conf. Ser. 2020, 1452, 012055. [Google Scholar] [CrossRef]
- Mike, G.; Oliver, S.; Jurgita, Z.; Ismail, B.; Robert, W. The effect of temperature on the erosion of polyurethane coatings for wind turbine leading edge protection. Wear 2021, 476, 203720. [Google Scholar]
- Nikesh, K.; Puneet, M.; Suhail, A.; Leon, M. Engineered anti-erosion coating for wind turbine blade protection: Computational analysis. Mater. Today Commun. 2022, 31, 103362. [Google Scholar]
- Michael, S.; Vlaho, P.; Frederik, B.; Lars, N.; Martin, K.; Pao, L.Y. Wind Tunnel Testing of an Optimal Feedback/feedfoward Control Law for Wind Turbines. IFAC Pap. 2020, 53, 12638–12643. [Google Scholar]
- Zhao, X.; Zhou, P.; Liang, X.; Gao, S. The aerodynamic coupling design and wind tunnel test of contra-rotating wind turbines. Renew. Energy 2020, 146, 1–8. [Google Scholar] [CrossRef]
- Robert, F.; Frank, K.; Markus, F.; Stefan, W.; Ralf, S. Along-Wind Aerodynamic Damping of Wind Turbine Towers: Determination by Wind Tunnel Tests and Impact on Tower Lifetime. Energies 2022, 15, 1984. [Google Scholar] [CrossRef]
- Guo, W.; He, S.; Yan, L.; Fang, F.; Kotaro, T. Wind tunnel tests of the rime icing characteristics of a straight-bladed vertical axis wind turbine. Renew. Energy 2021, 179, 116–132. [Google Scholar] [CrossRef]
- Li, X.; Guo, W.; Li, Y.; Xu, Z.; Feng, F. Wind tunnel test of an anti-icing approach by heat pipe for wind turbine bladesunder the rime ice condition. Therm. Sci. 2021, 25 Pt B, 4485–4493. [Google Scholar] [CrossRef]
- Li, S.; Liang, J.; Guo, P.; Wang, X.; Li, P. A novel test method for the aerodynamic performance ofwind turbine airfoil using wind generated by a moving vehicle. Wind Struct. 2021, 32, 551. [Google Scholar]
- Li, S.; Li, Q.; Liang, J.; Guo, P. Investigation of the Transiting Test Method for the Aerodynamic Performance of Vertical Axis Wind Turbine Using Wind Generated by a Moving Vehicle. Exp. Tech. 2021, 46, 351–363. [Google Scholar] [CrossRef]
- GB/T 10760.2-2017; Generator of Small Wind Turbines—Part 2: Testing Methods. China National Standards: Beijing, China, 2017.
- GB/T 18451.2-2003; Wind Turbine Generator Systems-Wind Turbine Power Performance Testing. China National Standards: Beijing, China, 2003.
- Zhou, M.; Wang, G.; Liu, M.; Chen, Y. Drag Reduction Effect of Convex Non-smooth Surface on the Boat -type Tractor. J. Agric. Mech. Res. 2018, 40, 236–240+246. [Google Scholar] [CrossRef]
- Liu, H.; Xu, Z. Study on Drag and Noise Reduction of Pantograph Rods based on Bionic Non-smooth Structures. Noise Vib. Control 2018, 38, 269–272. [Google Scholar]
- Yang, Y.; Lu, H.; Guo, S.; Pang, W.; Wang, Y.; Zhong, K. Effects of dimples with different depths in a highly loaded compressor cascade. J. Dalian Marit. Univ. 2018, 44, 83–91. [Google Scholar] [CrossRef]
- Yuan, Y.; Yang, H.; Shi, Y.; Zuo, H. Study on Drag Reduction Characteristics of Airfoil for Wind Turbine With Microgrooves on Surface. J. Eng. Thermophys. 2018, 39, 1258–1266. [Google Scholar]
- Wang, Y.; Lu, W.; Guo, S.; Wang, L.; Xin, J. Influence of Dimples on Aerodynamic Performance of Wind Turbine Airfoil. Chin. J. Turbomach. 2021, 63, 8–15. [Google Scholar] [CrossRef]
- Sun, Z. Numerical Simulation on Drag Reduction of Rotors with Non-smooth Surface. Shandong Text. Sci. Technol. 2009, 31, 117–121. [Google Scholar]
- Shahid, A.; Abdullah, K.; Imran, S.; Amin, K.T.; Yasir, A.; Umer, S.M.; Badar, R.; Won, J.D. Computational Fluid Dynamics and Experimental Analysis of a Wind Turbine Blade’s Frontal Section with and without Arrays of Dimpled Structures. Energies 2022, 15, 7108. [Google Scholar] [CrossRef]
Figure 1.
Diagram of scaling blade model.
Figure 2.
Structural schematic diagram of blade erosion device of the wind turbine.

Figure 3.
Test equipment of wind turbine blade erosion device.

Figure 4.
Working principle and flow of erosion device.
Figure 5.
Regional distribution map of windward side of blades.
Figure 6.
Blades after grouping erosion of test blades: (a) Blade after leading edge eroded; (b) Blade after semi-eroded; (c) Blade after full erosion.
Figure 6.
Blades after grouping erosion of test blades: (a) Blade after leading edge eroded; (b) Blade after semi-eroded; (c) Blade after full erosion.

Figure 7.
Characteristic curve of test generator: (a) Test Generator Power Curve; (b) Test Generator Efficiency Curve.
Figure 7.
Characteristic curve of test generator: (a) Test Generator Power Curve; (b) Test Generator Efficiency Curve.
Figure 8.
Power test scheme of the wind turbine.
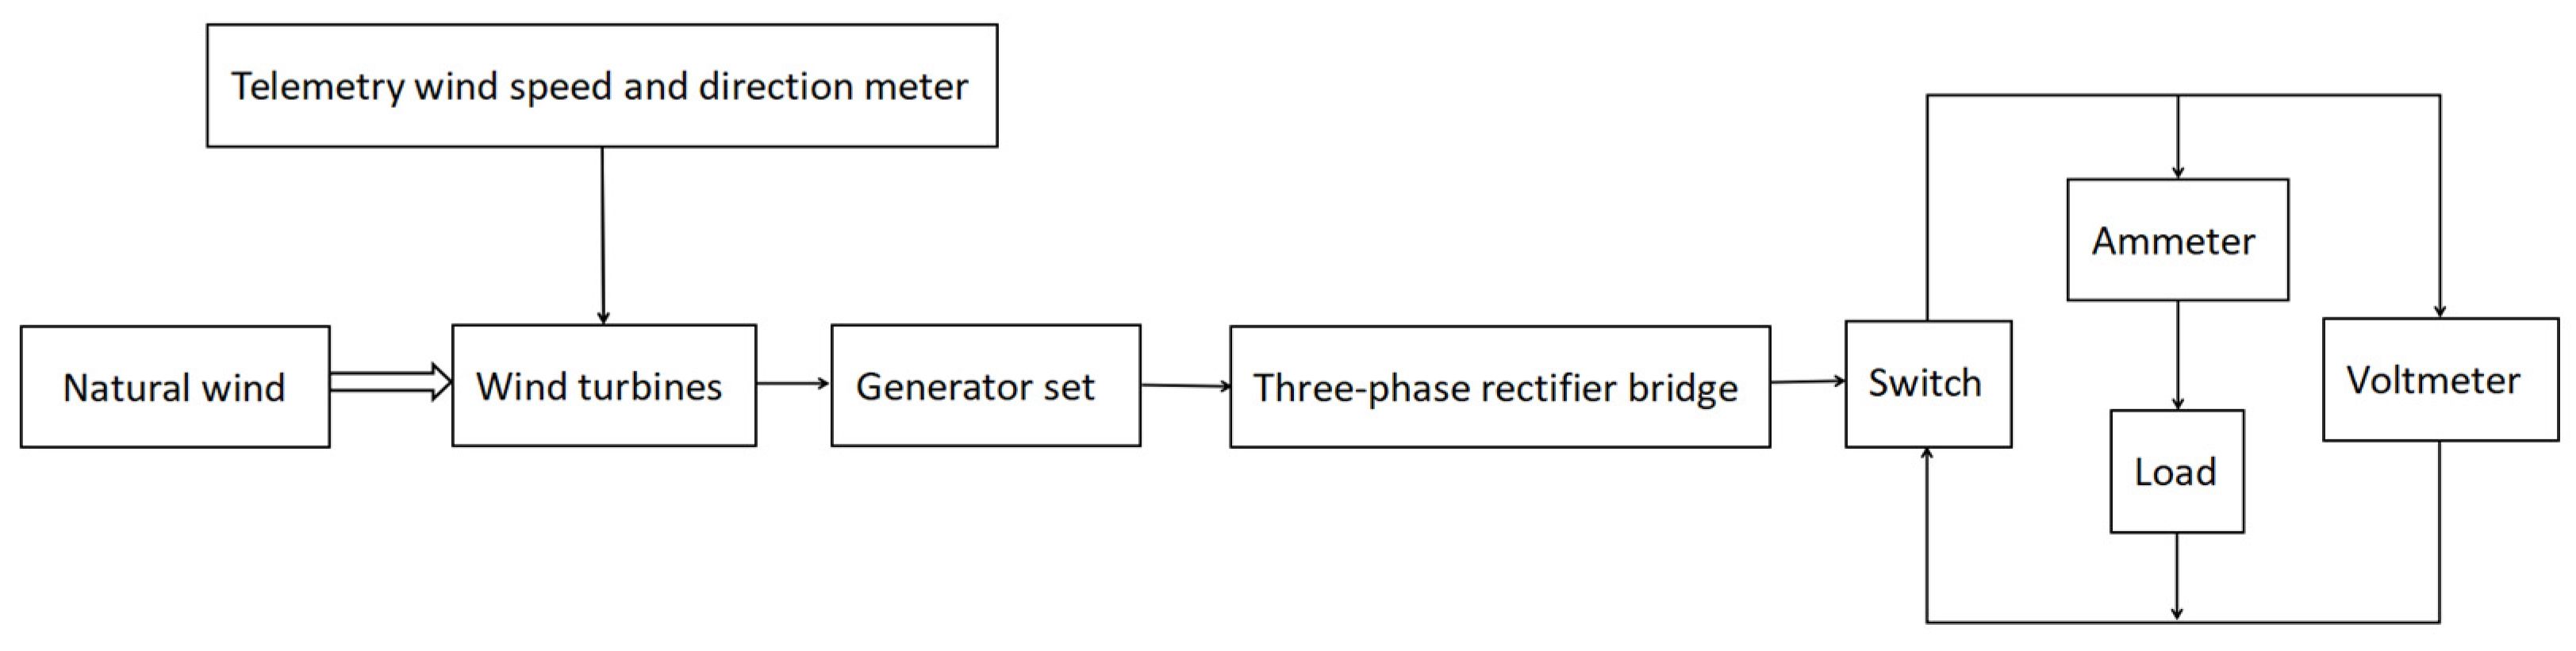
Figure 9.
Vehicle test of blades.
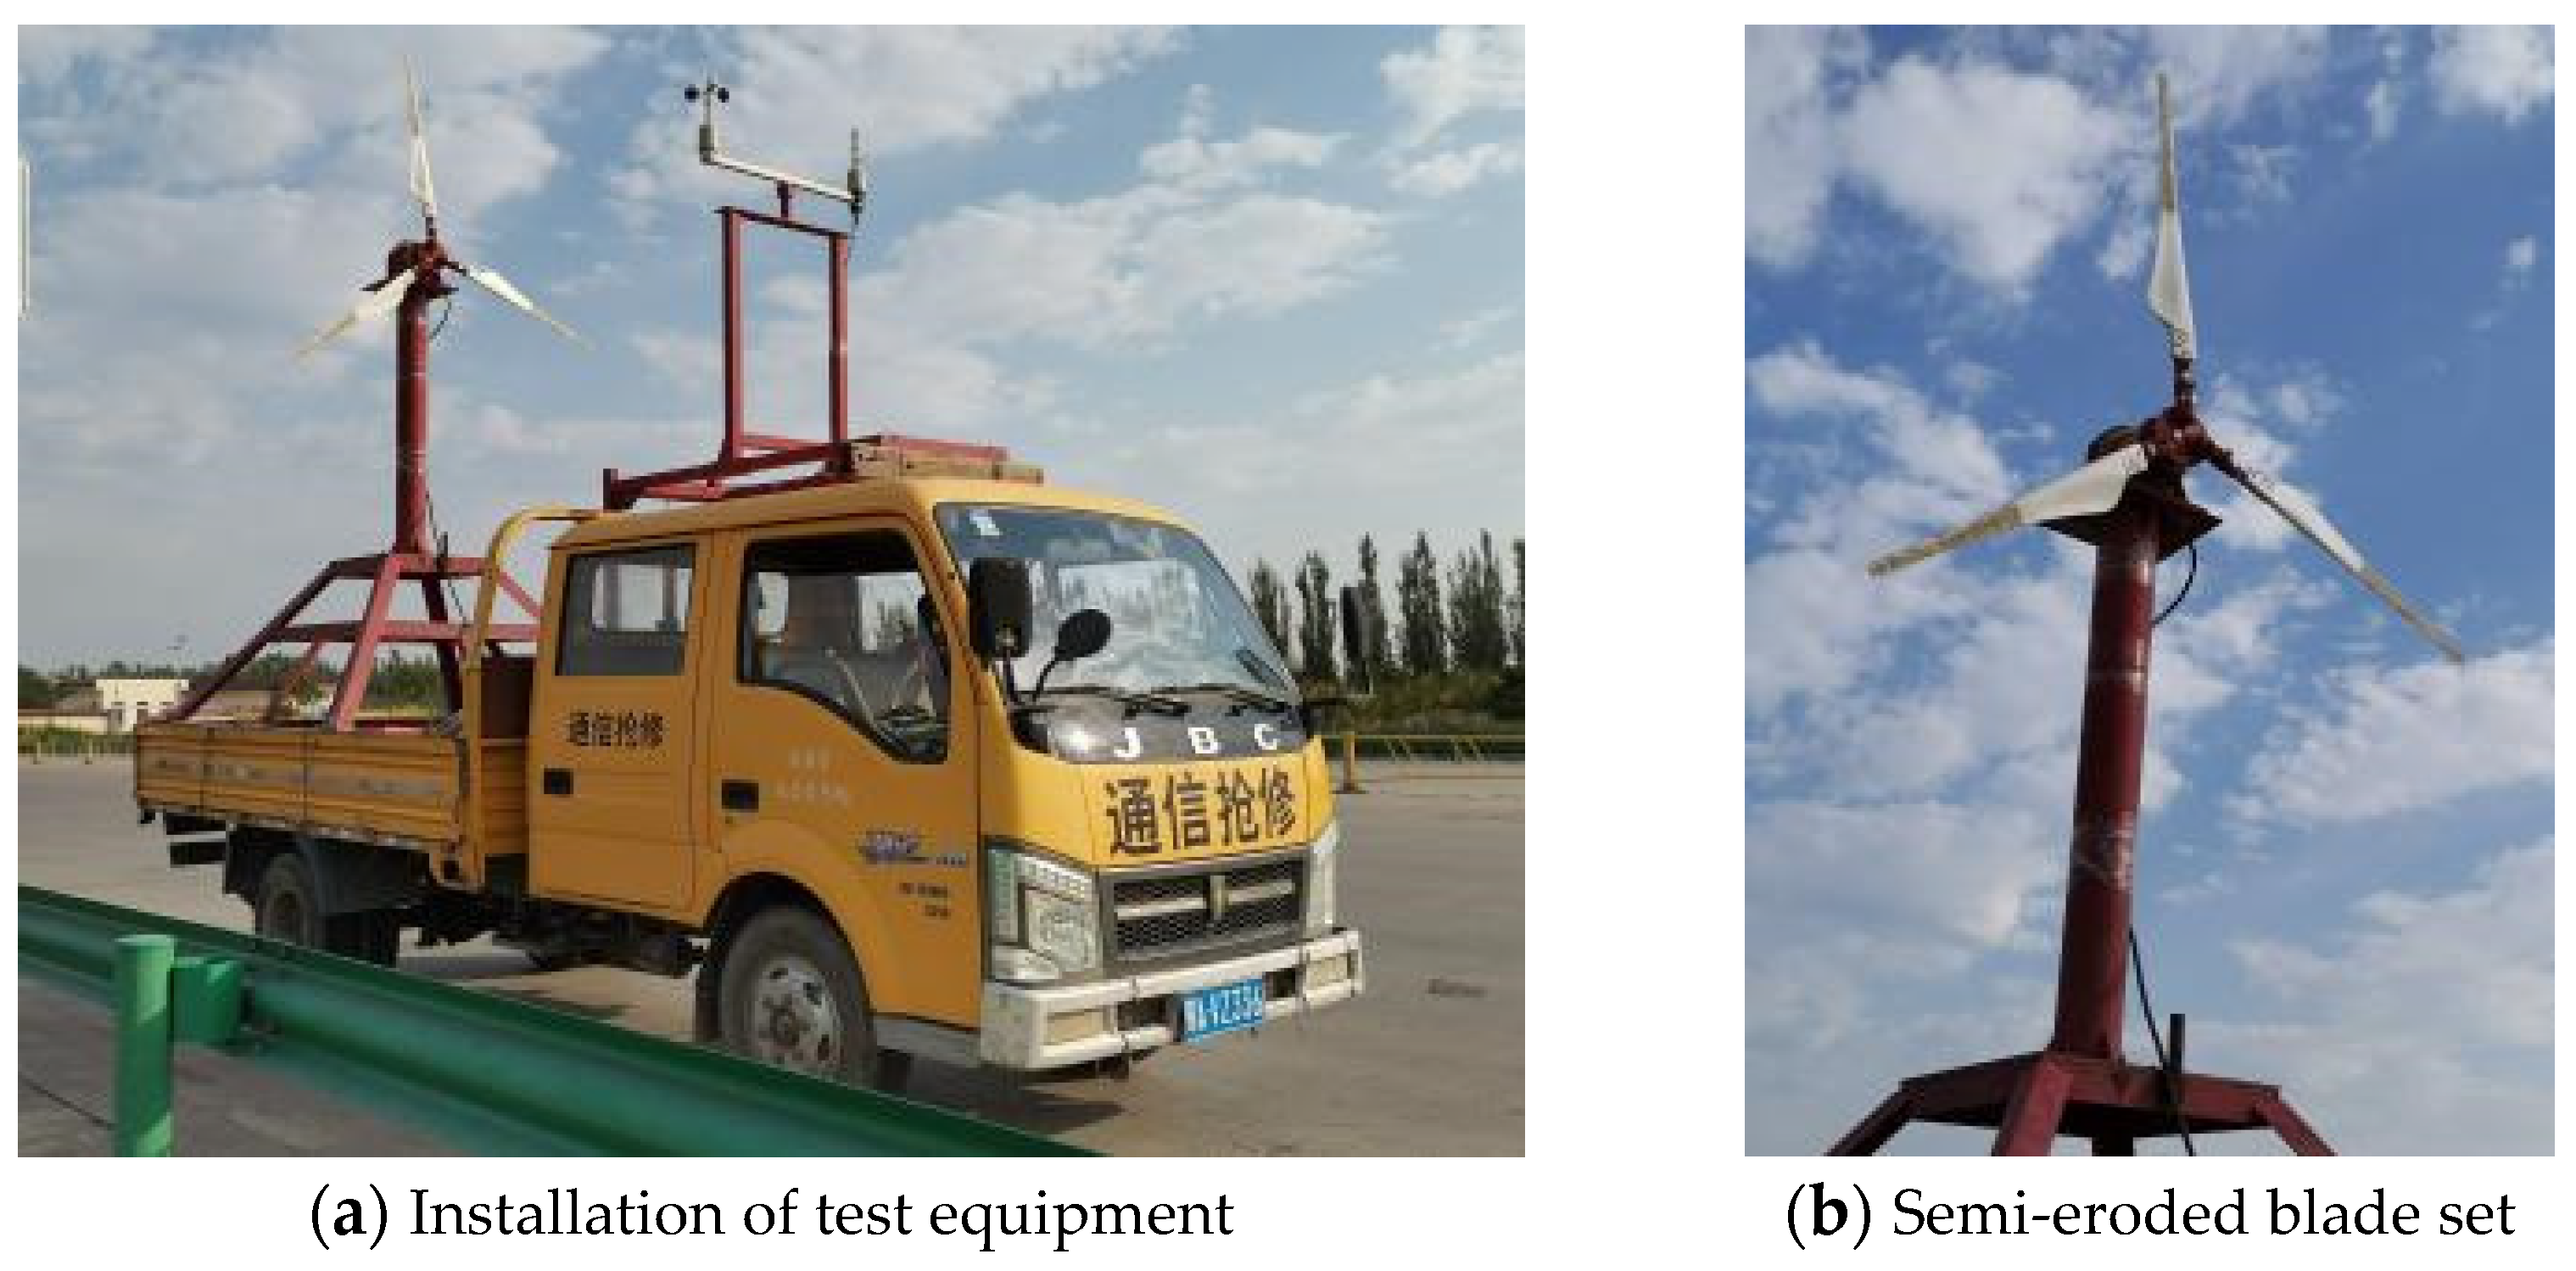
Figure 10.
Output characteristic curves of blade abrasion characteristics at installation angles of 22.7.
Figure 10.
Output characteristic curves of blade abrasion characteristics at installation angles of 22.7.

Figure 11.
Output characteristic curves of blade abrasion characteristics at installation angles of 31.7.
Figure 11.
Output characteristic curves of blade abrasion characteristics at installation angles of 31.7.
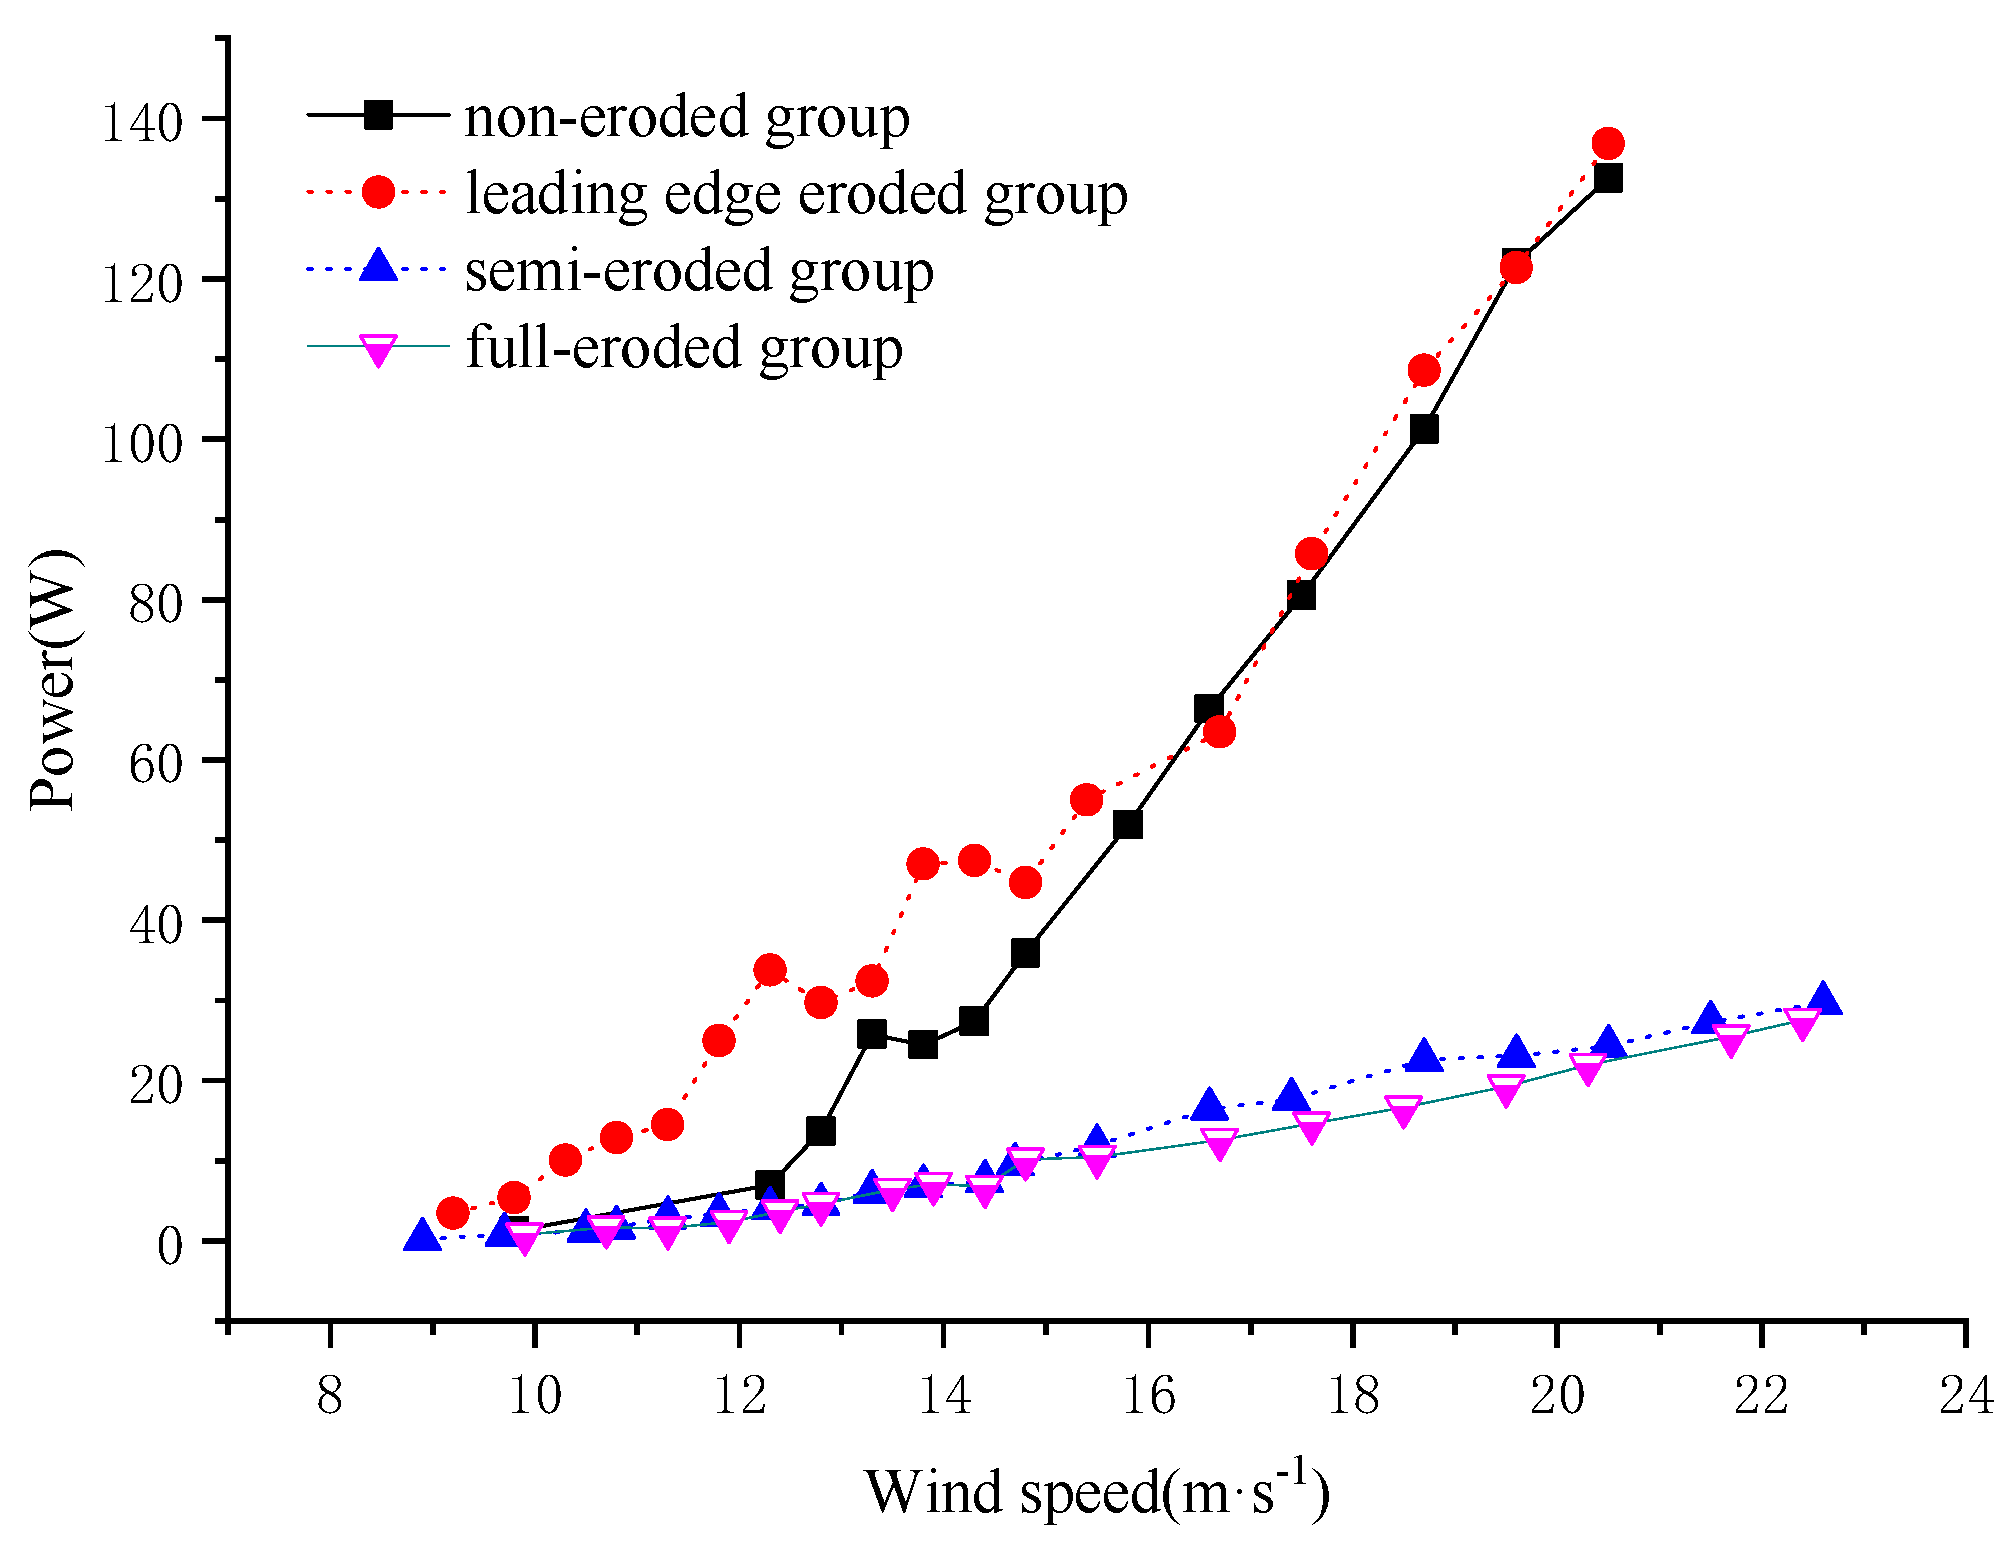
Figure 12.
Output characteristic curves of blade abrasion characteristics at installation angles of 40.7.
Figure 12.
Output characteristic curves of blade abrasion characteristics at installation angles of 40.7.
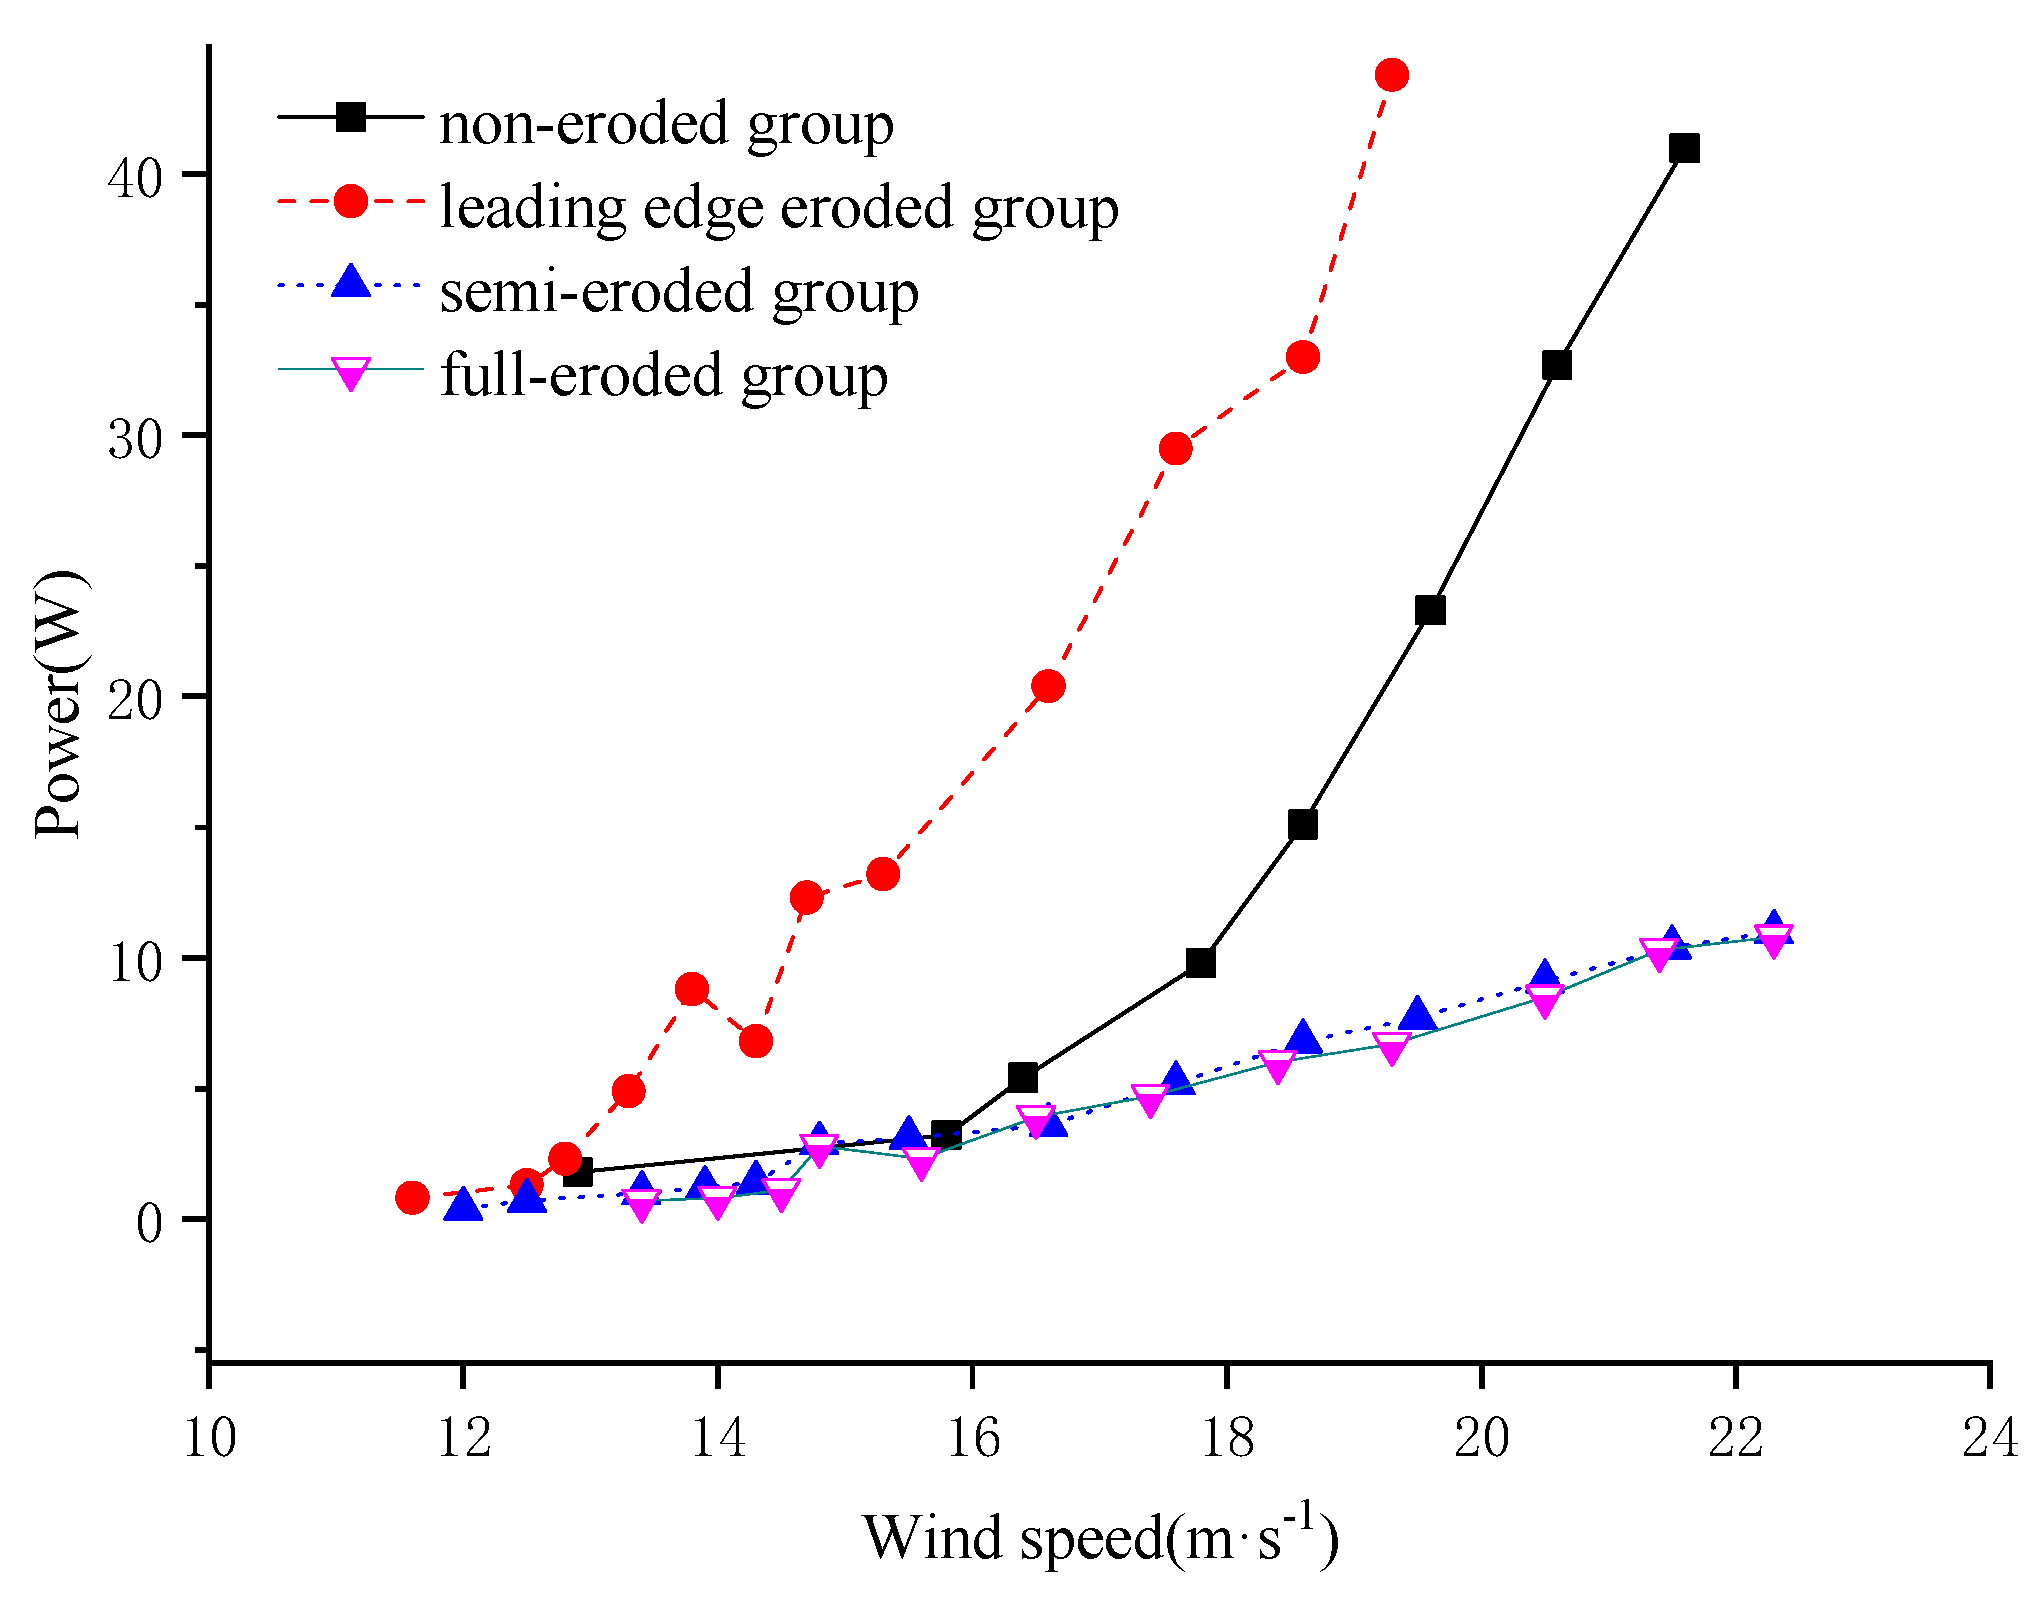
Figure 13.
Output characteristic curves of blade abrasion characteristics at installation angles of 49.7.
Figure 13.
Output characteristic curves of blade abrasion characteristics at installation angles of 49.7.
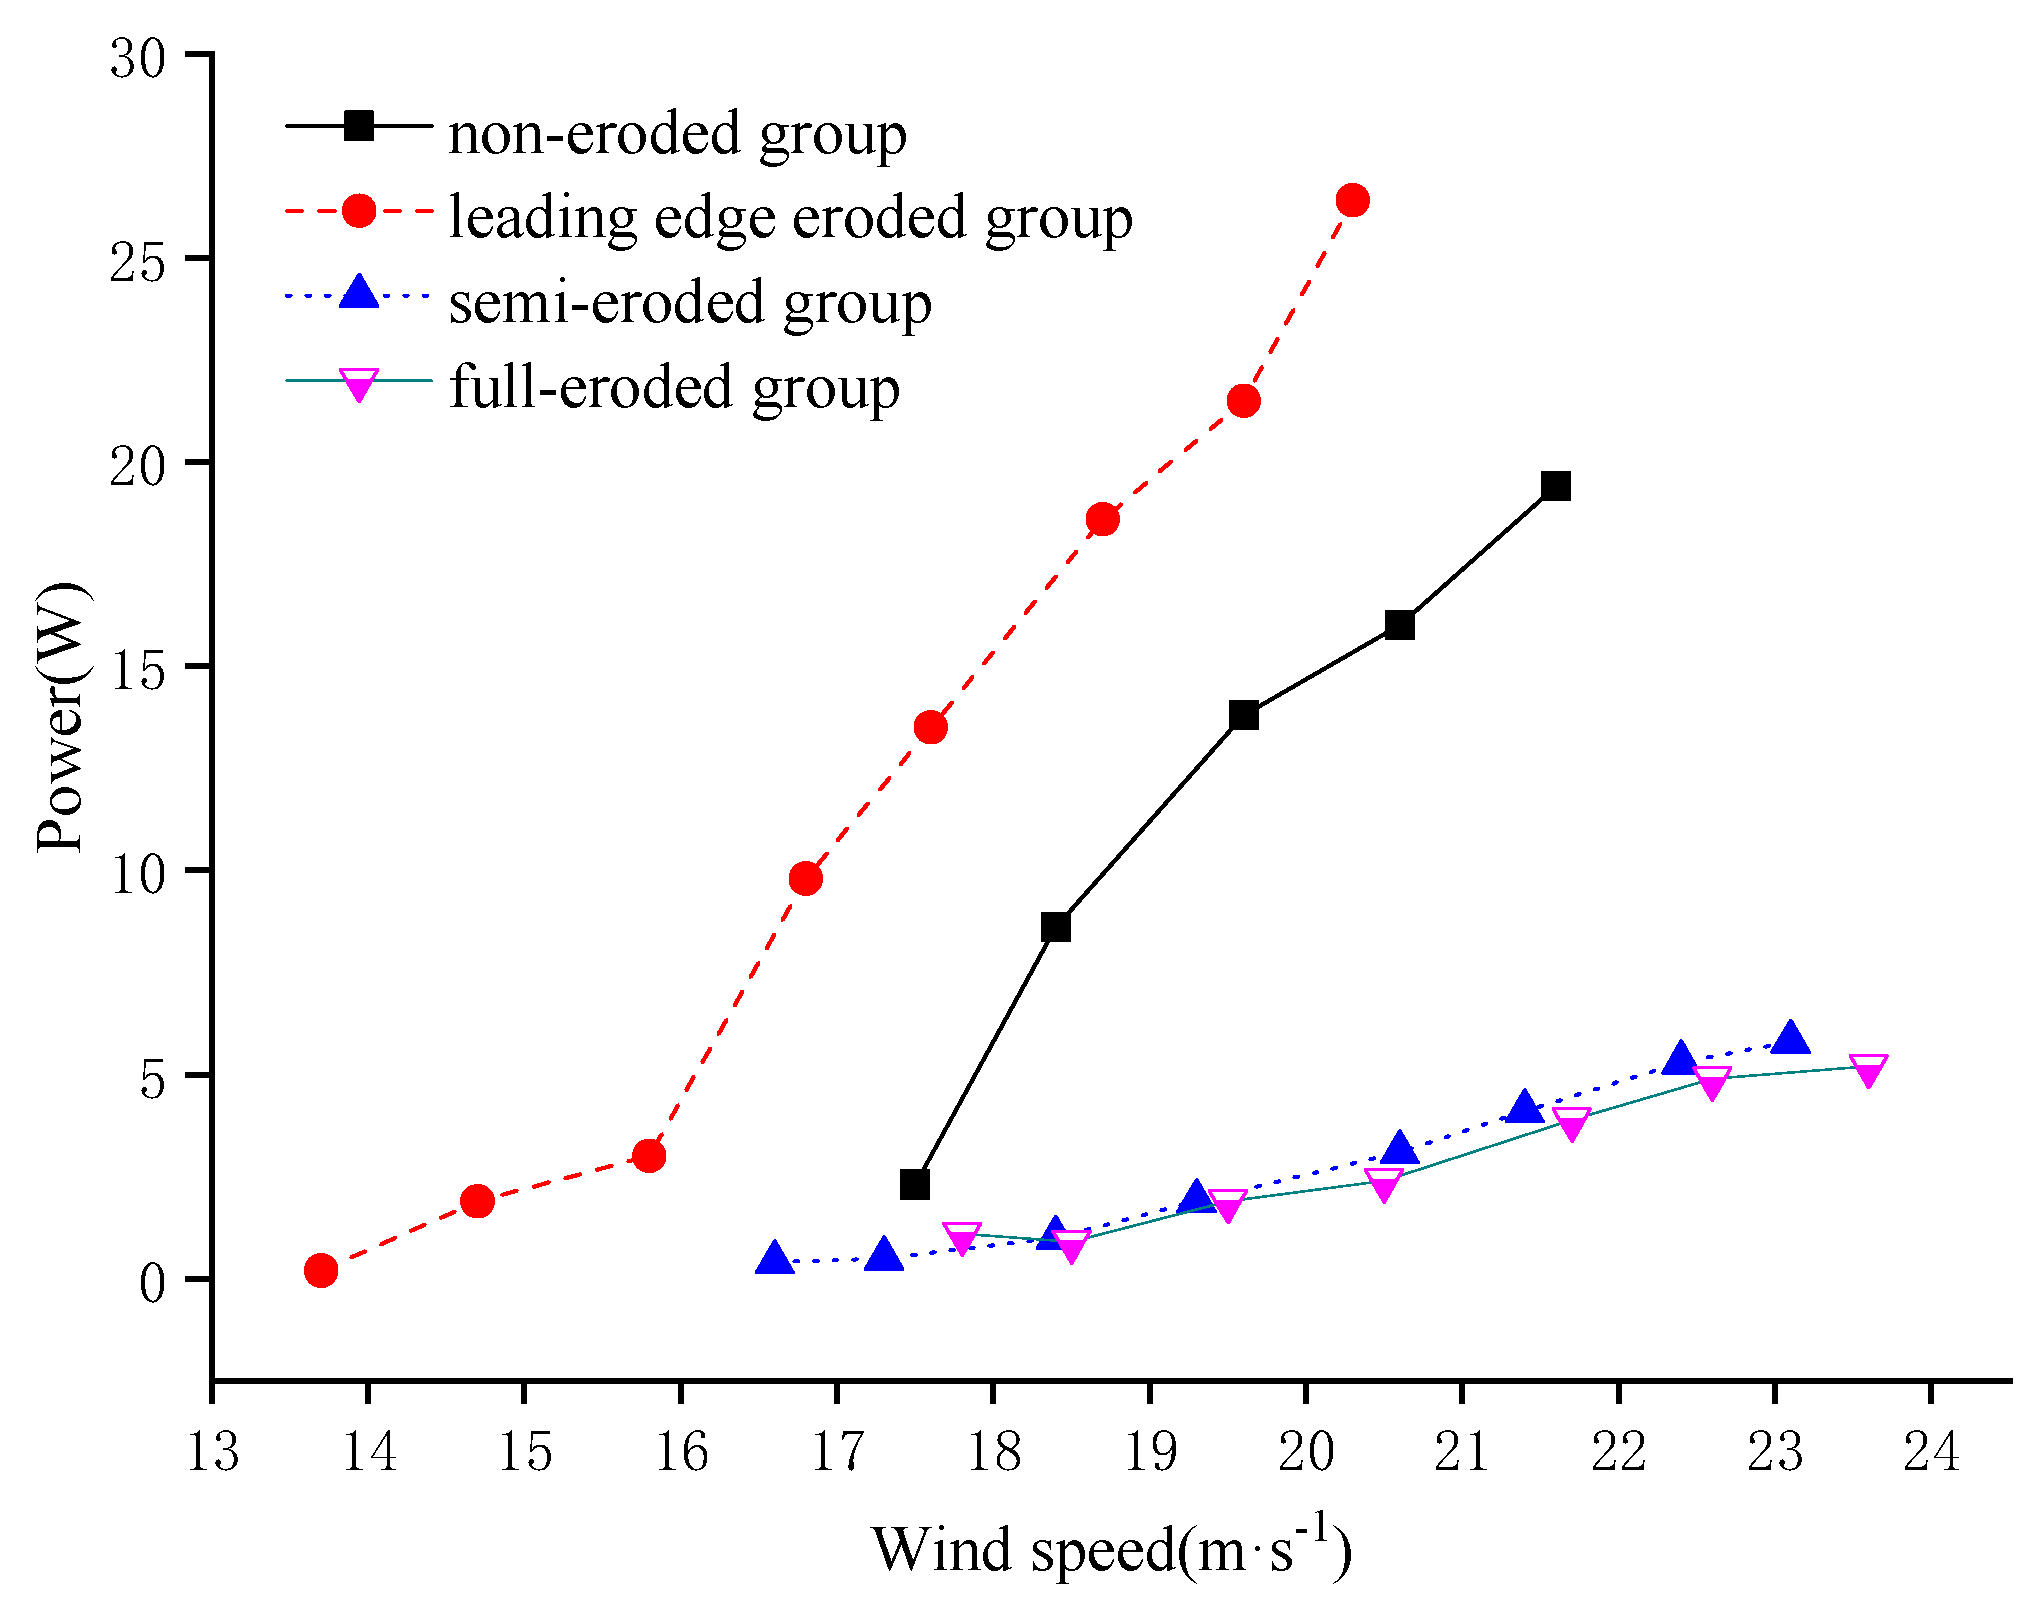
Figure 14.
Average wind energy coefficient of performance between wind wheels: (a) 22.7° installation angle; (b) 31.7° installation angle; (c) 40.7° installation angle; (d) 49.7° installation angle.
Figure 14.
Average wind energy coefficient of performance between wind wheels: (a) 22.7° installation angle; (b) 31.7° installation angle; (c) 40.7° installation angle; (d) 49.7° installation angle.

Figure 15.
Non-smooth surface structure of the pit and flow field of pit structure: (a) pit surface; (b) Description smooth surface.
Figure 15.
Non-smooth surface structure of the pit and flow field of pit structure: (a) pit surface; (b) Description smooth surface.

Table 1.
Mass percentage of sand pile particle size.
| Particle Size Range (mm) | Proportion (%) | Classification |
|---|---|---|
| <0.075 | 3.5 | Extra fine sand |
| 0.075–0.154 | 45 | |
| 0.155–0.250 | 51 | Fine Sand |
| 0.251–0.300 | 0.25 | Coarse sand |
| 0.301–0.360 | 0.15 | |
| 0.361–0.500 | 0.05 | |
| 0.501–0.600 | 0.03 | |
| 0.601–0.900 | 0.02 | |
| >0.900 | 0 |
Disclaimer/Publisher’s Note: The statements, opinions and data contained in all publications are solely those of the individual author(s) and contributor(s) and not of MDPI and/or the editor(s). MDPI and/or the editor(s) disclaim responsibility for any injury to people or property resulting from any ideas, methods, instructions or products referred to in the content. |
© 2024 by the authors. Licensee MDPI, Basel, Switzerland. This article is an open access article distributed under the terms and conditions of the Creative Commons Attribution (CC BY) license (https://creativecommons.org/licenses/by/4.0/).
Share and Cite
MDPI and ACS Style
Wan, D.; Chen, S.; Li, D.; Zhen, Q.; Zhang, B. Sand-Laden Wind Erosion Pair Experimental Analysis of Aerodynamic Performance of the Wind Turbine Blades. Energies 2024, 17, 2279. https://doi.org/10.3390/en17102279
AMA Style
Wan D, Chen S, Li D, Zhen Q, Zhang B. Sand-Laden Wind Erosion Pair Experimental Analysis of Aerodynamic Performance of the Wind Turbine Blades. Energies. 2024; 17(10):2279. https://doi.org/10.3390/en17102279
Chicago/Turabian StyleWan, Daqian, Songli Chen, Danlan Li, Qi Zhen, and Bo Zhang. 2024. "Sand-Laden Wind Erosion Pair Experimental Analysis of Aerodynamic Performance of the Wind Turbine Blades" Energies 17, no. 10: 2279. https://doi.org/10.3390/en17102279
Note that from the first issue of 2016, this journal uses article numbers instead of page numbers. See further details here.