Article

Implementation of a Microgrid System with a Four-Phase Inductor Coupled Interleaved Boost Converter for EV Charging Stations

by
Kommoju Naga Durga Veera Sai Eswar
1,
Mohan Arun Noyal Doss
1,*,
Mohammed Alruwaili
2 and
Waleed Mohammed Abdelfattah
3,*
1
Department of Electrical and Electronics Engineering, SRM Institute of Science and Technology, SRM Nagar, Kattankulathur 603203, India
2
Department of Electrical Engineering, College of Engineering, Northern Border University, Arar 91431, Saudi Arabia
3
General Subject Department, University of Business and Technology, Jeddah 23435, Saudi Arabia
*
Authors to whom correspondence should be addressed.
Energies 2024, 17(10), 2277; https://doi.org/10.3390/en17102277
Submission received: 21 March 2024 / Revised: 26 April 2024 / Accepted: 3 May 2024 / Published: 9 May 2024
(This article belongs to the Special Issue Electric Vehicle Charging: Social and Technical Issues Ⅱ)

Abstract

:
Electric vehicle charging stations are essential to enable broad reception due to the rise in electric vehicles in the transportation industry because they will lessen range anxiety concerns about distance. The primary objective of this work is to design a microgrid that is effective and affordable for an electric vehicle charging station that combines a photovoltaic, wind, and utility grid energy system (optional) as a principal source of energy. The proposed study employs a four-phase inductor coupled interleaved boost converter which is compact and effective with high power output which results in charging a vehicle within 33 min. A perturb and observe MPPT approach based on DC converters is used along with the digital 2PI controller to increase the effectiveness and performance of distributed energy systems. To make the converter a hassle-free operation, an interleaving technique is applied to the developed converter which results in ripple reduction, which results in an increase in the output current and voltage gain, with high power density and efficiency. For better understanding, real-time data for 2W/3W/4W are acquired and tested for various conditions and the maximum state of charge for the battery is gained within one-third of the usual time. At present, the interleaved converter’s operation is theoretically examined, and the behavior of the converter and the charging conditions of several electric vehicle systems are compared and shown in the simulation analysis.

1. Introduction

The widespread acceptance of EVs, which are ideal replacements for internal combustion engines, is a consequence of global climatic change. The rise of EVs has the ability to enhance economic viability, energy policy, and air quality, which reduce greenhouse gas releases and mitigate the negative effects of transportation, especially global warming. EV production emits (59%) more CO2 than internal combustion engines [1]. The ICEV releases 120 g/km of CO2 on a tank-to-wheel basis; however, from the life cycle assessment viewpoint, this rises to 170–180 g/km. Within a decade, India’s total GHG emissions were 6.55% of all global emissions, which is the equivalent of 3202 million metric tons of CO2 [2]. The vehicle is powered by an electric motor, which is incredibly effective, utilizing 90–95 percent of the energy given. The main reasons inhibiting the sales of EVs are the limited number of plug-in stations, charging, driving range, and the power capacity of batteries. To avoid emissions and to make the CS environment friendly, it should be designed with RES [3].
With current advancements in power electronic systems and the reduced cost of component parts, solar and wind energy have grown very popular as options to provide load demand in off-grid and remote areas. As per the research in [4], S-WHS is more advantageous than other sources of power generation. The unpredictable and fluctuating nature of these sources presents certain technical, environmental, and socioeconomic issues, and adds to the complexities. Using optimization methods and mathematical models of various components, a hybrid energy system can be created [5]. When using S-WHS, it is concluded that this may lessen the energy’s volatility, complexity, and create different PQ issues like power loss and voltage distortions. Also, a recent study states that with the help of renewable sources, it involves the microgrid and smart grid concept to charge the EVs, which is a major challenge [6]. In areas like a simplified control circuit with few switch operations, which improve stability, reliability, and efficiency, DC bus architecture is preferred to AC bus architecture [7].
As semiconductor technology has evolved, converters have become increasingly important in powertrain systems where bipolar converters reduce the step-down effort in the case of DC–DC converters and allow power exchange among CS and the grid. This will be ideal for the installation of SPV-EVCS in replacement of unipolar conventional converters [8]. Likewise, CBC plays a major role when used in medium/low power applications, but due to disadvantages like size, volume, and the cost of the inductor and capacitor, these are not much preferred. However, this circumstance will cause a significant input current ripple and shorten the lifetime. A larger duty cycle also results in a decreased CBC efficiency [9], which states that due to the size and cost of the capacitors, which are in series connection, there is a decrease in reliability. Modification with the help of the fourth leg is provided for zero sequence current which makes the system simple [10]. In a grid-tied NPC converter for DC, fast CS plug-in electric vehicles are presented in [11], which states that the filter size mainly depends on the type of converter and application used. A bulk capacitor leads to low ripple but results in high cost.
Inherent cons like high input current ripple, low efficiency, lifetime, the volume of inductor and capacitor, traditional boost/buck-boost/resonant full bridge, and push–pull converters are not suitable for EV charging applications. The authors of [12] stated that IBC is one of the latest research topics, as it can increase the power-processing capacity and boost the reliability of power electronic systems. Interleaved techniques can reduce the input current’s tolerances by making the inductor operate in discrete modes. The authors of [13] discuss how an inductor windings are coupled together, which makes an interleaved circuit that is mostly preferred for low power applications. Splitting the input current, multi-device IBC, and four-phase IBC achieving higher efficiency by significantly lowering I2R losses and inductor AC losses were discussed in [14]. Additionally, using coupled inductor strategies, voltage multiplier units, and/or adding snubber circuits can enhance voltage gain and reduce voltage stress across components. In [15], magnetic coupling techniques are used in IBC, designed with coupled inductors to reduce input current ripple and volume. A two-phase IBC steady-state operation for FC stacks has excellent power capacity, but its dynamic response is only moderate. High efficiency and lower power loss can be achieved with non-coupled inductors and loosely coupled inductors which fail to limit the EMI stated in [16]. Even if we are aiming for a high-duty cycle, it leads to high conduction losses and voltage stress. Multi-port IBC apt for EV high power applications has many advantages like the size, weight of the inductor/capacitor, ripples, and EMI from the input/output side. Simultaneous reduction in ripples and EMI efficiency, reliability, and dynamic response of the system is improved [17]. AMM and Fe-based magnetic materials properties have high mechanical strength and low flux density, which has been stated by the authors of [18], and materials made with NFR have high permeability with low core losses and are consistent for the self-inductance properties [19].
Sudden load deposition on the CS may result in instability and fluctuations, which lead to mis-operation of the loads. A controller is typically necessary to avoid these circumstances. Whenever a linear such as a lead-leg controller is used to regulate voltage, it results in many disadvantages like high response overshoot, huge setting time, and considerable steady-state inaccuracy. The authors of [5] use a DTC along with PI controllers and face low response. In [7], the author employed a sliding mode control for operating FP-IBC results with some instability. Since PV systems are completely reliant on their environment and must function well across the whole PV operating range, the use of linear controllers may not be appropriate because these are designed for their point of operation [8,11]. Addressing these shortcomings, intelligent control strategies have recently been suggested, such as the fuzzy logic controller, which is an intelligent-type controller employed in a variety of applications and is distinguished by its speedy response, precision, and reliability [12]. A controller operates with continual switching, which is one of its characteristics, such that the issue of running at high switching frequencies is resolved. The PI controller has historically been one of the most researched controllers, being adjusted using many methods. Energy management systems also play a vital role when employing sources like solar, wind, and grid. The main constraints that need to be considered while designing the structure of the EV system are data acquisition, forecasting, demand response, storage management, monitoring, and analysis, which help to enhance the system [13].
However, reliable operation of the converter’s efficiency, EMI, output and input ripples, and the duty cycle of the four-phase inductor coupled interleaved boost converter is not discussed for practical EV applications in the previous studies. Here, in this paper, the converter operates only in continuous conduction mode with different power management conditions. The above-mentioned aspects are discussed in a detailed manner for different load conditions along with a digital 2PI controller.

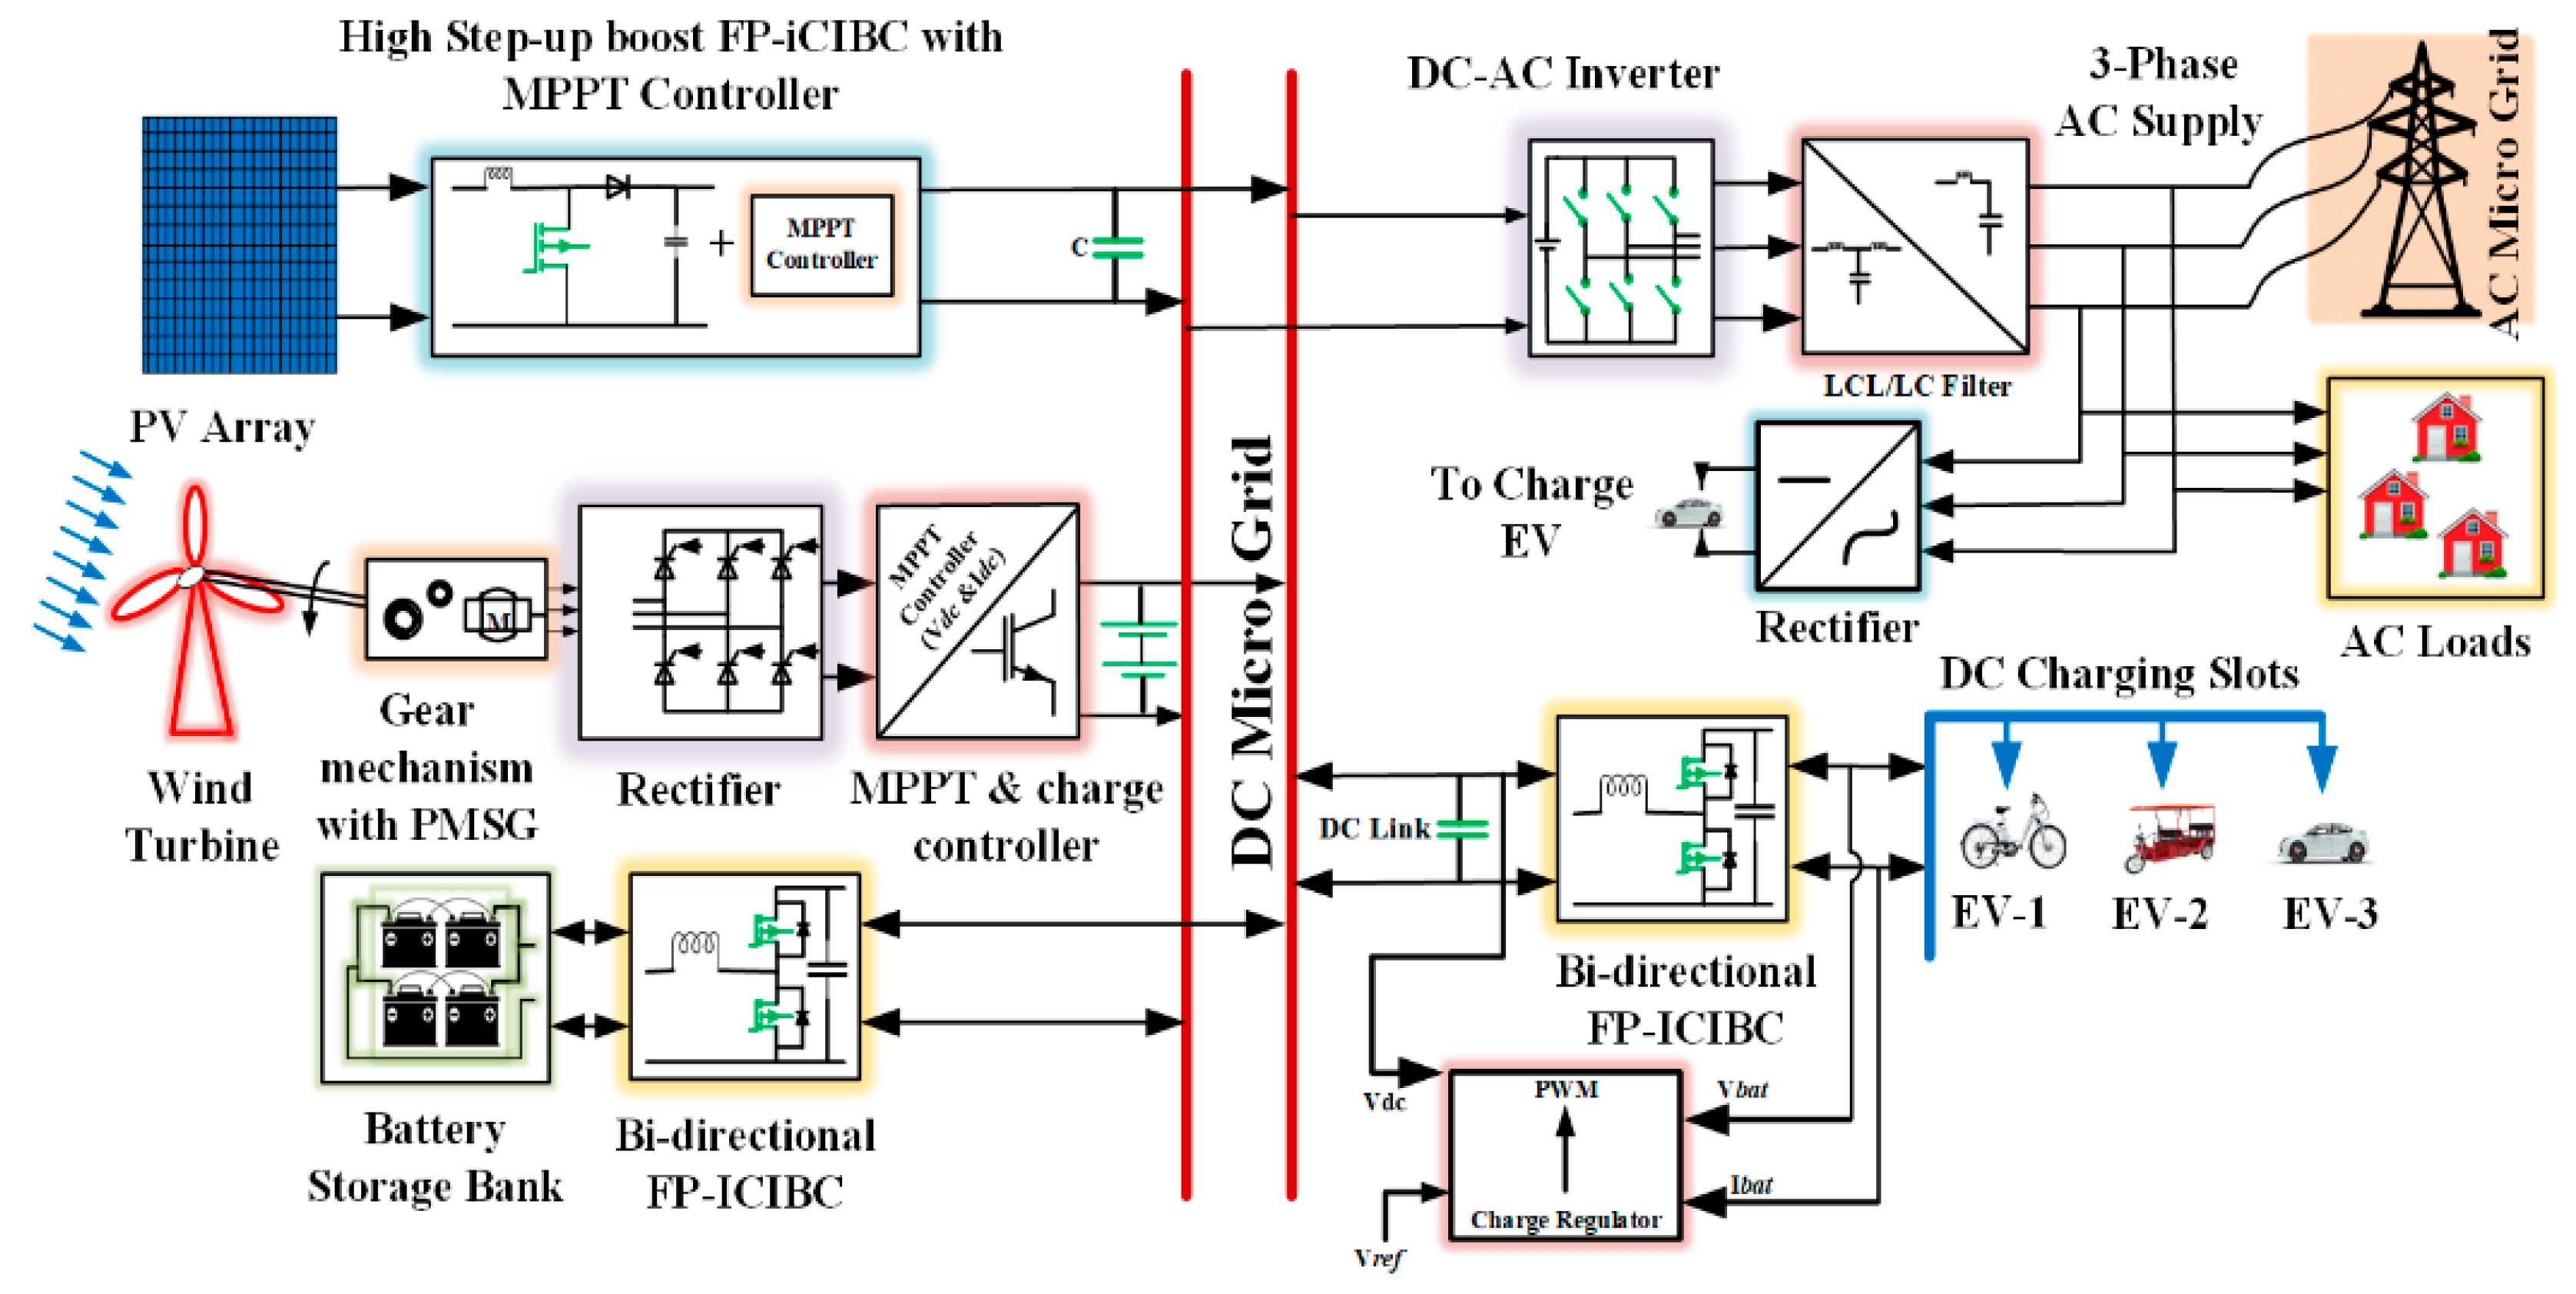
2. Proposed System Configuration
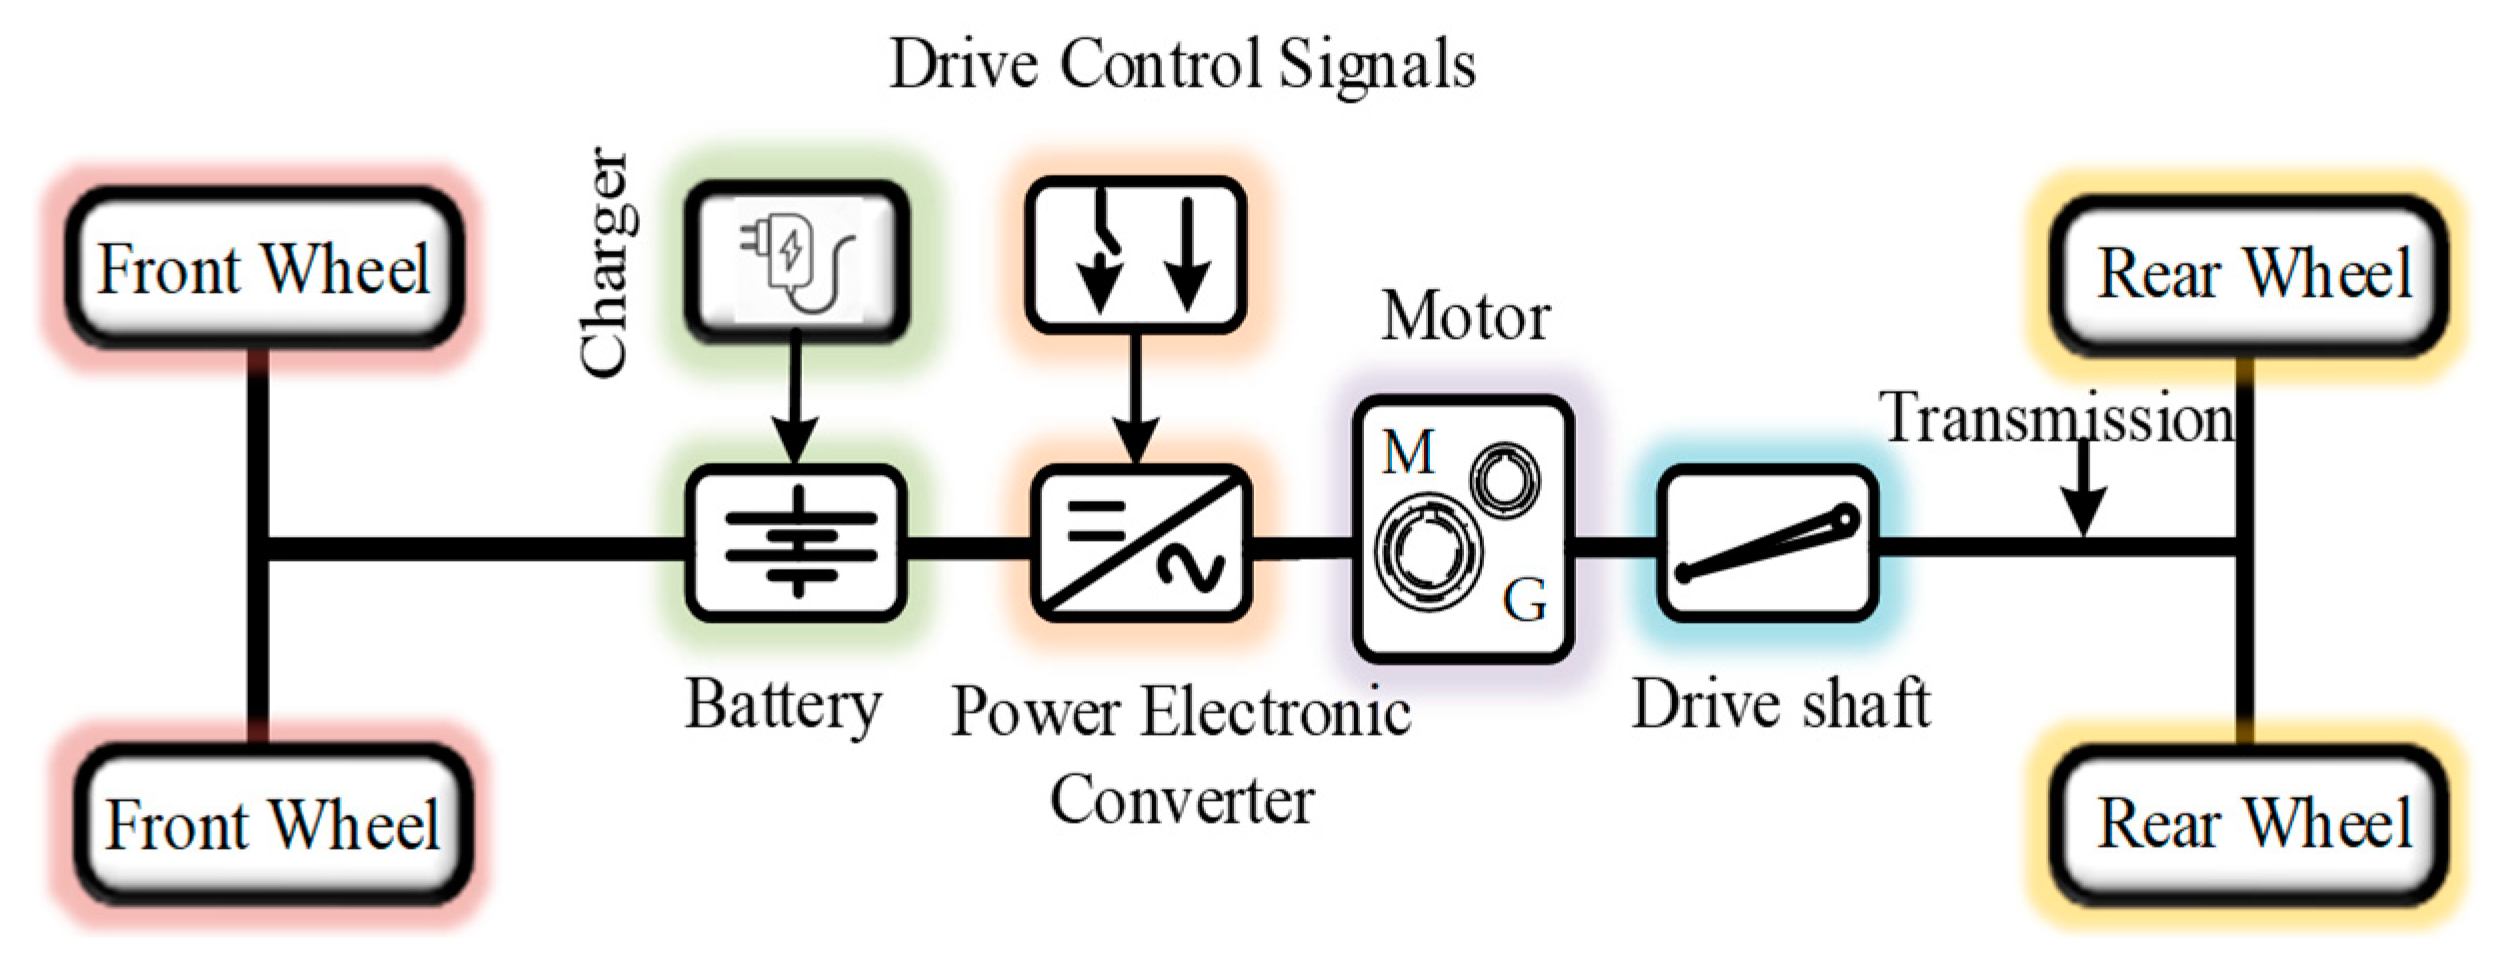
Figure 1 shows the conceptual line diagram of the proposed EV charging station with the hybrid system. In the current proposal, a DC bus is implemented by a single DC–AC grid-tied converter, and charging EVs are coupled by DC–DC converters. Direct connections to RES are made possible by the DC bus using a simple DC–DC converter. The bus voltage to EV battery voltage levels is intended to be maintained using an appropriate interleaved DC converter. During the design of a CS, several aspects need to be considered, such as (a) the area that can be used for electric vehicle parking, which determines the number of vehicles that can be charged; (b) the demand for fast charging slots in a given area; and (c) requirements for the network, such as the nominal voltage level and suitable power levels at the point of common coupling.

2.1. EV Structure

Figure 2 depicts the EV block diagram. Electric motors, mechanical gear systems, drive shafts, transmission, storage devices like battery packs, a charger, and a central power electronic converter are the fundamental components used in the design of EVs. It also includes two converters: one is a DC bidirectional converter used to regulate the battery system’s state of charge, and the other is a PWM-based converter that helps to control motor conditions.

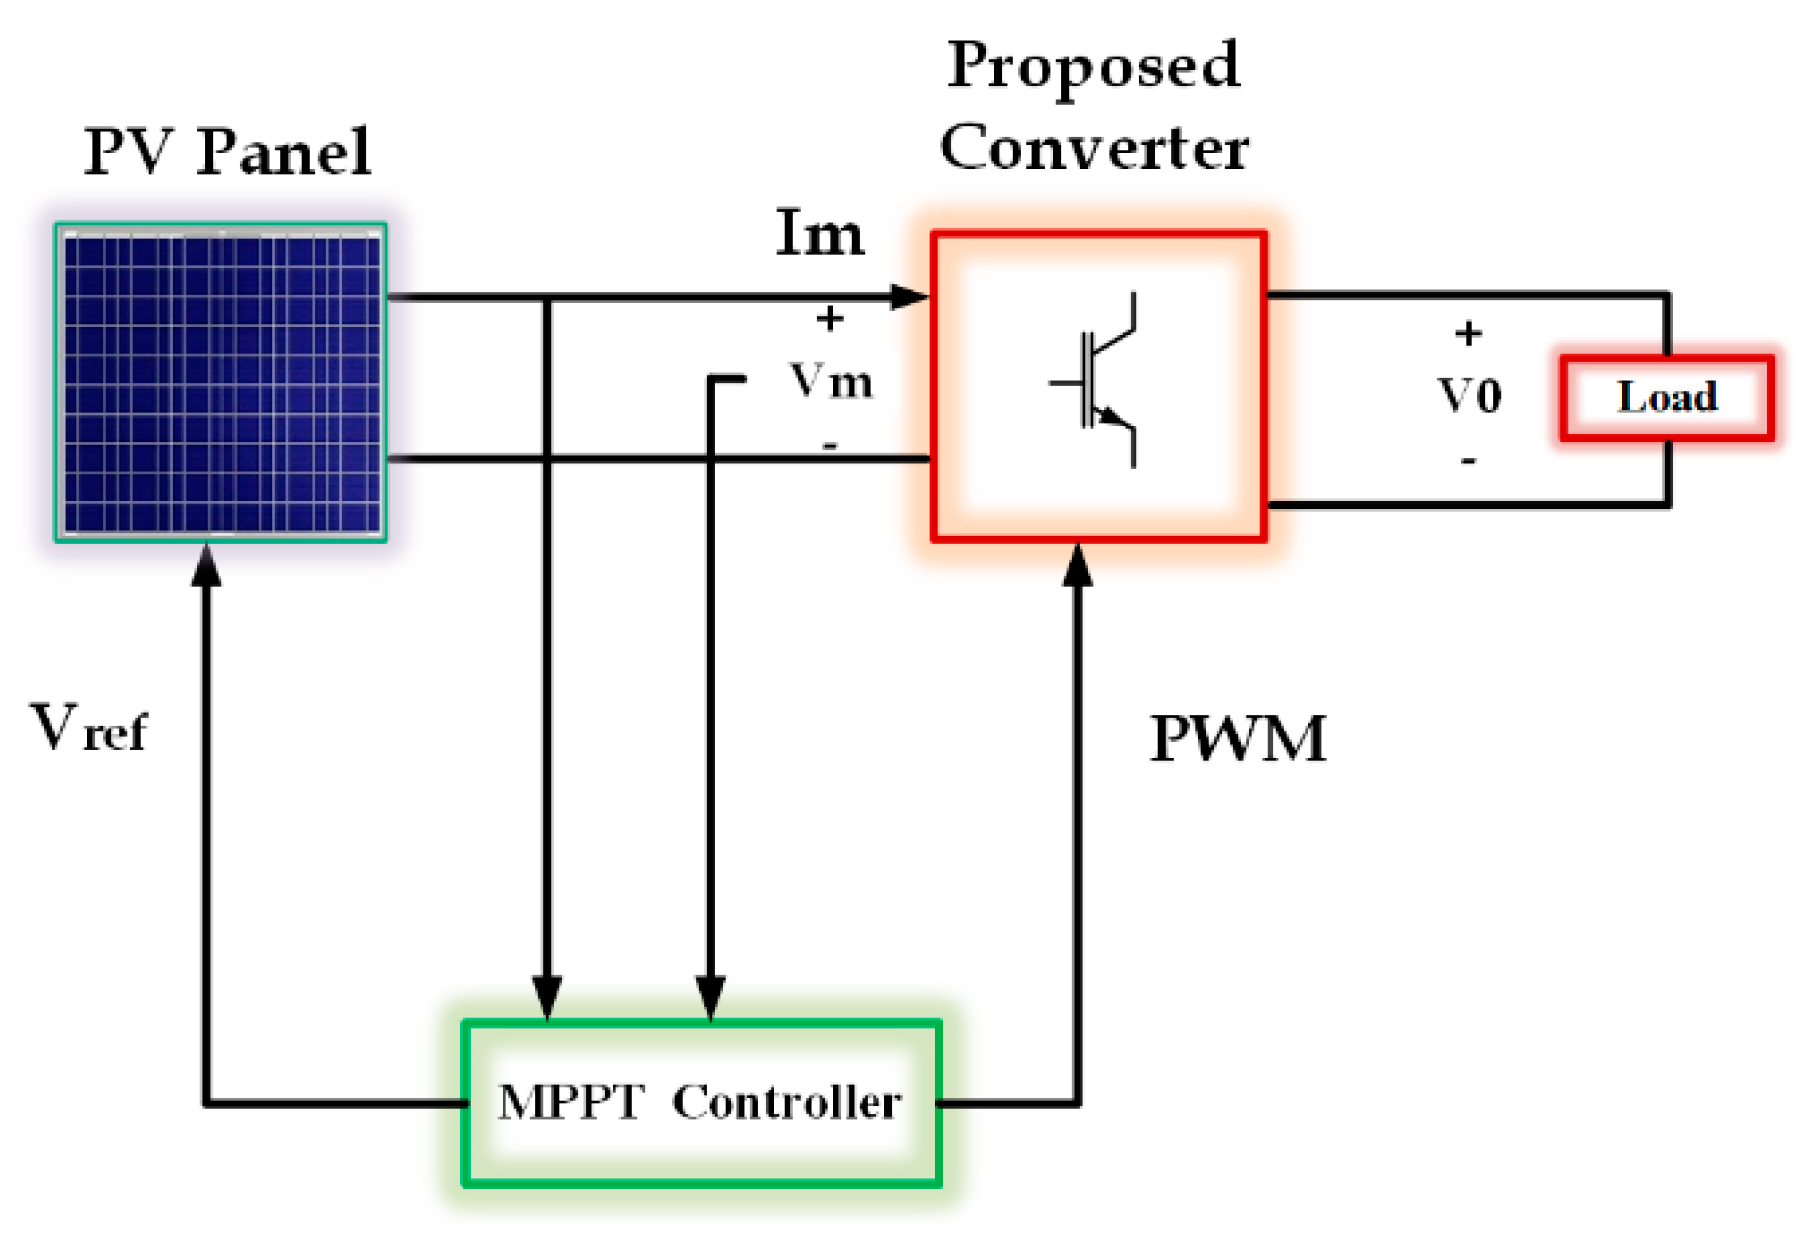
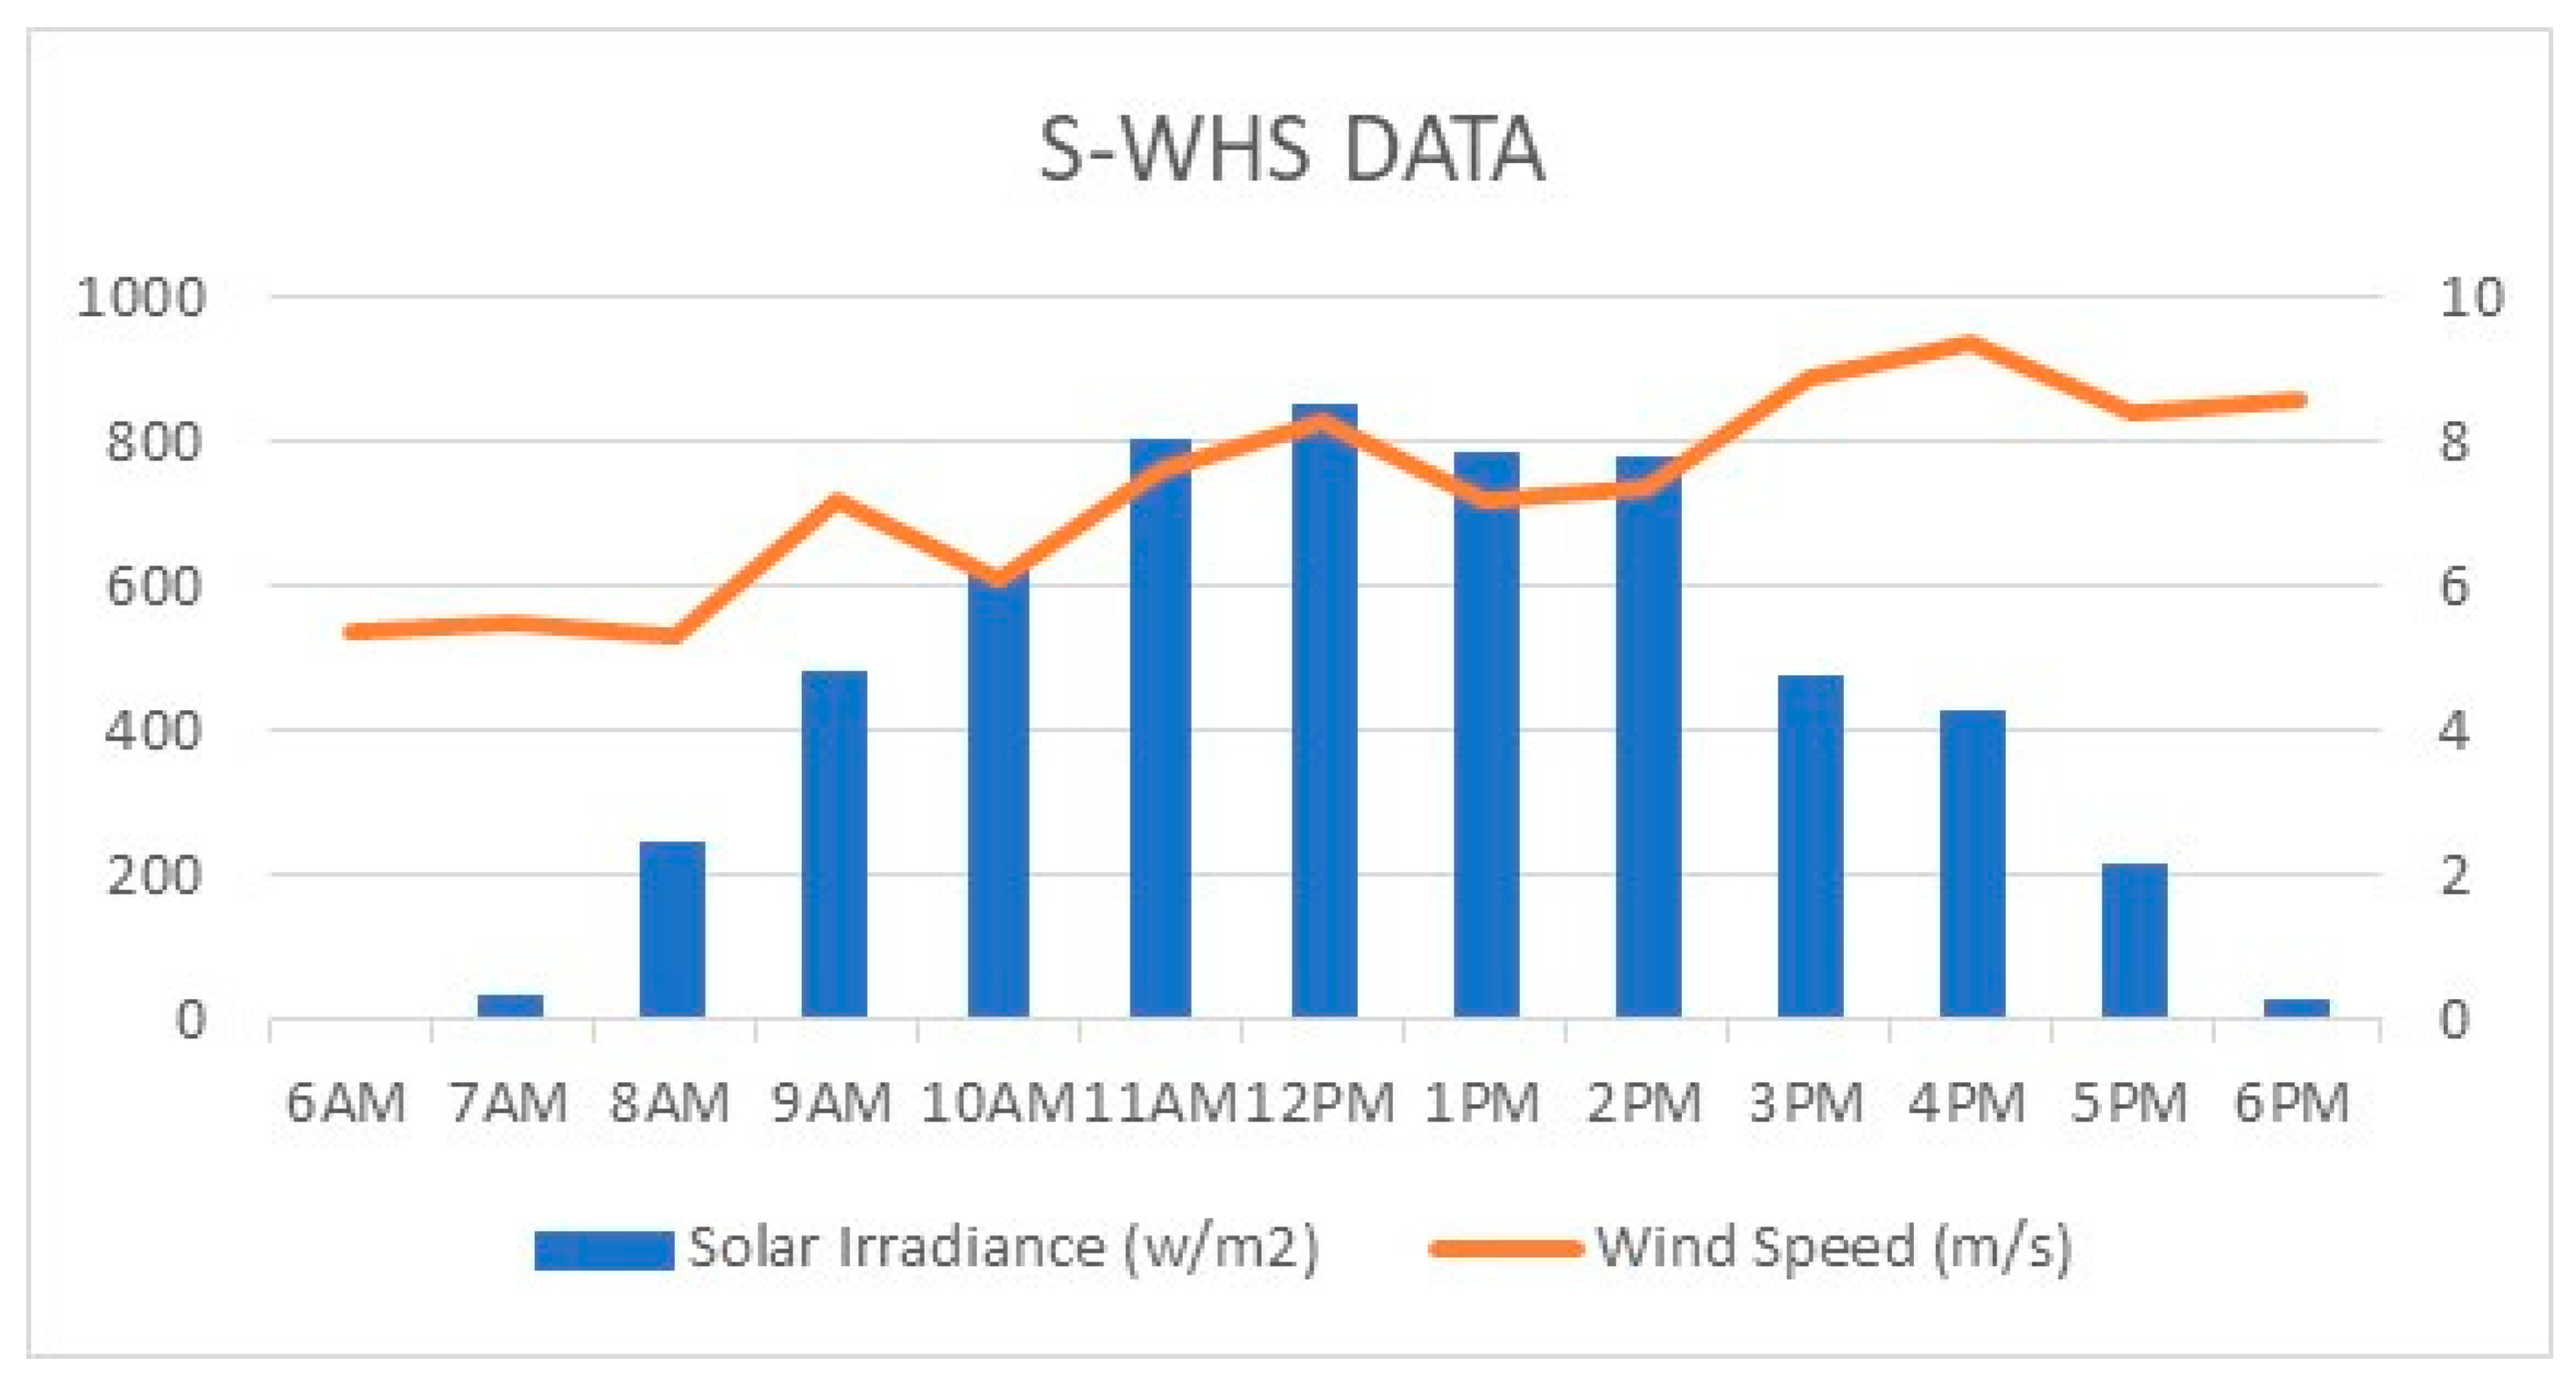
2.2. PV Solar System

Considering its nature of mobility, reliability, and affordability, the solar PV system plays a significant role in energy distribution all through the entire existence of ecofriendly power. Cells are arranged in a series and parallel combination and the produced photon effect of the sun’s irradiance, which is later transformed into PV voltage. This further varies according to the temperature, which also might destroy electrical equipment [14]. The applied DC boost converter combined with the MPPT base perturb and observed method is used to monitor changes in the array voltage and uses these data to predict how the output power might vary, which also evaluates the PV panel voltage and current even while computing the PV power to achieve stability in the DC voltage with maximum power output, as shown in Figure 3.
With the help of [20], the related equations are given below:
I p v = I p h I 0 e q V p v + R s I p v A K T 1 V p v + R s I p v R s h
P p v k = A × G k 1000 [ 1 + Υ p v × T a m b 25 ] × η D A
I p h is a current developed by photons from solar, I 0 is a saturation current, d is a diode current, I s h is a shunt current, R s h and R s e are the shunt and series resistance, respectively, I p v is the net current by the solar PV system, V p v is the output voltage of a PV cell, q is the electron charge, and A and K are the fitting factor and Boltzmann constant (1.38 × 10⁻²³ J/K) parameters, respectively.

2.3. Wind Energy System

An important factor in this distributed energy system is a wind turbine where the energy process of conversion is performed in two stages: at Stage 1, the wind speed is transformed into mechanical power by turbine blades, which is reliant on the availability of wind, and is later turned into electricity with the aid of an electrical generator (either an induction or synchronous generator can be used) [20]. In this case, an induction generator is preferred. Similarly, a gearbox setup is used to transform a low-speed shaft to a high-speed shaft, which is featured in Stage 2. To rotate turbine blades in the direction of wind speed, a pitch angle controller was employed, which is also reliable in operation. A wind vane serves to measure the wind speed. Figure 4 shows the layout of a general wind turbine structure with a basic generator, and numerical modelling of the wind energy system for generation of kinetic energy and torque are given in Equations (3) and (4), as found in [20].
P w = 1 2 A C P λ , β × V ω 3
T m = P m ω m = 1 2 × C P   × ρ × A V ω 3 ω m
P w is the kinetic energy generated (watts), A is the blade-swept area ( m 2 ), C P is the rotor power co-efficient (no dimensions), λ is the tip-speed ratio, β is the turbine blade pitch angle, and V ω is the velocity of the wind speed (m/s). P m is the mechanical power (watts), T m is the mechanical torque (N-m), ρ is the air density (kg/ m 3 ), and ω m is the mechanical angular speed (rad/s). The tip-speed ratio of the wind turbine relies upon the rotor angular velocity ( ω ), rotor range ( R ), and speed of the wind ( V ω ) as addressed in Equation (5).
λ = ω ω R V ω  
The electrical and mechanical masses present in the generator and turbine are considered by Equation (6).
J d ω m d t = T e T m × B × ω m  
T e —is the electromagnetic torque, T m —is the mechanical torque, J —is the combined inertia, and B —is the rotor friction.
A bi-directional converter was applied to achieve synchronization with the AC grid.

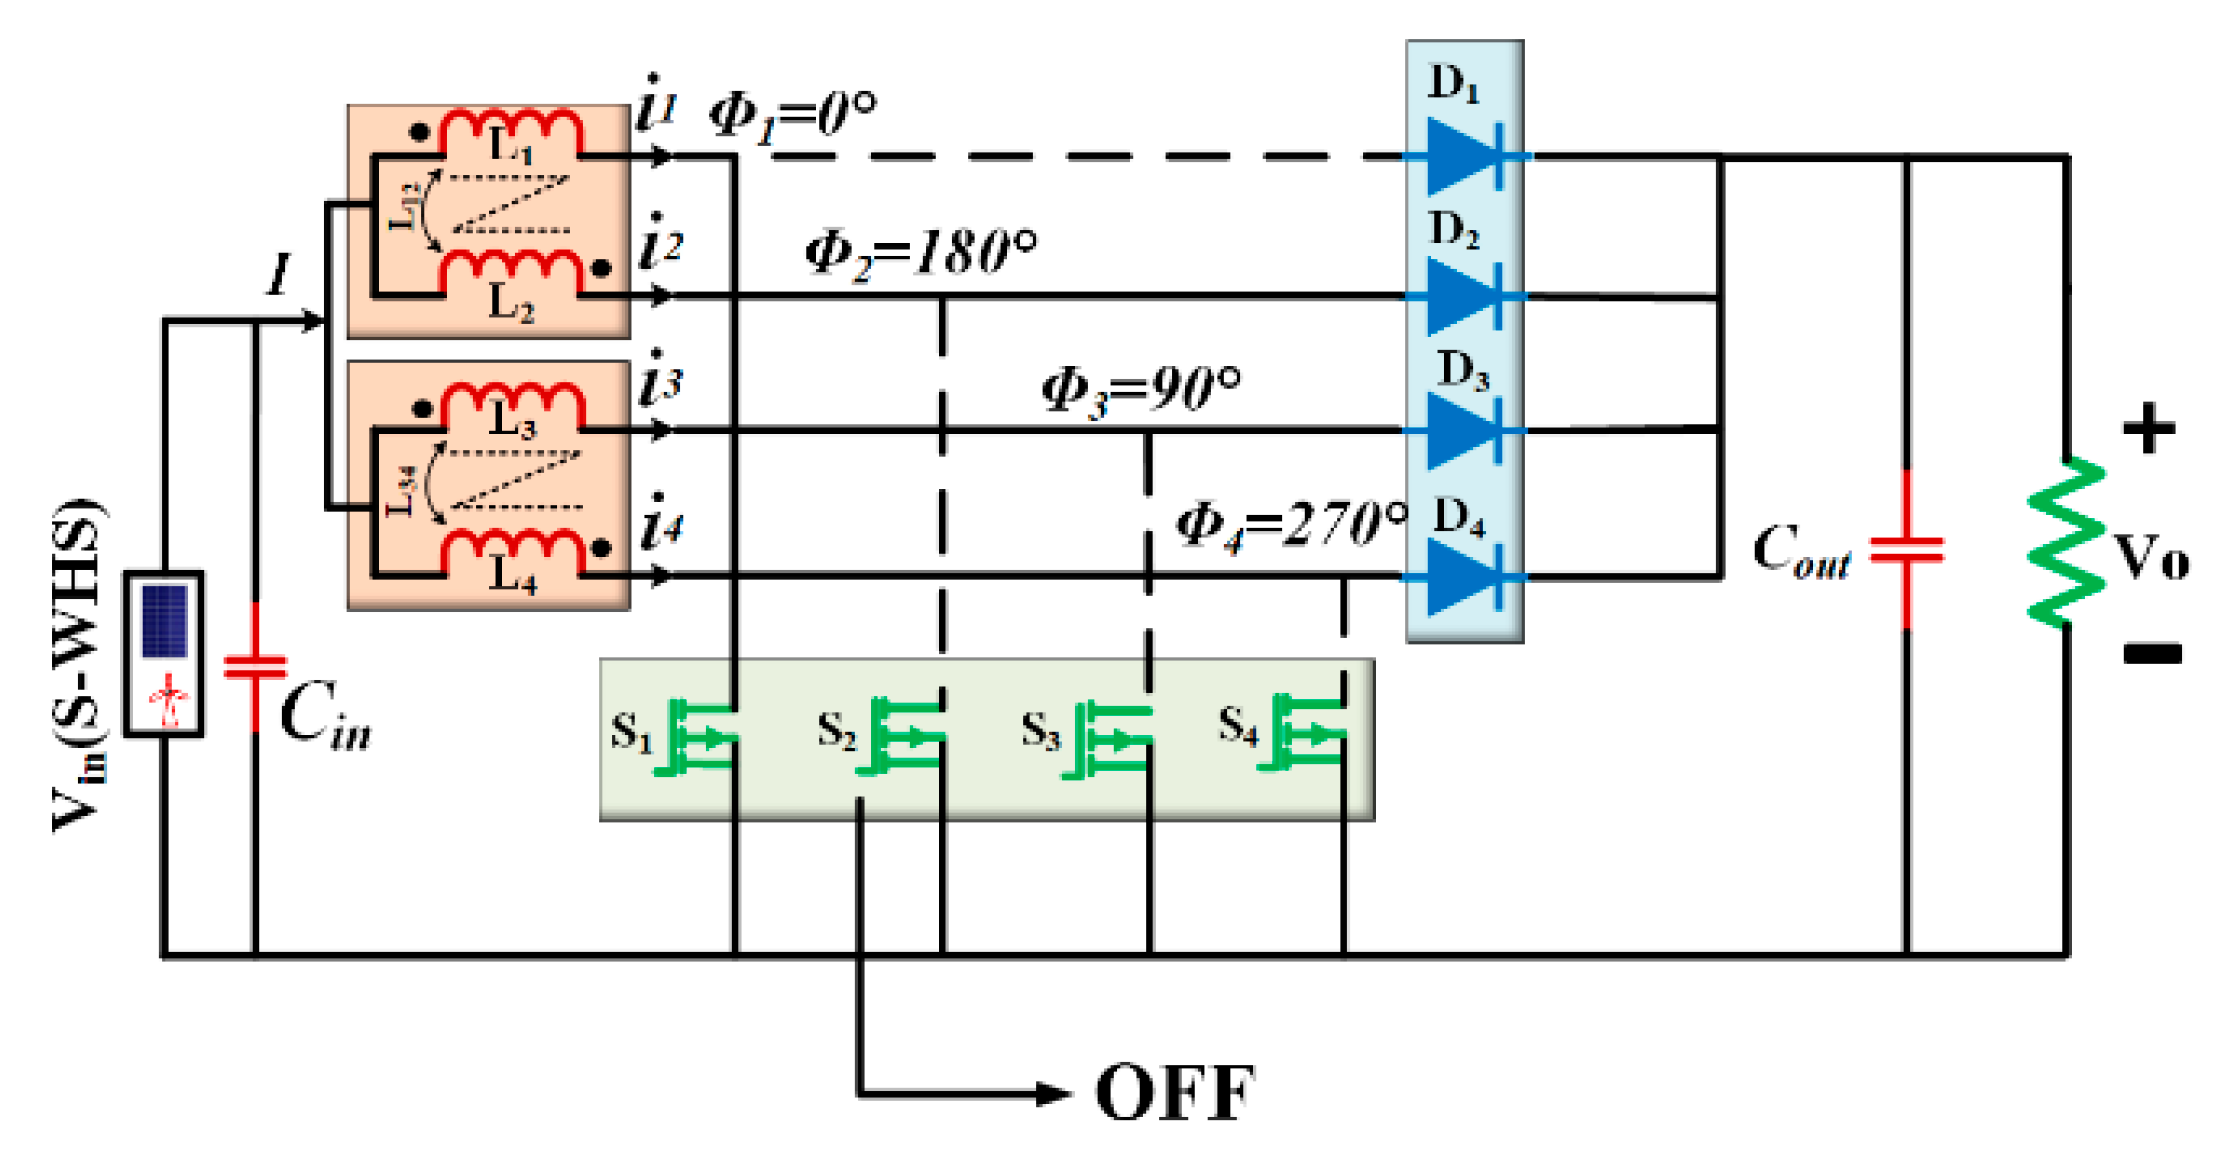
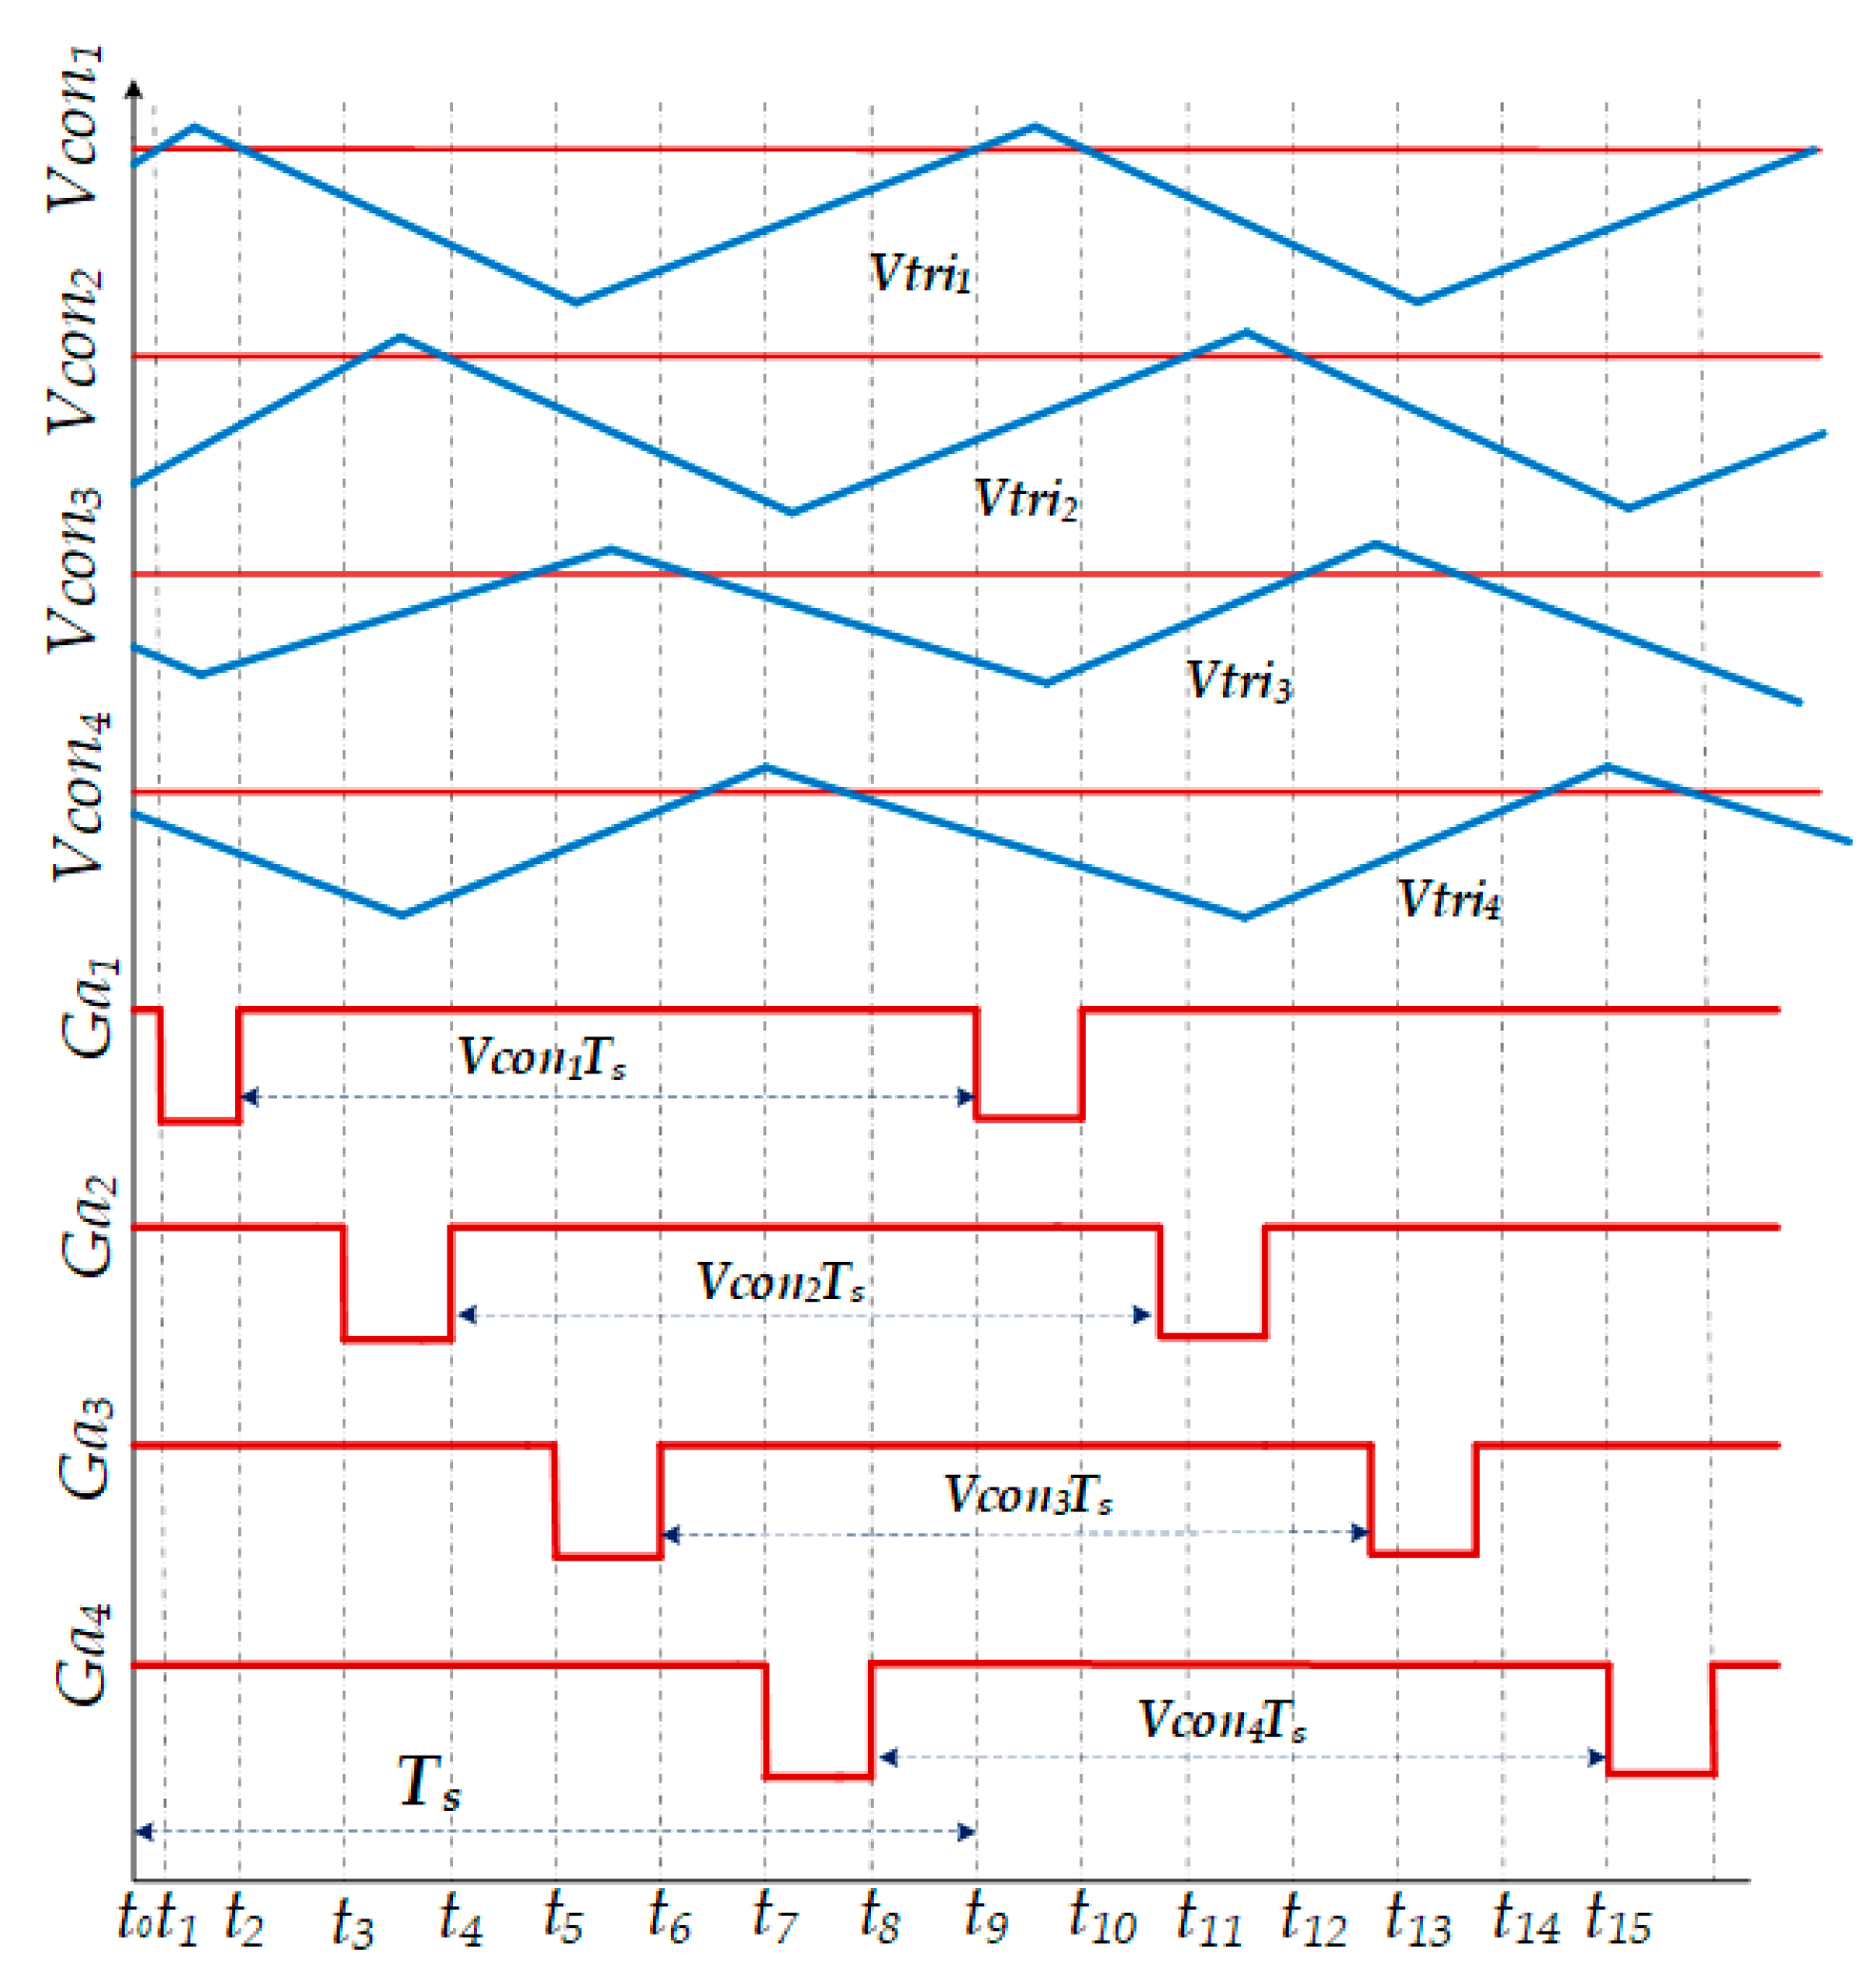
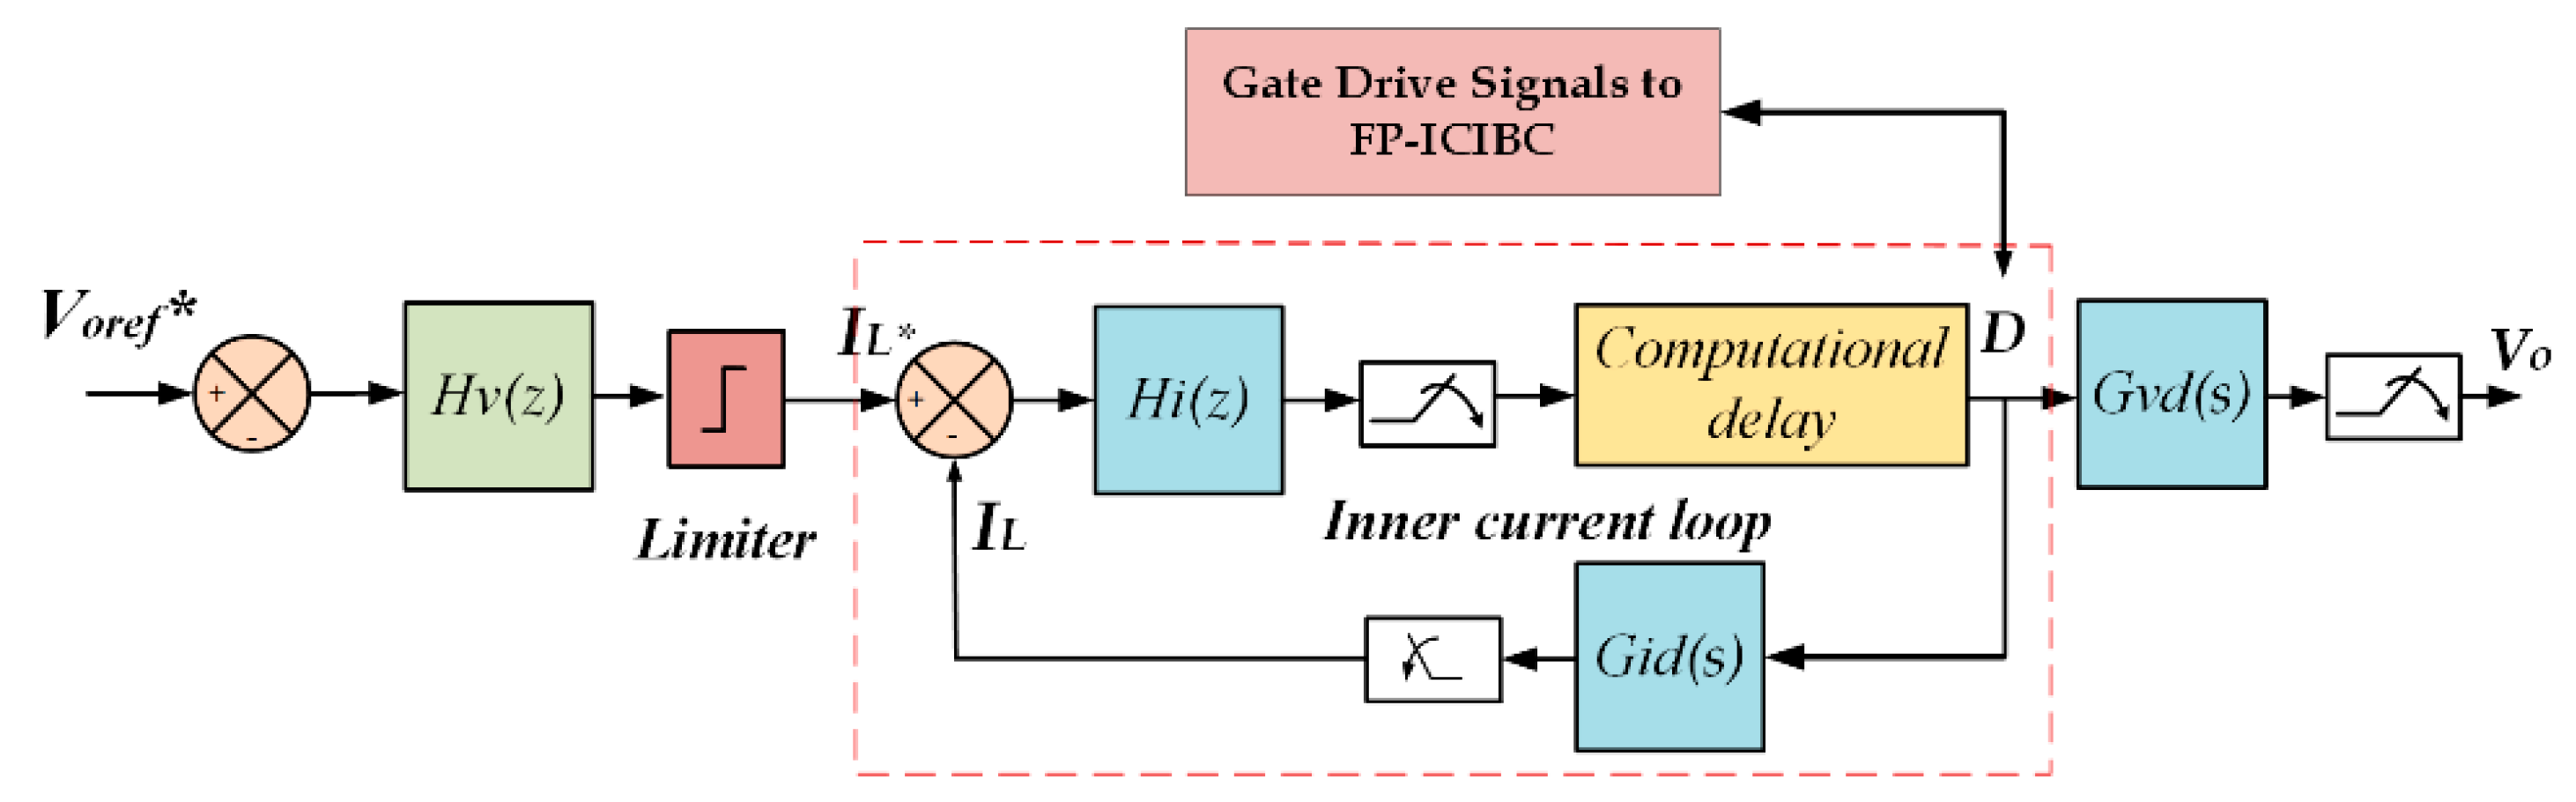
3. Design Structure for Proposed Four-Phase Inductor Coupled Interleaved Boost Converter (FP-ICIBC) and Its Control Strategy

Due to the lack of an energy buffer in the single-stage power converter to filter the current ripple produced by the single-phase AC inverter, a sizable bank of electrolytic capacitors is connected in parallel with the PV-Wind hybrid system. Closely coupled inductors and loosely coupled inductors [12] are the most frequently used methods for interleaved converters to lower the total size of magnetic components. The inductor and transformer concepts are combined into a single core in the interleaved circuit, which results in low-cost and magnetic losses in the design structure. If one winding is put above the other, an inductor will be tightly coupled [13]. There will not be any DC flux in the core and the leakage inductance will be very low; therefore, no air gap in the core is required if the projected current ripple is minimal, and the mutual inductance will be higher.
This paper suggests a FP-ICIBC, which is considered only for the continuous conduction mode and has some control over power in both directions. A circuit comprising an input source (Vin(S-WHS)), two energy storage coupled inductors (L12 and L34), four switching devices (S1, S2, S3, S4), four diodes (D1, D2, D3, D4), and two input (Cin) and output (Cout) capacitors make up the architecture, which employs a four-stage interleaving technique, as shown in Figure 5.
The relation Ts/(n × m) represents the number of phases (n) and number of parallel switches per phase (m) and Ts indicates the switching time. When FP-IBC m and n are both 1, each phase receives an equal amount of the current from the power source, which also has a ripple content with a period of Ts/4, as shown in Figure 6. In a similar fashion, the switching frequency fsw is ‘n’ times higher than the frequency of the output voltage and the input current [21], which is also the size of passive devices like capacitors and inductors, which will be n times smaller than they would be with CBC. Paralleling phases will also improve the system’s stability, converter power rating, distribution losses, and size optimization. Due to these benefits, FP-IBC is preferred over alternative converter topologies such as a DC/DC converter for EV power systems, particularly for high-power applications.
The duty cycle value in DC/DC converters determines how much power is regulated, and this is typically carried out to manage output/input voltage or output current. It is clear that a preferred duty ratio range is about between 0.2 and 0.8, which is enough for practically all boost converter application areas. As the duty ratio rises, the DC component of the current rises as well, which is related to the rise in the AC component (the ripple) of the current. The authors of [22] state that the output current frequency is increased by a factor of 4 owing to the 90 electrical degree phase difference between each circuit, while a ripple after superposition is reduced.
At high input, voltages or for low-duty cycles, Leq′ are slightly less than L, but, in this case, they rise as the input voltage falls. This is a useful feature because Leq′ must be greater at lower input voltages to limit the peak current. So, the loss may be minimized and vice versa. Coupled inductors made with opposite polarity have more inductance value and will be effective for operating conditions. The equivalent inductance Leq′ is obtained with the help of ‘Ls’ and ‘k’ during the switching periods of the ON duty cycle and the relevant equation is given in (7) and (8).
L e q 1 = L s 2 M 2 L s M × D / ( 1 D )   = 1 k 2 1 k × D / ( 1 D ) × L
L e q 3 = L s 2 M 2 L s M × ( 1 D ) / D   = 1 k 2 1 k × ( 1 D ) / D × L
  • Case 1: S1 is ON (M1000) and other switches are OFF.
Figure 7 shows that switch S1 is closed while the others remain in an OFF state. The load hybrid system joins L2, L3, and L4 after charging to “L1” where the current grows linearly, and this can be shown from Equations (9) and (10).
L 1 d i L 1 ( t ) d t = V i n ( h y b r i d ) ( t )
L 2 ( 3,4 ) d i L 2 ( 3,4 ) ( t ) d t = V o u t ( t ) + V i n ( h y b r i d ) ( t )
According to the relationship depicted in Equation (11), ‘C’ supplies energy to the load.
C d v o u t ( t ) d t = i = 2 4 i L 1 t V o u t ( t ) R
The duty cycles di(t) (i = 1 to 4) can be used to calculate the start time of each switch, di(t)Ts. The FP-ICIBC model suggests that every pair of adjacent phases must have a Ts/4 shift angle between them, and each phase duty cycle should remain unchanged. Figure 8 shows that only eight of the sixteen distinct work states can exist in a single period. Based on the total number of duty cycles, the ripple is minimal and the mutual inductance will be higher. Therefore, the four-stage IBC’s real functioning can be broken down into four different operating modes, as shown in Table 1. Here, (1) represents that the state of the switch is closed while (0) represents the opposite, i.e., open. Here, in Mode 4, due to the heavy duty cycle of each switch, a minimum of three switches are operated simultaneously. i takes between 1 and 4 and can be used to determine the drive waveforms Gi shown in red and blue waveform represents converter triggered voltages. A total of 2 consecutive drive waveforms in Case 1, as shown in Figure 7, have an interval time of Ts/4, which indicates that t1 + t2 = t3 + t4 = t5 + t6 = Ts/4. Furthermore, Case 1 has at least three switches closed concurrently in a single period due to the high duty cycle of each switch.
If we consider the ripple parameter for the case of the conventional two-phase boost converter with the same operating conditions, it can be expressed in Equation (12).
Δ I 1 p k p k = Δ I 1 p k p k + Δ I 2 ( p k p k ) = V i n L 1 × D × T s + V i n L 2 × D × T s = 2 V i n L × D × T s = 2 V i n L × ( V o u t V i n ) V o u t × T s
The current ripple is very low when the FP-ICIBC is designed with a coupled inductor. In this case, when three switches are in ON, while the remaining is in OFF, the inductor current increases linearly and the ripple equations are given by
I 1 ( p k p k ) = V i n ( h y b r i d ) L e q × D × T s
I 2 ( p k p k ) = V i n ( h y b r i d ) L e q × D × T s
I 3 ( p k p k ) = V i n ( h y b r i d ) L e q × D × T s
I 4 ( p k p k ) = V i n ( h y b r i d ) L e q 1 1 1 D × D × T s
The total input current for peak–peak is given by combining all the ripple current equations:
I i n p u t p k p k = I 1 p k p k + I 2 p k p k + I 3 p k p k + I 4 p k p k = V i n h y b r i d 2 L e q 8 D 2     10 D   +   3 1     D × D × T s = V o u t p u t 2 L e q 8 D 2 10 D + 3 × ( V o u t V i n ) V o u t × T s
The voltage stress on the switches is reduced when they are in the OFF position. This is because of the volume and size of the capacitor chosen. This subsequently reduces the voltage ripples on the switches.
The capacitor value is given in [14], where V i n and V o u t are the respective input and output voltages, R is the load value of resistor, V o u t is the capacitor ripple voltage, and fs represents the switching frequency.
C o u t   = V o u t × D R × V o u t   × f s
The mutually connected inductance L M is considered to be constant because it is sufficiently large. The output power is based on the idea of energy conservation.
P o u t = η × V i n × I i n = η × V i n × I L m
where η stands for the circuit’s efficiency of conversion. From Equation (19), I L M can be stated as
I L m = P o u t η × V i n = V o u t η × V i n

Digital 2PI Controller for FP-ICIBC

A PI controller is used to specify the controller’s beginning phase and its gains. It should be chosen carefully in order to find a compromise between minimal oscillation and transient response [17]. A high value of the integral gain could produce a nearly linear response and enhance the oscillations in the transient state. A closed loop digital 2PI controller shown in Figure 9, which is more effective and dependable for high-power converter applications, is used to satisfy the voltage and current requirements, independent of variations in the load and input voltages of the proposed FC-ICIBC. Here, the system was built directly in the z-domain, which helps to increase the system stability by avoiding computational lags and timing issues [18]. Two variable parameters, such as the output voltage V o u t and the inductor current IL, which are acquired with the help of the voltage control loop, are necessary in the 2PIC in order to obtain the reference current for the inner current loop (i.e., the outer loop). There is a significant signal disturbance between the output voltage V i n and the reference voltage V r e f at the output the inductor becomes saturated, and the load is affected. In order to prevent this, a limiter is used, which regulates the inductor current and safeguards the load.
After using the ZOH approach to acquire the current Gid(s) and voltage Gvd(s) as continuous time transfer functions for the used FC-ICIBC, it is simple to perform the digital controller Hz(s) in the z-domain in a manner like the continuous-time frequency method. The loops for controlling the voltage and current are represented by Hv(z) and Hi(z). The voltage Gvd(z) and current Gid(z) transfer functions for discrete time systems and are given by Equations (21) and (22):
G v d ( z ) = Z 1 e s T s s × e s T d × G v d ( s )
G i d ( z ) = Z 1 e s T s s × e s T d × G i d ( s )
The current T i ( s ) and voltage T v ( s ) loop gains are given by Equations (23) and (24):
T i ( s ) = G i d ( z ) × H i ( z )
T v ( s ) = G v d ( z ) × H v ( z ) × H i ( z ) 1 + T i ( z )
Therefore, selecting a digital PI controller and its transfer function is given by Equation (25). Gp(z) represents the open loop system for the discrete time transfer function.
H ( z ) = k p + k i × T s ( z ) z 1
here, k p = c o s θ G p ( z )
k i = ω c z   s i n θ G p ( z )

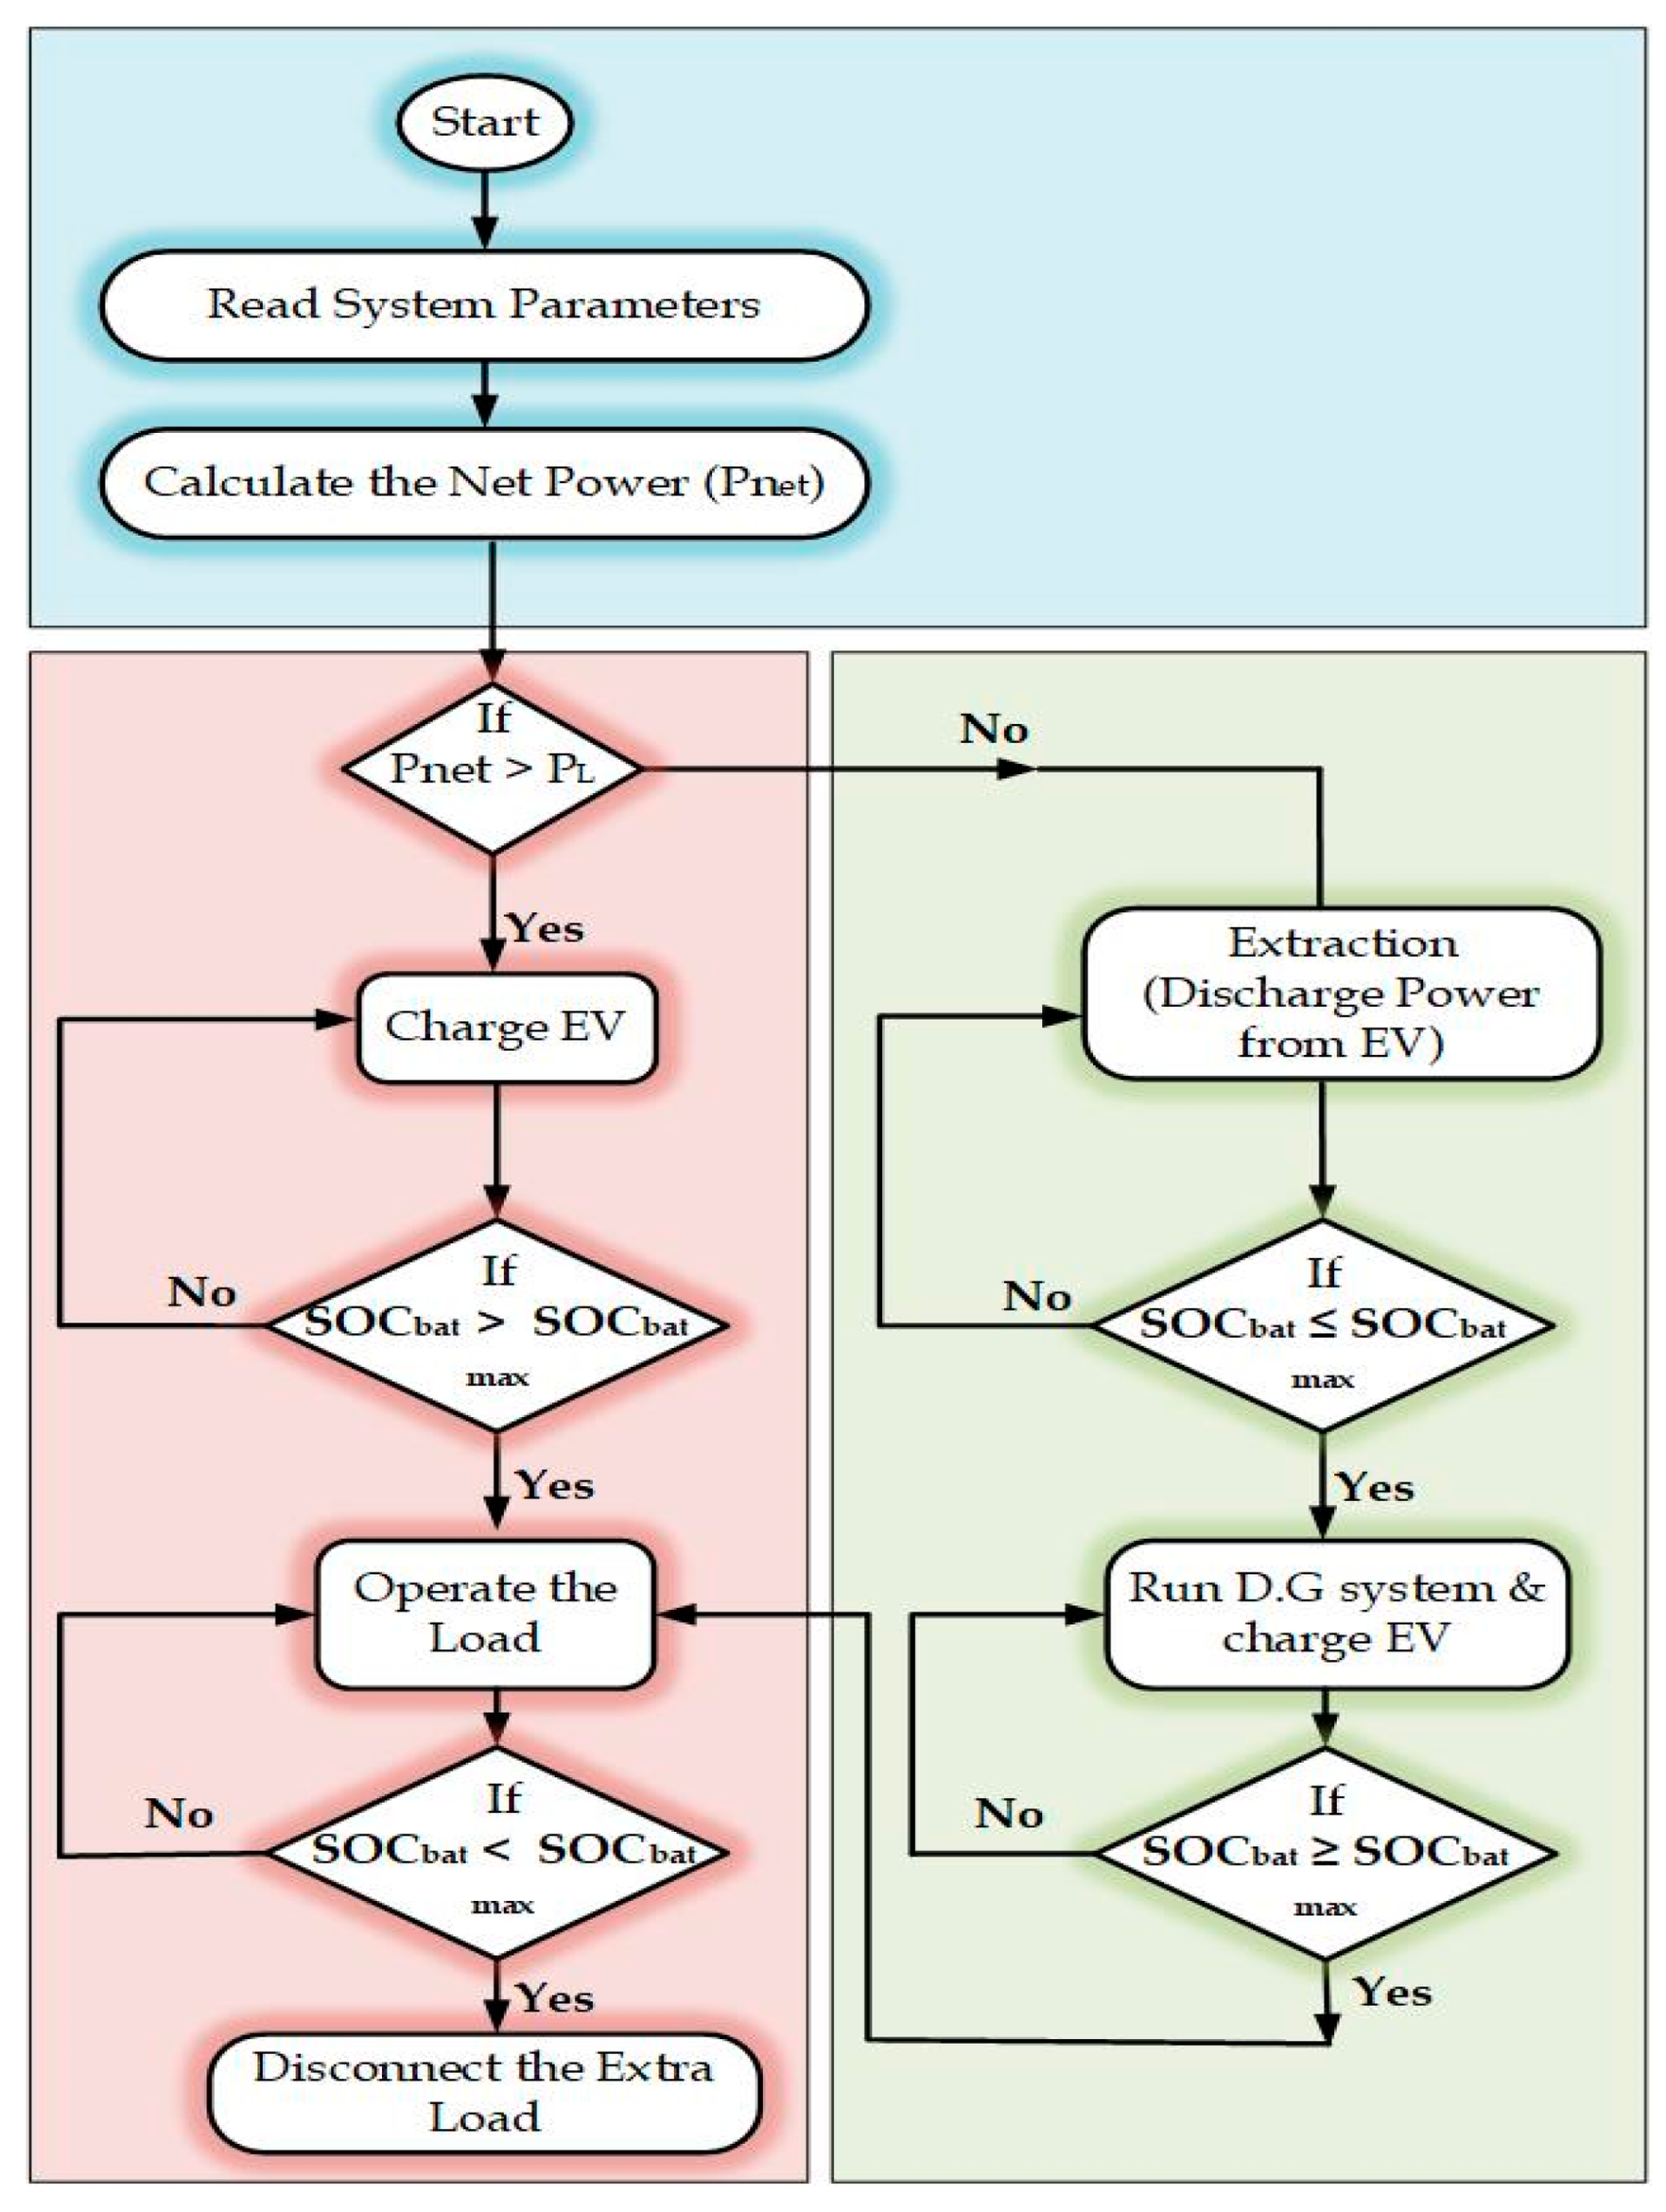
4. Power Management of Proposed Hybrid System and Simulation Analysis

In [23] solar irradiance and wind speed real time data were acquired from a 50 KW solar plant installed by Andhra Loyola College, Vijayawada, on 22 September 2023 and wind data are considered from KST wind engineering India Pvt, Ltd. (Coimbatore, Tamil nadu, India) on the date of 9 April 2023, as shown in Figure 10. The Case 1 grid connected solar wind hybrid system (G-SWHS) acted as a source and, when needed, the grid supplied 3 ph, 415 V as an input. The rest of the cases worked when S-WHS alone was acting as a source. The results and performance analysis of the proposed converter along with different load conditions are displayed in a MATLAB/Simulink R2022b environment. Table 2 illustrates the necessary requirements for a PV and wind energy system.

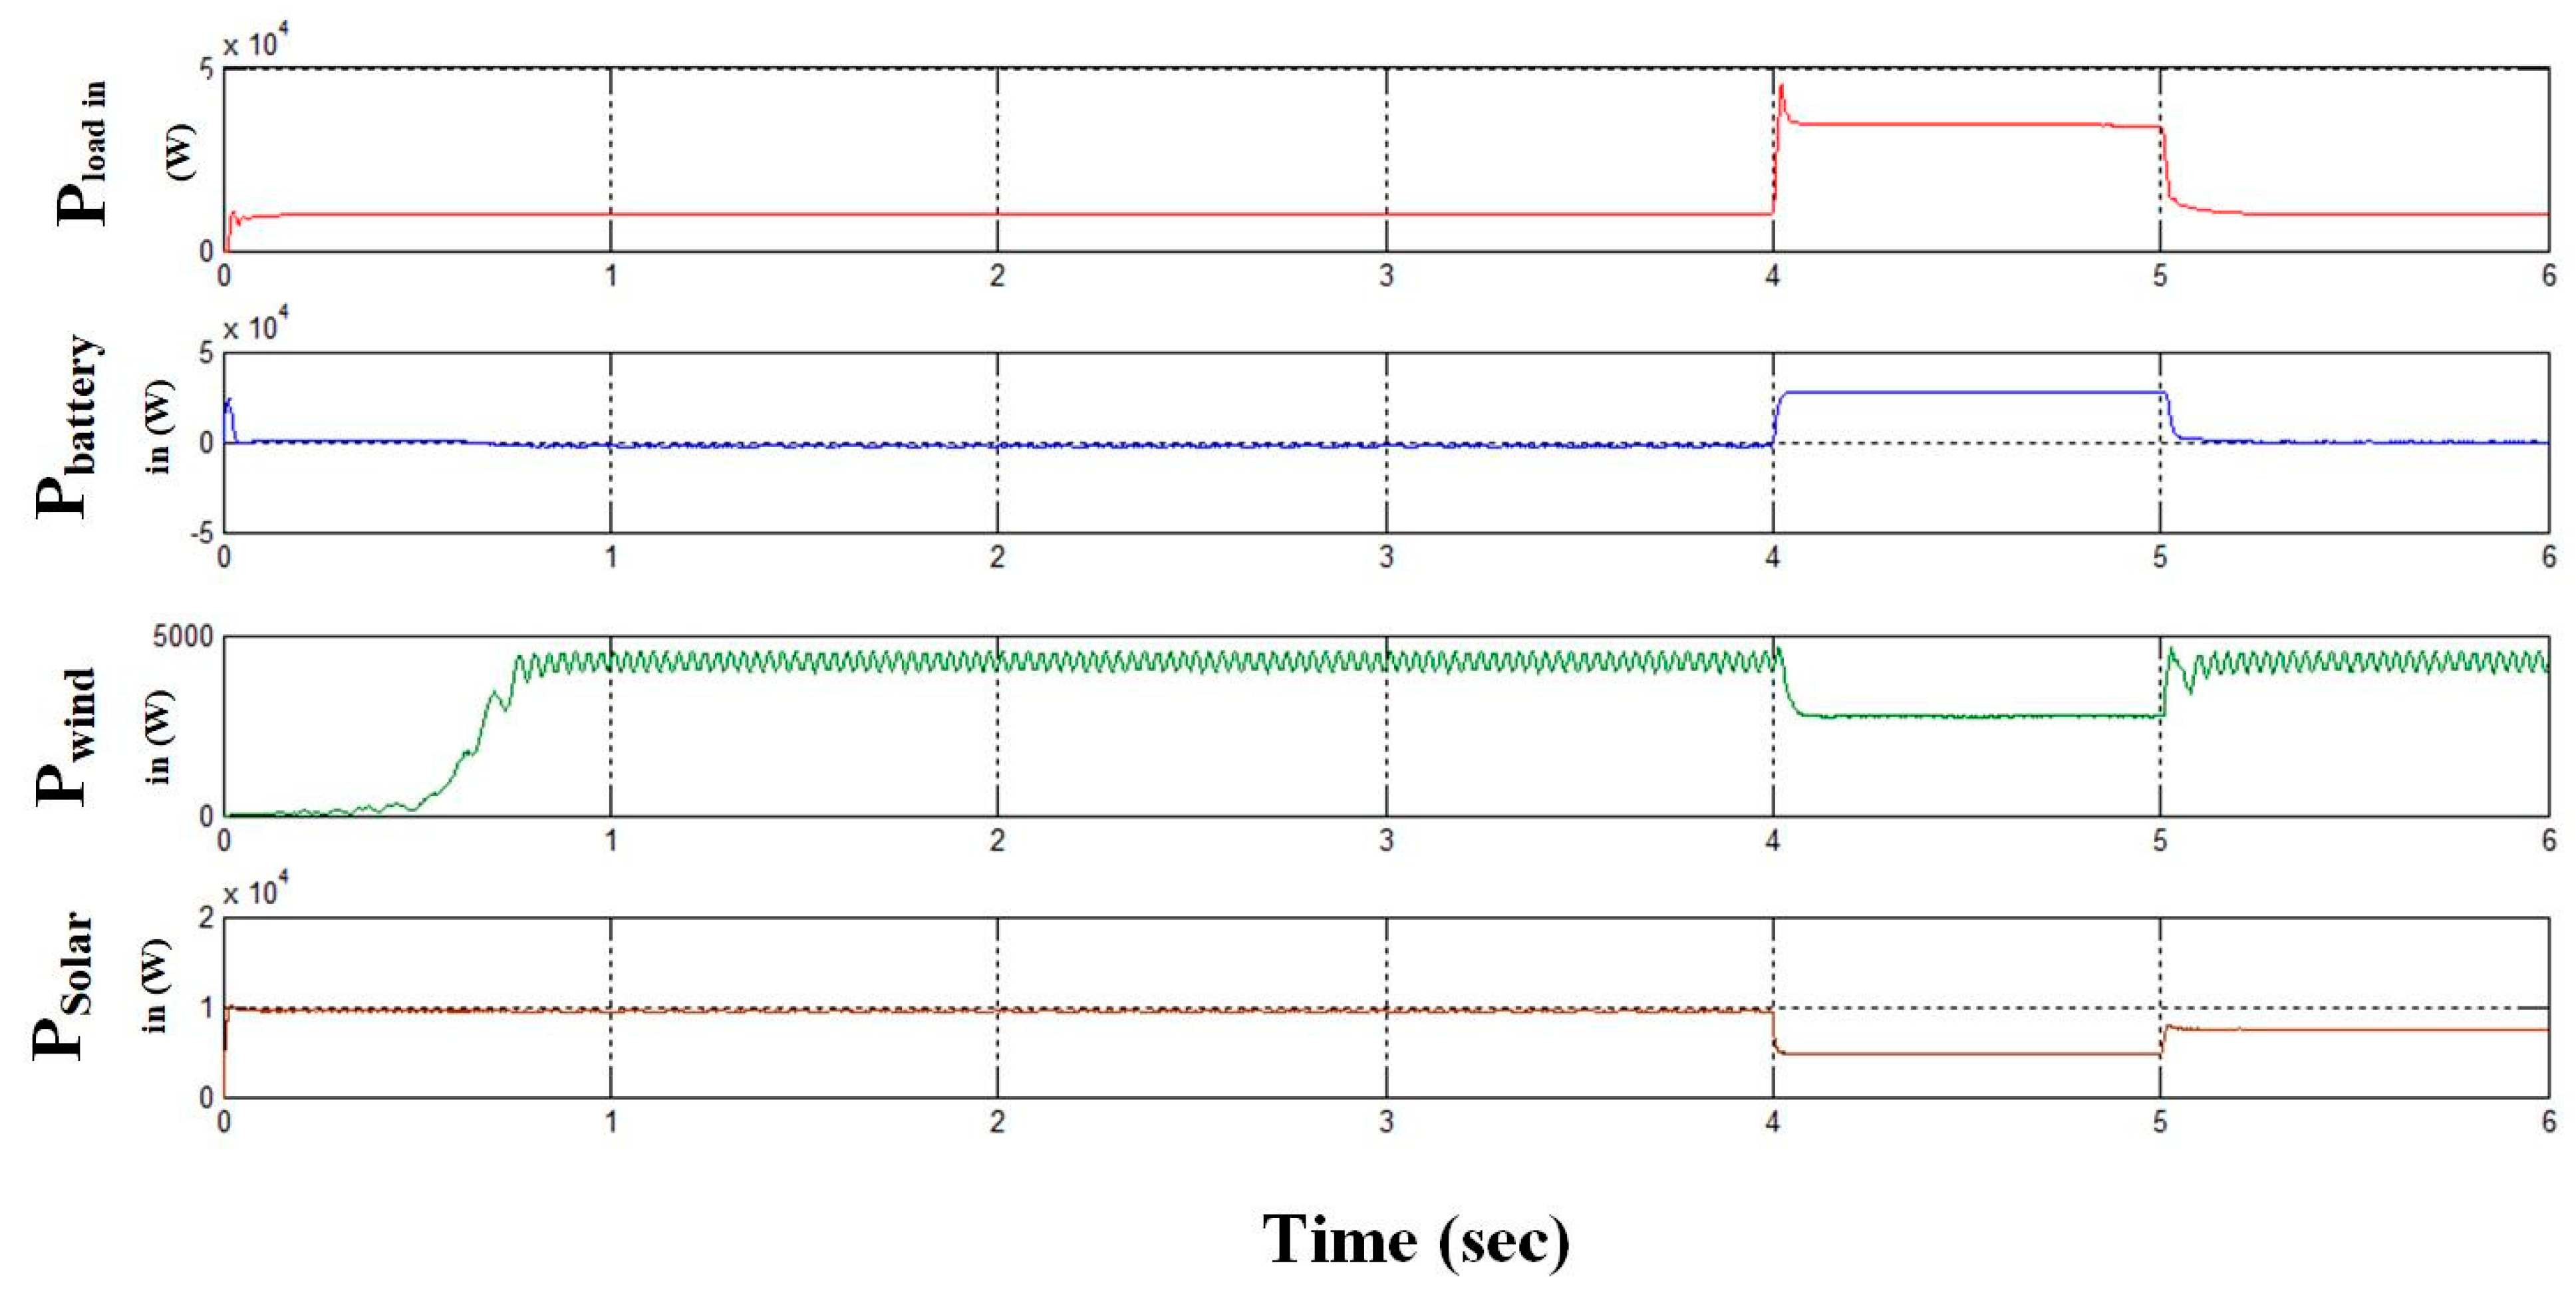
4.1. Case Studies for Different Load Conditions

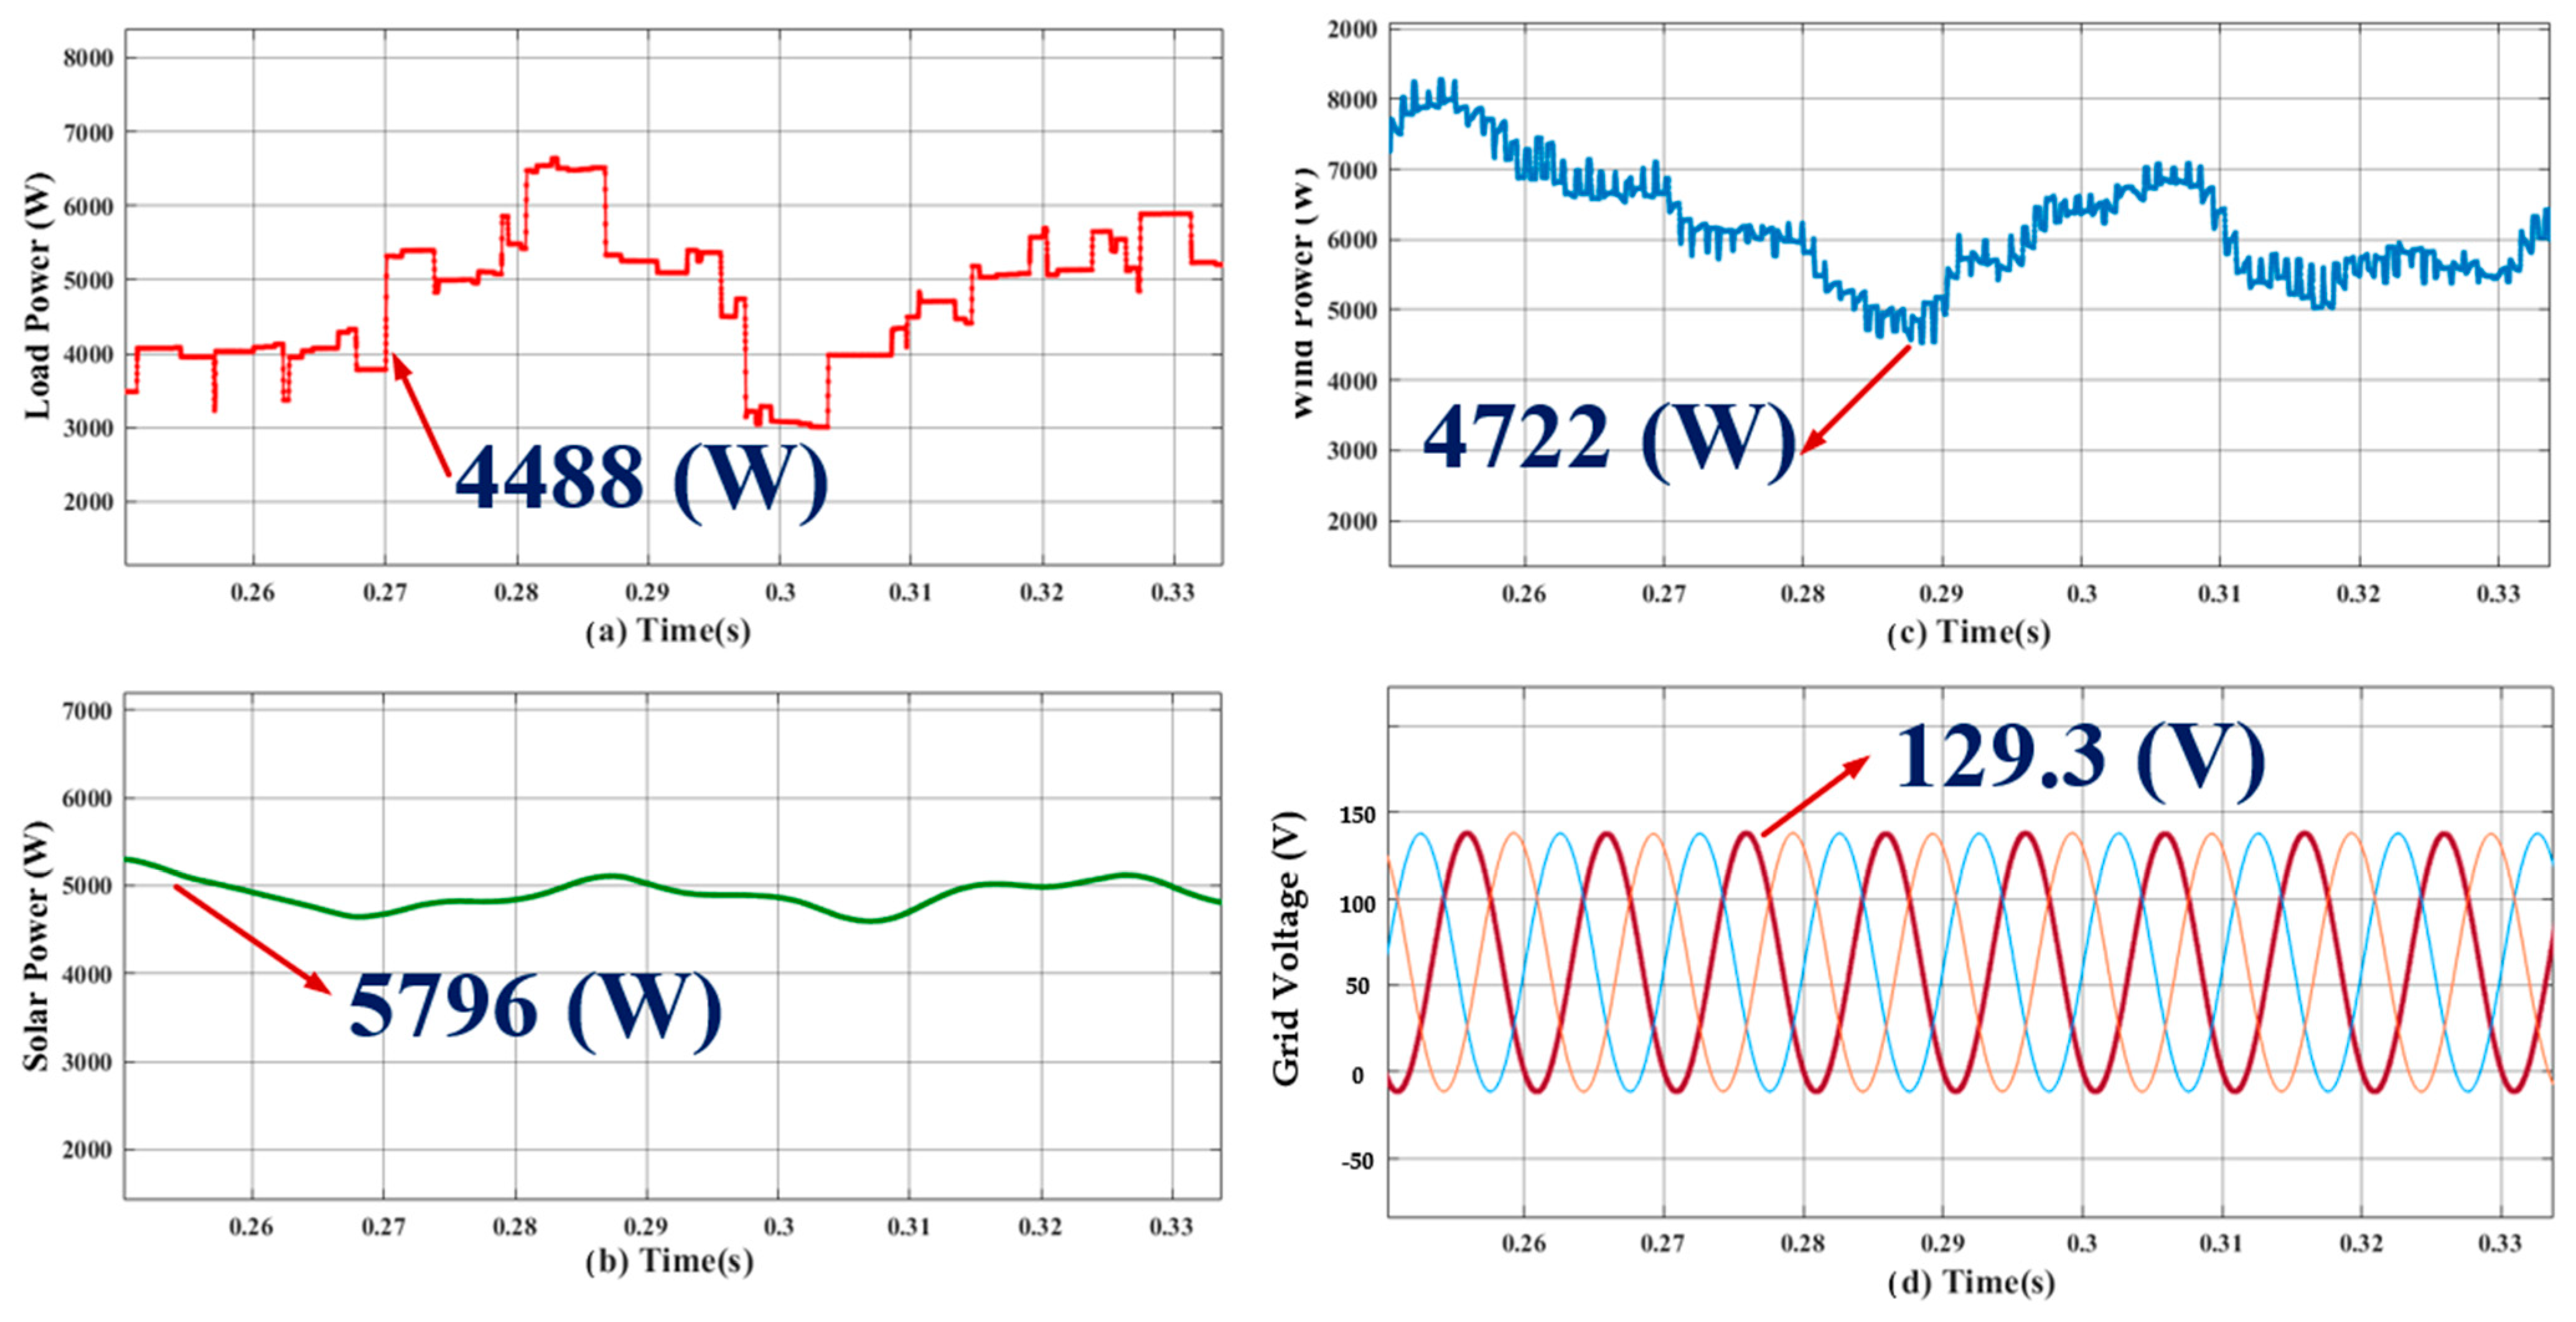
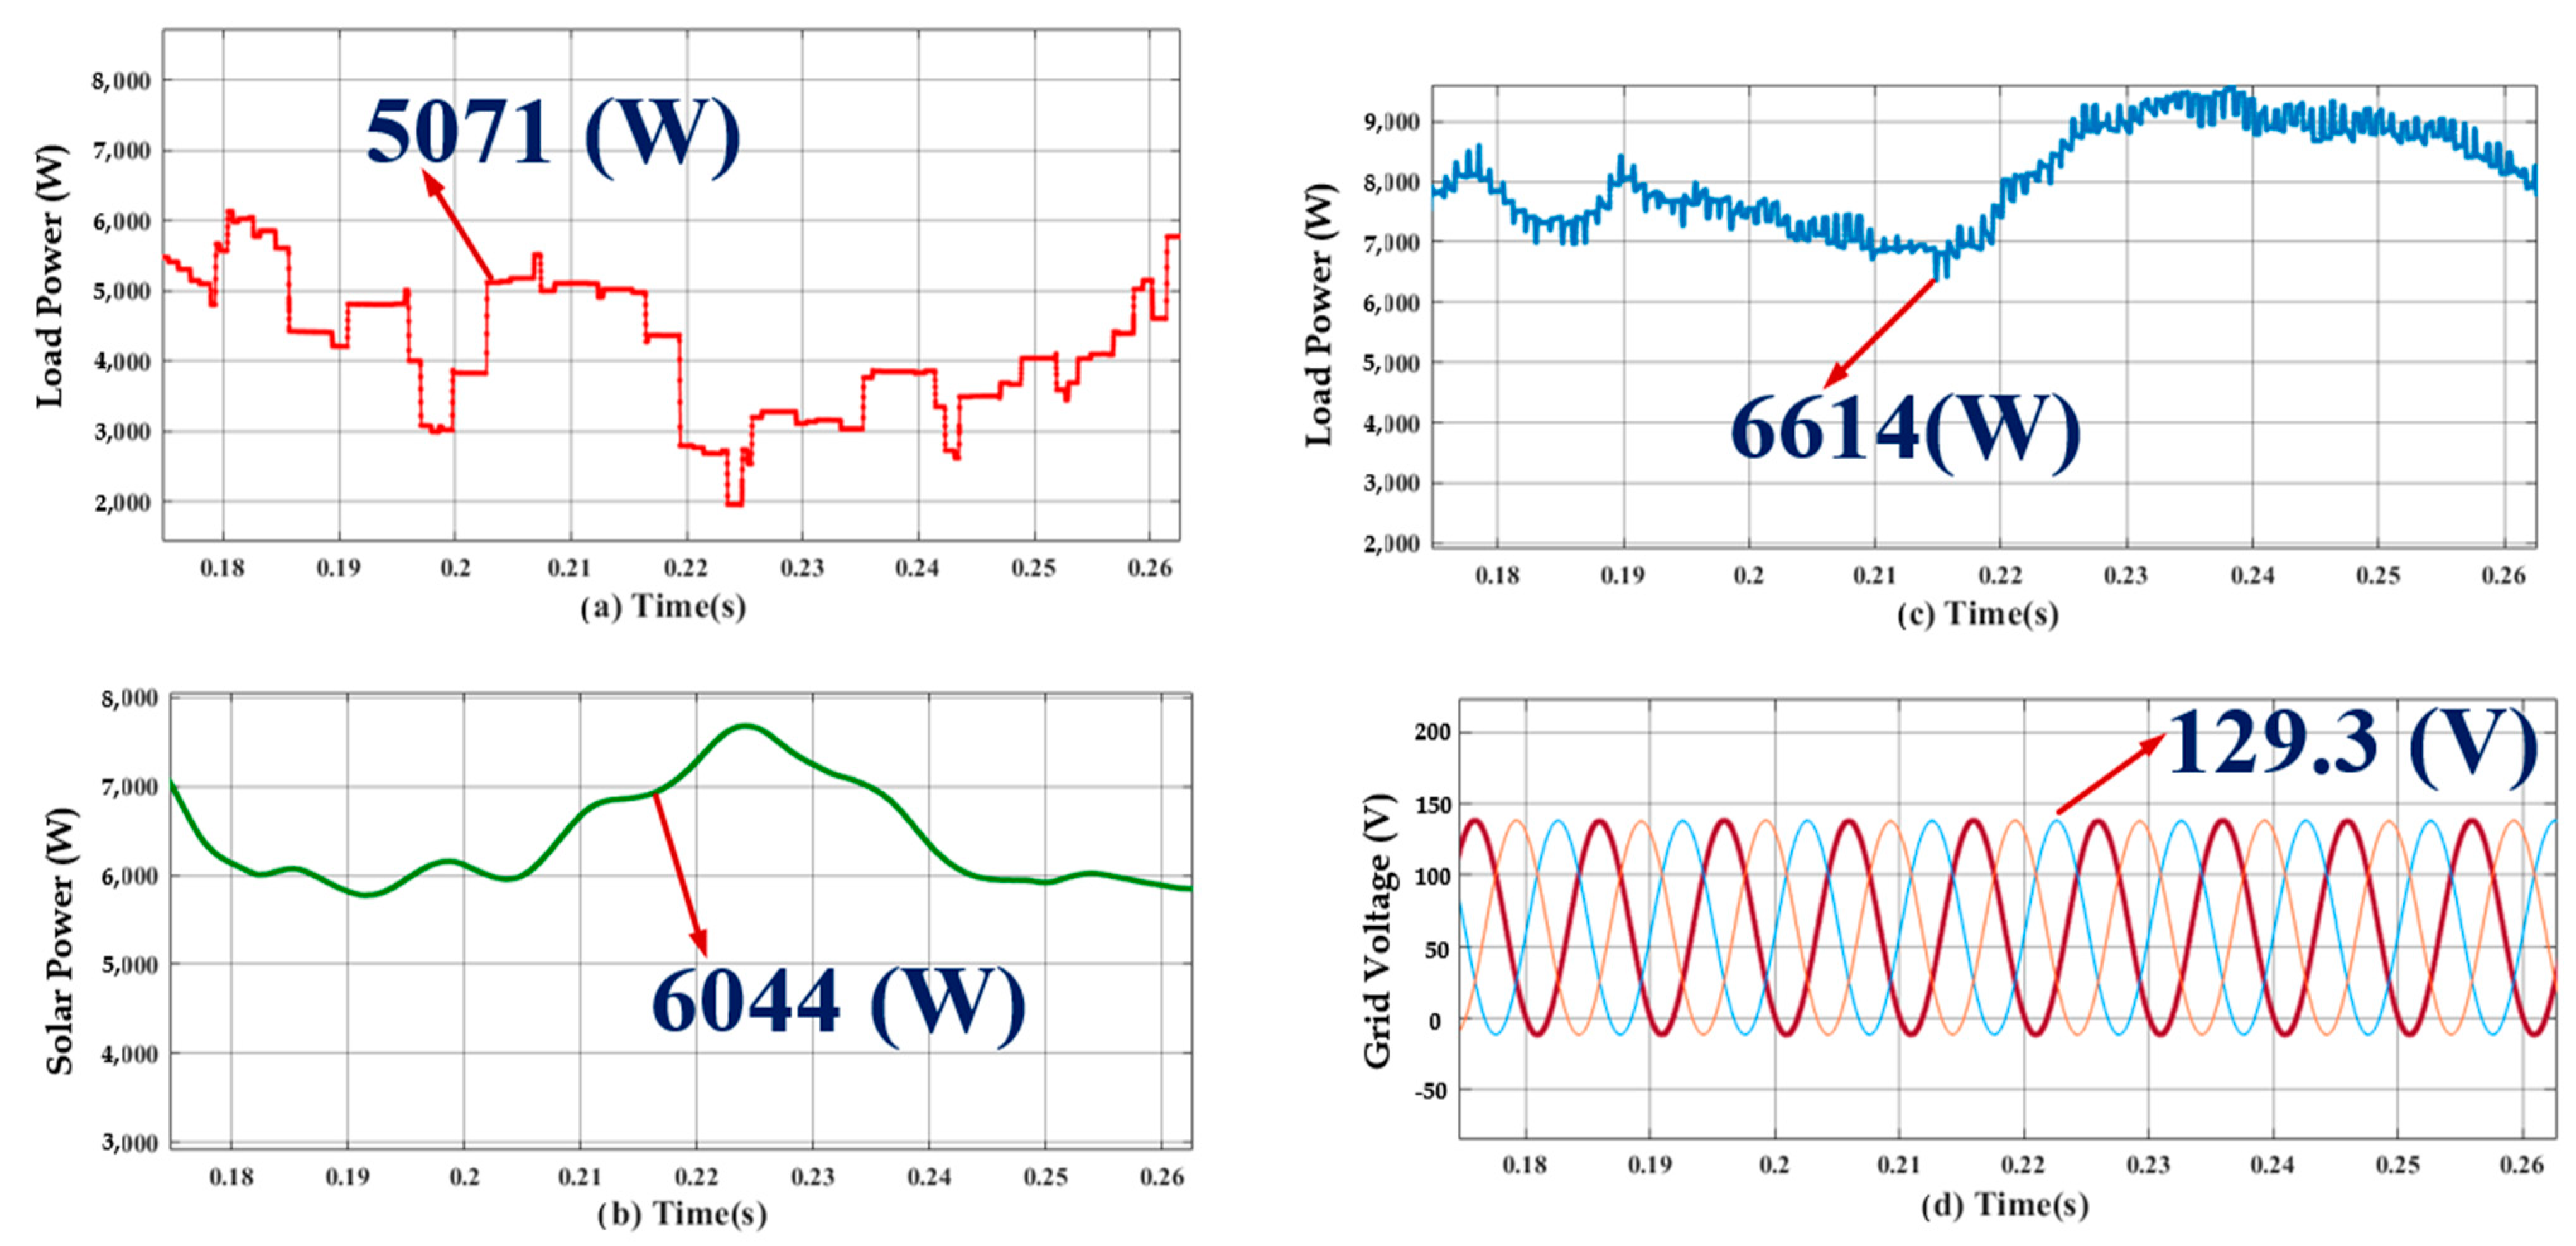
  • Case 1: analysis of S-WHS without load sharing.
According to the modelling expressions shown in the previous sections, a solar PV system for 15 KW and a wind system for 5 KW are designed in this work.
The power management approach for various load conditions and simulation output for the suggested system is displayed in Figure 11, alongside the P&O MPPT controller’s power management strategies. Here, the PV, battery, and grid systems were also chosen for load sharing based on their respective generations.
  • Case 2: analysis of S-WHS with load sharing (S-WHS > Grid).
The total produced power from both PV and wind systems is 8 kW and the operated EV limit is around 3.3 kW. The remaining excess power is supplied to the grid. Figure 12 presents the output of the simulation, exhibiting how the consumer grid system, wind, and solar energy sources were managed to meet the load demand. Under the working states of an electric vehicle in this instance, the power management conditions are shown.
  • Case 3: analysis of S-WHS with load sharing (S-WHS < Grid).
The power generated by the PV and wind energy systems in Case 1C is approximately 8 kW, whereas the maximum output of an electric vehicle is 12 kW. The grid network shown is what will provide the extra power (4 kW) needed to charge the electric vehicle. The simulation results are shown in Figure 13, along with the power management between the PV, wind, and consumer grid systems to meet load demand.
Under the functioning states of the electric vehicle in this instance, the power management conditions are clear.

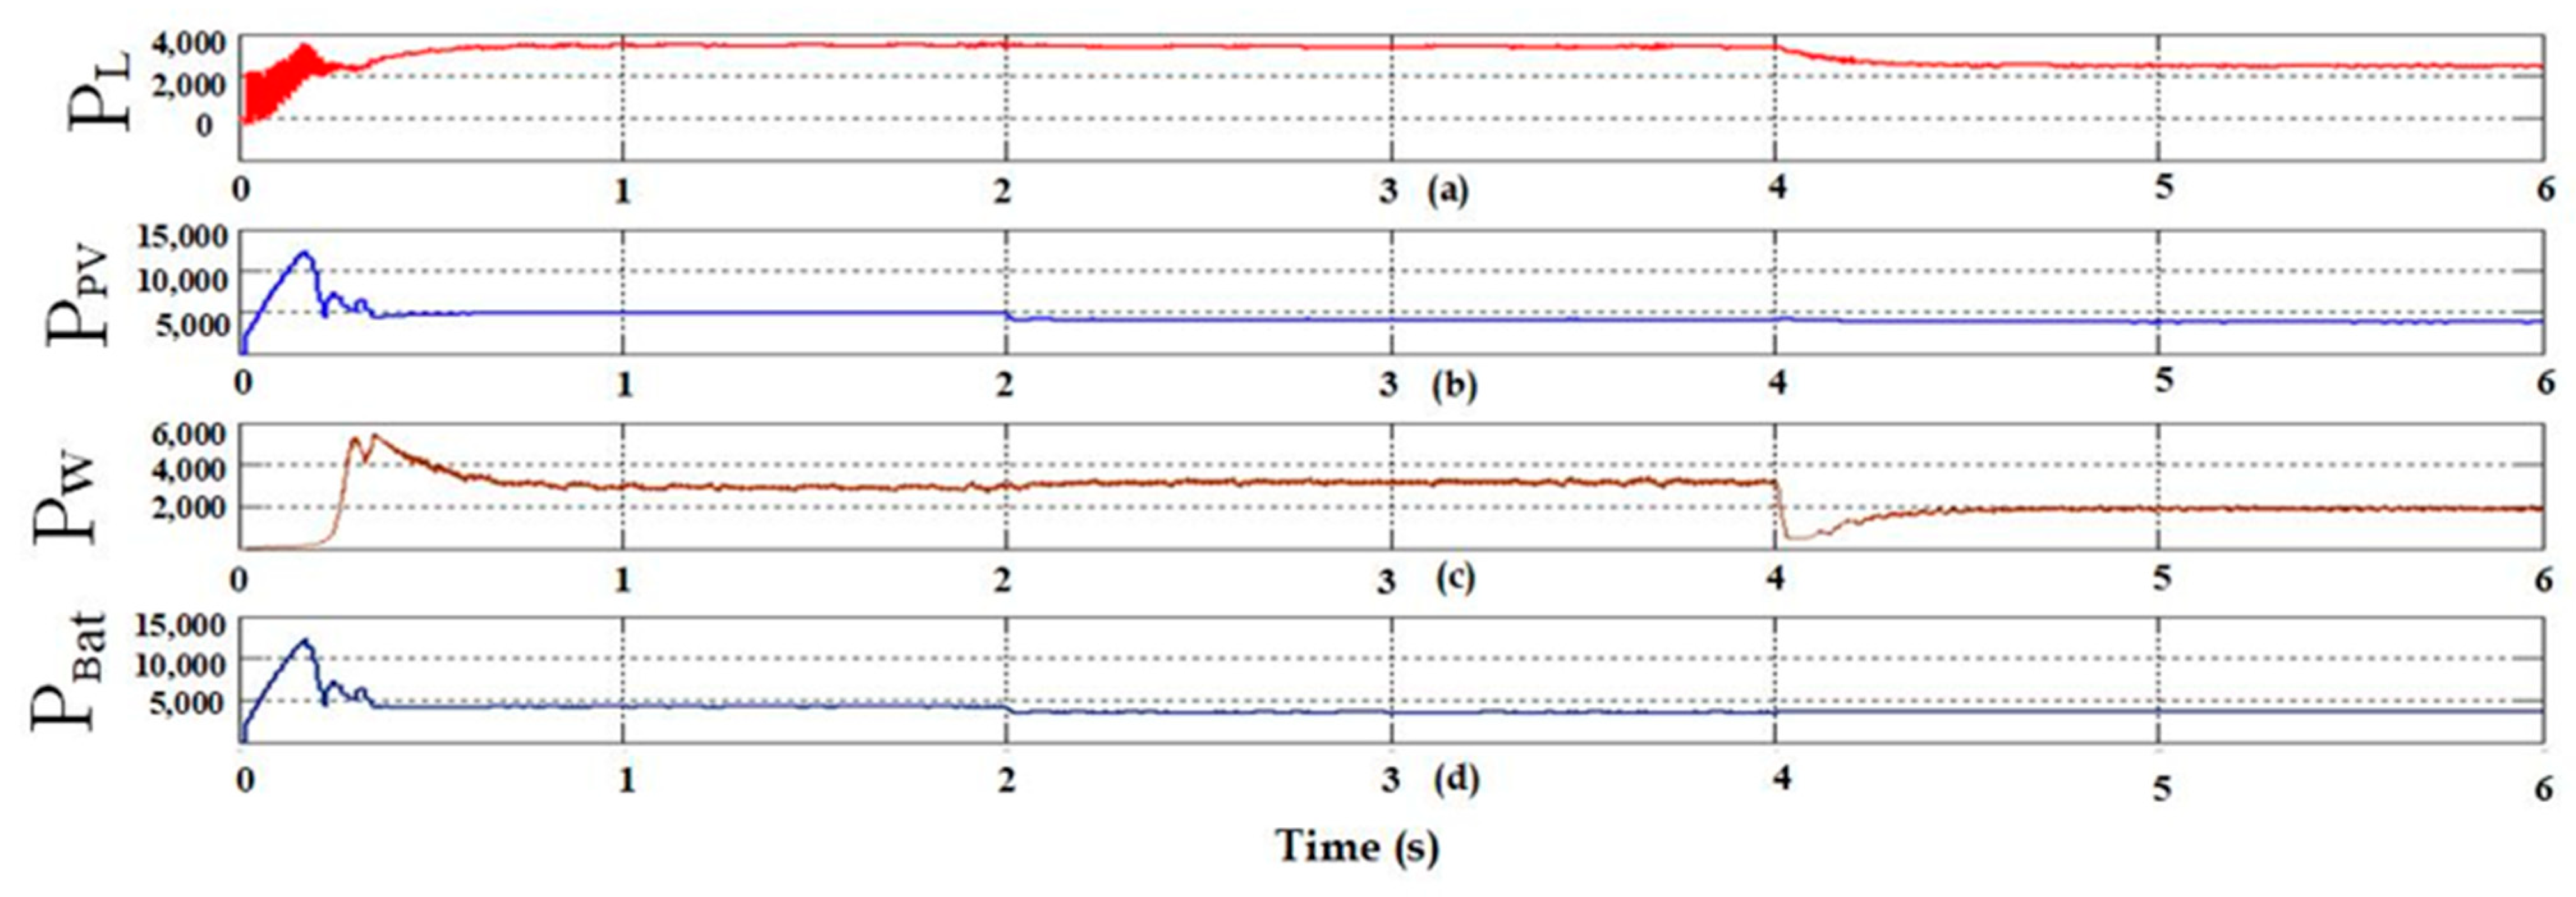
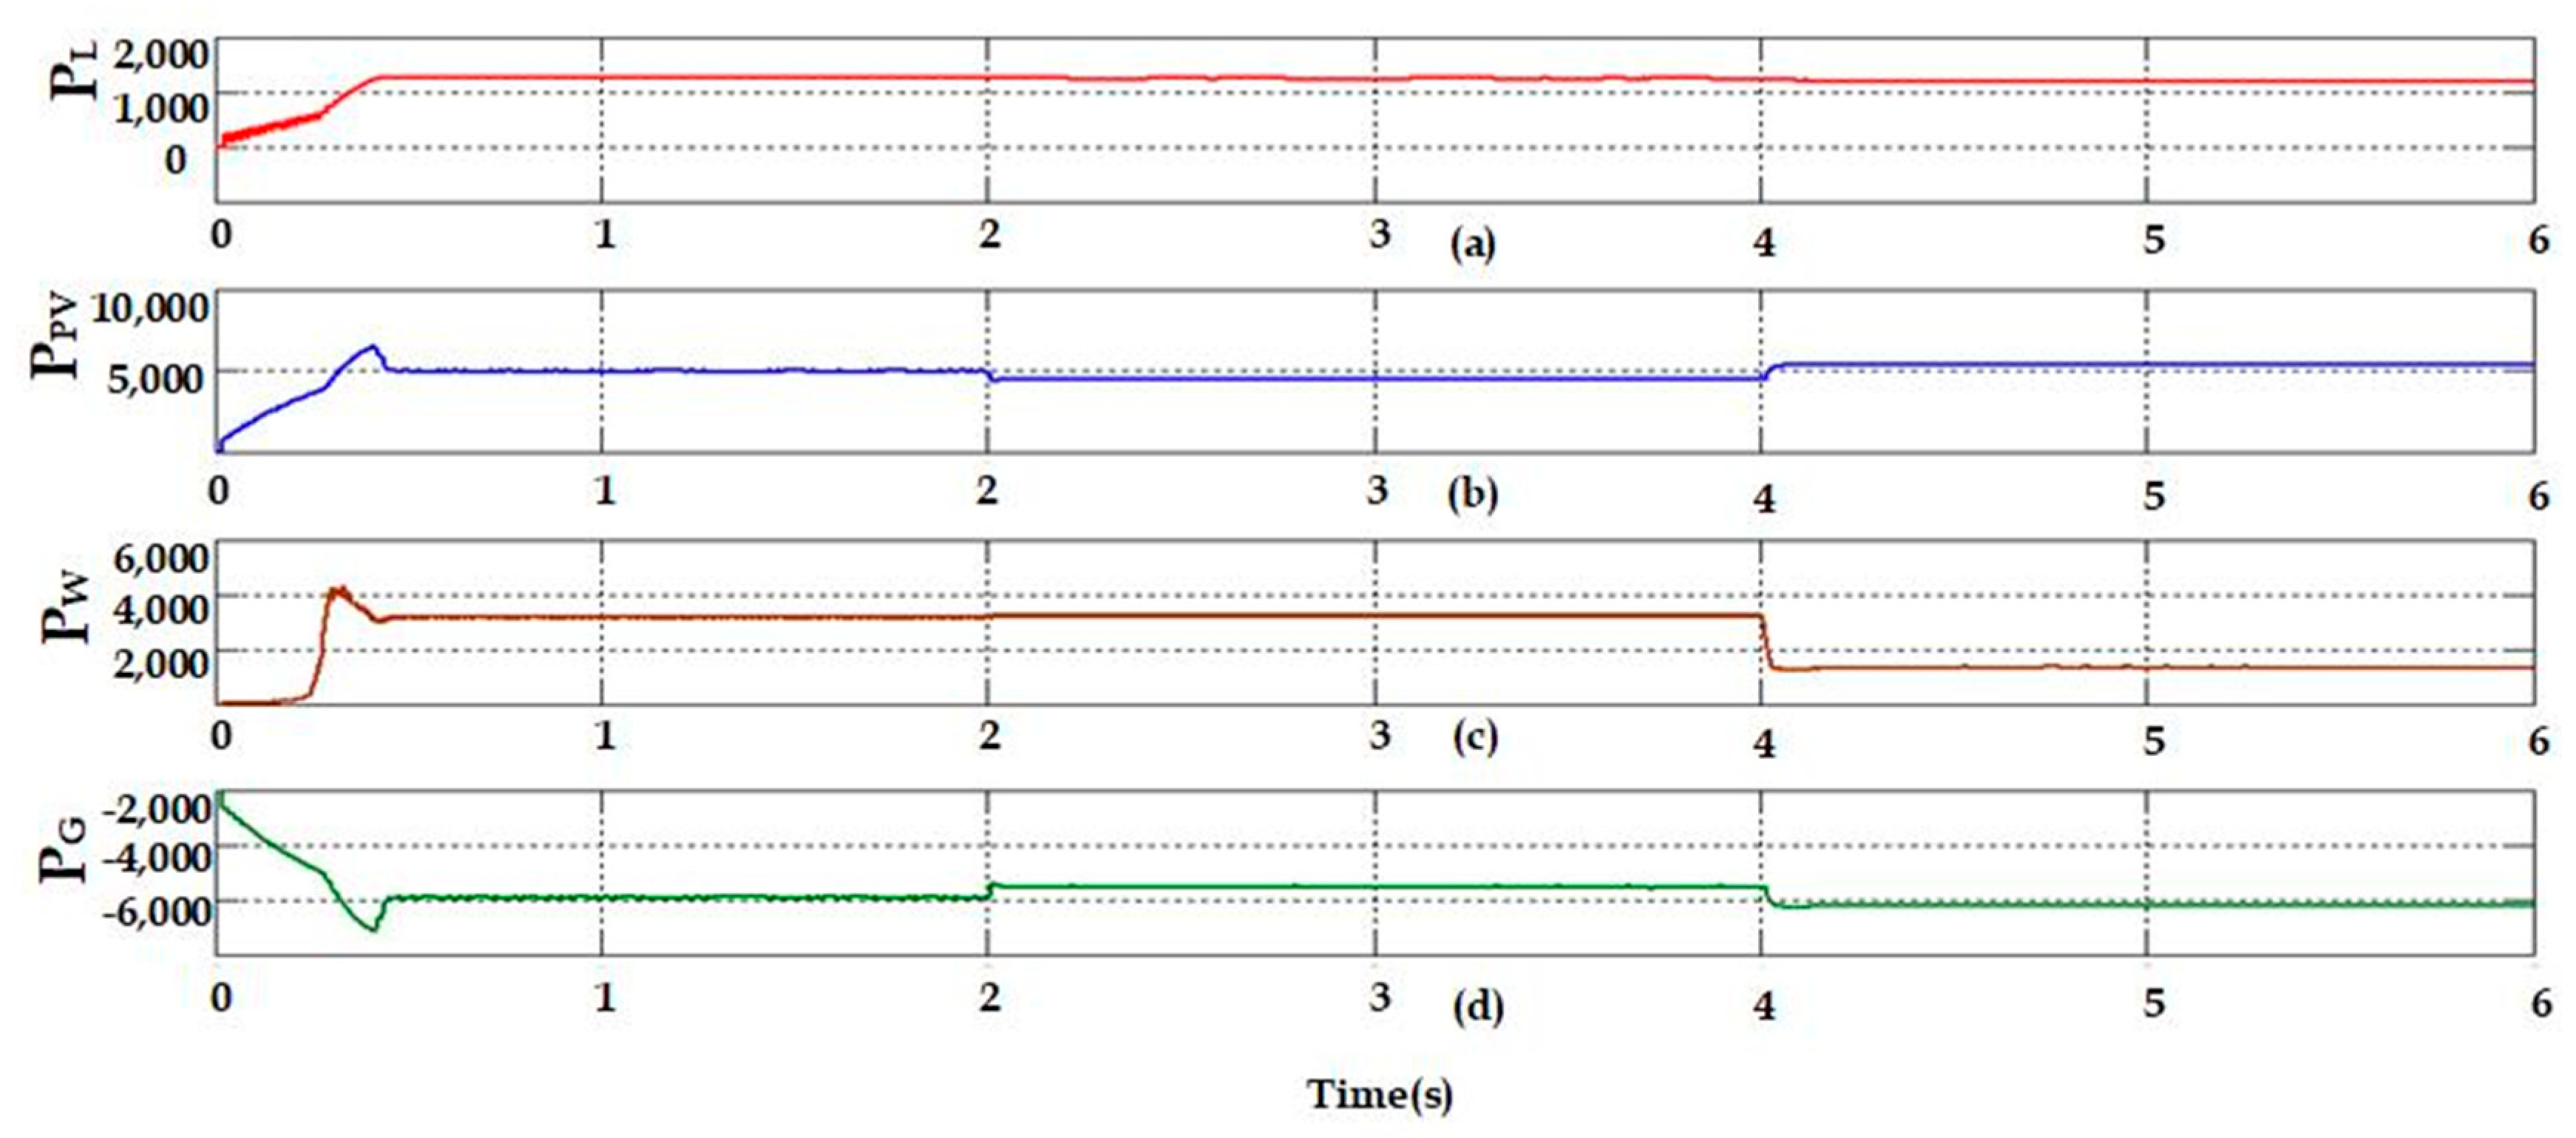
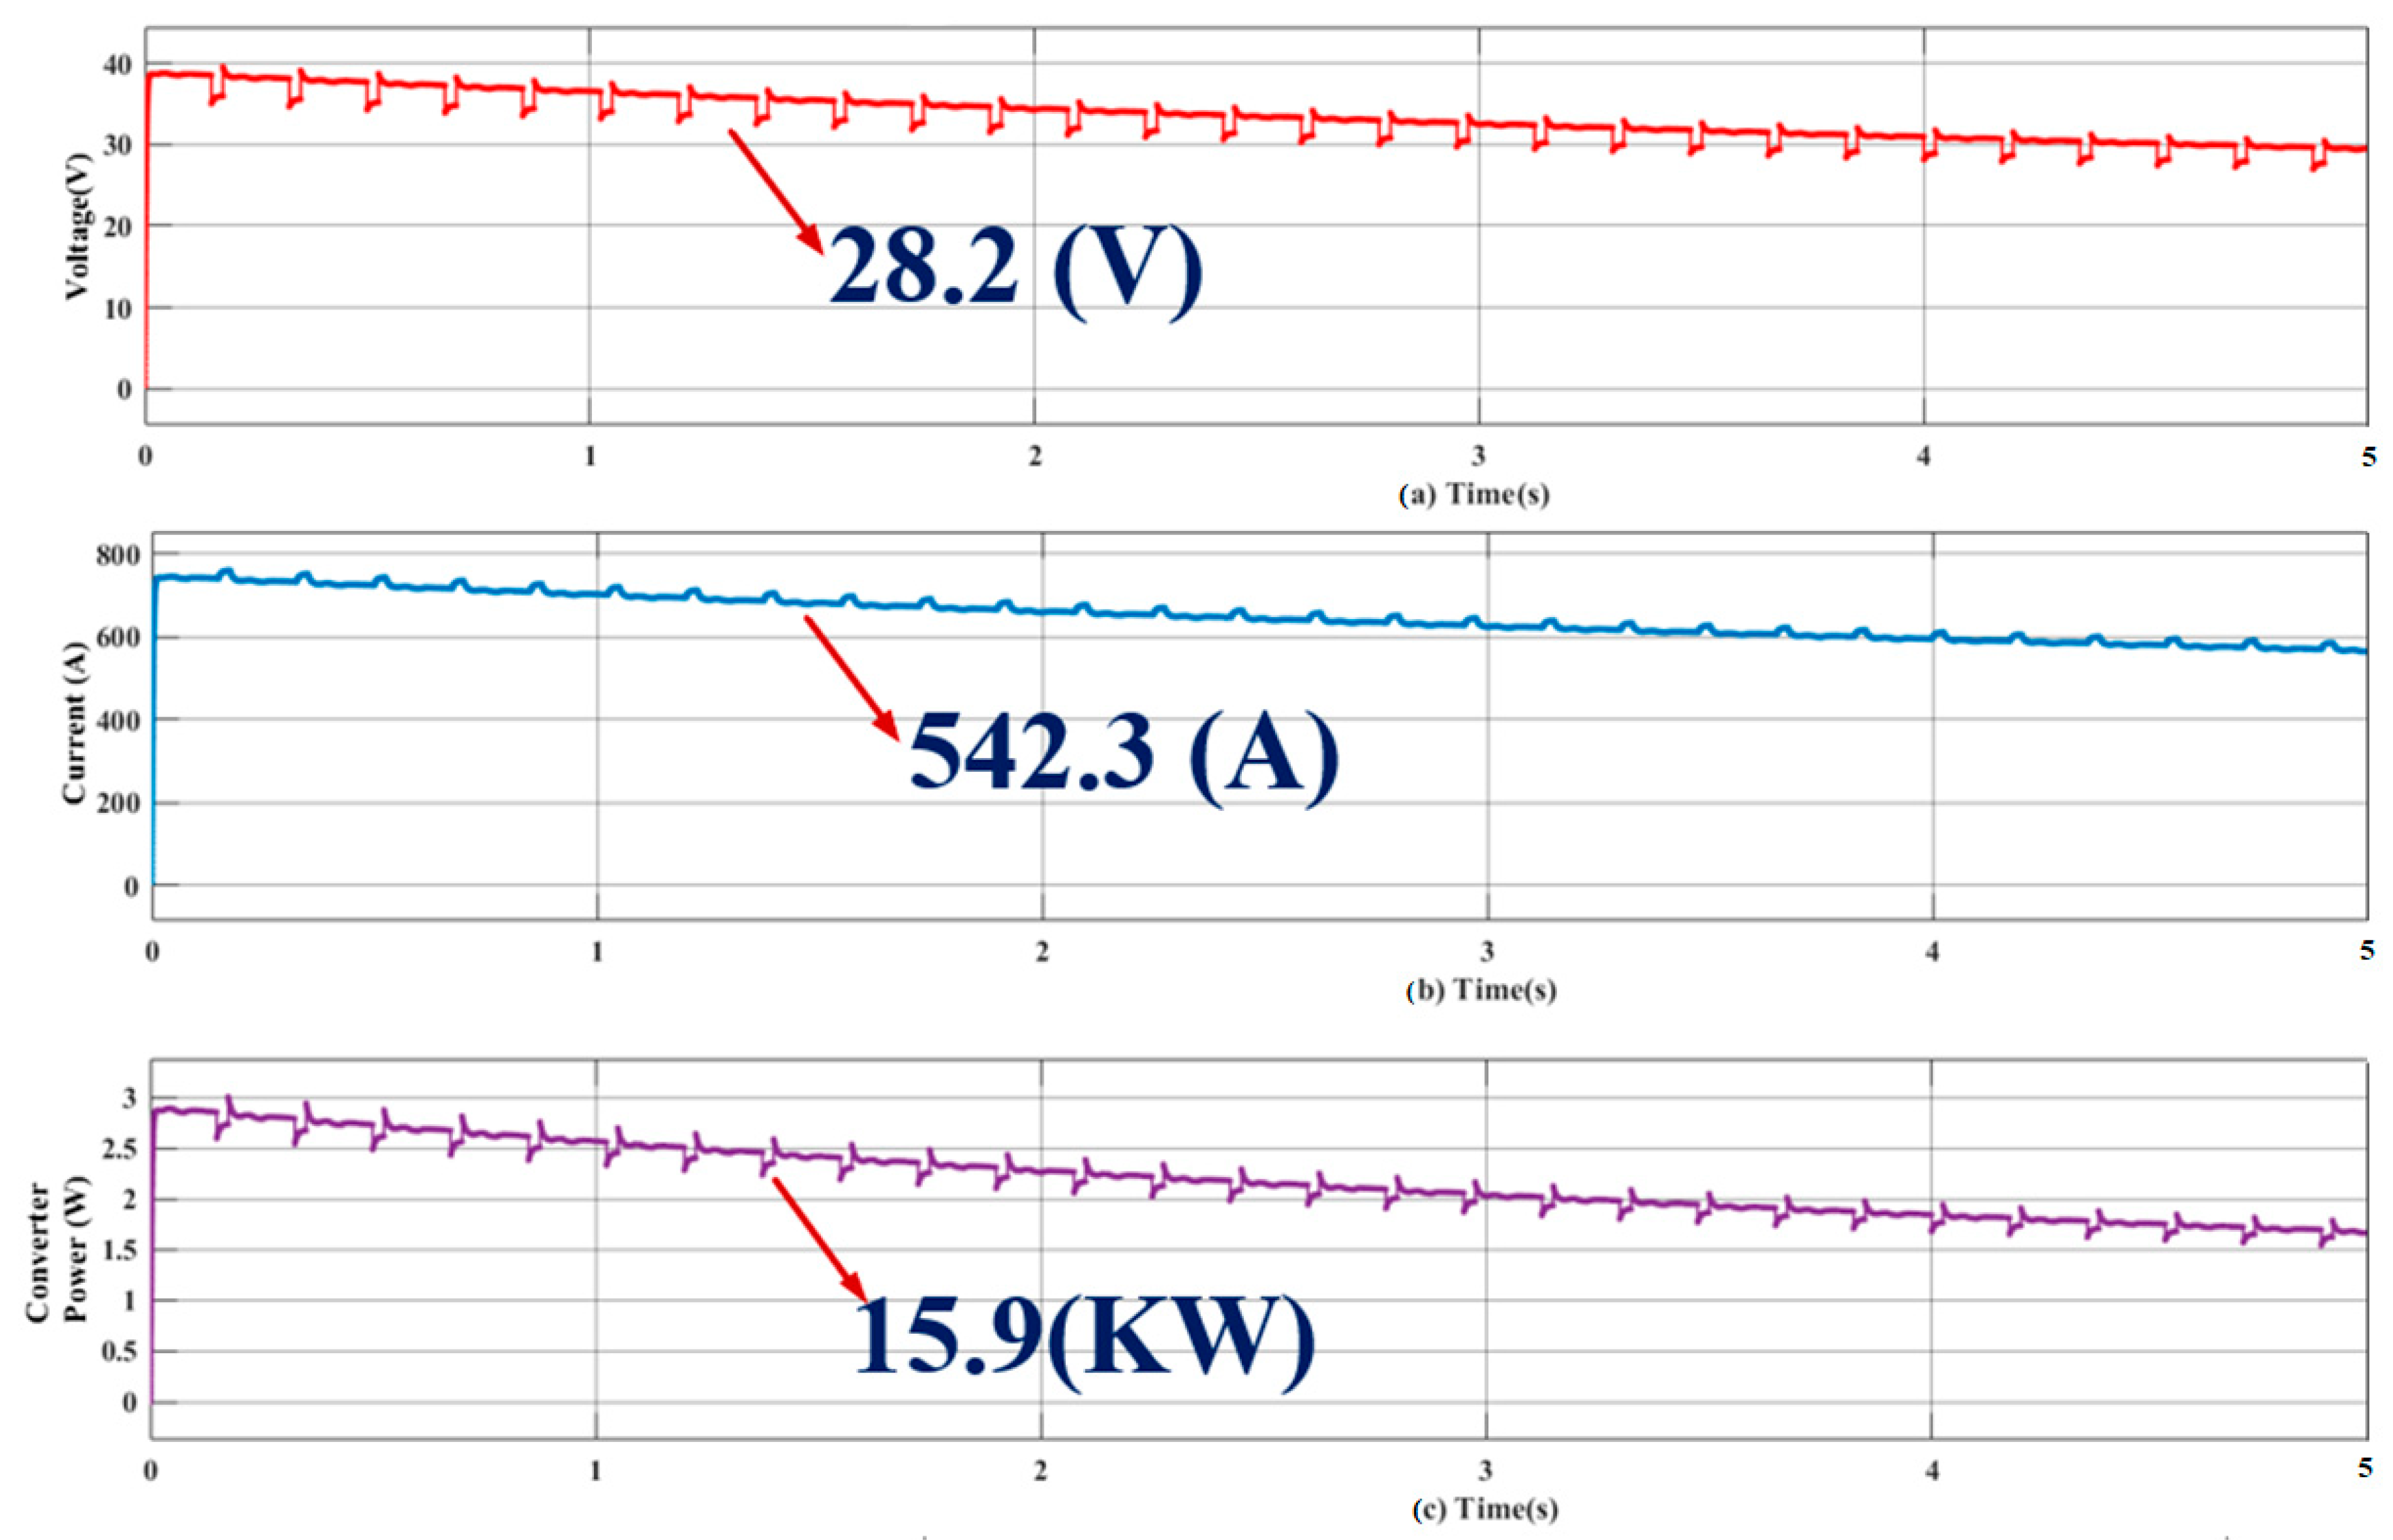
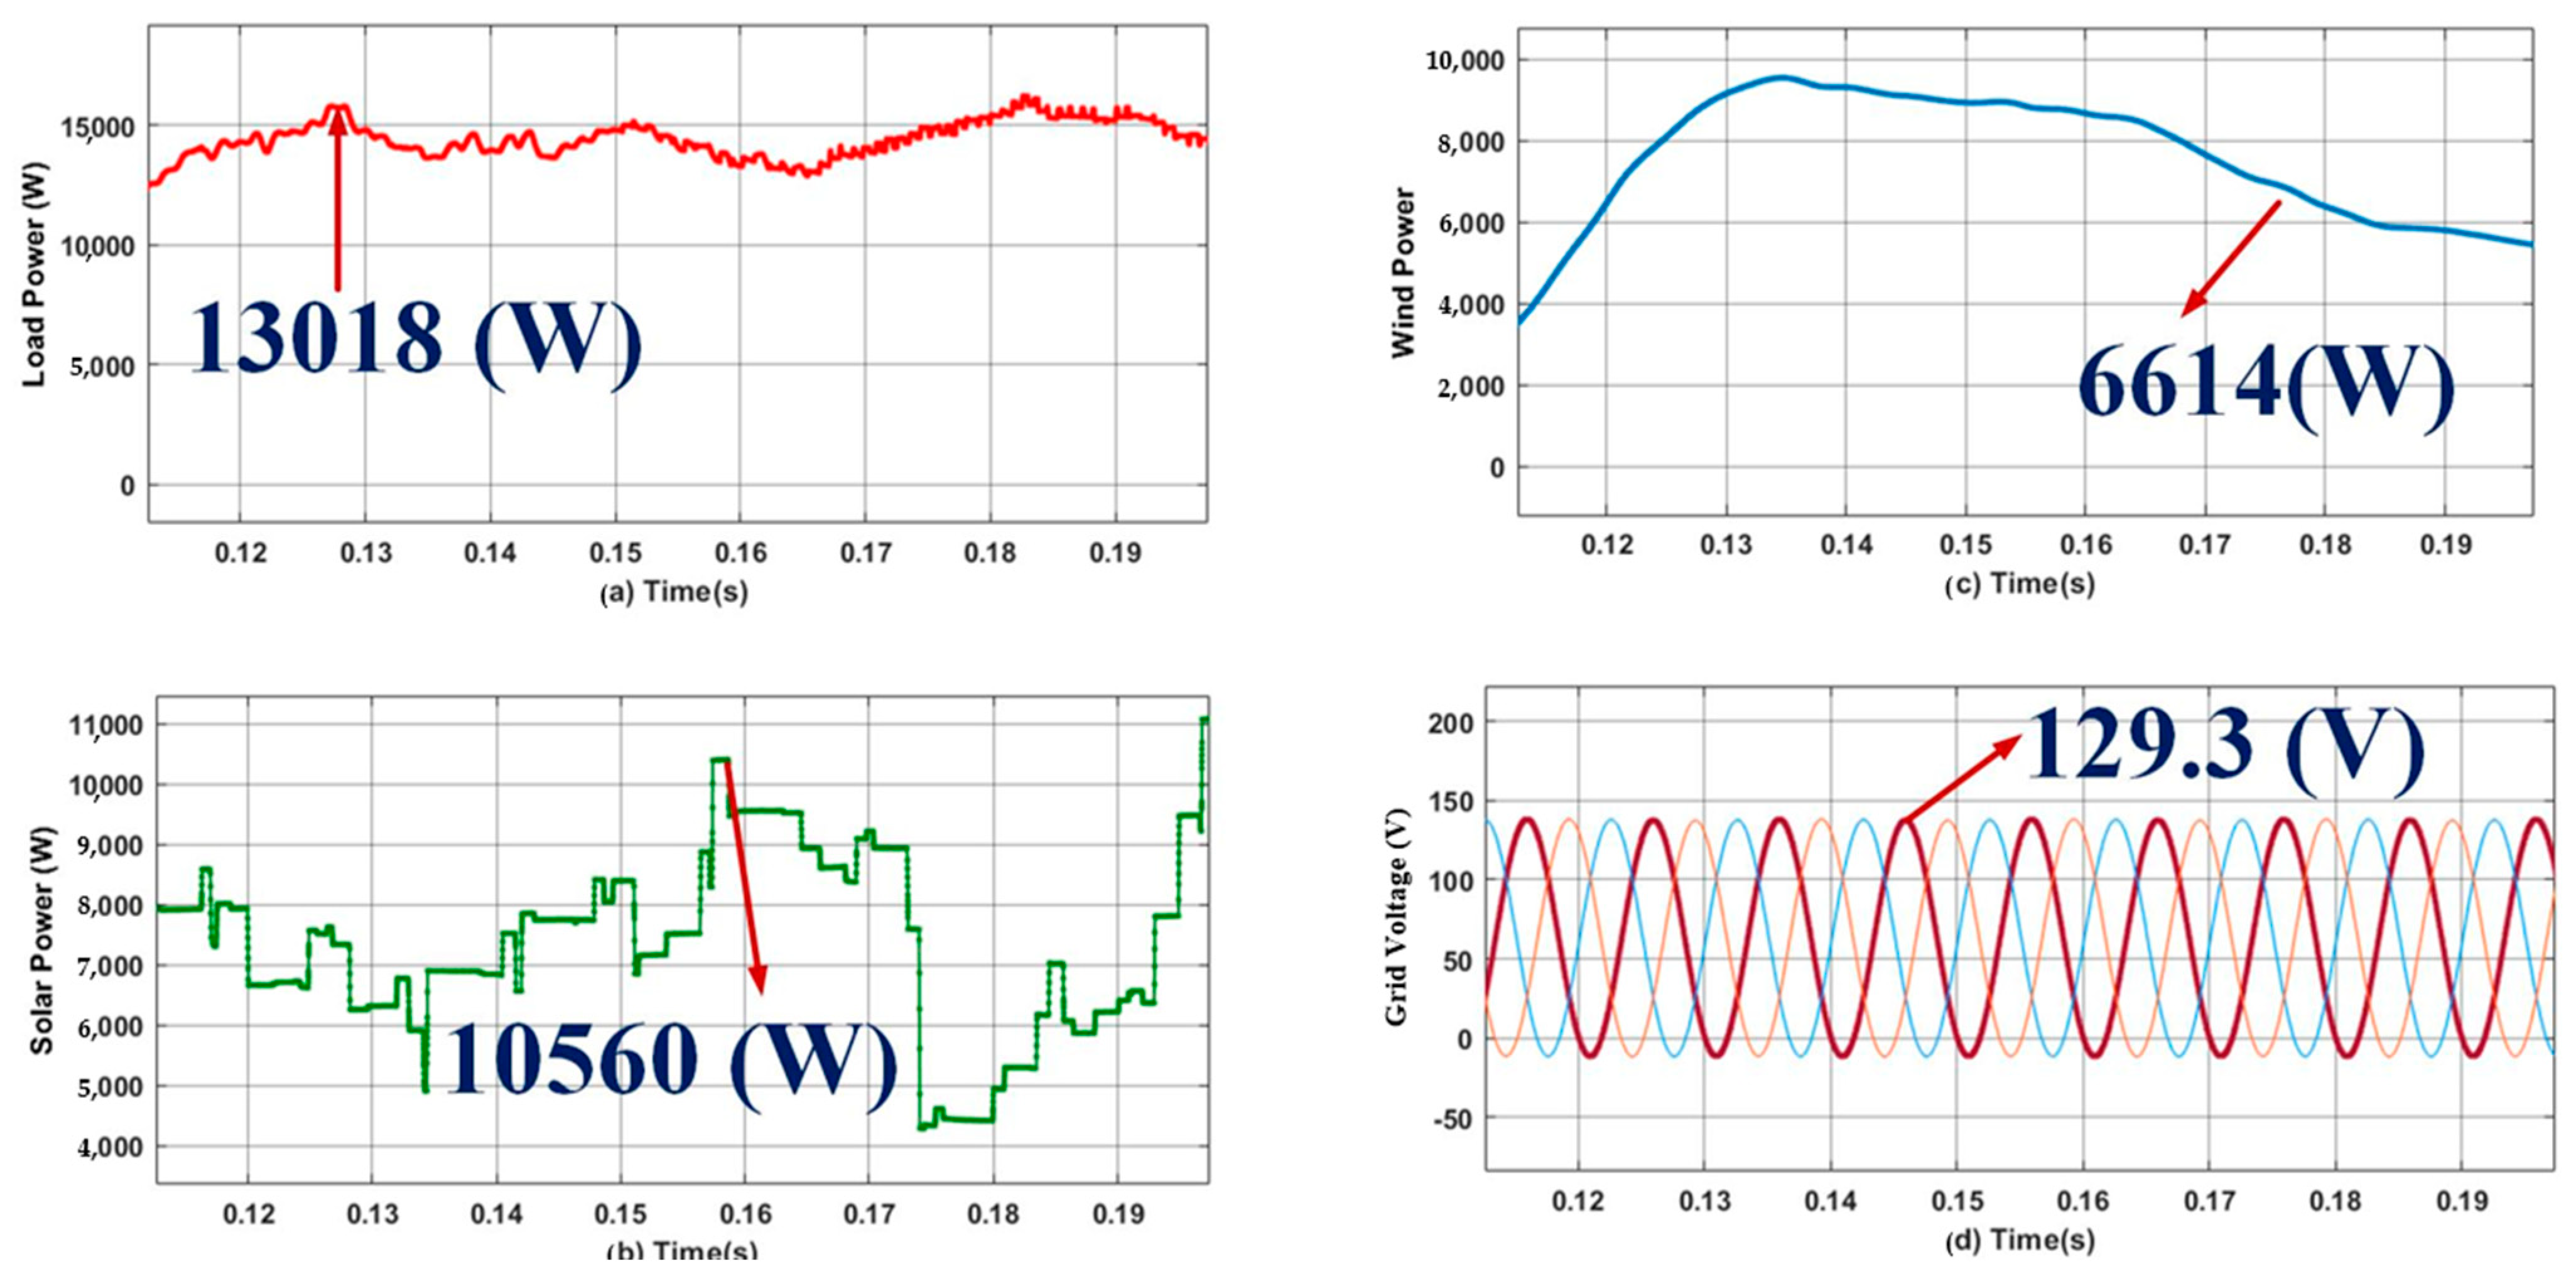
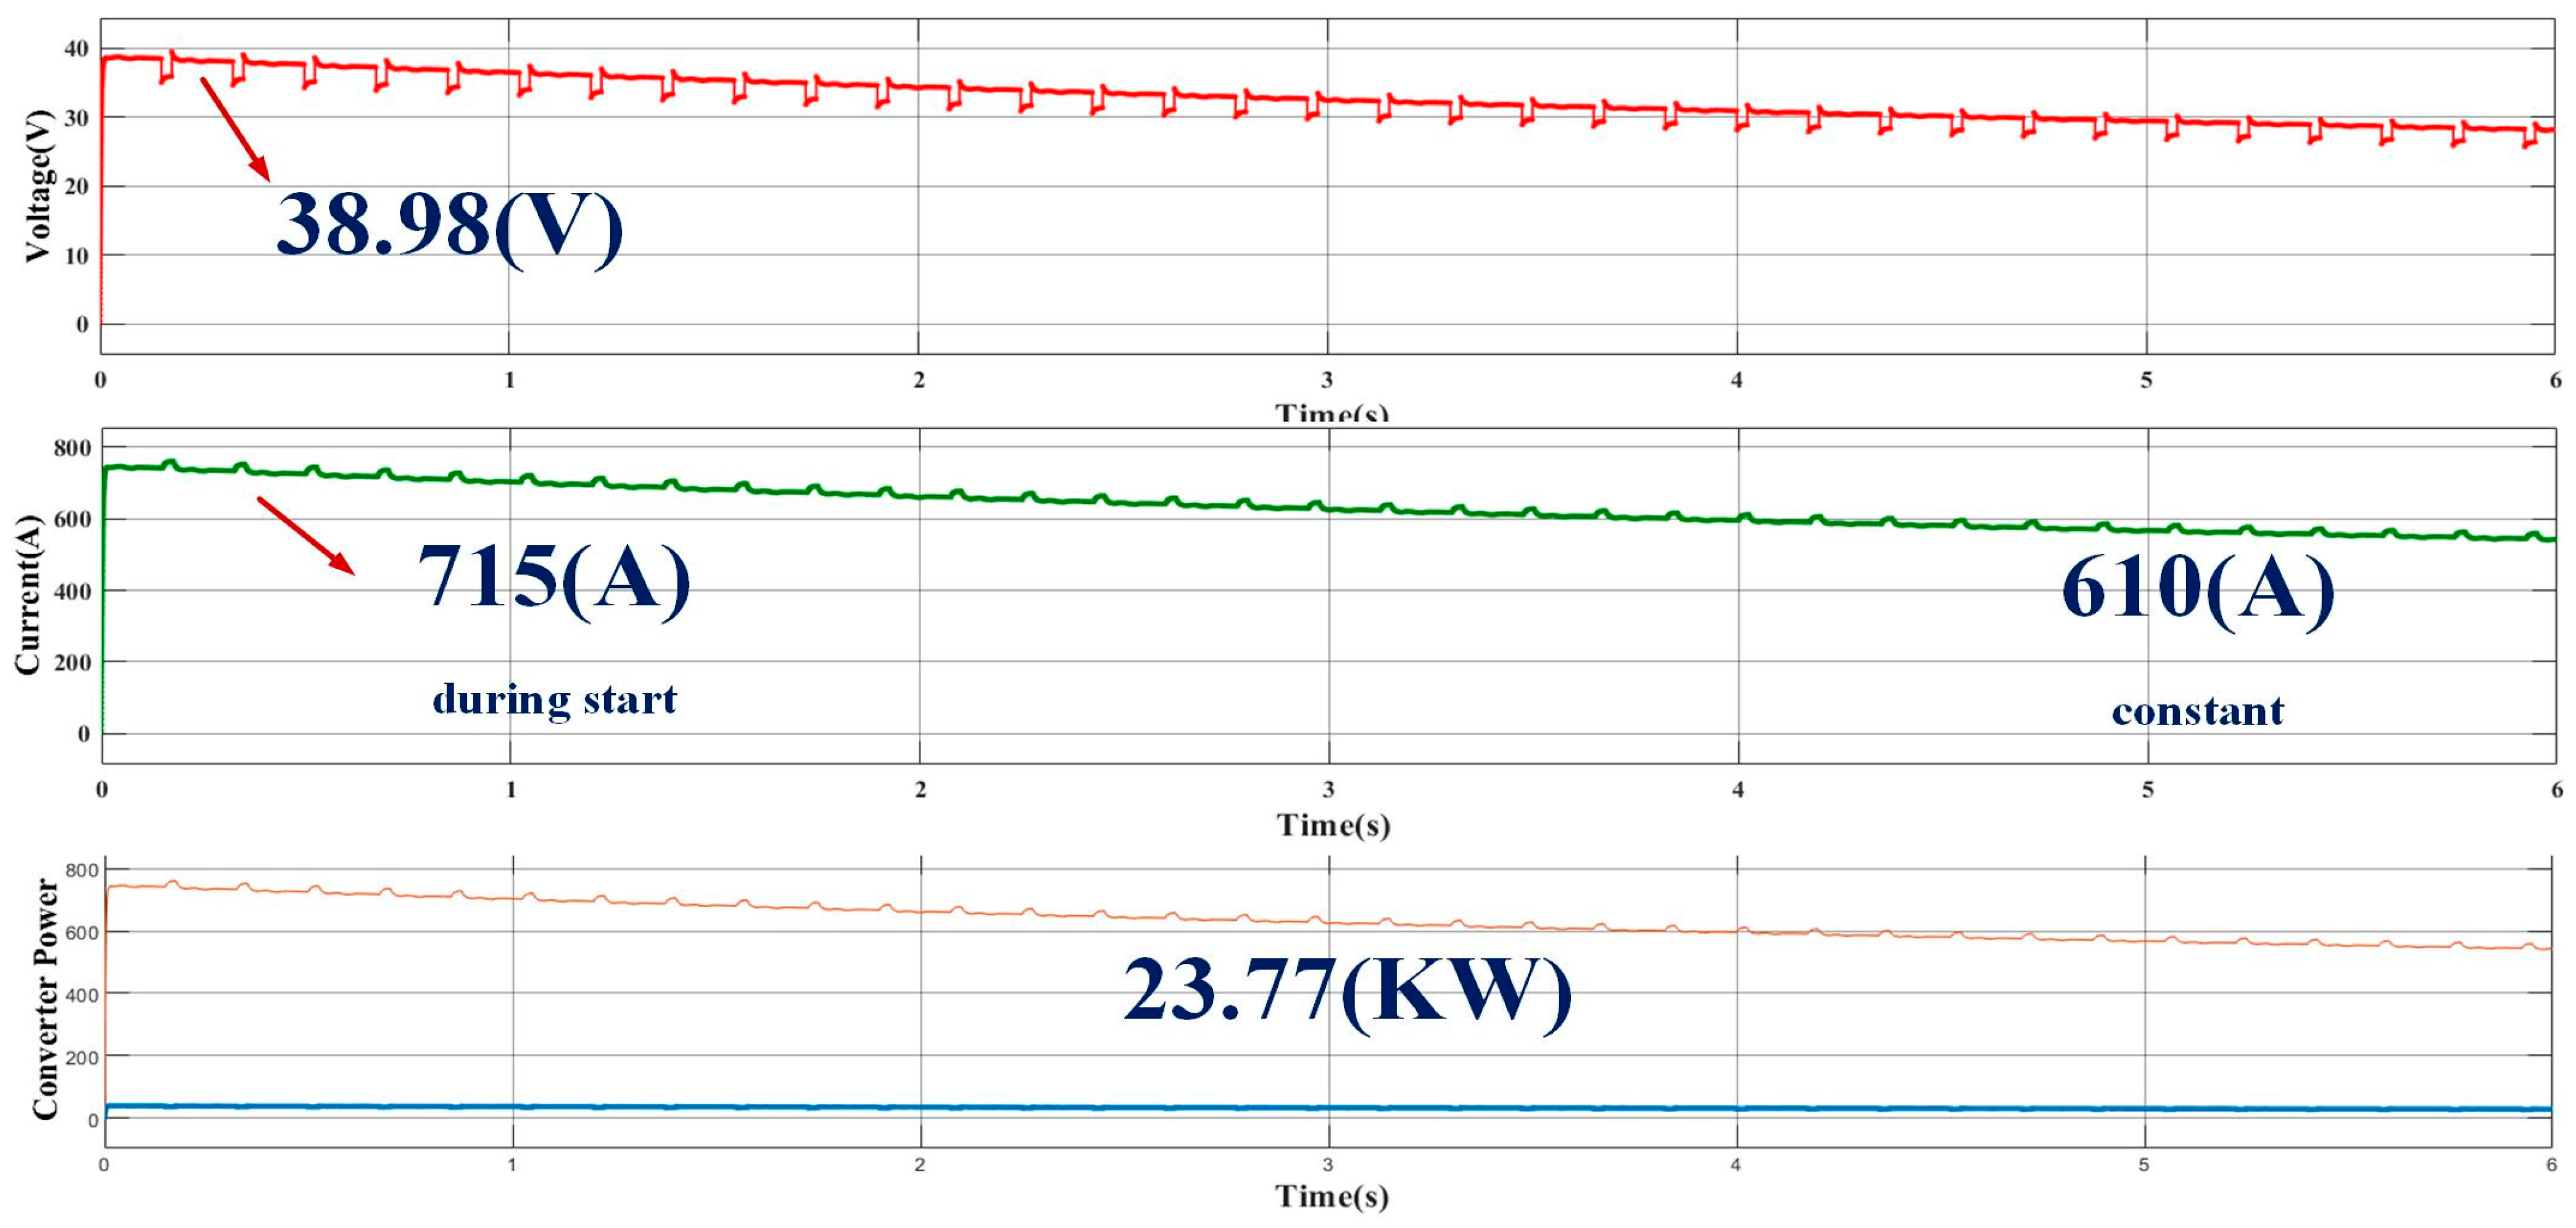
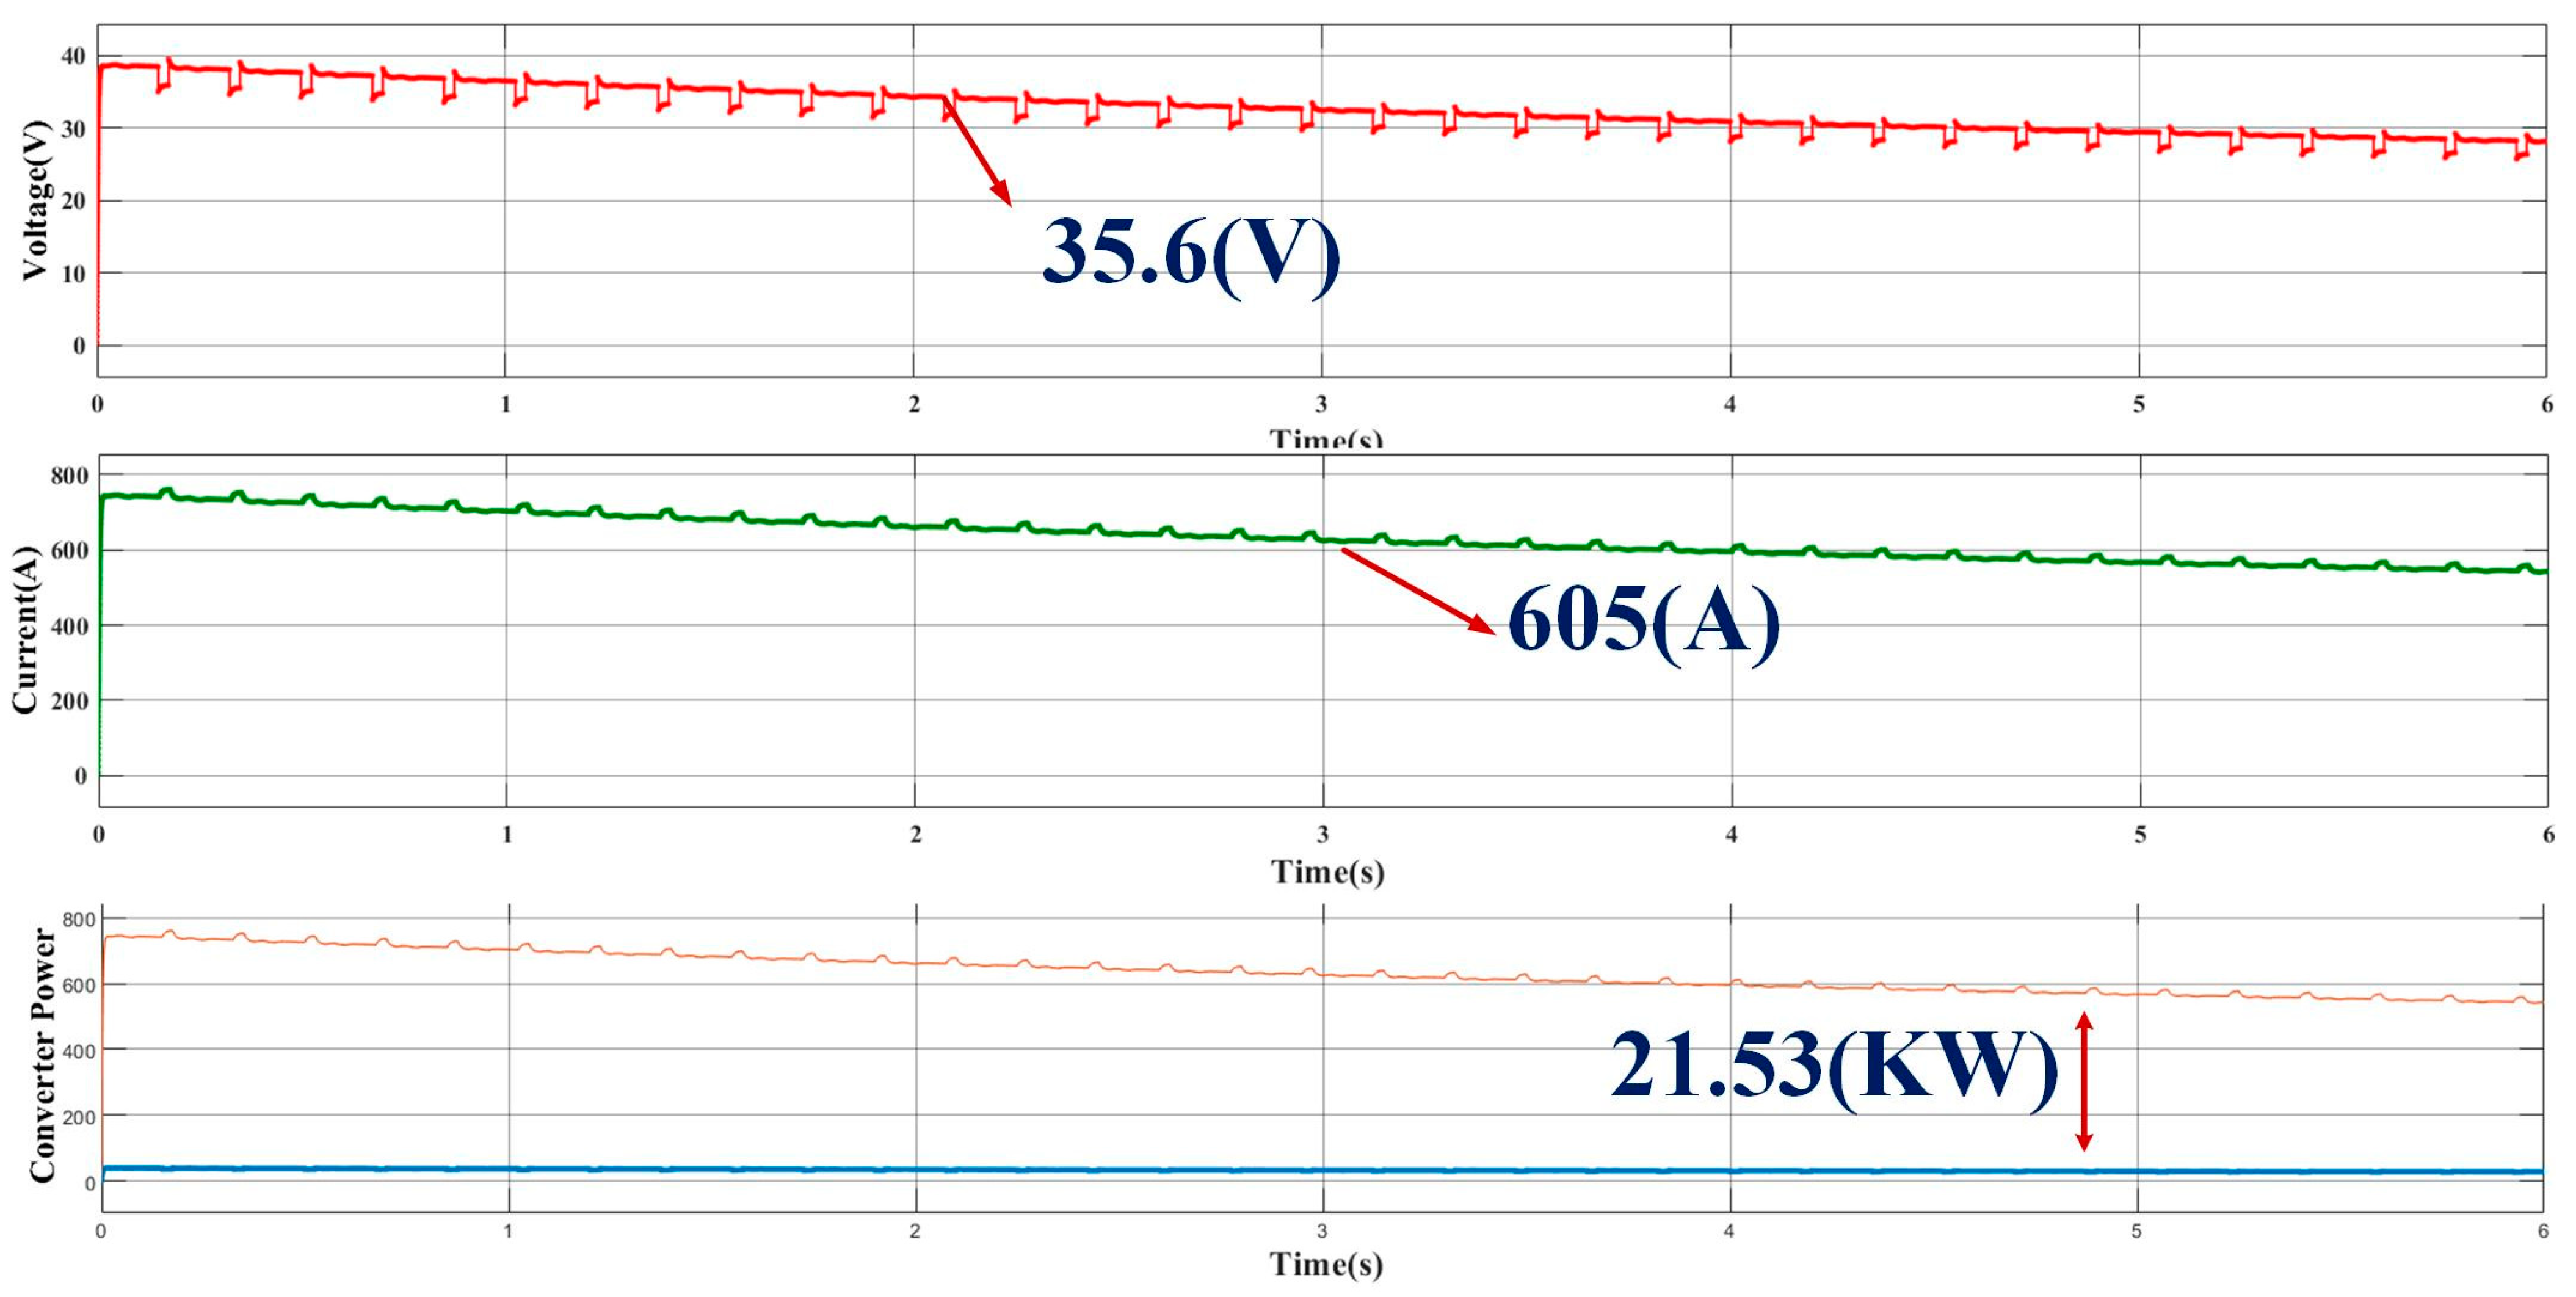
4.1.1. Analysis of Proposed Hybrid System Operated to Charge Two-Wheeler Electric Bike System

Here, two-wheeler (2W) model specifications are taken from [22] and listed in Table 3. The power required to drive the two-wheeler EV is taken from the hybrid source and the rest of the power is utilized to charge the battery storage system’s respective waveforms, which are displayed in Figure 14. The output voltage and current waveform of an FP-ICIBC are shown in Figure 15. Here, the converter’s objective is to maintain the EVs’ fast-charging capabilities in an unchanged manner. To achieve this, the converter must sustain high output currents (almost 700 A during start). A set of inductor parameters is examined to optimize the converter current, and the suggested controller also aids in ensuring the correct order of the switches in an IBC.
Figure 16 depicts the battery conditions for an EV in terms of the level of charge. In this, it takes 27 min to charge an electric vehicle’s battery to 60% of its initial capacity, 9 min to charge it to 90% of its capacity, and 18 min to finish charging it completely. The two-wheeler with a capacity of 3 kW requires 54 min to reach its full charge status while using this current.
An analysis of the proposed hybrid system operated to charge a three-wheeler electric auto system was carried out. Here, the source S-WHS generates the required energy to drive 4.4 kW 3-wheeler electric auto trucks with the help of the suggested converter. Performance graphs of the load and hybrid systems are displayed in Figure 17. These tests are typically carried out for continuous charging at a fixed charging rate. As found in [24], a model created by Bajaj RE electric auto-rickshaw serves as the basis for the specifications shown in Table 4, which are needed for an EV.
The converter parameters are shown in Figure 18 and represent the voltage and current values while operating an EV. If another EV is connected, then the converter current falls (to almost 520 A during starting). Inductors are employed to withstand and to optimize the performance of the converter for its full use and for fast-charging EV conditions.
Figure 18. FP-ICIBC operation when connected to 3 W. (a) Voltage (18.56 V) (b), current (356.9 A), and (c) converter output power (6.69 KW).The 4.3 KW electric auto-rickshaw takes roughly 1 h 15.3 min to complete its full charge. Battery conditions in terms of charge are mentioned here. To reach 60% of the battery level, it takes 40.2 min, and from 60 to 90% level of charge, it takes 20.1 min. The full charge is completed within 15 min, which is shown in Figure 19.
Energies 17 02277 g018
Figure 19. Three-wheeler EV battery charging conditions.
Energies 17 02277 g019

4.1.2. Analysis of Proposed Hybrid System Operated to Charge Four-Wheeler Electric Car System

Here, the recommended converter uses the S-WHS as a source to produce the necessary energy to power the four-wheeler EV. The required specifications are mentioned in Table 5 taken from [25] and their performance graphs for the load and hybrid systems are mentioned in Figure 20.
The output voltage and current waveform of the proposed converter are shown in Figure 21. During the operation of an EV, if suddenly a four-wheeler is connected, then the converter generates an output current (of almost 540 A) to withstand and optimize a suitable inductor. The controlling technique also aids the correct order of the switches in an interleaved DC–DC converter.
The 4.8 KW 4-wheeler EV requires 1 h and 43 min to reach its full charge condition. Figure 22 depicts the battery conditions for an electric car. In terms of the level of charge, to charge 60% of the battery, the time taken is about 55 min. To further charge from 60 to 90%, it took 26 min. Finally, within 22 min it attained its full charge.

4.1.3. Analysis of Proposed Hybrid System Operated to Charge Multiple Vehicles at a Time

Here, multiple electric vehicles are being charged simultaneously at a specially designed charging point. We use the examples of two-wheelers, three-wheelers, and four-wheelers. Table 4, Table 5 and Table 6 display the parameters of three different types of electric vehicles. The waveforms in Figure 23 represent the charging circumstances and converter simulation outcomes. The proposed converter’s output waveform for voltage and current is depicted in Figure 24. Here, the converter’s objective is to keep EVs’ quick charging capabilities maintained. This may be achieved by keeping the converter’s high output currents (almost 610 A) constant. All three electric vehicles are seen as charging simultaneously in this situation.
Analysis of the proposed hybrid system operated to charge multiple vehicles with mixed combinations. In this case, it is proposed to use a hybrid system to charge a variety of electric vehicles at various times during time intervals: from t = (0–4), a set of 2 W and 3 W; from time interval t = (4–8) a combination of 3 W and 4 W; from time instant t = (8–12), 4 W and 2 W; and during time t = (12–16), all 3 sets of electric vehicles are connected. In these conditions, the proposed converter efficiency is noted and the load conditions S-WHS are presented in Figure 25. Due to sudden load deposition, there is a slight change in the converter waveforms, which is shown in Figure 26.
The proposed converter is contrasted with the current converter topologies presented in Table 6 and Table 7. In order to explicitly validate the FP-ICIBC, based on the output power availability, a total of three converters can be developed for CS. For simplicity, only one converter specification is considered, and the comparison results demonstrate that the proposed converter performs better than the existing converter, with an efficiency of 97.02%. Figure 27a,b represents the time taken to charge the EV loads when connected to different existing converters and proves that the proposed FP-ICIBC is efficient among them.

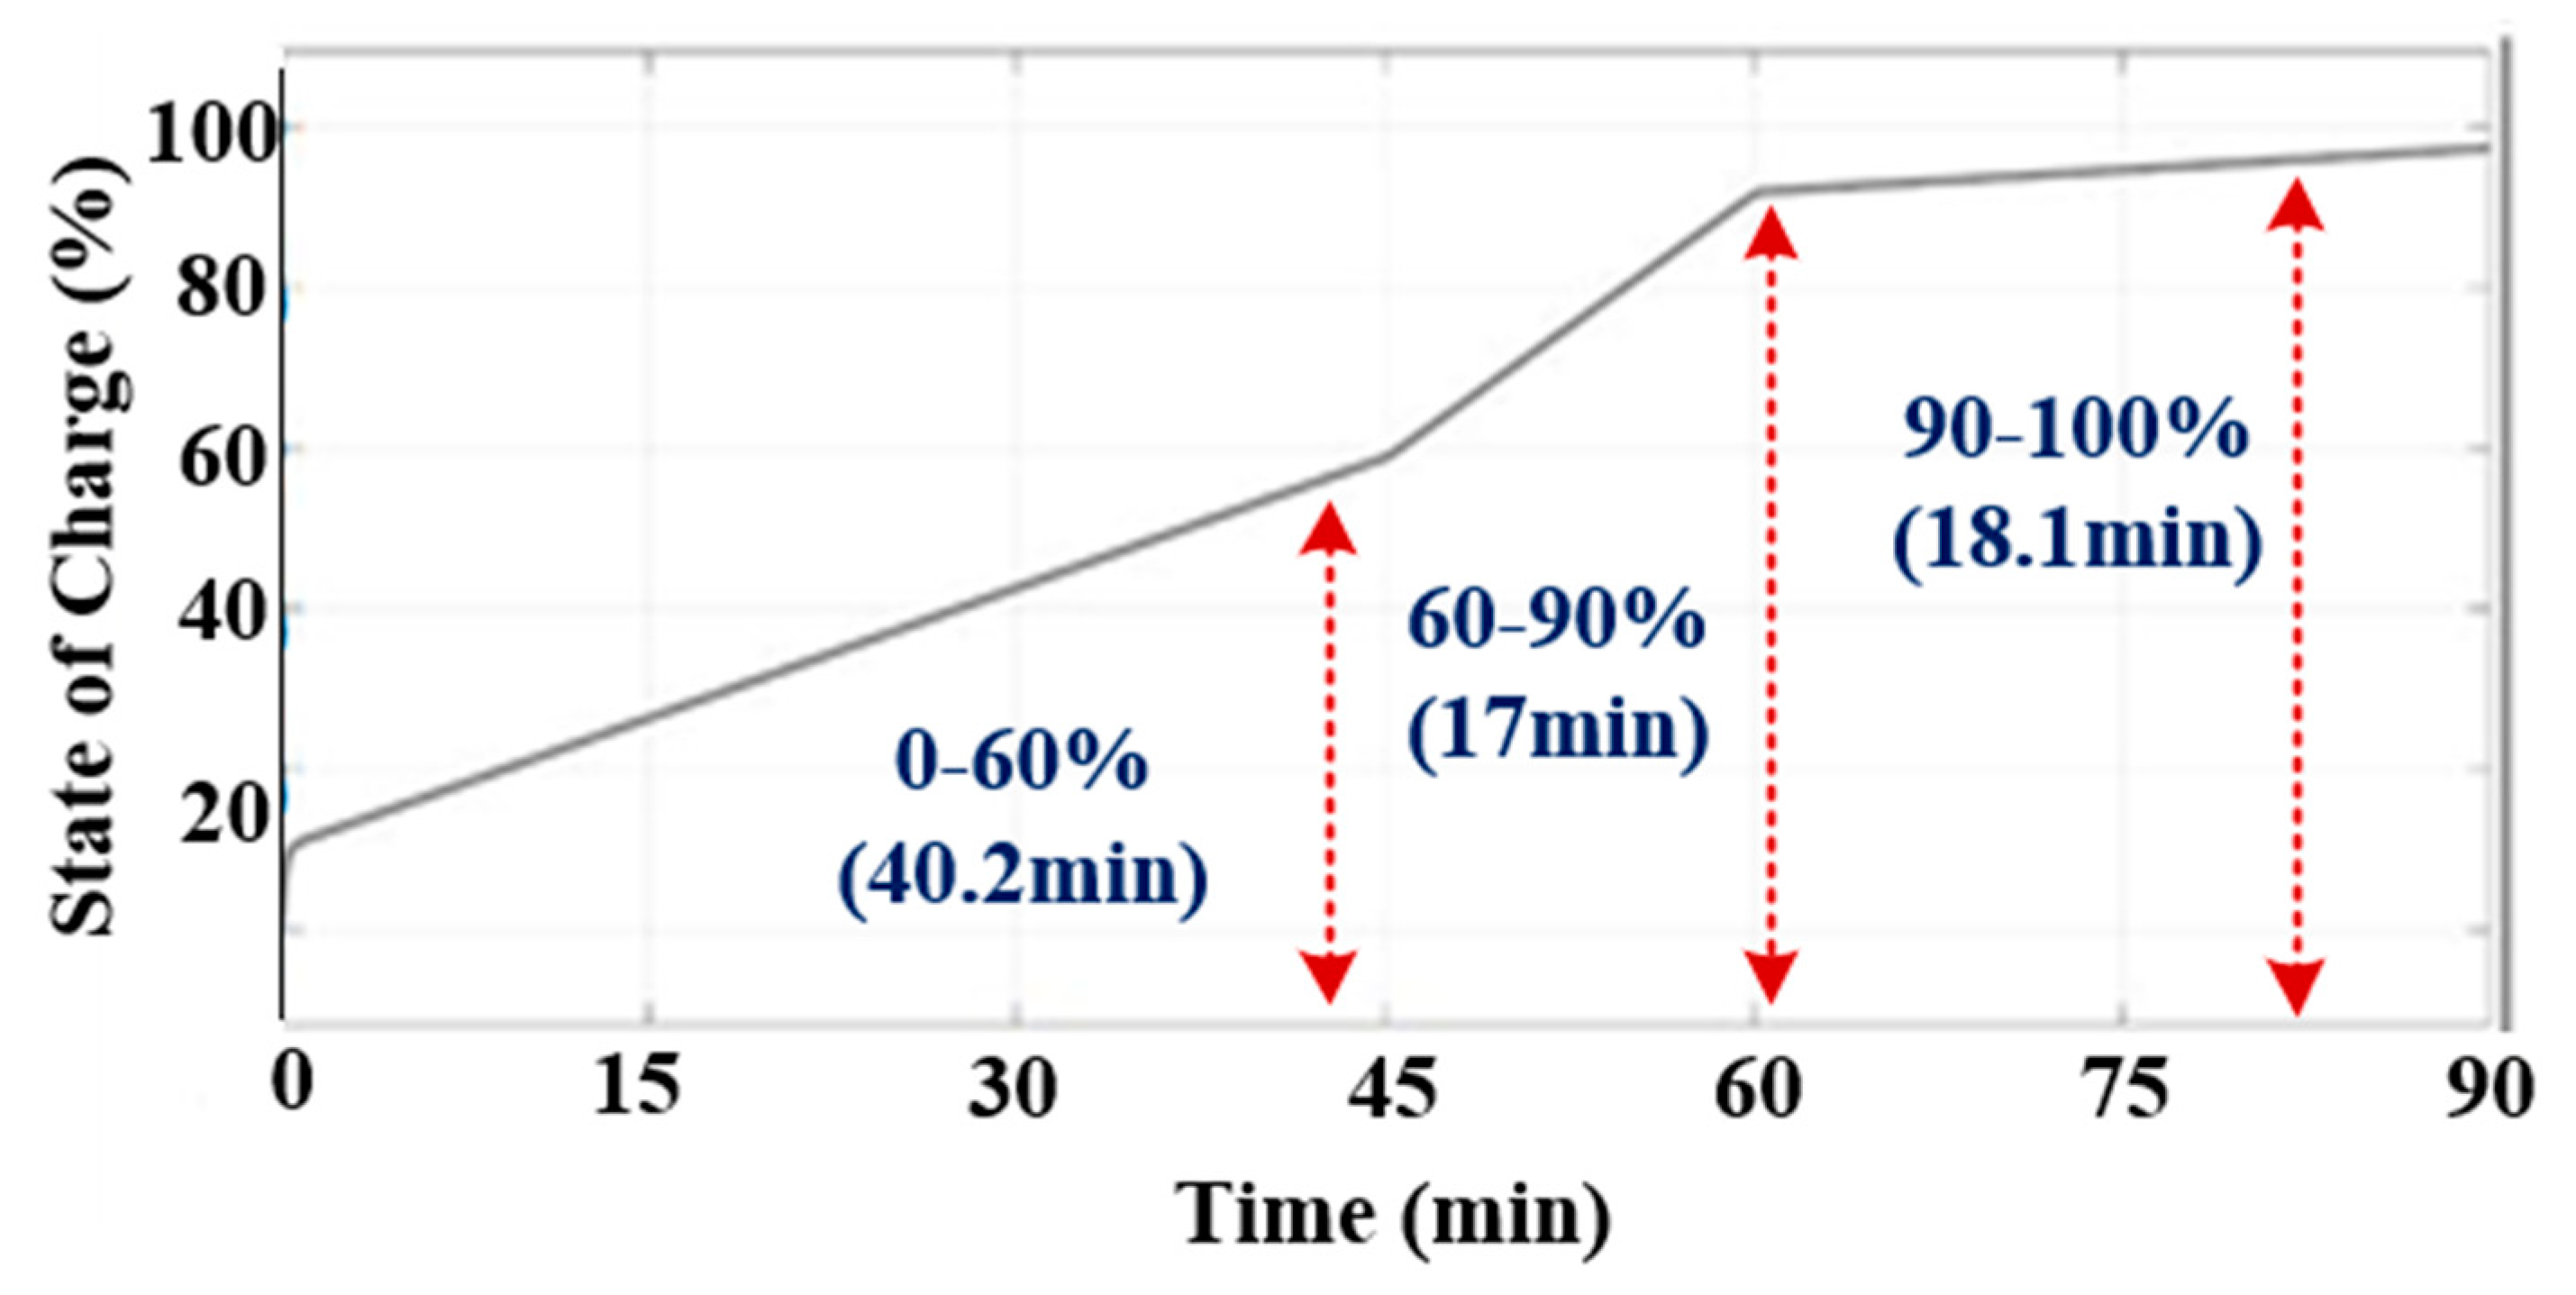
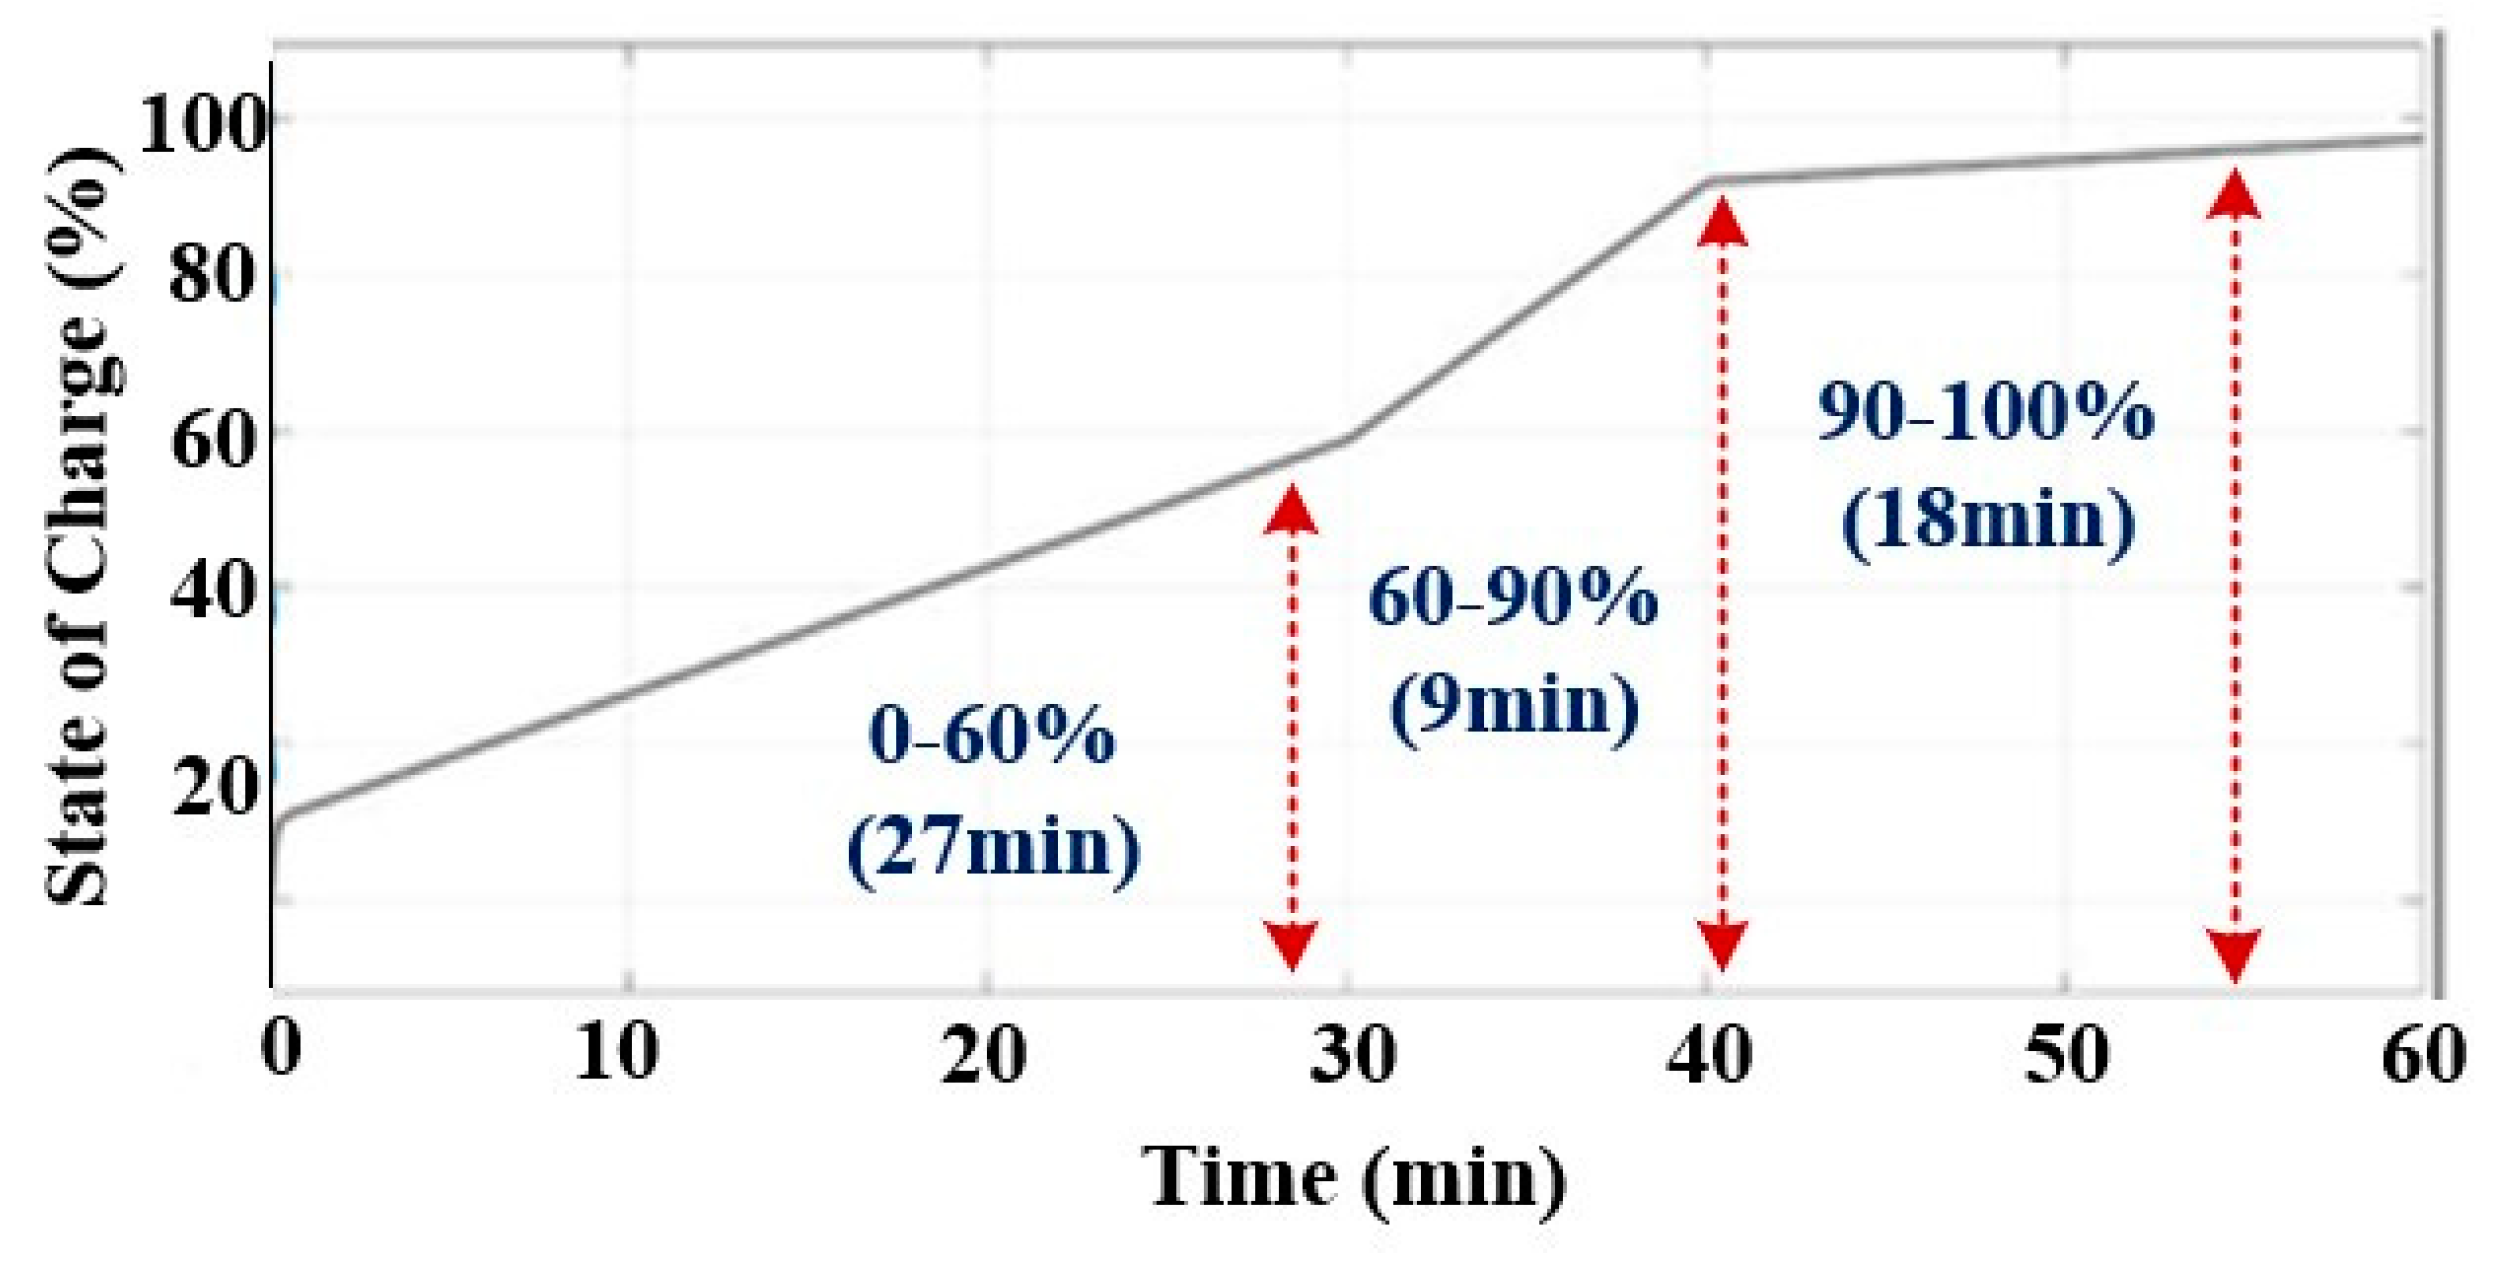
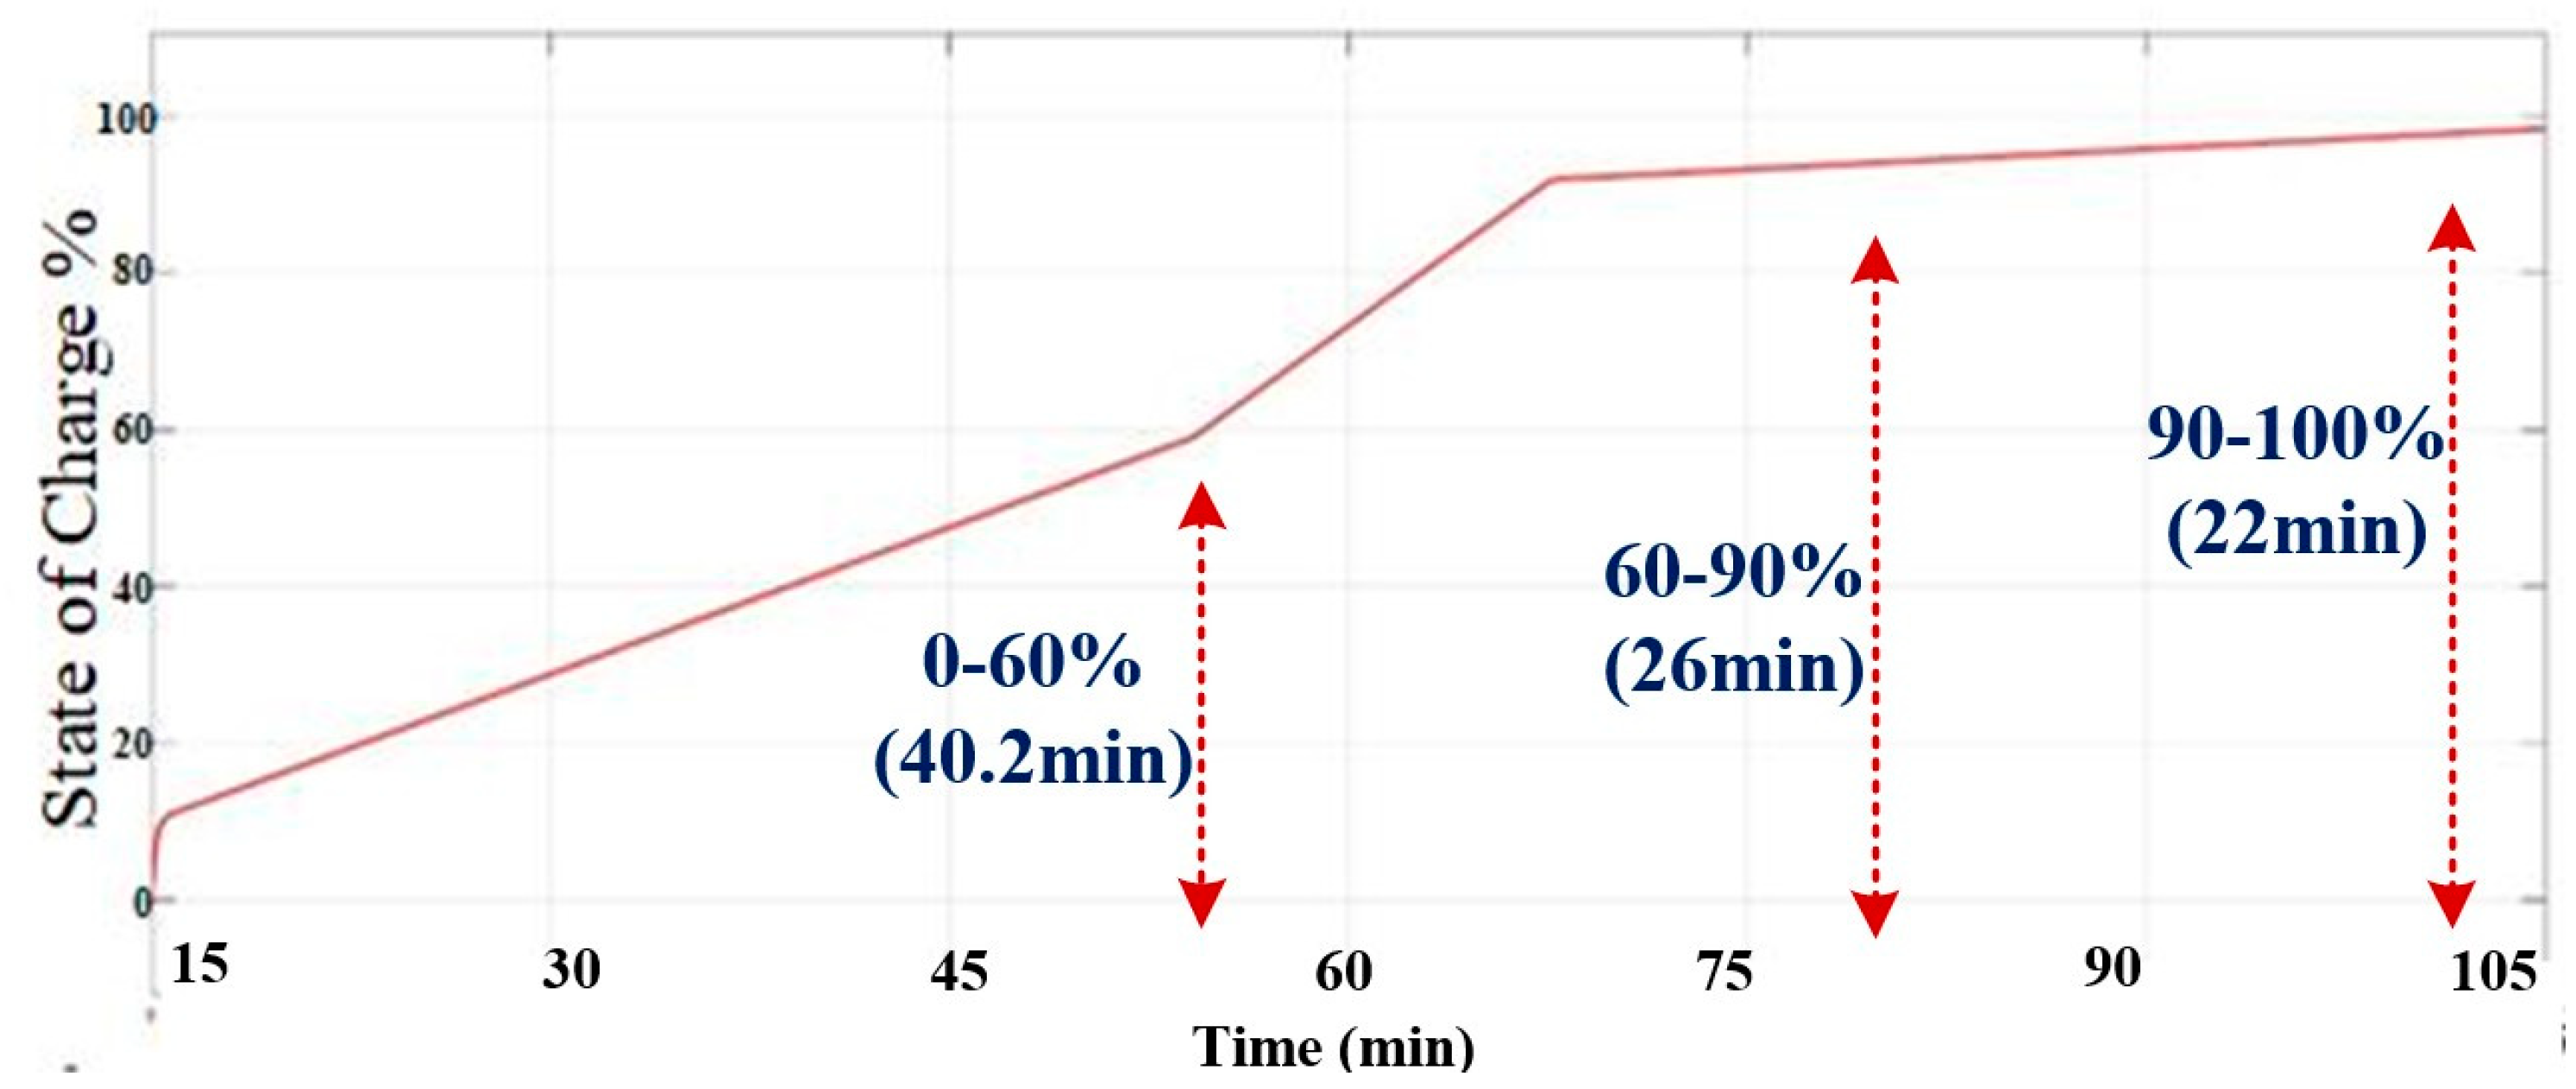
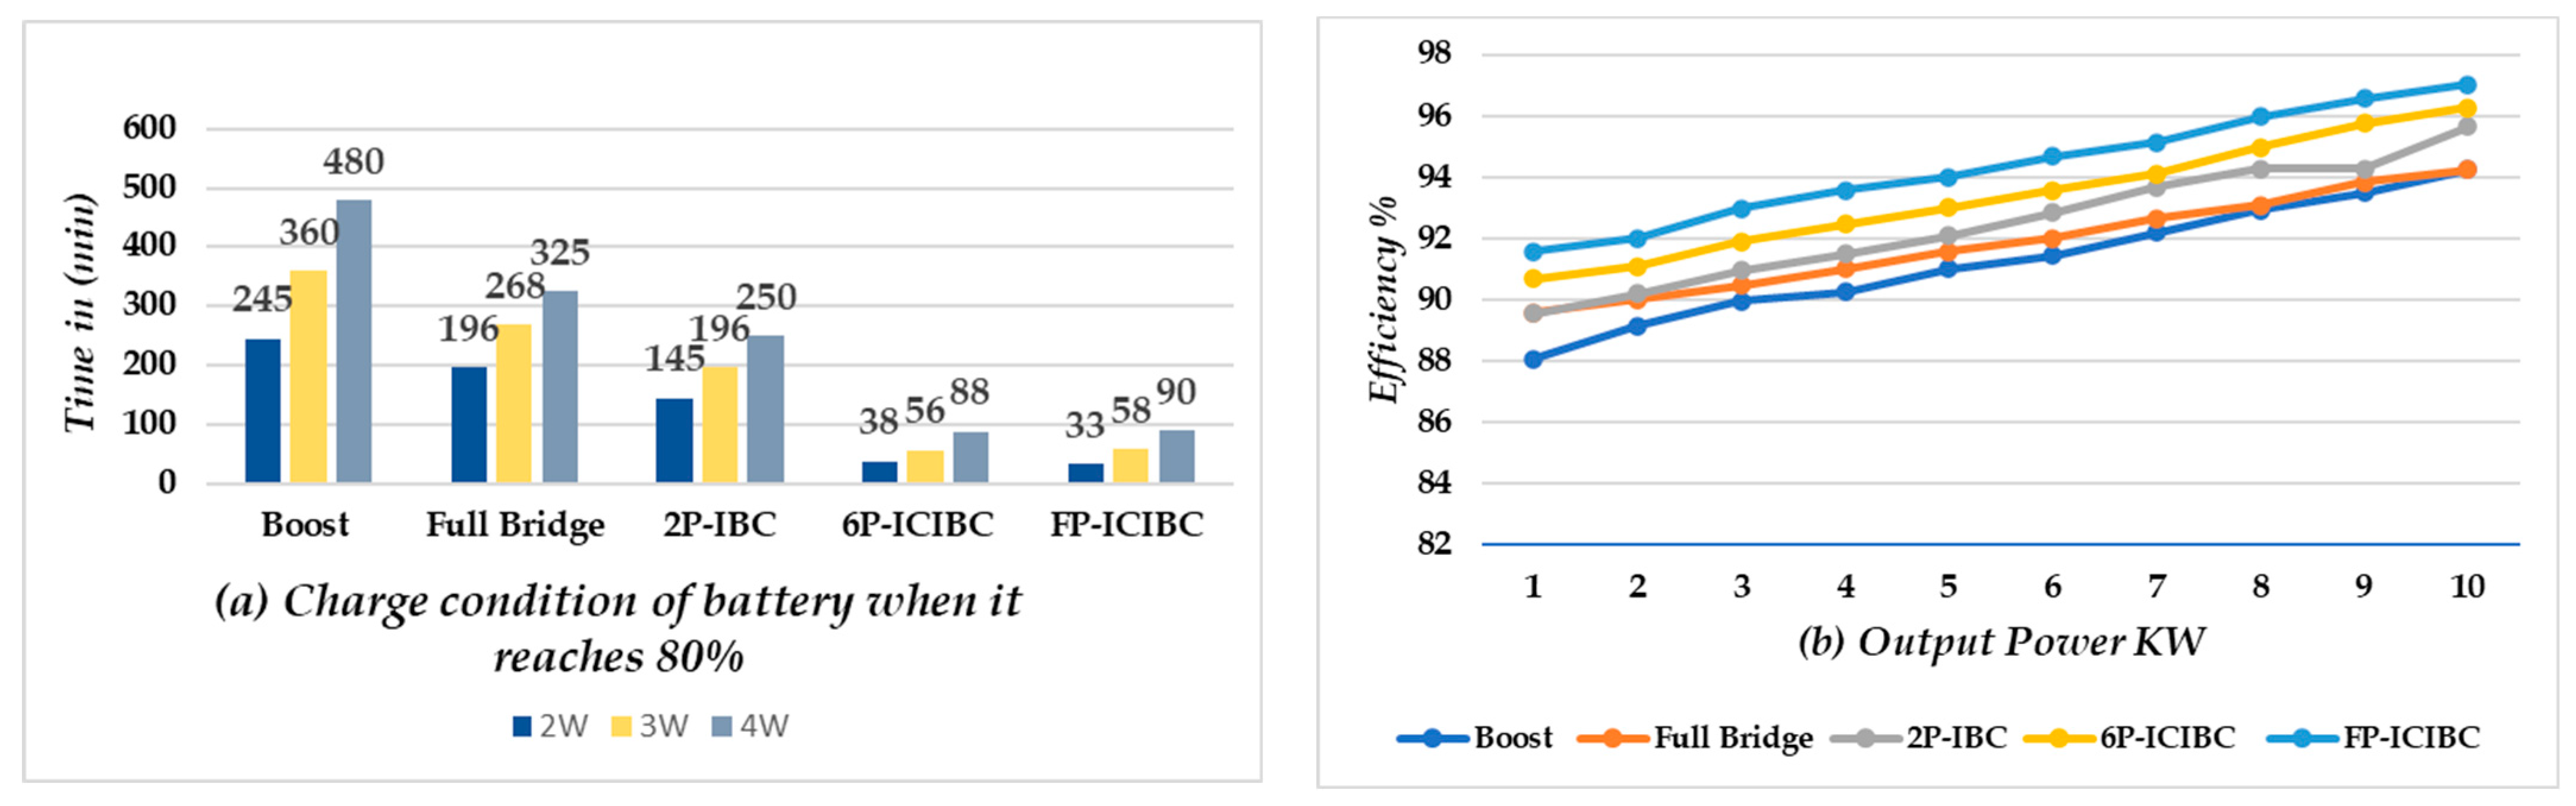
4.2. Mathematical Model Analysis for EV Charging Rate

This section presents the mathematical model analysis for identifying the charging time for electric vehicles expressed in Equation (26).
Charging   Time = Battery   Capacity × ( Target   Charge   Level Current   Charge   Level ) Acceptance   Rate   ×   0.9
C h a r g i n g   t i m e = E V   c h a r g e r   p o w e r   r a t i n g × V o l t a g e 100 .

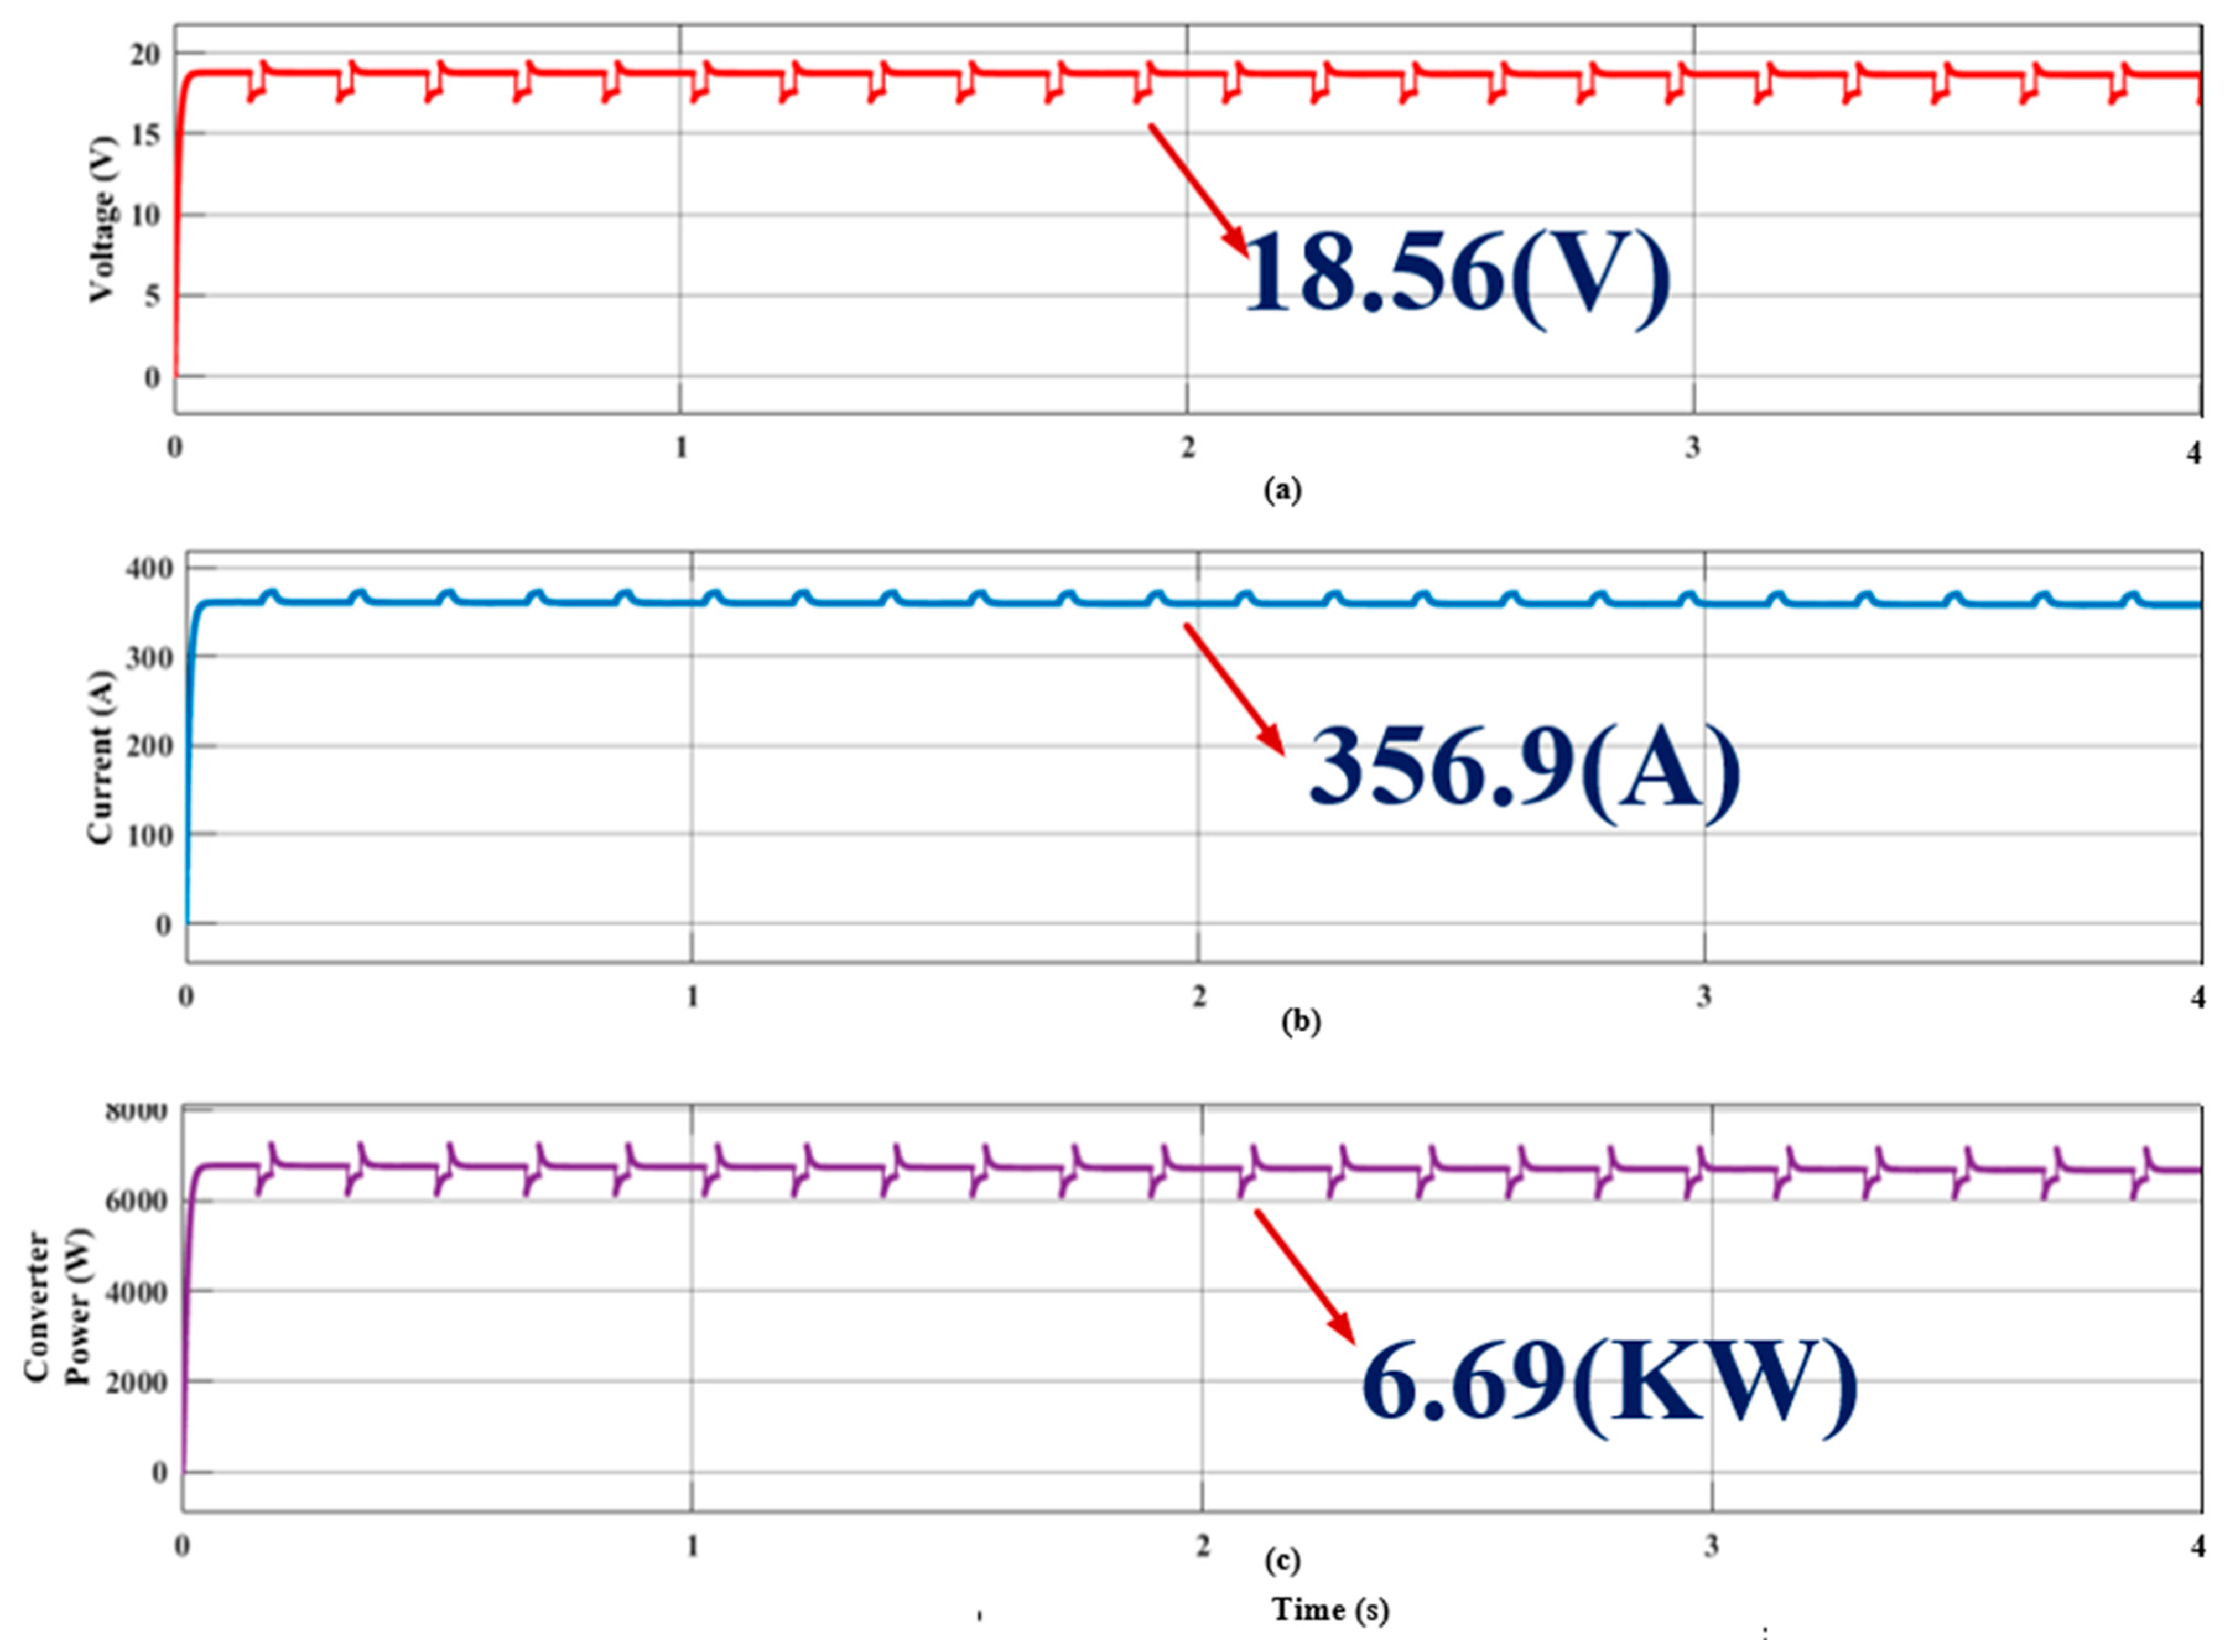
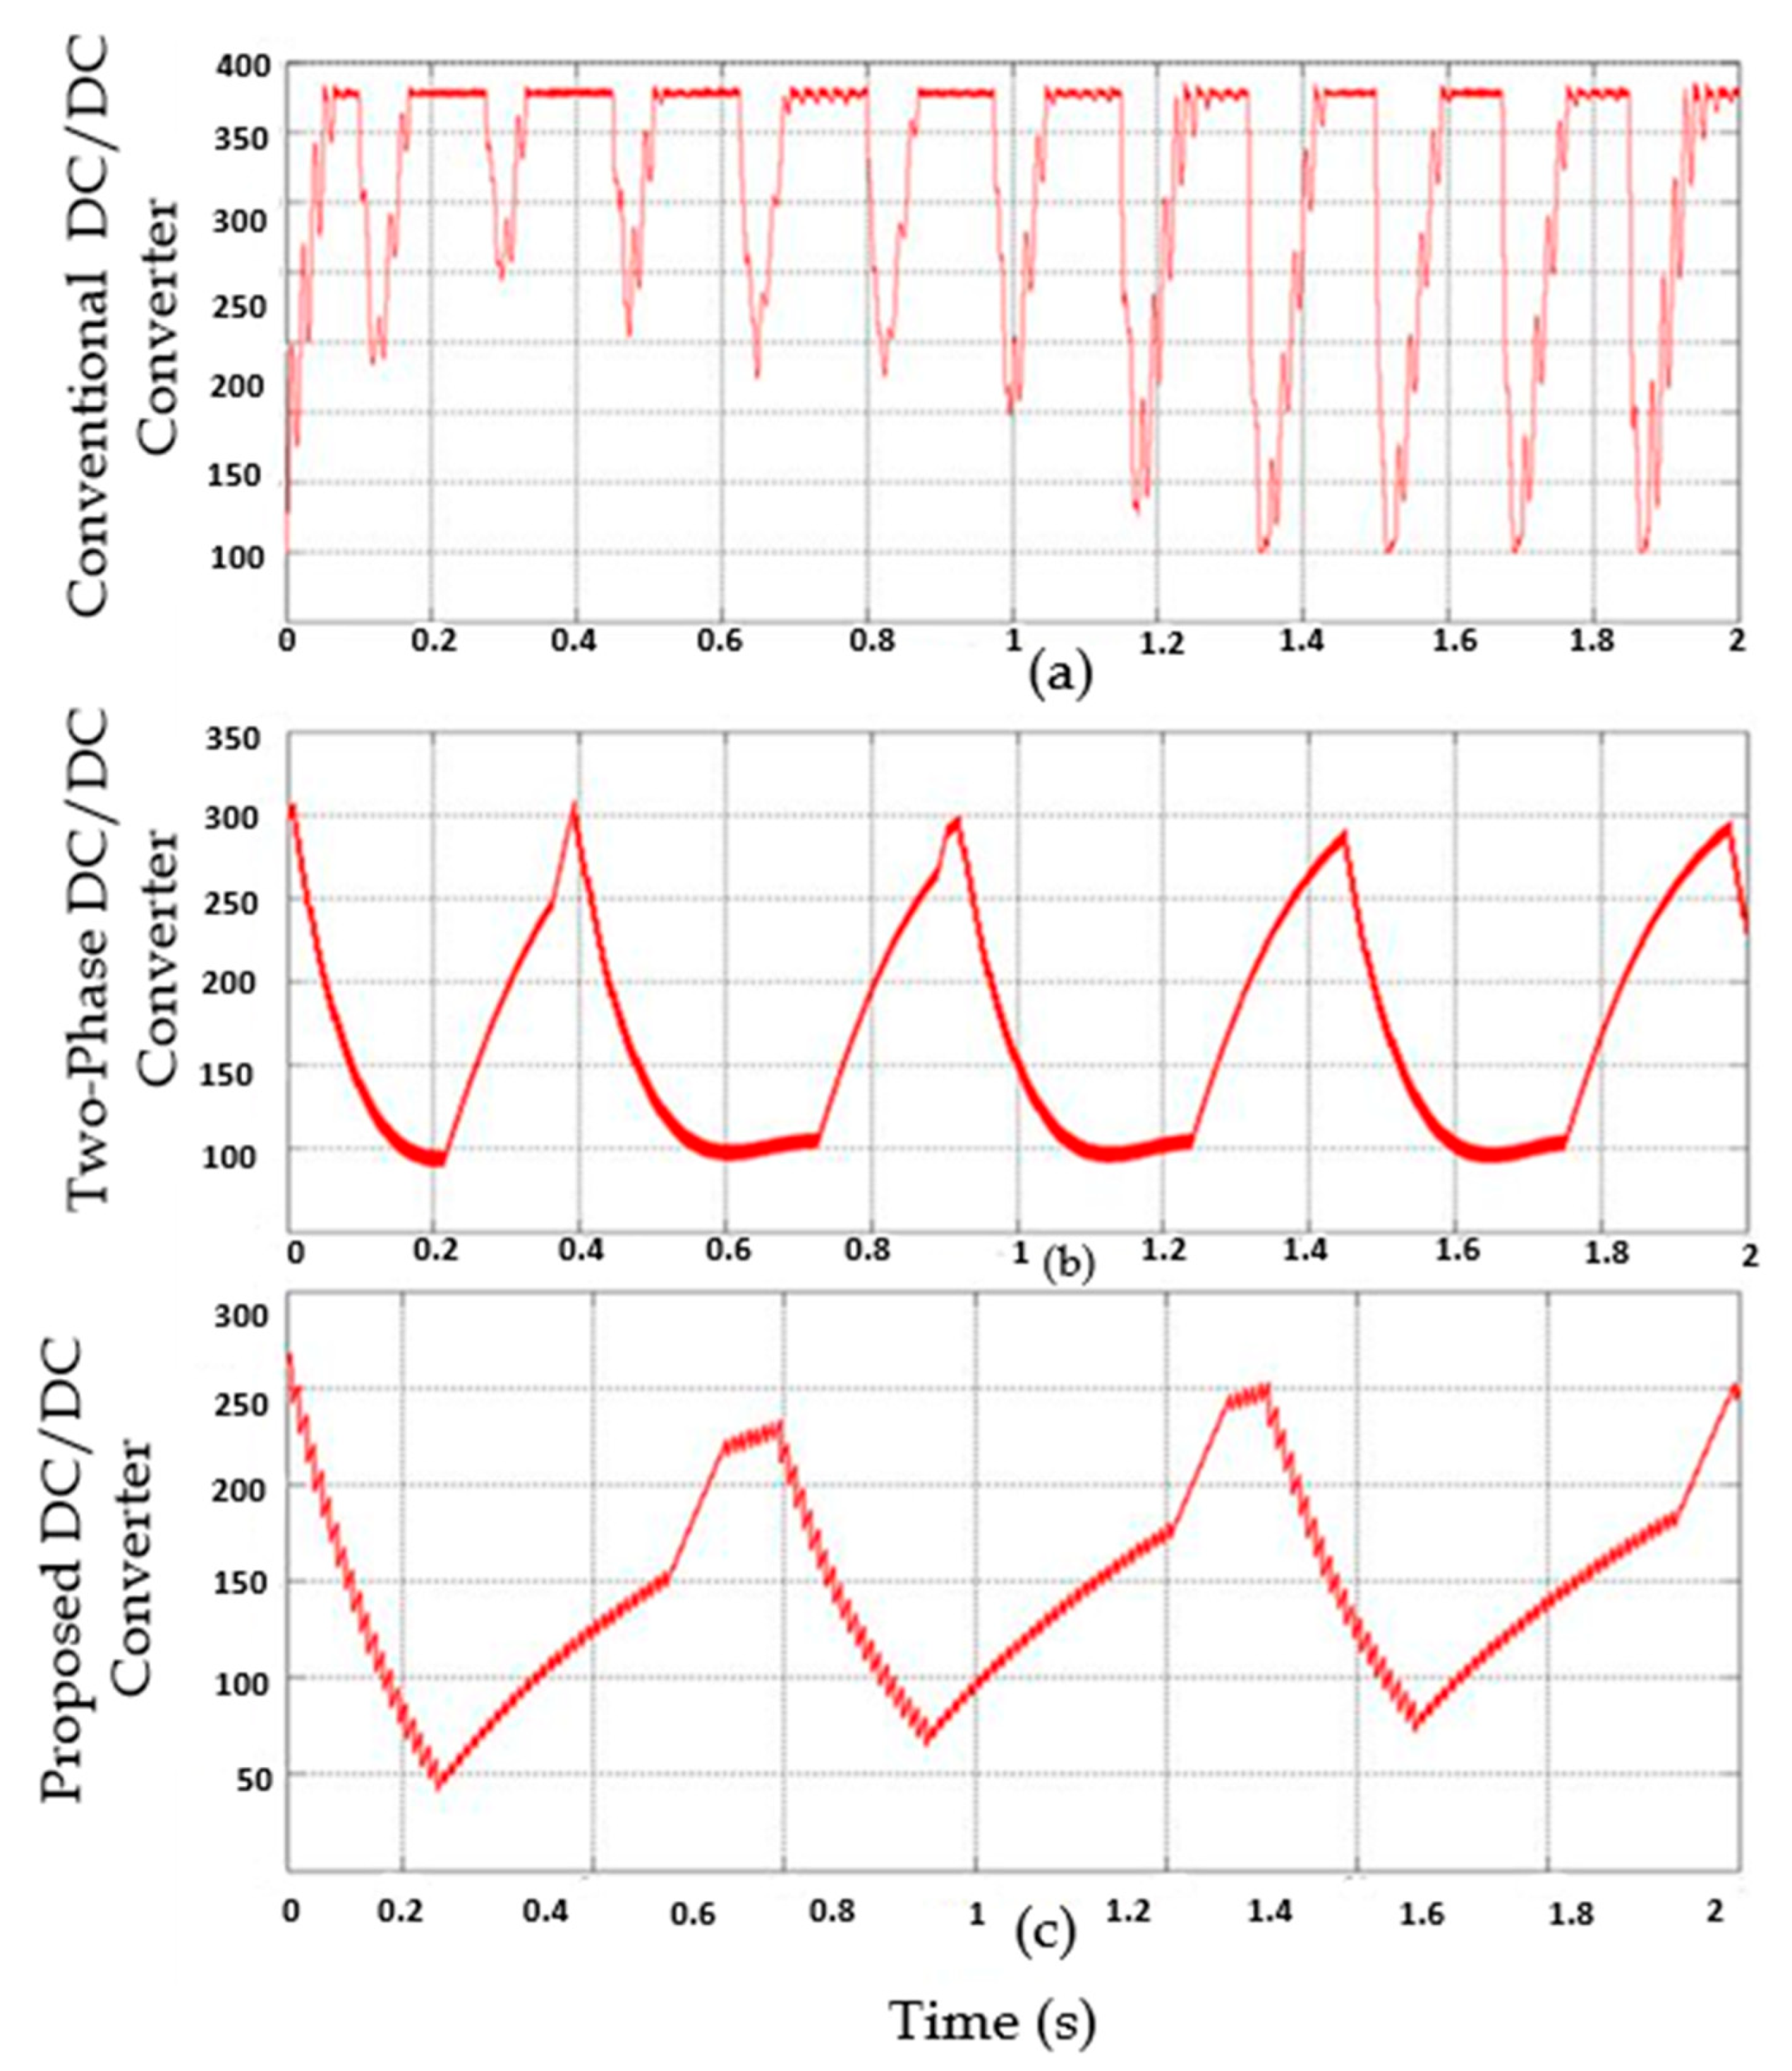
4.3. Performance Analysis of Proposed FP-ICIBC under Voltage Ripples

In order to prove the feasibility of the FP-ICIBC presented in this paper, the peak voltage ripple values for the traditional boost converter, 2P-IBC, and the proposed FP-ICIBC are 24, 19, and 12 volts and their ripple in terms of percentage is given as 6.34%, 5.12%, and 2.87%, respectively, as shown in Figure 28, meaning that it is within the limits.

4.4. Procedure Followed to Charge an EV (Buffering)

Based upon the configuration of the S-WHS EVCS, a flow chart is designed, which is shown in Figure 29. Firstly, the EVCS will read the parameters of the network after the net power condition. If it is Yes (i.e., Pnet > PL), then it will charge the EV and it follows the remaining procedure. For example, it will check the SoC of the battery level. Until the battery reaches the maximum limit, it will charge or it will again feed to the back step. After operating the load, the level is greater than the limit, and it will operate the load or it will again check the battery condition. In this case, if the SoC of the battery is less than the limit, it will disconnect the load. If the (Pnet > PL) condition is in a NO state, then it will fall into extraction mode and the power will be discharged from the EV. It further follows the procedure and will again check the battery condition. In this case, if the SoC of the battery is less than the limit, it will disconnect the load. If the (Pnet > PL) condition is in a NO state then it will fall into extraction mode and the power will be discharged from the EV. It further follows the procedure and checks the level of the battery condition. If the SoC limit is less than the actual limit, then its EV battery will be charged by the grid and it will operate the load or remain in the normal state.

5. Conclusions

This paper proposes a productive control diagram for FP-ICIBC which improves the gain factor, efficiency, and reliability of an EV charging station. The proposed converter is made to operate in all the suitable combinations using the interleaving technique where the converter parameters are maintained as a constant throughout the charging mode. A digital 2PI controller is used where the inner current and outer voltage loops are designed with the help of the ZOH method. Advantages like reducing the computational and timing issues make this controller viable to be chosen, which further helps to improve the stability of the system. The phases of the converter are operated based on the battery’s state of charge (SOC). The three charging speeds are slow (0–20% SOC), quick (20–80% SOC), and medium (80–100% SOC). Additionally, this study suggests that the proposed converter is suitable to operate the vehicles in quick charging mode. For the battery SOC to reach 80%, it took only 33 minutes to charge the vehicle and, operating with a converter efficiency of 97.02%, these modes contribute to longer battery life. Other parameters like the ripple factor and THD are 2.87% and 3.68%, which are maintained within the limits. This paper includes the simulation and analytical results of the different EV vehicles and attains the maximum charge of the battery within an hour. If there is a quick need for charge to the EV section, the proposed converter will be the future, and this can be viewed as a strong replacement for actual EV applications.

Author Contributions

Conceptualization, K.N.D.V.S.E. and M.A.N.D.; methodology, K.N.D.V.S.E.; software, K.N.D.V.S.E.; validation, K.N.D.V.S.E. and M.A.N.D.; investigation, K.N.D.V.S.E.; resources, K.N.D.V.S.E.; data curation, K.N.D.V.S.E. and M.A.N.D.; writing—original draft preparation, K.N.D.V.S.E.; writing—review and editing, K.N.D.V.S.E. and M.A.N.D.; visualization, K.N.D.V.S.E.; supervision M.A.N.D., M.A. and W.M.A.; project administration, K.N.D.V.S.E. and M.A.N.D.; funding acquisition, M.A. and W.M.A. All authors have read and agreed to the published version of the manuscript.

Funding

This research received no external funding.

Data Availability Statement

The data presented in this study are available on request from the corresponding author.

Acknowledgments

The authors extend their appreciation to the Deanship of Scientific Research at Northern Border University, Arar, KSA, for funding this research through the project number “NBU-FFR-2024-2124-01”.

Conflicts of Interest

The authors declare no conflict of interest.

Nomenclature

The following abbreviations are used in the article.
AC/DCAlternating Current/Direct Current
AMMAmorphous Magnetic Materials
CBCConventional Boost Converter
Cin/CoutInput/Output Capacitors
CO2Carbon dioxide
CSCharging Stations
DDuty cycle
DCDirect Current
DTCDirect Torque Control
EMIElectromagnetic Interference
EVElectric Vehicles
EVCSElectric Vehicle Charging Stations
FCFuel Cell
FswSwitching Frequency
GHGGreen House Gas
Gi/GvGate current/voltages
I / Δ I / Δ I p k p k Current/Change in current/Change in Current peak to peak
IBCInterleaved Boost Converter
ICEInternal Combustion Engines
I2RPower loss
Kcoupling coefficient
Kp/KiProportional/Integral gain
Ls/Leq/LMSelf-Inductance/Equivalent Inductance/Mutual Inductance
MPPTMaximum Power Point Tracking
NFRNanocrystalline Flake Ribbon
NPCNeutral Point Clamped
PIProportional Integral
PVPhotovoltaic
PoutOutput Power
PQPower Quality
PWMPulse Width Modulation
RESRenewable Energy Sources
SSwitch
SoCState of Charge
SPVSolar Photovoltaic
S-WHSSolar Wind Hybrid Systems
TsSwitching time
R/L/CResistance/Inductance/Capacitance
Vin/Vout/VrefInput/Output Voltage/reference Voltage
ZOHZero-order Hold
Δ V Change in Voltage
ηEfficiency

References

  1. Ye, H.; Jin, G.; Fei, W.; Ghadimi, N. Energy Sources, Part A: Recovery, Utilization, and Environmental Effects; Taylor & Francis: New York, NY, USA, 2020; pp. 1556–7036. [Google Scholar]
  2. Brenna, M.; Foiadelli, F.; Leone, C.; Longo, M. Electric Vehicles Charging Technology Review and Optimal Size Estimation. J. Electr. Eng. Technol. 2020, 15, 2539–2552. [Google Scholar] [CrossRef]
  3. Singh, S.A.; Carli, G.; Azeez, N.A.; Williamson, S.S. Modeling, Design, Control, and Implementation of a Modified Z-Source Integrated PV/Grid/EV DC Charger/Inverter. IEEE Trans. Ind. Electron. 2017, 65, 5213–5220. [Google Scholar] [CrossRef]
  4. Singh, S.; Chauhan, P.; Singh, N.J. Feasibility of Grid-connected Solar-wind Hybrid System with Electric Vehicle Charging Station. J. Mod. Power Syst. Clean Energy 2021, 9, 295–306. [Google Scholar] [CrossRef]
  5. Rivera, S.; Kouro, S.; Wu, B. Charging Architectures for Electric and Plug-In Hybrid Electric Vehicles. In Technologies and Applications for Smart Charging of Electric and Plug-in Hybrid Vehicles; Veneri, O., Ed.; Springer: Berlin/Heidelberg, Germany, 2017. [Google Scholar]
  6. Alghaythi, M.L.; O’Connell, R.M.; Islam, N.E.; Khan, M.M.S.; Guerrero, J.M. A High Step-Up Interleaved DC-DC Converter with Voltage Multiplier and Coupled Inductors for Renewable Energy Systems. IEEE Access 2020, 8, 123165–123174. [Google Scholar] [CrossRef]
  7. Mirzaei, M.; Keypour, R.; Savaghebi, M.; Golalipour, K. Probabilistic Optimal Bi-level Scheduling of a Multi-Microgrid System with Electric Vehicles. J. Electr. Eng. Technol. 2020, 15, 2421–2436. [Google Scholar] [CrossRef]
  8. Prem, P.; Sivaraman, P.; Raj, J.S.S.S.; Sathik, M.J.; Almakhles, D. Fast charging converter and control algorithm for solar PV battery and electrical grid integrated electric vehicle charging station. Automatika 2020, 61, 614–625. [Google Scholar] [CrossRef]
  9. Khosroshahi, A.; Abapour, M.; Sabahi, M. Reliability Evaluation of Conventional and Interleaved DC–DC Boost Converters. IEEE Trans. Power Electron. 2015, 30, 5821–5828. [Google Scholar] [CrossRef]
  10. Mou, X.; Zhao, R.; Gladwin, D.T. Vehicle-to-Vehicle charging system fundamental and design comparison. In Proceedings of the 2019 IEEE International Conference on Industrial Technology (ICIT), Melbourne, VIC, Australia, 13–15 February 2019; pp. 1628–1633. [Google Scholar] [CrossRef]
  11. Rivera, S.; Wu, B.; Kouro, S.; Yaramasu, V.; Wang, J. Electric Vehicle Charging Station Using a Neutral Point Clamped Converter with Bipolar DC Bus. IEEE Trans. Ind. Electron. 2014, 62, 1999–2009. [Google Scholar] [CrossRef]
  12. Wen, H.; Su, B. Practical Implementation of an Interleaved Boost Converter for Electric Vehicle Applications. J. Power Electron. 2015, 15, 1035–1046. [Google Scholar] [CrossRef]
  13. Kosai, H.; McNeal, S.; Jordan, B.; Scofield, J.; Ray, B.; Turgut, Z. Coupled Inductor Characterization for a High Performance Interleaved Boost Converter. IEEE Trans. Magn. 2009, 45, 4812–4815. [Google Scholar] [CrossRef]
  14. Smith, N.; McCann, R. Analysis and simulation of a multiple input interleaved boost converter for renewable energy applications. In Proceedings of the 2014 IEEE 36th International Telecommunications Energy Conference (INTELEC), Vancouver, BC, Canada, 28 September–2 October 2014; pp. 1–7. [Google Scholar]
  15. Pavlovsky, M.; Guidi, G.; Kawamura, A. Assessment of Coupled and Independent Phase Designs of Interleaved Multiphase Buck/Boost DC–DC Converter for EV Power Train. IEEE Trans. Power Electron. 2013, 29, 2693–2704. [Google Scholar] [CrossRef]
  16. Martinez, W.; Yamamoto, M.; Imaoka, J.; Velandia, F.; Cortes, C.A. Efficiency optimization of a two-phase interleaved boost DC-DC converter for Electric Vehicle applications. In Proceedings of the2016 IEEE 8th International Power Electronics and Motion Control Conference (IPEMC-ECCE Asia), Hefei, China, 22–26 May 2016; pp. 2474–2480. [Google Scholar]
  17. Hegazy, O.; Van Mierlo, J.; Lataire, P. Analysis, Modeling, and Implementation of a Multidevice Interleaved DC/DC Converter for Fuel Cell Hybrid Electric Vehicles. IEEE Trans. Power Electron. 2012, 27, 4445–4458. [Google Scholar] [CrossRef]
  18. Ou, J.; Liu, Y.; Breining, P.; Schiefer, M.; Doppelbauer, M. Experimental Study of the Amorphous Magnetic Material for High-Speed Sleeve-Free PM Rotor Application. IEEE Trans. Ind. Electron. 2019, 67, 4422–4432. [Google Scholar] [CrossRef]
  19. Luo, Z.; Li, X.; Jiang, C.; Li, Z.; Long, T. Permeability-Adjustable Nanocrystalline Flake Ribbon in Customized High-Frequency Magnetic Components. IEEE Trans. Power Electron. 2023, 39, 3477–3485. [Google Scholar] [CrossRef]
  20. Haubert, T.; Mindl, P.; Čeřovský, Z. Design of Control and Switching Frequency Optimization of DC/DC Power Converter for Super-capacitor. Automatika 2016, 57, 141–149. [Google Scholar] [CrossRef]
  21. Hao, X.; Salhi, I.; Laghrouche, S.; Ait-Amirat, Y.; Djerdir, A. Robust control of four-phase interleaved boost converter by considering the performance of PEM fuel cell current. Int. J. Hydrog. Energy 2021, 46, 38827–38840. [Google Scholar] [CrossRef]
  22. Available online: https://www.bikedekho.com/tvs/iqube-electric/specifications (accessed on 26 August 2023).
  23. Eswar, K.N.D.V.S.; Doss, M.A.N.; Jayapragash, J. Design of Zeta Converter Integrated with Renewable Source PV and Hybrid Energy Storage Systems for Industrial/Domestic Applications. In International Symposium on Sustainable Energy and Technological Advancements; Panda, G., Alhelou, H.H., Thakur, R., Eds.; Springer: Singapore, 2023; pp. 303–317. [Google Scholar]
  24. Available online: https://evfunda.com/bajaj-re-electric-auto-rickshaw/ (accessed on 26 August 2023).
  25. Available online: https://www.cardekho.com/tata/nexon-ev (accessed on 26 August 2023).
  26. Chakraborty, S.; Vu, H.-N.; Hasan, M.M.; Tran, D.-D.; Baghdadi, M.E.; Hegazy, O. DC-DC Converter Topologies for Electric Vehicles, Plug-in Hybrid Electric Vehicles and Fast Charging Stations: State of the Art and Future Trends. Energies 2019, 12, 1569. [Google Scholar] [CrossRef]
  27. Nahar, S.; Uddin, M.B. Analysis the performance of interleaved boost converter. In Proceedings of the 2018 4th International Conference on Electrical Engineering and Information & Communication Technology (iCEEiCT), Dhaka, Bangladesh, 13–15 September 2018; pp. 547–551. [Google Scholar]
  28. Samuel, V.J.; Keerthi, G.; Mahalingam, P. Interleaved quadratic boost DC–DC converter with high voltage gain capability. Electr. Eng. 2020, 102, 651–662. [Google Scholar] [CrossRef]
  29. Sampath, S.; Rahiman, Z.; Chenniappan, S.; Sundaram, E.; Subramaniam, U.; Padmanaban, S. Efficient Multi-Phase Converter for E-Mobility. World Electr. Veh. J. 2022, 13, 67. [Google Scholar] [CrossRef]
Figure 1. Line diagram of proposed system.
Energies 17 02277 g001
Figure 2. EV Block diagram.
Energies 17 02277 g002
Figure 3. PV system with power converter.
Energies 17 02277 g003
Figure 4. General layout of SCIG wind energy turbine.
Energies 17 02277 g004
Figure 5. Proposed converter designed for FP-ICIBC.
Energies 17 02277 g005
Figure 6. Switching sequence for duty cycle ‘D’ which is shown in blue shade.
Energies 17 02277 g006
Figure 7. Operational diagram for FP-ICIBC.
Energies 17 02277 g007
Figure 8. Shows the FP-ICIBC performance waveforms during the Mode 4 operation.
Energies 17 02277 g008
Figure 9. Block diagram of 2PI controller for FP-ICIBC.
Energies 17 02277 g009
Figure 10. Solar and wind speed data.
Energies 17 02277 g010
Figure 11. Results of a simulation for load demand in red, solar power in brown, wind power in green, and battery power in blue using P&O MPPT controller.
Energies 17 02277 g011
Figure 12. Simulation plot displays when supplying excess power to the grid for the following: (a) EV load demand; (b) solar; (c) wind; and (d) grid power taken.
Energies 17 02277 g012
Figure 13. Simulation plot displays excess power taken from the grid for the following: (a) EV load demand; (b) solar; (c) wind; and (d) grid power taken.
Energies 17 02277 g013
Figure 14. Results for system powers (a) EV load power (3812 W) (b) PV power (5974 W), (c) wind power (6774 W), and (d) maintaining grid voltage (129.3 V) where, RYB phases indicated with blue, red, and orange colors.
Energies 17 02277 g014
Figure 15. FP-ICIBC operation when connected to 2 W (a) voltage (28.2 V) (b) current (542.3 A), and (c) converter output (15.9 KW).
Energies 17 02277 g015
Figure 16. Two-wheeler EV battery charging conditions.
Energies 17 02277 g016
Figure 17. S-WHS waveform for Case 3. (a) EV load power (4488 W), (b) PV power (5796 W), (c) wind power (4722 W), and (d) maintaining grid voltage (129.3 V) where, RYB phases indicated with maroon, orange and blue colors.
Energies 17 02277 g017
Figure 20. S-WHS waveform for Case 4 (a) EV load power (5071 W), (b) PV power (6044 W), (c) wind power (6614 W), and (d) maintaining grid voltage (129.3 V) where, RYB phases indicated with maroon, orange and blue colors.
Energies 17 02277 g020
Figure 21. FP-ICIBC waveforms when connected to 4 W. (a) Voltage (27.98 V), (b) current (538.1 A), and (c) converter output power (15.05 KW).
Energies 17 02277 g021
Figure 22. Four-wheeler EV battery charging conditions.
Energies 17 02277 g022
Figure 23. S-WHS waveform for Case 5. (a) Load power (13,018 W), (b) PV power (10,560 W), (c) wind power (6614 W), and (d) grid voltage (129.3 V) where, RYB phases indicated with maroon, orange and blue colors.
Energies 17 02277 g023
Figure 24. FP-ICIBC waveforms applied to multiple vehicles.
Energies 17 02277 g024
Figure 25. S-WHS waveform for Case 6. (a) PV power (10.08 KW), (b) wind power (4.854 KW), (c) load power (14.2 KW), and (d) grid voltage acquired extra is (332.3 V) where, RYB phases indicated with maroon, yellow and orange colors.
Energies 17 02277 g025
Figure 26. FP-ICIBC operating waveforms for Case 6.
Energies 17 02277 g026
Figure 27. Comparison between the work in [26,27,28,29] and the proposed FP-ICIBC (a) charge conditions for different converters, and (b) efficiency curves.
Energies 17 02277 g027
Figure 28. Ripple waveforms for different converters. (a) Conventional DC/DC converter (b) Two Phase DC/DC converter; (c) Proposed DC/DC converter.
Energies 17 02277 g028
Figure 29. Flow chart for the battery charging condition.
Energies 17 02277 g029
Table 1. Four operation situations of FP-ICIBC.
Operating StatesT1T2T3T4 Operating StatesT1T2T3T4
Mode-1
0 < D1(t) + D2(t) + D3(t) + D4(t) ≤ 1
1000Mode-3
2 < D1(t) + D2(t) + D3(t) + D4(t) ≤ 3
1011
00001001
01001101
00001100
00101110
00000110
00010111
00000011
Mode-2
1 < D1(t) + D2(t) + D3(t) + D4(t) ≤ 2
 Mode-4
3 < D1(t) + D2(t) + D3(t) + D4(t) ≤ 4
 
10000111
11001111
01001011
01101111
00101101
00111111
00011110
10011111
✓—indicates that it is in conduction state. ✖—indicates that it is not in conduction state.
Table 2. Solar wind hybrid system specifications.
Parameters and Its Specifications
S
O
L
A
R

D
A
T
A
Maximum Power (Pmax)15,000 WW
I
N
D

D
A
T
A
Rated Power Output (PRout)5000 W
Voltage at max. power (Vmax)220 VPeak power output (PPout) 6800 W
Current at max. power (Imax)6.818 ARated voltage (R voltage)415 v
Open circuit voltage (Voc)232.32 VCut-in (N Cin), Cut-out (Ncout) and wind speed (Nw)2, 18, and 8 m/s
Short circuit current (Isc)5.65 ARated rotor speed (Nrotor)250 rpm
No. of panels (Np)10Generator efficiency (η gen)0.95
No. of strings (Ns)1Number of blades (Nblades)3
Cells in string (Ncs)10Rotor diameter (Dr)3600 mm
Cp value at max. (Cpmax)0.18
Table 3. Two-wheeler EV specifications.
Parameter VariableRatings
Rated power output (W)3 KW
Battery capacity and type48 V, 62 Ah, 2.97 kWh, Li-ion
Charging conditionUp to 4 h to charge 0–90%
Battery typeLi-ion
On-board charger1.8 kW
Table 4. Three-wheeler auto-rickshaw EV specifications.
Parameter VariableRatings
Rated power output (W)4.3 KW
Battery capacity and type48 V, 91.66 Ah, 4.4 Kwh Li-ion
Charging conditionup to 6 h to charge 0–80%
Battery typeLi-ion
On-board charger2.2 KW
Table 5. Four-wheeler EV specifications.
Parameter VariableRatings
Rated power output (W)4.8 KW
Battery capacity and type72 V, 298.61 Ah, 21.5 Kwh Li-ion
Charging conditionup to 8 h to charge 0–80%
Battery typeLi-ion
On-board charger9.1 kW
Table 6. Proposed converter FP-ICIBC compared with the existing topologies.
Type of ConverterVin(v)Vout(v)Iout(A)NFs(Hz)L(μH)C(μF)DPo(W)Pl(W)Pin(W)η%
Boost [26]20038013.021204107800.54.94317.545.2693.97
Full Bridge [27]20043413.562201152500.55.80267.346.1594.24
2P-IBC [28]200435.713.624201002350.55.93266.886.1995.66
6P-IBC [29]20050013.98620851950.56.992707.2696.28
Proposed FP-ICIBC232464.414.12542566.671680.56.56201.486.7697.02
Table 7. Comparison of gain, rise time, ripple factor, and charging time of the proposed and various converters.
ParameterGainRise TimeVoltage RippleCharging Time
Boost [26]Very low1.02 s12.5%Very high
Full Bridge [27]Average1.08 s12.5%High
2P-IBC [28]Max. 22.02 s5.12%Moderate
Proposed FP-ICIBCHigh1.05 s<2.9%Very low
Disclaimer/Publisher’s Note: The statements, opinions and data contained in all publications are solely those of the individual author(s) and contributor(s) and not of MDPI and/or the editor(s). MDPI and/or the editor(s) disclaim responsibility for any injury to people or property resulting from any ideas, methods, instructions or products referred to in the content.

