


The Optimal Infrastructure Design for Grid-to-Vehicle (G2V) Service: A Case Study Based on the Monash Microgrid

Department of Civil Engineering, Monash University, Clayton, VIC 3800, Australia
*
Author to whom correspondence should be addressed.
Energies 2024, 17(10), 2267; https://doi.org/10.3390/en17102267
Submission received: 9 April 2024
/
Revised: 29 April 2024
/
Accepted: 1 May 2024
/
Published: 8 May 2024
(This article belongs to the Special Issue Advanced Optimization Strategy of Electric Vehicle and Smart Grids)
Abstract
:The electrification of the transport sector has emerged as a game changer in addressing the issues of climate change caused by global warming. However, the unregulated expansion and simplistic approach to electric vehicle (EV) charging pose substantial risks to grid stability and efficiency. Intelligent charging techniques using Information and Communication Technology, known as smart charging, enable the transformation of the EV fleets from passive consumers to active participants within the grid ecosystem. This concept facilitates the EV fleet’s contribution to various grid services, enhancing grid functionality and resilience. This paper investigates the optimal infrastructure design for a smart charging system within the Monash microgrid (Clayton campus). We introduce a centralized Grid-to-Vehicle (G2V) algorithm and formulate three optimization problems utilizing linear and least-squares programming methods. These problems address tariff structures between the main grid and microgrid, aiming to maximize aggregator profits or minimize load fluctuations while meeting EV users’ charging needs. Additionally, our framework incorporates network-aware coordination via the Newton–Raphson method, leveraging EVs’ charging flexibility to mitigate congestion and node voltage issues. We evaluate the G2V algorithm’s performance under increasing EV user demand through simulation and analyze the net present value (NPV) over 15 years. The results highlight the effectiveness of our proposed framework in optimizing grid operation management. Moreover, our case study offers valuable insights into an efficient investment strategy for deploying the G2V system on campus.
1. Introduction
The increasing international emphasis on tackling the complexities of climate change has sparked a global commitment to develop sustainable energy infrastructure. This has prompted a rapid shift towards electrifying the transportation sector, incorporating timelines for discontinuing internal combustion engine (ICE) vehicles and encouraging the adoption of electromobility [1].
In 2023, Australia saw an increase in the adoption of EVs, which accounted for 8.4% of total new car registrations [2], trailing behind the global average of 14%. However, the Bureau of Infrastructure and Transport Research Economics (BITRE) projected a rapid increase in EV sales in Australia, estimated at approximately 25% by 2030 and 60% by 2040, relative to annual new passenger vehicle sales [3]. In this context, the Australian Energy Market Operator (AEMO) also anticipates a notable surge in EV charging demand of 5.9 TWh (including battery and plug-in hybrid EVs) within the National Electricity Market in five years and 25.2 TWh in a decade under their green energy exports scenario [4].
The roll-out of uncontrolled EV charging will present significant challenges to energy systems [5]. Numerous researchers have warned against the simplistic aggregation of EV charging without any control system, as it could adversely impact grid operations [6].
Nevertheless, the introduction of coordinated EV charging, facilitated by Information and Communication Technology (ICT), known as smart charging, can transform EV fleets from being a grid issue to a potential advantage. This transformation can be achieved by utilizing smart consumers with unidirectional control (Grid-to-Vehicle, G2V) or smart prosumers with bidirectional control (Vehicle-to-Grid, V2G), contingent on the specific charging system implemented [7,8].
Optimization algorithms for controlling aggregated charging loads facilitate the efficient operation of grid systems and offer multifaceted benefits in developing charging infrastructure. The regulation of peak loads reduces the necessity for fast chargers, thereby avoiding unnecessary investment costs and minimizing upgrade expenses for the network system. Moreover, smart charging systems can tailor flexible optimization strategies to their specific environments. Given the extensive adoption of solar photovoltaic systems, the Australian energy market typically experiences lower electricity prices during daytime hours. Consequently, implementing smart charging systems optimized to maximize the utilization of solar generation during the day yields significant economic advantages for EV users while also fostering the establishment of the most eco-friendly charging infrastructure in Australia.
1.1. Aims of the Research
This research explores the potential application of a G2V algorithm in effectively operating the increasing number of EVs within the Monash microgrid. This study introduces a centralized G2V algorithm and formulates three distinct optimization problems based on different tariff structures imposed on the Monash microgrid.
In the simulation phase, the research varies the number of EV users from 100 to 1000 to anticipate the growing presence of EVs on the Monash campus. Through the simulation of microgrid operation issues, including voltage variations, this study aims to identify the impacts of uncoordinated charging and assess the potential benefits of implementing the smart G2V system.
Additionally, the financial analysis of the proposed smart charging project is conducted, seeking to determine the optimal configuration of charging infrastructure within the Monash microgrid from the perspective of an aggregator. The charging systems’ NPV are analyzed, considering variations in the total number of chargers and the composition of charger types (level 1 and level 2). By comparing net project profits with an uncontrolled (convenience) charging case, the study aims to unveil the optimal investment strategy for the charging infrastructure design of the G2V system and address critical questions below in the techno-economic aspect.
- 1.
- What is the required number of chargers to accommodate the escalating population of EV users within the Monash microgrid?
- 2.
- To optimize overall profits while meeting user preferences, what types of chargers should the aggregator deploy for maximum effectiveness?
- 3.
- How should the configuration of the charging system be strategically devised to maximize total profits while concurrently catering to users’ requirements and preferences?
The findings demonstrate that the G2V system effectively manages the EV interaction with the microgrid to avoid violations and facilitates the stable operation of a significant number of EVs within the existing microgrid network compared to uncontrolled charging scenarios. Consequently, this results in improved financial outcomes. Results show that a system with predominantly high-power chargers optimizes algorithm performance, increasing satisfaction among EV users and maximizing daily power trading profits. However, this only sometimes guarantees better project finance due to its higher capital costs. This underscores the importance of detailed adjustments in designing the charging system’s power types.
1.2. State of the Field/Literature Review
The optimization problems in the smart EV charging research can be broadly classified into two main categories: grid operation and cost savings perspectives. Each category is customized to address the specific viewpoints of EV users, aggregators, or grid operators [7,9].
When addressing grid operation challenges, topics such as peak load regulation [10], integration of distributed energy resources (DERs) like solar photovoltaic (PV) or wind power [11,12,13], and grid stability issues due to EV charging, such as network voltage or frequency [14,15], are widely discussed. While many studies propose well-coordinated algorithm designs and novel solver techniques to tackle specific optimization problems, the impact of infrastructure configuration on algorithm performance has yet to be extensively addressed.
In terms of cost-related research, existing studies predominantly concentrate on minimizing the operational costs of the charging system or maximizing daily profits for EV users. However, a comprehensive examination of project finance for smart charging systems from the investor’s perspective has yet to be extensively explored.
Author [16] presents a multi-objective optimization problem employing model predictive control (MPC) to minimize net load fluctuation and operational costs (electricity generation and power loss) within a low-voltage network comprising 19 households. The study showcases overall operational cost savings between controlled and uncontrolled scenarios across various levels of EV penetration (ranging from 16% to 47%). Simulation results indicate approximately 1% to 2% reduction in generation costs and 7% to 50% reduction in loss costs. However, the research solely considers a single type of EV charger (level 1, up to 7 kW), and the impact of different charger types (such as lower or higher power) on cost-saving effects still needs to be explored.
Reference [17] introduces a two-stage, non-cooperative EV charging game to minimize net charging costs for five aggregators, each managing 10 EVs. The simulation results demonstrate a stable cost-saving effect (40% to 50%) for the aggregators and peak power reduction (50%), regardless of the probability weighting function. However, this research also solely incorporates single-type chargers (level 2, up to 20 kW) in the simulation without further discussing how charger configuration affects cost savings. Additionally, the simulation focuses on a very limited time frame (a single day, from 8 a.m. to 4 p.m.), which poses limitations on guaranteeing the longer-term performance of the proposed algorithm.
Similarly, reference [18] introduces a non-cooperative hierarchical game competition among charging stations, aiming to regulate peak load and maximize power trading profits using particle swarm optimization. A case study is conducted in a distributed residential network in Milwaukee, featuring four charging stations (32 nodes total) and 2500 EVs (50,000 vehicles total), providing a highly reliable simulation result through long-term performance analysis (spanning a year). However, the economic analysis of the charging system is solely focused on daily revenue, indicating a stable convergence at approximately $1000 per charging station. Assuming the aggregator’s responsibility for the construction and operation of the system, a more comprehensive discussion regarding the economic analysis of project finance is warranted. This should include detailed considerations of operating profits and the overall system’s investment to provide a deeper understanding of the financial implications.
Many studies focusing on cost-related objective functions [13,19,20,21,22,23] only address operational revenue aspects. However, capital investment analysis is also crucial for commercializing smart charging systems, especially from the investors’ perspective. It is also imperative to acknowledge that the configuration of the charging infrastructure affects algorithm performance and directly impacts the project’s economics. Therefore, there is a critical need for a thorough exploration of the charging system’s configuration design, equivalent to the level of attention devoted to algorithm design.
1.3. Contribution of the Research
Currently, smart charging systems are in the conceptual phase, with no commercially available G2V-enabled charging solutions on the market. However, the G2V system, operating with unidirectional control, requires minimal upgrades to the onboard chipset in conventional charging facilities and software packages [24,25,26]. As a result, the G2V system emerges as a promising technology for potential implementation shortly, and the scope of this case study focuses on approximately a decade ahead.
In this context, we assume that the capital costs of G2V solutions will be comparable to conventional charging facilities, and the novelty of this research lies in the optimal investment strategy of smart charging systems, including on charging infrastructure design and tariff structures. This dimension needs to be addressed more extensively in existing studies, and the key contributions of this paper can be summarized as follows:
- 1.
- We present a G2V system designed for daytime charging within a large public parking garage in Monash University’s Clayton campus. The discussion on smart parking systems is widespread, attributed to their diverse advantages, including integration with DERs or the potential to operate as an energy buffer for load control, offering opportunities to participate in a demand response (DR) market [27].Considering the typically extended daily parking hours of vehicles on campus, the university provides an ideal environment for implementing a smart charging system. In this context, the research conducted serves as a case study, offering valuable insights into the design of daytime charging systems in workplace environments.
- 2.
- In contrast to relying on simplistic assumptions regarding EV charging and parking patterns, this study ensures the reliability of simulation results by utilizing measured charging and parking data from the Monash campus spanning 2019. Additionally, the performance evaluation of the G2V algorithm in this research extends throughout the entire year (365 days in 2019), guaranteeing a longer-term reliability of the simulation results.
- 3.
- This study discusses an optimal infrastructure design based on analyzing the proposed system’s entire project finance (15 years) from the aggregator’s (the owner of the microgrid) perspective rather than relying on short-term economic analysis such as daily profits. Through simulations, we investigate the most effective investment strategy by examining the ideal quantity of EV chargers and the optimal configuration of charger types (levels 1 and 2) based on the total number of EV users on the campus. The financial analysis encompasses three scenarios contingent on the electricity contract between the microgrid and the main grid operator. It also aims to identify the most favorable tariff structure for the G2V system.
The subsequent sections of this paper are structured as follows: Section 2 outlines the system model and fundamental assumptions guiding the model. Section 3 describes the objective functions and constraints pertinent to the optimization problems. Section 4 details the sophisticated algorithm structures, presenting pseudo codes for each stage incorporating dynamic power curtailment. Section 5 and Section 6 provide details on simulation parameters and analysis of results. The paper concludes with a summary of the findings in Section 7.
2. System Model Description
This section outlines the physical architecture of the proposed Monash microgrid, the power and cash flow model of the G2V system, and summarizes the EV charging and parking models and assumptions. The proposed G2V service is presumed to be available for everyone, including visitors. It exclusively focuses on the campus’s N1 parking facility, which is designed to accommodate a maximum of 3000 vehicles.
2.1. System Architecture
The Monash University Clayton campus, approximately 20 km southeast of Melbourne’s central business district, has developed a precinct-scale microgrid platform through the Australian Renewable Energy Agency (ARENA)-funded Smart Energy City project. Spanning an area of 1.2 , the campus microgrid encompasses academic buildings, three libraries, one sports complex, five commercial facilities, two residential areas, additional entertainment and ancillary facilities, and eight public parking lots, two of which are under cover [28].
The construction of the microgrid is underway, but it is currently non-operational. However, if everything goes according to plan, the envisioned architecture of the proposed microgrid system will resemble the following. The microgrid will include controllable loads totalling 3.5 MW across 20 mixed-use and multi-tenant buildings with EV chargers. In addition to the controllable loads, the microgrid system manages two types of DERs independently. The first is a 1 MW solar PV system incorporating eight separate smaller PV systems installed on various building rooftops within the microgrid. Although physically integrated with individual buildings, these PV systems can be independent DERs when managed. The second DER is a 1 MWh integrated BESS featuring a 120 kW/120 kWh lithium-ion and 180 kW/900 kWh vanadium flow battery. This system is installed and combined with one of the buildings but also can independently be managed as a DER. A smart microgrid platform is implemented to manage the energy output of these DERs and the microgrid as a whole. Ideally, the microgrid platform concept incorporates four hierarchical control layers: DER integration, active grid management, smart energy management, and TEM governing layer. These control structures enhance the microgrid’s power quality through aggregated DERs and facilitate close communication with the energy market. Figure 1 visually represents the physical network of interconnected buildings within the microgrid, forming a real-world community with diverse load profiles.
The proposed G2V system employs a centralized algorithm. A single aggregator is tasked with overseeing the total charging requirements of the EV fleet in N1 parking and facilitating communication with the energy market operator (AEMO) as an integral component of the Monash microgrid.
The energy market operator oversees power trading activities, manages the balance between supply and demand, and ensures optimal conditions on the local grid within established operating standards through the distributed network service provider (DNSP). Moreover, the energy market operator facilitates complex interactions among various grid-connected energy resources by communicating with the transmission network service provider (TNSP). A pivotal aspect of this role involves conducting periodic biddings to determine the market price, also referred to as the spot price, of electricity at five-minute intervals within the National Electricity Market (NEM) based on bids submitted by electricity generators.
As illustrated in Figure 2, the aggregator optimizes power flow (trading amount and timing) unidirectionally (from the main grid to EV users) to maximize trading profits based on communication with the AEMO.
2.2. EV Charging Model
To better reflect reality, this study simulates the daily variability in EV users’ behavior on campus. Additionally, it posits that EV users’ yearly parking and charging patterns in the near future will closely resemble those observed in 2019. Based on these premises, the subsequent sections outline the estimation of input parameters (EV parking and charging) for simulation.
We define the index as the number of EVs in N1 parking requiring charging service within a day. The proposed algorithm formulates charging schedules for all connected EVs at each time slot , with each time slot representing half an hour. Upon the arrival of a new EV at the charging bay at a time t, the aggregator establishes external information variables denoted as for the individual EVi. These variables then serve as input parameters for the optimization process.
We assumed that each EV has a unique target state of charging (SoC) level. Rather than imposing a fixed target SoC level in the optimization problem, we specified varying minimum and maximum charging requirements for each EV.
Figure 3 presents a histogram delineating the historical charging data encompassing all charging instances recorded at the N1 parking facility using two installed EV chargers. Each bar within the graph corresponds to the amount of energy charged in kilowatt-hours, while the y-axis value denotes the cumulative count of charging events observed over the entire year in 2019 (the observations show that EV users charged 18.9 kWh per day on average in 2019).
The symbol in Equation (1) represents the minimum charging requirement for each EV, denoted as EVi. Our assumption stipulates that the minimum charging requirement () for the EV fleet served by G2V charging of a day will adhere to the distribution outlined in Figure 3, ranging from 8 kWh to 30 kWh, and the estimation of is carried out through Monte Carlo simulation. Furthermore, we estimate the maximum charging requirement () to be 1.5 times the minimum requirement, ensuring it does not surpass 40 kWh. This consideration accounts for the physical limitations imposed by the battery size of the EVs, which is set at 50 kWh.
To cater to the diverse charging needs of EV owners and optimize economic benefits for both the aggregator and EV users, the proposed G2V framework integrates two charger types: 2 kW (Level 1, L1) and 7 kW (Level 2, L2). Our analysis reveals that the average power for EV charging is approximately 3 kW, considering an average charging requirement of 18.9 kWh and an average parking duration of around 7 h in 2019. Consequently, combining 2 kW and 7 kW chargers is sufficient for the G2V service.
The charging power allocation for EVi is contingent upon factors such as the duration of parking and the charging demand. In the charging model, EVs must fulfil a minimum requirement, , by the end of the parking period, with the charging power constrained between 0 and . By default, if the 2 kW (L1) charger is capable of meeting the minimum charging needs of the EV, users are more likely to select the 2 kW (L1) charger, given its lower unit price compared to the 7 kW (L2) charger.
However, owing to the limited number of chargers, specific drivers may need help in selecting their preferred charging power. They may need to opt for an alternative or give up charging altogether. This constraint can result in user dissatisfaction, as individual EV users may need to compromise on their desired SoC level (Mode 3) or accept a higher charging fee (Mode 2), given that the unit charging price for L2 is higher than L1. Consequently, the aggregator classifies EVs into three distinct charging modes, , and imposes specific constraints in the optimization process.
2.3. EV Parking Model
This research recognizes the daily variability in EV users’ parking behaviors on campus premises. In the parking model, we assume the parking behavior of the EV fleet aligns with that of non-EV users. The N1 parking facility utilizes sonic sensors installed at each parking bay to monitor the arrival and departure of the entire vehicle fleet at 15-min intervals. To estimate the daily parking patterns of EVs in our simulation, we relied on daily parking data (conventional vehicles) observed in 2019 and employed Monte Carlo simulation techniques.
In Figure 4, illustrative depictions of daily vehicle parking on 29 March 2019 (left) and the yearly trend of maximum parking numbers (right) are presented. The left figure highlights notable instances, such as the peak entry (orange) at 9 a.m. with 695 vehicles per hour (), the peak exit (yellow) at 6 p.m. with 599 vehicles per hour (), and the maximum parking number (blue) reached at noon (red circle, left) with 2006 vehicles ().
The parking behavior observed within the N1 parking facility displays substantial daily fluctuations. As depicted in Figure 4, a distinct annual pattern emerges in the maximum parking capacity, reaching a peak of over 2500 vehicles during the semester and 2006 vehicles on 29 March (red circle, right), only to decline sharply on weekends and during off-semester periods. Consequently, the outcome generated by the proposed algorithm will inevitably manifest significant daily variability. Hence, it is imperative to conduct comprehensive long-term tests incorporating realistic parking profiles to ensure the sustained reliability of simulations over extended periods.
In this context, our approach involves estimating the daily EV parking behaviors by leveraging Monte Carlo simulation, utilizing the dataset observed from daily records of vehicle parking for the whole year span in 2019. We also assume that EVs enter () and exit () within the same day, with no consideration for overnight parking in the optimization problem. Furthermore, it is assumed that participants availing the proposed charging service engage in parking for at least 4 h, and parking is at most 20 h per day.
2.4. Energy Supply Model
Let represent the total charging load of the EV fleet during the time slot t. We assume that the main grid fulfils all charging requirements for EVs and the microgrid does not engage in any DR market activities. Consequently, the total power consumption of the microgrid, denoted as , is the sum of the base load (), solar PV generation (), and the aggregate EV charging (). The capacity limit of the transformer between the substation and microgrid, denoted as , 11.5 MW, establishes the physical constraint on power trading. must not exceed this transformer constraint.
3. Problem Formulation
This study constructs the offline optimization problem under the assumption of possessing foreknowledge for all of the information variables , encompassing EVs’ parking and charging details. This study incorporates three scenarios based on the electricity tariff structure between the grid operator and the microgrid, as detailed in Section 5.2. The objective function for the optimization process is determined as either or , depending on the electricity tariff structure below.
3.1. Objective Function 1:
The aggregator generates profits by capitalizing on the unit price differentials between selling power to EV users and purchasing from the main grid. Figure 5 illustrates the cash flow of the proposed G2V service. Employing the cost function , the aggregator seeks to determine the optimal charging schedule solution, denoted as , for individual EVi, to maximize trading profits. This formulation depends on the prior knowledge of EV profiles and the offline optimization problem, where can be articulated as follows:
where represents the unit charging price in Australian dollars per kilowatt-hour (/kWh), a fixed value dependent on the charger types (L1 or L2). denotes the unit electricity costs (/kWh) at time slot t, varying according to different tariff structures. To alleviate grid stress, is set to be lower than , incentivizing EV owners to opt for the more economical 2 kW(L1) charger as long as it fulfils their charging requirements.
We define the variable as an optimization variable, signifying the charging power ratio for EVi. As this study centers explicitly on the G2V strategy, we stipulate this variable as continuous values within the positive range of 0 to 1. Consequently, signifies the adequate charging power, varying from 0 to during each time slot t. The principal objective is to ascertain the optimal set of across the entire parking duration from to .
Upon the arrival of an EVi at the charging bay at the specified time , we optimize the charging schedule to fulfil the EV users’ requirements, ensuring its designated SOC level within the prescribed lower and upper requirements for EV Mode 1 and Mode 2 in Table 1. Nevertheless, applying to EV Mode 3 is infeasible and thus, Mode 3 has a distinct constraint of charging requirement for the optimization as guided by the following.
3.2. Objective Function 2:
In the case of flat-rate tariffs, the aggregator consistently generates the same profits for power trading, given that both the unit charging price and the power purchasing price in Equation (7) remain fixed. Hence, by employing the cost function , the aggregator aims to identify the optimal charging schedule solution, denoted as , to minimize the fluctuation of the total load, inclusive of EVs’ charging. Similar to , the primary objective of the optimization is to determine the optimal variable set of as expressed in Equation (7) throughout the entire parking duration, from to .
Equation (7) represents a linear problem, while Equation (8) constitutes a linear least-squares problem. The solution set for can be determined by utilizing an optimization solver when the information variable is given. In our research, we used the MATLAB platform and two distinct Gurobi solvers, namely ’linprog’ and ’lsqlin,’ to address these optimization problems. Table 2 delineates the categorization of the objective functions according to the electricity tariff agreement.
3.3. The Voltage Magnitude Control
Furthermore, with the escalating number of EVs connected to the microgrid, maintaining voltage levels within acceptable levels at all network nodes () becomes more complex. In response to this challenge, this study introduces a network-aware charging strategy to address the node voltage issues in the campus as the number of connected EVs grows.
where in this context represents the per unit (p.u.) voltage deviation limit at the Monash microgrid and is constrained to 0.1 as stipulated in this paper. We conducted a power flow analysis of the microgrid using the Newton–Raphson method in a single phase. This approach seeks a close-to-optimal solution for the power flow equation in each time slot, and detailed explanations will be provided in Section 4.
4. G2V Algorithm
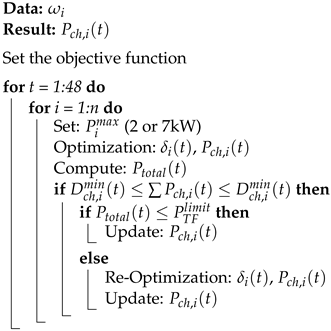
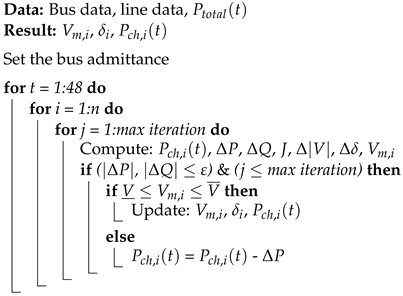
This section outlines the systematic progression and organization of the proposed G2V algorithm. The algorithm is structured into two key components: Algorithm 1, which tackles the scheduling optimization problem by solving either Equation (7) or Equation (8), and Algorithm 2, which encompasses functions of node voltage control as expressed in Equation (9). Figure 6 furnishes an overview of the proposed architectural framework of the G2V system, elucidating the execution flow.
| Algorithm 1: Charging schedule optimization with load congestion management |
 |
| Algorithm 2: Voltage management |
 |
4.1. Algorithm 1: Charging Schedule Optimization
Algorithm 1 adopts a heuristic rolling horizon control strategy expressed in Figure 7, aiming to determine the optimal charging schedule for the objective Equation (7) or (9). The structure of Algorithm 1 adheres to the principles outlined in [29,30]. The algorithm initiates the generation of an m by n parking index matrix, denoted as with values of 0 or 1, based on the set of at t. Here, m represents the number of parked EVs at t, and n denotes the last parking slot among the parked EVs. Additionally, matrix is introduced to represent the set of optimization variables of in Equation (7) for m EVs.
Adhering to the principle of the moving horizon, Algorithm 1 refines suboptimal predictions of at each time slot based on the solution set of in Equation (7) or (8). Consequently, and represent the suboptimal prediction set and charging power for the of m EVs, respectively. In the absence of TL violations at time t, as expressed in Equation (5), Algorithm 1 retains only the solution set of the current time t, , while disregarding the rest. This process subsequently updates the set until the last time slot.
This investigation focuses on a centralized algorithm, where the aggregator takes on the responsibility of optimizing the charging schedule. Additionally, this study delves into an offline algorithm that considers the perfect accuracy of all EV-related information, including , treating as a global solution. However, as Algorithm 1 lacks voltage control considerations, potential voltage issues may arise in the microgrid. Consequently, the computed suboptimal charging solution at the current time t, , serves as input parameters for Algorithm 2 to evaluate node voltage in the microgrid.
4.2. Algorithm 2: Voltage Control
Algorithm 2 introduces a network-aware and dynamic power curtailment technique for EV charging. This approach aims to tackle the issue of maintaining satisfactory voltage levels across all microgrid nodes amidst the increasing connection of EVs to the network. The algorithm performs the power flow analysis, utilizing the Newton–Raphson method to allow the aggregator to maintain voltage levels within acceptable ranges, ensuring reliable and efficient grid operation. The Newton–Raphson method involves an iterative approach utilizing an initial approximation and the application of Taylor’s series expansion, constituting a successive approximation procedure [31].
The proposed method for controlling node voltage focuses on analyzing an interconnected power system during normal operation, particularly in a steady state. The power system assumes that the microgrid operates under balanced conditions and is expressed by a single-phase network model. The Monash microgrid measures five distinct nodes’ active and reactive power consumption every 15 min. Therefore, we added one additional node of the load bus (N1 parking) and formulated the power flow equation below.
The formulation of complex power at bus j is represented by Equation (12), which comprises a set of nonlinear algebraic equations utilizing the nodal admittance matrix () expressed in voltage magnitude per unit and phase angle in radians. Here, the bus admittance is the reciprocal of the impedance of the connection line between two nodes (j and k), and represents the matrix form of the bus admittance expressed in Equation (12).
Expanding in Equation (13) through Taylor’s series centered at the initial approximation of , considering a negligible error and higher-order terms, results in a set of linear equations relating and below.
Consequently, the Jacobian matrix in n dimensions (), which characterizes the partial derivatives of P and Q assessed at and , establishes a linearized connection between variations in phase angle and voltage magnitude and the small changes in active () and reactive () power below.
Utilizing Newton’s method to address the nonlinear power flow equations within the Monash microgrid system improves accuracy by transforming the problem into a system of linear equations. The subsequent steps delineate obtaining power flow solutions for load buses through Algorithm 2.
- 1.
- Set the total EV charging at t ( = )
- 2.
- Set and equal to be 1 and 0 (the slack bus)
- 3.
- 4.
- Calculate Jacobian matrix (,,, and in Table 3)
- 5.
- Calculate
- 6.
- Iterate the process until the absolute value of is below the predetermined threshold
Ensuring optimal control of voltage magnitudes across all nodes () within the Monash microgrid requires meticulous supervision to maintain specified threshold levels denoted by . In the event of a voltage violation within the microgrid, Algorithm 2 adjusts the cumulative charging requirements, , using a curtailing ratio, . This process enables Algorithm 2 to dynamically modify EV charging, effectively addressing voltage-related issues while simultaneously ensuring fairness among EV users through the uniform application of for all charging requirements. In the absence of voltage violation issues, Algorithm 2 confirms either or as a global charging solution at t.
5. Simulation Settings
This study explicitly assesses the algorithm’s performance in 2019, focusing on the total simulation period spanning 365 days, from 1 January to 31 December 2019. We utilize the exact EV model with a battery size of 50 kWh and two types of EV chargers, namely L1 (2 kW) and L2 (7 kW). The primary objective of the simulation is to identify the optimal infrastructure design for the G2V service in the Monash microgrid. To achieve this, we generate various scenarios related to EV users, chargers, and tariff structures, except for the EV model (battery size). Subsequent sections elaborate on fundamental assumptions and provide details about the specifics of EV-related scenarios for the simulation. MATLAB Simulink is employed as the primary tool for evaluating the G2V algorithm.
5.1. EV Parking Numbers and Chargers
Utilizing historical parking data from N1 parking, we modeled the maximum daily parking () based on annual trends as delineated in Equation (4). Figure 8 illustrates the yearly trajectory of , reaching its peak at 2884 vehicles on 28 May (red circle, right), with an average of 1171 vehicles per day throughout 2019.
In the context of the presented parking trend, our initial assumption involved determining the total number of EV users () on the campus, ranging from 100 to 1500. Subsequently, we made two key assumptions: (1) the EV fleet would exhibit the same parking profile as non-EV users, and (2) on the day with the highest value of (28 May), it is assumed that 100% of EV users exclusively utilize the N1 parking facility. Consequently, the estimation of the maximum EV parking on a day () is derived from the number of EV users and the ratio between (on that day) and 2884 (the yearly maximum of ). Equation (17) calculates the maximum EV parking on 29 March (red circle (left) in Figure 8) with 100 EV users on the campus.
Furthermore, we varied the total number of EV chargers () based on the ratio of total EV users, ranging from 10% to 100%. Additionally, we varied the ratio of the two types of chargers (L1 and L2) based on . All assumptions related to EV scenarios are summarized in Table 4.
5.2. Assumptions of the Financial Analysis
Historically, the vehicle parking and EV charging patterns at N1 parking have demonstrated a consistent trend, with stability observed except for 2020 to 2022, impacted by the COVID-19 pandemic. We assumed that the financial benefits to individual EVs from the proposed G2V system over the entire project duration (15 years) would exhibit minimal deviation compared to those witnessed in 2019. Based on these assumptions, we evaluated NPV as part of the financial analysis. In the financial analysis, we formulated three tariff structures for the electricity trading between the grid operator and the Monash microgrid. The average spot price in 2019 hovers around $0.1/kWh, leading us to adopt a flat-rate pricing at this value. For the ToU tariff, we structured it with peak and off-peak periods, with Victoria’s case in Australia [32], while assigning different prices yet aligning with the mean value of $0.1/kWh. Detailed explanations of all assumptions utilized in calculating NPV are provided in Table 5, Table 6 and Table 7 below with Australian dollar currency in 2023.
6. Results
In this section, our primary focus revolves around assessing the efficacy of G2V charging within the context of grid operations, explicitly delving into Algorithms 1 and 2. Subsequently, we thoroughly evaluate the financial benefits inherent in the G2V system, concurrently exploring the optimal infrastructure design strategy through NPV calculations.
In the simulation, we introduced variations in multiple parameters, including the total number of EV users on campus, the overall count of EV chargers, the ratio between two charger types (L1 and L2), and the tariff structure as delineated in Table 4 and Table 5. To ensure a transparent and systematic comparison, we implemented two distinct systems, each with systematically altered ratios of the two charger types. The specifics of these variations are comprehensively detailed in Table 8. The L1-dominant system is characterized by a 90% representation of L1 chargers from the total EV chargers, indicative of a lower charging power system. Conversely, the L2-dominant system follows a vice-versa configuration.
6.1. Daily Performance by Scenarios
Figure 9 illustrates a one-day simulation for three distinct G2V scenarios, denoted as S1 (a), S2 (b), and S3 (c), conducted on 29 March 2019, with 1200 EV users (835 in EV parking) and 1200 EV chargers. Each graph compares convenience and G2V charging in both L1 (black) and L2-dominant (red) systems with a subplot (blue, in Equation (7) or in Equation (8)).
In the L2-dominant system, convenience charging peaks at 12.9 MW at 10 a.m., surpassing the transformer limit and rendering it incapable of accommodating 835 EV parking requirements for the day. Conversely, G2V charging controls total power consumption below the transformer limit. The abundance of 7 kW chargers in the L2-dominant system allows G2V to satisfy over 90% (d in Figure 9) of EV user charging needs, showcasing substantial flexibility in optimization. However, convenience charging in the L1-dominant system reaches only 10.2 MW at 10 a.m., not exceeding the transformer limit but fulfilling approximately 50% (d in Figure 9) of EV user requirements due to a lower number of 7 kW chargers. The prevalence of 2 kW chargers indicates less optimization flexibility, resulting in a high similarity between convenience and G2V charging.
Scenario 1 demonstrates the highest daily profits in both systems, with the L2-dominant system exhibiting a superior profit increase of 9.3% compared to convenience charging. This is attributed to the high optimization flexibility, enabling the arrangement of more charging schedules during lower RRP periods and thereby maximizing trading profits more effectively. Scenario 3 yields identical daily profits to convenience charging, as the energy trading profit remains fixed. Consequently, as long as the total energy trading amount remains constant, convenience and G2V charging demonstrate equivalent daily profits. In summary, the G2V algorithm significantly influences optimization in high-charging power systems, achieving high charging rates with lower similarity between convenience and G2V charging. Further details regarding the daily performance of G2V algorithms are elucidated in Table 9.
6.2. Violations: Transformer Limit and Voltage Magnitude Limit
Figure 10 illustrates the annual maximum power demand within the Monash microgrid for convenience charging and G2V charging, categorized by the number of EV users in 2019. The power consumption encompasses Monash load, incorporating solar PV generation, and the cumulative EV charging demand based on L1 and L2-dominant systems. Notably, the L2-dominant system exhibits a notable surge in total power consumption, attributed to the substantial presence of 7 kW chargers. In the case of convenience charging, it becomes unfeasible to accommodate more than 500 EVs without violating the transformer limit in both systems. Conversely, G2V charging demonstrates the capacity to accommodate over 1500 EVs without breaking the TL violation.
As delineated in Algorithm 2, the assessment of voltage magnitude across individual nodes within the Monash microgrid is facilitated via power flow analysis. An algorithm is deployed to ensure that the voltage levels at each node remain within the prescribed standard range of 0.95 to 1 per unit. The envisaged algorithm for voltage regulation orchestrates the adjustment of aggregated EVs’ charging capacities within the microgrid, employing a flexible curtailment strategy that diminishes their present values by 5%.
Figure 11 illustrates the annual voltage levels across all nodes within the campus in 2019, contingent upon the quantity of EVs present. Without voltage regulation (convenience charging), the microgrid experiences voltage irregularities beyond the threshold of 700 EVs. Conversely, the proposed algorithm demonstrates the capacity to uphold node voltages within the designated standard range. Notably, the fluctuations in node voltages exhibit greater stability, thereby demonstrating the efficacy of the proposed voltage control methodology. Consequently, the microgrid can adeptly accommodate over 1000 EVs without encountering issues about voltage magnitude while ensuring that all nodes remain within the predetermined range.
6.3. Comparison Scenarios
Figure 12 illustrates the NPV trend based on the total number of EV users in an L2-dominant system. The figure encompasses convenience charging (on the left) and G2V charging (on the right) under three distinct scenarios, namely S1, S2, and S3. In all instances, NPV exhibits an upward trajectory with the increasing number of EV users attributed to enhanced power trading. The simulation of NPV was conducted with up to 500 EVs in convenience charging, driven by constraints outlined in Section 6.2. The flat-rate contract (S3) demonstrates a higher NPV of $0.87 million with 500 EVs than the RRP contract (S1). This discrepancy arises from the parking arrival profile, leading to concentrated charging demand around 10 a.m., the morning peak. Consequently, the Monash microgrid must meet high charging demand during the high RRP period, resulting in lower energy trading profits for S1 than S3. However, when simulating NPV up to 1500 EVs in G2V charging, scenario 1 with the RRP contract yields the highest NPV of $2.12 million. G2V charging efficiently schedules charging demand during lower RRP periods (less than flat rate), maximizing trading profits in scenario 1. Due to its tariff structure, the ToU tariff exhibits the least NPV. Scenario 2 can generate better profits only when optimization allocates charging demand before or after 9 a.m. However, the parking arrival profile (focused on between 9 a.m. and 9 p.m.) results in most charging occurring during the peak period, priced at $0.16/kWh, leading to the worst NPV result. In summary, the flat-rate contract emerges as the optimal choice without charging schedule optimization. Conversely, G2V charging effectively maximizes trading profits under the RRP contract.
Figure 13 presents a comparative analysis between convenience and G2V charging in both L1 and L2-dominant systems. G2V charging significantly increases NPV by 46% in L1 and 96% in L2-dominant systems when considering 500 EVs under scenario 1. This suggests that incorporating more 7 kW chargers results in two key advantages: (1) a boost in the overall energy trading volume, and (2) the optimization efficiency is maximized due to heightened scheduling flexibility. Consequently, the profitability of G2V charging demonstrates a tendency to be maximized in L2-dominant systems.
On the contrary, the ToU tariff (S2) exhibits a modest 11.8% increase in NPV within the L2-dominant system. As previously elucidated, the G2V algorithm necessitates arranging charging schedules before 9 a.m. and after 9 p.m. to optimize profitability in S2. However, due to the parking profile, most charging activities are concentrated during midday, resulting in negligible NPV differences compared to convenience charging.
Under the framework of a flat-rate contract (S3), the aggregator purchases electricity from the main grid at a predetermined unit price (, /kWh) for all t. Consequently, the unit trading profits () also remain constant across all time slots t for both G2V and convenience charging. Therefore, in terms of trading profits, provided EVi maintains a consistent charging power (, 2 or 7 kW), G2V charging yields identical daily profits (expressed in Equation (7)) compared to convenience charging within the flat-rate contract framework. Within this context, as long as the aggregator maintains a consistent number and EV charger configurations (power ratio, L1-dominant or L2-dominant system), the proposed G2V system generates equivalent daily profits and NPV alongside convenience charging under the flat-rate contract (S3). Table 10 provides a comprehensive overview of the NPV increases in G2V charging compared to convenience charging across various scenarios.
6.4. Optimal Range of L2 Ratio
As we discussed in Section 6.3, G2V shows the trend of better performance in the high charging power system. In this section, we explore the optimal configuration of power ratio of the charging system.
The left graph of Figure 14 delineates the NPV based on the L2 charger ratio among the total EV chargers with varying numbers of EV users in scenario 1. To facilitate a clear comparison, the total number of EV chargers across all data points was fixed at 50% of the total EV users.
The NPV demonstrates an increasing trend with the rise in EVs, attributable to heightened energy trading. However, the NPV reaches its peak when the L2 ratio is fixed at 70%, depicted in the left graph (the vertical red dot line) of Figure 14, indicating an optimal configuration (the maximum NPV). This optimal point is attributed to the fact that, at a 70% L2 ratio, the average charging achievement reaches a plateau of approximately 90%, as depicted in the right graph (the horizon red dot line) of Figure 14. This implies that surpassing a 70% L2 ratio does not significantly augment energy trading volume. However, the capital cost increases sharply in proportion to the number of L2 chargers. Consequently, NPV experiences a decline beyond the 70% L2 ratio from the total EV chargers.
The 70% L2 ratio is optimal when coupled with a 50% EV charger ratio from the total EV numbers. However, it is essential to note that the optimal L2 point varies depending on the EV charger ratio relative to the total EV users.
6.5. Optimal Range of EVSE Ratio
As elucidated in Section 6.4, an excessively high L2 ratio can lead to a reduction in NPV. The optimal L2 ratio also varies depending on the EV charger ratio relative to the total EV users. This section examines the interaction between the EV charger ratio and its optimal L2 configuration.
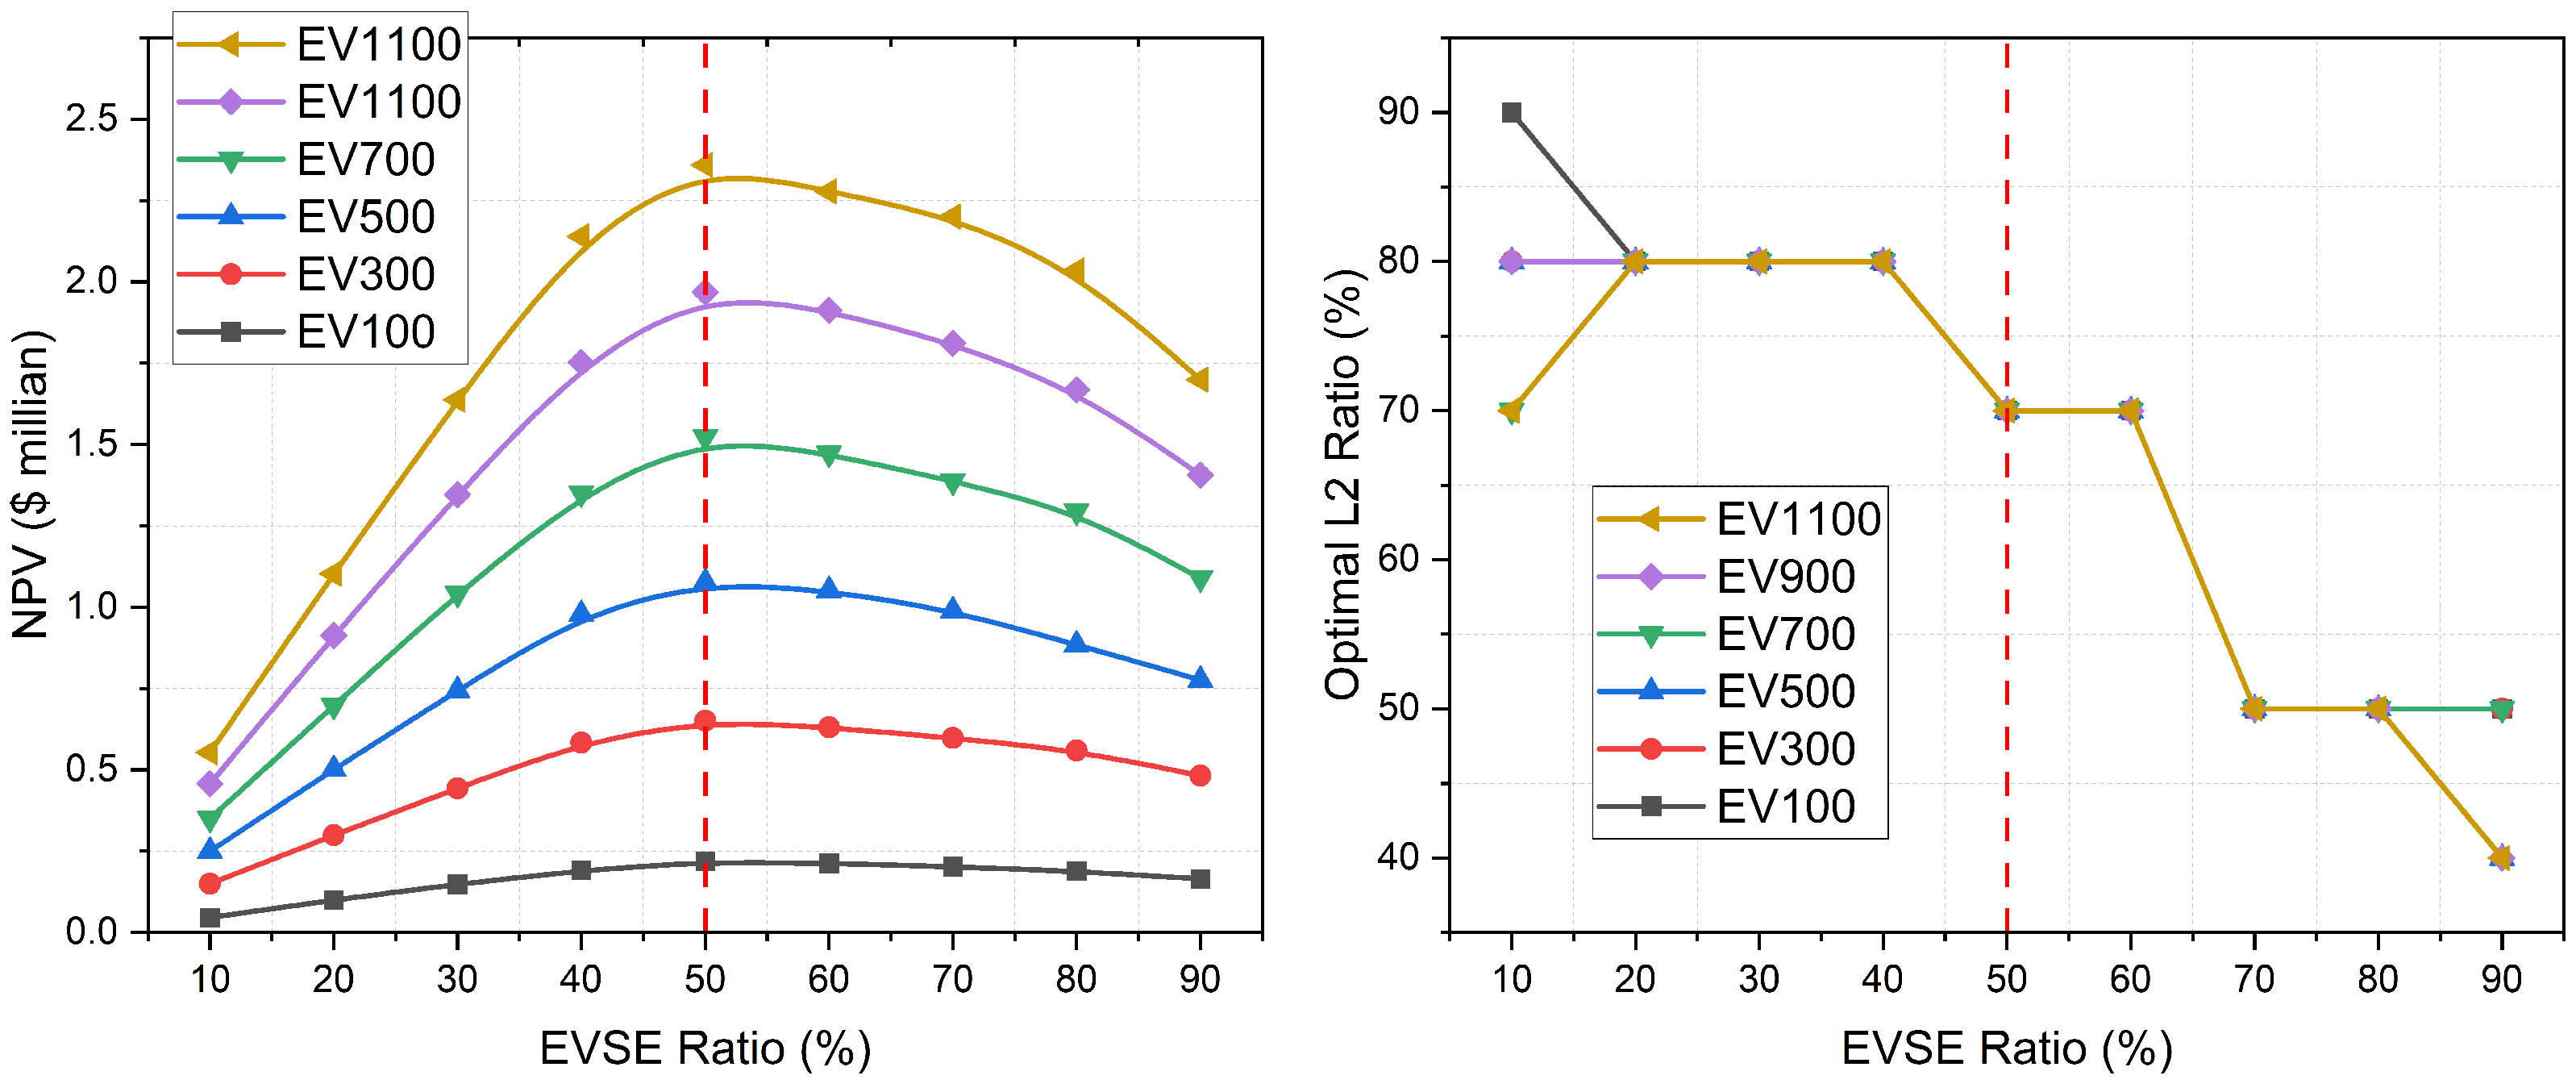
The left graph of Figure 15 illustrates the NPV based on the EV charger ratio among the total EV users within scenario 1. Each data point in this figure represents the highest NPV identified through the simulations. Essentially, each data point represents the optimal condition uncovered in this research, where these points align with varying L2 ratios, as illustrated in the right panel. The NPV exhibits a positive trend with increasing EVs driven by heightened energy trading. Nevertheless, the NPV attains its maximum when the EV charger ratio is 50% depicted in the left graph (the red dot line) of Figure 15, regardless of the L2 charger ratio, signifying an optimal configuration.
This phenomenon arises from the average daily parking occupancy of approximately 40% (1171 vehicles) relative to the maximum capacity observed on 1 June 2019, which recorded 2884 vehicles. Consequently, on average, only 40% of EV users utilize the charging facility in the simulation. Therefore, exceeding a 50% EV charger ratio does not notably increase energy trading volume while concurrently escalating capital costs in direct proportion to the number of EV chargers. Furthermore, as depicted in the right panel, the optimal L2 ratio varies depending on the EV charger ratio. The graph illustrates an inverse relationship between these two parameters. For instance, at a 50% EV charger ratio (the red dot line), a 70% L2 ratio yields the highest NPV irrespective of the number of EVs. This implies that if the aggregator invests in more than 50% of EV chargers, maintaining less than 70% of the L2 ratio ensures superior financial benefits. This is because, despite possessing a substantial number of EV chargers, only a fraction is utilized daily (averaging 50%). As discussed in Section 6.4, excessive L2 chargers can decrease NPV within the charging system. Conversely, if the aggregator invests less than 50% of EV chargers, maintaining a higher L2 ratio implies better financial benefits. This is because an insufficient number of L2 chargers fails to meet the overall charging needs of EV users (resulting in lower charging achievement), adversely affecting financial benefits through a reduced volume of energy trading.
7. Conclusions
This paper delves into the optimal investment strategy for G2V systems within the Monash microgrid. The Monash campus is an ideal environment for implementing smart charging systems due to drivers’ longer parking duration (exceeding five hours per day). In conjunction with algorithm design, infrastructure design plays a pivotal role in shaping the performance and economic aspects of smart charging systems. Therefore, careful coordination is paramount. This study meticulously analyzed the optimal infrastructure configuration of EVSE and tariff structure in response to fluctuations in the number of EV users on campus, considering perspectives from project finance. Our results indicate that violation control stands out as a significant advantage of the G2V system. Without a charging control system, the Monash microgrid can sustain a maximum of 500 EVs. However, the proposed G2V scheme adeptly manages a substantial EV fleet, exceeding 1000 EVs, without encountering power trading or node voltage violation concerns. The optimal ratio of EVSEs (from the total EV users) is closely correlated with the parking profile of EV users. A low EVSE number can reduce operating costs, while an excessively high number within the system can result in unnecessary investment costs, leading to unfavorable financial outcomes. The optimal power ratio necessitates a more intricate optimization approach. Employing a low-power system (L1-dominant) allows the aggregator to minimize investment costs. However, this diminishes the algorithm’s flexibility (sharp increase in Mode 3), resulting in decreased satisfaction among EV users and operating profits. Conversely, a high-power system (L2-dominant) can positively impact project finance metrics (e.g., NPV) by maximizing the optimization performance of the algorithm. Nevertheless, excessive L2 chargers within the system can lead to unnecessary capital expenditures, as energy trading amounts saturate at specific thresholds. Hence, achieving an appropriate balance between L1 and L2 chargers ratios is crucial. In the context of the Monash microgrid, maintaining a 50% EVSE ratio and a 70% L2 charger ratio ensures the highest NPV. The optimal tariff structure depends on the control scheme. The flat-rate tariff ensures the highest NPV without a control system due to the inherent parking patterns at the Monash campus. However, the G2V scheme exhibits maximal algorithm performance within a dynamic rate (spot price) tariff.
In conclusion, devising an investment strategy for the smart charging system presents a highly complex optimization problem, necessitating simultaneous consideration of various internal/external factors such as EV users’ uncertainty and grid conditions. The EVSE ratio, derived from the total number of EV users, emerges as a crucial parameter determining the optimal charging power ratio. Moreover, when considering the usage rate of charging facilities, increasing EVSE numbers within the system lead the aggregator to prioritize possessing a relatively higher number of low-charging power units, thereby maximizing financial advantages.
In this study, we have discussed the potential utilization of smart charging systems at the microgrid level and optimal strategies for implementing such systems. However, it is essential to note that the concept of smart charging can be expanded and applied on a much broader scale. With the increasing adoption of renewable energy in grid systems, the aggregated battery capacity resulting from smart charging could serve as an energy buffer to mitigate the intermittency of DERs, thus significantly enhancing the quality of the power grid. Furthermore, at the whole grid level, battery storage systems possess inherent characteristics, such as rapid response times, which enable them to address stability and reliability issues within the power network, including frequency control ancillary services (FCASs). This aspect necessitates additional, comprehensive investigation in subsequent research, and the following limitations require further exploration in future studies.
- 1.
- Firstly, this study did not consider the annual increasing trend of EV users on campus. While the simulation increased the total number of EV users to analyze various operational issues within the Monash microgrid, for the convenience of NPV calculation in financial analysis, the total number of EV users on campus was assumed to remain constant throughout the total project duration. However, a more realistic consideration is required for this aspect, and future research should integrate yearly variability in the increasing number of EV users to mitigate this limitation.
- 2.
- Secondly, the simulation only considers a single EV model (battery size), overlooking the anticipated increase in battery size in the future. Incorporating realistic trends in battery size growth for project finance calculations is essential.
- 3.
- Lastly, the study relies on simplistic estimations of EV users’ behavior. While campus drivers’ charging and parking patterns exhibit yearly stability, addressing EV user uncertainty issues requires more nuanced approaches, such as employing prediction models. These limitations highlight areas for further investigation to enhance the comprehensiveness and accuracy of future studies.
Author Contributions
Conceptualization, S.Y.; methodology, S.Y.; software, S.Y.; validation, S.Y.; formal analysis, S.Y.; investigation, S.Y.; resources, S.Y.; data curation, S.Y.; writing—original draft preparation, S.Y.; writing—review and editing, R.D.; visualization, S.Y.; supervision, R.D. All authors have read and agreed to the published version of the manuscript.
Funding
This research received no external funding.
Data Availability Statement
The datasets presented in this article are not readily available due to privacy restrictions.
Conflicts of Interest
The authors declare no conflict of interest.
Abbreviations
The following abbreviations are used in this manuscript:
| AEMO | Australian Energy Market Operator |
| ARENA | Australian Renewable Energy Agency |
| BITRE | Bureau of Infrastructure and Transport Research Economics |
| DERs | Distributed Energy Resources |
| DNSP | Distributed Network Service Provider |
| DR | Demand Response |
| EV | Electric Vehicle |
| EVSE | Electric Vehicle Supply Equipment |
| FCAS | Frequency Control Ancillary Services |
| G2V | Grid-to-Vehicle |
| ICE | Internal Combustion Engine |
| ICT | Information and Communication Technology |
| NEM | National Electricity Market |
| NPV | Net Present Value |
| MPC | Model Predictive Control |
| PV | Photovoltaic |
| SoC | State of Charging |
| TNSP | Transmission Network Service Provider |
| ToU | Time of Use |
| V2G | Vehicle-to-Grid |
References
- International Energy Agency. World Energy Outlook 2023; IEA: Paris, France, 2023.
- Electric Vehicle Council. State of Electric Vehicles; Electric Vehicle Council: Sydney, Australia, 2023. [Google Scholar]
- Department of Infrastructure, Transport, Cities and Regional Development. Electric Vehicle Uptake: Modelling a Global Phenomenon; Australian Government: Canberra, Australia, 2019.
- Australian Energy Market Operator. Integrated System Plan; AEMO: Melbourne, Australia, 2023. [Google Scholar]
- Li, M.; Lenzen, M. How many electric vehicles can the current Australian electricity grid support? Int. J. Electr. Power Energy Syst. 2020, 117, 105586. [Google Scholar] [CrossRef]
- Acharige, S.S.; Haque, M.E.; Arif, M.T.; Hosseinzadeh, N.; Hasan, K.N.; Oo, A.M.T. Review of electric vehicle charging technologies, standards, architectures, and converter configurations. IEEE Access 2023, 11, 41218–41255. [Google Scholar] [CrossRef]
- Nimalsiri, N.I.; Mediwaththe, C.P.; Ratnam, E.L.; Shaw, M.; Smith, D.B.; Halgamuge, S.K. A survey of algorithms for distributed charging control of electric vehicles in smart grid. IEEE Trans. Intell. Transp. Syst. 2019, 21, 4497–4515. [Google Scholar] [CrossRef]
- Mahmud, K.; Town, G.E.; Morsalin, S.; Hossain, M. Integration of electric vehicles and management in the internet of energy. Renew. Sustain. Energy Rev. 2018, 82, 4179–4203. [Google Scholar] [CrossRef]
- Sadeghian, O.; Oshnoei, A.; Mohammadi-Ivatloo, B.; Vahidinasab, V.; Anvari-Moghaddam, A. A comprehensive review on electric vehicles smart charging: Solutions, strategies, technologies, and challenges. J. Energy Storage 2022, 54, 105241. [Google Scholar] [CrossRef]
- Secchi, M.; Barchi, G.; Macii, D.; Petri, D. Smart electric vehicles charging with centralised vehicle-to-grid capability for net-load variance minimisation under increasing EV and PV penetration levels. Sustain. Energy Grids Netw. 2023, 35, 101120. [Google Scholar] [CrossRef]
- Yang, X.; Zhang, Y.; Zhang, F.; Xu, C.; Yi, B. Enhancing utilization of PV energy in building microgrids via autonomous demand response. IEEE Access 2021, 9, 23554–23564. [Google Scholar] [CrossRef]
- Dorokhova, M.; Martinson, Y.; Ballif, C.; Wyrsch, N. Deep reinforcement learning control of electric vehicle charging in the presence of photovoltaic generation. Appl. Energy 2021, 301, 117504. [Google Scholar] [CrossRef]
- Hu, Y.; Zhang, M.; Wang, K.; Wang, D. Optimization of orderly charging strategy of electric vehicle based on improved alternating direction method of multipliers. J. Energy Storage 2022, 55, 105483. [Google Scholar] [CrossRef]
- Hoque, M.M.; Khorasany, M.; Razzaghi, R.; Jalili, M.; Wang, H. Network-Aware Coordination of Aggregated Electric Vehicles Considering Charge-Discharge Flexibility. IEEE Trans. Smart Grid 2022, 14, 2125–2139. [Google Scholar] [CrossRef]
- Hoque, M.M.; Khorasany, M.; Razzaghi, R.; Wang, H.; Jalili, M. Transactive coordination of electric vehicles with voltage control in distribution networks. IEEE Trans. Sustain. Energy 2021, 13, 391–402. [Google Scholar] [CrossRef]
- Tahmasebi, M.; Ghadiri, A.; Haghifam, M.; Miri-Larimi, S. MPC-based approach for online coordination of EVs Considering EV usage uncertainty. Int. J. Electr. Power Energy Syst. 2021, 130, 106931. [Google Scholar] [CrossRef]
- Mediwaththe, C.P.; Smith, D.B. Game-theoretic electric vehicle charging management resilient to non-ideal user behavior. IEEE Trans. Intell. Transp. Syst. 2018, 19, 3486–3495. [Google Scholar] [CrossRef]
- Tan, J.; Wang, L. Real-time charging navigation of electric vehicles to fast charging stations: A hierarchical game approach. IEEE Trans. Smart Grid 2015, 8, 846–856. [Google Scholar] [CrossRef]
- Cao, Y.; Wang, H.; Li, D.; Zhang, G. Smart online charging algorithm for electric vehicles via customized actor–critic learning. IEEE Internet Things J. 2021, 9, 684–694. [Google Scholar] [CrossRef]
- Crow, M.L. Electric vehicle scheduling considering co-optimized customer and system objectives. IEEE Trans. Sustain. Energy 2017, 9, 410–419. [Google Scholar]
- Jalilian, F.; Mansour-Saatloo, A.; Mirzaei, M.A.; Mohammadi-Ivatloo, B.; Zare, K. Optimal participation of electric vehicles aggregator in energy and flexible ramping markets. In Energy Storage in Energy Markets; Elsevier: Amsterdam, The Netherlands, 2021; pp. 217–233. [Google Scholar]
- McClone, G.; Ghosh, A.; Khurram, A.; Washom, B.; Kleissl, J. Hybrid Machine Learning Forecasting for Online MPC of Work Place Electric Vehicle Charging. IEEE Trans. Smart Grid 2023, 15, 1891–1901. [Google Scholar] [CrossRef]
- Lee, Z.J.; Lee, G.; Lee, T.; Jin, C.; Lee, R.; Low, Z.; Chang, D.; Ortega, C.; Low, S.H. Adaptive charging networks: A framework for smart electric vehicle charging. IEEE Trans. Smart Grid 2021, 12, 4339–4350. [Google Scholar] [CrossRef]
- Shareef, H.; Islam, M.M.; Mohamed, A. A review of the stage-of-the-art charging technologies, placement methodologies, and impacts of electric vehicles. Renew. Sustain. Energy Rev. 2016, 64, 403–420. [Google Scholar] [CrossRef]
- Mustafa, U.; Ahmed, R.; Watson, A.; Wheeler, P.; Ahmed, N.; Dahele, P. A comprehensive review of machine-integrated electric vehicle chargers. Energies 2022, 16, 129. [Google Scholar] [CrossRef]
- Rajakaruna, S.; Shahnia, F.; Ghosh, A. Plug in Electric Vehicles in Smart Grids: Charging Strategies; Springer: Berlin/Heidelberg, Germany, 2014. [Google Scholar]
- Huang, P.; Munkhammar, J.; Fachrizal, R.; Lovati, M.; Zhang, X.; Sun, Y. Comparative studies of EV fleet smart charging approaches for demand response in solar-powered building communities. Sustain. Cities Soc. 2022, 85, 104094. [Google Scholar] [CrossRef]
- Khorasany, M.; Azuatalam, D.; Glasgow, R.; Liebman, A.; Razzaghi, R. Transactive energy market for energy management in microgrids: The monash microgrid case study. Energies 2020, 13, 2010. [Google Scholar] [CrossRef]
- Jiang, W.; Zhen, Y. A real-time EV charging scheduling for parking lots with PV system and energy store system. IEEE Access 2019, 7, 86184–86193. [Google Scholar] [CrossRef]
- Liao, J.T.; Huang, H.W.; Yang, H.T.; Li, D. Decentralized V2G/G2V scheduling of EV charging stations by considering the conversion efficiency of bidirectional chargers. Energies 2021, 14, 962. [Google Scholar] [CrossRef]
- Saadat, H. Power System Analysis, 2nd ed.; McGraw-Hill Primis Custom: Boston, MA, USA, 2002. [Google Scholar]
- Essential Services Commision. Victorian Default Offer Price Determination 2023–2024; Essential Services Commision: Melbourne, Australia, 2023.
- Borlaug, B.; Salisbury, S.; Gerdes, M.; Muratori, M. Levelized cost of charging electric vehicles in the United States. Joule 2020, 4, 1470–1485. [Google Scholar] [CrossRef]
Figure 1.
Monash microgrid.
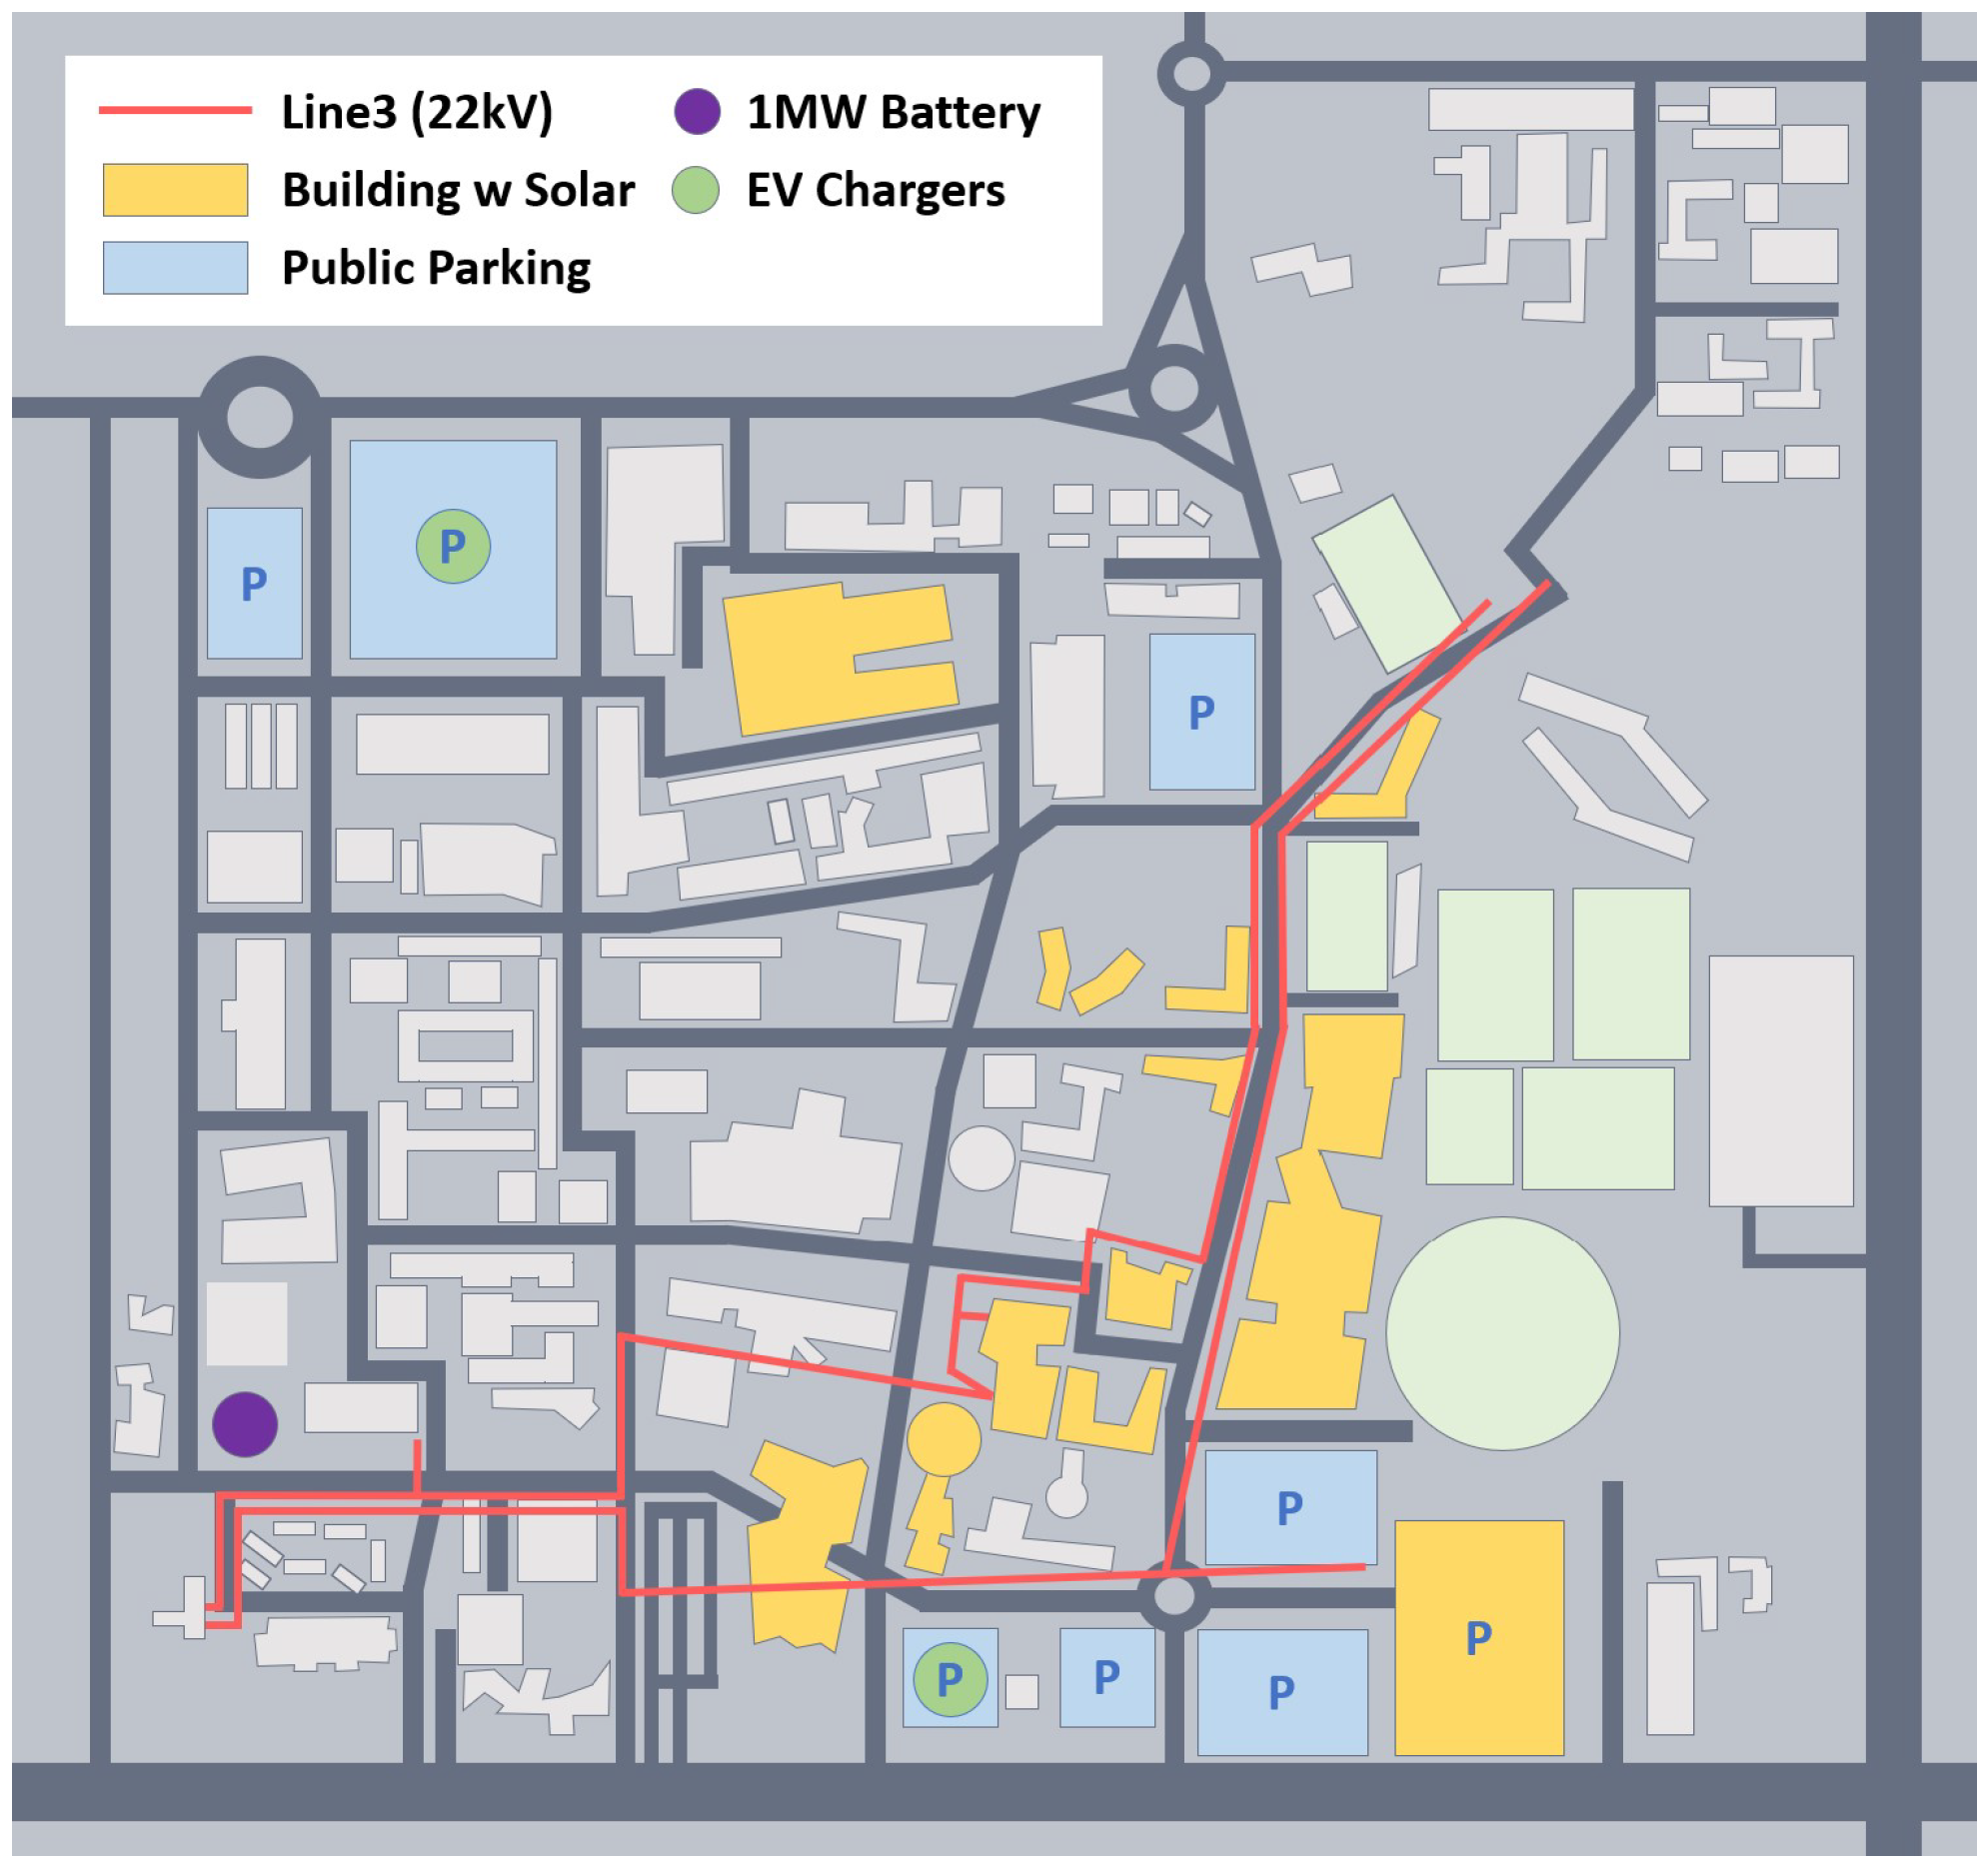
Figure 2.
G2V model (power and cash flow).
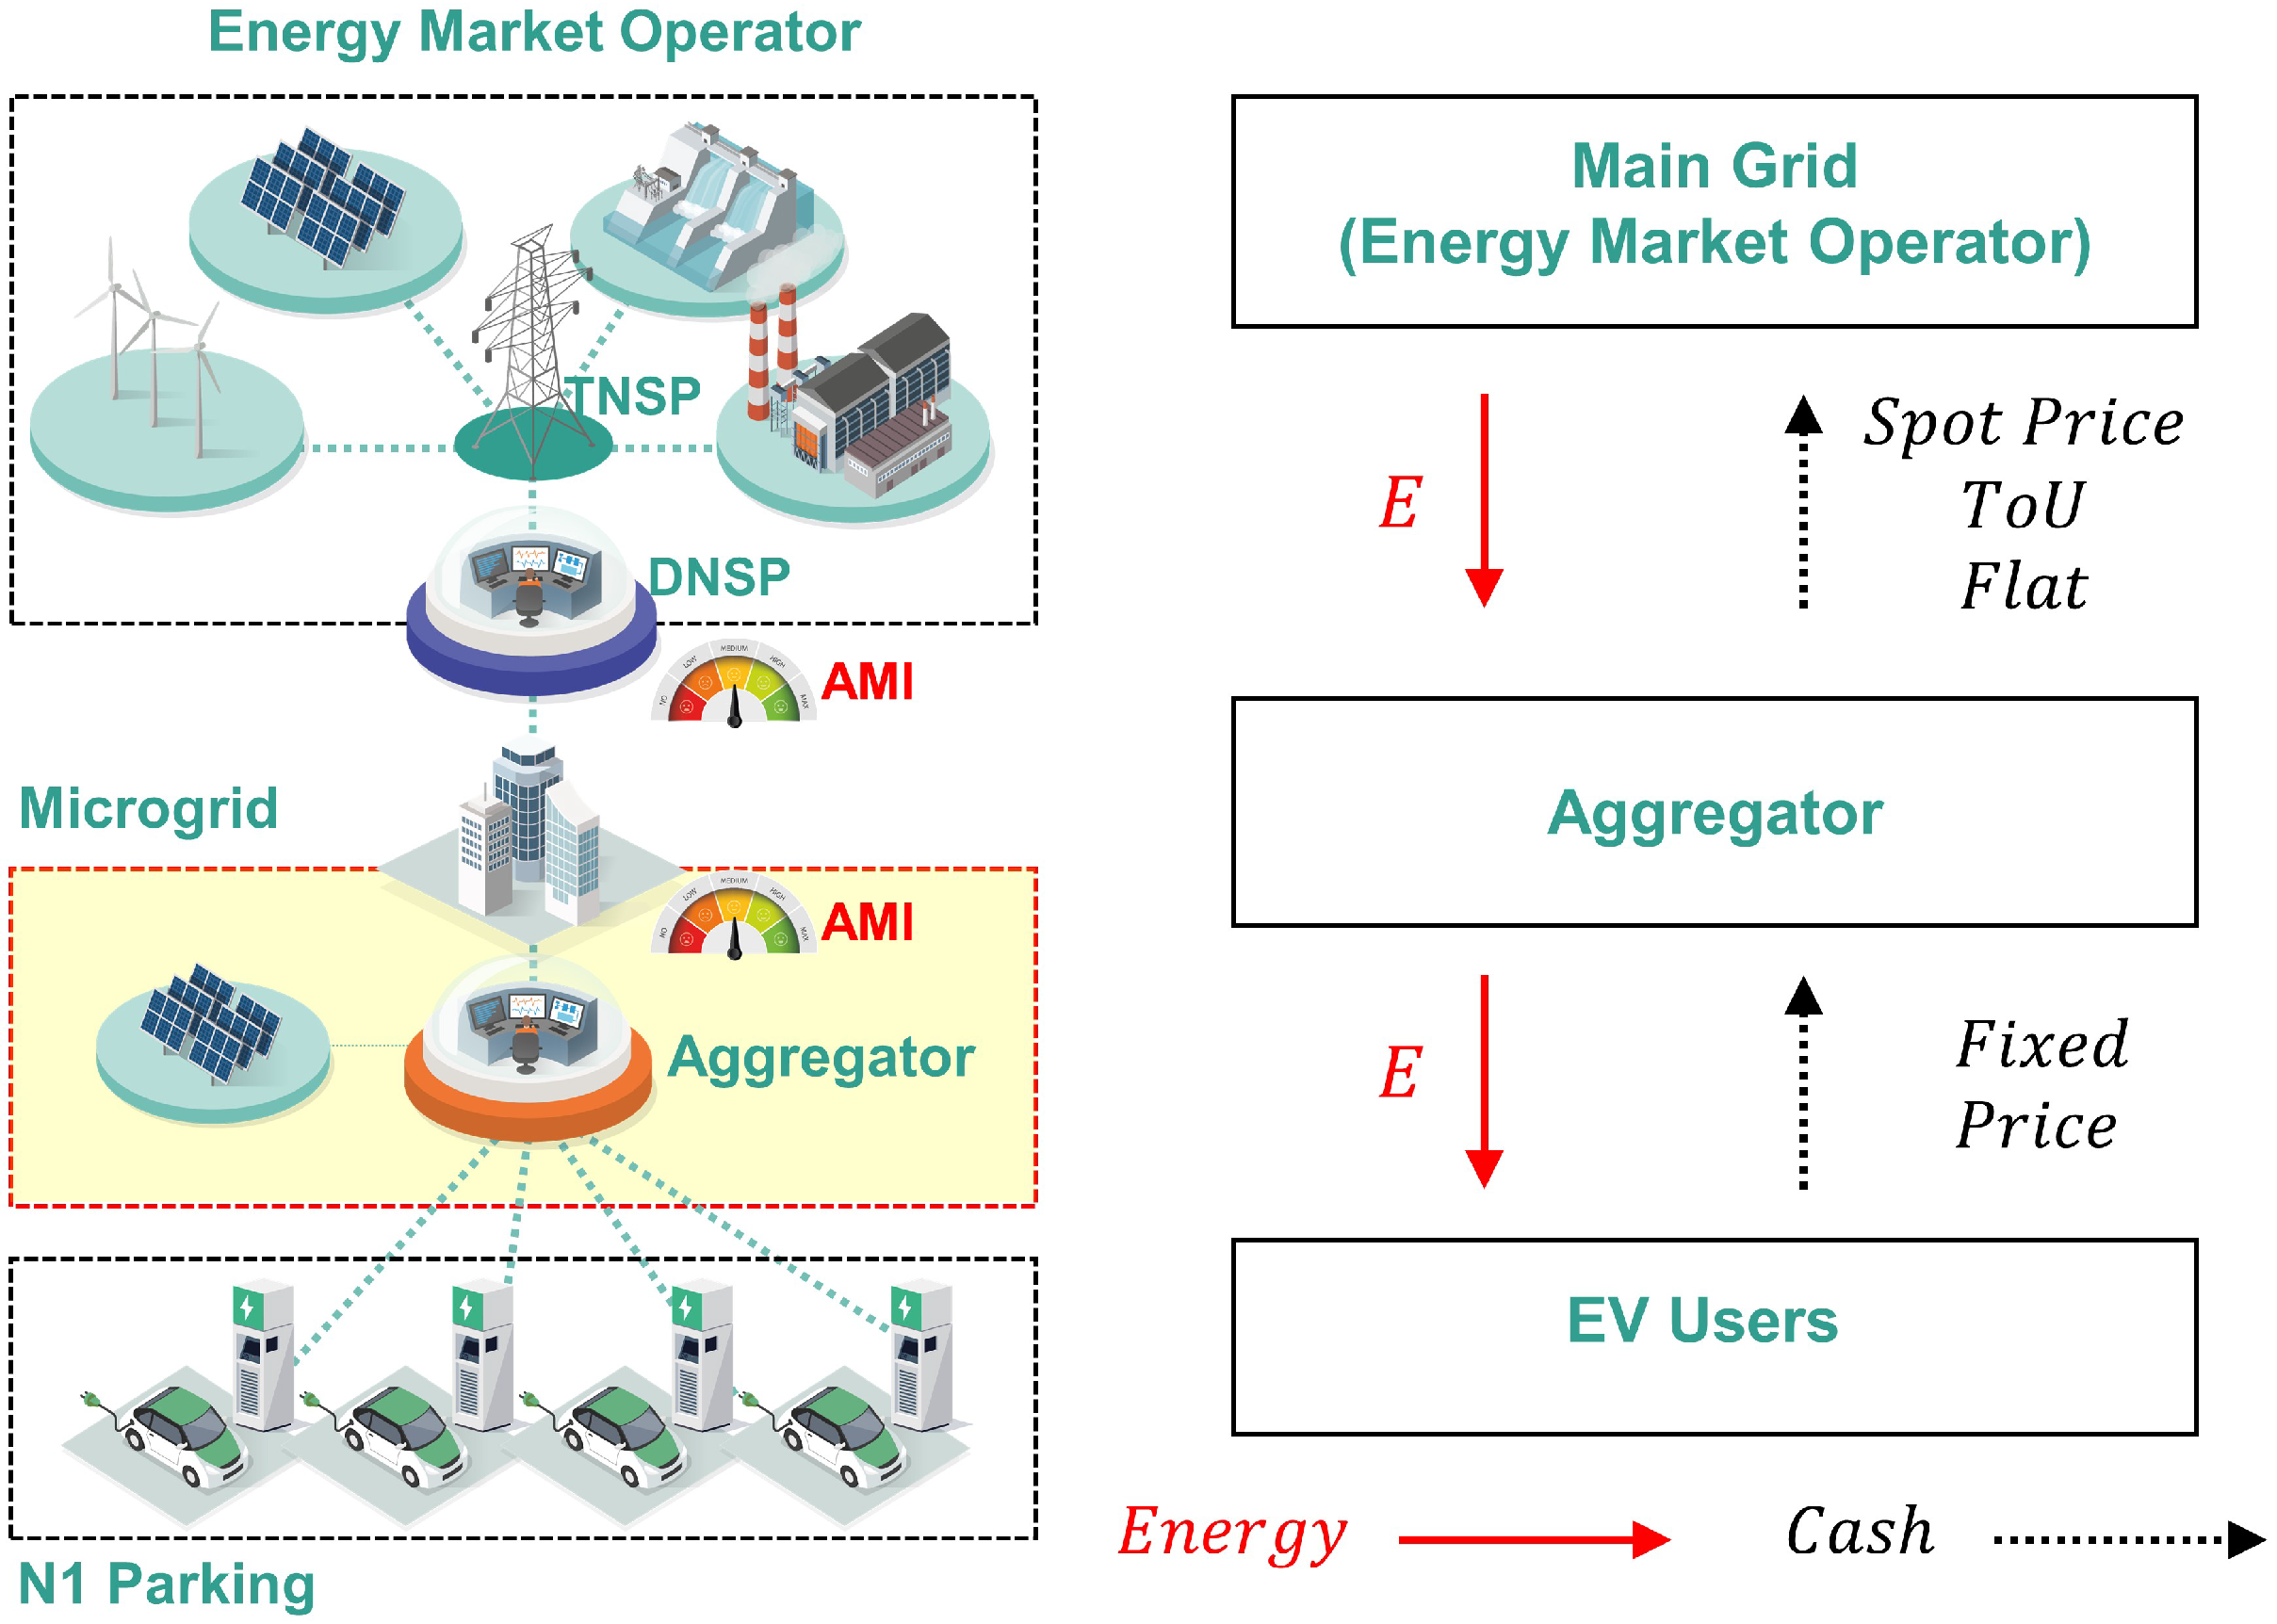
Figure 3.
Observed EV charging profile in 2019.
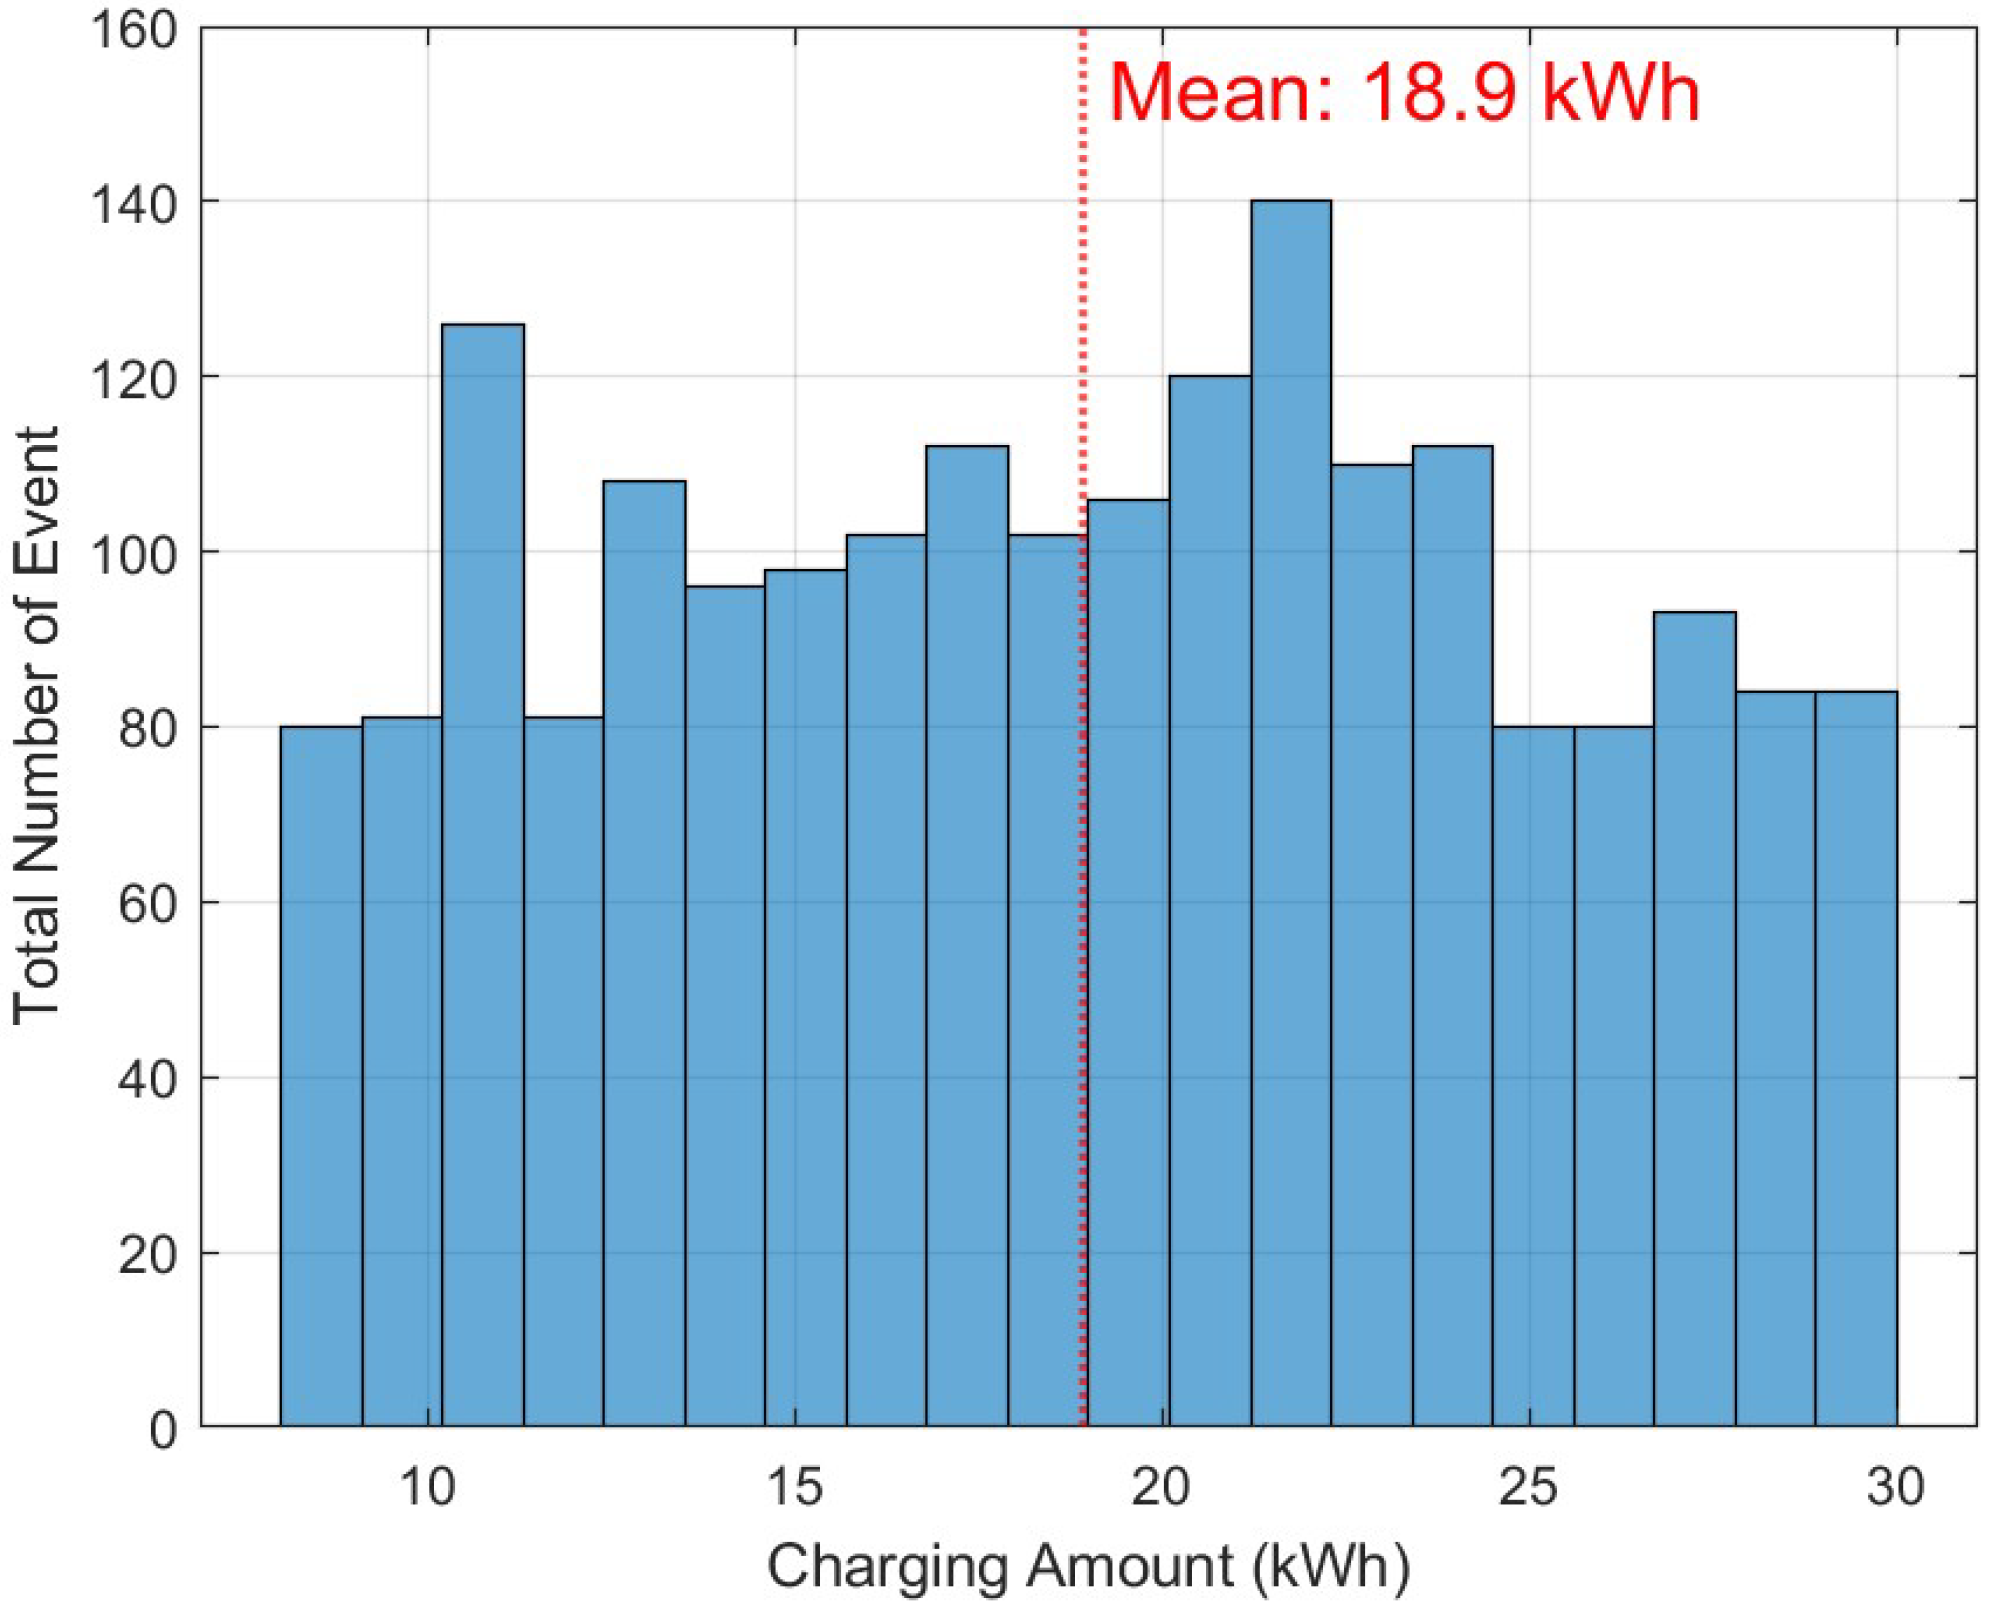
Figure 4.
Daily parking profile (left, 29 March 2019) and yearly maximum daily parking trend (right) in N1 parking.
Figure 4.
Daily parking profile (left, 29 March 2019) and yearly maximum daily parking trend (right) in N1 parking.
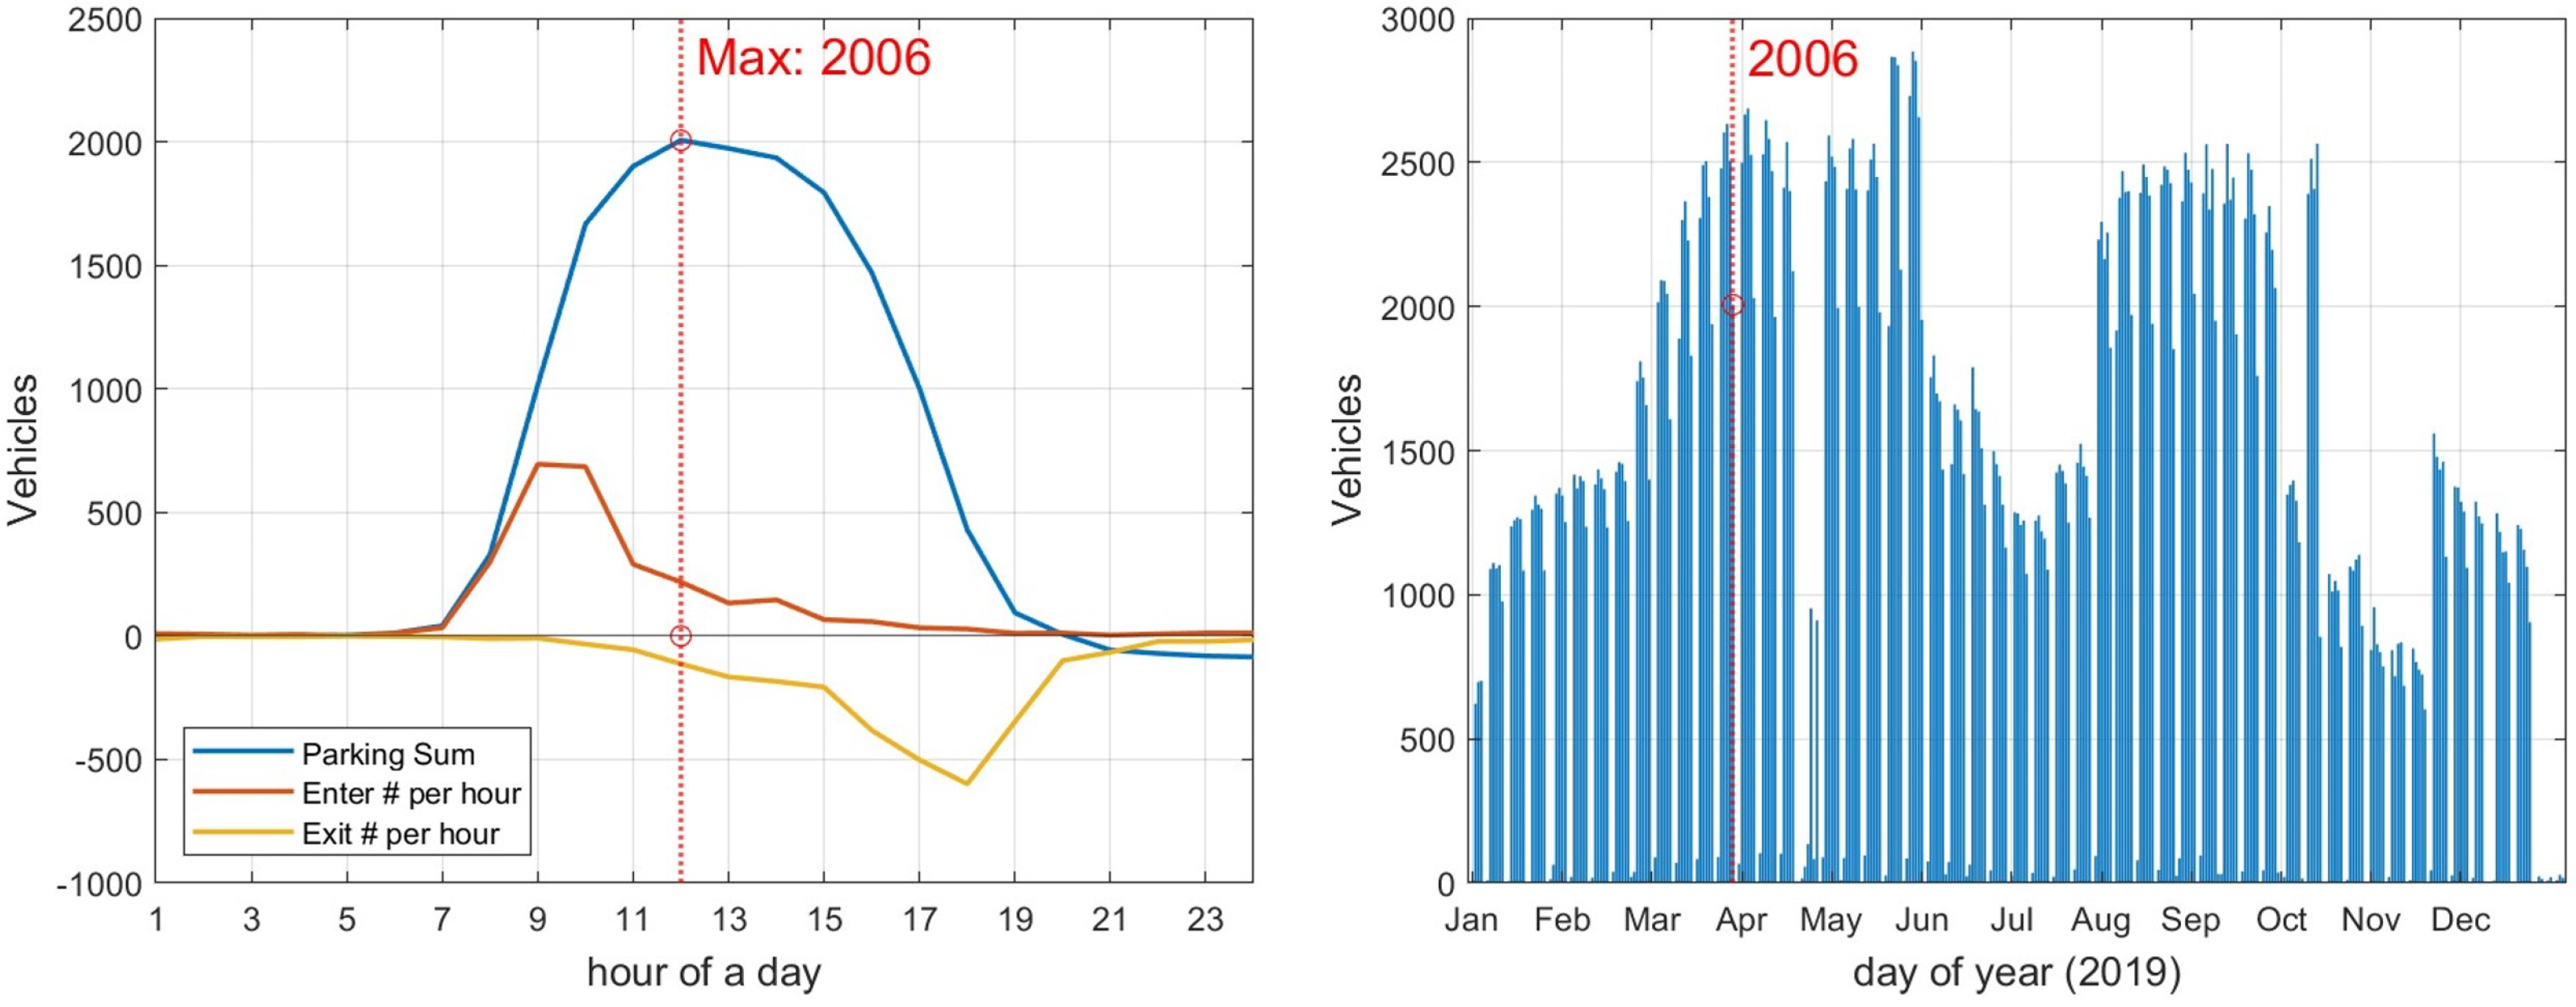
Figure 5.
Cash flow of G2V system.
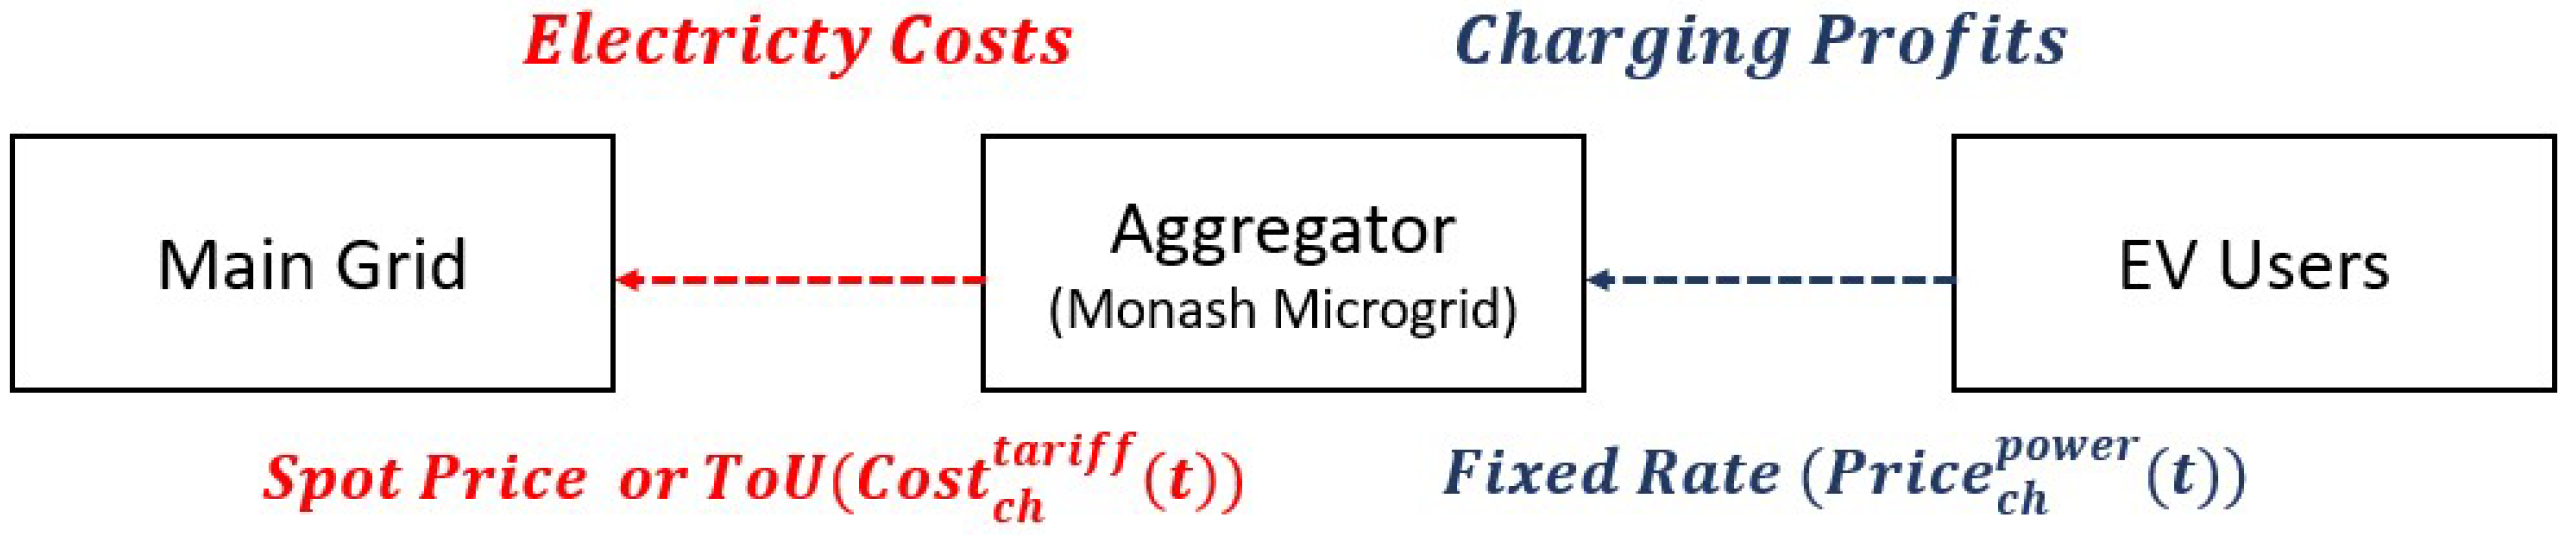
Figure 6.
Algorithm structure.
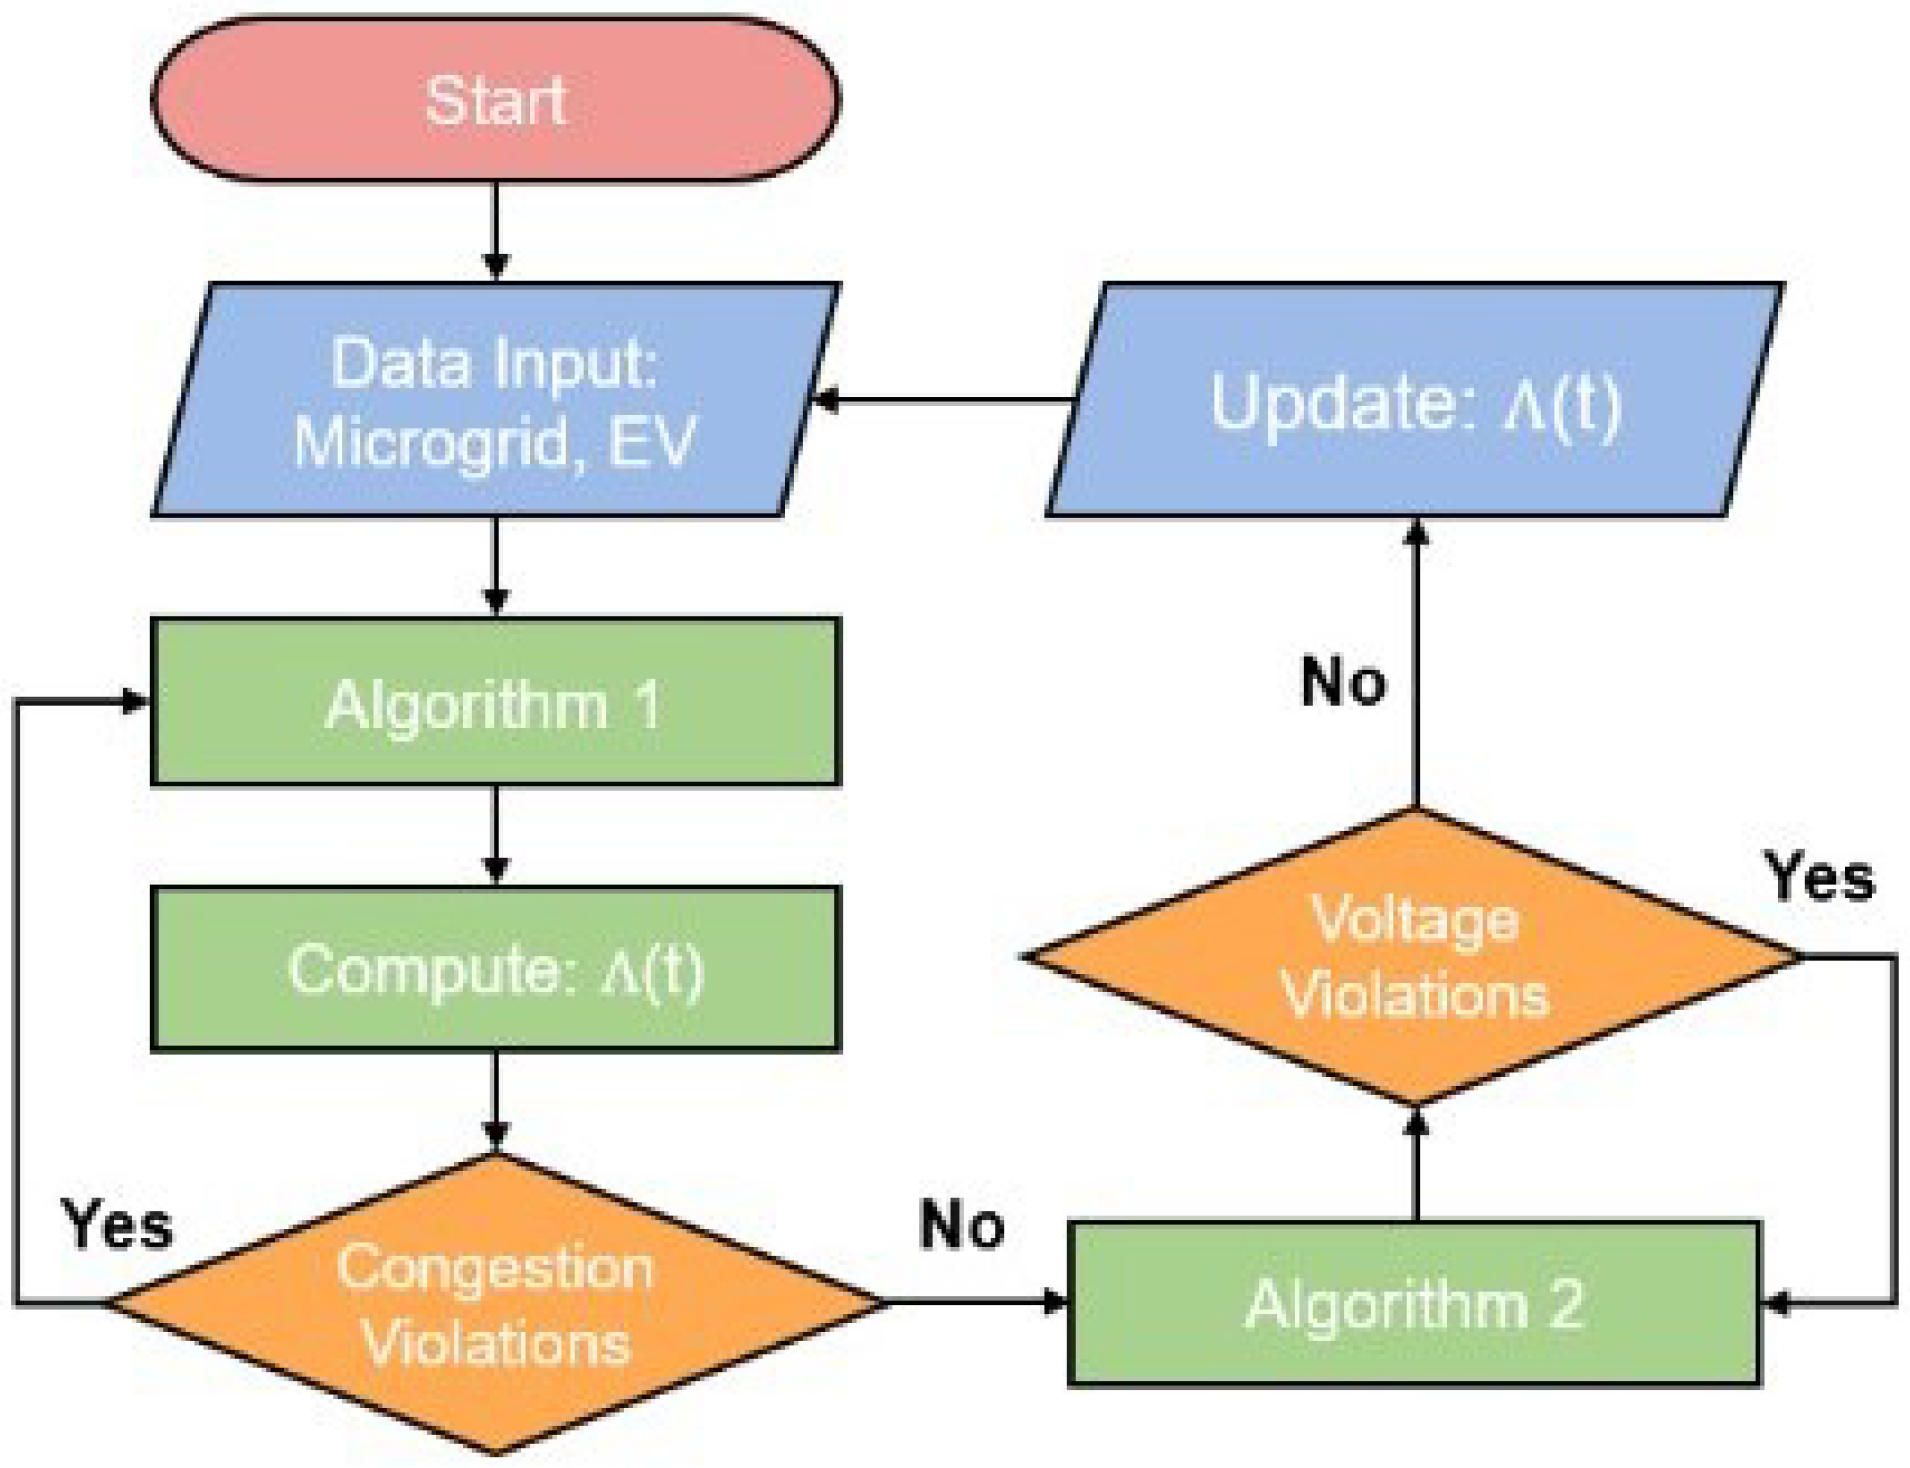
Figure 7.
and for the rolling horizon process.
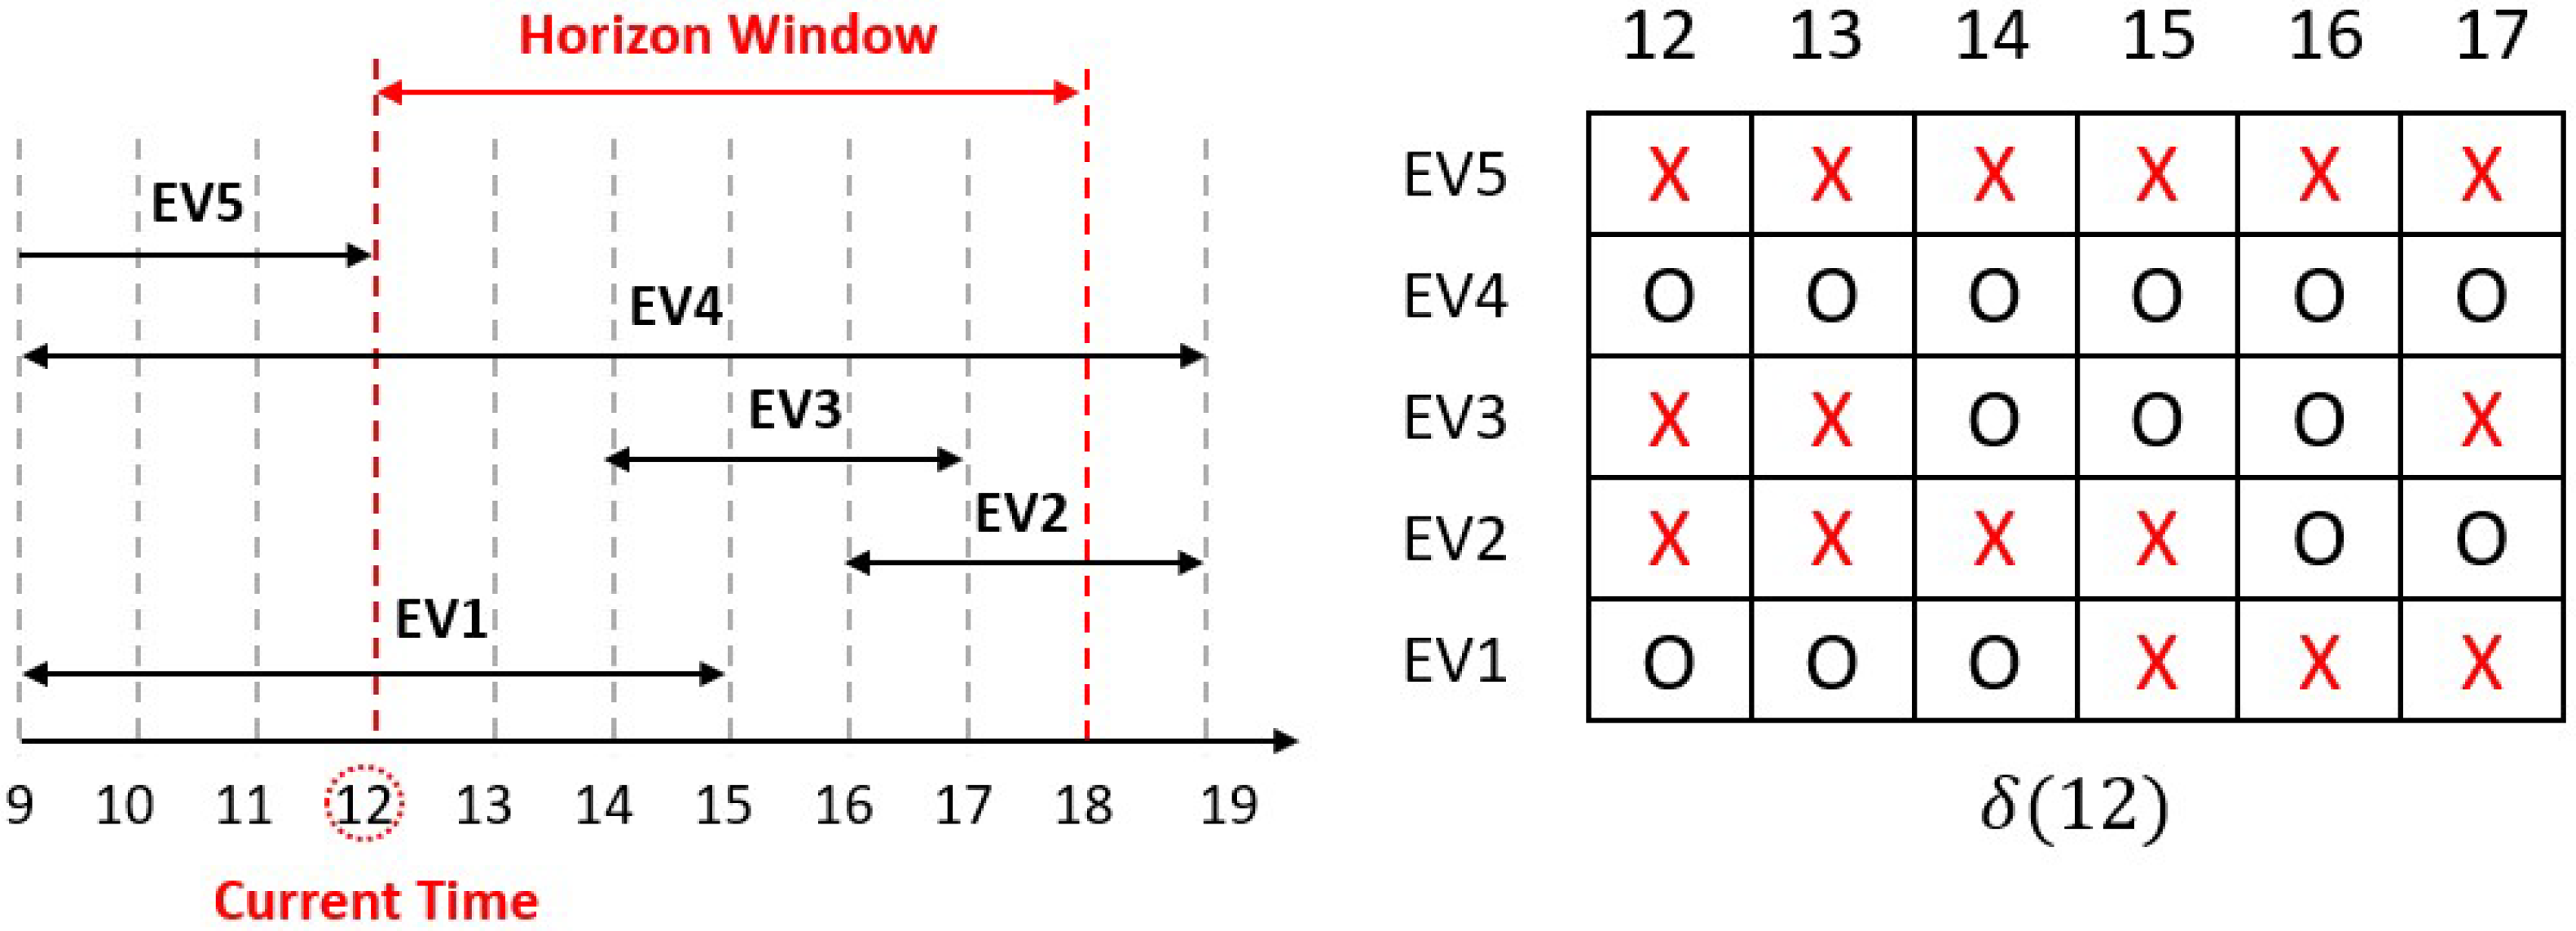
Figure 8.
Yearly trend of maximum daily parking.

Figure 9.
Daily G2V Simulation.
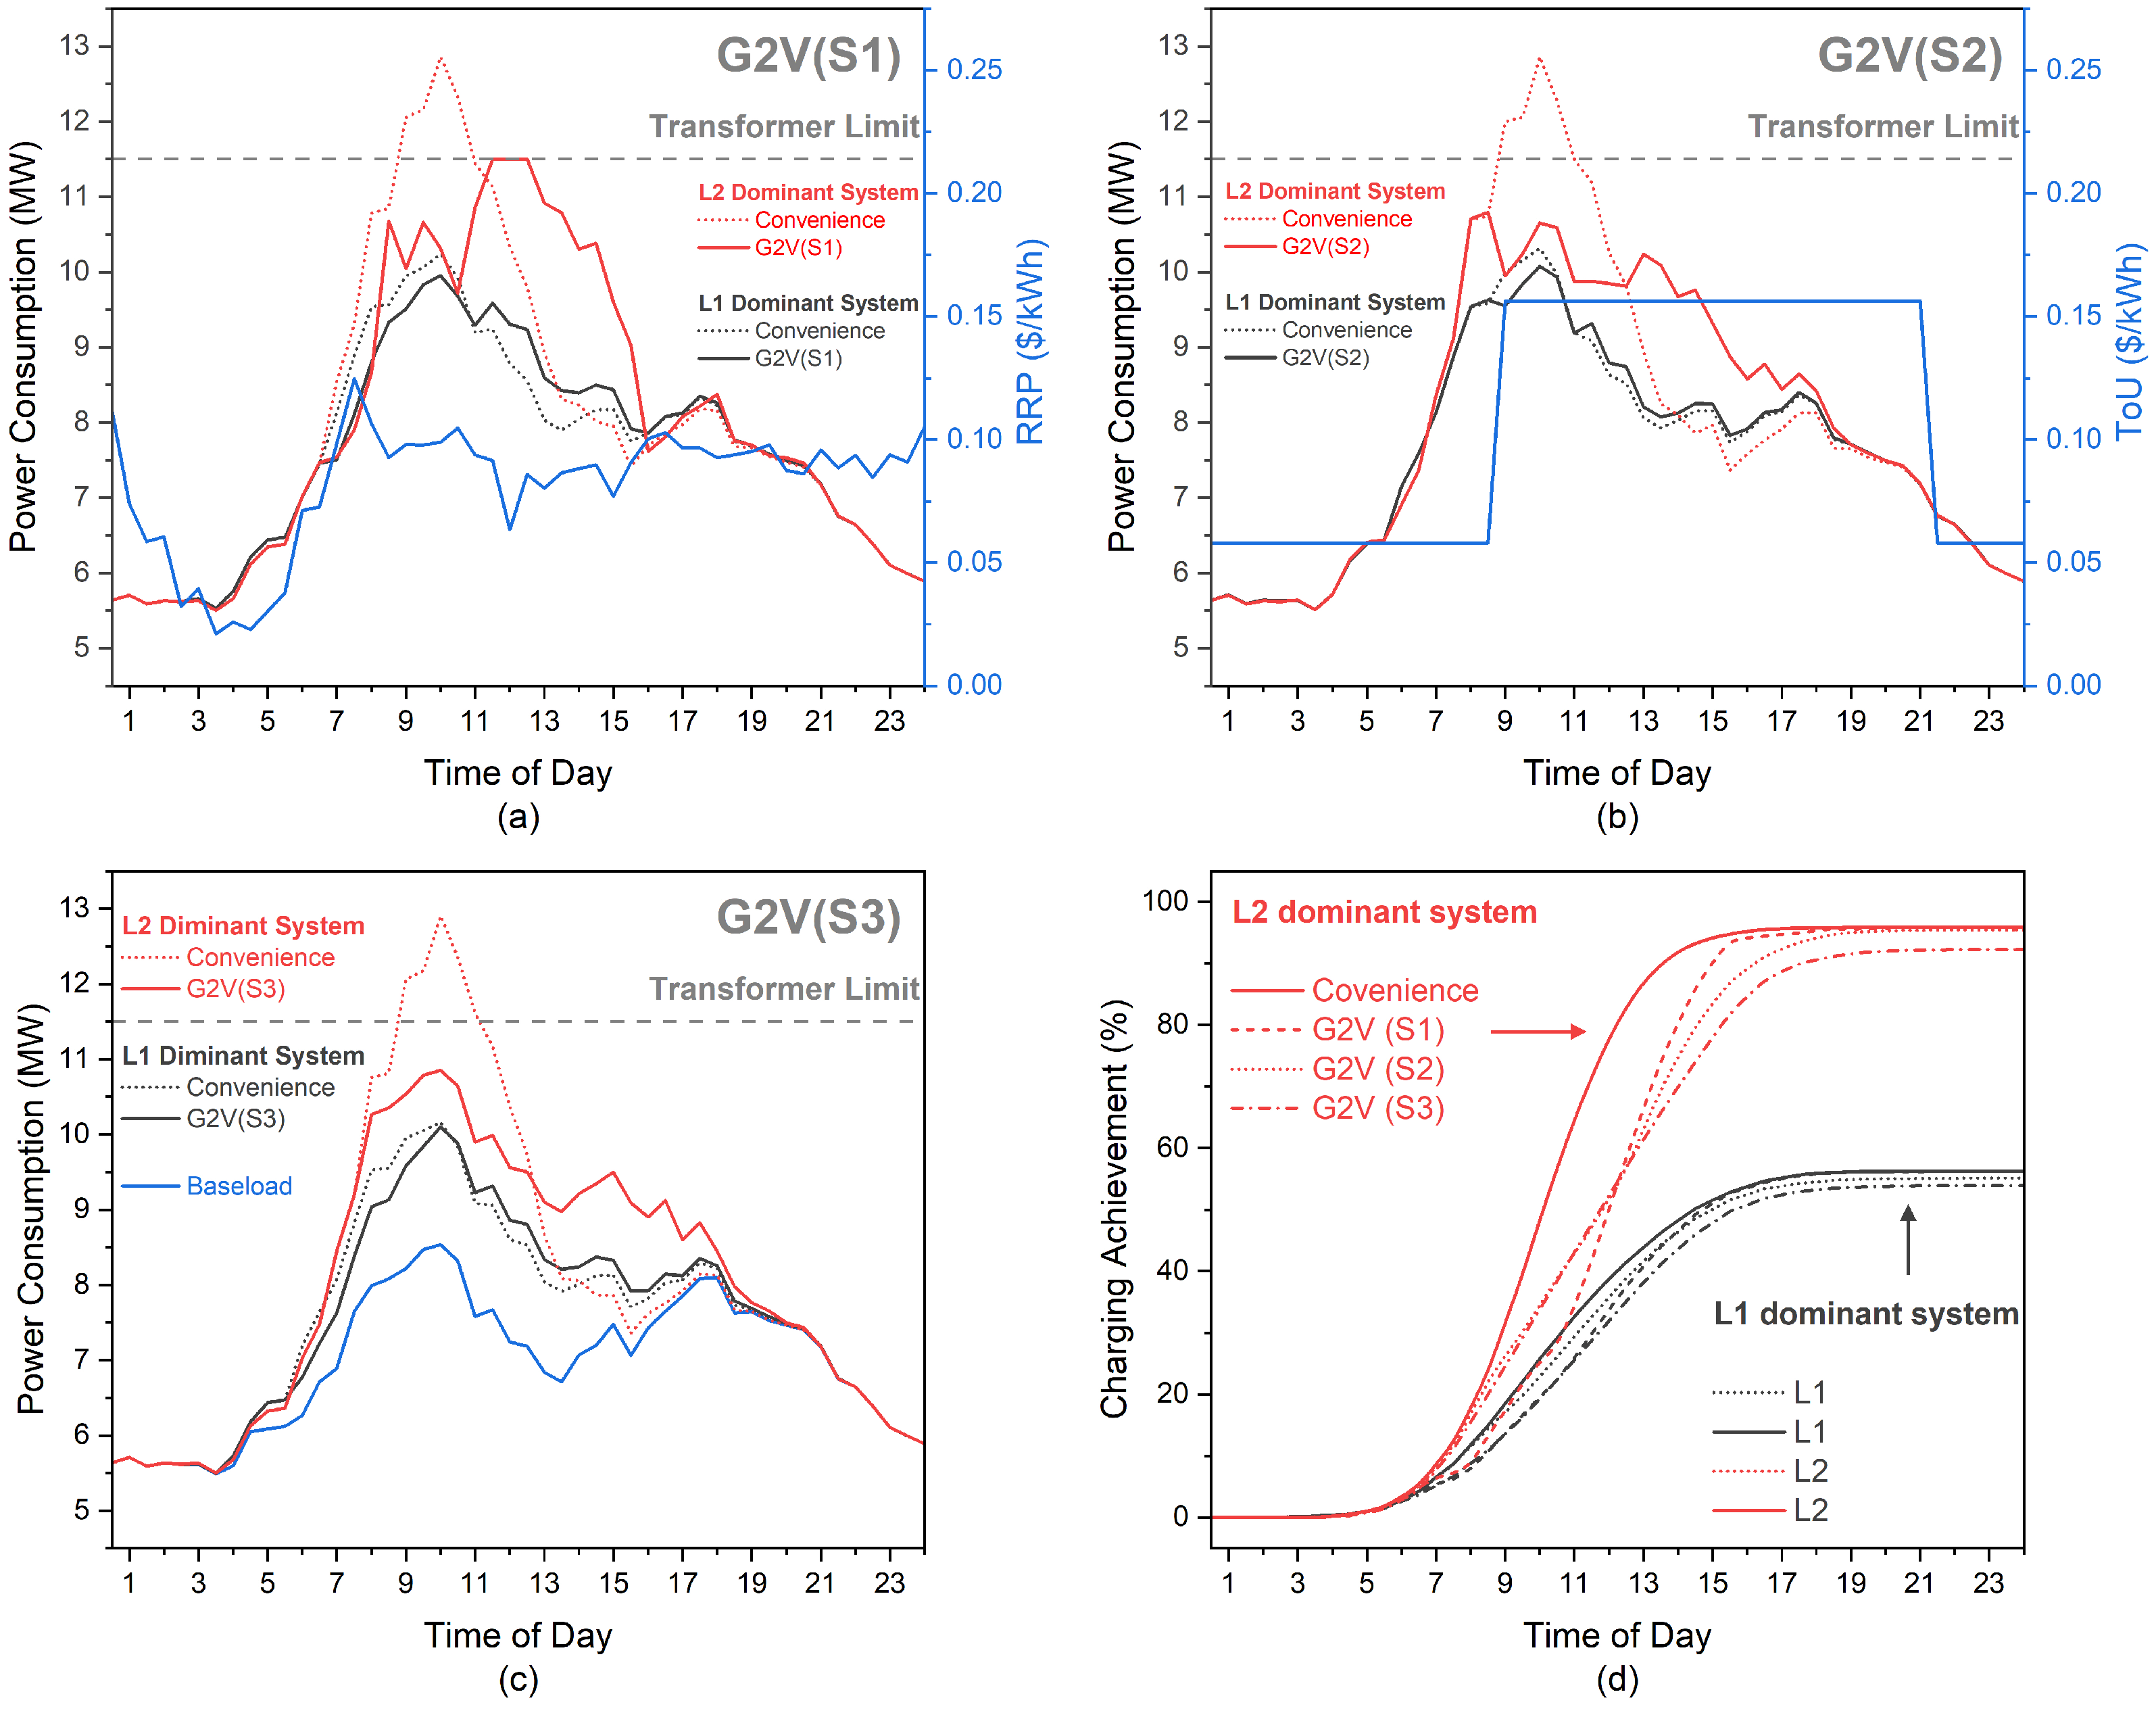
Figure 10.
Total demand with number of EV users.
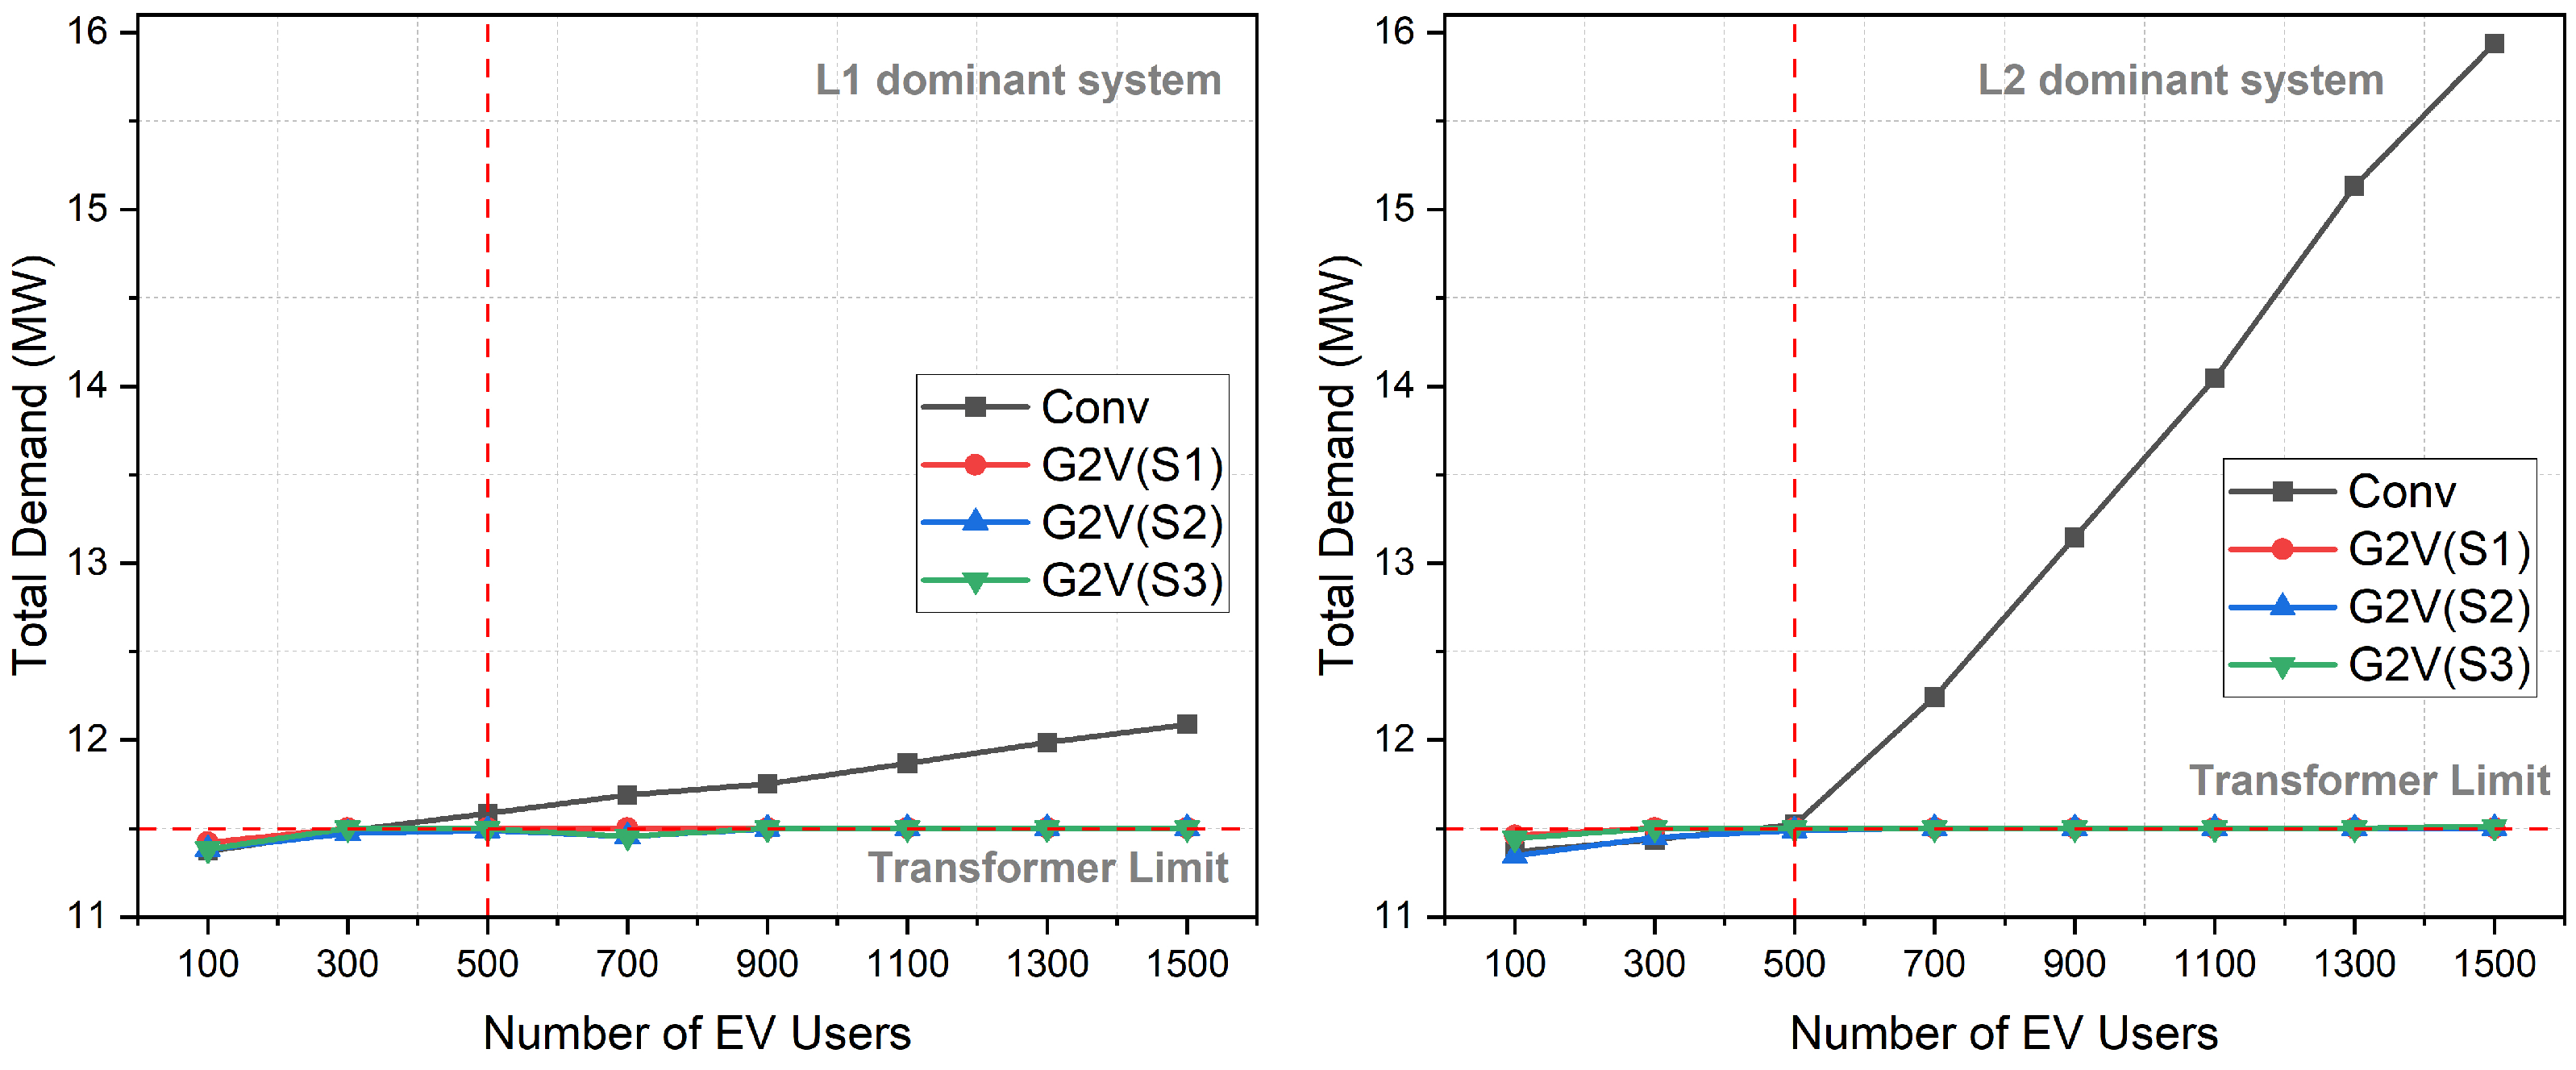
Figure 11.
The yearly trend of node voltage at Monash campus for convenient charging (top) and G2V charging (bottom).
Figure 11.
The yearly trend of node voltage at Monash campus for convenient charging (top) and G2V charging (bottom).
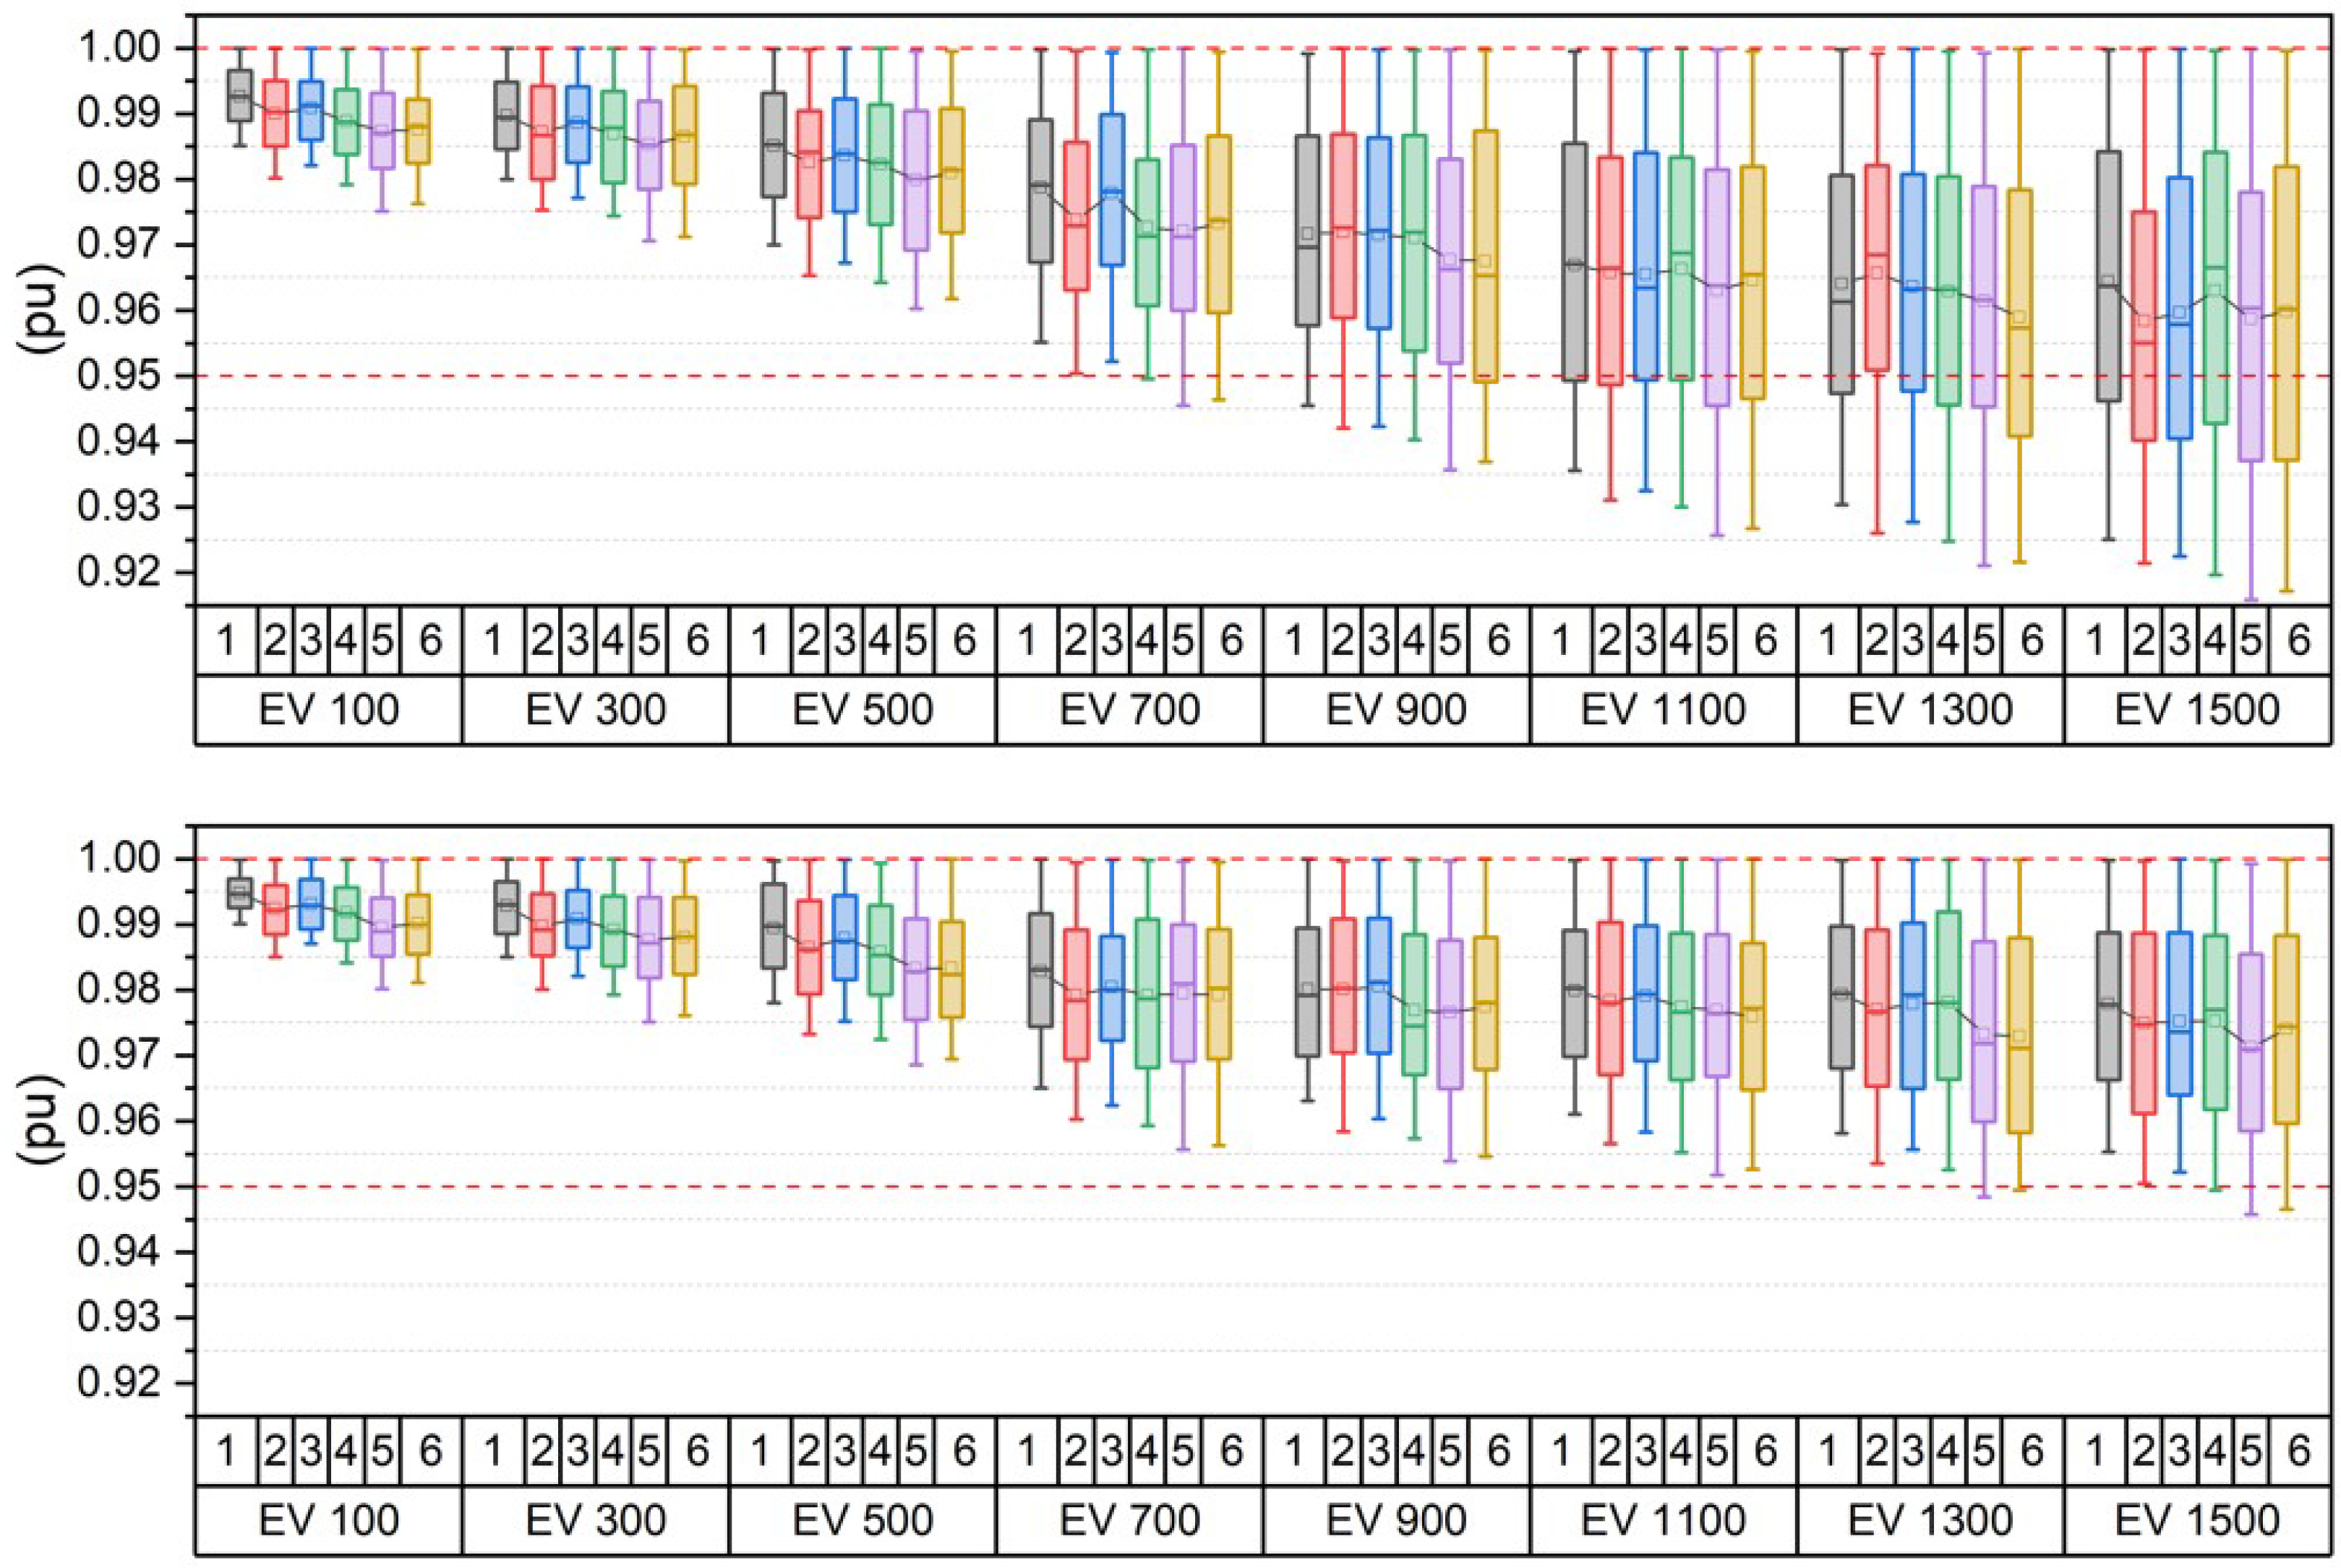
Figure 12.
Number of EVs and NPV.
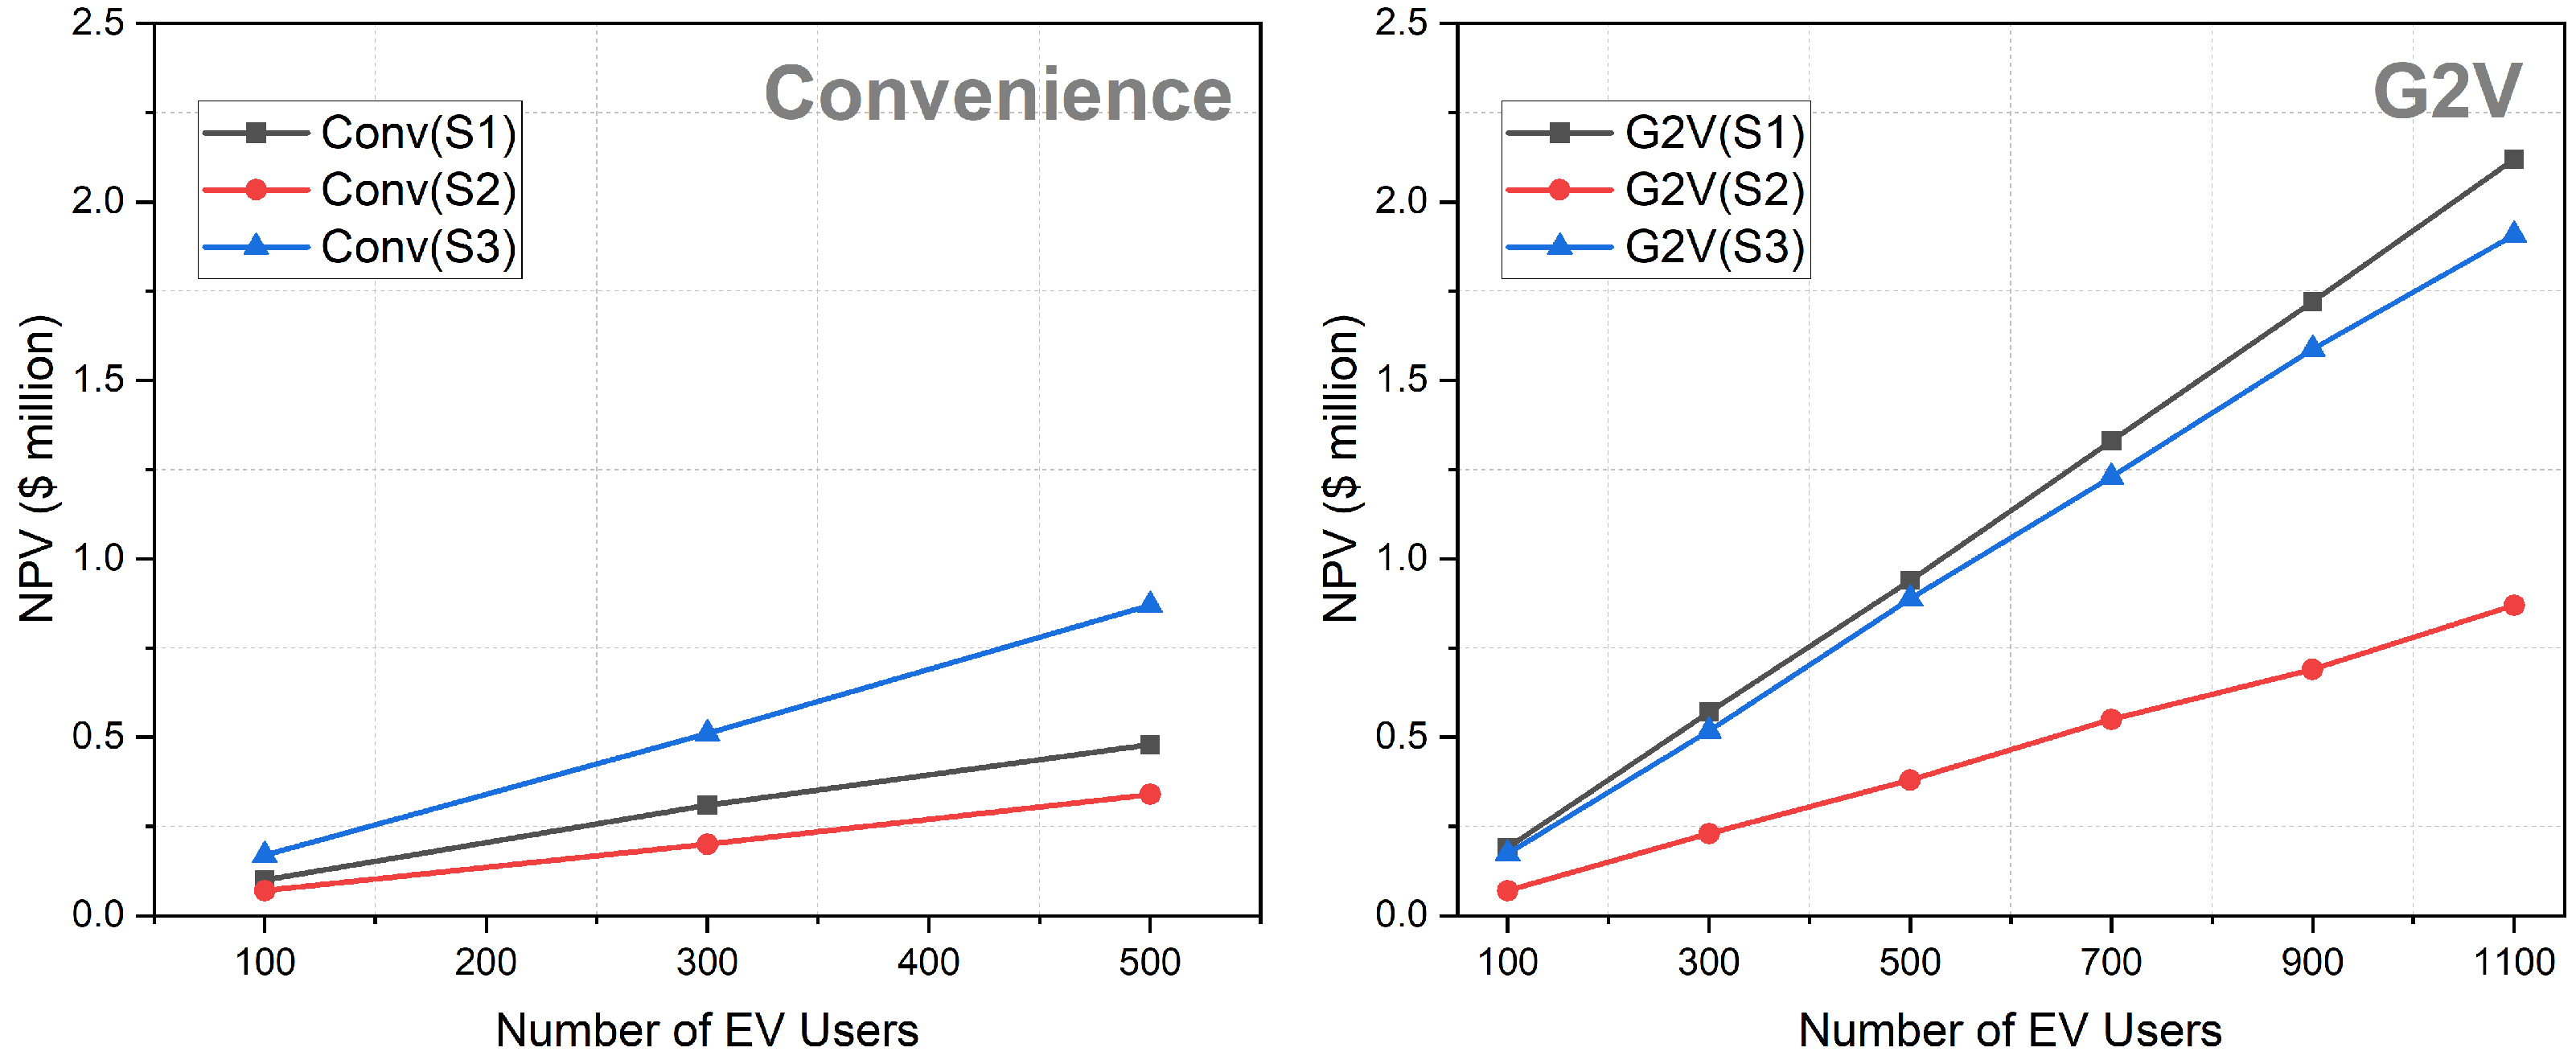
Figure 13.
Number of EVs and NPV.
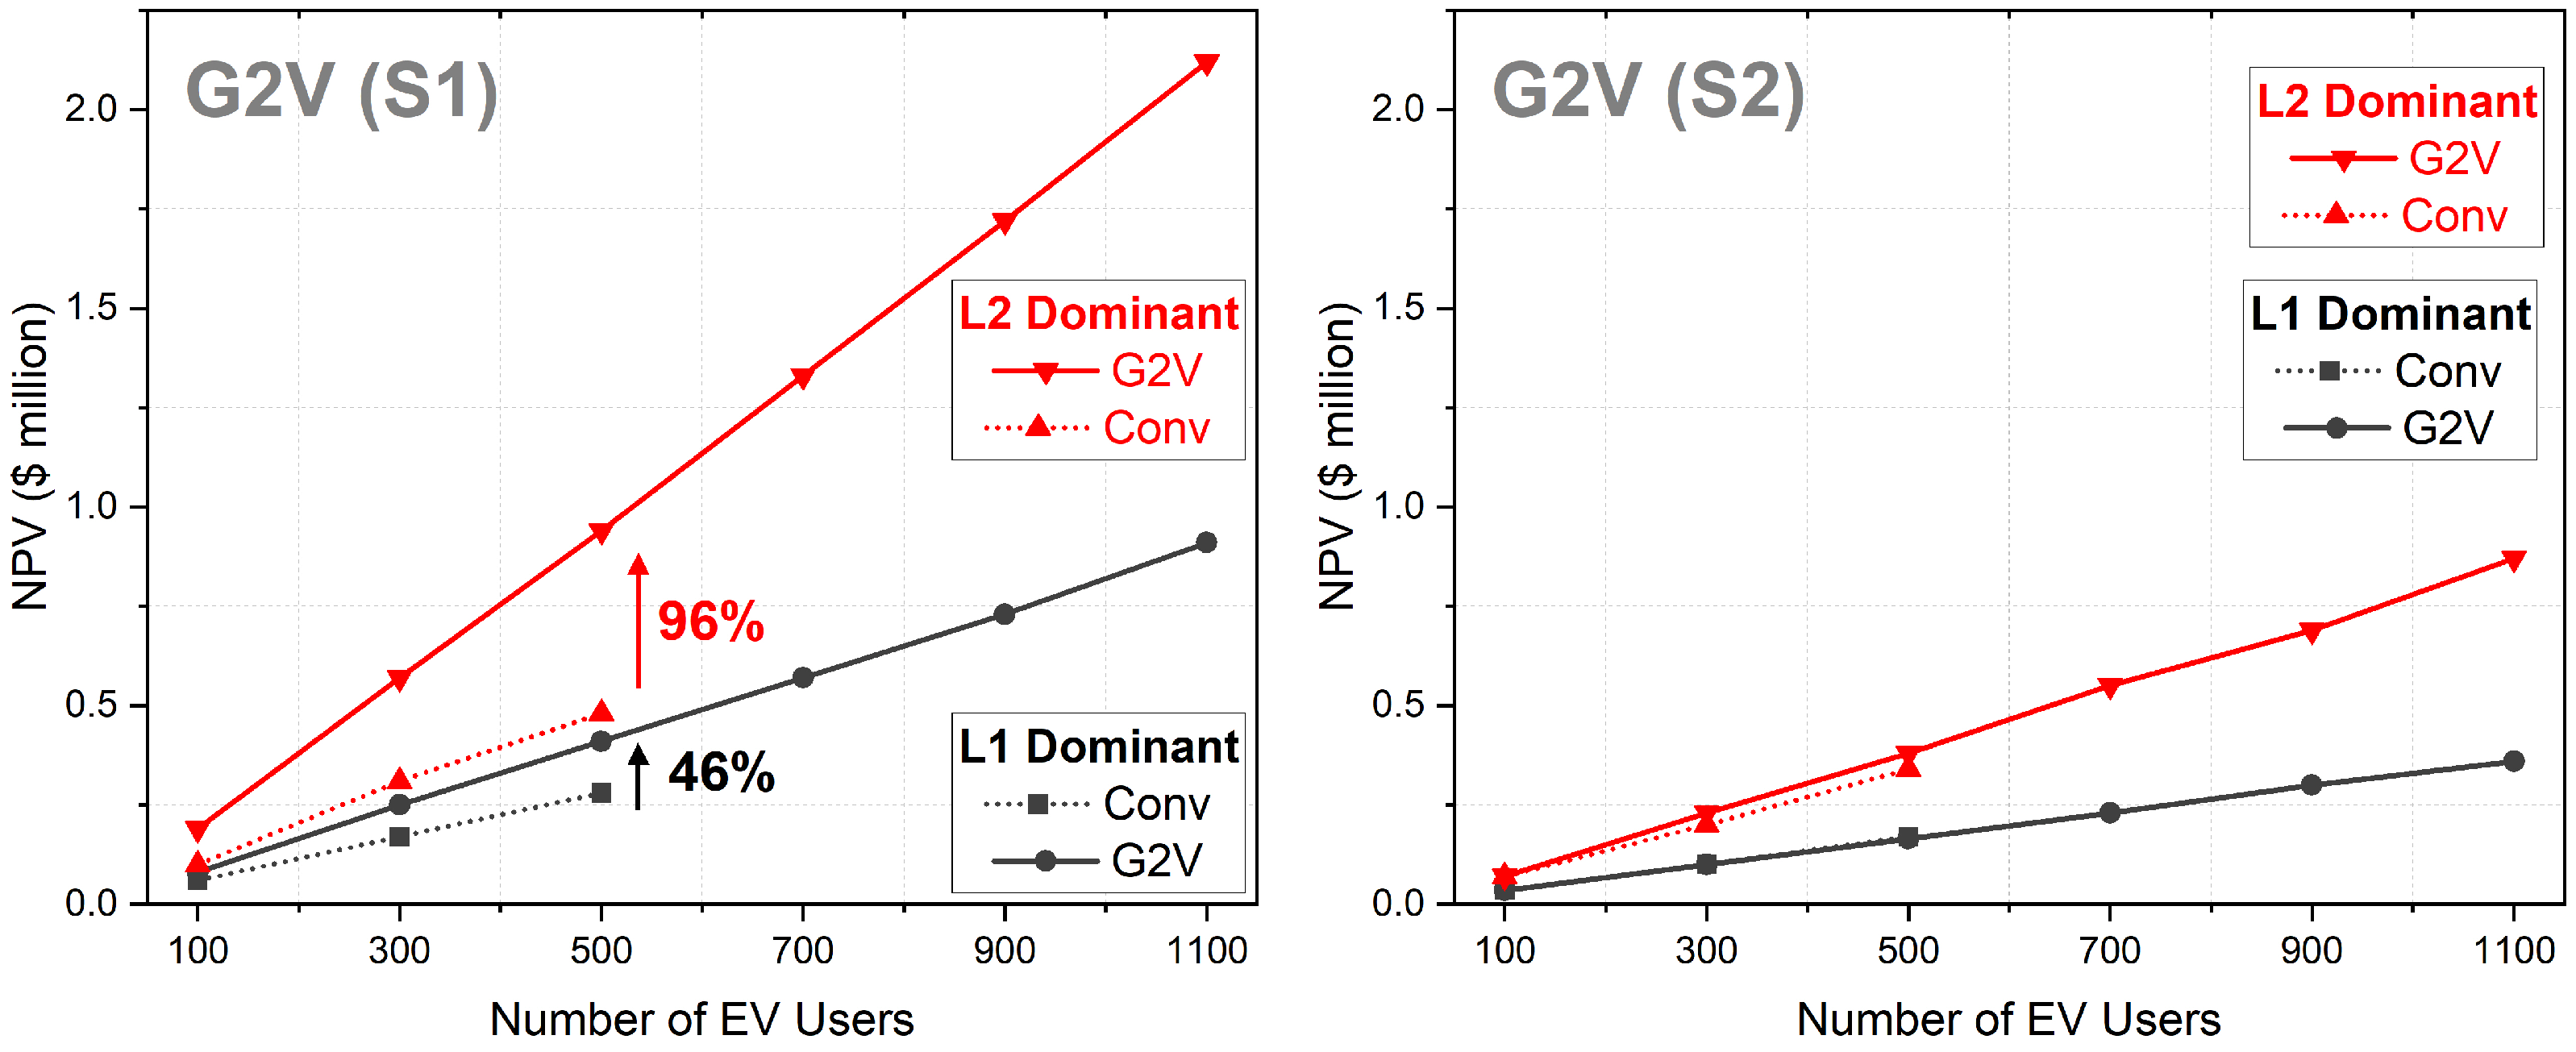
Figure 14.
L2 ratio and NPV.
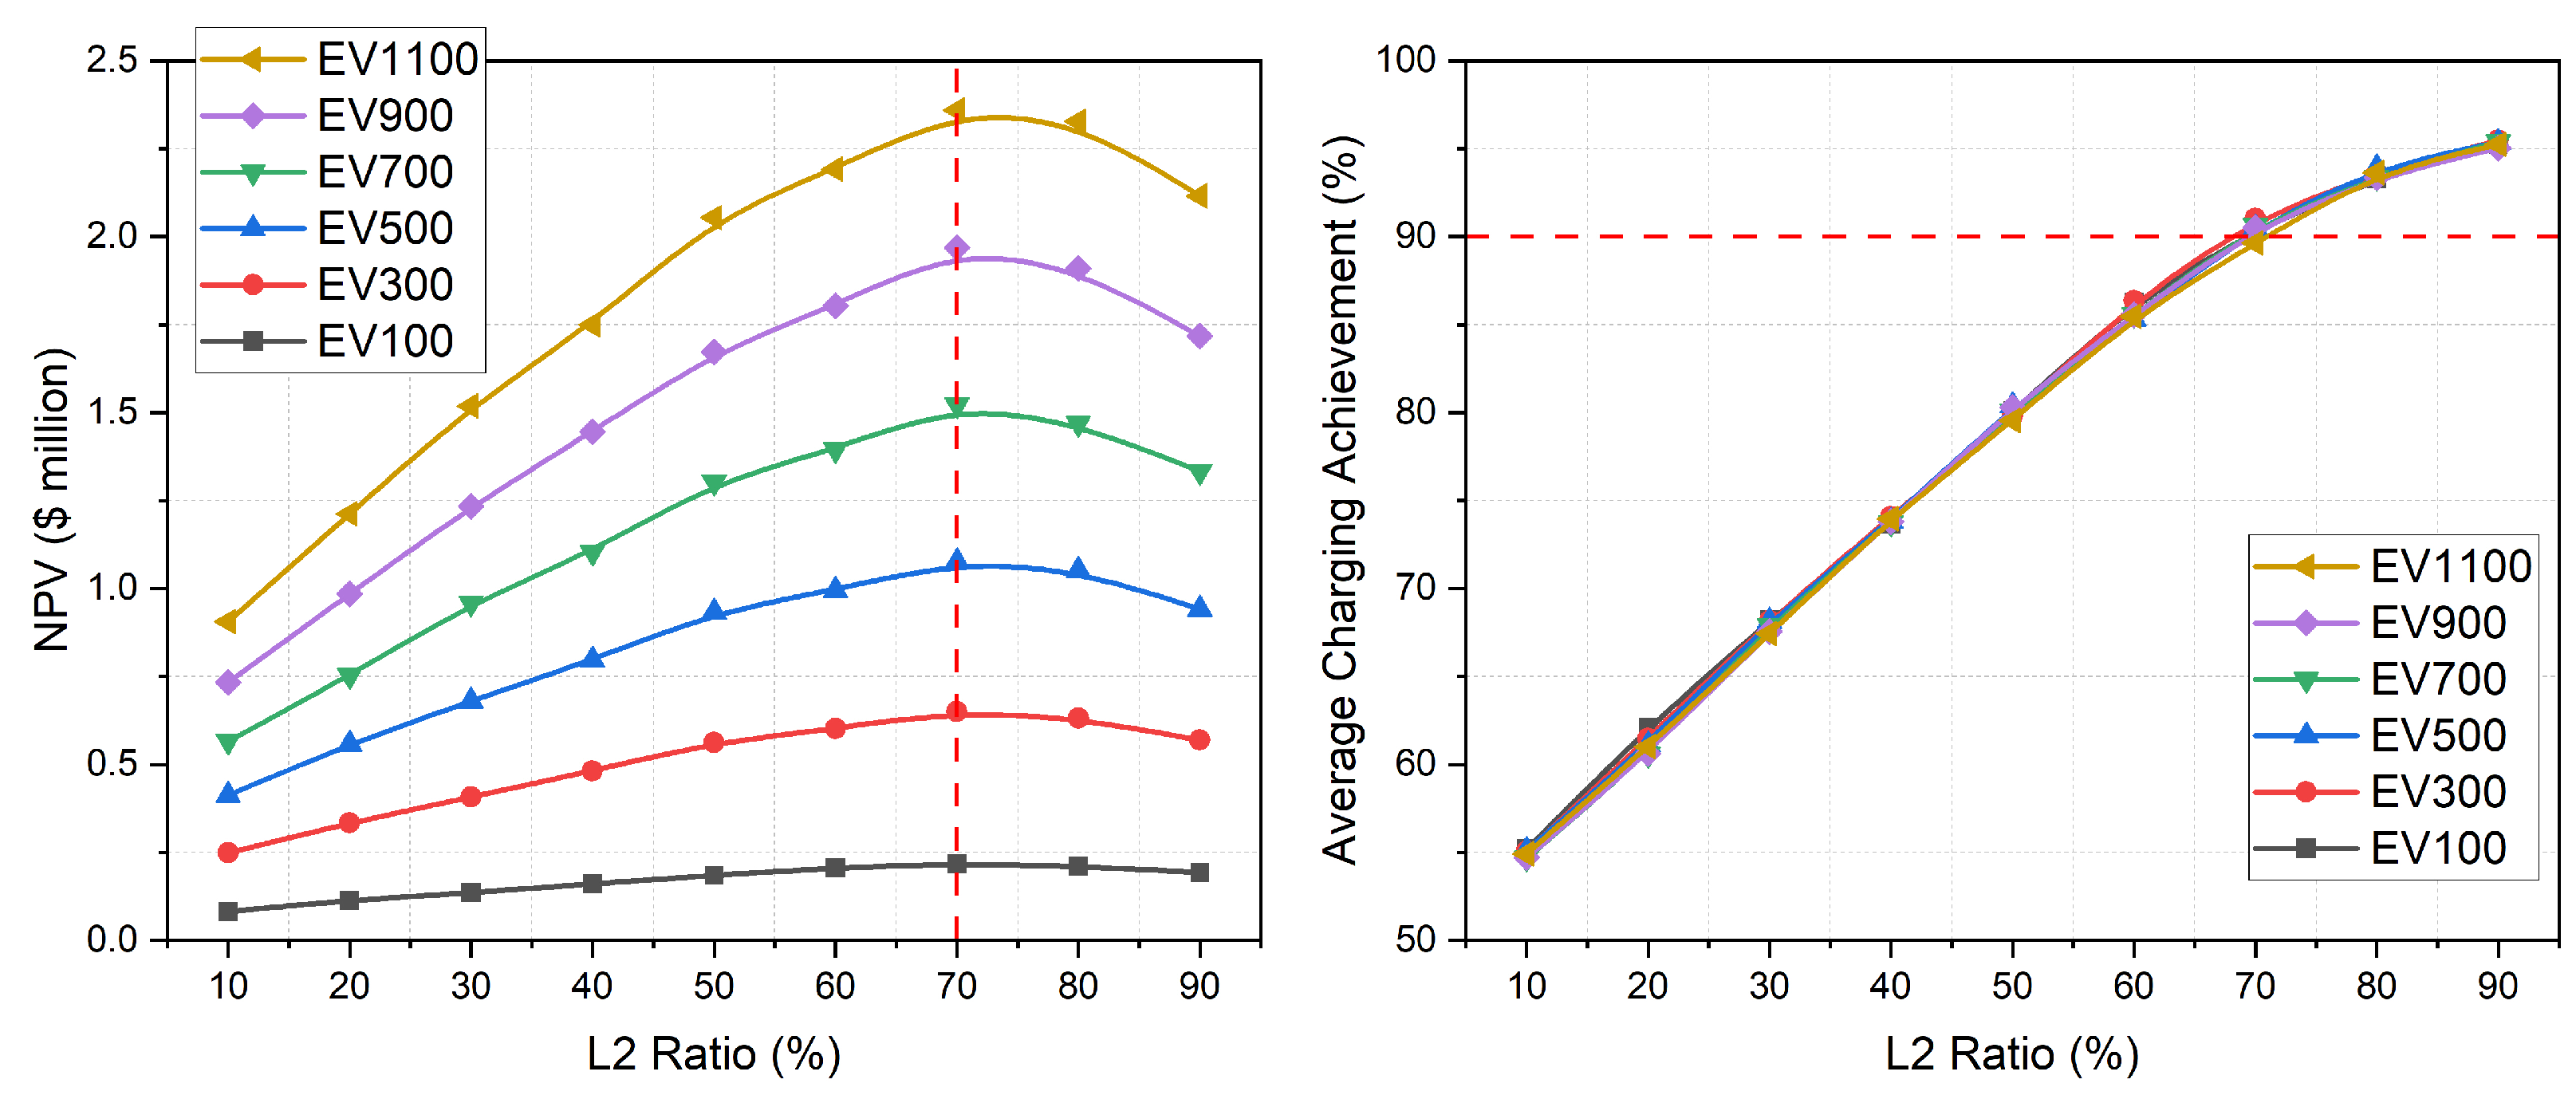
Figure 15.
The optimal EVSE and L2 ratio.

Table 1.
EV Charging modes.
| Mode 1 | Mode 2 | Mode 3 | |
|---|---|---|---|
| - | |||
| - |
Table 2.
The objective functions.
| Electricity Tariff | |||
|---|---|---|---|
| Flat Rate | Time of Use (ToU) | Spot Price | |
| 0 | 1 | 1 | |
| 1 | 0 | 0 | |
| Objective Function (J) | |||
Table 3.
Jacobian matrix elements.
| Diagonal | ||||
| Off-diagonal |
Table 4.
Variable parameters.
| Input Parameters | Scenarios |
|---|---|
| Total EV users () | 100~1000 users |
| Total EVSE * Numbers () | 10~100% of |
| L1 Charger Numbers () | 10~100% of |
| L2 Charger Numbers () |
* Electric vehicle supply equipment.
Table 5.
Tariff structures.
| Scenario | Tariff Contract | Price | Time |
|---|---|---|---|
| S1 | Spot Price | RRP in 2019 | 24 h |
| S2 | ToU Rate [32] | Off peak: $0.06/kWh | Rest of time |
| Peak: $0.16/kWh | 9 a.m. to 9 p.m. | ||
| S3 | Flat Rate | $0.1/kWh | 24 h |
Table 6.
Assumptions for EV chargers.
| Charger Types | Charging Price | Capital Cost | Installation Cost |
|---|---|---|---|
| L1 (2 kW) | $0.2/kWh | $1500/charger | $1500/charger |
| L2 (7 kW) | $0.25/kWh | $5000/charger | $4000/charger |
Table 7.
Assumptions for NPV and IRR calculation.
| CPI | 5 % | Tax Rate | 25 % |
| Discount Rate [33] | 6 % | Project Duration | 15 years |
| Operating Costs (annual) | 2% from the total capital costs | Power Line Upgrade Costs (N1 Parking) | $300/kW |
Table 8.
L1 and L2-dominant system.
| L1 Charger Ratio (from the Total EV Chargers) | L2 Charger Ratio (from the Total EV Chargers) | |
|---|---|---|
| L1-dominant (Low-Power System) | 90% | 10% |
| L2-dominant (High-Power System) | 10% | 90% |
Table 9.
Summary: daily performance.
| Scenario | Charging Achievement | Similarity | Daily Profits | Profits Increase | |
|---|---|---|---|---|---|
| L1-Dominant | G2V (S1) | 57.5% | 94% | $3681 | 4.4% |
| G2V (S2) | 56.1% | 93.7% | $2384 | 1.8% | |
| G2V (S3) | 57.8% | 94.5% | $3135 | 0% | |
| L2-Dominant | G2V (S1) | 94.5% | 57% | $7535 | 9.3% |
| G2V (S2) | 94.1% | 62% | $5236 | 4.1% | |
| G2V (S3) | 94.8% | 65% | $6735 | 0% |
Table 10.
Summary: G2V performance by scenarios.
| G2V(S1) | G2V(S2) | G2V(S3) | |
|---|---|---|---|
| L1 Dominant | 46% ($0.13 M) | 0% | 0% |
| L2 Dominant | 96% ($0.36 M) | 11.8% ($0.04 M) | 0% |
Disclaimer/Publisher’s Note: The statements, opinions and data contained in all publications are solely those of the individual author(s) and contributor(s) and not of MDPI and/or the editor(s). MDPI and/or the editor(s) disclaim responsibility for any injury to people or property resulting from any ideas, methods, instructions or products referred to in the content. |
© 2024 by the authors. Licensee MDPI, Basel, Switzerland. This article is an open access article distributed under the terms and conditions of the Creative Commons Attribution (CC BY) license (https://creativecommons.org/licenses/by/4.0/).
Share and Cite
MDPI and ACS Style
Yoon, S.; Dargaville, R. The Optimal Infrastructure Design for Grid-to-Vehicle (G2V) Service: A Case Study Based on the Monash Microgrid. Energies 2024, 17, 2267. https://doi.org/10.3390/en17102267
AMA Style
Yoon S, Dargaville R. The Optimal Infrastructure Design for Grid-to-Vehicle (G2V) Service: A Case Study Based on the Monash Microgrid. Energies. 2024; 17(10):2267. https://doi.org/10.3390/en17102267
Chicago/Turabian StyleYoon, Soobok, and Roger Dargaville. 2024. "The Optimal Infrastructure Design for Grid-to-Vehicle (G2V) Service: A Case Study Based on the Monash Microgrid" Energies 17, no. 10: 2267. https://doi.org/10.3390/en17102267
Note that from the first issue of 2016, this journal uses article numbers instead of page numbers. See further details here.