Article

Assessment of the Efficiency of a Hybrid Photovoltaic and Photovoltaic Heating System (PV–Solar) in the Context of a Warehouse for a Housing Community in Poland

1
Faculty of Environmental Management and Agriculture, West Pomeranian University of Technology, 70-310 Szczecin, Poland
2
Management Institute, University of Szczecin, 70-453 Szczecin, Poland
3
Faculty of Economics and Management, Opole University of Technology, 45-758 Opole, Poland
4
Faculty of Management, Rzeszów University of Technology, 35-959 Rzeszów, Poland
5
Institute of Economics and Finance, University of Szczecin, 70-453 Szczecin, Poland
6
Lithuania Business College, 91249 Klaipėda, Lithuania
7
Institute of Management, University of Social Sciences, 9 Sienkiewicza Str., 90-113 Lodz, Poland
*
Author to whom correspondence should be addressed.
Energies 2024, 17(10), 2264; https://doi.org/10.3390/en17102264
Submission received: 24 March 2024 / Revised: 26 April 2024 / Accepted: 3 May 2024 / Published: 8 May 2024
(This article belongs to the Special Issue Sustainable Energy & Society II)

Abstract

:
In light of global challenges such as the war in Ukraine and the depletion of fossil fuel resources, it is essential to explore sustainable energy solutions. Hybrid energy systems represent a potential solution, offering energy independence to urban housing estates and reducing CO2 emissions. This article aims to explore the feasibility of integrating photovoltaic systems (utilizing vacuum collectors) and combined utilities (system heat and electricity) in a hybrid setup, leveraging existing technical infrastructure with necessary modifications. A key aspect is to perform calculations on the amount of heat and electricity generated from these systems. The study analyzes the demand for heat and electricity among consumers compared to the estimated production from renewable sources. Calculations also include the potential energy savings and CO2 emission reductions achievable through the proposed solutions. The findings indicate that hybrid photovoltaic systems with heat storage could effectively address energy issues in urban housing estates, given adequate support and community involvement. The innovative methodology employed in this study encompasses both analytical and experimental research approaches. The analysis employs advanced statistical techniques and data integration to enhance understanding of the phenomena studied, while the experimental research provides robust results through controlled variable manipulation and precise measurement tools, thereby verifying the study’s objectives.

1. Introduction

A global issue stemming from the progress of civilization is the depletion of fossil fuel reserves, primarily consumed in combustion processes, leading to pollution in the form of “smog”. This challenge also affects residents of Polish cities, driven by nationwide trends such as the proliferation of dispersed single-family residential buildings on urban outskirts, alongside the growth of road transport and industrial facilities. Previously, the issue of “smog” formation in Małopolska and Krakow was predominantly recognized during the autumn and winter heating seasons [1]. This phenomenon, known as “London smog”, involves PM10 particulate matter and PM2.5 emissions from domestic boiler heating, industrial pollution, atmospheric dust from gaseous emissions, and traffic pollutants. A new phenomenon has emerged during the summer months, induced by emissions from motor vehicles. This “Los Angeles” type of smog is exacerbated by high temperatures and sunny weather. While these occurrences are also observed on multi-family housing estates, where well-established heating networks are powered by heat and power plants, the spatial configuration of buildings often allows the creation of ventilated air corridors. Stringent legal regulations govern large heat sources regarding exhaust gas emissions, adhering to Best Available Techniques (BAT) conclusions. These sources typically employ more efficient production processes, often incorporating cogeneration systems to enhance efficiency. Flue gases undergo purification in dedicated Flue Gas Desulfurization (FGD) installations, resulting in the generation of electricity and heat. Nonetheless, the transformation process still relies on combustion, utilizing fossil fuels (such as natural gas, hard coal, lignite, and petroleum products) as well as biomass [2].
The composition of exhaust gases generated during the combustion process varies depending on the type of fuel utilized. Each fuel source leaves a distinct carbon footprint based on its origin. Currently, there are established technical solutions that effectively curtail reliance on fossil fuels and forest biomass for electricity and heat production. These solutions involve renewable energy sources (RESs) such as wind, solar thermal, and photovoltaic (PV) installations; geothermal sources; tidal energy; and others. However, these sources present challenges due to their inherent dynamic variability, making prediction difficult. Implementing these solutions in urban areas is often challenging or unfeasible for certain technologies, and they are frequently decentralized [3].
The fluctuating energy production inherent to RESs necessitates the development of energy storage facilities for effective and sustainable energy storage. Currently, no 100% effective energy storage method exists, often leading to direct integration with the power grid. The reliability and parameters of the grid are supported by traditional energy sources, which offer stability of operation within predictable and controllable limits [4].
One effective method of utilizing existing energy sources is through hybrid systems, which combine modern RES technologies with traditional energy sources for electricity and heat production. These systems can operate independently or in conjunction with conventional energy sources. For instance, the integration of solar energy with the municipal heating network in urban areas presents significant potential. Such integration could satisfy the demand for heat energy for domestic hot water (DHW) and provide electricity for powering the electrical equipment of heat substations in isolated systems [5].
The capacity to store energy and deliver it directly to consumers in multi-family buildings ensures a continuous energy supply. A district heating network functions as a safeguard, maintaining consistent parameters for end users. Additionally, supplying additional energy through such networks can decrease reliance on fossil fuels and biomass combustion [6,7].
The objective of this study was to assess the feasibility of integrating photovoltaic installations with building utilities (such as heating systems and electricity) in a hybrid configuration, utilizing existing technical infrastructure following necessary modifications. A key aspect involved conducting calculations pertaining to the heat and electricity output from solar and photovoltaic installations. The study also entailed analyzing the heat and electricity demand relative to consumer needs, alongside estimating the potential contributions from renewable sources. Calculations were performed to quantify the savings achievable through renewable energy utilization, as well as the associated reductions in CO2 emissions facilitated by the proposed solutions [8]. The research scope encompassed gathering data concerning consumers’ heat demand (CO/DHW) and electricity requirements for powering heating substation equipment and proposed renewable energy source (RES) installations. In the preliminary phase of the study, an urban housing estate was chosen. Information was acquired regarding building heat and electricity demands, as well as the cubic capacity of rooms. Calculations were conducted to select appropriate solar panels, photovoltaic panels, energy storage (DHW), and transmission installations. Feasibility analyses were performed to assess the viability of device installation, and the approved device types for further development were identified [9].
Various quantitative and qualitative methods of analysis and information processing were employed in this study. The primary qualitative method utilized was the observation method, enabling the collection of authentic data on the operation of the heat substation system without interference with its operation or predefined parameters. Data were obtained from heat meters, which were verified using Kamstrup’s free heat meter software “LogViewHCW” (1.0) and licensed PcBase. Another qualitative method used in data collection was the interview method, providing insights into actual and estimated heat and electricity demand, as well as the consumption of DHW in individual buildings. Quantitative methods utilized in the research included statistical calculations and mathematical modeling.
The novelty of this study lies in exploring the potential for integrating photovoltaic installations with existing systems that supply energy to buildings in a hybrid system. This approach is based on utilizing existing infrastructure after implementing appropriate modifications, thereby opening up new perspectives on the efficient utilization of energy resources.

2. Literature Review

Each year, an increasing number of countries actively seek solutions to crises related to climate change, pandemics, and other developmental challenges. Against this backdrop, the international community increasingly focuses on the concept of a “green” economy, particularly in terms of ensuring resource sustainability, notably through substituting conventional resources with renewable alternatives [10,11,12].
In today’s energy consumption landscape, the significance of utilizing alternative energy sources is increasingly pertinent [13,14,15].
This importance primarily stems from the depletion of minerals commonly used in the energy sector. Additionally, it is crucial to acknowledge that thermal and power plants relying on organic fuels significantly pollute our planet’s atmosphere [16,17,18].
Energy storage technologies are deemed paramount in promoting the widespread adoption of renewables across various sectors. Indeed, they enhance the feasibility of utilizing these sources by bridging the gap between production (supply) and demand, thereby enhancing their competitiveness against standard energy conversion technologies. In Poland, the Energy Law defines energy storage as “an installation used to store energy, connected to the grid, capable of supplying electricity to the grid” [19,20].
Conversely, the Capacity Market Act defines energy storage as referred to in Article 2(17) of the Renewable Energy Sources Act of 20 February 2015, with the ability to supply electricity to the system [21].
Another definition is presented in the RES Act, where energy storage facilities are defined as “a separate device or set of devices used to store energy in any form, not causing emissions that burden the environment, in a manner allowing for at least partial recovery” [22,23,24].
Numerous definitions of energy storage facilities exist in global literature. Baranecki, Niewiadomski, and Płatek define electricity storage systems as systems that enable energy storage in any form by converting electrical energy into another type of energy or accumulating energy in a magnetic or electric field, subsequently delivering it in the form of electricity with specific parameters when required [25,26].
The utilization of energy storage systems primarily addresses issues concerning the efficient operation of the power system, particularly with the use of renewable energy sources, the functionality of guaranteed power supply systems, mobile system power supply, and modern power supply technologies in the automotive industry [27,28].
Conversely, according to the RES Act, energy storage facilities are separate devices or sets of devices used to store electricity in any other form of generated energy, which do not cause emissions burdening the environment due to technological or chemical processes, allowing for at least partial recovery [29,30,31].
For many years, research has focused on forecasting energy storage technologies, primarily for storing renewable energy sources. Several studies in the cited literature have analyzed energy storage for re-electrification or operation within the electrical grid. However, none of these studies provided a tool capable of optimizing the performance of energy storage systems used in both applications while considering electricity market prices and investment opportunities for future investors [32,33].
Researchers striving to find solutions for energy security and lower greenhouse gas (GHG) emissions are exploring energy storage deployment. Salgi, in 2008, investigated the prospects of energy storage in western Denmark for grid-supporting applications. The simulation model demonstrated that even without restrictions on energy storage, the assumed energy demand in 2030 could be met at market prices [34,35].
Similarly, Carr, in 2016, assessed the performance of energy storage systems powered by a wind turbine connected to the electricity grid in Rotherham, UK. Optimizing the system to maximize revenues (i.e., electricity sales) while minimizing operating costs (i.e., electricity costs) revealed the significant influence of electricity prices and demand on the economic viability of the system [36].
Researchers Rad and Fung have established that borehole thermal energy storage (BTES) provides optimal conditions for long-term energy storage, characterized by high energy involvement levels and relatively low data carrier costs. Within BTES, underground structures serve as the storage material; heat is extracted or discharged through vertical or horizontal borehole heat exchangers (BHEs), typically installed 30 to 100 m below the ground surface. BHEs can be made of single or double U-shaped tubes or concentric pipes made of synthetic materials; it is possible to hydraulically connect a specified number of BHEs in series and simultaneously connect a specified number of series [37].
Compared to traditional district heating systems, district heating (DH) systems offer several advantages: generally higher efficiency; flexibility in selecting energy sources; control over conservation and maintenance of the designed performance level; and improved energy supply security. However, district heating plants require significant initial investments in infrastructure and pipeline systems [38].
In 2019, Colbertaldo presented a simulation of the Californian power system with high penetration of renewable energy sources using energy storage. The study revealed that for California to have a grid solely based on renewables, high-power solar/wind converters and a suitable energy storage system are essential. For large systems, the cost of selling electricity exceeds 500 EUR/MWh and is expected to decrease to more than 300 EUR/MWh, which is relatively high compared to other technologies [39].
Recent studies have discussed the application of seasonal thermal energy storage in heating systems based on solar collectors, on both large and small scales. All these studies suggest that central solar heat power stations with seasonal storage (CSHPSSs) could play a significant role in implementing future intelligent energy systems, due to their high efficiency and favorable environmental impact compared to individual heating systems. However, to fulfill this role, these systems need further development to reduce network losses, exploit synergistic effects, and increase overall system performance [40].

3. Materials and Methods

To assess methodological rigor, an analytical approach was employed. This method involves systematically dissecting and analyzing individual elements of the research process, including determining the existing state of knowledge, identifying the research problem, and drawing conclusions. Analysis facilitates a deeper understanding of the research process and the evaluation of the quality of its individual components.
Experimental research was utilized to conduct an economic analysis of financing investments in hybrid photovoltaic installations. This method involved comparing the costs of system components, estimating energy production costs, and performing economic calculations for hybrid installations. Experimental research enabled an analysis of the investment’s profitability and determination of the payback period.
It is worth emphasizing that both applied research methods are crucial for obtaining reliable and credible research results. Analytical research allows the assessment of methodological rigor, while experimental research enables specific analyses and determination of economic indicators. By employing these research methods, researchers were able to thoroughly examine and evaluate the subject of their research, contributing to the acquisition of reliable and accurate conclusions.
In the context of the analyzed study on hybrid photovoltaic installations, several key methodologies were adopted. The first step involved precisely defining the technical parameters of the installation, such as the angle of inclination of solar collectors or the minimum distance between individual rows. This method relied on the use of mathematical geometric models, which enabled precise determination of installation parameters.
Another important aspect was conducting an economic analysis of investment financing. Financial techniques were utilized to compare the costs of individual system components, estimate energy production costs, and perform economic calculations for hybrid installations. The economic analysis also considered available funds from assistance programs and the possibility of utilizing grants.
Additionally, the analysis of the hybrid installation project with a heat storage required consideration of technical and organizational aspects of building infrastructure and heating systems. This method relied on the analysis of technical requirements and verification of agreements with energy operators.
It should be noted that the study also included an analysis of the profitability of enterprises, which required consideration of economic, environmental, and organizational aspects. This method involved assessing the possibility of using grants, analyzing annual energy price increases, and forecasting investment returns.
Methodological analysis of the study should also encompass the utilization of criteria for assessing methodological rigor, such as internal and external validity, validity of measures, and reliability. Employing these criteria makes it possible to evaluate the quality of conducted research and considering the credibility of the obtained results.
The input data provided to the model pertains to an urban housing development located in the town of Gryfino, specifically on Łużycka Street, locally referred to as “Osiedle Południe”. Gryfino is situated in a lowland area, at an elevation of approximately 5–10 m above sea level. This specific geographical location influences the region’s characteristic climatic conditions. Being approximately 60 km away from the nearest Baltic Sea coast affects the local microclimate, contributing to relatively mild atmospheric conditions. The region exhibits a moderate climate, characterized by warm yet not excessively hot summers and cold, often humid winters.
Average summer temperatures hover around 20 °C, conducive to outdoor activities and solar energy utilization. Conversely, winters are moderate, with temperatures often dropping below freezing, averaging around −3 °C, increasing the demand for heating energy. Precipitation is evenly distributed throughout the year, with slightly higher rainfall in the summer months. The average annual precipitation is approximately 600 mm, typical for this part of Poland.
The variability of weather, characteristic of a moderate climate, combined with the relative humidity of the air, directly impacts the planning and operation of systems based on renewable energy sources. These conditions are particularly favorable for solar energy utilization in the summer months, while moderate winters pose a challenge for maintaining a continuous supply of thermal energy. Meanwhile, the mild climate favors the use of solutions such as heat pumps, which efficiently utilize low-temperature heat sources from the surroundings, even in colder months.
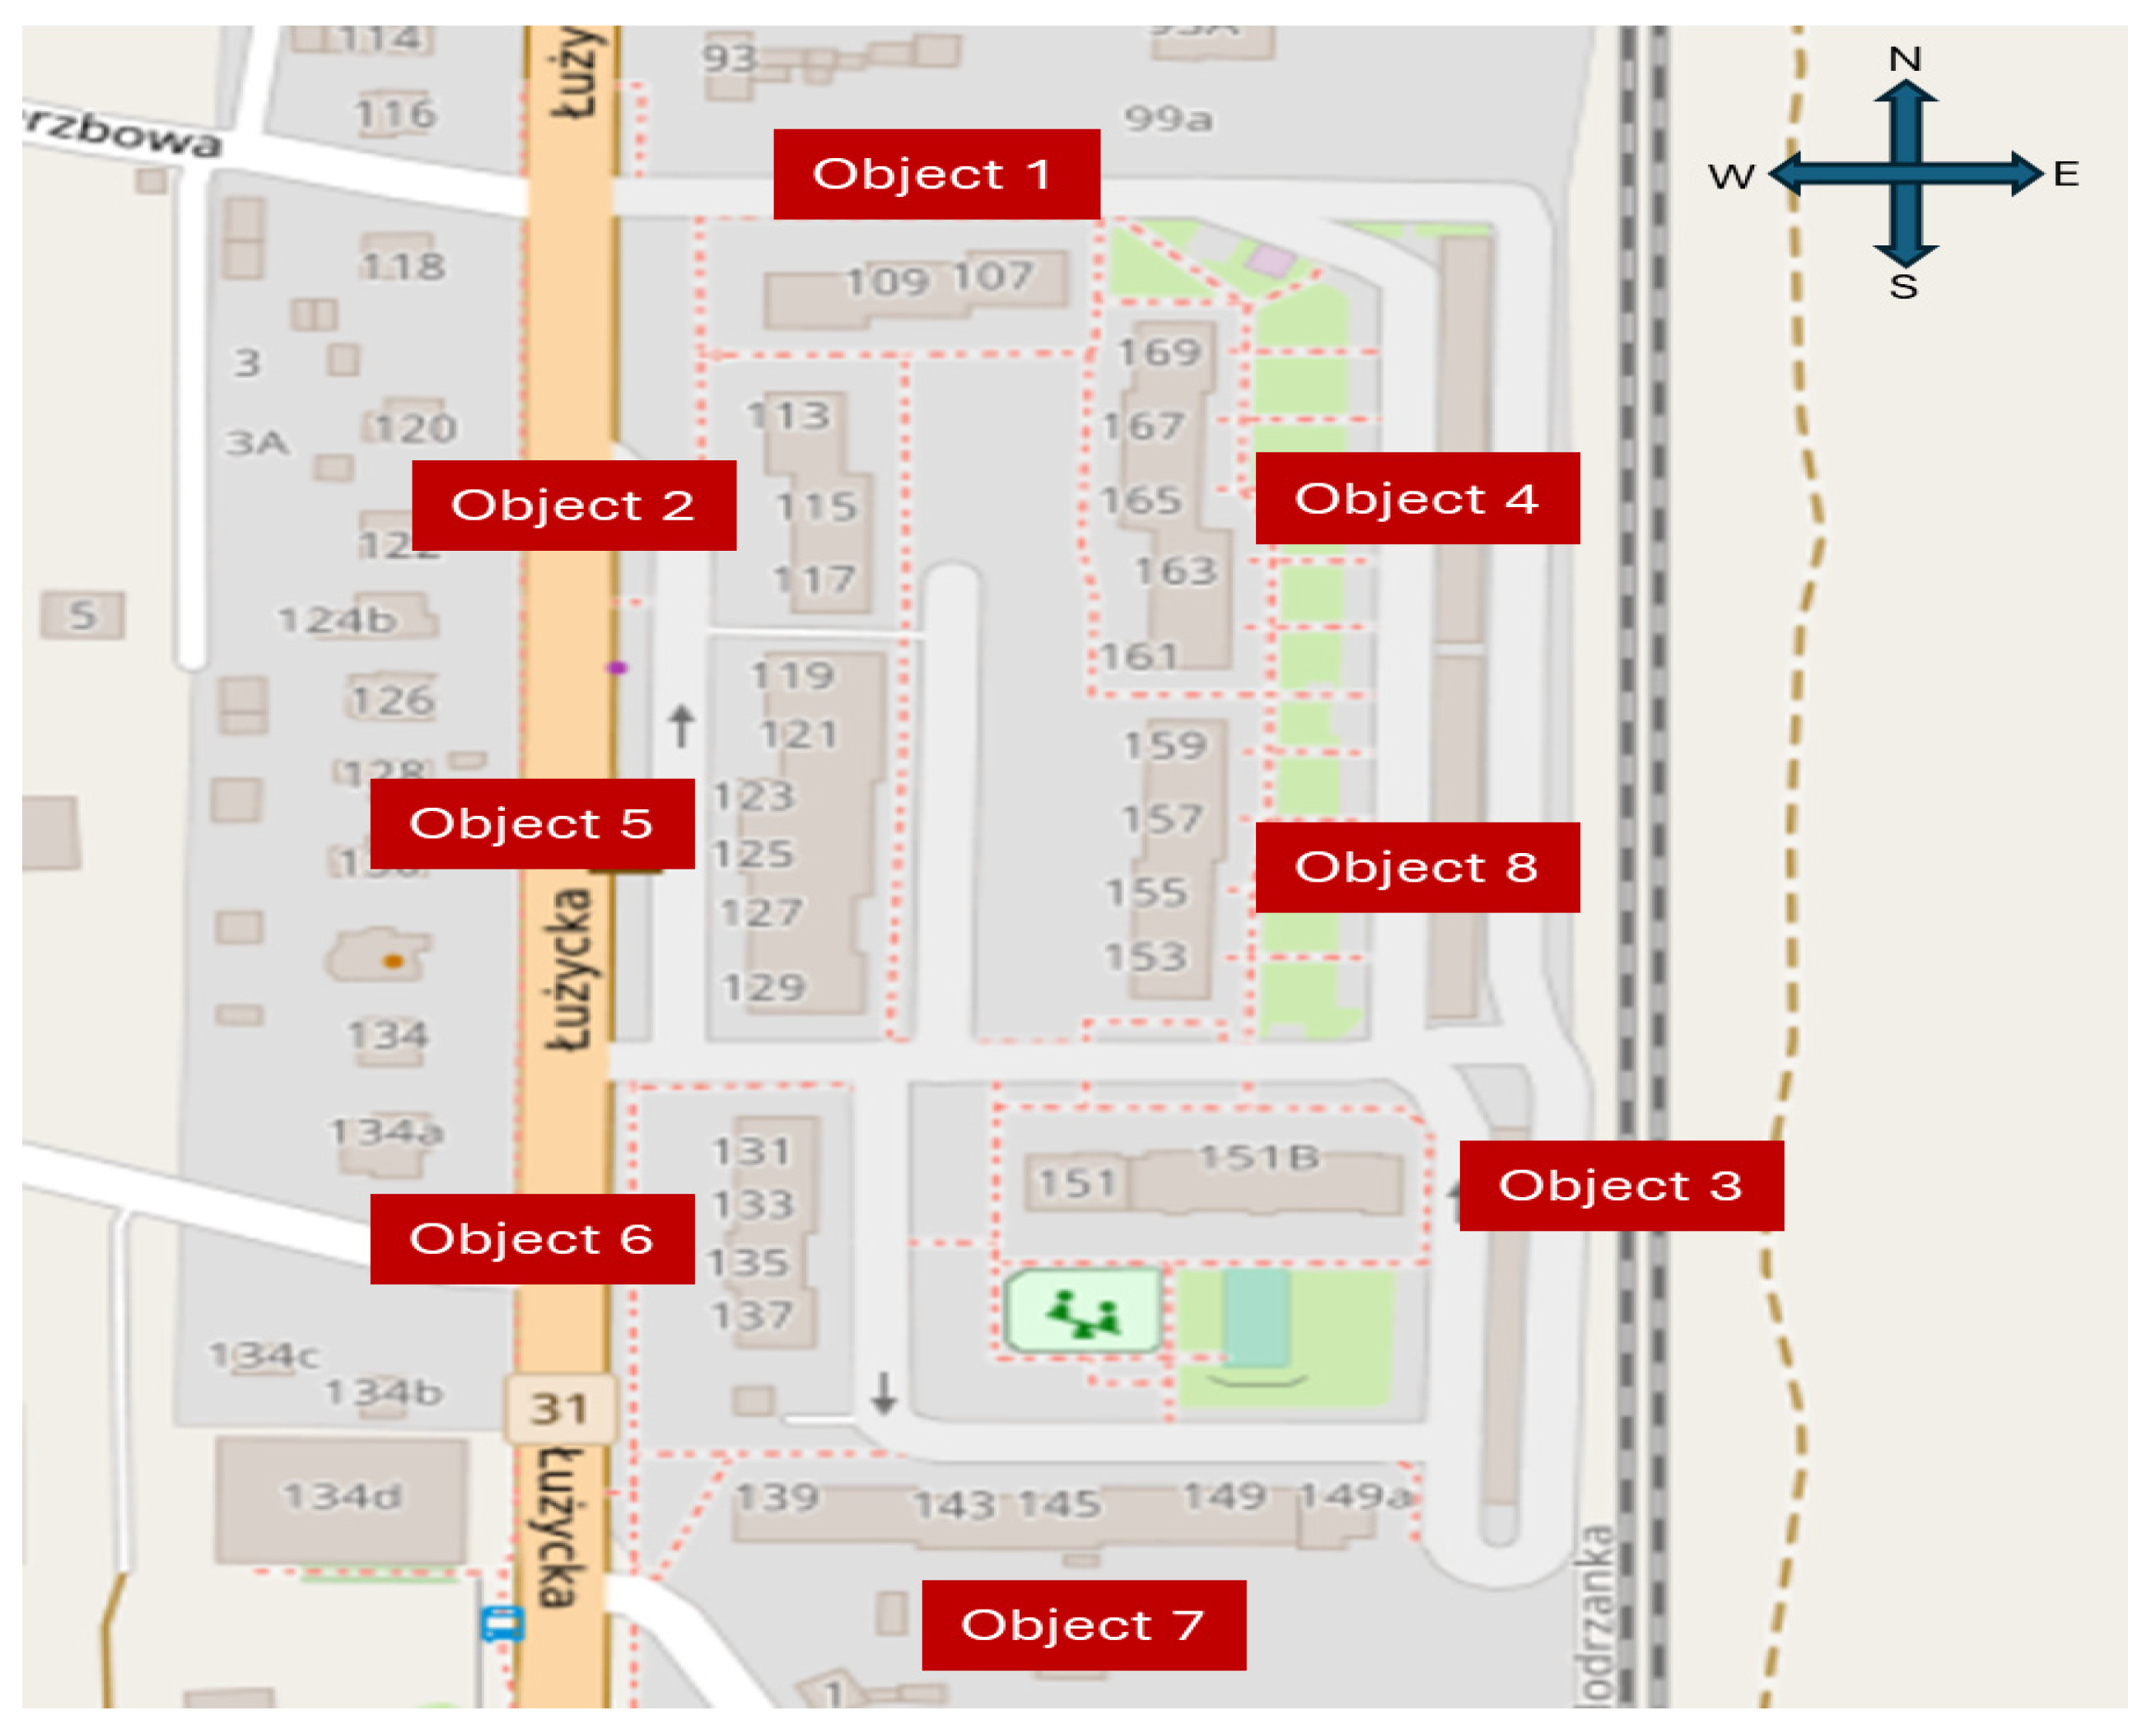
The complex consists of eight six-story residential buildings, each characterized by a different average number of residents, reflecting the dynamic nature of the community in recent years. In 2017, the total average number of residents in individual buildings was as follows: Building 1—71 people, Building 2—87 people, up to Building 8—120 people. Minor changes were observed in the following year; for instance, the number of residents in Building 1 decreased to 70 people, while in Building 7 it increased to 139 people. In the subsequent year, further changes highlighted demographic variability, e.g., the number of residents in Building 1 increased to 72 people, while in Building 6 it decreased to 94 people. The heating area of the buildings ranges from 2007.96 m2 for Building 1 to 3927.97 m2 for Building 5, indicating variation in size and potential energy demand.
The complex was built in the 1990s. It consists of eight residential buildings. The housing estate is managed by a housing cooperative. Multi-family buildings are connected to the municipal heating network, which supplies the heating agent necessary to meet the central heating and hot water needs. This service is provided by a local heating company. Electricity supplies to the heat substations are secured through individual agreements between the heat supplier and the local electricity distribution company.
All buildings included in the housing estate have individual heat substations. The consumption of heat supplied to the building is measured using a main heat meter installed on the return pipe by Kamstrup, belonging to the supplier. Heat consumption levels are read monthly via radio in a drive-by system. The registration of electricity consumption is carried out by readings made by the Enea operator. The building manager, aware of the need to reconcile the records of heat consumed for central heating purposes, reads the heat consumption for central heating purposes from the heat meter installed on the return from the heating module of the heat substation and registers the amount of cold water supplied for hot water purposes through the water meter. The administrator also calculates the coefficient of water heating. Heat substations are installed in dedicated technical rooms of the building, accessible only to authorized persons. Individual rooms differ in size. In two locations, it is possible to build additional technical infrastructure, allowing for the expansion of systems with new capabilities, such as energy storage. Individual buildings are connected to the municipal heating network based on connection agreements and technical conditions issued during the construction period. The current demand for thermal power is constantly verified. This is related to thermal modernization works, installation of thermostatic valves under vertical control valves, increased user awareness, and climatic conditions.
In summary, the development regarding the design of hybrid photovoltaic and photovoltaic installations was based on a wide range of research methods, which enabled a comprehensive technical, economic, and organizational analysis of the investment. Thanks to methodological rigor and appropriate evaluation criteria, the research results are reliable and have practical application in the management area.

4. Installation Sizing and Results

For the analysis, the buildings were categorized into two groups. Table 1 presents the data on the average daily electricity consumption in kilowatt-hours (kWh) for these facilities, categorized by groups. In this study, the term “Object 1 to 8” refers to multi-family buildings equipped with vacuum tube collectors and photovoltaic modules installed on their roofs. These buildings also house energy storage units and heat exchangers.
To compute the nominal power of the modules required for heating substations, it is essential to select them based on the season. Formula (1) was employed for this purpose to ascertain the energy efficiency of the PV system (PV), considering losses through appropriate coefficients:
E i d = P P V   ·   Z 1   ·   Z 2   ·   Z 3   ·   V [ kWh / day ]
where the variables are defined as follows:
Eid represents the energy efficiency of the PV system (kWh/day), derived from the daily demand for electrical energy indicated in Table Groups No. 11 and No. 12. PPV denotes the requisite nominal power of modules (kW), whereas Z1 signifies the average daily sunlight hours under Standard Test Conditions (STC) (h/day), with a coefficient contingent upon location and the month of the year. Z2 and Z3 represent coefficients associated with the deviation from the horizontal plane and module temperature, respectively in Table 2. Additionally, V, calculated as the product of V1, V2, and V3 (V = V1V2V3 = 0.76), accounts for voltage drops along cables and losses linked to battery usage. V1 (0.94) corresponds to the efficiency of converting electrical energy into chemical energy and vice versa in batteries, while V2 (0.9) represents losses due to voltage fluctuations during variable sunlight and differing module temperatures. The term “STC” stands for “Standard Test Conditions”, encompassing standardized parameters used for assessing photovoltaic (PV) module performance. These conditions include a cell temperature of 25 °C (or 77 °F), solar irradiance of 1000 W/m2, and an air mass equal to 1.5 (AM1.5). The air mass (AM) signifies the spectral distribution of sunlight reaching the Earth through the atmosphere, with AM1.5 representing a typical condition for sunlight reaching the Earth at a specific angle, corresponding to the average solar spectrum for moderate latitudes. The state of STC serves as a universal benchmark for comparing the performance of diverse photovoltaic modules, ensuring standardized evaluation methods.
The heating substation devices operate year-round, irrespective of the season (excluding the central heating system). The calculations were grounded on fixed values for Groups I and II of buildings (as depicted in Table 1) to compute the demand for   E i d in both summer and winter. Following the transformation, Equation (1) was reformulated into Equation (2), enabling the determination of the nominal power of the modules (as presented in Table 3:
P P V = E i d   Z 1   ·   Z 2   ·   Z 3   ·   V [ kW ]
To calculate the area required for PV modules, the computed power values from the summer periods for Group I and Group II were utilized. Any energy deficits during this period will be supplemented from the power grid. Table 4 below presents a summary of module types and their corresponding surfaces for generating power [1 kWp].
Silicon modules were utilized for the study. The assumed area of the modules, as per the data from Table 3, is 4542∙8 m2 = 36,336 m2 for Group I and 5906∙8 m2 = 47,248 m2 for Group II. Modules with a peak power of 350 Wp from a recognized brand were selected.
For each group, the number of modules was determined. For Group I, 13 units with a power of 4.55 [kWP] were allocated, with a planned assembly area of (1.74 m∙1.03 m∙13 pcs. = 23.30 m2). For Group II, 17 units with a power of 5.95 [kWP] were designated, with a planned installation area of (1.74 m∙1.03 m∙17 pcs. = 30.47 m2).
Below are calculations for the photovoltaic panel fields for Object 1 and Facility 7. The field intended for the installation of photovoltaic panels for Building 1 measures 4 m ∙13.66 m, accounting for shading. The assumed dimensions for calculations, after subtracting the required distances, amount to 3 m∙12.6 m = 37.8 m2. This represents approximately 62% more than the area required and obtained from the calculations. Conversely, for Object 7, the area allocated for the installation of photovoltaic panels is 4 m∙11.2 m. The assumed dimensions for calculations, after subtracting the required distances, result in 3 m∙11.2 m = 33.6 m2, representing about 10% more than the area required and obtained from the calculations.
The subsequent stage of the analysis involved selecting rechargeable batteries. With the correct operating process, energy production should fulfill the demand and provide a reserve of 50% to prevent battery discharge. Battery capacity is calculated using Formula (3), and the calculations for Building Groups I and II are presented in Table 5:
C = 2 · W · F U [ Ah ]
where C—battery capacity [Ah], W—daily energy demand [Wh], F—coefficient related to energy reserve: 2.5 for summer and 4 for winter, and U—system voltage [V].
Following that, the selection of electrical wires with an appropriate cross-sectional area was conducted. To connect the installation with the devices, it was essential to calculate the cross-section of the DC electrical wires. Copper wires with an assumed line voltage drop of 3% were employed. The cross-section of DC electrical wires is determined by Formula (4). The calculations used to select the cables are detailed in Table 6:
A = [ L · P 3 % · K · U 2   ] [ mm 2 ]
where the variables are defined as follows:
A—conductor cross-section [mm2], K—specific conductivity of copper KCU = 56 [ m Ω · m m 2 ] , U—system voltage 12 [V], L—length of wires [m], and P—transmitted power [W].
Table 6. Cross-section calculated and selected for DC electrical conductors (connection between generator (PV) and battery).
Group IGroup II
L ± l [m]14040
P [W]45425906
A [mm2]CalculatedSelectedCalculatedSelected
26.28259.7710
Hence, DC installation cables were selected for Group I with a diameter of 25 mm2 and for Group II with a diameter of 10 mm2, denoted as follows: 10 mm2–25 mm2.
For an AC system connecting the receiving devices with the inverter, it is essential to determine the length of the wires in the node rooms, as well as the power cables of individual buildings. The load current for single-phase circuits is determined by Formula (5), with the calculation for individual objects provided in Table 7:
I r o b = P U f   ·   c o s ϕ [ A ]
where the variables are defined as follows:
I r o b —operating current [A] and U f —phase voltage [V]. The calculation was based on i 230   [ V ]   c o s ϕ = −0.95.
Table 7. Load current values for groups of buildings from Table 1.
Group IGroup II
Object NameObject 1Object 2Object 3Object 4Object 5Object 6Object 7Object 8
P [W]10010516513728210968199
I r o b   [A]0.460.480.750.631.290.500.310.91
Next, the cross-section of the AC conductor is determined according to Equation (6). Calculations for the size of these cross-sections for individual objects from Table 1 are included in Table 8.
S   = P · I U 2 · γ · 0.01 [ mm 2 ]
where the variables are defined as follows:
S—cross-section of the cable [mm2], P—power [W], l—total length of the cable [m], U—voltage [V], γ—specific conductivity Cu = 56 [ m Ω · m m 2 ].
Table 8. Cross-section (S) calculated and selected for AC conductors for building groups from Table 1.
Group IGroup II
Object NameObject 1Object 2Object 3Object 4Object 5Object 6Object 7Object 8
P [W]10010516513728210968199
L [m]Node room10.0010.0010.0010.0010.0010.0010.0010.00
power supply to the building1046815014188096
sum of distances1147825101519810106
S [mm2]Calculated0.380.280.140.051.440.360.020.71
Chosen1.51.51.51.541.51.52.5
In the case of two loads, it was necessary to increase the cable diameters, specifically for object 5 and object 8, due to the significant voltage drops. Percentage voltage drops for single-phase circuits were determined according to Formula (7). The results of these calculations are presented in Table 9.
Δ U = 200 · P · I U 2 · γ · S [ % ]
During the calculations, it was observed that the percentage of voltage drop for object 5, when using smaller conductor diameters, significantly exceeded the permissible value of ΔU% = 1%. Conversely, for object 8, with a smaller wire diameter, the calculated percentage was close to the permissible voltage drop of ΔU% = 1%.
As a result of these calculations, cross-sections of AC wires were selected for individual locations: YKY 3 × 1.5, 3 × 2.5, 3 × 4 [mm2].
The next step involved determining the power range of the inverter. To properly select an inverter, it’s essential to know the power of the photovoltaic panels that will be installed. By considering the values calculated for the summer conditions of each group (Table 3), the power of the modules in the summer was estimated as follows: for group I, PPV = 4542 W, and for group II, PPV = 5906 [W]. Using Equation (8), the appropriate inverter was selected for each group of objects from Table 1, with the results presented in Table 10:
0.7∙PMAX(MOD) < PNOM(INV) < 1.2∙PMAX(MOD)  [W]
where the variables are defined as follows:
PNOM(INV)—inverter power [W], PMAX(MOD)—module power [W].
Table 10. Selection of the inverter in the given nominal power ranges.
Group IGroup II
Extremes of power bandsPNOM(INV)
0.7∙PMAX(MOD)3179.44134.2
1.2∙PMAX(MOD)5450.47087.2
Inverters selectedFronius Symo Hybrid 4.0-3-S—rated AC output power 4.0 kW.Fronius Symo Hybrid 5.0-3-S—rated AC output power of 5.0 kW.
The number of minimum and maximum modules in the chain, along with their quantity, were calculated. To ascertain the potential minimum and maximum number of connected modules in a chain, this process should be conducted when the total system voltage equals the sum of the voltages generated by the modules connected in series. The maximum number of modules in the chain is determined by Formula (9), the minimum number by Formula (10), and the number of module chains by Formula (11). The calculations are outlined in Table 11.
n M A X = V D C ( M A X ) V O C ( 10 ° C )
n M I N = V D C ( M I N ) V M P P ( 70 ° C )
I N   S T R I N G S     I M A X ( I N V ) I N   S T R I N G [ A ]
where the variables are defined as follows:
V D C ( M A X ) —maximum input voltage of the Inverter, —open circuit voltage at −10 °C, if it is not specified in the manufacturer’s specification, it should be calculated on the basis of STC data: = 1.14, V O C 10 ° C V O C 10 ° C V O C S T C .
V D C ( M I N ) —minimum inverter input voltage, —open circuit voltage at 70 °C, if it is not specified in the manufacturer’s specification, it should be calculated on the basis of STC data: = 0.82∙ V M P P ( 70 ° C ) V M P P ( 70 ° C ) V O C ( S T C ) .
I M A X ( I N V ) maximum permissible DC current (16ADC inverter), —maximum current in the string (serial modules 10.01 A). I N   S T R I N G .
Table 11. Maximum and minimum number of modules and number of module chains.
Number of Panels Group IGroup II
Maximum V D C ( M A X ) [V]1000
V O C ( 10 ° C ) [V]1.14∙41.21 = 46.98 V O C ( S T C ) = 1.14   ·
n M A X 1000 46.98 = 21
Minimum V D C ( M I N ) [V]150
V M P P ( 70 ° C ) [V]0.82∙= 0.82∙41.21 = 33.79 V O C ( S T C )
n M I N 150 33.79 = 4
N S T R I N G S   16   A 10.01 = 1.59
The calculations reveal that the maximum number of modules that can be connected in a single chain is 21 units, while the minimum is 4 units. Additionally, there is only one chain per phase.
Moving on to the subsequent stage of the analysis, the aim was to estimate the annual electricity production from 1 kWp. Theoretical calculations were conducted, considering the potential electricity generation from the installed modules. Utilizing Formula (11), the annual electricity production for groups I and II as shown in Table 1 was estimated based on the module power data from Table 3. The resulting figures are provided in Table 12.
E e l e k t = E S   ·   η   ·   P P [ kWh / m 2 year ]
where the variables are defined as follows:
E S annual sum of solar radiation energy [kWh/m2year], η —average efficiency of photovoltaic modules, P P —analyzed area.
For the calculations, it was assumed that: = 19.8% = 0.198.900 [kWh/m η E S = 2year], P P = 1 kWp350 W = 5.12 [m2/1 kWp], location in Gryfino, West Pomeranian Voivodeship.
Table 12. Estimated quantities of annual electricity production.
Estimated Yield of Electricity from 1 [kWp/year]
E e l e k t = 900 [kWh/m2year]∙0.198∙5.12 [m m2/1 kWp] = 912.384 [kWh/(m2 (1 kWp)]
Group IGroup II
installed power of modules P4.55 [kWp]5.95 [kWp]
E e l e k t [kWh/1 kWp]4.55∙912.384 = 4151.34 [kWh]5.95∙912.384 = 5428.68 [kWh]
  • Selection of solar collector surfaces for the installation and roof of buildings
For the purpose of sizing and designing solar collector installations, the heat demand for domestic hot water (DHW) heating and water consumption were determined. This information can be obtained based on readings from heat meters, storage water meters, and the main water meter for DHW or estimated through calculations. It has been assumed that solar energy utilization in DHW preparation for residential installations can range from 80% to 90%, a consistent value. In single-family dwellings, it is assumed that 1 square meter of collector area corresponds to the hot water demand of one user (occupant) if the collector is designated for DHW preparation. For multi-family housing with larger installations, this area per capita can be reduced to 0.5 square meters for calculation purposes. Due to the scale of the buildings in question, the potential support for the central heating system was not considered.
Table 13 below presents calculations of collector areas for objects from Table 1.
The calculated areas of solar collectors designated for DHW heating are −189 m2 for group I and −237 m2 for group II. For subsequent computations, the KSP-12U type Direct-Flow vacuum collectors with an absorber area of 3.68 m2 were assumed, resulting in a collector area of 2.12 m2. The utilization of these collectors in installations tailored to existing buildings reduces weight compared to flat collectors, eliminates the sail effect, and thus, does not necessitate structural alterations to the roofing. Direct-Flow vacuum collectors offer versatility in installation locations, including building facades, pitched roofs, flat roofs, and ground installations. Their low hydraulic resistance permits the creation of sections comprising six manifolds. Vacuum tube collectors were selected due to their superior performance compared to flat plate collectors, particularly in conditions of lower temperatures, which aligns with the higher heat demand in residential buildings.
Below, calculations for the number of solar collectors and sections for each building group are conducted according to Formulas (13)–(15). The results are outlined in Table 14.
n = P k I P p a
i = n 6
P d = P k ·   n
where the variables are defined as follows:
P k I —collector area [m2], P p a —absorber area [m2], n—number of collectors, i—number of sections, Pd—required roof area [m2], Pk—area of a single collector [m2].
Table 14. Collector counts, sections, and collector area for objects in Table 1.
Group IGroup II
P p a 3.68 m2
P k I 189 m2237 m2
P k 2.12 m2
n (189 m2)/(3.68 m2) = 51.35 ≈ 52 pcs.(237 m2)/(3.68 m2) = 64.4 ≈ 65 pcs.
i 52 6 = 8.66 ≈ 965/6 = 10.83 ≈ 11
P d 2.12 m2∙52 = 110.24 m22.12 m2∙65 = 137.8 m2
Consequently, for the first group of buildings, it was assumed that 52 KSP-12U vacuum collectors would be installed across nine sections. It was determined that the required roof area for installing vacuum solar collectors for group I buildings, without factoring in necessary distances, amounts to 110.24 m2. Regarding the second group, 65 collectors are needed, covering a corresponding area of 137.8 m2. These vacuum collectors are slated for installation on the roofs of buildings, with group I installations planned for the roof of building object 1 and group II installations on the roof of building object 7.
Subsequently, calculations were conducted to determine the actual number of collectors that can be accommodated on the buildings, considering the area of their roofs. 
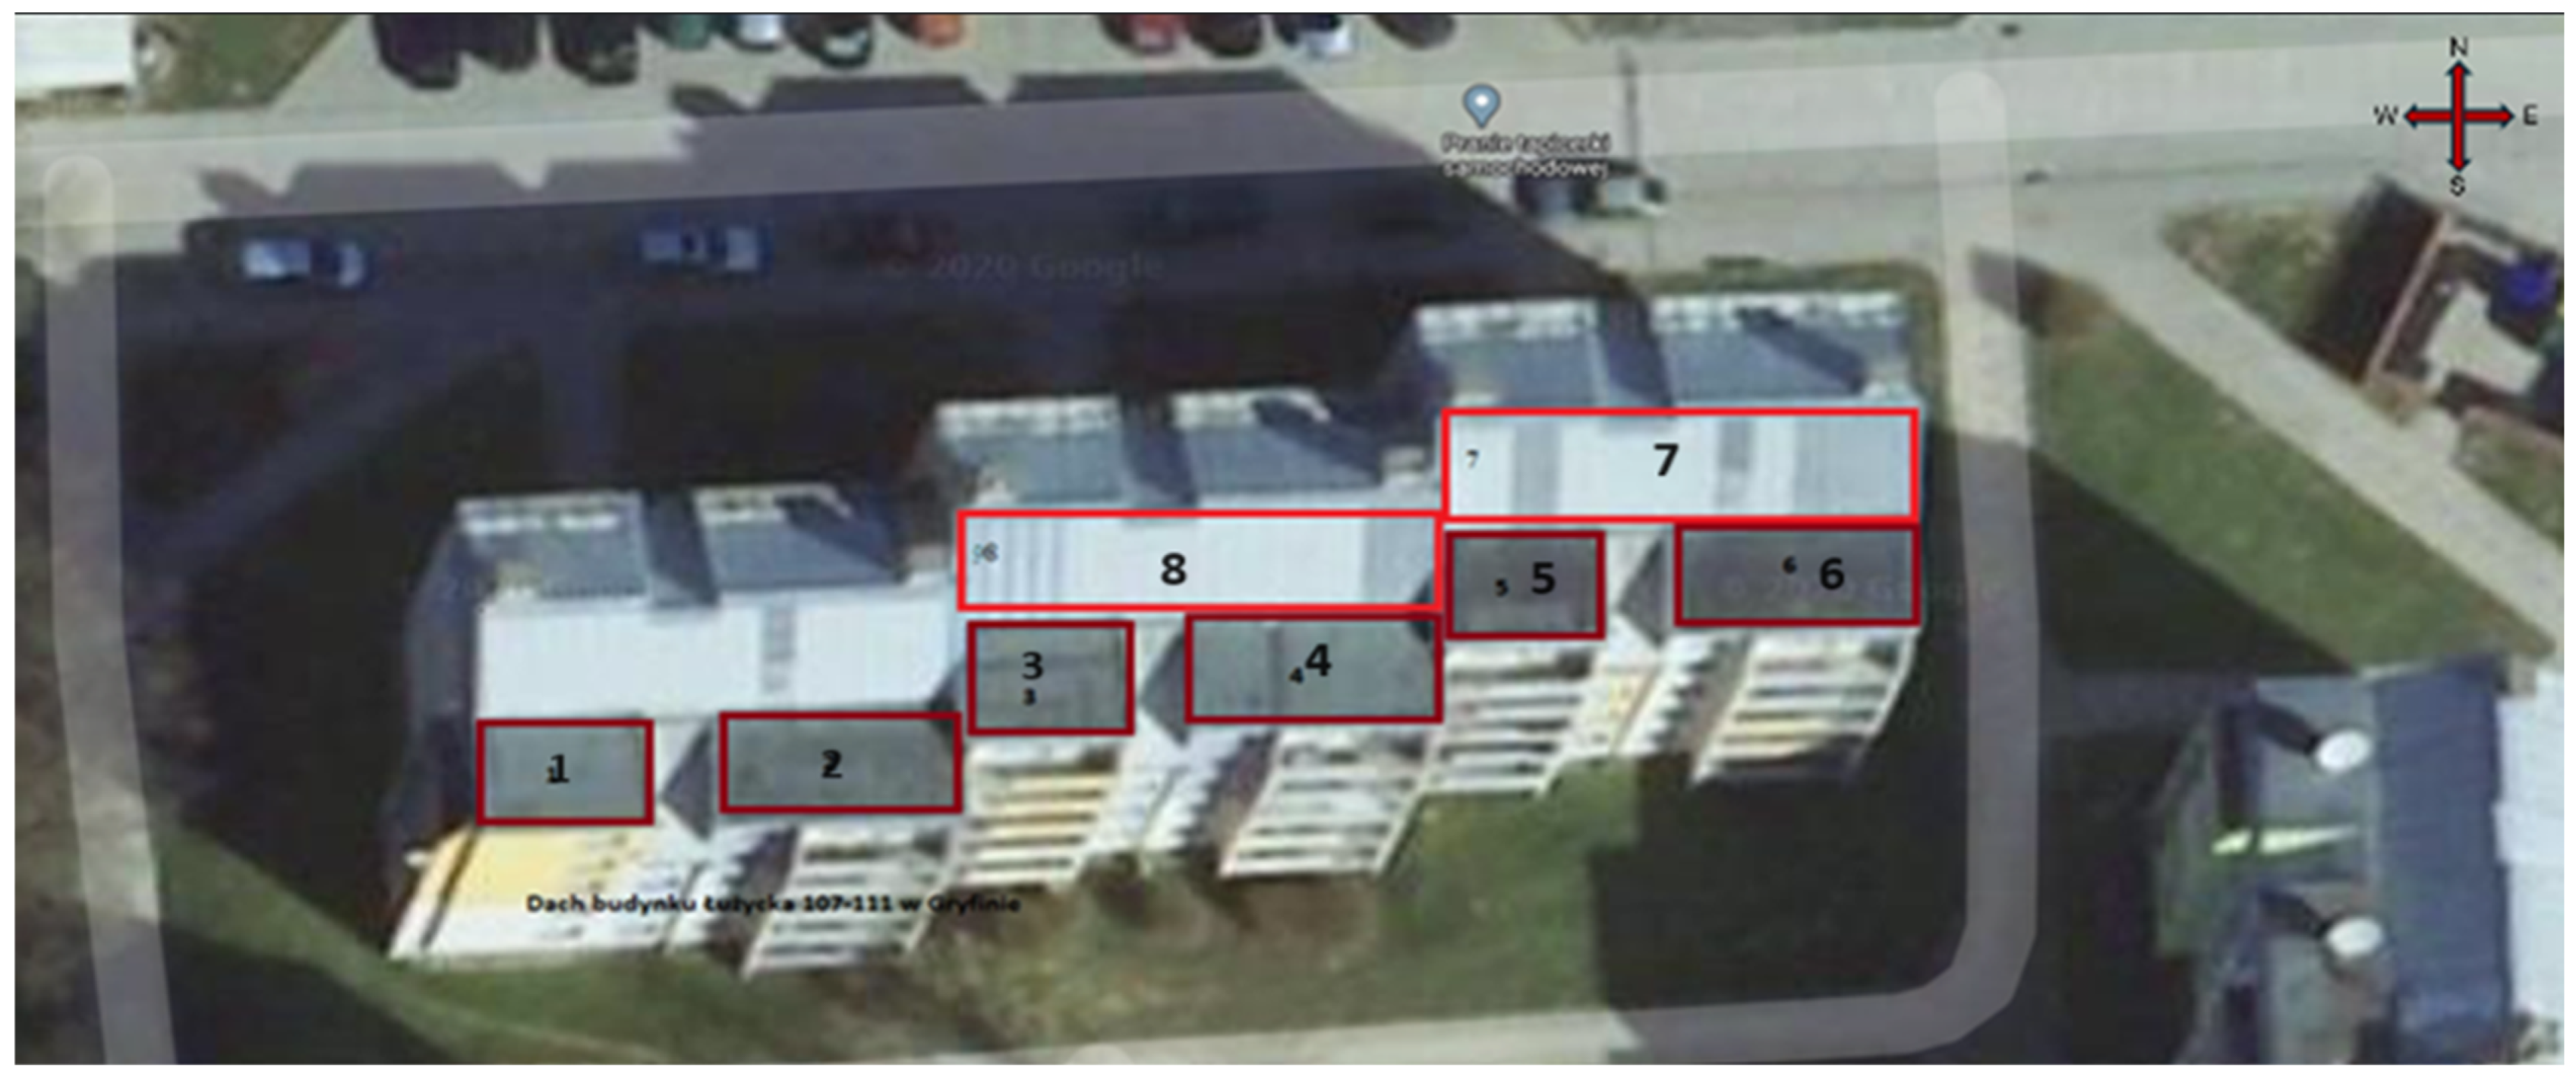
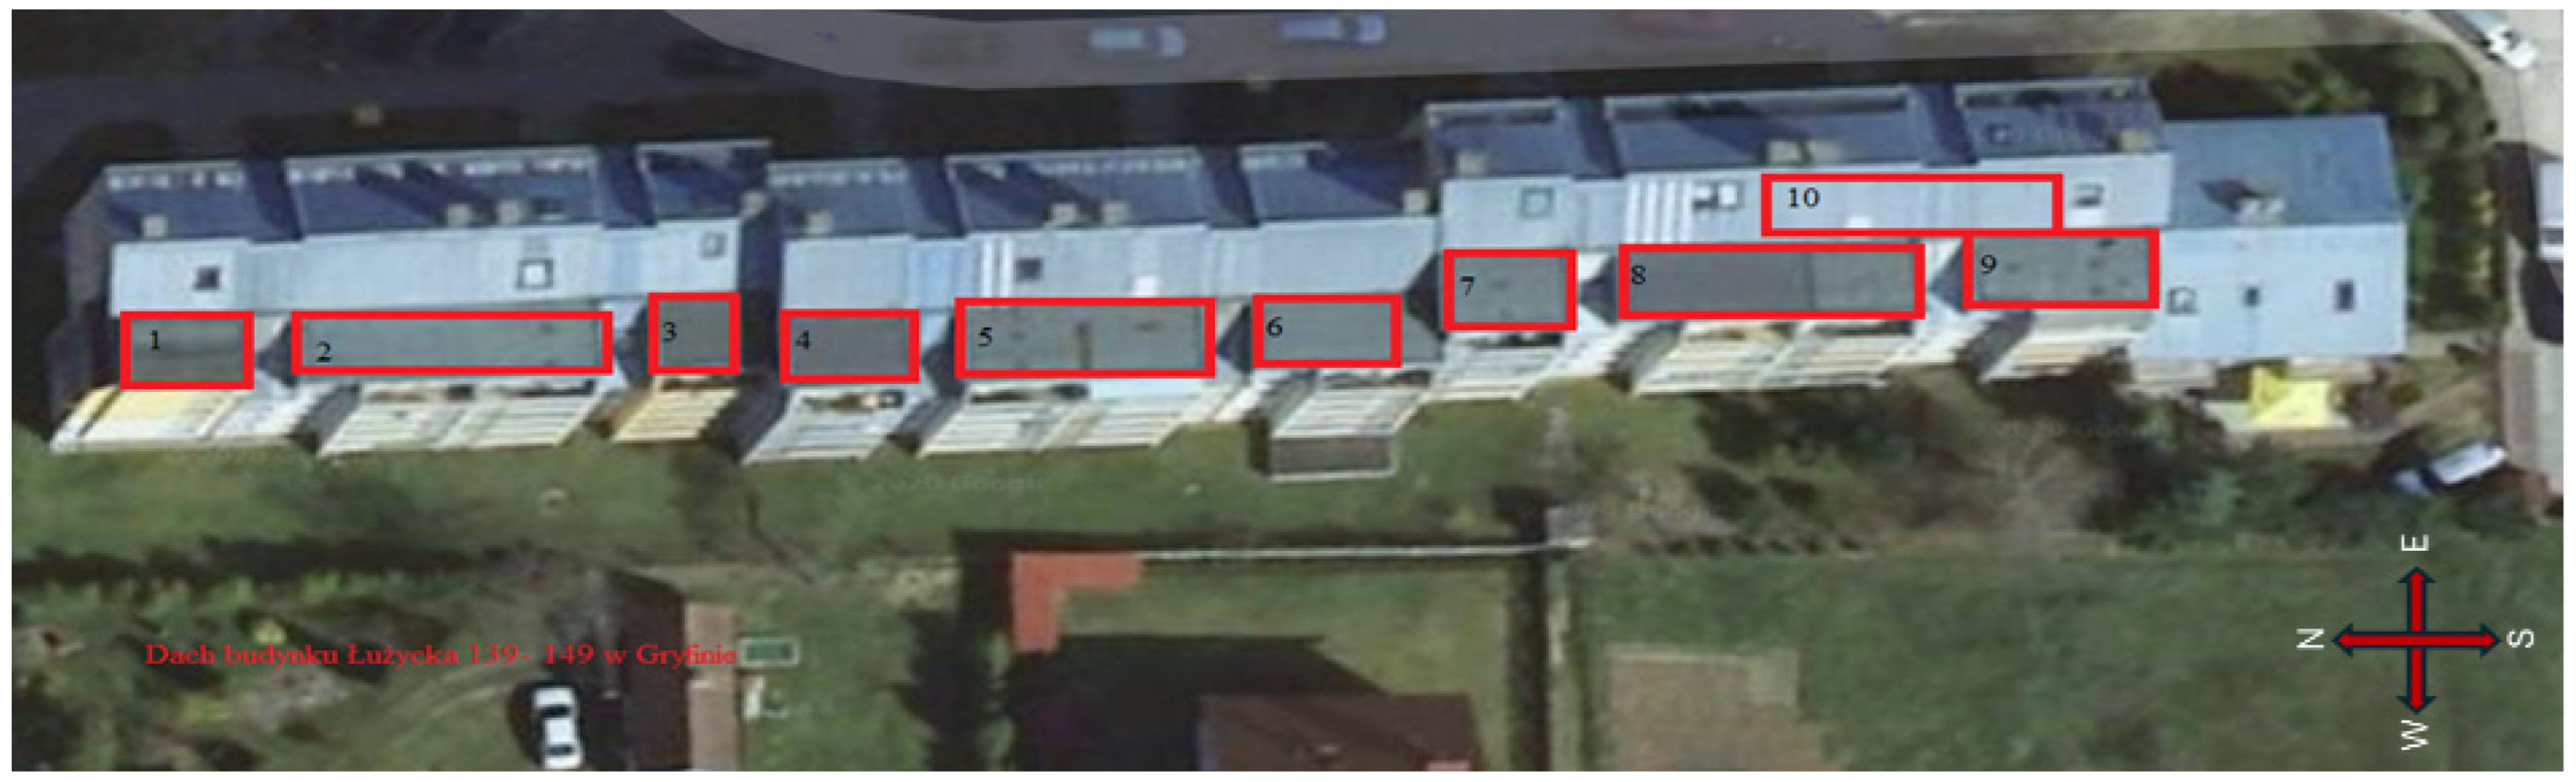
Table 15 presents the essential calculations, while Figure 1, Figure 2 and Figure 3 depict photographs showing the roof view of the respective subjects: object 1 and object 7.
The number of collectors that can be installed on the roof of building 1 in group I of buildings is 54 units. This accounts for 100% of the calculated number of collectors required to fulfill the DHW heating demand from the solar panel installation. Due to the arrangement of the collector mounting bays, it was decided to allocate 10 sections, deviating slightly from the initially calculated 9.
The quantity of collectors that can be installed in group II of buildings is 65 units. This constitutes 100% of the calculated number of collectors required to satisfy the demand for hot water heating from the solar collector installation.
  • Selection of DHW tanks
There are three methods available for selecting DHW tanks for water storage. The first method involves determining the daily demand for hot water by the users, which often results in high values with considerable error margins. This approach doesn’t provide a means to estimate the temperature of the withdrawn water from the system. Under normal usage conditions, the heated water from the solar system should ideally cover 60–70% of the annual demand, with percentages rising to 80–90% during the summer months.
The second method for determining the DHW tank size is based on the assumption that the daily demand for hot water is a constant 0.05 m3 per inhabitant. While this is an average figure, it aligns closely with actual water demands of over 50 L per inhabitant. Details regarding this method are provided in Table 16.
Another method for selecting a DHW storage tank involves calculating its capacity using the Formula (16), which is commonly used in Poland for designing hot water installations. Please refer to Table 17 for the corresponding calculations.
V = c o e f f i c i e n t ( 0.05 ÷ 0.1 )   ·   F k   [ m 3 ]
where the variables are defined as follows:
F k —surface area of the solar collector, V —tank capacity [m3].
Table 17. Calculation of tank capacity for groups: I and II.
Group IGroup II
Fk189 m2237 m2
Coefficient(0.05 ÷ 0.1)0.1
V18.9 m323.7 m3
The calculated energy storage capacities for groups I and II, obtained from two different calculation methods (as shown in Table 16 and Table 17), either coincide or show similarities. The system will be outfitted with devices enabling energy storage to meet the demand for hot water. The option of utilizing superheating in flow mode, facilitated by the heating substation, enables the storage tank capacities to be limited to the required values:
For group I, a tank volume of VI = 16 m3 was assumed, while for group II, t VII = 20 m3. Insulated tanks without coils from Termica, designed specifically with a capacity of 4.0 m3 each, will be installed in sets of 4 for group I and 5 for group II, utilizing a series-parallel connection system.
  • Selection of DHW exchangers
To ascertain the daily demand for thermal energy required to heat the assumed capacity of DHW tanks, two methods can be employed. The first method is theoretical and involves utilizing a formula for the thermal energy received from a water accumulator (Formula (17) as provided in Table 18). The second method relies on calculations using actual data, if available (as provided in Table 19).
Q w = ρ   ·   C   ·   V w   · ( t w c t w z ) [ J ]
where the variables are defined as follows:
Q w —daily demand for thermal energy [J], ρ —density of water [kg/m3], C —specific heat of water [J/kg K], V w —volume of hot water consumed [m3], t w c —hot water temperature [°C],   t w z —cold water temperature [°C].
Table 18. The amount of energy required to heat the water in the DHW tanks calculatd by Formula (19).
Group IGroup II
ρ 998.3 kg/m3
C 4200 J/kg K
V w 16 m320 m3
t w c 55 °C
t w z 10 °C
Q w 838.572 kWh1048.215 kWh
Table 19. Daily demand for thermal energy for DHW.
Object NameThree-Year Average Heat Consumption (GJ)Average Monthly Heat Consumption (GJ*278 = kWh)Daily Consumption of Thermal Energy for DHW (kWh/day 30.67)Hourly Heat Output of DHW Demand (kW)
Group I
Object 116.864688.01154.366.43
Object 219.025286.32174.067.25
Object 528.217841.14258.1910.76
Object 428.377885.93259.6610.82
Amount846.2735.26
Group II
Object 619.265353.97176.297.35
Object 734.959716.72319.9413.33
Object 823.166437.86211.988.83
Object 320.125593.98184.197.67
Amount892.437.18
The results obtained from both methods exhibit discrepancies. In the case of group I buildings, the differences are minimal, amounting to approximately 1%. However, when comparing the results for group II, the disparities can reach up to 15%. Such variations may stem from factors such as the condition of water installations in buildings, implemented work programs in substation regulators, and actual values of DHW and ZW temperatures. For further calculations, values from Table 20 will be utilized, representing the actual energy consumption: 846.27 kWh for group I and 892.4 kWh for group II.
In large solar installations, external heat exchangers are employed to facilitate heat exchange between water sources. In the first climate zone of Poland (−16), glycol serves as the working medium in solar installations. Tubular heat exchangers (Jad type) or brazed/bolted plate heat exchangers are typically utilized in such installations. Plate heat exchangers offer a more precise adjustment of the exchange surface due to their design, but they may be prone to defects such as leaks at the joints of the panels and are more susceptible to contamination of working media. When selecting an exchanger, a simplified conversion rate of the exchange area ranging between 0.2 and 0.35 can be applied. For small installations, calculations consider the area of the solar collectors, while for large installations, the maximum power output is considered.
The effective utilization period of solar collectors spans from March to October. On average, the number of hours of practical use in this region amounts to 1600 h. Within the effective operating period, there are 243 days per year. On any given day, approximately 6.58 h of effective collector operation can be expected. The energy required to heat DHW for individual groups was calculated to fulfill the demand within the daily period. To ascertain the capacity of the exchangers during effective operation, their daily operating time should be assumed. The capacity of the solar system was determined using Formula (18), specifying the simplified conversion rate of the exchange area. Following hourly calculations, the results presented in Table 20 were derived.
P W = 0.35 · P ( I ; II )   [ kW ]
Heat exchangers have been selected for groups I and II, consisting of one JAD 6/50 unit, capable of producing 60 kW of power at Δt 25 °C. These units are known for their low resistance and high operational reliability. Heat exchangers of this type are readily available on the market.
  • Selection of solar and charging pump
The selection of the pump for the solar system was made on the basis of a simplified Formula (19) for the optimal flow rate as a function of the area of solar collectors m ˙ F k   [ m 2 ] . The calculations are presented in Table 21.
m ˙ = c o e f f i c i e n t ( 0.6 ÷ 1.2 ) F k   [ L / m i n · m 2 ]
Following the calculations and technical parameter analysis, pumps from the Grundfos Magna series were chosen for the solar systems in each group. These pumps are known for their flow variability, allowing for the adjustment of the operating point, electronic control, and high operational reliability. For group I buildings, the selected pump model is the Magna 32-100 180 Grundfos, while for group II buildings, the Magna 40-100 F 240 Grundfos model was chosen.
When selecting a DHW charging pump, it is also possible to use the simplified Formula (20) for the optimal flow rate as a function of the area of the exchangers m ˙ F w   [ m 2 ] The calculations are presented in Table 22.
m ˙ = c o e f f i c i e n t ( 0.6 ÷ 1.2 ) F w   [ L / m i n · m 2 ]
Following the calculations and technical data analysis, the same pumps were selected for the energy storage charging systems in both groups of buildings—the Grundfos Alpha 25-60 180 series. These pumps are known for their flow variability, which allows the adjustment of the operating point, electronic control, and high operational reliability.
  • Selection of safety valves for solar and DHW systems
The guidelines for selecting a safety valve for the installation are outlined in the PN-99/B-02414 standard [41]. Additionally, safety valves are under the supervision of the Office of Technical Inspection (UDT) for installations with a capacity of ≥0.5 m3 for single-medium tanks (e.g., water) and ≥0.3 m3 for dual-medium tanks (e.g., gas/water). When choosing a DHW safety valve, the following factors should be calculated: the required throughput (model 21), the diameter of the valve seat (model 22), and the number of valves (model 23).
W = 1.59   ·   b   ·   A   ·   10 6   ·   p 3 p 1   ·   ρ 1   [ kg / h ]
d = 4   · W 3.14   · 1.59   ·   α   · 0.35   ·   1.1   · p 1 p 2 ·   ρ 1 )
n = ( d d o ) 2
where the variables are defined as follows:
W —safety valve capacity [kg/h], —coefficient depending on the pressure difference, b —cross-sectional area of damage, for plate heat exchangers 0.0001 m2, for capacitive heat exchangers coil diameter and flow heat exchangers [mm2], —permissible pressure (safety valve opening pressure) [bar], —pressure at the outlet of the valve (at the outlet to the atmosphere) [bar], A   p 1   p 2 p 2 = 0   p 3 nominal pressure of the heat network [bar], —density ρ 1 of the water liquid of the heat network for min. design temperature [kg/m3], —valve flow rate for air, —required valve seat diameter [mm], α   d - d 0   valve seat diameter [mm].
P3P1 < 5 [bar] − b = 1 3 1
P3P1 > 5 [bar] − B = 2
Data:
p1 = 6 max. pressure in the DHW system [bar]
p3 = 12 max. heat network pressure [bar]
T1 = 68 °C min. design temperature of the heat network [°C]
A—0.00005 [m2]
b = 2
ρ68—979.2 [kg/m3]
α—0.32 valve flow rate for air
d0 = 35
W =1.59∙bA∙106∙= 1.59∙2∙ p 3 p 1 · ρ 1   0.00005∙106∙= 12187.35 12 6 · 979.2   [kg/h]
d = 32.93 [mm] 4   · W 3.14   · 1.59   ·   α · 0.35 · ( 1.1 · p 1 p 2 ) ·   ρ 68   = 4   · 12,187.35 3.14   · 1.59   ·   0.32 · 0.35 · ( 1.1 · 6 0 ) ·   979.2    
n = ( d d o )2 = ( 32.93 35 )2 = 0.88
During the calculations, a safety valve was chosen for the domestic hot water (DHW) side, specified as a 1 1/4″ 6 bar model. One unit was allocated per object for both systems to ensure adequate safety measures and compliance with operational standards.
The method for selecting a safety valve on the solar system side follows the same process as selecting a safety valve for the central heating system. When choosing the safety valve for the solar system, the following factors should be calculated: the required capacity (model 24), the diameter of the valve seat (model 25), and the number of valves (model 23).
W = 447.3   ·   b   ·   A   ·   10 6   ·   p 3 p 1   ·   ρ   [ kg / h ]
d = 54   · W   α c   ·   p 1 ·   ρ   · 3600  
where:
ρ—density of the water liquid in the heat network for max. design temperature [kg/m3], αc—valve flow coefficient for water.
Data:
p1 = 4 bar max. Pressure in the solar system
p3 = 6 bar max. water mains pressure
T1 = 130 °C max. Installation Temperature
A—0.00005 m2
b—1
ρ130—935.2 kg/m3
αc—0.25 valve flow rate for air
d0 = 35
W = 447.3∙bA∙3600 p 3 p 1   ·   ρ  
W = 447.3∙1∙0.00005∙3600 = 3425.4 (kg/h) 6 4   ·   935.2  
d = 54∙ W   α c · p 1 ·   ρ   · 3600  
d = 54∙= 13.5 (mm) 3425.4   0.25 · 4 ·   935.2   · 3600  
n = ( d d o )2
n = ( 13.5 35 )2 = ( 182.25 1225 ) = 0.15
As a result of the calculations, a safety valve was selected on the side of the solar system type 3/4″; 4 bar in the amount of one piece per object for both systems.
  • Selection of diaphragm vessels for solar and DHW systems
A diaphragm vessel serves as a safeguard for the installation, mitigating pressure surges resulting from volume changes in the heating medium during the operation of the CO/DHW/CT/solar system. It functions as a stabilizer, and its absence can lead to the activation of safety valves and subsequent leakage of the medium due to excessive pressure buildup. This absence can disrupt operation or lead to increased costs associated with water charges. The selection of diaphragm vessels is governed by the Polish standard PN B-02414:1999 [41]. Equation (26) is utilized to calculate the water gain in the system (ΔV).
Δ V = e   ·   V c i [ L ]
where:
e —the coefficient of expansion of water, taking into account the difference in water expansion between expansion at the maximum operating temperature of the heating system and expansion at the minimum temperature when the system is not operating, —the total capacity of the water system V c i .
Then, in order to select a diaphragm vessel, the minimum volume of this vessel in the system (Formula (27)) (see Table 23) and the pre-pressure of the diaphragm vessel (—model V n   m i n   p i   28) and the filling pressure of the system (—model 29) p a are determined.
V n   m i n   = Δ V   ·   p f + 1 p f p i   [ L ]
p i = p s t + p p + 0.2   [ b a r ]
p a = V n   · ( p i + 1 ) V n Δ V 1   [ b a r ]
where:
p f —maximum pressure of the system (actuation of the safety valve) [bar], p i —pre-pressure of the diaphragm vessel [bar], p s t —static pressure of the system [bar], p p —pump discharge pressure, if the vessel is installed on the discharge side of the pump [bar].
Table 23. Selection of diaphragm vessels for solar and DHW systems.
DHWSolar System
Group IGroup IIGroup IGroup II
e 0.014500.014500.022690.02269
p f [bar]6644
V c i   [m3]16.120.10.2350.270
p s t   [bar]1.81.82.12.1
p p [bar]0.60.61.01.0
t m i n [°C]1011010
t m a x [°C]5557070
Δ V [L]233.45291.455.336.12
p i [bar]2.62.63.33.3
V n   m i n   [L]480.9600.3988.00101.96
p a   [bar] 3.573.57
The calculated capacity of diaphragm vessels in the DHW system for group I buildings is 480.9 L (for group II buildings, it is 600.39 L). Two diaphragm vessels of Reflex N250 type have been chosen for the hot water installations in group I (for group II, Reflex N300 type). In the solar system, the calculated capacity of the diaphragm vessel for group I buildings is 88.80 L (for group II buildings, it is 101.96 L). For the solar installation in group I, a diaphragm vessel of Reflex S100 type has been selected (for group II, Reflex S140 type).
The design of hybrid solar and photovoltaic installations, intended to supply both heat and electricity to power installations and equipment, necessitates the calculation of distances between individual rows. These installations are to be mounted on a roof with limited mounting areas. In the analyzed cases of building groups, physically adjusting the devices according to the calculations is not feasible.
The assumed angle of inclination for the solar collectors is 30°, corresponding to the latitude of the Gryfino installation site at 53°15′08″ N. The required distance to prevent shading is calculated to be 5887 mm. With a roof width of 4000 mm, determining the minimum mounting height involves utilizing formulas for calculating the sides of a right triangle with angles of 30°, 60°, and 90°. By considering the length of the solar collectors as the diagonal of this triangle, with an angle of inclination of 30°, and the rectangular angle at this angle as approximately 1732 mm, the minimum mounting height of the photovoltaic panels is calculated to be 1000 mm, which is half the length of the diagonals.
Consequently, the minimum installation height of photovoltaic panels on a sloping roof for each building group is 1000 mm. However, this height should be adjusted depending on the installation height of the solar collectors and the roof surface. The available roof surfaces of the buildings allow stretching of the photovoltaic system along the roof surfaces.
Furthermore, an economic analysis of the investment financing was conducted, which the article extensively covered, delving into its technical aspects. The costs of the system components were compared, and the expenses for energy production in these systems were estimated. Using public aid calculators from the Operational Programme Infrastructure and Environment 2014–2020, an economic evaluation was performed for a hybrid installation comprising elements of both a solar system and a photovoltaic system. The projected payback period for this investment, under the specified conditions, was slightly over eighteen years. It’s worth noting that this duration is shorter than the expected lifespan of the installation in question.

5. Discussion

The design of a hybrid installation with heat storage for a selected urban area represents a significant stride towards sustainable energy development. The study has affirmed the precision of the adopted design assumptions, underscoring the innovative methodologies employed. Primarily, the fine-tuning of summer parameters for heat and electricity production installations has enabled the fulfillment of consumer needs without the unjustified expansion of infrastructure.
It’s notable that existing energy sources were leveraged to offset potential shortages from renewable energy sources (RES) installations, facilitating seamless integration of diverse sources and optimal resource utilization. Furthermore, meticulous selection of roof mounting surfaces ensured coverage of installation requirements, allowing for flexible configurations during installation and efficient space utilization.
The project’s innovation is further demonstrated by the incorporation of designated rooms within buildings, facilitating the accommodation and operation of additional infrastructure such as hot water tanks. This approach maximizes space utilization and ensures the thermal infrastructure operates effectively.
The precise selection of parameters for the summer installation, enabling simultaneous heat and electricity production, is pivotal for overall system efficiency. This minimizes unnecessary infrastructure expansion, leading to cost savings and reduced emissions.
Planned roof mounting surfaces designed to allow flexible configuration during assembly are crucial for ensuring installation flexibility and efficiency. This optimizes space utilization and maximizes system efficiency.
Implementing individual dual-function heating units in each building offers a practical solution, tailoring thermal conditions to residents’ needs. Buildings equipped with energy storage such as domestic hot water (DHW) tanks require accompanying devices to ensure optimal system functionality.
The use of digital controllers in heating systems enables precise control of the solar system, enhancing efficiency and optimal solar energy utilization. Adapting the ANL controller’s operating program is essential for optimizing energy consumption, resulting in cost savings and reduced environmental impact.
Ensuring proper electricity distribution to all buildings within the area is crucial, necessitating thorough verification of individual contracts with the energy operator and modernization of inactive hot water pipelines between buildings. Conducting an economic analysis of the entire project, considering available funds from aid programs and long-term loan options, is essential for assessing investment profitability.
From a business profitability perspective, a critical consideration is the feasibility of investment financing. Existing funds from aid programs offer opportunities for energy suppliers, contingent upon the submission of requisite documentation and program eligibility. Regarding a proposed investment concerning the installation of solar collectors and photovoltaic panels with energy storage, eligible costs may receive up to 60% co-financing. For solar installations, this co-financing takes the form of a non-repayable loan. However, for photovoltaic installations, the loan spans a maximum of 20 years, featuring a zero-margin rate and monthly installments (12 per annum). It’s reasonable to estimate that with co-financing, costs could be recouped within 18 years. The assumed annual energy price escalation stands at 7% (subject to potential fluctuations due to energy price regulations by the Energy Regulatory Office). Given this expenditure and the uncertainties surrounding profits due to energy consumption and price fluctuations, the investment is most viable for building administrators or energy companies. Should the investment proceed as a commercial venture by an external investor, it might necessitate imposing additional financial obligations on tenants.
If the heating equipment owner and project implementer is a heat supplier, the investment may yield economic, ecological, and reputational benefits. However, if undertaken by another entity such as a building manager or external investor, additional challenges such as device ownership rights management and thermal infrastructure operating costs arise. Therefore, a comprehensive analysis of financial, technical, and legal aspects is imperative before investment decision-making to ensure maximum profitability and project effectiveness.
The study conducted based on the technical and economic analysis of solar and photovoltaic installations revealed several strengths and weaknesses.
Strengths of the study:
Technical analysis:
Precise calculations regarding the selection of pumps for solar installations and heat exchangers, considering various factors such as solar collector area, flow rate, and other technical parameters.
Utilization of technical standards and regulations, such as PN-99/B-02414, ensuring installation compliance with required standards.
Selection of equipment (pumps, heat exchangers, expansion tanks) characterized by high reliability and operational efficiency.
Economic analysis:
Detailed analysis of investment costs, considering components of solar and photovoltaic systems as well as energy production costs.
Utilization of public assistance calculators to estimate potential financial benefits and available support funds.
Determination of the payback period for the investment at slightly over eighteen years, which is shorter than the expected service life of the installations, suggesting investment profitability.
Weaknesses of the study:
Discrepancies in obtained results:
There are discrepancies between results obtained using different calculation methods, which may raise doubts about the precision of the analysis.
In some cases, such as Group II buildings, discrepancies reach up to 15%, suggesting the need for additional analysis and improvement of calculation methodologies.
Physical limitations:
The analysis of the height of photovoltaic panel installation on the roof considers physical limitations, such as roof width and the minimum distance required to avoid shading. These limitations may affect the ultimate efficiency of the installation.
Potential omission of external factors:
The study may not account for all external factors, such as changes in energy prices, tax regulations, or energy policy, which may impact the profitability of the investment in the longer term.
In conclusion, the study demonstrates advanced technical and economic analysis of solar and photovoltaic installations(see the Appendix A), but there are certain areas that require additional attention and analysis to ensure a comprehensive and reliable assessment of the investment.

6. Conclusions

The aim of the article was to examine the possibility of combining photovoltaic installations (using vacuum collectors) with media (system heat, electrical energy) supplied to buildings in a hybrid system, utilizing existing technical infrastructure after necessary modifications.
Correctness of project assumptions:
The project of hybrid solar and photovoltaic installations confirms the validity of the adopted project assumptions.
The parameters of summer installations meet the recipients’ needs without the need to expand the infrastructure.
Utilization of available roof areas:
Available roof areas of buildings allow flexible configuration of photovoltaic installations, enabling the use of surplus space for panel mounting.
Investment profitability:
Economic analysis confirms the profitability of the project, assuming an average return period of just over eighteen years.
There is a possibility of utilizing various forms of financing, which may shorten this period.
Legal and ownership issues:
The investment can be economically, ecologically, and reputationally viable for the building manager or energy company, but issues related to equipment ownership law and operating costs may arise for external investors.
Financing:
Various financing options are available for the investment, significantly aiding project implementation.
Operating costs:
The operating costs of photovoltaic installations depend on their size and amount to approximately 3–4% of the net value for photovoltaic installations.
In conclusion, the project of hybrid solar and photovoltaic installations has been confirmed in terms of its profitability and the validity of project assumptions. However, legal, ownership, and additional analyses need to be considered to ensure a comprehensive evaluation of the investment.

Author Contributions

Writing—original draft preparation, A.G., M.R. and M.N.; writing—review and editing, D.R., Y.B., A.Ł., J.M. and S.K. All authors have read and agreed to the published version of the manuscript.

Funding

The authors (Y. Bilan and M. Rabe) express their gratitude to the project titled “Cluster for innovative energy” in the frame of the program “HORIZON-MSCA-2022-SE-01” under the grant agreement number 101129820. The study was co-financed by the Minister of Science under the “Regional Excellence Initiative”.

Data Availability Statement

Data is contained within the article.

Conflicts of Interest

The authors declare no conflicts of interest.

Appendix A

Economic Analysis of Hybrid Plant Financing

A simplified economic analysis of the project’s profitability factored in the costs related to its implementation. The study considered expenses such as the purchase of basic materials, the estimated cost of labor, and earthworks. These values were determined based on the net costs of similar projects. The adopted assumptions facilitated an assessment of the investment’s legitimacy and profitability, as well as the estimated time for the return on invested funds.
Table A1. Breakdown of DHW costs (values of system components for the solar system).
NameQuantity/pcs/mNet Value PLN/pcNet Sum €
Thermica storage tank special design 4.0 m398000.0072,000.00
KSP Vacuum Collector—12U1171960.00229,320.00
Grundfos Alpha 25-60 Series 1802436.00872.00
JAD 6/50 heat exchanger23876.637753.26
Reflex N2502976.761953.52
Reflex N30021220.632441.26
Reflex S1001879.51879.51
Reflex S14011409.511409.51
Magna 32-100 180 Grundfos11332.251332.25
Magna 40-100 F 240 Grundfos14803.304803.30
Replacement of DHW pipelines 1 m/1000 PLN2891000.00289,000.00
Free-standing structure for flat roofs for one vacuum collector KWP/1117320.0037,440.00
Together649,204.61
Table A2. Cost statements of photovoltaic system components.
NameNumber of Pcs/mNet Price PLN/pcs/mNet Total
Q_CELQ. CELLS_Q.PEAK_DUO_BLK-G8_plus_35030568.2917,048.70
BYD B-Box H6.4217,163.604327.20
10 mm2 cable—Helukabel Solarflex-x PV1-F VDE807.92633.60
25 mm2 cable—Helukabel Solarflex-x PV1-F VDE14016.572319.80
YKY 3 × 2.5 cable1062.46260.76
YKY 3 × 4 cable1514.37659.87
YKY 3 × 1.5 cable3351.62542.70
Corab B-01 mounting system (4 modules)8323.292586.32
Fronius Symo Hybrid 5.0-3-S18998.108998.10
Fronius Symo Hybrid 4.0-3-S18212.238212.23
Together75,589.28
In Polish conditions, effective heat production occurs during the months of April to September, totaling approximately 7 h per day. Heat production may also occur during other times, depending on weather conditions, but these values were not considered for the purposes of the study.
Table A3. Summary of estimated annual heat production for DHW.
Summer Data
Energy (kWh)/hEnergy (kWh) × 7 hEnergy (kWh) × 183 DaysEnergy (kWh)/278 = (GJ)
Group I128.61900.27164,749.40592.6238
Group II135.62949.34173,729.20624.9253
Together338,478.601217.5490
The price of 1 GJ of heat is determined by the tariff approved for the energy company by the President of the Energy Regulatory Office. In this analyzed case, it is the DO/W/2 tariff. A four-year tariff was utilized to ascertain the annual price increment per 1 GJ. Costs related to maintaining the connection, ordered power, transmission, and the energy carrier were not factored into consideration.
Table A4. Determination of the annual increment in the energy rate [GJ].
Tariff DO/W/2GJ/PLNAnnual Tariff Increase [PLN]Annual Percentage Increase in GJ Value
202035.494.3814%
201931.110.171%
201830.940
201730.94
Average annual increase in GJ value2.287%
Given an annual increase in the GJ value at a rate of 7%, we can estimate the reduction in the costs of heat production for DHW needs through the utilization of solar collector installations over a 25-year operational period.
Table A5. Comparison of the value of heat production in a solar system with the value of heat taken from MSC over 25 years with a 7% price increase.
Heat SourceGJ HeatGJ Value 202020202045Energy Value (GJ)/PLN
MSC8216.7235.49291,611.391,582,701.1920,026,841.17
K.Sol.1217.5535.4943,210.81104,131.361,801,507.70
Value of purchased energy over a period of 25 years PLN/GJ18,225,333.48
The estimated annual production of electricity in the photovoltaic system was adopted for the simplified economic analysis on the basis of the calculations performed.
Table A6. Comparison of the amount of annual energy produced in the photovoltaic system and the amount actually taken from the power grid.
Photovoltaic SystemEnergy Taken from the Power Grid
Energy (kWh)Daily Consumption (kWh)Annual Energy Consumption (kWh)
Group I4151.3412.154434.75
Group II5428.6815.805767.00
Amount9580.02 10,201.75
The expected service life of the photovoltaic system is 25 years. Due to the fact that the power connection has been left in operation, the cost of ordered, variable power and transmission is not included in the statement of the value of energy produced and consumed.
Table A7. Summary of electricity values over a 25-year period with a 7% increase in electricity prices.
Source of EnergyHeat kWhValue kWh/PLN 202020202045Total Energy Value (kWh)/PLN after 25 Years
Power Grid10,201.750.55565668.096064.8619,740,897.87
Photovoltaic Installation9580.020.55565322.6612,826.78221,907.68
Value of purchased energy over a period of 25 years PLN/kWh19,518,990.20
The estimated percentage cost of installation works for photovoltaic installations, comprising assembly (10%) and electrical connections (10%), amounts to 20% of the device value, based on data from the OZE Synthesis portal (RES, 2020, accessed on 24 June 2020). With the estimated net value of the equipment at PLN 75,589.28, the assembly works would cost PLN 15,117.86 net. In the realm of solar installations, the value of installation works was determined based on an estimated offer found on the website (Renovation, accessed on 24 June 2020). With a quantity of 117 collectors, the works were estimated at PLN 58,500 net.
The implementation of investments in renewable energy sources (RESs) is supported by various mechanisms aimed at prosumers and energy suppliers, implemented at local, national, and European levels. Within the scope of the ongoing project, it is possible to apply for non-refundable subsidies from the Regional Operational Programme, overseen by the Marshal of the Voivodeship, or from the Cohesion Fund, depending on the capacity of the heating and return installation for the electrical system. These programs adhere to similar guidelines and are repeated periodically under comparable conditions. When availing of the subsidy, energy sources must be categorized into heat and electricity (Environment, accessed on 24 June 2020). To calculate the subsidy value, available eligible-cost calculators can be utilized after submitting the required documentation.
Table A8. State aid calculator for measure 1.1.1 of the Operational Programme Infrastructure and Environment 2014–2020—Competition V Heat.
L.p.SpecificationAmount
1Costs eligible for aid for renewable energy sources *649,204.61
1.1Preparation of the investment project
1.2Management of the investment process, including supervision of construction works
1.3Acquisition of rights related to real estate
1.4Construction works including materials, connection fees, and commissioning649,204.61
1.5Equipment
1.6Intangible assets
1.7Other fees and charges directly related to the implementation of the investment project
1.8Reserve **
2Costs not eligible for aid for renewable energy sources0.00
2.1Staff training
2.2Information and promotion
2.3Costs incurred prior to the submission of the application
2.4....................
2.5....................
2.6....................
3Total investment costs649,204.61
Location of the investmentWest Pomeranian Voivodeship
Size of the businessLarge
Maximum aid intensity60%
Type of investmentPlant construction
Type of installation (technology)Solar
Heat output [MW]0.26
Average annual heat production [GJ/yr]1217.55
Cost of reference investment [PLN]159,498.92
Difference between the eligible cost of RES installations and the cost of the reference investment [PLN]489,705.69
Other state aid for the project (EDB) [PLN]
Maximum subsidy [PLN]293,823.41
Requested subsidy [PLN]
Table A9. Calculator of state aid for measure 1.1.1 of the Operational Programme Infrastructure and Environment 2014–2020—Competition V electricity from photovoltaic installations.
L.p.SpecificationAmount
1Costs eligible for aid for renewable energy sources *90,707.00
1.1Preparation of an investment project (excluding concepts, analyses, feasibility studies, etc.)
1.2Management of the investment process, including supervision of construction works
1.3Acquisition of rights related to real estate
1.4Construction work including materials, connection fees, and commissioning90,707.00
1.5Equipment
1.6Intangible assets
1.7Other fees and charges directly related to the implementation of the investment project
1.8Reserve **
2Costs not eligible for aid for renewable energy sources0
2.1Concepts, analyses, feasibility studies, etc.
2.2Staff training
2.3Information and promotion
2.4....................
2.5....................
2.6....................
3Total investment costs90,707.00
4Reference investment cost799.00
5Eligible cost (costs eligible for aid for renewable energy sources minus the cost of the reference investment)89,908.00
Location of the investmentWest Pomeranian Voivodeship
Size of the businessLarge
Maximum aid intensity60%
Type of investmentPlant construction
Type of installation (technology)Photovoltaic power plant
Electric power [MW]0.01
Average annual net electricity production [MWh/y]1
Cost of reference investment [PLN]799
AmountEDBAmount as % of qualifying costs.
EU funding85,000.008184.1893.71%
Return aid85,000.008184.1893.71%
Investment premium 0.000.00%
Other help
Total aid85,000.008184.18
Total aid intensities9.10%
Maximum aid intensity60.00%
As of the end of June 2020, the loan interest rate data were as follows: base rate 1.35%, discount rate 2.35%, with a satisfactory rating. The margin was set at 1.00%, the reference rate at 2.35%, and the interest rate for repayable aid at 0%.
The operational costs of photovoltaic systems vary depending on the size of the installation (Solaris, accessed on 25 June 2020). According to the Solaris portal, for a 10.50 kW photovoltaic installation, the operational costs range from 3–4%. For the economic analysis, 4% of the net value for a photovoltaic and solar installation over a 25-year operational period, i.e., PLN 31,936.47, was assumed.
As of the end of June 2020, the following loan interest rate data were applicable: the base rate was 1.35%, the discount rate was 2.35%, and the margin was set at 1.00%. The reference rate stood at 2.35%, and the interest rate for repayable aid was 0%, all with a satisfactory rating.
The operational costs of photovoltaic systems vary depending on the size of the installation. According to the Solaris portal (accessed on 25 June 2020), for a 10.50 kW photovoltaic installation, the operational costs range from 3–4%. For the economic analysis, 4% of the net value of a photovoltaic and solar installation over a 25-year operational period, i.e., PLN 31,936.47, was assumed.
Table A10. Economic calculation for photovoltaic and solar installations.
Installation Type:PhotovoltaicSolar
Purchase cost of equipmentzł75,589.28zł649,204.61
Equipment installation costzł15,117.86zł58,500
Capital expenditure on renewable energy sources—CNIzł798,411.00
Revenue—Pazł5322.66zł43,210.81
First-year revenue—Pazł48,533.47
Revenue over 25 years of operation with an estimated 7% annual increase in energyzł2,023,415.38
Financing of investments
EquityPLN355,381.20 + PLN5707.00 = PLN361,088.20
Subsidyzł293,823.41
Creditzł85,000.00
Monthly loan installment for a repayment period of 20 years85,000/(12∙20) = $354.17
Annual repayment of the loan principalzł4250.04
Annual interest rate on loans7.05%
Monthly interest on the loanzł497.29
Annual loan repayment (principal + interest)zł10,217.52
Monthly service costzł106.4549
Operating cost for a 25-year investmentzł31,936.47
Annual operating costszł1277.4588
Straight-line depreciation for a 25-year service life at a rate of 4%zł31,936.44
Income statement
Operating profit48,533.47 − 12,77.4588 − 31,936.44 = PLN 15,319.57
Gross profitPLN15,319.57 − PLN497.29 = PLN14,822.28
Net profit (with 19% tax)zł12,006.05
Cumulative net profit over 25 years of operation25∙12,006.05 PLN = 300,151.25 PLN
Cash48,533.47 − 10,217.52 − 4250.04 − 497.29 −
1277.4588 − 2816.23 = PLN 29,474.93
Assessment of the economic viability of the investment
Discount rate2.35%
Net present value NPV25∙(29,474.93∙1/(1 + 2.35)) = $219,588
Payback time798,411/25∙(31,936.44 + 12,006.05) = 18.169 years
The payback time according to the above calculations is more than eighteen years and is lower than the expected service life of the installation.

References

  1. Bućko, P. Local Balancing in the Power System. Rynek Energii 2023, 6, 3–7. [Google Scholar]
  2. Svazas, M.; Navickas, V.; Paskevicius, R.; Bilan, Y.; Vasa, L. Renewable energy versus energy security: The impact of innovation on the economy. Rynek Energii 2023, 1, 60–71. [Google Scholar]
  3. Fan, W.; Kokogiannakis, G.; Ma, Z. A multi-objective design optimisation strategy for hybrid photovoltaic thermal collector (PVT)-solar air heater (SAH) systems with fins. Sol. Energy 2018, 163, 315–328. [Google Scholar] [CrossRef]
  4. Dupeyrat, P.; Ménézo, C.; Rommel, M.; Henning, H.M. Efficient single glazed flat plate photovoltaic-thermal hybrid collector for domestic hot water system. Sol. Energy 2011, 85, 1457–1468. [Google Scholar] [CrossRef]
  5. Gan, G. Effect of air gap on the performance of building-integrated photovoltaics. Energy 2009, 34, 913–921. [Google Scholar] [CrossRef]
  6. Kumar, A.; Baredar, P.; Qureshi, U. Historical and recent development of photovoltaic thermal (PVT) technologies. Renew. Sustain. Energy Rev. 2015, 42, 1428–1436. [Google Scholar] [CrossRef]
  7. Sharma, M.K. Alternative designs and technological advancements of phase change material integrated photovoltaics: A state-of-the-art review. J. Energy Storage 2022, 48, 104020. [Google Scholar] [CrossRef]
  8. Lyeonov, S.; Toušek, Z.; Bozhenko, V.; Kérmárki-Gally, S.E. The impact of corruption in climate finance on achieving net zero emissions. J. Int. Stud. 2023, 16, 142–159. [Google Scholar] [CrossRef]
  9. Hu, G.; Wang, K.; Peng, Y.; Qiu, M.; Shi, J.; Liu, L. Deep Learning Methods for Underwater Target Feature Extraction and Recognition. Comput. Intell. Neurosci. 2018, 2018, 1–10. [Google Scholar] [CrossRef]
  10. Alshalali, T.; Josyula, D. Fine-Tuning of Pre-Trained Deep Learning Models with Extreme Learning Machine. In Proceedings of the 2018 International Conference on Computational Science and Computational Intelligence (CSCI), Las Vegas, NV, USA, 12–14 December 2018; pp. 469–473. [Google Scholar] [CrossRef]
  11. Štreimikienė, D.; Mikalauskienė, A.; Macijauskaitė-Daunaravičienė, U. Role of information management in implementing the Green Deal in the EU and the US. J. Int. Stud. 2022, 15, 9–27. [Google Scholar] [CrossRef]
  12. Sang, N. Mapping the evolution of green finance through bibliometric analysis. Environ. Econ. 2024, 15, 1–15. [Google Scholar] [CrossRef]
  13. Valdenegro, M. Object recognition in forward-looking sonar images with Convolutional Neural Networks. In Proceedings of the OCEANS 2016 MTS/IEEE Monterey, Monterey, CA, USA, 19–23 September 2016; pp. 1–6. [Google Scholar] [CrossRef]
  14. Touil, A.; Ayad, K.; Hamidi, N.; Babounia, A. Toward greener supply chains: Analysis of the determining factors. Environ. Econ. 2023, 14, 114–126. [Google Scholar] [CrossRef]
  15. Alfarizi, M.; Samputra, P.; Arista, N. Role of entrepreneur’s perspective of waste management for coffee shop sustainability. Probl. Perspect. Manag. 2023, 21, 502–515. [Google Scholar] [CrossRef]
  16. Ginevičius, R. Assessment of the impact of air pollution on population mortality in EU countries. Econ. Sociol. 2022, 15, 219–230. [Google Scholar] [CrossRef]
  17. Ali, I.; Naushad, M. Insights on electric vehicle adoption: Does attitude play a mediating role? Innov. Mark. 2022, 18, 104–116. [Google Scholar] [CrossRef]
  18. Pilch, T. Zasady Badań Pedagogicznych; Ossolineum: Wrocław, Poland, 1977; pp. 42–56. [Google Scholar]
  19. Pang, W.; Zhang, Q.; Cui, Y.; Zhang, L.; Yu, H.; Zhang, X.; Zhang, Y.; Yan, H. Numerical simulation and experimental validation of a photovoltaic/thermal system based on a roll-bond aluminum collector. Energy 2019, 187, 115990. [Google Scholar] [CrossRef]
  20. Valizadeh, M.; Sarhaddi, F.; Adeli, M. Exergy performance assessment of a linear parabolic trough photovoltaic thermal collector. Renew. Energy 2019, 138, 1028–1041. [Google Scholar] [CrossRef]
  21. Mojiri, A.; Stanley, C.; Rodriguez-sanchez, D.; Everett, V.; Blakers, A.; Rosengarten, G. A spectral-splitting PV—Thermal volumetric solar receiver. Appl. Energy 2016, 169, 63–71. [Google Scholar] [CrossRef]
  22. Karami, N.; Rahimi, M. Heat transfer enhancement in a PV cell using Boehmite nanofluid. Energy Convers. Manag. 2014, 86, 275–285. [Google Scholar] [CrossRef]
  23. Diwania, S. Photovoltaic-thermal (PVT) technology: A comprehensive review on applications and its advancement. Int. J. Energy Environ. Eng. 2020, 11, 33–54. [Google Scholar] [CrossRef]
  24. Aste, N.; del Pero, C.; Leonforte, F. Water flat plate PV-thermal collectors: A review. Sol. Energy 2014, 102, 98–115. [Google Scholar] [CrossRef]
  25. Skoplaki, E.; Palyvos, J.A. On the temperature dependence of photovoltaic module electrical performance: A review of efficiency/power correlations. Sol. Energy 2009, 83, 614–624. [Google Scholar] [CrossRef]
  26. Tahmasbi, M.; Siavashi, M.; Norouzi, A.M.; Doranehgard, M.H. Thermal and electrical efficiencies enhancement of a solar photovoltaic-thermal/air system (PVT/air) using metal foams. J. Taiwan Inst. Chem. Eng. 2021, 124, 276–289. [Google Scholar] [CrossRef]
  27. Herez, A.; El Hage, H.; Lemenand, T.; Ramadan, M.; Khaled, M. Review on photovoltaic/thermal hybrid solar collectors: Classifications, applications and new systems. Sol. Energy 2020, 207, 1321–1347. [Google Scholar] [CrossRef]
  28. Štreimikienė, D. Externalities of power generation in Visegrad countries and their integration through support of renewables. Econ. Sociol. 2021, 14, 89–102. [Google Scholar] [CrossRef]
  29. Streimikiene, D. Renewable energy technologies in households: Challenges and low carbon energy transition justice. Econ. Sociol. 2022, 15, 108–120. [Google Scholar] [CrossRef]
  30. Bublyk, Y.; Borzenko, O.; Hlazova, A. Cryptocurrency energy consumption: Analysis, global trends and interaction. Environ. Econ. 2023, 14, 49–59. [Google Scholar] [CrossRef]
  31. Mukhtarov, S.; Aliyev, J.; Borowski, P.F.; Disli, M. Institutional quality and renewable energy transition: Empirical evidence from Poland. J. Int. Stud. 2023, 16, 208–218. [Google Scholar] [CrossRef]
  32. Alam, A.; Ratnasari, R.T.; Jannah, I.L.; Ashfahany, A.E. Development and evaluation of Islamic green financing: A systematic review of green sukuk. Environ. Econ. 2023, 14, 61–72. [Google Scholar] [CrossRef]
  33. Versal, N.; Sholoiko, A. Green bonds of supranational financial institutions: On the road to sustainable development. Investig. Manag. Financ. Innov. 2022, 19, 91–105. [Google Scholar] [CrossRef]
  34. IEA. Tracking Clean Energy Progress 2023; IEA: Paris, France, 2023; Available online: https://www.iea.org/reports/tracking-clean-energy-progress-2023 (accessed on 1 April 2024).
  35. Bhattarai, U.; Lopatka, A.; Devkota, N.; Paudel, U.R.; Németh, P. Influence of green human resource management on employees’ behavior through mediation of environmental knowledge of managers. J. Int. Stud. 2023, 16, 56–77. [Google Scholar] [CrossRef]
  36. Boros, A.; Lentner, C.; Nagy, V.; Tőzsér, D. Perspectives by green financial instruments—A case study in the Hungarian banking sector during COVID-19. Banks Bank Syst. 2023, 18, 116–126. [Google Scholar] [CrossRef]
  37. Rad, F.M.; Fung, A.S. Solar community heating and cooling system with borehole thermal energy storage—Review of systems. Renew. Sustain. Energy Rev. 2016, 60, 1550–1561. [Google Scholar] [CrossRef]
  38. Ciampi, G.; Ciervo, A.; Rosato, A.; Sibilio, S.; Di Nardo, A. Parametric simulation analysis of a centralized solar heating system with long-term thermal energy storage serving a district of residential and school buildings in Italy. Adv. Model. Anal. A 2018, 55, 165–172. [Google Scholar] [CrossRef]
  39. Makarenko, I.; Bilan, Y.; Streimikiene, D.; Rybina, L. Investments support for Sustainable Development Goal 7: Research gaps in the context of post-COVID-19 recovery. Investig. Manag. Financ. Innov. 2023, 20, 151–173. [Google Scholar] [CrossRef]
  40. Rosato, A.; Ciervo, A.; Guarino, F.; Ciampi Gi Scorpio, M.; Sibilio, S. Dynamic simulation of a solar heating and cooling system including a seasonal storage serving a small Italian residential district. Therm. Sci. 2020, 24, 3555–3568. [Google Scholar] [CrossRef]
  41. Heating and District Heating-Protection of Water Heating Installations in a Closed System with Diaphragm Expansion Vessels-Requirements, SBD, Construction and Building Structures Sector, PN-99/B-02414, 28/01/1999. Available online: https://bip.malopolska.pl/pobierz/996002.html (accessed on 23 March 2024).
Figure 1. Aerial view of the residential complex designated for hybrid system integration. Source: Author’s own elaboration based on Geoportal.
Energies 17 02264 g001
Figure 2. Roof of the building Object 1. Source: Author’s own elaboration based on Google Maps.
Energies 17 02264 g002
Figure 3. Roof of the building object 7. Source: Author’s own elaboration based on Google Maps.
Energies 17 02264 g003
Table 1. Daily Electricity Consumption for Group I and Group II Buildings.
Group I
Object NameObject 1Object 2Object 3Object 4Amount
average daily consumption [kWh]2.392.513.963.2912.15
Group II
Object NameObject 5Object 6Object 7Object 8Amount
average daily consumption [kWh]6.772.621.644.7715.8
Table 2. Summary of coefficients Z 1 , Z 2 , Z 3 for each month of the year.
MonthAndIIIIIIVVVIVIIVIIIIXXXIXII
Z1[h/day]0.651.212.263.434.454.874.584.002.931.680.870.48
Z2
by module orientation
45° S1.571.501.191.050.940.900.911.001.181.371.611.55
45° E-S/W-S1.481.421.160.950.950.910.921.001.161.311.511.46
Z3Related to the temperature of the module1.001.000.980.960.930.900.880.880.900.940.970.99
Table 3. Module power P P V [kW] for groups of objects from Table 1 and summer and winter periods.
PeriodGroup IGroup II
summerPPV = 4.542   12.15 4 · 1 · 0.88 · 0.76 PPV = 5.906   15.80 4 · 1 · 0.88 · 0.76
winterPPV = 21.696   12.15 0.48 · 1.55 · 0.99 · 0.76 PPV = 28.214   15.80 0.48 · 1.55 · 0.99 · 0.76
Table 4. Summary of the areas of PV modules needed to generate power [1 kWp].
Module TypeArea [1 kWp/m2]
Monocrystalline silicon modules7–9
Polycrystalline silicon modules8–11
CIS thin-film modules11–13
CdTe thin-film modules14–18
Amorphous silicon thin-film modules16–20
Table 5. Capacity of batteries C [Ah] for groups of objects from Table 1 and periods: summer and winter and proposal for their selection.
Group IGroup II
W [Wh]4542 Wh5906 Wh
U [V]12 V12 V
F in summer2.5
F in winter4.0
assumed capacity of batteries C [Ah]C = 2 · 4542 · 2.5 12 = 1892.5C = 2460.83 = 2 · 5906 · 2.5 12
C = 2 · 4542 · 4 12 = 3028C = 3937.33 = 2 · 5906 · 4 12
Selected battery packBYD B-Box H6.4.BYD B-Box H6.4.
Table 9. Allowable voltage drops on the side of AC conductors.
Group IGroup II
Object 1Object 2Object 3Object 4Object 5Object 6Object 7Object 8
L [m]114.0078.0025.0010.00151.0098.0010.00106.00
P [W]10010516513728210968199
S [mm2]1.51.51.51.541.51.52.5
ΔU%0.510.370.190.060.720.480.030.57
Table 13. Selection of collector surfaces according to the coefficient for individual groups.
Group Iamount
Object NameObject 1Object 2Object 3Object 4
average DHW consumption over three years [m3]1021.331387.671286.671906
average annual population (2017/2018/2019)7187100120
collector area selection coefficient [m2]0.50.50.50.5
collector area [m2]35.543.550.060.0189
Group IIamount
Object NameObject 5Object 6Object 7Object 8
average DHW consumption over three years [m3]1617.3311602195.671656
average annual population (2017/2018/2019)119102138115
collector area selection coefficient [m2]0.50.50.50.5
collector area [m2]59.551.069.057.5237
Table 15. Collector counts, sections, and collector area for objects in Table 1.
FieldDimensions of the Fields on the RoofAvailable Surface Lengths of Individual Roof Bays (*)Number of Collectors (**)
object 1 for group I
1; 3; 54 m∙5 m4 m3 pcs of 4 pcs. = 12 pcs.
2; 4; 64 m∙7.5 m6.5 m3∙6 pcs. = 18 pcs.
74.25 m∙15 m14 m2∙6 pcs. = 12 pcs.
84.25 m∙15 m14 m2∙6 pcs. = 12 pcs.
object 7 for group II
1; 4; 74 m∙5 m4 m3 pcs of 4 pcs. = 12 pcs.
2; 5; 84 m∙12.3 m11.3 m3 of 11 pcs. = 33 pcs.
34 m∙3.15 m2.65 m (not used)
64 m∙5.8 m4.8 m4 pcs.
94 m∙7.2 m6.2 m6 pcs.
103.5∙13.5 m12.5 m10 pcs.
(*) after subtracting approximately 0.5 m on each side; (**) the length of the adopted KSP-12U collector is 1.06 m.
Table 16. Selection of the bunker by consumption and coefficient [m3].
Object NameAverage DHW ConsumptionSecuring 70% of the Daily Demand for Hot Water [m3]Average Number of Inhabitants for Three Consecutive YearsFactor 0.05 [m3] per Capita
Monthly
of 3 Years [m3]
Daily [m3/30 Days]
Group I
Object 11021.3334.0423.83713.55
Object 21387.6746.2632.38874.35
Object 31286.6742.8930.021005.00
Object 41906.0063.5344.471206.00
Amount186.72130.7137818.90
Group II
Object 51617.3353.9137.741195.95
Object 61160.0038.6727.071206.00
Object 72195.6773.1951.231386.90
Object 81656.0055.2038.641155.75
Amount220.97154.6849224.60
Table 20. Calculation of heat exchanger power for individual groups:.
Group IGroup II
P 128.61 kW135.62 kW
P W 45.01 kW47.47 kW
Table 21. Calculations for the selection of a pump for a solar system.
Group IGroup II
F k   189 m2237 m2
Coefficient(0.6 ÷ 1.2)0.9
m ˙ [ L / m i n · m 2 ] 170.1213.3
m ˙ [ m 3 / h · m 2 ] 10.20612.798
Table 22. Calculation of the DHW charge pump.
Group IGroup II
J A D 6 / 50   F W   5.7 m2
Coefficient(0.6 ÷ 1.2)0.9
m ˙ [ L / m i n · m 2 ] 5.13
m ˙ [ m 3 / h · m 2 ] 3.078
Disclaimer/Publisher’s Note: The statements, opinions and data contained in all publications are solely those of the individual author(s) and contributor(s) and not of MDPI and/or the editor(s). MDPI and/or the editor(s) disclaim responsibility for any injury to people or property resulting from any ideas, methods, instructions or products referred to in the content.

