
Structure-Circuit Resistor Integrated Design Optimization of Piezoelectric Energy Harvester Considering Stress Constraints

Department of Automotive Engineering, Hanyang University, Seoul 04763, Republic of Korea
*
Author to whom correspondence should be addressed.
Energies 2023, 16(9), 3766; https://doi.org/10.3390/en16093766
Submission received: 3 April 2023
/
Revised: 21 April 2023
/
Accepted: 26 April 2023
/
Published: 27 April 2023
(This article belongs to the Special Issue The New Techniques for Piezoelectric Energy Harvesting: Design, Optimization, Applications, and Analysis)
Abstract
:A piezoelectric energy harvester (PEH) transduces mechanical energy into electrical energy, which can be utilized as an energy source for self-powered or low-power devices. Therefore, maximizing the power of a PEH is a crucial design objective. It is well known that structural designs are firstly conducted for controlling resonance characteristics, and then circuit designs are pursued through impedance matching for improving power. However, a PEH contains solid mechanics, electrostatics, and even a circuit-coupled multi-physics system. Therefore, this research aims to design a PEH considering a circuit-coupled multi-physics. As a design process, a conceptual design is developed by topology optimization, and a detailed design is developed sequentially by applying size optimization as a post-processing step to refine the conceptual design results for manufacturable design. In the two optimization processes, design optimizations of a structure coupled with circuit resistor are performed to maximize the power, where the electrical and mechanical interactions between PZT, substrate, and circuit resistor are simultaneously considered. Additionally, stress constraints are also added for structural safety to ensure operational life of PEH. As a result of the proposed design methodology, a manufacturable design of PEH having maximum power and operational life is obtained with power density of .
1. Introduction
Energy harvesting provides useful renewable energy from unused or wasted sources. Currently, various types of energy sources that are subject to energy harvesting are being studied, such as mechanical [1,2], thermal [3], solar [4], and wind energy [5]. Based on several studies, the amount of energy obtained from energy harvesting is less than the Watt level, but its usability has been studied as an energy management solution, such as low-power devices or self-powered devices for the implementation of Internet of things [6].
Among the various energy sources, mechanical energy, specifically vibration, is the most popular because of its prevalence, easy access, and high-power density. Mechanical energy is converted into electrical energy via a piezoelectric material, the mechanism of which transforms mechanical behavior into an electrical response [7]. In this study, lead zirconate titanate (PZT) is used as a piezoelectric material. Recently, since environmental concerns have emerged due to the toxicity of PZT’s lead, lead-free materials such as (KNN) are being studied [8]. However, the purpose of this study is to propose a design methodology for piezoelectric energy harvesters (PEHs). Therefore, PZT is used as a representative material because it is a widely used and well-established material. Note that the proposed design methodology is applicable not only to PZT but also to lead-free materials.
For PEHs, increasing the harvesting power to act as an alternative energy source is a major concern. To accomplish this, there have been various design approaches for the configuration of cantilever-type PEHs, which is a typical PEH structure. Accordingly, a cantilever shape geometry has been studied as one of the design approaches. Parametric studies have been conducted on trapezoidal or quadratic shapes [9,10], or zigzag shapes have also been studied [11,12,13]. However, the application of these approaches has limitations such as designing with the designer’s intuition or the structures of combination of specific configurations.
Recently, a topology optimization method that distributes materials effectively in a given design domain by removing materials from unfavorable zones has been widely used to improve performances. Using this method, a new configuration that is not generally imaginable and intuition-independent in design can be obtained. Furthermore, topology optimization enables efficient design that can obtain further improved performance results while using less material compared to general cantilever beams. To take the advantage of topology optimization, several studies have been conducted: topology optimization of substrate structures for maximizing the voltage [14] of piezoelectric materials for maximizing electrical energy regarding input mechanical force [15], and of both for maximizing power density [16]. These studies focus on inducing resonance for a specific frequency through the configuration design of PEH and optimizing the electrical output at that time.
In addition to increasing the electrical power through the configuration design, the electric circuit plays an important role in the performance of PEH. If the resistor value of the circuit connected to the PEH changes, the power output varies even at the same PEH [17]. In addition to power, resonance frequencies may change as the resistor values change [18]. Therefore, impedance matching plays a major role in electrical performance analysis. However, independent impedance matching after configuration design reduces the overall design freedom because the design steps are separated, which may limit the performance improvement of PEH. So, the PEH design has also been extended to the topology optimization, coupled with an electric circuit, including circuit elements, such as resistors, inductors, and capacitors to incorporate impedance matching into the structural design optimization process [19]. Furthermore, topology optimization of PZT materials, coupled with an electric circuit, has also been conducted with stress constraints to ensure operational life of PEH [20]. Excessive stress damages the PEH, which leads to the degradation of performance. Therefore, the stress level is associated with the lifetime of PEH, and by considering this, the operational life of PEH can be designed. According to the results of those studies, although the power output is reduced, optimal PZT configuration is obtained with preventing maximum stress from exceeding the yield stress. Additionally, the optimal PZT configuration changed compared to when there were no stress constraints.
In this research, PEH design methodology is proposed for maximizing power generation by considering the operating conditions of the magneto-mechanical PEH applied to the AC power-line cable [21]. PEH, which uses the magnetic field of AC power as an energy source, is excited at a constant frequency of AC power. To protect from external contamination during operation, PEH is installed inside the case. At this time, the space allowed for PEH is limited, and a specific geometrical size is enforced. In addition, it is necessary to prevent the failure of the PEH by preventing structural damage to the PEH during operation. Therefore, in addition to previous work, this research deals with topology optimization of PEH considering both stress constraints and multi-physics including PZT materials, substrates and circuits elements. If both PZT materials and substrate structure are designed simultaneously, PEH can be designed to resonate well at an operating frequency by the optimized substrate structure, and at the same time, the configuration of PZT materials corresponding to the best performance of the structure can be also achieved. Moreover, optimization including a circuit resistor means that it is possible to achieve better performance considering the feedback of electrical and mechanical properties of PZT, and stress constraints can provide operational life of PEH design at the real operating condition.
Meanwhile, as a topology optimization methodology of PEH, a density-based topology optimization is commonly used. This design method determines the presence or absence of material in the design domain by using the density of each element in the finite element model as design variables. However, the results of density-based topology optimization have element-wise discrete outline and may not provide a completely empty or solid element result. This makes it difficult to manufacture PEHs with continuous outlines in the optimal topology design. Therefore, post-processing for the optimal topology design is required [22], which can provide a manufacturable design.
Accordingly, in order to solve the density-based topology optimization problem, the overall design process is organized into two stages: conceptual design and detailed design, which are performed sequentially [23]. First, at the conceptual design stage, topology optimization is applied to the initial basic model to distribute and empty material in a specified design space. As a result of the topology optimization, an unusual conceptual configuration satisfying the design conditions while improving the performance of the PEH is obtained. Then, the detailed design stage proceeds as a method to post-process for manufacturability that can be cast or machined. In the detailed design, additional size optimization is performed on the simplified parametric PEH model which is a refined model of the topology optimization result, because the refined parametric model cannot fully reflect the topology optimization result. The overall design process proceeds in two stages, but the optimization of each stage considers both multi-physics and stress constraints.
The contributions of this research can be summarized as follows:
- To develop a reliable simulation model, model calibration is performed by comparing the initial configuration of the target PEH with the experiment.
- Topology optimization of PEH considering multi-physics is performed in order to obtain an intuition-independent conceptual design for maximum power generation in a given design area.
- In order to confirm the effect of the multi-physics effect of the piezoelectric material, substrate, and resistor on the result of the optimal design, case study is conducted while expanding the design domain: only PZT case, PZT and substrate case, and PZT, substrate and resistor case.
- Model simplification and size optimization are performed as a post-processing to obtain manufacturable design for the optimal topology optimization result.
- The optimal design obtained by the two-stage design process of topology optimization and size optimization considering stress constraints and multi-physics is compared with the recently performed design methods, and the excellence of the proposed method is confirmed.
The sections of this paper are organized as follows. In Section 2, a PEH simulation model is developed, and model calibration is performed through experiments to build an accurate simulation model. After that, the multi-physics properties of PEH and the effect of resistors on the electrical and mechanical properties of PEH are examined. In Section 3, conceptual design using topology optimization is performed, and PEH performance and design changes are analyzed simultaneously according to the degree of design freedom through expansion of the design domain and the presence or absence of a resistor variable. Subsequently, in Section 4, as a post-processing method, model simplification and refinement based on the topology optimization result of Section 3 is performed, and the final optimal design is achieved by performing size optimization. Finally, Section 5 summarizes this study.
2. PEH Modeling Considering Multi-Physics
2.1. Piezoelectric Effect of Piezoelectric Energy Harvester
Energy harvesters with piezoelectric materials are widely used to generate electrical energy from mechanical energy. Any form of energy around the harvester, such as vibration, impact, and wind, can induce the mechanical behavior (i.e., stress or strain) of the harvester, thereby generating electricity via the piezoelectric effect of the piezoelectric material.
PEH generates electricity through the piezoelectric effect, which is a fundamental characteristic of piezoelectric materials that transduce mechanical energy into electrical energy. As the piezoelectric material serves as a transducer, the piezoelectric effect is an electromechanical coupling multi-physics system. The governing equations representing the electromechanical coupled piezoelectric effect with the stress-charge matrix form are as follows [24]:
where , and represent the mechanical strain, electric field vectors, and piezoelectric coupling coefficient matrix. and are the mechanical stress vector and elastic stiffness coefficient matrix, respectively, under the constant electric field conditions in Equation (1). and are the electric displacement vector and dielectric coefficient matrix, respectively, under the constant strain conditions in Equation (2). In particular, most matrix elements of the governing equations for piezoelectric ceramic materials, such as PZT, are zero, and its detailed equations can be represented as follows:
2.2. PEH Simulation Model
In order to apply the design optimization methodology of this study, the evaluation of PEH performance using finite element simulation analysis or other methods is essential. Moreover, to secure the reliable simulation model, the analysis model is calibrated based on the experimental results so that the analysis model can accurately represent the true results.
Figure 1a presents the schematic illustration of the cantilever PEH model where the analysis and design are applied in this research. PEH is composed of substrate steel plate, a single-layered PZT-5H ceramic, and tip magnet. One side of of the cantilever beam is clamped (fixed end), and overhang length is . The opposite side is free end with the tip magnet. This system is connected with simple circuit with resistor and excited at a frequency of with acceleration. Figure 1b presents an FEM mesh model of Figure 1a constructed in COMSOL Multiphysics 5.4. The overhang plate area is modeled as square single-layer hexahedron mesh considering topology optimization, and the remaining area is modeled as tetrahedral with coarse mesh option. Mechanical damping is set as 0.0217 of isotropic loss factor.
In order to secure the reliability of the simulation model of Figure 1b, the simulation model is calibrated through experimental results. Figure 2a presents experimental setups for PEH with base excitation. Shaker (2007E, The Modal Shop, Cincinnati, OH, USA) was connected to the power amplifier (Servo 200, Samson Technologies, Hicksville, NY, USA) and function generator (9205C, Protek, Gwangmyeong, GG, Korea). The displacement of base excited by the shaker was measured with laser displacement sensor (LTS-120-20, MTI Instruments, Albany, NY, USA), and the output of PEH was measured with oscilloscope (TDS 3034B, Tektronix, Beaverton, OG, USA). Figure 2b presents COMSOL model with clamping zig. In the experimental setup, the PEH was clamped to a zig, and the zig was vibrated by a shaker. Therefore, in order to accurately simulate the experimental situation for calibration, an additional clamping zig modeling was performed. Geometry of clamping zig is and there is a diameter hole away from the opposite side where the PEH is clamped. Clamping zig is also modeled as tetrahedral with coarse mesh option and mechanical damping is assumed as 0.0217 of isotropic loss factor.
The experiment for five sets of PEH was conducted to measure the first resonance frequency and RMS voltage at the resonance frequency when the base excited at . The resistor used in the experiment was . Simulation analysis was conducted through frequency domain analysis under the same conditions of acceleration. The calibration of the simulation model was performed by reducing the errors of resonance frequency and RMS voltage value between the analysis model and 5 experimental data. The voltage of the analysis model was calculated through frequency domain analysis, and the excitation frequency was , which was the mean resonance frequency of the experimental data. As calibration parameters, Young’s modulus of clamping jig, piezoelectric coupling coefficient (), and dielectric coefficient () were used since those parameters are hard to measure, but they have significant impact on response [25]. The experimental data and calibration results are shown in Table 1 and the material properties including calibrated parameters are listed in Table 2. As a result of calibration, an accurate simulation model was developed; the error between mean resonance frequency of the 5 experimental data and the analysis model was 0.45%, and the error of RMS voltage was 0.36%.
2.3. Circuit Resistor Influence on PEH Performance
In general, the performance of the energy harvester is estimated using the open-circuit voltage. Although the open-circuit voltage can appropriately measure the capability of energy harvester which indicates the maximum electric potential of the energy source, it is difficult to use it as a measure of the energy supplier. If there is a resistor connected to the energy source, the voltage across the resistor will be less than the open-circuit voltage unless the energy source is ideal. However, all the energy sources used practically, including PEH, are non-ideal sources [26]. Thus, it is more suitable to examine the voltage or electric power across the resistor that substitutes the operating device.
Figure 3 presents variation of electrical and mechanical PEH responses as a function of the resistor obtained through COMSOL. In Figure 3a, the voltage across the resistor (blue-dashed line) increases monotonically as the resistor value increases, and converges to the open circuit voltage. This is because the greater the resistor value, the closer it is to the open-circuit condition. Meanwhile, the power curve (red-solid line) does not change monotonically, but increases and then decreases after it reaches the peak (maximum value). This implies that the resistor value substantially affects the electric power, and impedance matching is important for extracting the maximum power.
Figure 3b shows features from a mechanical perspective. The maximum von Mises stress of the PZT domain is not constant but changes. This result indicates that the changing resistor value also affects the mechanical response. The piezoelectric constitutive equation (Equation (1)) represents these results. For the longitudinal mechanical response according to the transverse electrical electrode, Equation (1) is rewritten as follows:
Because the electric field is a function of voltage, that is, , the voltage changed by the resistor affects the change in mechanical stress. Thus, the circuit resistor is not an independent element in the PEH system, and the PEH system should be treated as a multi-physics system that is coupled to the circuit, which also exhibits electromechanical coupling.
Figure 4 shows the voltage and current across the resistor in the frequency sweep results when the resistor changes from to . The resonance frequencies of voltage and current for each resistor are all the same: 89.4 Hz for , 90.1 Hz for , 92.4 Hz for and 92.5 Hz for , respectively. In the voltage response depicted in Figure 4a, as the resistor value increases gradually, the resonance frequency and peak value increase simultaneously. As the value of the resistor increases from the lower resistances, the system changes from the short-circuit to the open-circuit condition. Accordingly, the stiffness of the piezoelectric material gradually increases [27]. This causes the resonance frequency shifting at which the peak value appears. Additionally, the voltage increases from a small value to the open circuit voltage and then converges. On the other hand, for the current response depicted in Figure 4b, as the resistor value increases gradually, the resonance frequency increases, but the peak value at that time decreases inversely.
Now the power curve can be obtained by multiplying the voltage and current as a function of frequency according to the change in the resistor value, as shown in Figure 5. Unlike the voltage and current which exhibit gradual trends, power has a pattern in which the resonance frequency increases as the resistor value increases; however, the peak value at resonance of each resistor has no gradual change pattern. As aforementioned, the resonance frequency changes according to the circuit condition change, and when the condition moves to the open-circuit condition (), the voltage converges to the open-circuit voltage () nonlinearly. Thus, the peak power frequency shifts, and the peak value changes nonlinearly—that is, changing the resistor value affects both the frequency at which resonance occurs and the electrical response at that time. These phenomena were studied in detail in a previous study and verified using closed-form analytical models and experiments [28].
To briefly summarize the influence of the resistor shown above, the change in the resistor value connected to the energy source varies the electrical output power. Second, it also changes the mechanical properties of the PEH, such as the stress of the PZT and resonance frequency of the PEH. Therefore, it is necessary to design the PEH by including the resistor as a design variable in the design process, rather than separately designing the harvester and impedance matching.
3. Conceptual Design
3.1. Design Degree of Freedom Comparison
Before conducting the topology optimization for the conceptual design, the effect of the design degree of freedom on the optimal design is examined for three cases with increasing degrees of freedom. In the first case, topology optimization is performed on the PZT material only as the design domain, which is depicted as in Figure 6a. In the second case, the design domain is expanded by adding the substrate domain to the first case, which is shown as in Figure 6b. Thus, the influence of substrate design on PEH performance can be examined. For the two cases, the register is assigned as . Note that the electrical and mechanical responses vary depending on the resistor. The last case is to add the resistor as a design variable to the second case as shown in Figure 6c, which examines the influence of the structural-circuit resistor integrated topology optimization. For finite element analysis the PZT and the substrate are modeled as square single-layer mesh, respectively. A summary of the design variables for case studies is given in Table 3.
3.2. Density-Based Topology Optimization of PEH
The density-based method is widely used for topology optimization. The concept of density-based topology optimization is to distribute a specified amount of material in a design domain by allocating density to finite elements in the optimization process. If the material is fully filled with material, the spatial density has value of 1 (present), and if it is empty, spatial density becomes 0 (void). Thus, the density value should only be 0 or 1; however, this leads to difficulties in solving discrete variable problems. To solve this problem, a solid isotropic material with a penalization (SIMP) method was utilized to handle the element densities in this research. The SIMP method interpolates the density values between 0 and 1 through the penalization parameter p, which makes the density continuous and works like 0 or 1 [29]. Equation (6) shows the penalized Young’s modulus of the substrate.
where and are the substrate density variable, penalization parameter, and Young’s modulus of the solid, respectively. Because a higher value of may cause problems in converging to the local optimum too rapidly, and a lower value may produce too many intermediate values, an appropriate penalization parameter satisfying should be selected [29].
Similar to the penalized Young’s modulus, a penalizing piezoelectric material was also employed for PZT. A piezoelectric material with penalization and polarization (PEMAP-P) modeling method is utilized for penalized piezoelectric material properties, which are described in Equations (1) and (2) [30]. The PEMAP-P model contains the orientation of the PZT, and some studies have also performed optimization by including the orientation of the PZT as a design variable [19,20]. It is considered to provide better results with a higher design freedom. However, when various directions are mixed, other problems arise regarding manufacturing, such as having to manufacture and combine PZT material for each orientation piece or develop PZT organized in various directions. Therefore, in this research, the orientation of PZT was excluded, and PEMAP-P without polarization was applied as follows:
where and are PZT-density-variable penalization parameters for the elastic stiffness coefficient, piezoelectric coupling coefficient, and dielectric coefficient, respectively. Now, optimization is performed for the density by replacing the existing properties with penalized properties.
Topology optimization is performed using COMSOL Multiphysics with the method of moving asymptotes algorithm, which is a gradient-based optimization algorithm. The mathematical formulation for performing topology optimization of cases 1 and 2 is as follows:
where is the electrical output power across the resistor, and and are the density of each element, volume of each element, total volume of the design domain, allowance of volume usage, and the number of elements, respectively. and are maximum von Mises stress of substrate and PZT, respectively. The yield strength of the subject is and is modulus of rupture of PZT [31]. For case 3, the following equation, in which the resistor is added as a design variable, is utilized for the topology optimization formulation. All the performances of the formulation were calculated under frequency domain.
3.3. Topology Optimization Results
Table 4 shows topology optimization results for cases 1 to 3, and the power of the optimal topology by case and the impedance matching results are summarized in Table 5. Firstly, the results of case 1 have a distinct difference compared to the other results. Contrary to the optimal topology in cases 2 and 3, most of the design variables converge to 0 or 1. However, the results show the inferior power of even after impedance matching. The inferior power comes from resonance frequency. Except for PZT, the resonance frequency is about when it consists of only substrate and tip magnet. Thus, the PZT material should be distributed far from the fixed boundary to decrease the stiffness, but should be distributed near the fixed boundary where stress is highest to maximize power generation. As a result, the PZT material was distributed near the fixed boundary for power generation, but a very small amount was distributed to suppress the increase in stiffness. This result is not only the lowest power, but also meaningless as a result of topology optimization. Therefore, it seems to be necessary to design by expanding the design domain, as suggested in this study.
On the other hand, the optimal topologies in case 2 show contrasting results. The design variables of the optimal topology are not clearly obtained as 0 or 1 and have many intermediate values both in the PZT and substrate domain, as shown in Table 4. For before impedance matching, the power across the resistor is , and its power is increased to after impedance matching. The results of case 2 show that, unlike case 1, a larger amount of power generation can be obtained because the resonant frequency () is moved near the operating frequency, , due to the added substrate design.
Lastly, looking at the topology optimization results in case 3, the optimal topologies of PZT and the substrate was found to have similar topologies to that of case 2. However, the optimized power becomes , which is the highest power among the case study results. In addition, in the previous two cases, the optimal resistor after impedance matching is far from the initial value (), and the PZT stresses have some margin of and on the constraint boundary, respectively. On the other hand, in case 3, the resistor value of topology optimization result and the resistor value after impedance matching are the same, and the PZT stress is actively satisfied for the constraint boundary—that is, it suggests that if resistor is not considered at the structural design stage, limited results can be obtained even though there is a possibility of improving the power generation.
From the above results, it is confirmed that power generation increases as the design freedom increases from case 1 to 3. Based on the highest design freedom in case 3, case 2, which is the intermediate level of freedom, peaks at 76.73% electric power, and case 1, which is the lowest level of freedom, peaks at 15.76% electric power—that is, the design approach that simultaneously considers most designable factors such as PZT, substrate and resistor can provide higher output power. Therefore, conceptual design is adopted with the topology of case 3 that are the highest power.
4. Detailed Design
4.1. Size Optimization of Refined Optimal Topology Model
In the conceptual design process, the optimal topology was obtained. However, the optimal design is not suitable for manufacturing design because there are densities with intermediate values (), as shown in Table 4. Therefore, for a manufacturable design which has 0 or 1 entities, the conceptual design is refined by setting the optimal topologies to 1 for elements with , and 0 otherwise—this is represented in Figure 7a,b as PZT in yellow and substrate in gray. These refining process results may differ somewhat from those of the optimal topology because even a small change in the resonance frequency significantly affects the performance. Furthermore, it is necessary to smooth the outline with simple lines because the design in Figure 7 still has element-wise outlines.
The refined model shown in Figure 7a,b is now reconstructed into a simple continuous shape for manufacturable design. Local complex features are expressed with simple lines, and small or discontinued elements are ignored. Figure 7c,d shows a simplified model with simple continuous shape. The power of the simplified model is , and the stresses in the substrate and PZT are and , respectively. It reveals that it is far behind the performance of the optimal topology design. This is because only the outlines of the roughly refined model are smoothed and intermediate values and small parts are ignored, as shown in Figure 7. Therefore, as a post-process for the simplified parametric model, a detailed design is required, and this was carried out through size optimization.
Figure 8 presents a simplified parametric model with six variables that are to be the design variables for size optimization. The design variables consist of the three geometrical lengths that can define the PZT configuration, the resistor, and the thickness of each material that are not taken into account in the topology optimization. The initial design and design range are described in Table 6, where the thicknesses of the substrate and PZT are discrete variables with a unit value of 0.1 mm, and the remaining four variables are continuous variables.
Size optimization was performed using MATLAB R2021a with a genetic algorithm, which is a gradient-free optimization algorithm because some variables are discrete. The size optimization can be defined as follows:
where and are the lower and upper bounds of each design variable, respectively. The descriptions and values of and are listed in Table 6.
4.2. Results
The optimal design of size optimization and its performances are given in Figure 9 and Table 7. The converged value of the design variables can be explained as the relationship between stiffness and resonance frequency—that is, the resonance frequency of PEH increases as the stiffness of the system increases. Since the resonance frequency of the simplified model is , design changes should occur aiming to reduce the stiffness of the PEH in order to shift the resonance frequency to . Therefore, the overall length () and the PZT thickness () are reduced to achieve a stiffer system. Meanwhile, the power of optimal model is , which is approximately 96% of the output of optimal topology design. It shows that the performance that is degraded in the process of model simplification has been recovered to almost the original level. Therefore, through the post-processing using size optimization, it is possible to optimize the PEH design that is manufacturable and has the same level of performance as the optimal topology design.
The performance of final optimal PEH is compared with other recently studied PEH and summarized in Table 8. The size of PEH and the scale of power in each study are different, so they are compared based on power density. In the studies that were conducted to maximize power in a fixed PEH space (length width), the PEH design was carried out based on the designer’s intuition, such as making holes in the cantilever beam [32,33] or constructing a meandering structure [34]. The power densities designed with these methods have values of approximately , while the power density obtained by the proposed method is . Since optimization considering multi-physics increases the output power, and topology optimization reduces unfavorable materials efficiently, the proposed intuition-independent method gives relatively excellent power density. On the other hand, a study with geometry ratio optimization [35] obtained a slightly higher power density than this study. In addition, very high power density was obtained in study that optimized geometry by using power density as the objective function of optimization [36]. The difference between the previous two studies and this study is consideration of discrete variables and stress constraints. Since the optimizer was terminated using an active stress constraint rather than the optimality condition in this study, it seems that stress constraints affect power generation. Accordingly, it is expected that higher power density will be obtained if the constraints are relaxed through changing material with high MOR and the continuous variable is handled. Through comparison, it can be confirmed that designs derived through optimization give better results than designs based on empirical intuition.
Meanwhile, in the study that showed the highest power density [36], power density was used as the objective function. The point to note here is that it is true that an efficient PEH design with high power density was performed, but it cannot be said that the amount of power is maximum in a given space. If the decrease in volume is smaller than the decrease in power, the power of the PEH decreases but the power density increases. Therefore, it is necessary to select an appropriate objective function suitable for the design purpose and situation (i.e., power or efficiency).
5. Conclusions
This paper proposed a design methodology to optimize PEH from a multi-physics perspective. Prior to the design process, the multi-physics phenomenon in which the change in the resistor value affects the electrical and mechanical performance of the PEH was examined. According to the resistor value, the circuit condition can change to closed circuit or open circuit—that is, as the circuit condition becomes closer to the open circuit, the stiffness of PEH increases due to electrochemical coupling, so that the resonance frequency increases. From an electrical point of view, as the value of resistor increases, the peak voltage value increases and the peak current value decreases, and the power, which is product of the two, increases and then decreases.
To maximize the power of PEH, a two-stage optimization approach was proposed—a sequential method of topology optimization, and size optimization. First, a conceptual design was performed for the development of an optimal configuration through density-based topology optimization with stress constraints. To examine the effect of multi-physics in the design process, three case studies were conducted: optimizing only the PZT material; optimizing the PZT material and substrate; and optimizing the PZT material, substrate, and resistor. As a result of our case study, it is confirmed that a higher power is obtained when the PZT material and substrate are optimized together rather than when only the PZT material are optimized. Here, the turning of the PEH resonance frequency becomes easier with the design change of the substrate. Furthermore, the highest power is obtained when PZT material, substrate, and resistor are designed together. From this, it can be seen that better design can be obtained by performing impedance matching in the process of designing the PEH configuration.
With the best topology optimization results that generated electric power, a detailed design for post-processing is performed to develop a manufacturable design through size optimization. As a result of size optimization, the final optimal PEH design provides a harvesting power of , which peaks at 96% of the power of optimal topology design. Comparing the results of this study with the recent studies, it is confirmed that if the PEH is designed with the proposed method, it is possible to design a manufacturable PEH with higher performance than intuition-based design. In addition, although a lower power density was obtained than for the PEH designed without stress constraints, the structural safety of PEH was secured owing to the stress constraints, and it is expected that further improvements to performance can be realized if higher-MOR piezoelectric materials are used than now.
Although the final configuration of the design is complex, it can be manufacturable if mass production such as die casting is considered. Additionally, its performance is expected to be similar to the optimum results, since the simulation model is verified through experiments. The design process of this study, however, used a stress constraint to prevent failure during operation. Considering the operating situation where the PEH undergoes many cycles of deformation, the PZT stress of 61.9 MPa (i.e., almost active constraint) of optimal design may be vulnerable to the fatigue situation. Therefore, although the fatigue strength of PZT, which can be obtained by experiments, is not available yet, the optimal design is expected to be obtained which can cope with fatigue if the stress constraint boundary value is changed to fatigue strength in the proposed design methodology.
Author Contributions
Conceptualization, J.K.; methodology, T.K. and J.K.; software, T.K.; validation, T.K. and T.H.L.; formal analysis, T.K. and J.K.; investigation, T.K.; resources, J.K.; data curation, T.K.; writing—original draft preparation, T.K.; writing—review and editing, J.K. and T.H.L.; supervision, T.H.L. All authors have read and agreed to the published version of the manuscript.
Data Availability Statement
Not applicable.
Conflicts of Interest
The authors declare no conflict of interest.
References
- Farokhi, H.; Gholipour, A.; Ghayesh, M.H. Efficient Broadband Vibration Energy Harvesting Using Multiple Piezoelectric Bimorphs. J. Appl. Mech. Trans. ASME 2020, 87, 41001. [Google Scholar] [CrossRef]
- Panda, S.K.; Srinivas, J. Electro-Structural Analysis and Optimization Studies of Laminated Composite Beam Energy Harvester. Mech. Adv. Mater. Struct. 2021, 29, 4193–4205. [Google Scholar] [CrossRef]
- Hey, J.; Repaka, M.; Li, T.; Tan, J.L. Design Optimization of a Rotary Thermomagnetic Motor for More Efficient Heat Energy Harvesting. Energies 2022, 15, 6334. [Google Scholar] [CrossRef]
- Mohammadnia, A.; Rezania, A.; Ziapour, B.M.; Sedaghati, F.; Rosendahl, L. Hybrid Energy Harvesting System to Maximize Power Generation from Solar Energy. Energy Convers. Manag. 2020, 205, 112352. [Google Scholar] [CrossRef]
- Sheeraz, M.A.; Malik, M.S.; Rehman, K.; Elahi, H.; Butt, Z.; Ahmad, I.; Eugeni, M.; Gaudenzi, P. Numerical Assessment and Parametric Optimization of a Piezoelectric Wind Energy Harvester for IoT-Based Applications. Energies 2021, 14, 2498. [Google Scholar] [CrossRef]
- Shirvanimoghaddam, M.; Shirvanimoghaddam, K.; Abolhasani, M.M.; Farhangi, M.; Zahiri Barsari, V.; Liu, H.; Dohler, M.; Naebe, M. Towards a Green and Self-Powered Internet of Things Using Piezoelectric Energy Harvesting. IEEE Access 2019, 7, 94533–94556. [Google Scholar] [CrossRef]
- Yang, Z.; Zhou, S.; Zu, J.; Inman, D. High-Performance Piezoelectric Energy Harvesters and Their Applications. Joule 2018, 2, 642–697. [Google Scholar] [CrossRef]
- Kumar, A.; Sharma, A.; Kumar, R.; Vaish, R. Finite Element Study on Acoustic Energy Harvesting Using Lead-Free Piezoelectric Ceramics. J. Electron. Mater. 2018, 47, 1447–1458. [Google Scholar] [CrossRef]
- Kianpoor, A.; Jahani, K. Modeling and Analyzing of Energy Harvesting from Trapezoidal Piezoelectric Beams. Iran. J. Sci. Technol.-Trans. Mech. Eng. 2019, 43, 259–266. [Google Scholar] [CrossRef]
- Montazer, B.; Sarma, U. Design and Optimization of Quadrilateral Shaped Pvdf Cantilever for Efficient Conversion of Energy from Ambient Vibration. IEEE Sens. J. 2018, 18, 3977–3988. [Google Scholar] [CrossRef]
- Bath, D.; Salehian, A. A Novel 3D Folded Zigzag Piezoelectric Energy Harvester; Modeling and Experiments. Smart Mater. Struct. 2019, 28, 25011. [Google Scholar] [CrossRef]
- Fernandes, E.; Martin, B.; Rua, I.; Zarabi, S.; Debéda, H.; Nairn, D.; Wei, L.; Salehian, A. Design, Fabrication, and Testing of a Low Frequency MEMS Piezoelectromagnetic Energy Harvester. Smart Mater. Struct. 2018, 27, 35017. [Google Scholar] [CrossRef]
- Dhote, S.; Li, H.; Yang, Z. Multi-Frequency Responses of Compliant Orthoplanar Spring Designs for Widening the Bandwidth of Piezoelectric Energy Harvesters. Int. J. Mech. Sci. 2019, 157–158, 684–691. [Google Scholar] [CrossRef]
- Townsend, S.; Grigg, S.; Picelli, R.; Featherston, C.; Kim, H.A. Topology Optimization of Vibrational Piezoelectric Energy Harvesters for Structural Health Monitoring Applications. J. Intell. Mater. Syst. Struct. 2019, 30, 2894–2907. [Google Scholar] [CrossRef]
- Amlashi, A.H.; Mohand-ousaid, A.; Rakotondrabe, M. Topology Optimization of Piezoelectric Plate Energy Harvester Under External In-Plan Force Considering Different Boundary Conditions. In Proceedings of the 2019 International Conference on Manipulation, Automation and Robotics at Small Scales (MARSS), Helsinki, Finland, 1–5 July 2019. [Google Scholar]
- Thein, C.K.; Liu, J.S. Numerical Modeling of Shape and Topology Optimisation of a Piezoelectric Cantilever Beam in an Energy-Harvesting Sensor. Eng. Comput. 2017, 33, 137–148. [Google Scholar] [CrossRef]
- Uchino, K. Piezoelectric Energy Harvesting Systems—Essentials to Successful Developments. Energy Technol. 2018, 6, 829–848. [Google Scholar] [CrossRef]
- Hasan, N.; Muktadir, M.A.; Alam, M. Forces in Mechanics Comparative Study of Tapered Shape Bimorph Piezoelectric Energy Harvester via Finite Element Analysis. Forces Mech. 2022, 9, 100131. [Google Scholar] [CrossRef]
- Salas, R.A.; Reddy, J.N. A Topology Optimization Formulation for Transient Design of Multi-Entry Laminated Piezocomposite Energy Harvesting Devices Coupled with Electrical Circuit. Int. J. Numer. Methods Eng. 2018, 113, 1370–1410. [Google Scholar] [CrossRef]
- Kiyono, C.Y.; Silva, E.C.N.; Reddy, J.N. Optimal Design of Laminated Piezocomposite Energy Harvesting Devices Considering Stress Constraints. Int. J. Numer. Methods Eng. 2016, 105, 883–914. [Google Scholar] [CrossRef]
- Wang, Q.; Kim, K.B.; Woo, S.B.; Song, Y.; Sung, T.H. A Magneto-Mechanical Piezoelectric Energy Harvester. Energies 2021, 14, 2387. [Google Scholar] [CrossRef]
- Methods, C.; Mech, A.; Li, H.; Gao, L.; Li, H.; Li, X.; Tong, H. ScienceDirect Full-Scale Topology Optimization for Fiber-Reinforced Structures with Continuous Fiber Paths. Comput. Methods Appl. Mech. Eng. 2021, 377, 113668. [Google Scholar] [CrossRef]
- Zhu, J.; Cai, X.; Zhang, J.; Ni, X. Improved Structural Design of Wind Turbine Blade Based on Topology and Size Optimization. Int. J. Low-Carbon Technol. 2021, 17, 69–79. [Google Scholar] [CrossRef]
- Côté, F.; Masson, P.; Mrad, N.; Cotoni, V. Dynamic and Static Modelling of Piezoelectric Composite Structures Using a Thermal Analogy with MSC/NASTRAN. Compos. Struct. 2004, 65, 471–484. [Google Scholar] [CrossRef]
- Jung, B.C.; Yoon, H.; Oh, H.; Lee, G.; Yoo, M.; Youn, B.D.; Huh, Y.C. Hierarchical Model Calibration for Designing Piezoelectric Energy Harvester in the Presence of Variability in Material Properties and Geometry. Struct. Multidiscip. Optim. 2016, 53, 161–173. [Google Scholar] [CrossRef]
- Mayergoyz, I.D.; McAvoy, P. Basic Electric Circuit Theory: A One-Semester Text, 1st ed.; Academic Press: San Diego, CA, USA, 1997; ISBN 9780124808652. [Google Scholar]
- Platt, S.R.; Farritor, S.; Haider, H. On Low-Frequency Electric Power Generation with PZT Ceramics. IEEE/ASME Trans. Mechatron. 2005, 10, 240–252. [Google Scholar] [CrossRef]
- Erturk, A.; Inman, D.J. An Experimentally Validated Bimorph Cantilever Model for Piezoelectric Energy Harvesting from Base Excitations. Smart Mater. Struct. 2009, 18, 25009. [Google Scholar] [CrossRef]
- Sigmund, O.; Maute, K. Topology Optimization Approaches: A Comparative Review. Struct. Multidiscip. Optim. 2013, 48, 1031–1055. [Google Scholar] [CrossRef]
- Kögl, M.; Silva, E.C.N. Topology Optimization of Smart Structures: Design of Piezoelectric Plate and Shell Actuators. Smart Mater. Struct. 2005, 14, 387–399. [Google Scholar] [CrossRef]
- Hooker, W. Properties Ceramics of PZT-Based Piezoelectric and 250 °C; Technical Report for NASA; NASA: Langley, VR, USA, 1998.
- Anand, A.; Pal, S.; Kundu, S. Multi-Perforated Energy-Efficient Piezoelectric Energy Harvester Using Improved Stress Distribution. IETE J. Res. 2021, 1–16. [Google Scholar] [CrossRef]
- Pertin, O.; Guha, K.; Jakšić, O.; Jakšić, Z.; Iannacci, J. Investigation of Nonlinear Piezoelectric Energy Harvester for Low-Frequency and Wideband Applications. Micromachines 2022, 13, 1399. [Google Scholar] [CrossRef]
- Debnath, B.; Kumar, R. Design and Simulation Study of a New Flared-U Shaped Springs Based MEMS Piezoelectric Vibration Energy Harvester. In Proceedings of the 2020 IEEE International Conference on Computing, Power and Communication Technologies GUCON 2020, Greater Noida, India, 2–4 October 2020; pp. 101–105. [Google Scholar] [CrossRef]
- Hu, Y.; Yi, Z.; Dong, X.; Mou, F.; Tian, Y.; Yang, Q.; Yang, B.; Liu, J. High Power Density Energy Harvester with Non-Uniform Cantilever Structure Due to High Average Strain Distribution. Energy 2019, 169, 294–304. [Google Scholar] [CrossRef]
- Huang, Y.; Yi, Z.; Hu, G.; Yang, B. Data-Driven Optimization of Piezoelectric Energy Harvesters via Pattern Search Algorithm. Micromachines 2021, 12, 561. [Google Scholar] [CrossRef] [PubMed]
Figure 1.
Cantilever PEH with resistive circuit: (a) schematic illustration and (b) FEM mesh model with mesh quality measured by skewness.
Figure 1.
Cantilever PEH with resistive circuit: (a) schematic illustration and (b) FEM mesh model with mesh quality measured by skewness.
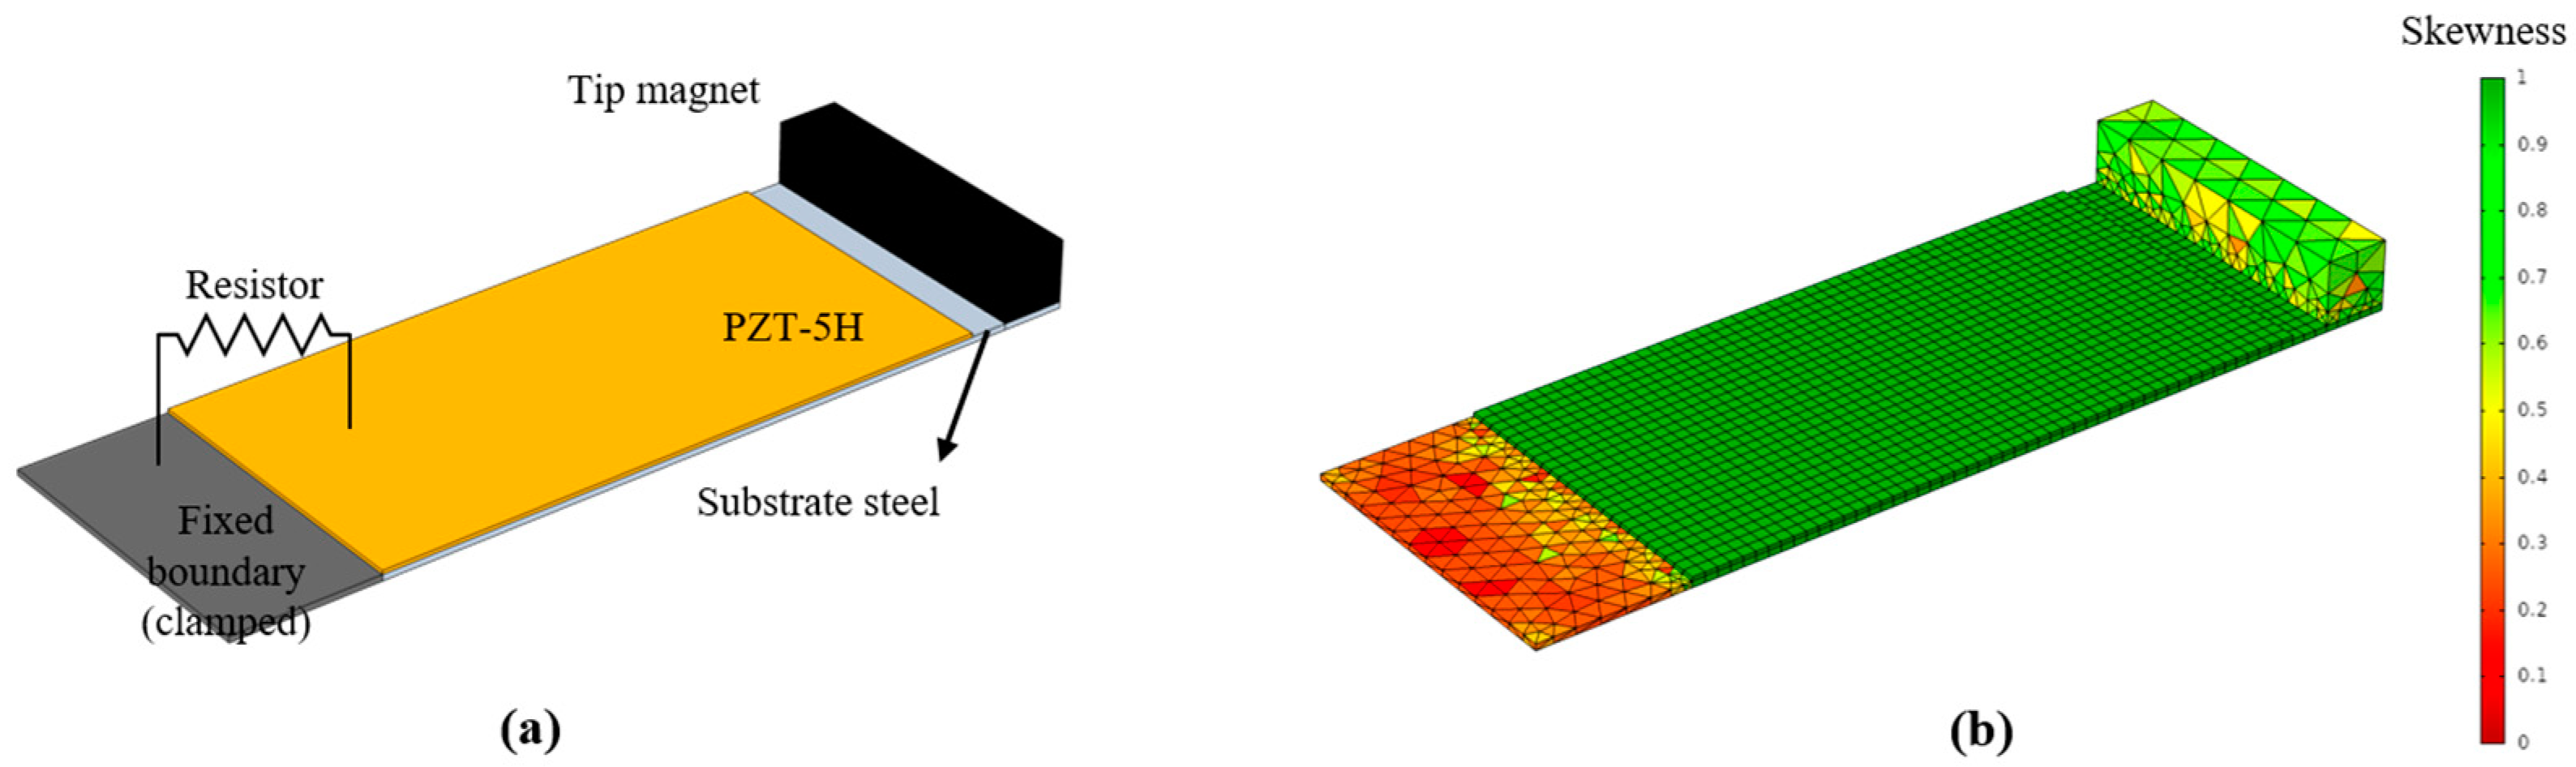
Figure 2.
Base excitation experiment of PEH: (a) experimental setups and (b) FEM mesh model with clamping zig.
Figure 2.
Base excitation experiment of PEH: (a) experimental setups and (b) FEM mesh model with clamping zig.
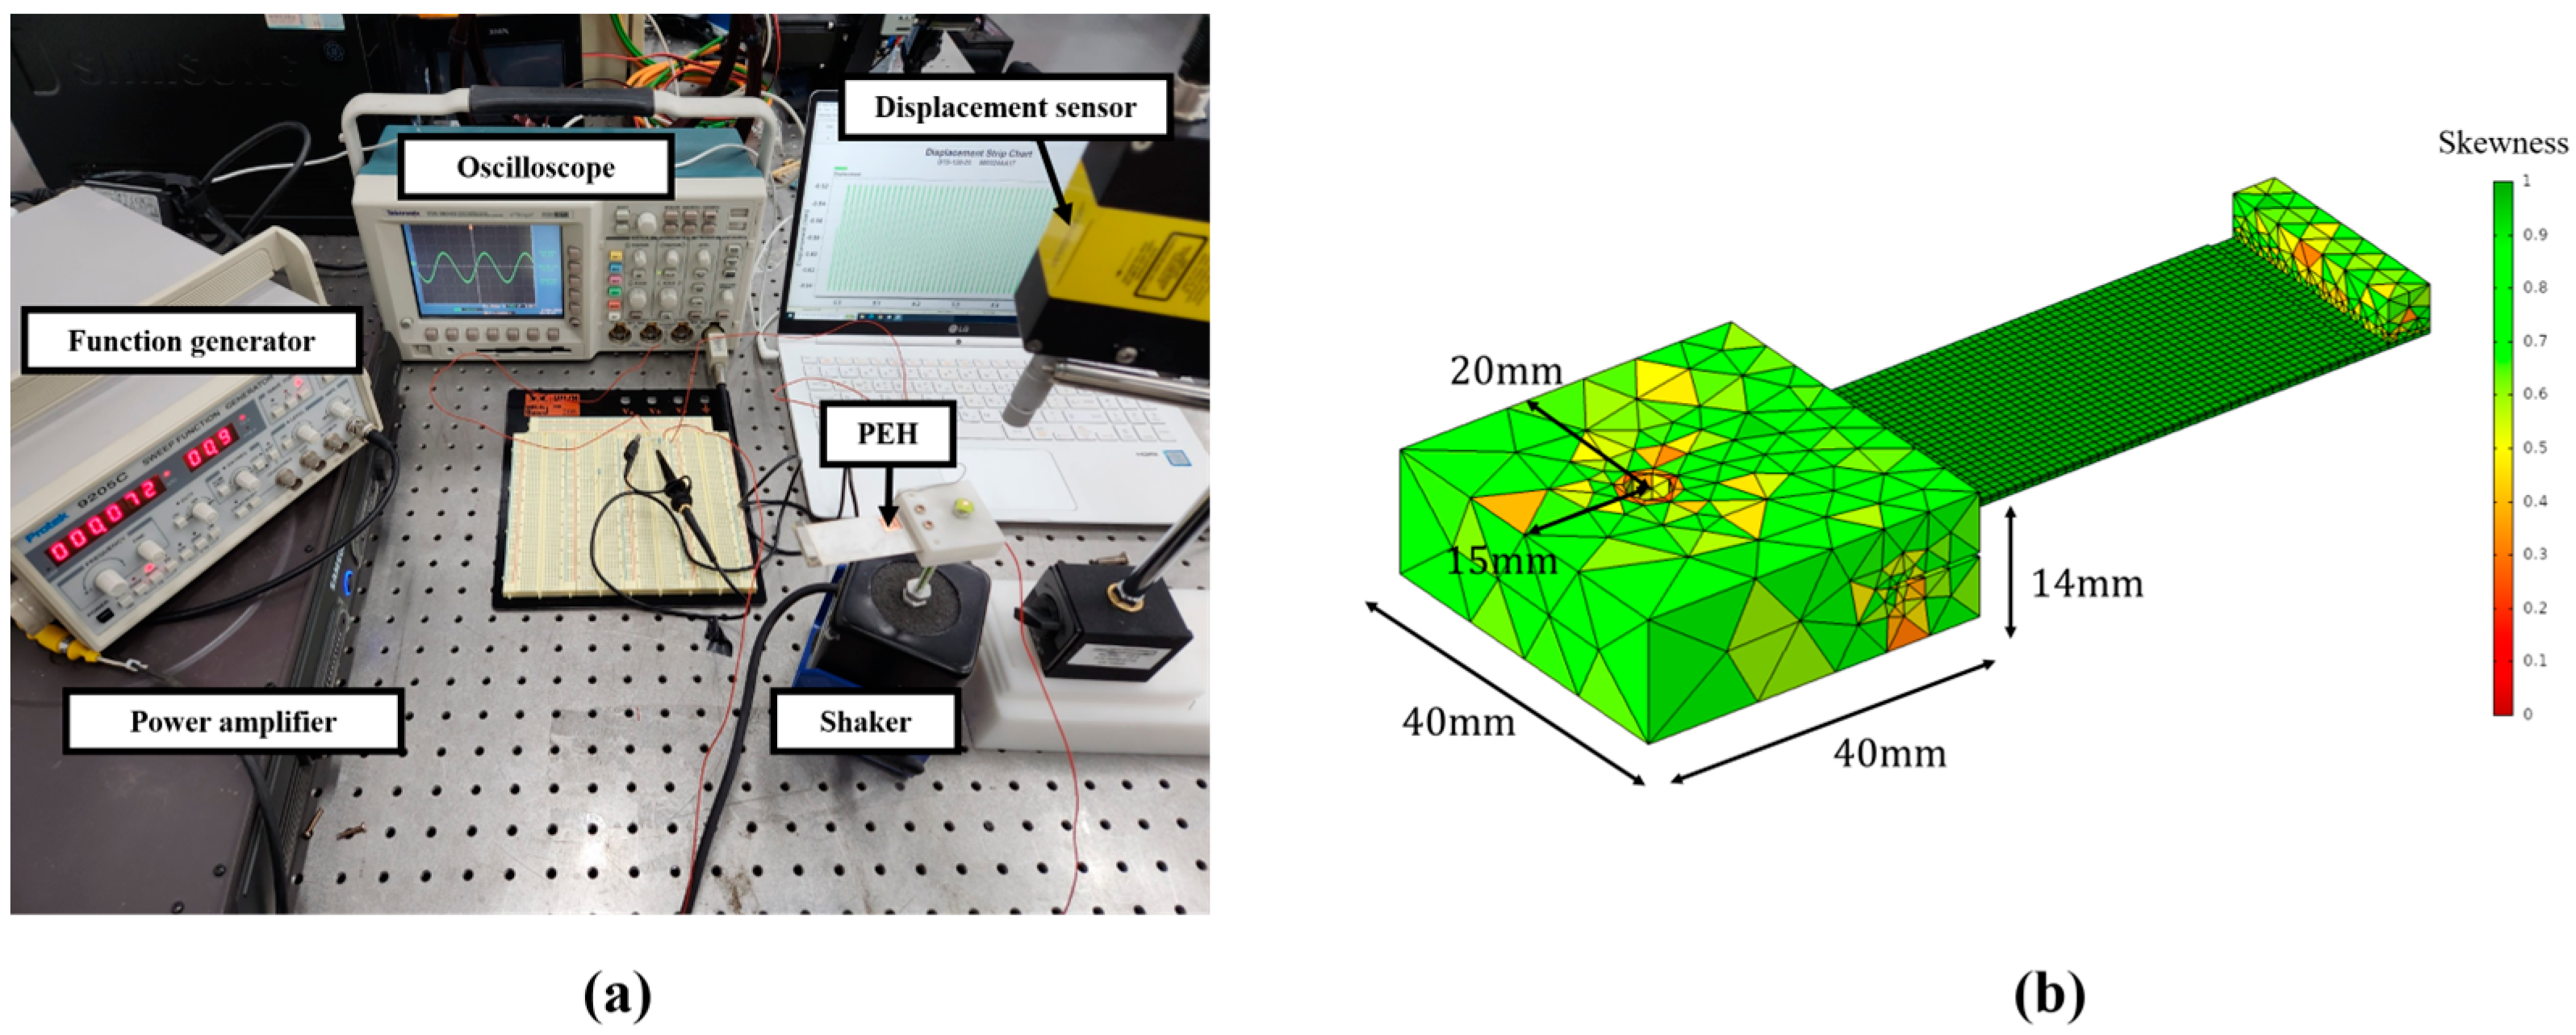
Figure 3.
Variation of PEH responses according to resistor: (a) electrical and (b) mechanical.
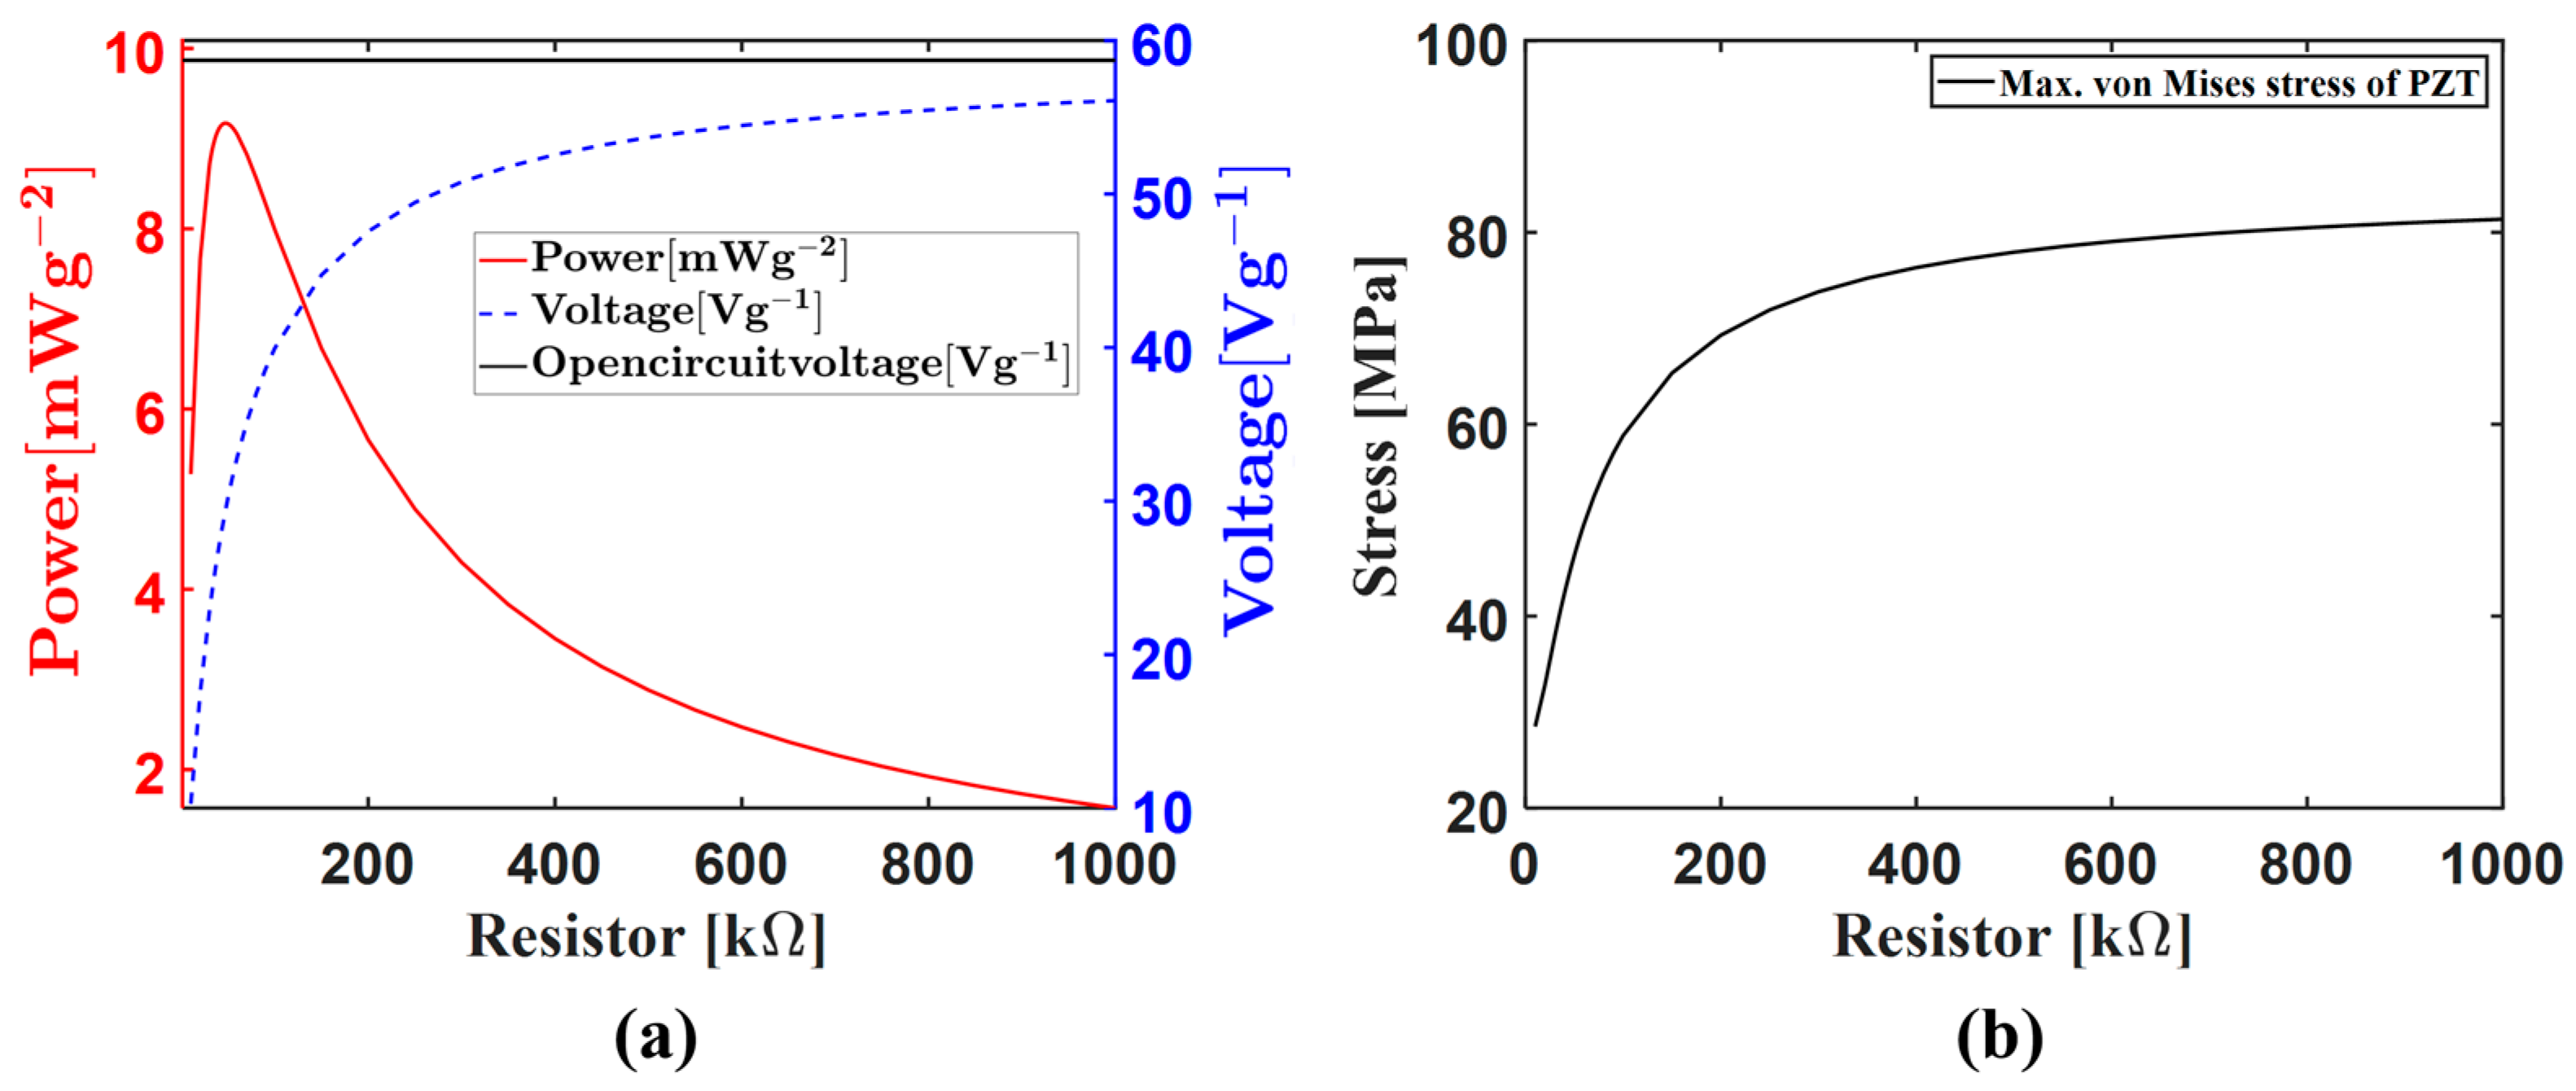
Figure 4.
Frequency sweep results according to resistor value change: (a) Voltage and (b) Current.
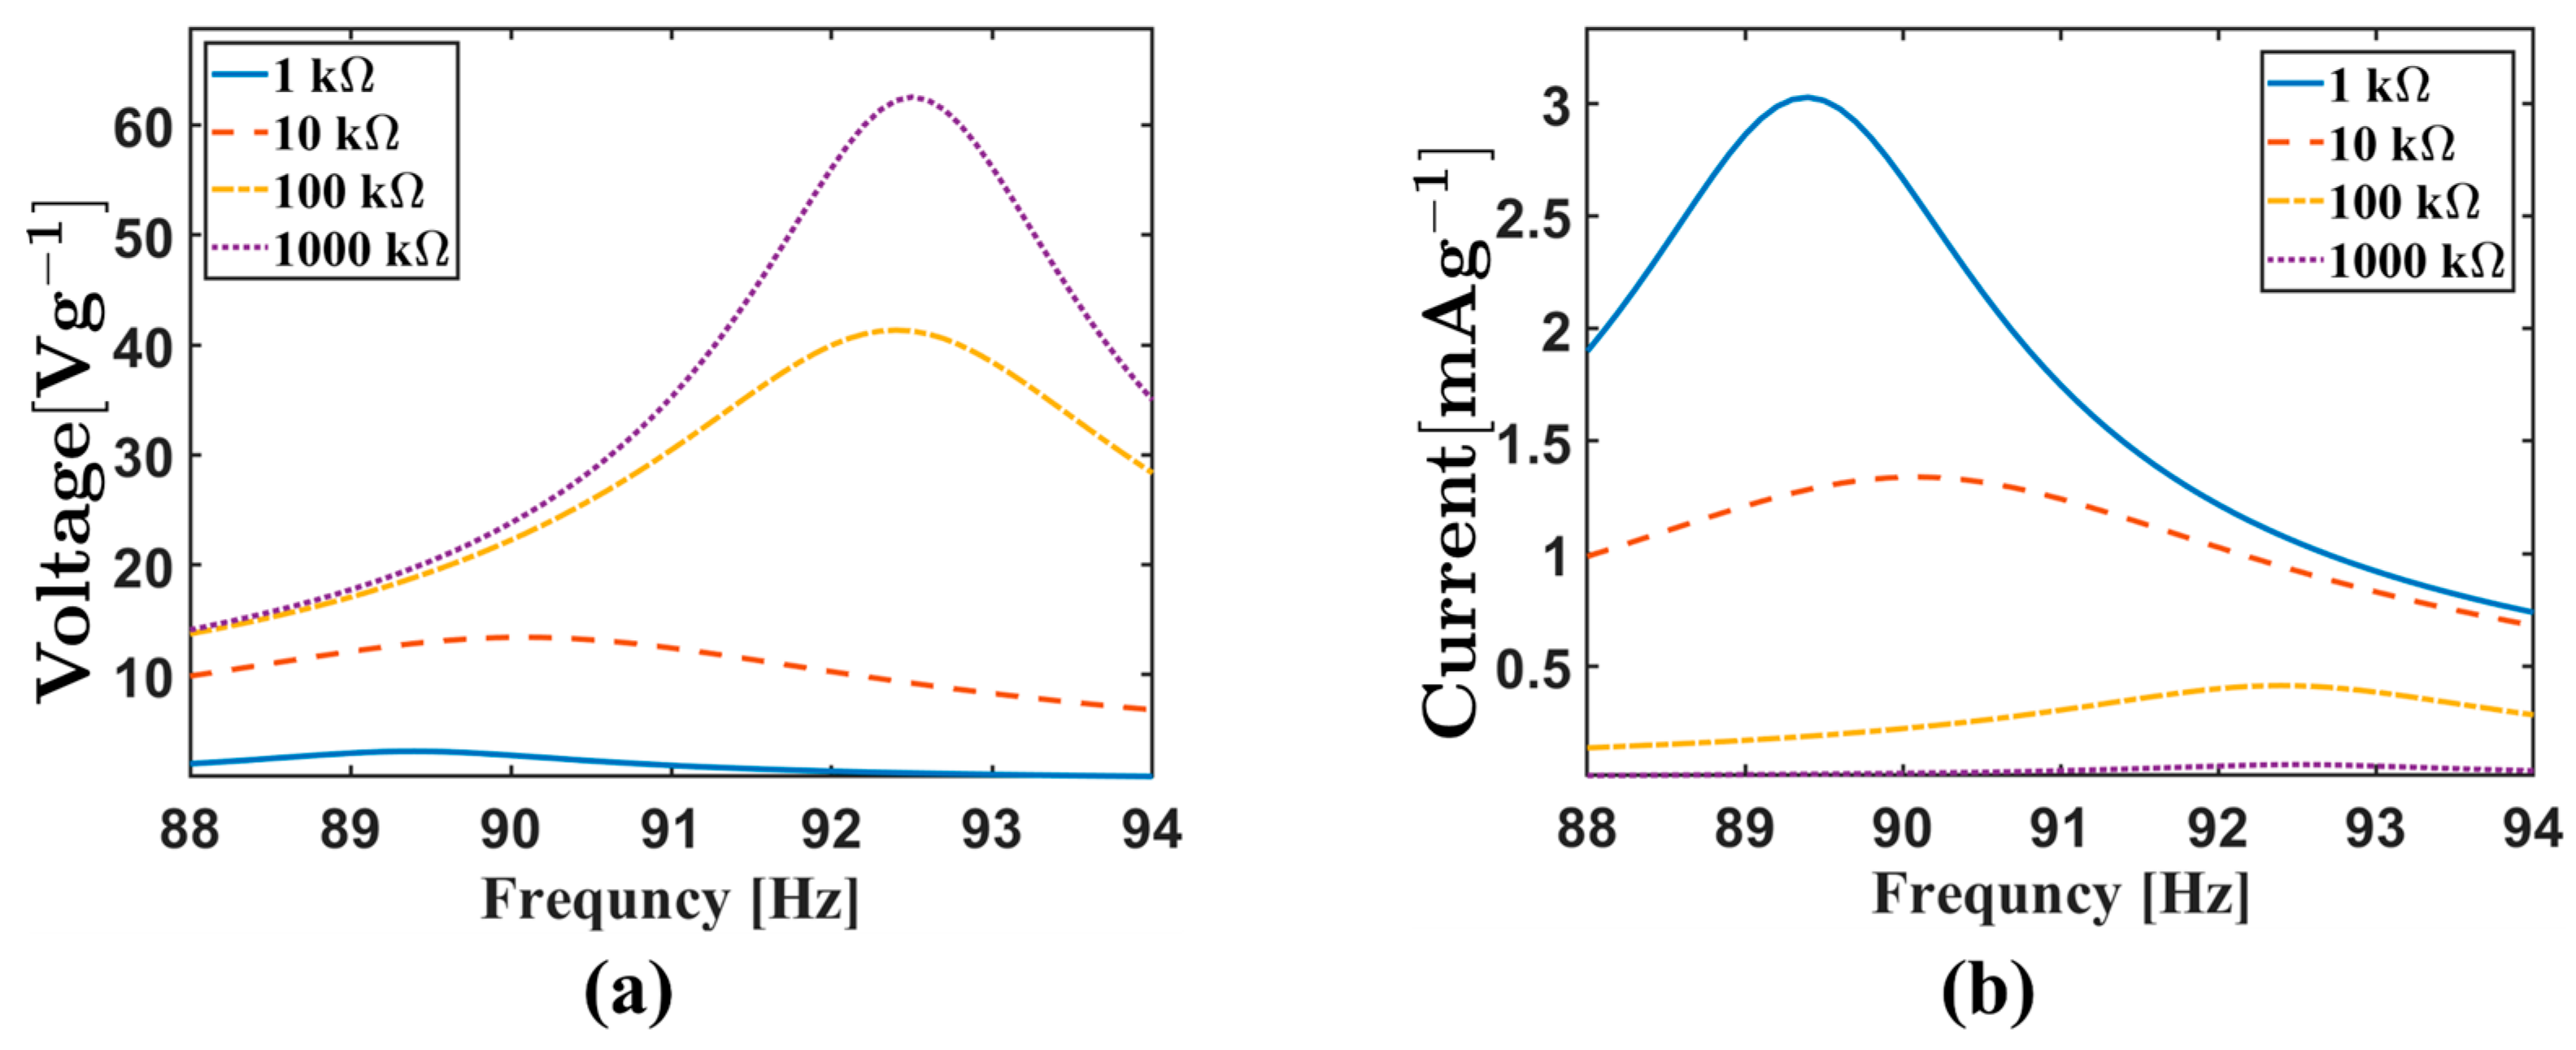
Figure 5.
Frequency sweep results of varying resonance frequency according to resistor value change.
Figure 5.
Frequency sweep results of varying resonance frequency according to resistor value change.
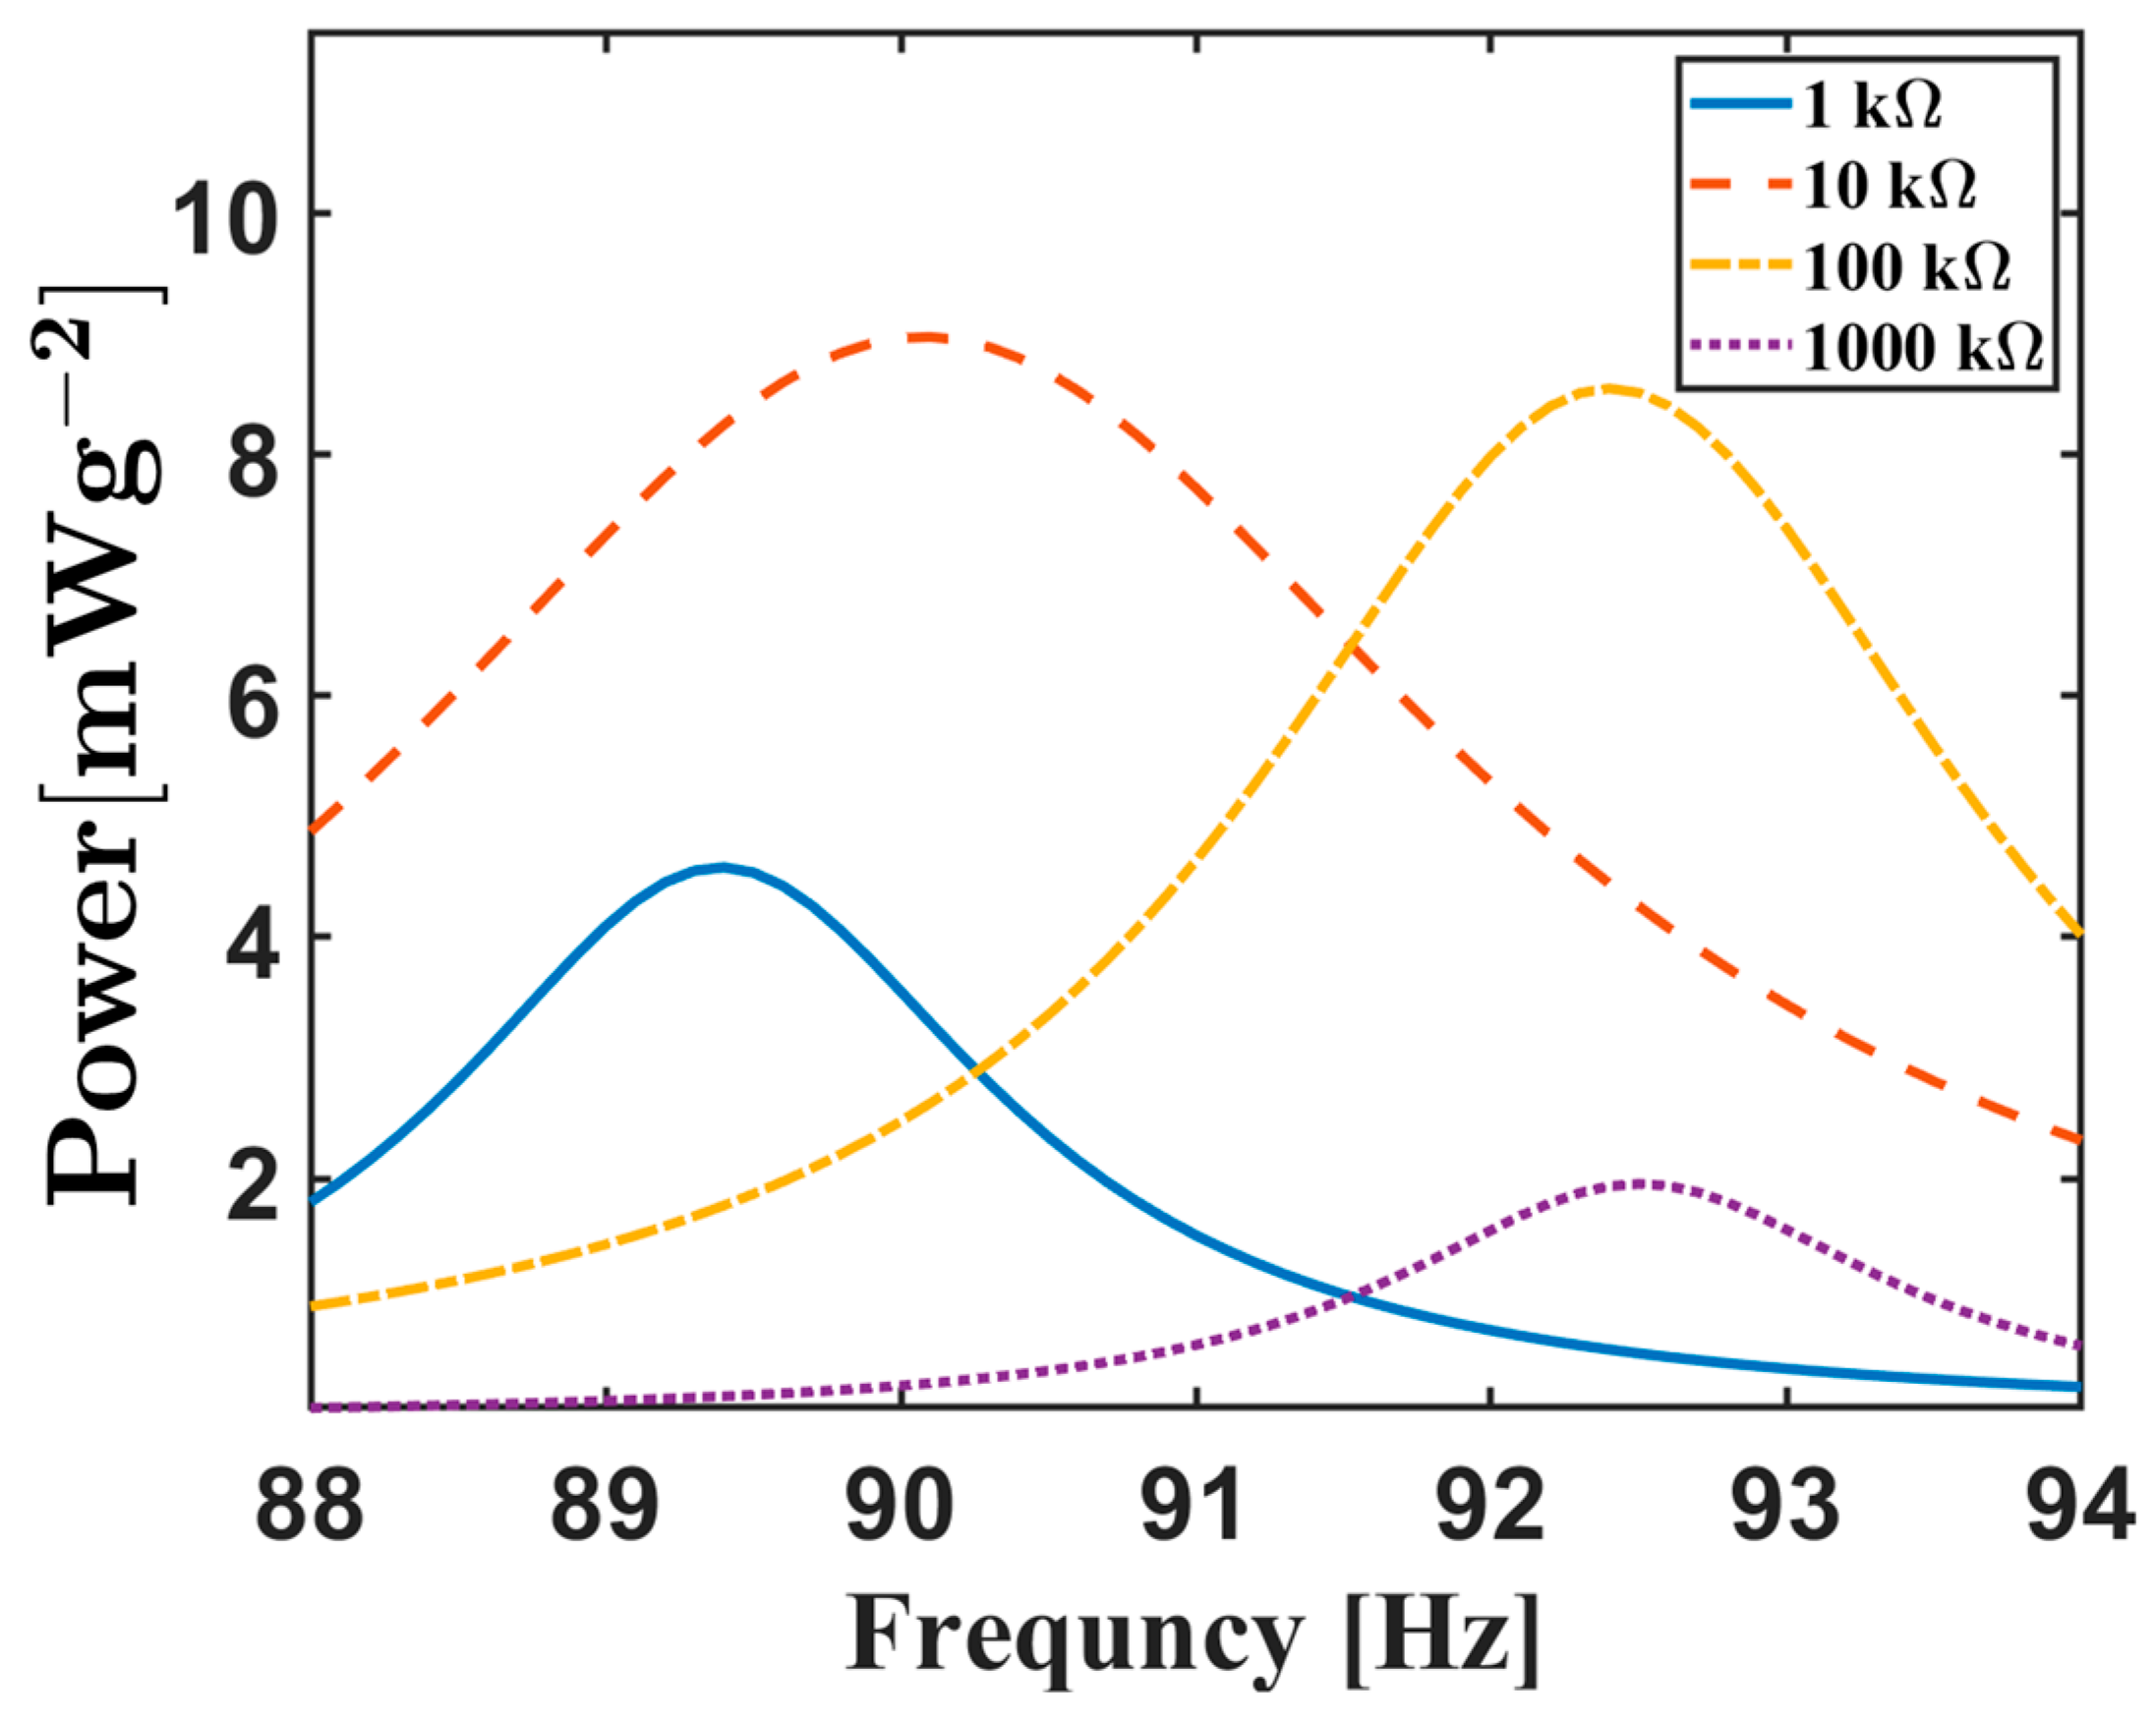
Figure 6.
Design domain definitions: (a) case 1-only PZT (yellow), (b) case 2-PZT and substrate (grey), and (c) case 3-PZT, substrate, and resistor.
Figure 6.
Design domain definitions: (a) case 1-only PZT (yellow), (b) case 2-PZT and substrate (grey), and (c) case 3-PZT, substrate, and resistor.
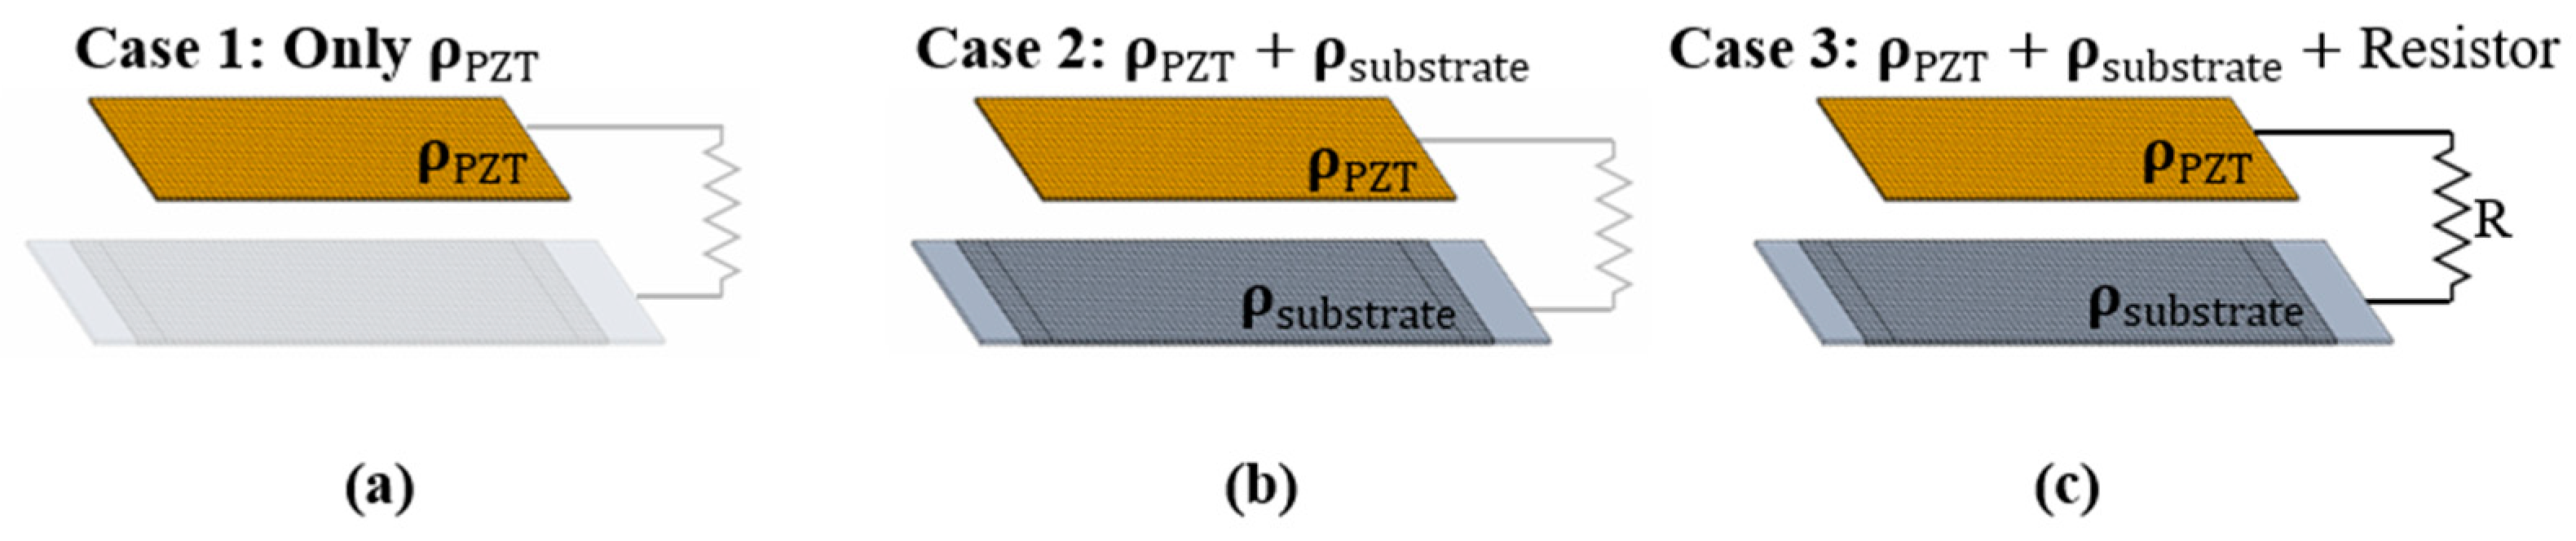
Figure 7.
Refined model of optimal topology of PZT (yellow) and substrate (grey) with ρi > 0.5, (a) top view (b) bottom view, and simplified model with simple continuous shape, (c) top view (d) bottom view.
Figure 7.
Refined model of optimal topology of PZT (yellow) and substrate (grey) with ρi > 0.5, (a) top view (b) bottom view, and simplified model with simple continuous shape, (c) top view (d) bottom view.
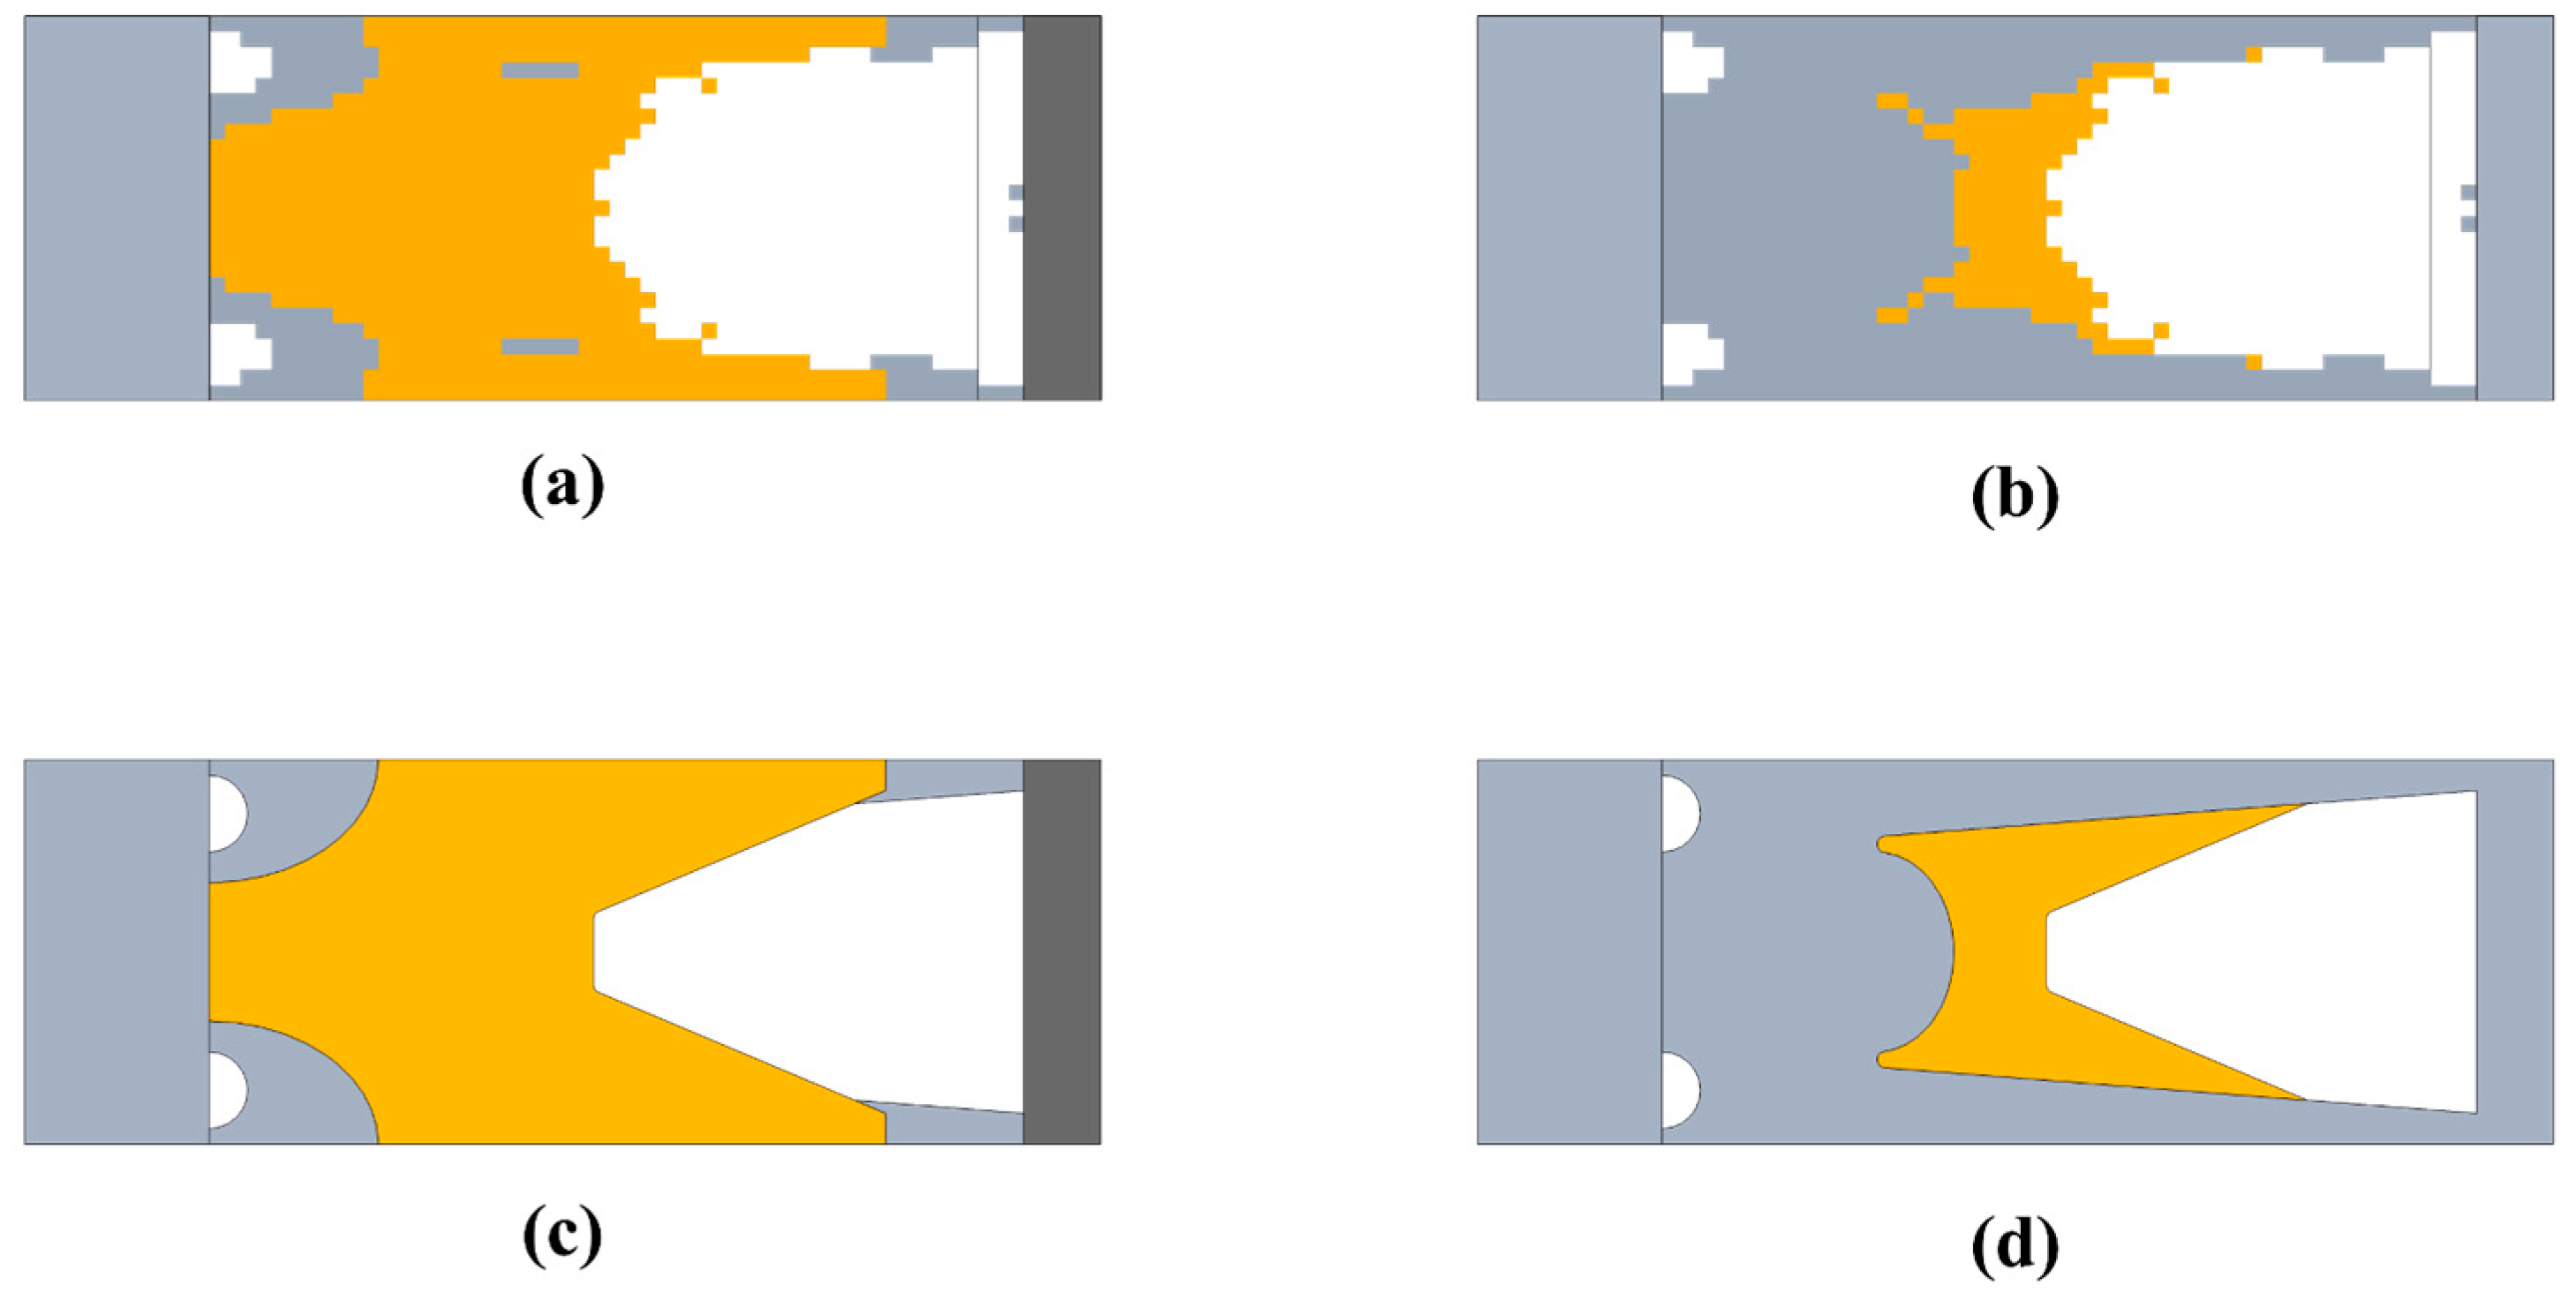
Figure 8.
Simplified parametric model and its design variables: (a) top view, (b) side view, and (c) bottom view.
Figure 8.
Simplified parametric model and its design variables: (a) top view, (b) side view, and (c) bottom view.
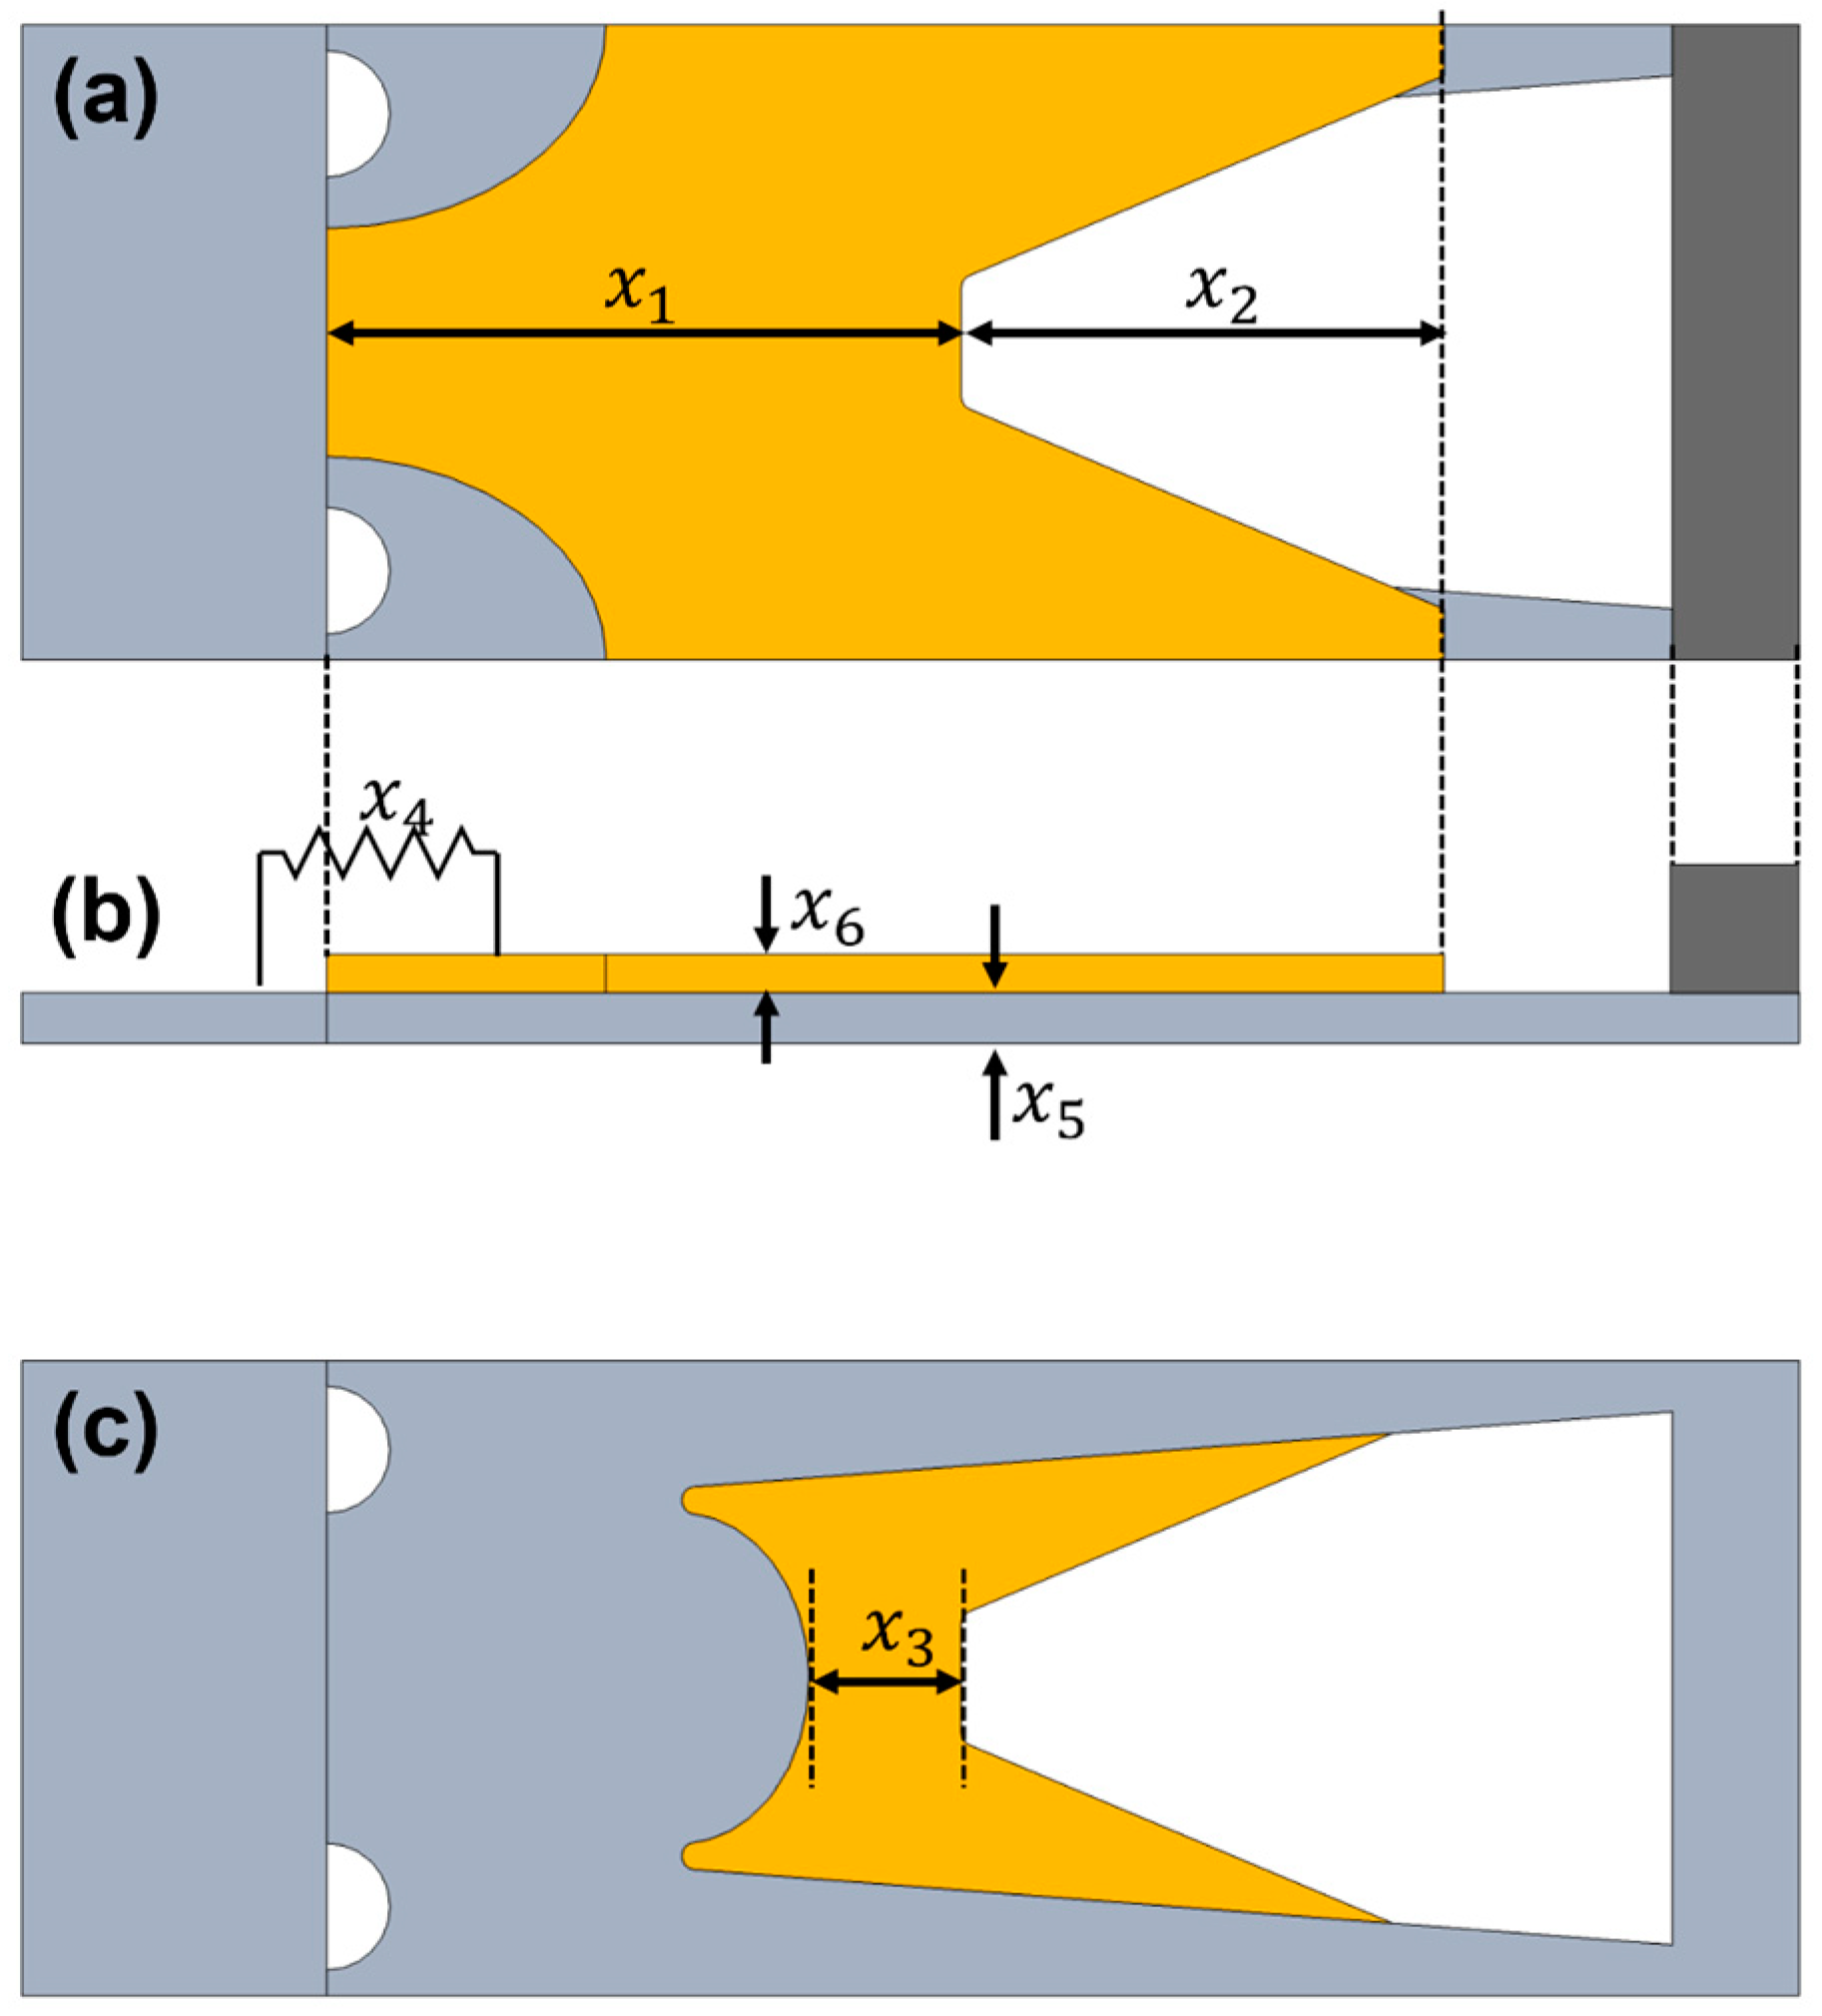
Figure 9.
Design change in optimal design of simplified parametric model: (a) top view, (b) side view, and (c) bottom view.
Figure 9.
Design change in optimal design of simplified parametric model: (a) top view, (b) side view, and (c) bottom view.


Table 1.
Experimental results and simulation results.
| Experiment | Calibrated Model | Error [%] | ||||||
|---|---|---|---|---|---|---|---|---|
| 1 | 2 | 3 | 4 | 5 | Mean | |||
| Resonance [Hz] | 75.5 | 76 | 75.2 | 75.1 | 74.1 | 75.18 | 75.52 | 0.45 |
| RMS voltage [V] | 33.6 | 33.2 | 34 | 32.8 | 32 | 33.12 | 33.24 | 0.36 |
Table 2.
Material properties of the PEH and clamping jig.
| Component | Material Property | Value |
|---|---|---|
| PZT ceramic (PZT-5H) | Density () | |
| Dielectric constants: | ||
| Piezoelectric charge constants (): | ||
| Substrate steel | Density () | |
| Young’s modulus (): | ||
| Tip magnet | Density () | |
| Clamping jig | Young’s modulus (): | 2.0509 |
Table 3.
Definition of design domain for case studies.
| Case No. | PZT Material | Substrate Material | Resistor |
|---|---|---|---|
| 1 | O | X | |
| 2 | O | O | |
| 3 | O | O | O |
Table 4.
Topology optimization results ().
| Case No. | PZT Domain | Substrate Domain |
|---|---|---|
| 1 |  | N/A |
| 2 | 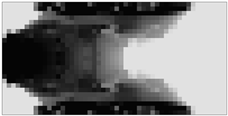 | 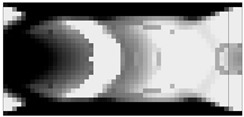 |
| 3 | 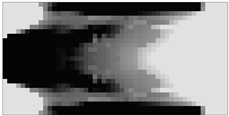 | 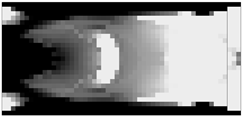 |
Table 5.
The power of each of the optimal topology impedance matching results.
| Performance | Case 1 | Case 2 | Case 3 |
| ] | 1.0124 | 3.3977 | 8.6929 |
| ] | 1.2071 | 4.5981 | |
| ] | 935 | 204 | 163 |
| ] | 105.68 | 70.32 | 87.75 |
| ] | 53.31 | 49.24 | 61.93 |
Table 6.
Description of design variables and design bounds.
| Variable | Description | Lower Bound | Initial Design | Upper Bound |
|---|---|---|---|---|
| PZT center length | ||||
| PZT shaving length | ||||
| Space margin | ||||
| Resistor | ||||
| Substrate thickness, discrete | ||||
| PZT thickness, discrete |
Table 7.
Size optimization comparison between simplified and optimal model.
| Variables | Simplified Model | Optimal Model |
|---|---|---|
| Power @ 60 Hz | ||
| Substrate stress @ 60 Hz | ||
| PZT stress @ 60 Hz |
Table 8.
Performance comparison with recently studied PEH.
| Reference | Piezoelectric Material | Resonance Frequency [Hz] |
Acceleration |
Volume |
Power |
Power Density |
|---|---|---|---|---|---|---|
| A. Anand et al. [32] | BaTiO3 | 98.59 | 1 | 4.31 | 7.15 | 1.66 |
| O. Pertin et al. [33] | PZT-5H | 150.3 | 0.9 | 753 | 3210 | 4.26 |
| B. Debnath et al. [34] | PZT-5H | 28.6 | 0.07 | 1.89 | 2.19 | 1.16 |
| Y. Hu et al. [35] | PZT | 45.37 | 2 | 32 | 241.25 | 7.54 |
| Y. Huang et al. [36] | PZT | 26.38 | 1 | 4.43 | 261.02 | 58.87 |
| This work | PZT-5H | 61.13 | 1 | 1264.1 | 8360 | 6.61 |
Disclaimer/Publisher’s Note: The statements, opinions and data contained in all publications are solely those of the individual author(s) and contributor(s) and not of MDPI and/or the editor(s). MDPI and/or the editor(s) disclaim responsibility for any injury to people or property resulting from any ideas, methods, instructions or products referred to in the content. |
© 2023 by the authors. Licensee MDPI, Basel, Switzerland. This article is an open access article distributed under the terms and conditions of the Creative Commons Attribution (CC BY) license (https://creativecommons.org/licenses/by/4.0/).
Share and Cite
MDPI and ACS Style
Kim, T.; Kim, J.; Lee, T.H. Structure-Circuit Resistor Integrated Design Optimization of Piezoelectric Energy Harvester Considering Stress Constraints. Energies 2023, 16, 3766. https://doi.org/10.3390/en16093766
AMA Style
Kim T, Kim J, Lee TH. Structure-Circuit Resistor Integrated Design Optimization of Piezoelectric Energy Harvester Considering Stress Constraints. Energies. 2023; 16(9):3766. https://doi.org/10.3390/en16093766
Chicago/Turabian StyleKim, Taekyun, Jihoon Kim, and Tae Hee Lee. 2023. "Structure-Circuit Resistor Integrated Design Optimization of Piezoelectric Energy Harvester Considering Stress Constraints" Energies 16, no. 9: 3766. https://doi.org/10.3390/en16093766
Note that from the first issue of 2016, this journal uses article numbers instead of page numbers. See further details here.