Article

Numerical Study of the Erosion Distribution of Sulfur-Containing Particulate Gas in 90-Degree Gathering Elbow

1
Energy College, Chengdu University of Technology, Chengdu 610059, China
2
CDB Gas Mine of PetroChina Southwest Oil and Gas Field Company, Dazhou 635000, China
*
Authors to whom correspondence should be addressed.
Energies 2023, 16(6), 2707; https://doi.org/10.3390/en16062707
Submission received: 19 January 2023 / Revised: 8 March 2023 / Accepted: 11 March 2023 / Published: 14 March 2023

Abstract

:
The phenomenon of pipeline erosion dominated by sulfur particles has become a key research target for sulfur-containing gas-gathering pipelines. Gas-solid two-phase flow of sulfur-containing gases is simulated with a coupled CFD-DPM model in this paper. The Realizable k-ε turbulence model was used to determine the changes in the complex flow field and the Euler-Lagrange method was used to describe the specific trajectory of sulfur particles in the complex flow field. The main erosion trace distribution and the effect of secondary flow effects at the elbow were analyzed and the erosion distribution pattern was investigated for different curvature ratios, particle sizes, and pipe diameters. The results show that the formation of erosion along the tip of the V-shaped erosion trace on the outlet sidewall of the elbow may be related to secondary flow effects. The increase of the curvature ratio RD reduces the erosion intensity of the maximum erosion area, but subsequent increase will result in new secondary erosion trace near the outlet of the elbow and reach the maximum when RD = 8. Variations in particle size will have a significant effect on the extent of the erosion distribution, causing the main erosion distribution of the elbow to vary between 48.2° and 84.2°, while variations in pipeline diameter will have a lesser effect. The Stokes number can also be reduced by controlling the variation in particle size and pipe diameter to alter the force profile on the particles and reduce the erosion effect.

1. Introduction

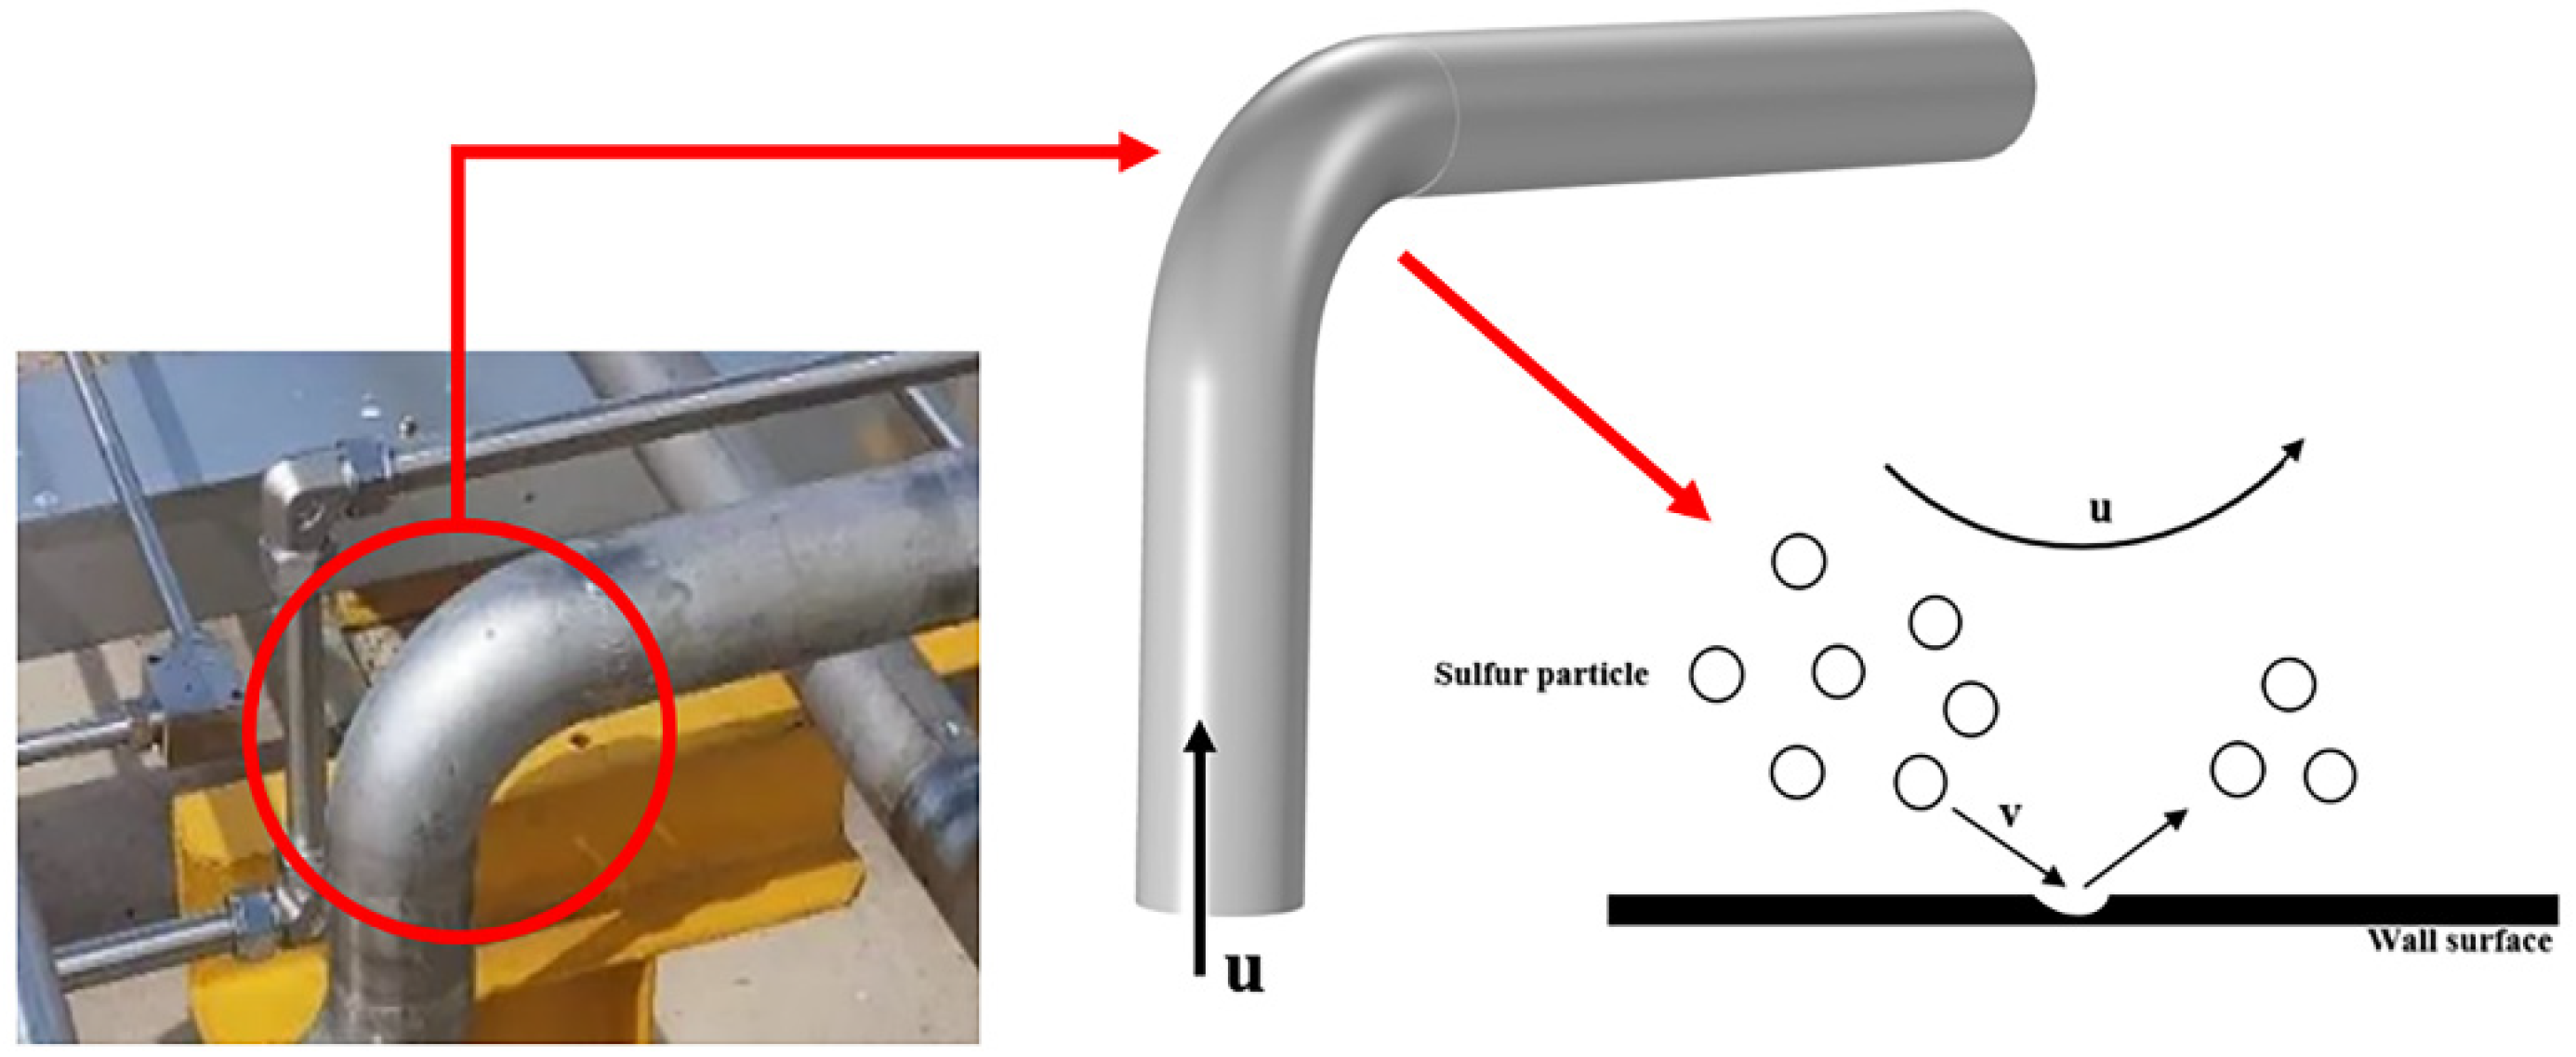
During the transportation of sulfur-containing gases in the gathering pipeline, sulfur particles are precipitated from the gas mixture due to changes in fluid temperature and pressure, which can cause serious erosion damage to pipelines, pipe fittings, throttle valves, and other facilities when carried by high-velocity fluids [1]. Pipeline failures due to erosion formed by sulfur-containing particles account for around 30–40% of the solid particle erosion types each year, which not only reduces the efficiency of the product development and transportation process of sulfur-containing gas reservoirs but also causes significant economic damage and safety hazards. Combined with the current research and development concerning the erosion mechanism of solid particles, the complex variation in erosion behavior of sulfur particles is associated with many influencing factors, such as the characteristics of fluid carrier, the physical properties of erosion particles, the wall materials and the geometry of pipelines [2]. The variation in these influences can cause huge differences in erosion, for example, it has been found that the degree of erosion damage by particles at the elbow can be more than 50 times higher than that of the straight pipe [3]. Therefore, understanding the erosion patterns of sulfur-containing particulate gas on gas well-gathering pipelines is a prerequisite to avoid exacerbating the damage caused by the erosion effect and to increase the service life of the pipe column, which is conducive to setting the optimum gas well-gathering pipeline parameters.
Finnie [4] discovered through erosion experiments that metal and ceramic targets show different erosion patterns at different impact velocities, impact angles, and particle size impacts, and proposed the first erosion theory for plastic materials—the micro-cutting theory, which was later modified to obtain a mathematical formula for the erosion rate at changing incidence angles for calculating the magnitude of volume loss at the wall. Bitter [5] analyzed the erosion pattern of materials at different erosion angles from the perspective of energy balance and proposes a theory of deformation wear, which explains the total erosion loss as the sum of cutting wear and deformation wear. Levy [6] used the step-by-step erosion method to carry out extensive experiments to propose a theory of forging and extrusion that restored the evolution of erosion damage. The indentation fracture theory proposed by Evans [7] described the variation of cracks on the surface of the target material during particle erosion, and these theories have been proposed to better explain the erosion phenomenon on the basis of Finnie’s theory. As the oil and gas industry developed, the phenomenon of solid particle erosion within pipelines came to the fore, based on the development of a preliminary material erosion theory, and early publications by Berger et al. [8] and Smith [9] provided an extensive theoretical study of flow in bent pipelines. Ahlert et al. [10] established erosion models related to pipeline materials, particulate matter properties, and wear angles through various types of pipeline wear experiments. The mathematical model of erosion established by Oka [11] considers the parameters of particle hardness and material properties and better predicts the erosion behavior of different attributes of particles on different pipes. The E/CRC erosion rate model [12] uses the laser Doppler velocimeter to measure the flow field distribution and correct the velocity coefficient on the basis of the Finnie model, which can more accurately describe the flow field distribution in the gas-solid two-phase flow model. The DNV RP-0501 model [13] is established by the DNV Classification Society based on a large number of experimental data. It is proposed that the erosion rate and the particle velocity are a power exponential relationship, which is widely used in actual field applications and is mostly used for erosion prediction of industrial large pipe diameters. Rehan Khan [
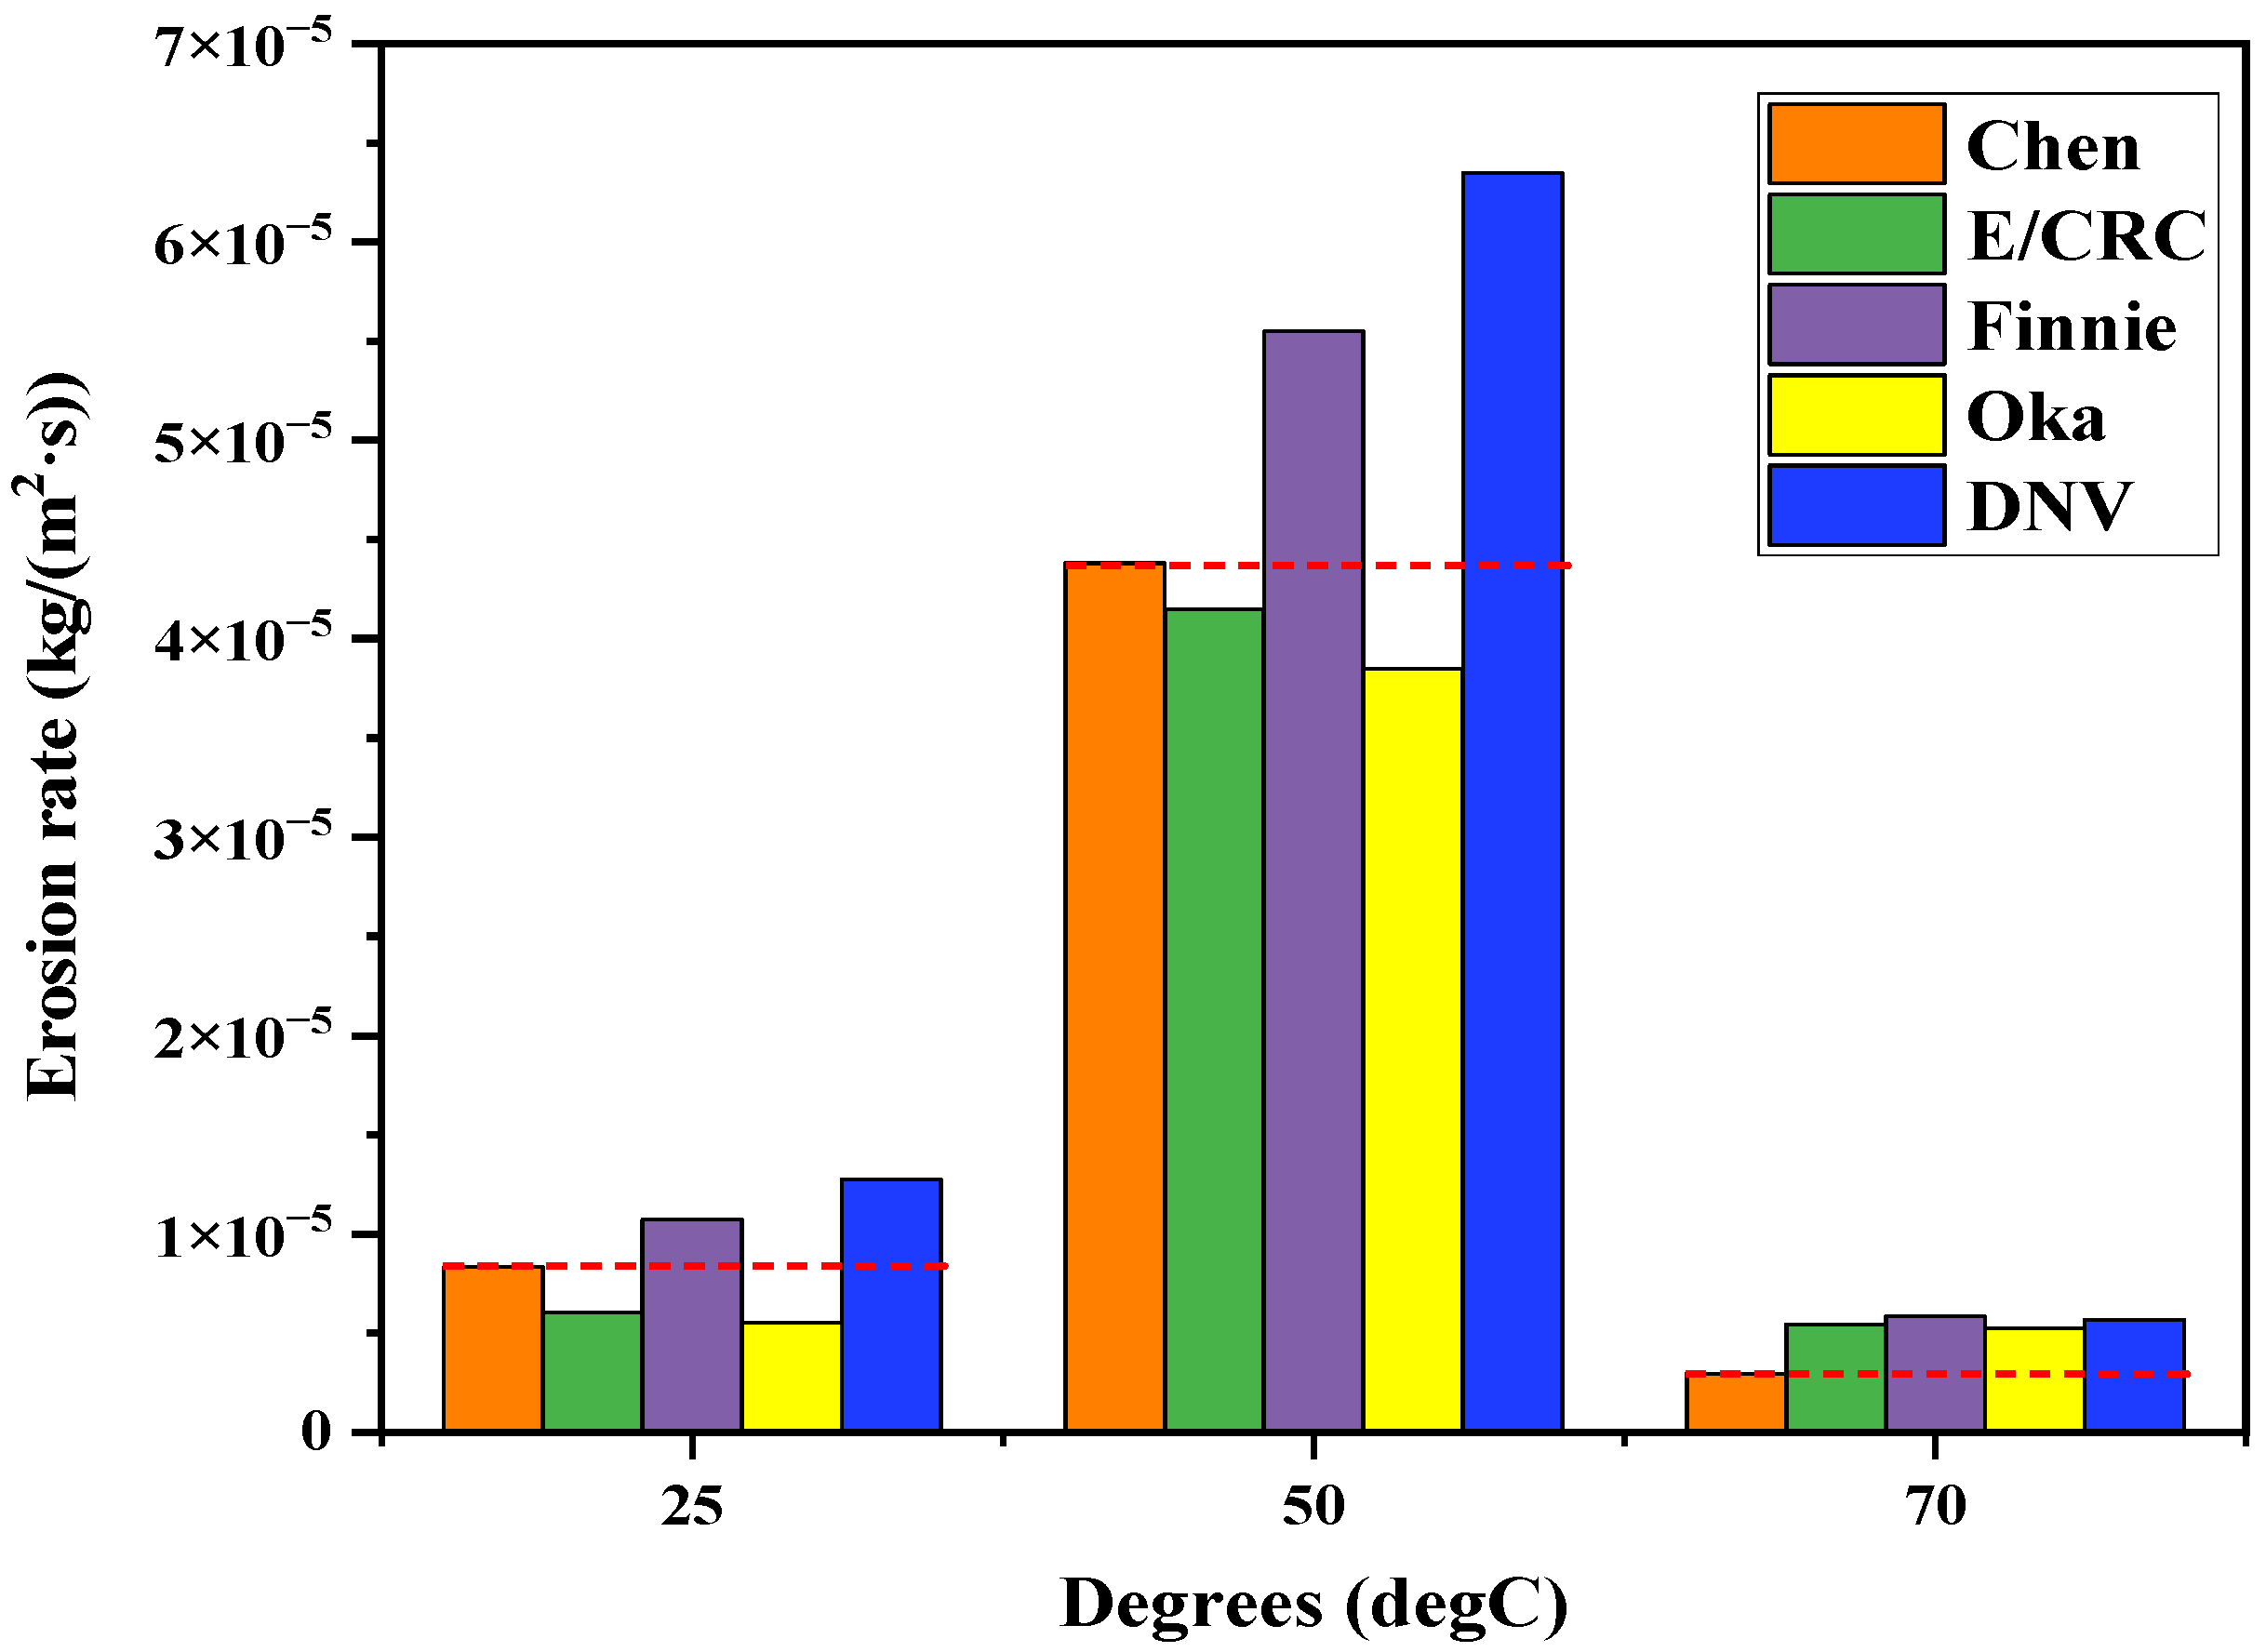
14] quantified the influence of different elbow angles on erosion distribution under the condition of sand erosion by a new experimental program, and illustrated three main erosion mechanisms of elbow surface (pitting, ploughing, and cutting), which further perfected the research on erosion and wear mechanism under the condition of multiphase flow. Currently, the DNV and E/CRC erosion models are the most commonly used in pipeline erosion studies, and both models are simple and similar in form for easy comparison in the study of erosion impact parameters.
Today’s computer fluid dynamics (CFD) techniques are widely used in various erosion simulation studies to describe the process of solid particle-wall collisions using the two-phase Euler-Lagrange tracking method, improving the accuracy and applicability of erosion models and parameter corrections and facilitating the development of pipeline erosion studies. Wang [15] modified some parameters on the basis of Ahlert’s model and established a new erosion prediction model for gas-solid two-phase flow by simulating the erosion phenomenon at the bend location of the pipe through CFD. The accuracy of calculating erosion rates for gas-solid two-phase flows was investigated by McLaury [16], Edwards [17] and Haugen et al. [18] They considered physical variables such as fluid properties, pipe geometry and established relationships between the parameters, although their studies on the effects of secondary flow effects and turbulence effects on solid particles were insufficient. Later, Bozzini et al. [19] used CFD simulations of erosion in 90° bends to explain the formation of secondary flow in bends and to investigate the effects of factors such as flow velocity and particle content on erosion patterns. Zeng [20] modified the partial erosion model based on CFD simulations considering the erosion effect of non-spherical particles by introducing a dimensionless constant to explain the effect of secondary flows, vortices and particle trajectories on the formation of partial erosion traces in the elbow. Zhang [21] used CFD to predict the particle erosion behavior of a 90° elbow under multiphase flow conditions based on Zeng’s study. The effects of secondary collisions, mean curvature, inertial forces, drag forces and Stokes number on the trajectories of sulfur particles were additionally investigated, and the main distribution locations of the severely eroded areas at the elbow were analyzed. Generally speaking, the flow of gas in gas well pipelines presents a high Reynolds number state, if the simulation using a laminar flow state will not truly reflect the movement process of particles; therefore, in recent years, scholars of erosion research have widely used a variety of 
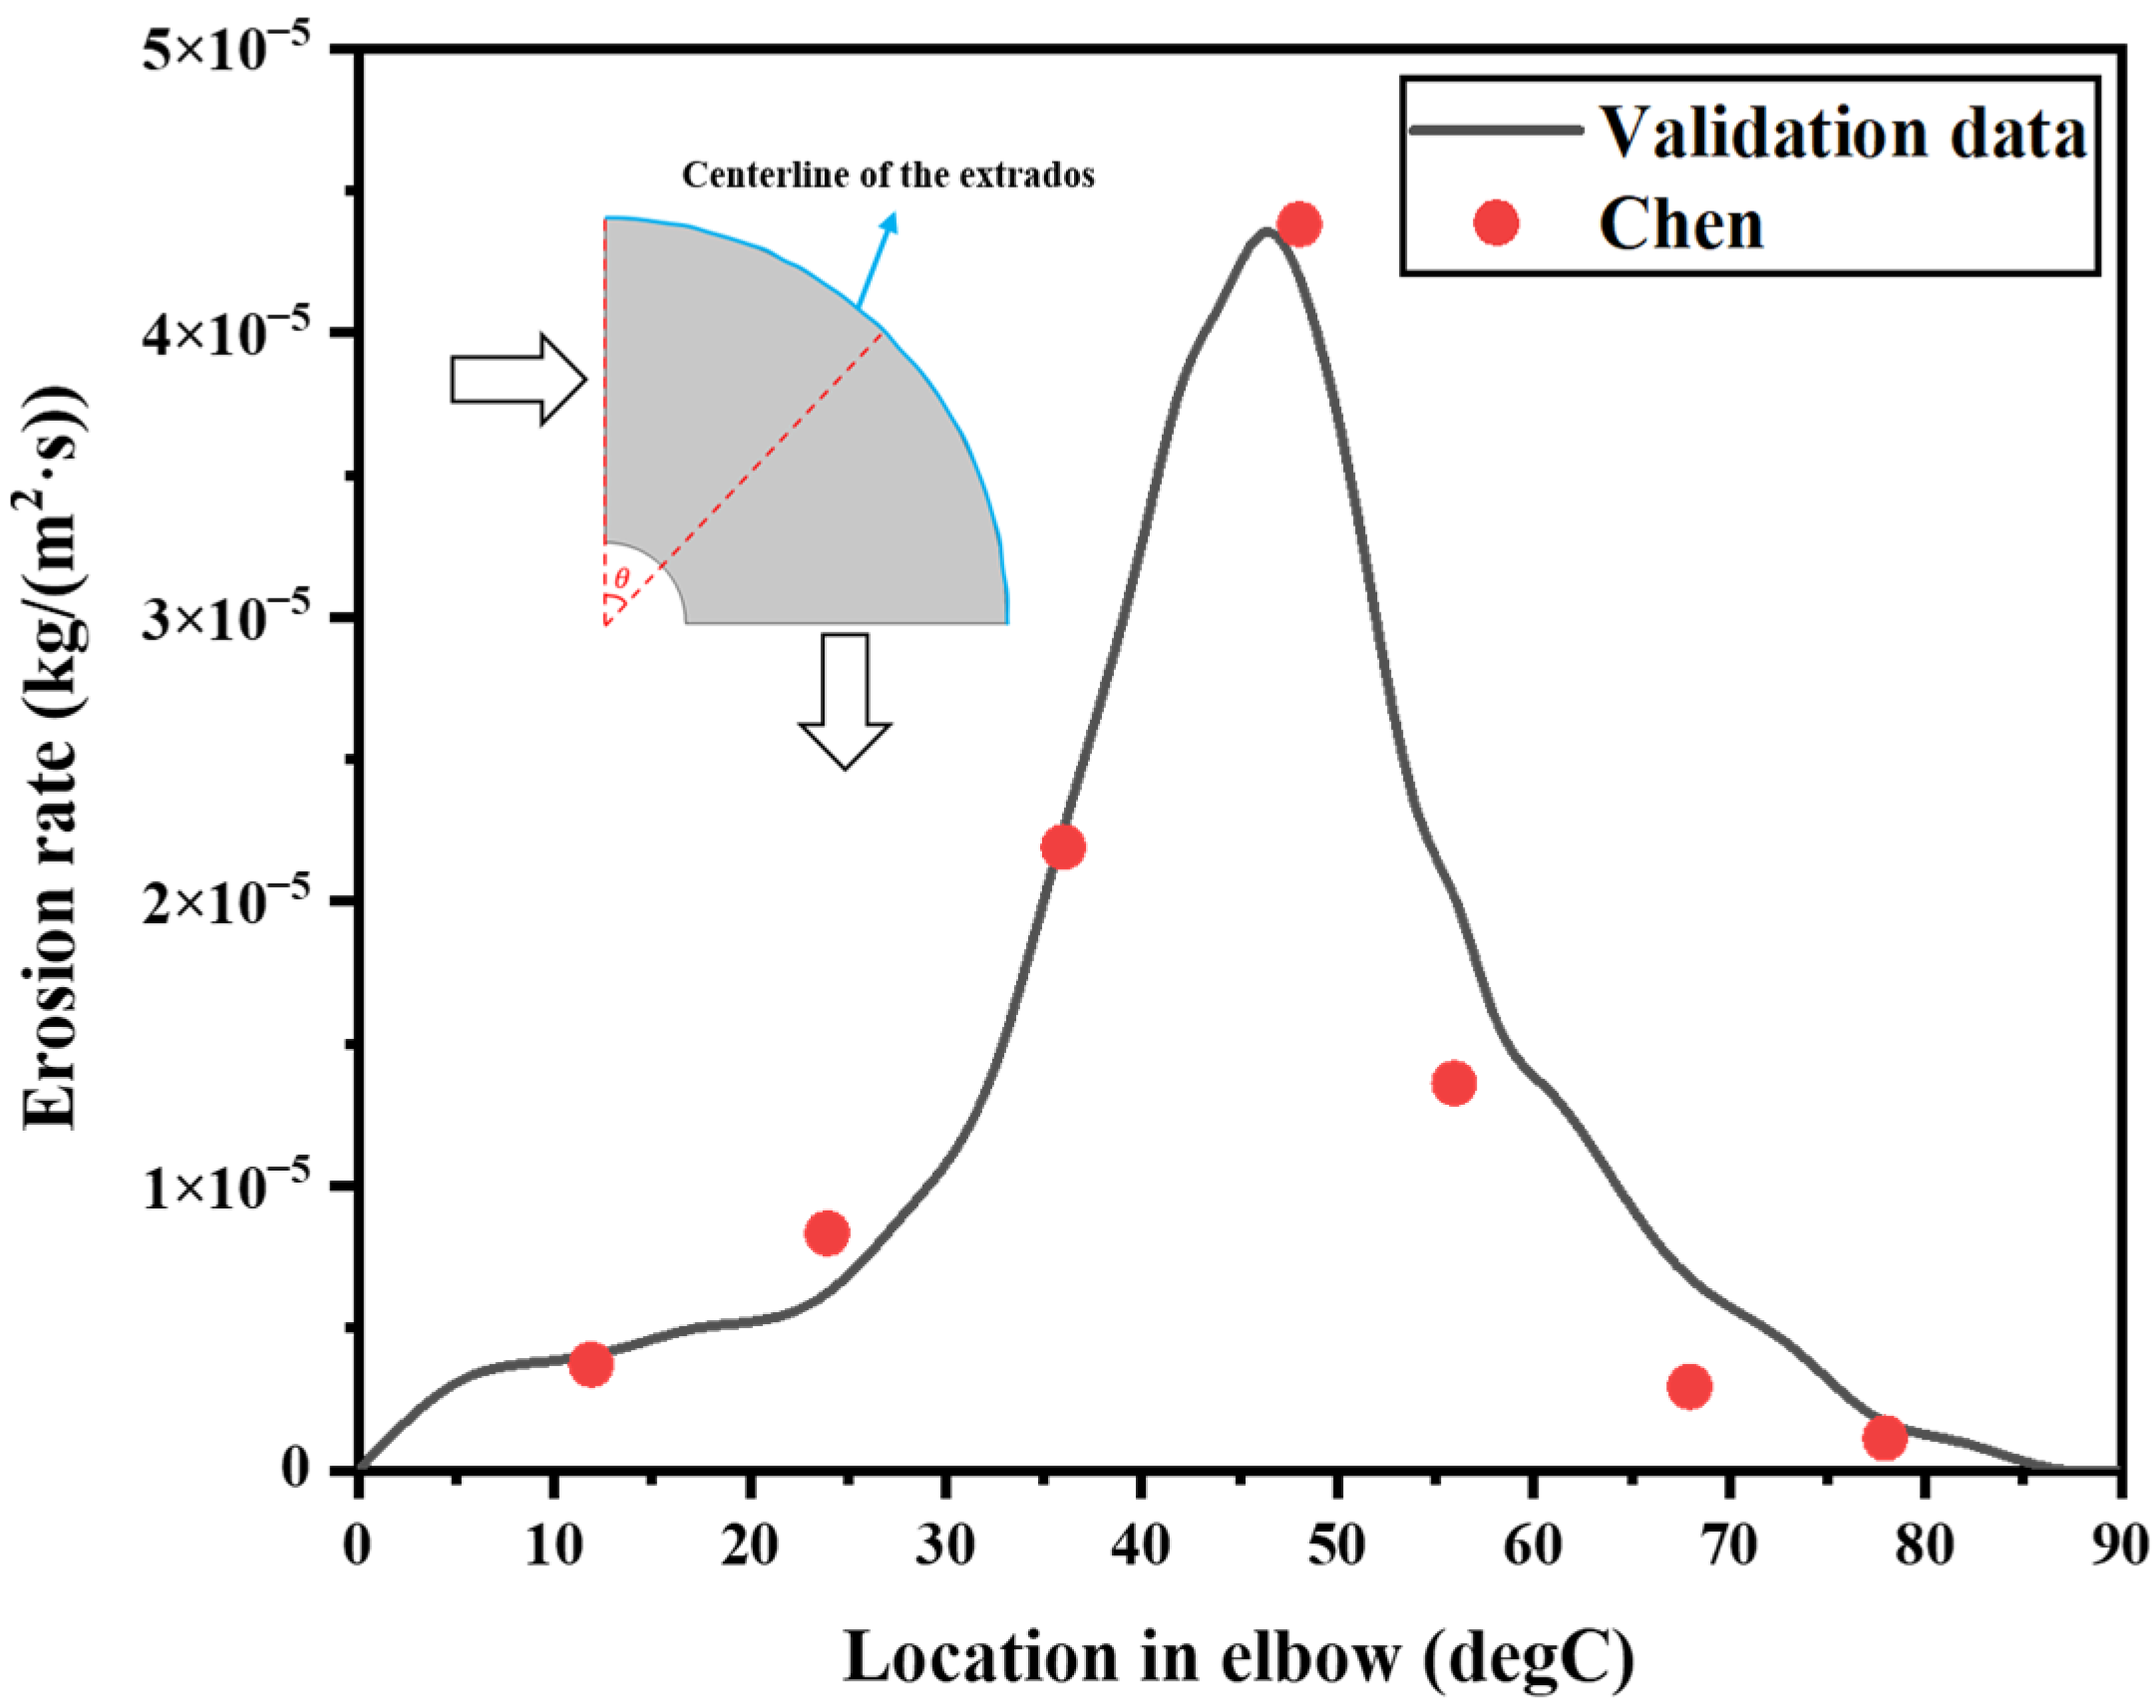
k-ε turbulence model of Reynolds-averaged Navier-Stokes (RANS) equations to simulate the fluid flow in the pipeline, which is important to improve the accuracy and reliability of solid particle erosion simulation. For example, Chen [22], Pei [23], Peng and Cao et al. [24] used RNAS of the k-ε turbulence model to calculate the erosion process of mud on the elbow and analyzed the effect of changes in fluid parameters on the erosion effect. Laín and Sommerfeld et al. [25] used a stochastic method to calculate a model of particle collisions with rough walls in turbulent transport, and in a subsequent study explained the forces involved, such as drag forces, gravity and lateral lift [26]. They later calculated the erosion of particles along horizontal to vertical elbows by combining the Euler-Lagrange method with an appropriate turbulence model via a two-way full coupling, considering the effect of inter-particle collisions on erosion [27]. Laín [28] has carried out three-dimensional numerical simulations of particle collisions in transportation pipelines by combining the Euler-Lagrange method with an adapted turbulence model to obtain the component streamlines of the gas velocity cross-section and to analyze the particle motion pattern and the variation of the collision frequency.
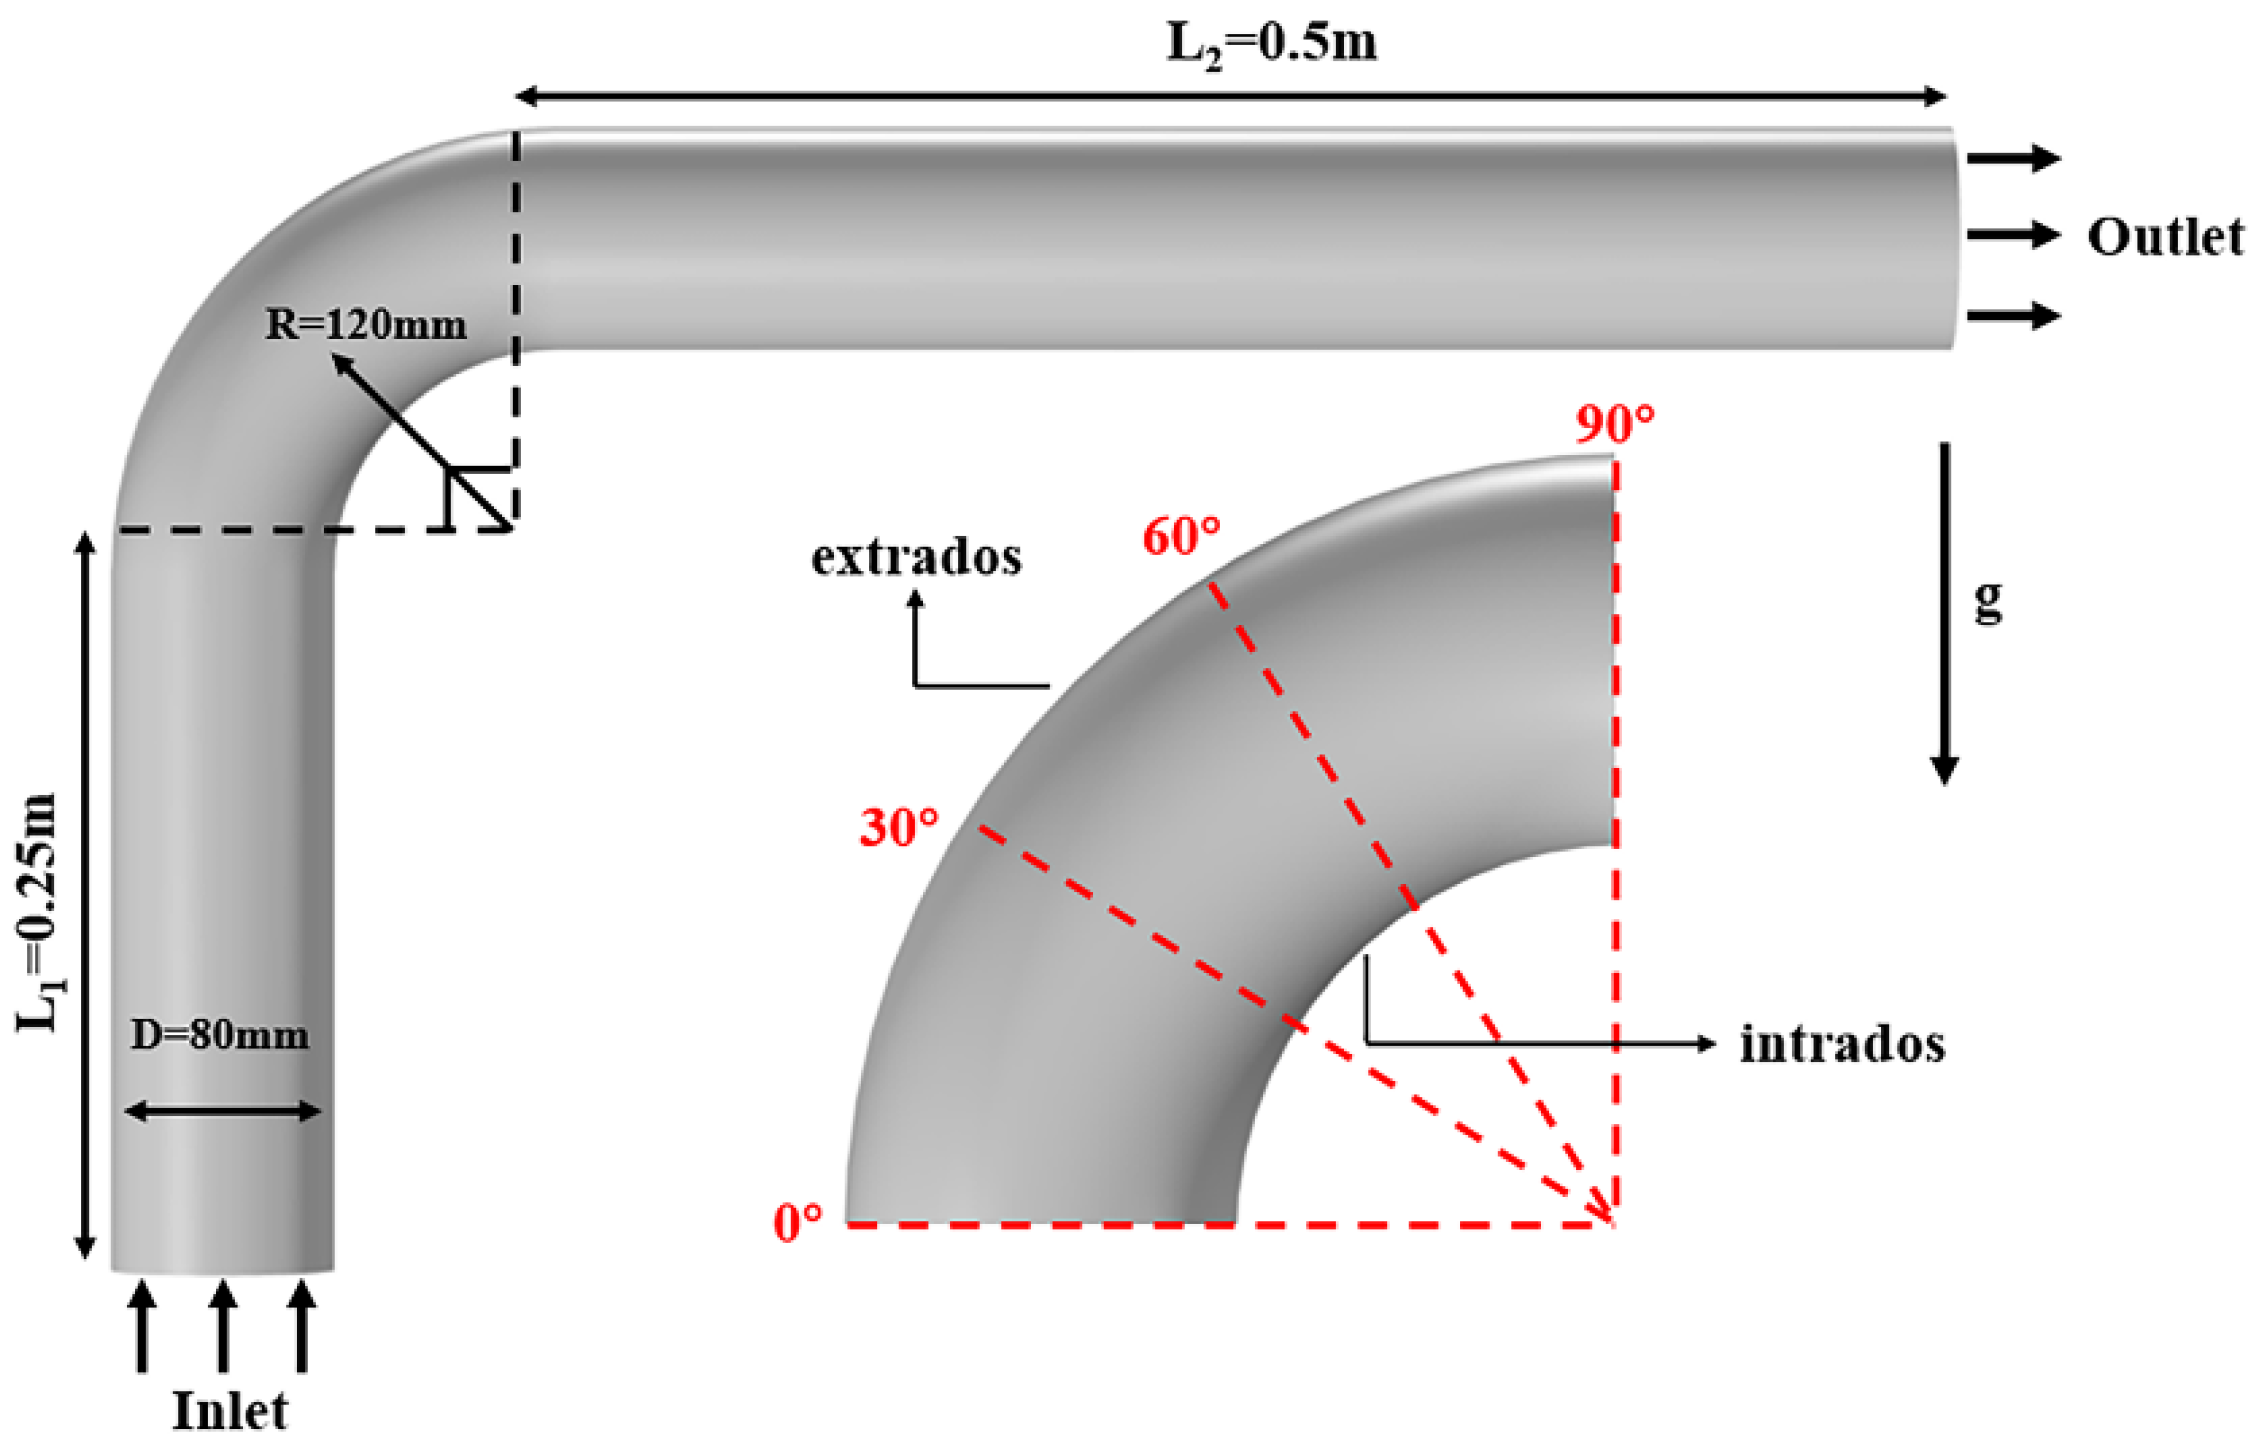
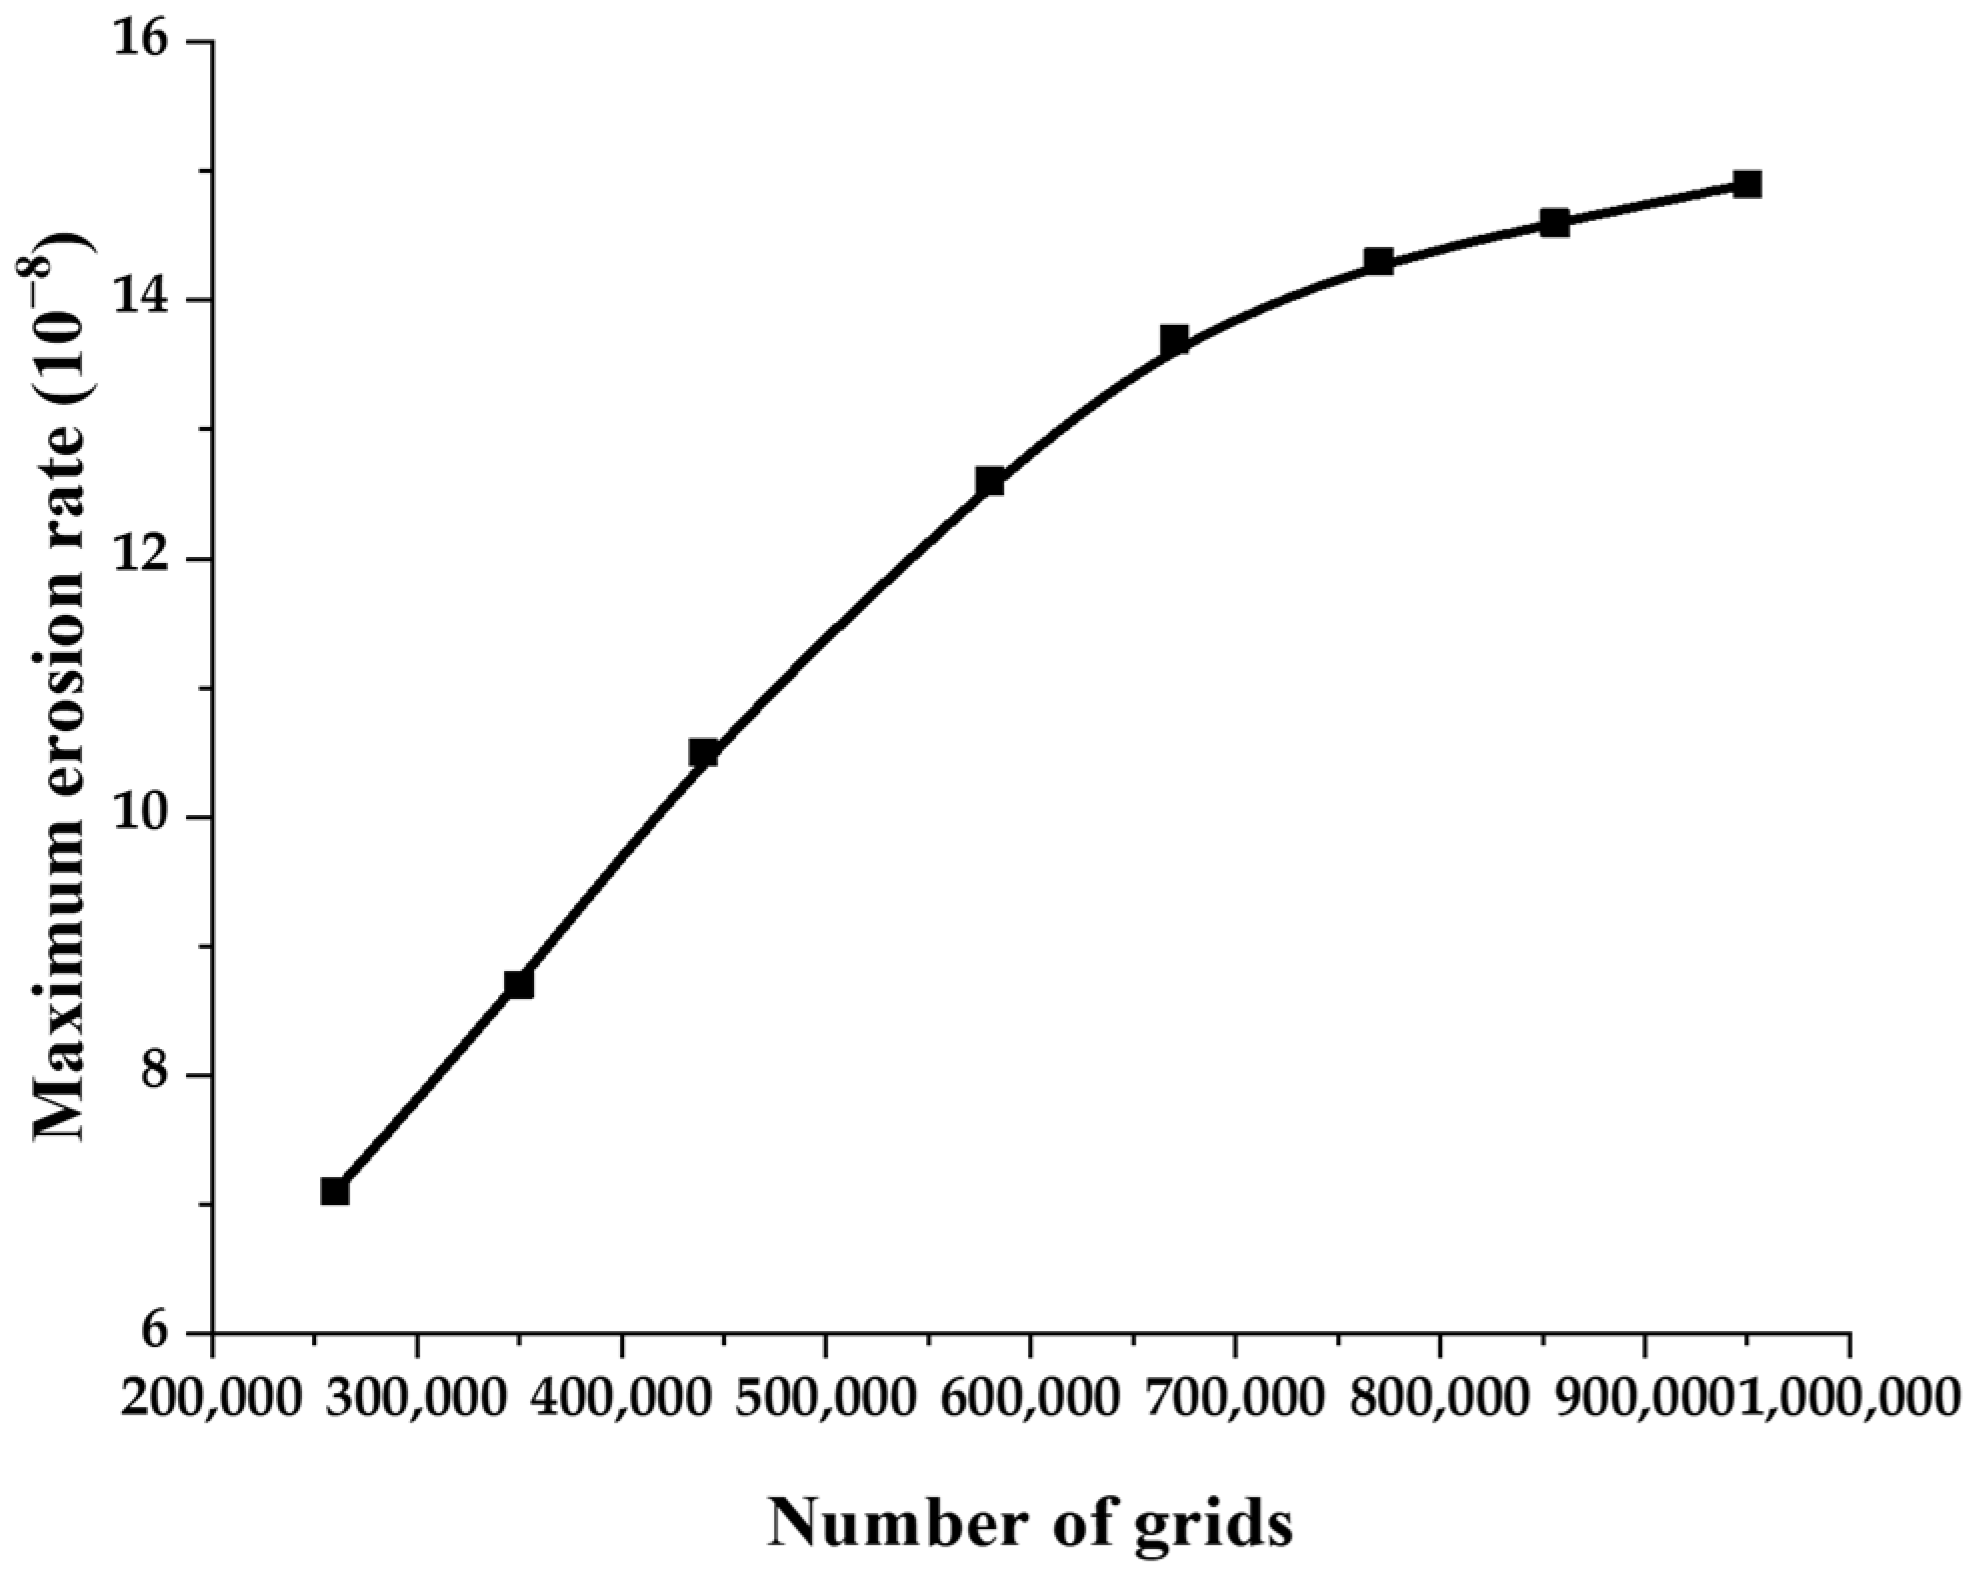
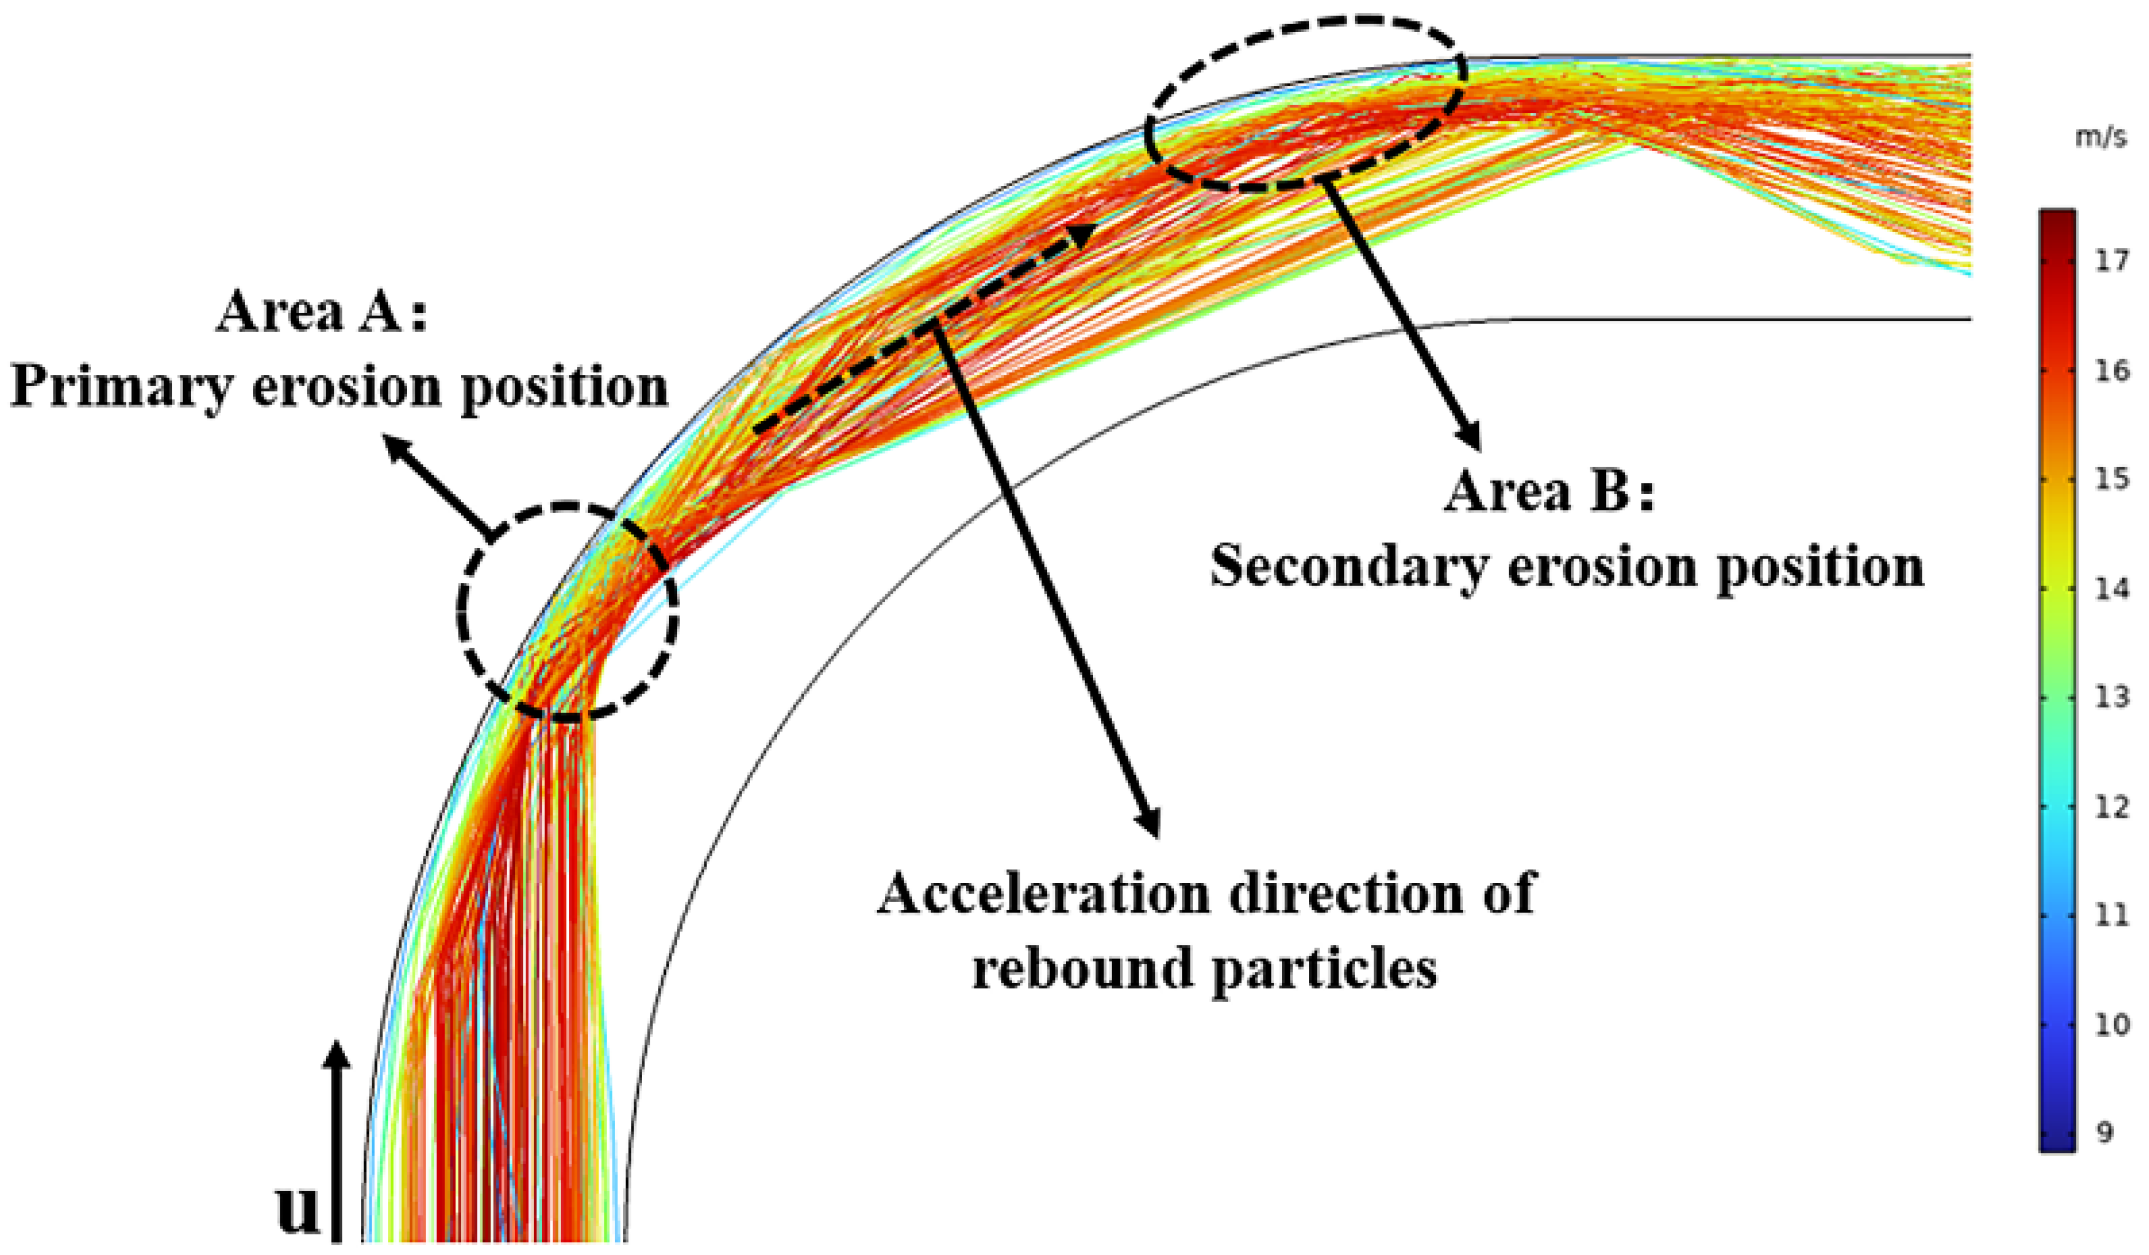
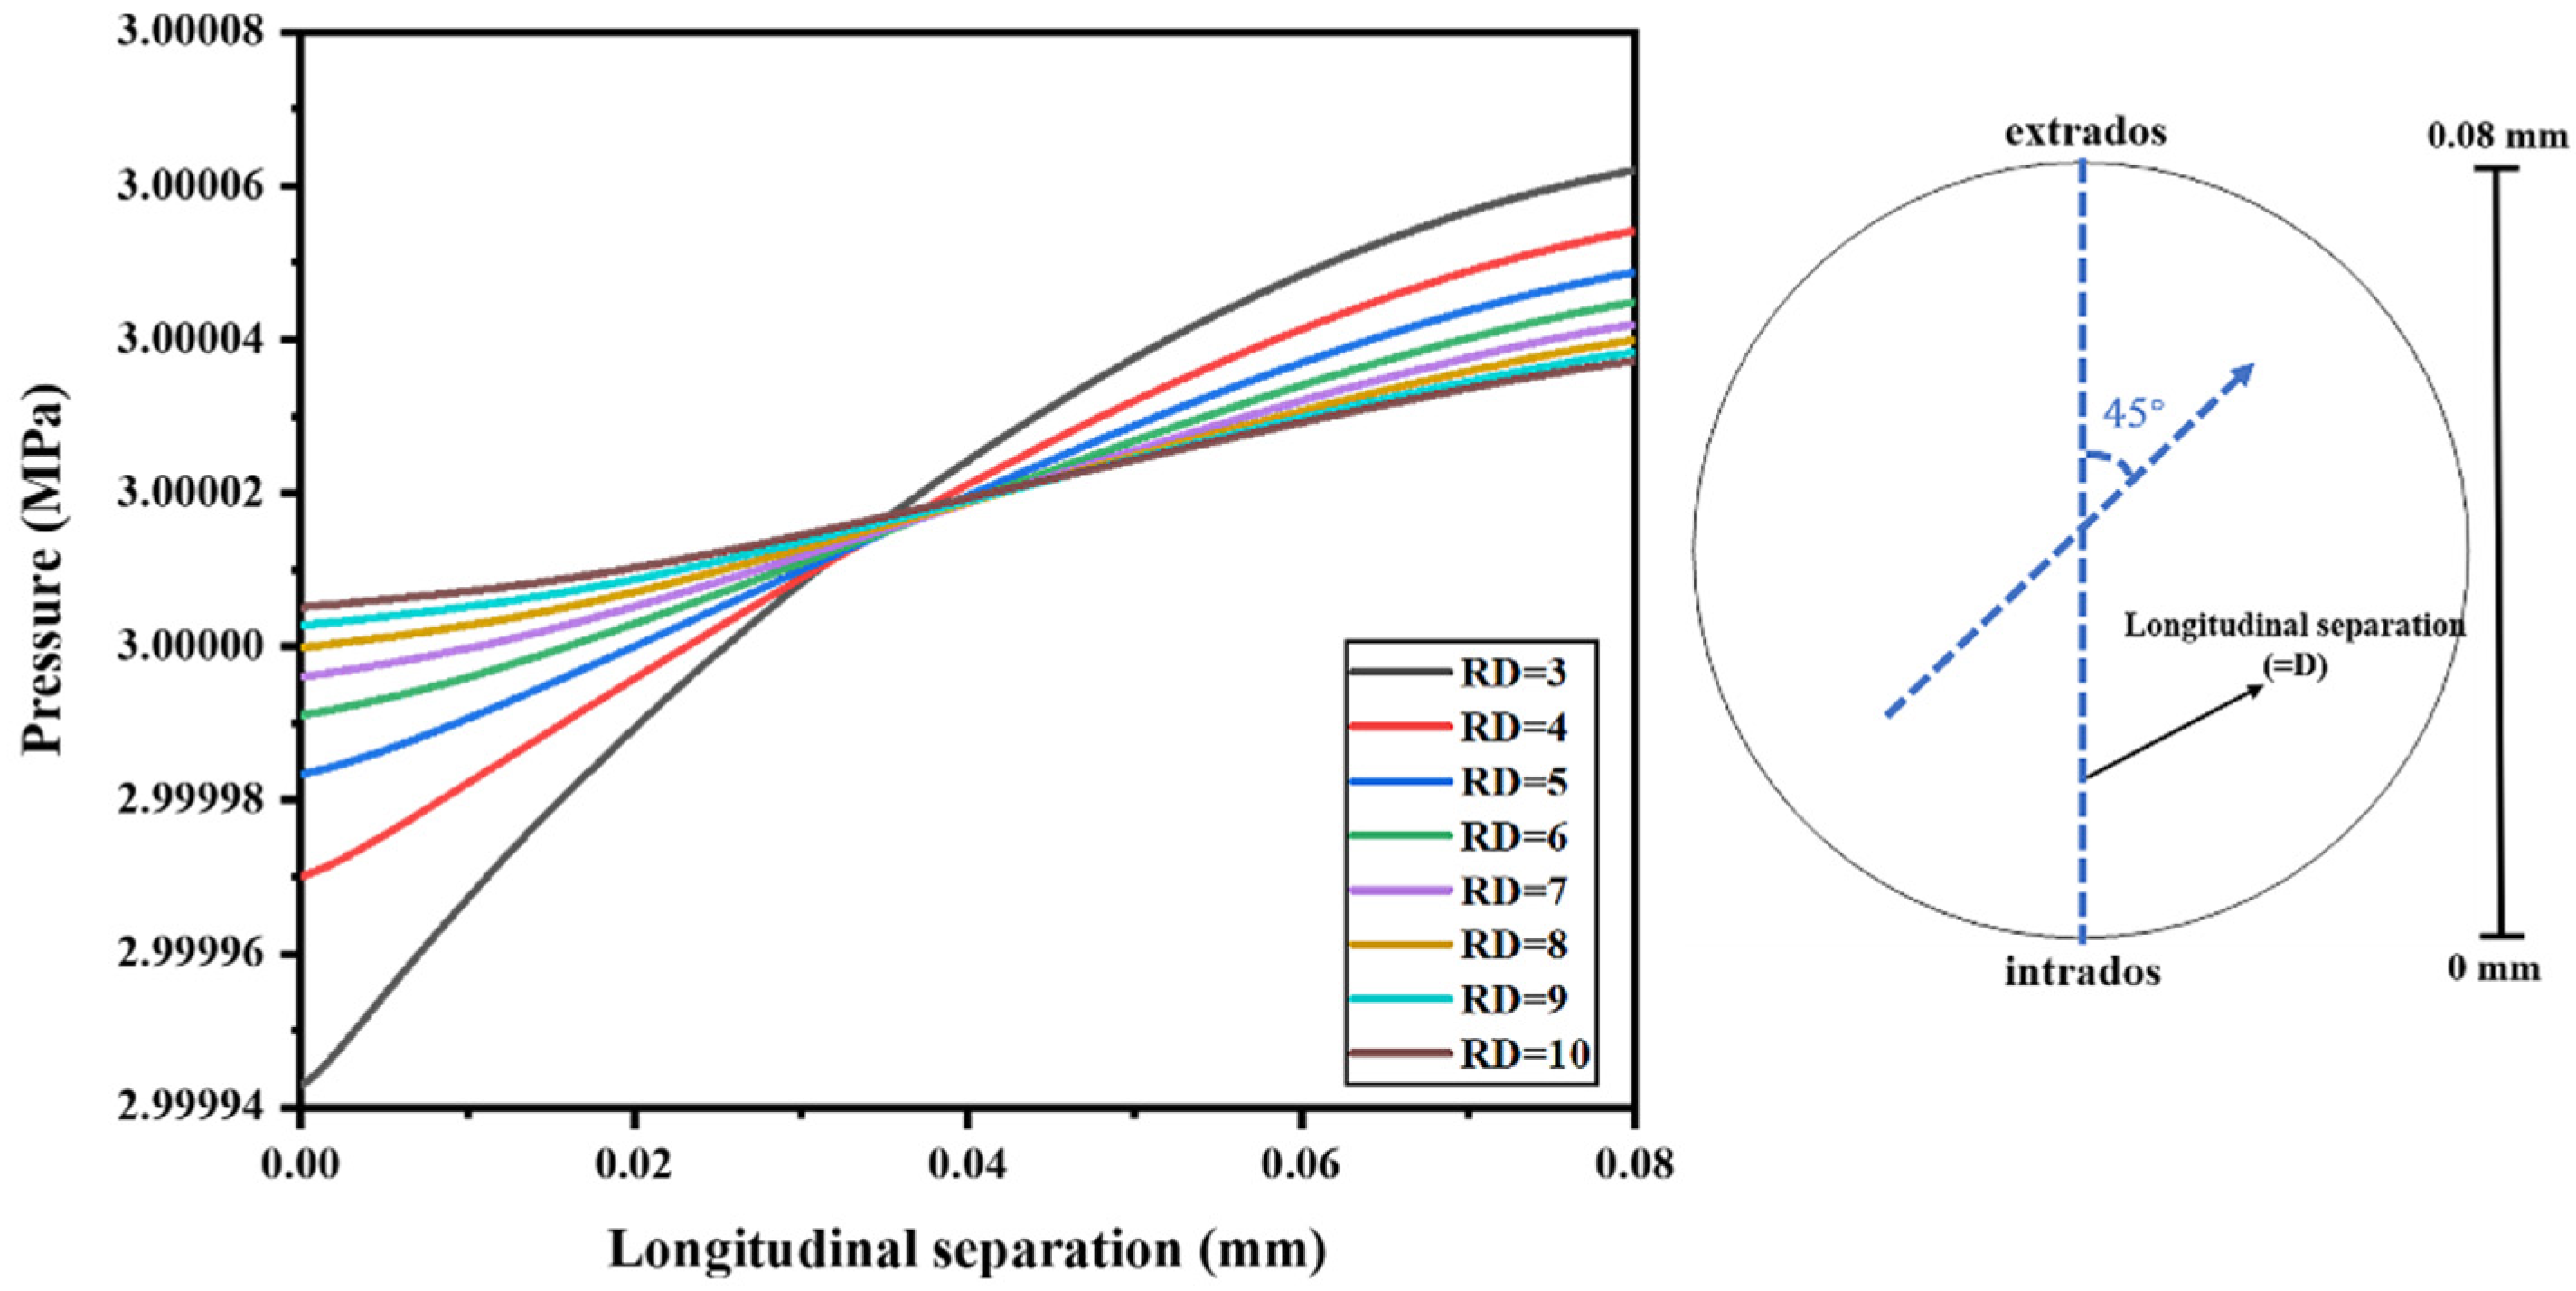
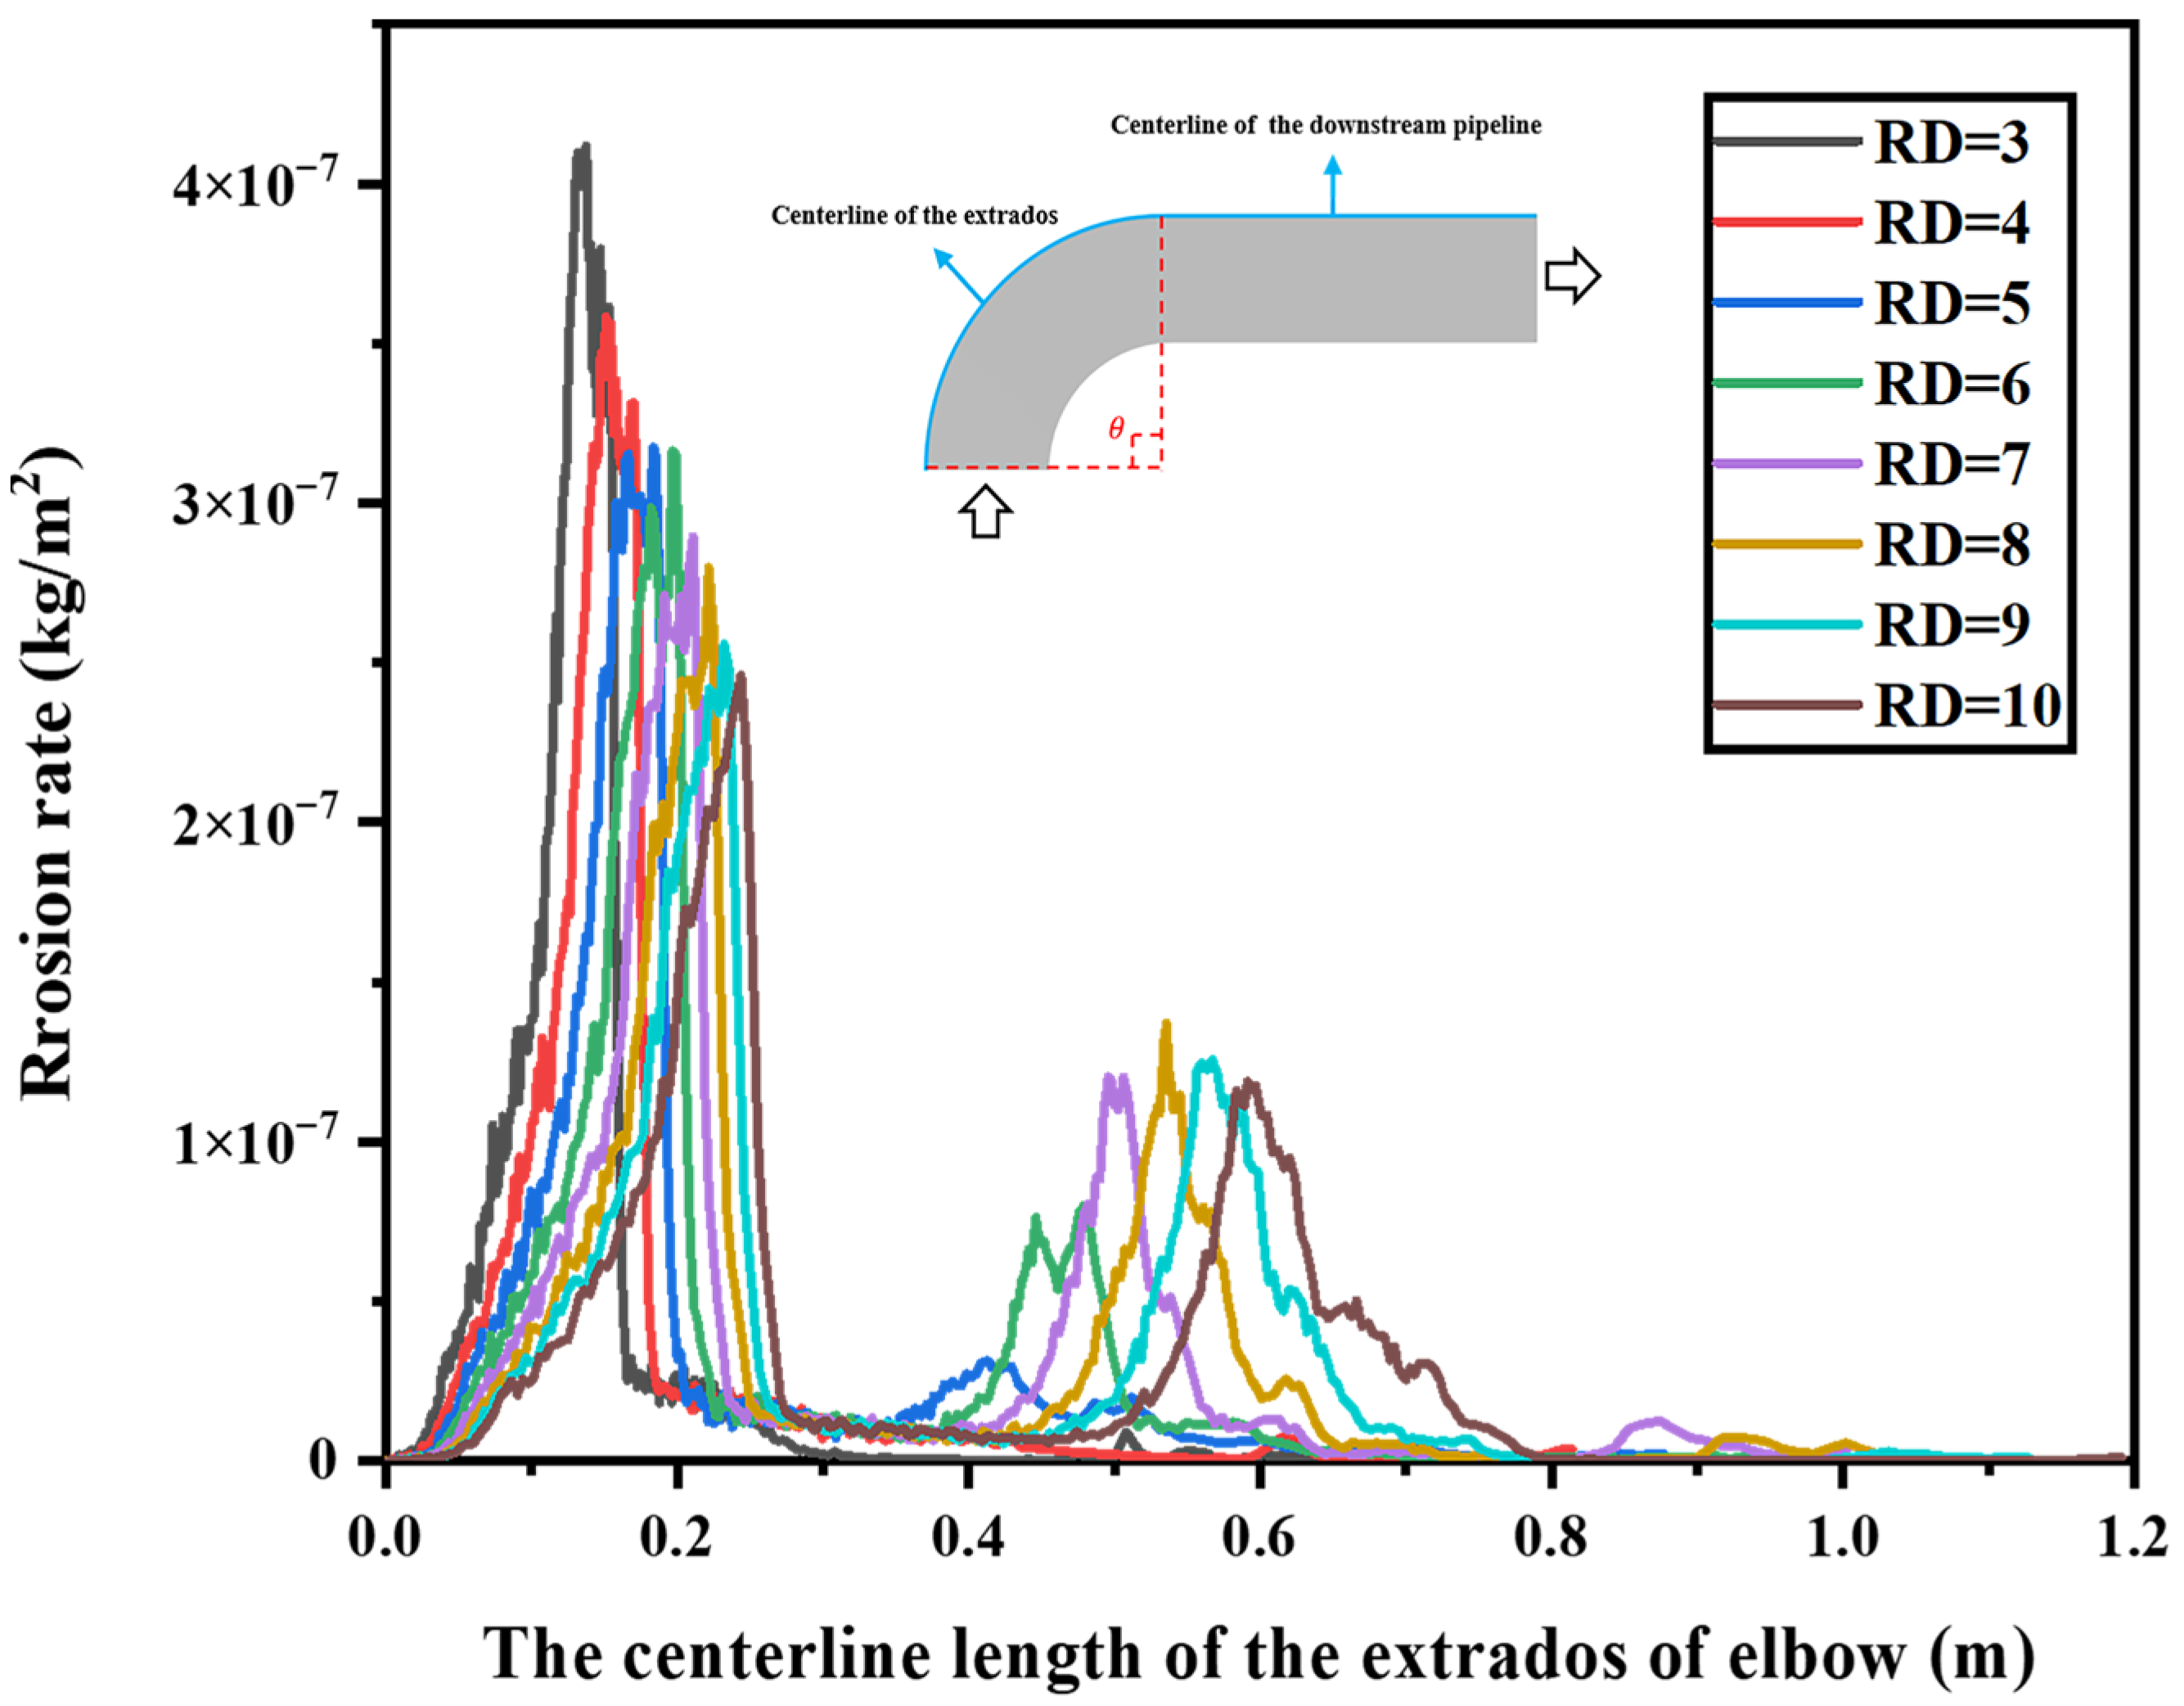
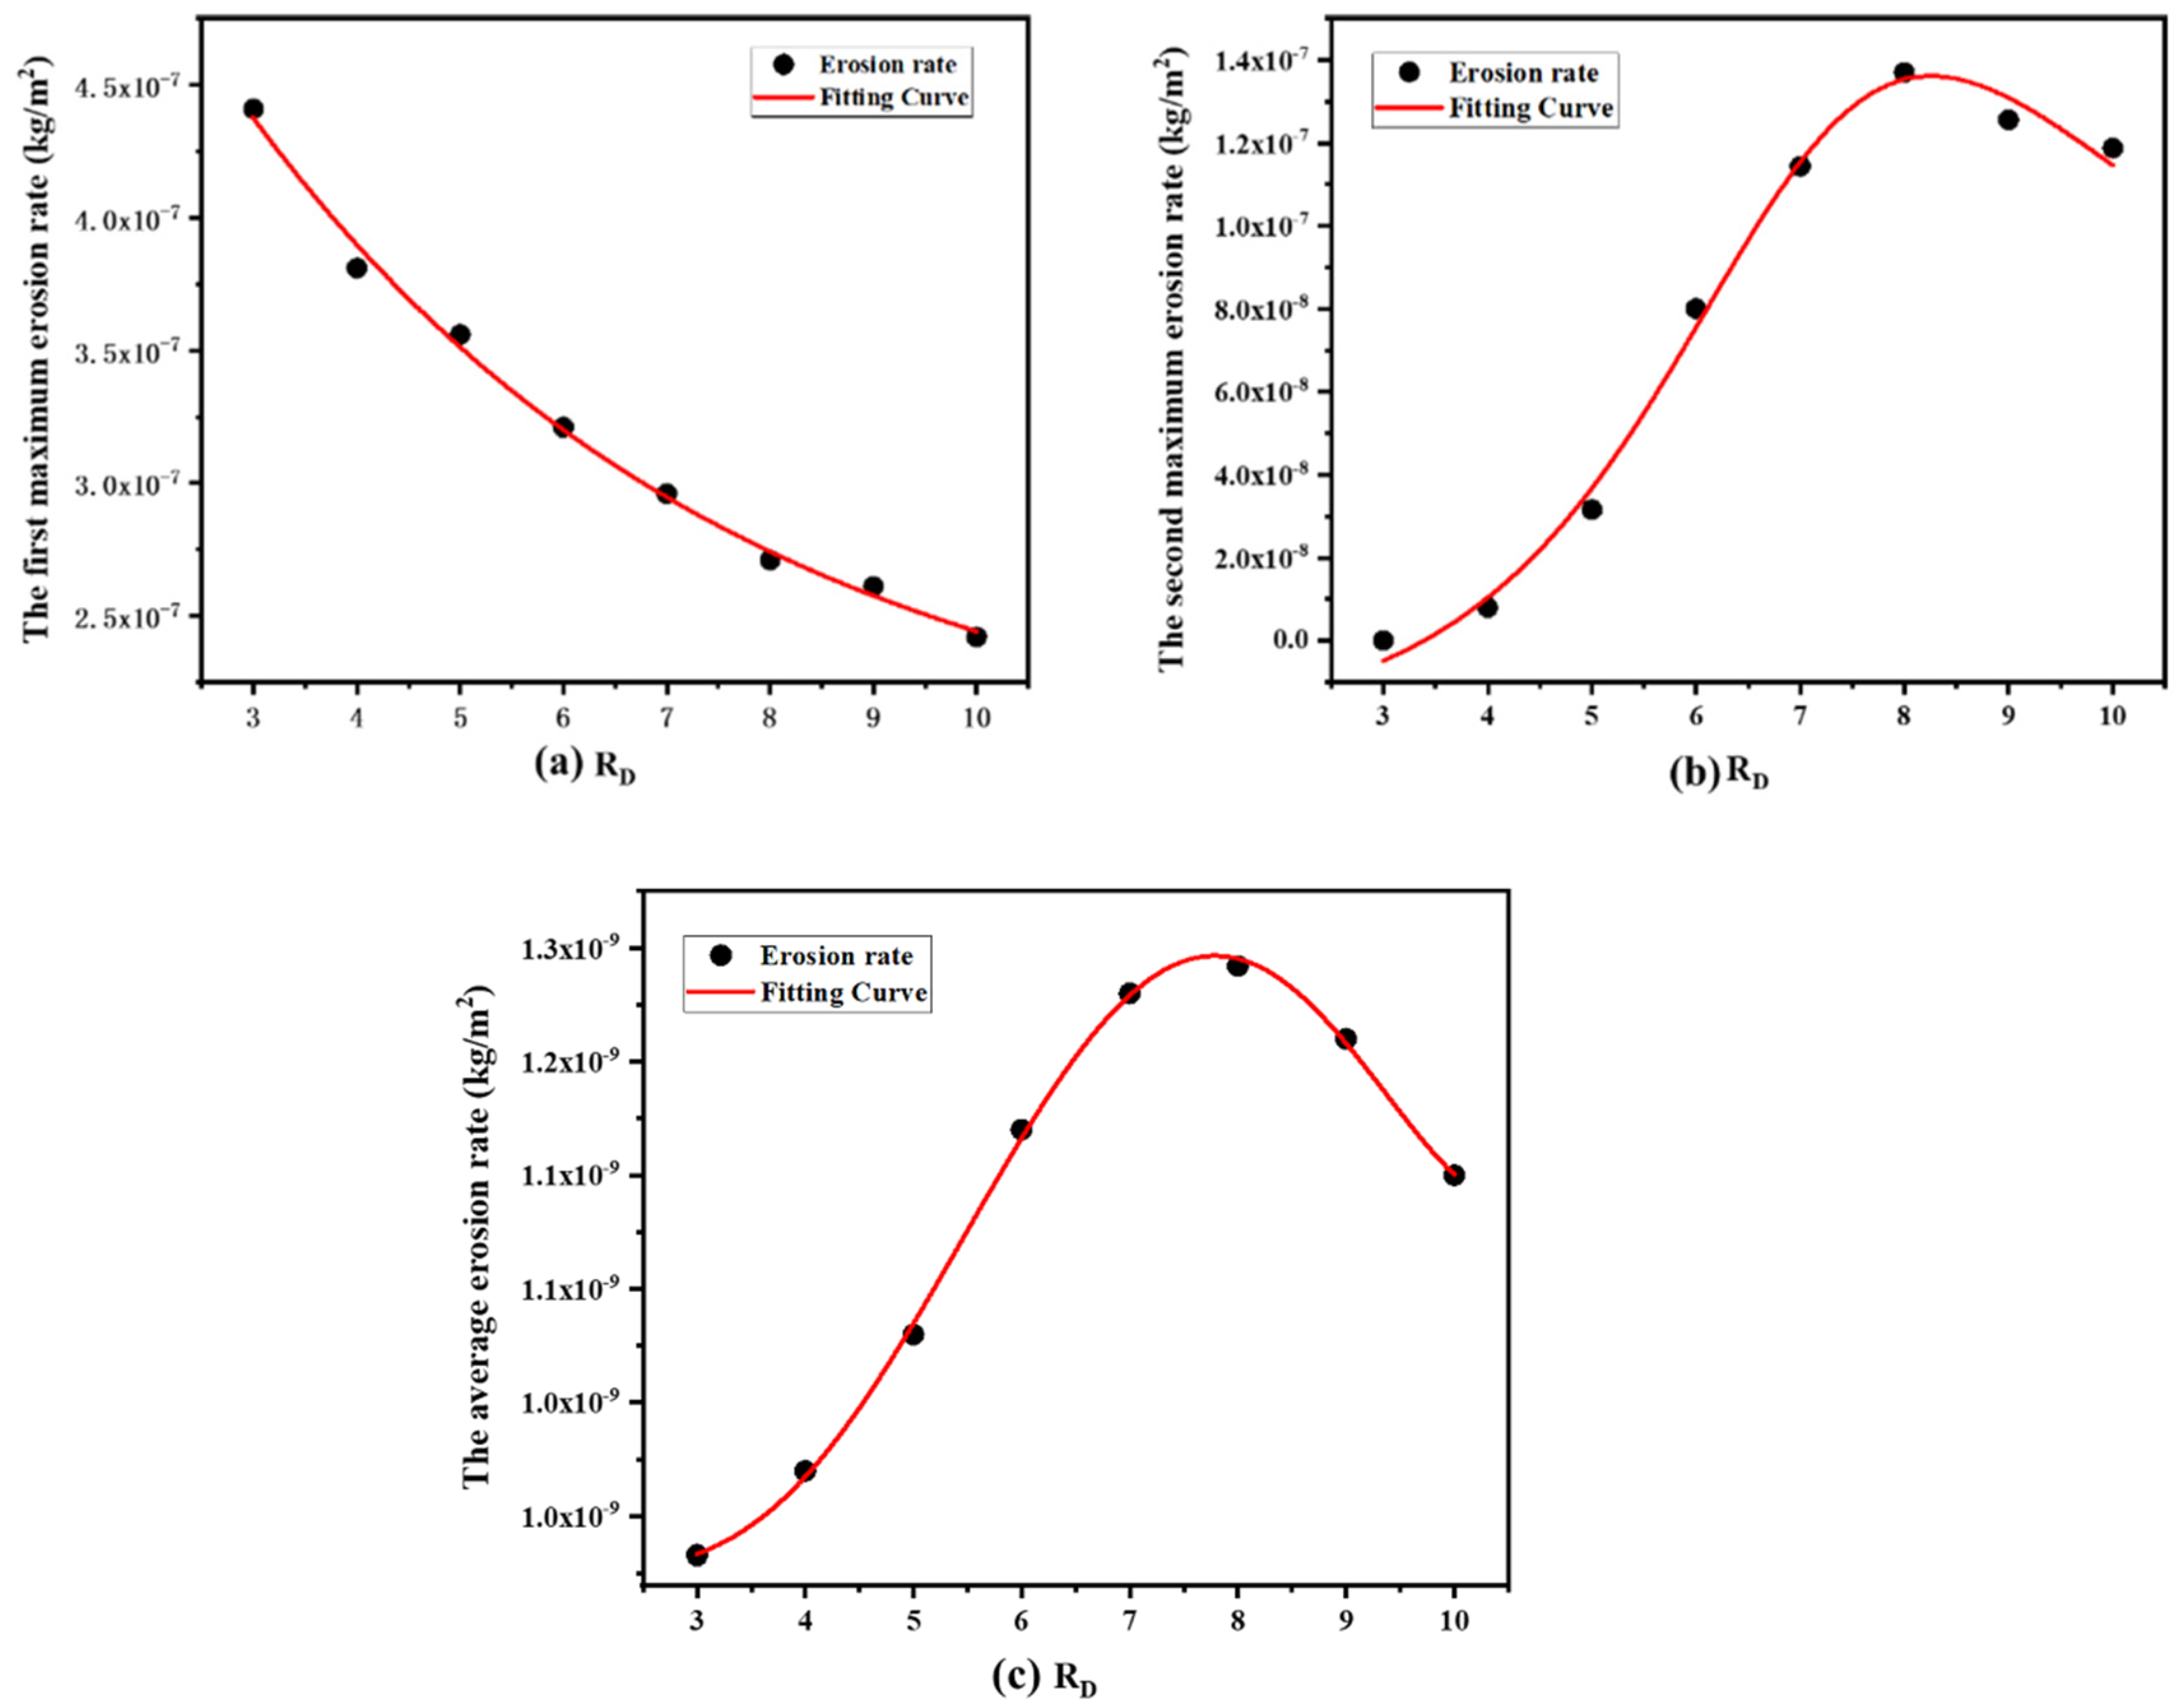
In general, there are relatively few studies on the erosion of sulfur-containing gases in gathering pipelines. Moreover, sulfur particles have different characteristics compared to other solid particles, such as low density, low hardness and easy rebound, and the erosion distribution pattern caused by most pipelines out of sand is different, especially the distribution difference caused by the change of curvature ratio of the elbow, and it is necessary to carry out research on the erosion distribution pattern of sulfur particles in pipelines under different collision conditions. In this paper, the gas-solid flow simulation model of the pipeline will be developed through the CFD simulation of COMSOL Multiphysics. The relationship between the distribution of erosion traces of sulfur-containing gases at 90° elbows and the variation of secondary vortex flow is investigated without considering chemical corrosion, and the influence law of erosion distribution under different curvature ratio, particle and pipe diameter conditions is analyzed separately to provide a reference for the transportation of sulfur-containing gas gathering pipelines in the industry.

2. Numerical Model

The CFD module of COMSOL Multiphysics is used to numerically simulate the erosion phenomenon at the bend of the sulfur-containing particle pipeline. Figure 1 shows a schematic diagram for constructing a structural model of the pipeline. The Realizable k-ε turbulence model is used to simulate the complex motion and flow field distribution of the continuous phase, and the motion trace of the discrete phase is described by the Eulerian-Lagrangian method. The particle–wall interaction was used to obtain the collision between sulfur particles and the pipe wall and the E/CRC erosion model was used to calculate the wall mass loss.

2.1. Continuous Phase Control Equation

The governing equation for the continuous phase consists of the conservation of mass and conservation of momentum:
ρ t + ρ u = 0
ρ u t + ρ u u = p + μ u + u T 2 3 μ u + S
where u is the fluid flow rate, m/s; ρ is the fluid density, kg/m3; p is the fluid pressure, Pa; μ is the fluid viscosity, Pa·s; t is the flow time; S is the external force acting on the fluid, which can be understood as the interaction force between particles and the fluid.
For the calculation of the turbulent state of a gas flowing in a pipe, the traditional k-ε turbulence model used by previous scholars makes it difficult to calculate the complex flow field with large changes in flow velocity and vortex flow characteristics, and the simulation accuracy will be decreased. Therefore, the Realizable k-ε turbulence model proposed by Shih et al. [29] is used to solve this problem in this paper. The model adds a limiting condition equation for turbulent viscosity and a transport equation for turbulent dissipation rate, which can be applied to the study of drastically changing flow fields, rotating flows and other complex secondary flows in pipes, and can more accurately describe the changing process of secondary flows. The Realizable k-ε turbulence model for the continuous phase is as follows:
ρ u k = μ + μ T σ k k + P k ρ ε
ρ u ε = μ + μ T σ ε ε + C 1 ρ s ε C 2 ρ ε 2 k + v ε
C 1 = max 0.43 , η 5 + η
η = s k ε
s = 2 E : E
where μ T is the turbulent viscosity, which can be expressed as:
μ T = ρ C μ k 2 ε
C μ = 1 A 0 + A S U k / ε
A S = 6 cos 1 3 arccos 6 W
W = 2 2 E : E E | E | 3
U = E : E + Ω : Ω
where P k is the turbulence kinetic energy caused by laminar flow and can be expressed as:
P k = μ T u : u + u T 2 3 ( u ) 2 2 3 ρ k u
where k is turbulence kinetic energy, J; ε is the turbulence dissipation rate, W/m3; v is the kinematic viscosity, m2/s; E is the time average strain rate; Ω is the mean vorticity, 1/s; σ k and σ ε are the Prandtl coefficients of turbulence for k and ε , respectively, which can be determined as 1.0 and 1.3 from the experimental data of Wilcox [30]. C 2 and A 0 are empirical constants of the model, usually with values of 1.92 and 4.

2.2. Discrete Phase Model

As the volume fraction of sulfur particles is typically around 10% of the total gas-solid two-phase flow, multiphase flow consisting of relatively dilute discrete phases are usually simulated using the discrete phase model, in which the gas-phase fluid is taken as the continuous phase, and the sulfur particles are treated as the discrete phase. It is assumed that the incident particles are independent of each other and the small deformation of the pipe caused by particle collisions is not considered, and because the concentration of sulfur particles in the pipe is relatively low, the collision effects between particles and the fragmentation of particles are not considered. The trajectory of the discrete phase is described by the Eulerian-Lagrangian method and the movement of the solid particles in the fluid as the discrete phase is determined by Newton’s second law:
m p d v d t = F + m p ρ p ρ ρ p g
where m p is the mass of the particle, mg; v is the velocity of the particle, m/s; ρ p is the particle density, kg/m3; g is the acceleration of gravity, m/s2; F is the sum of the other forces exerted on the particle at the flow field, N. Since the simulated particles are extremely dilute discrete phases with a density much greater than that of the continuous phase, forces that have less effect on the particles (such as pressure gradient forces, additional mass forces, and particle collision forces) can be ignored and are mainly affected by drag forces F D and slip-shear forces (Saffman force) F S :
F = F D + F S
The drag force effect is the most obvious, and the expression is:
F D = 18 μ C D R e p 24 ρ p d p 2 u v
R e p = u v μ
C D = a 1 + a 2 R e p + a 3 R ep 2
where d p is the particle diameter, m; R e p is the relative Reynolds number of the particles; C D is the drag coefficient, and in this study the sulfur particles are assumed to be spherical by default, so within a certain range of R e p , a 1 , a 2 and a 3 are constants.
Where the expression for slip-shear force F S is:
F S = 1.615 d p 2 L v μ ρ u v L v
L v = u v u v

2.3. Particle-Wall Interaction

The collision of solid particles with walls results in energy and velocity losses and transformations. Forder et al. [31] have proposed a non-random particle-wall collision bounce model which can accurately describe and predicts particle trajectory. This model allows the velocity change of solid particles to be solved and the loss of energy to be measured using different recovery coefficients. The recovery coefficient refers to the ratio of the velocities of the particles before and after the collision which, together with the impact angle, determines the velocity of the particles after the collision. The model formula is as follows:
e t = 0.988 0.78 θ + 0.19 θ 2 0.024 θ 3 + 0.027 θ 4
e n = 1 0.78 θ + 0.84 θ 2 0.21 θ 3 + 0.028 θ 4 0.022 θ 5
where e t is the tangential recovery coefficient; e n is the normal recovery factor; θ is the incident angle of the particles, rad.

2.4. E/CRC Erosion Model

The severity of the erosion effect is generally expressed by the erosion wear rate, which can be defined as the mass loss per unit of time and area of impact on the target surface during particle motion. The DNV RP-0501 model for the oil and gas industry is established based on the actual production data of industrial large-diameter pipelines. The average value for erosion prediction of large-scale pipelines with sand production is widely estimated. However, the inner diameter values for gathering pipelines for sulfur-containing gas reservoirs are mostly within the range of 40 mm to 150 mm, belonging to the range of small pipe diameters, and the calculation of the DNV model may cause certain errors. Zhang et al. [32] showed that the DNV model is generally less accurate than the Ahlert and Oka models for erosion calculations in smaller pipe diameters and that there is over-prediction for small pipe erosion calculations. The E/CRC model is based on data from small-diameter pipes and is mainly based on gas-solid and gas-phase dominated multiphase flows. Pereira [33] has experimentally found that is a greater level of accuracy in this model than in the Oka model in calculating the thickness loss of the inner surface of the bent section of the pipe and can more accurately describe the distribution of particles in the flow field. In order to more accurately reflect the distribution and pattern of erosion of sulfur particles in the curved section of the pipe, we investigated the use of an E/CRC model to simulate the erosion process in order to improve the accuracy of local calculations. The E/CRC model is defined as follows:
E R = C F ( θ ) ( B H ) 0.59 F s v n
F ( θ ) = k = 1 5 R k θ k
where E R is the erosion rate, kg/(m2·s); C and n are the empirical constants of E/CRC model materials, which are 2.17 × 10⁻⁷ and 2.41, respectively; F s is the shape coefficient of the particle, and since the default particle is spherical, the value is 0.2; B H is the Brinell hardness of the erosion material, and the default value of the pipeline material is steel, with a value of 120; R k is a constant and the values are shown in Table 1 [34].

3. Physical Model

3.1. Basic Settings

The pipe geometry setup is shown in Figure 2. The continuous phase is methane (CH4) and the Realizable k-ε turbulence model is selected to simulate the gas flow. The inlet boundary is set to a velocity condition and the outlet condition is set to a pressure with a value of 3MPa. It is ensured that both boundary conditions are fully developed flows. The discrete phase is sulfur particles and a spherical shape by default. The Lagrangian particle tracking method is selected to simulate the movement process of solid particles. The discrete phase wall condition is set as bounce. The turbulent dispersion model is the discrete random walk. The E/CRC model is selected for the calculation model of wall erosion. Two-phase parameter settings and pipe material properties are shown in Table 2.

3.2. Wall Treatment and Mesh Setting

The velocity variation of the continuous phase has a great influence on the particle motion in the near-wall region. Since the flow near the wall is characterized by a low Reynolds number, a very fine mesh is required to ensure the feasibility of the solution; however, this process requires a large amount of computational time and is likely to result in a non-physical solution. The flow state of the boundary layer can be classified as a combination of a viscous bottom region, buffer layer region and log law region (fully turbulent region). In the case of high Reynolds number turbulent flow, the mesh nodes can be divided into regions of log law layers, while the buffer and viscous bottom layers are left unmeshed in order to achieve a reduced computational difficulty for the model. This method of meshing allows the use of the standard wall function condition to relate the viscous bottom layer to the turbulent region [35], ignoring the transformation of turbulent and viscous stresses in the buffer layer above the viscous bottom layer, and providing an analytical solution for calculating the flow in the viscous bottom layer at the wall. The model is based on COMSOL’s Realizable k-ε automatic wall function method to describe the change in motion of a continuous phase near the wall, expressed in viscous units, with wall uplift defined as:
y + = max h 2 C μ 1 / 4 k μ , 11.06
The first argument is derived from the law of the wall and the second argument is the distance from the wall, in viscous units, where the logarithmic layer meets the viscous sublayer. The dimensionless y+ is defined as:
y + = y u τ μ
where y is the height of the continuous phase from the wall; u τ is the friction velocity, m/s.
u τ = max C μ 1 / 4 k , u u +
u + = 1 K v log y + + B
where K v is the von Kárman constant with a value of 0.41; B is a dimensionless constant with a value of 5.2. A reasonable result for y+ is usually 11.06 for this turbulence model, which allows the accuracy and stability of the model calculation to be guaranteed. According to the above calculation process, when meshing the boundary layer near the part of the inlet pipe wall, a progressive mesh is used to divide the mesh into seven layers in the radial direction; the height of the first layer is 0.003m, the stretching factor is 1.5, the thickness adjustment factor is 0.5 and there is no slip of the wall fluid, and the remaining part is set up with a tetrahedral mesh sweep. Subsequent parametric studies subjected the model to symmetric treatment to improve computational efficiency, and the overall pipe meshing is shown in Figure 3.
As the quantity and quality of the mesh also have an impact on erosion calculation, a mesh independence study is carried out during the meshing process to ensure the accuracy and speed of the calculation. A plurality of groups of different mesh control groups was set to select the optimal number of mesh, as shown in Figure 4 and Table 3. The change in maximum erosion rate and calculation time were analyzed when the mesh number of the bend model was increased from 260,600 to 923,000 at a flow rate of 15 m/s. It was found that the rate of increase in erosion rate was close to smooth after 770,000 mesh numbers.

4. Model Validation

In order to ensure the rationality of the erosion model selected in this study, we conducted a new simulation based on Chen’s experimental conditions [36]. The simulation parameters are shown in Table 4. The experimental results were compared with the erosion data obtained along the center line of the external arch from the inlet (0°) to the outlet (90°) of the elbow.
As shown in Figure 5, the maximum erosion rate obtained from Chen’s experimental results is 4.38 × 10⁻⁵ kg/(m2·s) at the position of 48° in the elbow. The maximum erosion rate of 4.36 × 10⁻⁵ kg/(m2·s) was obtained at the 47.4° position of the elbow through the simulation results, and the erosion distribution trend in the elbow was generally the same as that in Chen’s experiment. The simulation results and the experimental results are essentially in agreement. We also added three additional groups of new erosion models (Finnie, Oka and DNV) before the simulations to compare how closely their erosion rates at 25°, 50° and 70° of the elbow approximated the experimental results. As shown in Figure 6 and Table 5, the results of the DNV model deviate significantly from the experimental results and, as stated in the previous section, the DNV model is over-predictive in gas-solid erosion of small pipelines. Although the results of the E/CRC model are similar to those of the Oka model, the data from the E/CRC model can more closely match the experimental results. Therefore, the method and E/CRC model used in this paper are reasonable.

5. Results and Discussions

5.1. Main Erosion Distribution

The distribution of the flow field at the elbow has a significant effect on the movement of the particles. Figure 7 respectively shows the distribution of pressure and flow velocity in the flow field as the fluid passes through the bent section. There is a significant pressure gradient in the elbow section in Figure 7a due to the fluid being influenced by the curvature of the elbow and the centrifugal force and viscous drag of the fluid opposing each other, causing the pressure to become greater on the outside of the elbow and lower on the inside. The flow velocity distribution in Figure 7b is similar to the pressure, as the transformation between kinetic and potential energy causes the velocity of the fluid near the outside of the bend to decrease and the inside to increase. This is the same trend as the pressure and flow field distribution described by Zolfagharnasab in his report [37].
The effect of the flow field on particle motion can be studied by calculating the magnitude of the Stokes number with regard to the particle motion process. The Stokes number is defined as the ratio of particle relaxation time to the fluid time scale, which is dimensionless and can describe the degree to which particles follow the fluid flow. The particle movement and elbow erosion can be related through Stokes numbers. The Stokes number is expressed as follows:
S t = ρ p d p 2 u 18 μ D
where D is the pipe diameter, mm. When S t < 1, the particles are obviously affected by the surrounding fluid drag force, and they can move along the direction of streamline development, with a strong following, and the probability of collision with the wall is reduced. When S t > 1, the inertial force of the particles dominates and has a large kinetic energy, and the effect of fluid drag force is weakened. The particle trajectory will deviate from the development of streamline to a certain extent and directly collide with the elbow wall, resulting in an increase in the severity of erosion. The case study in this paper is about 19.61, which indicates that the influence of fluid flow on particle motion is very small. The particles are mainly inertial in their movement and are more likely to strike the wall directly when passing through the elbow, increasing the degree and extent of erosion and creating a clear area of maximum erosion (as shown in red in Figure 8). In order to reflect more intuitively the collision process of particles, as shown in the trajectory of particles in Figure 9, the change of velocity and distribution of particles before and after passing through the elbow is described. Before entering the inlet of the elbow, the particles are uniformly distributed and the velocity is basically consistent with that in the flow field before the inlet. However, after entering the elbow, the moving state of the particles is dramatically changed under the influence of the gradient of pressure and velocity. After the calculation of the Stokes number, only a small part of the particles’ velocity decreases and moves along the outer pipe wall under the trend of fluid extrusion, and most of the particles actually directly collide with the pipe wall and decrease in velocity after the wall collision and rebound into the downstream straight pipe. A particle-free region (within the red region in Figure 9) is formed within the inner pipe wall, which is generated by the shadowing effect [38], resulting in most of the particles not colliding with the inner side wall. Therefore, the erosion distribution of particles will be mainly concentrated around the outer wall of the elbow.
Figure 8 is an erosion nephogram of 100 μm sulfur particles at a fluid velocity of 15 m/s. The red erosion trace in the figure is the position of the maximum erosion rate, and this is an erosion formed by the direct collision of some high-speed particles with the inner wall of the elbow. Two distinct V-shaped erosion trace are also found above the maximum erosion rate. The explanation for this erosion trace phenomenon was suggested by Zeng et al. [20], describing the trajectory changes of particle collision through the particle-wall rebound model and reporting that the reason was secondary erosion caused by multiple collisions of low-velocity particles rebounding after collision with the pipe wall.
As shown in Figure 10, most of the particles will rebound along two main directions (red dashed area) after a direct collision with the red solid line area of the outer pipe wall, and at significantly lower velocities, with the bounced low-velocity particles moving in essentially the same direction as the V-shaped erosion traces. This is consistent with Zeng’s statement and validates the particle–wall interaction model used in our simulation. Moreover, due to the curvature characteristics of the elbow, the turbulent effect of the fluid passing through the bend will become more intense and the secondary flow formed will have a significant effect on the particle movement. Figure 11 and Figure 12 show the development of secondary flow and turbulence intensity at the inlet of the elbow as the axial cross-section increases from 0° to 90°, represented by the streamline and velocity contour surfaces, respectively. The turbulence intensity and streamline of the fluid before entering the elbow are uniformly distributed without drastic changes, as shown in Figure 11a and Figure 12a. After entering the elbow, the turbulence intensity changed significantly, and the region of maximum turbulence intensity appeared on the outer tube wall, which increased with the increase of the elbow angle and gradually extended to the inner tube wall, as shown in Figure 11b–d. The fluid streamline entering the bend develops into two symmetrical vortices around the sidewalls, which interfere violently with the movement of the particles in the cross-section, and whose vortex degree and intensity increase in parallel with the turbulence intensity, as shown in Figure 12b–d. This secondary flow vortex phenomenon, known as the Dean vortex, is a secondary rotational flow in the tube due to the pressure difference formed at the bend and the dramatic change in turbulence, which can affect the movement of the particles in the tube in the flow line and has a serious impact on the erosion distribution of the particles [39]. Its strength characteristic can be expressed by the Dean number, which is used to describe the interaction between centrifugal force and the viscous force of flowing fluid. Dean number expression is as follows:
De = Re × r R c 0.5
where De is the Dean number (dimensionless); Re is Reynolds number (dimensionless); r is the pipe radius, m; R c is the radius of curvature of the elbow, m. When the Dean number De > 400 in the full turbulence environment, the Dean vortex will become stable, and the centrifugal force of the fluid has a greater effect on the flow of particles in the elbow than the viscous force. The Dean number considered in this case is approximately 4.6 × 10⁴, and the movement of the particles is obviously affected by the eddy current, which may indicate that part of the secondary erosion trace in the black dashed area on the side wall of Figure 8 is caused by the secondary flow eddy current.

5.2. Effect of Curvature Ratio RD on Erosion

Analyzing the influence of the change of the curvature ratio (RD = R/D) of the elbow on the erosion distribution, this paper simulates the erosion distribution when RD = 3 is increased to RD = 10 with the curvature ratio as a variable under the condition of the same pipe diameter (80 mm), and the settings of other parameters are the same as those in Table 2. As Figure 13 shows the erosion nephogram for increasing curvature ratio from RD = 3 to RD = 10, due to the fixed elbow angle, the incidence angle between most particles and the elbow wall does not change much for different curvature ratios, and the maximum erosion area will be mainly concentrated near the central area of the elbow (near 45° of the elbow). However, it is worth noting that, for curvature ratios RD ≥ 5 in this model, new secondary erosion traces will appear near the outlet of the downstream elbow, and the erosion distribution will change significantly with increasing curvature ratios.
In order to analyze the cause of the new erosion area, we obtained the average fluid velocity contour filling diagram of pipeline cross-section and elbow 45° axial section under different curvature ratio conditions. As shown in Figure 14, due to the increase of RD, the radius of curvature of the elbow increases, and then the fluid can change direction more stably after entering the elbow. The flow field velocity of the upstream straight pipe gradually tends to be uniform with the flow field velocity of the partial area of the elbow, and the flow field distribution at the elbow starts to become uniform and concentrate towards the axial center so that the particles have better following. This reduces particle kinetic energy changes and velocity, so the number of direct collisions with the pipe wall upstream of the elbow is less. Therefore, the maximum erosion distribution decreases with the increase of RD, but it increases the probability of more particles colliding with the downstream area of elbow. In addition, the distribution of the high-velocity flow field increases with an increasing radius of curvature. As most of the particles collide directly with the wall of the elbow, the rebounded low-velocity particles will be significantly influenced by the flow field, as the increased RD results in the particles being able to travel longer distances in the elbow and the low-velocity particles can be fully accelerated again under the influence of the expanded high-velocity flow field distribution. With the increase of kinetic energy of the particles, the motion of the particles may be separated from the influence of the streamline again and will have a secondary direct collision with the pipe wall. As shown in the particle trajectory when RD = 8 in Figure 15, region A is the direct collision of the high-velocity particles with the pipe wall (primary erosion position), the direction of the black dashed shear head is the movement direction of the secondary acceleration of the particles, and region B is the position where the secondary acceleration particles directly collide with the wall surface (secondary erosion position). According to Figure 16, the pressure change in the cross-section longitudinal direction of the elbow at 45 degrees shows that the increase of RD also reduces the pressure gradient at the elbow, and weakens the intensity of the secondary flow, together with the relatively gentle change of flow velocity. Therefore, the influence of the secondary vortex on the particle movement will gradually decrease and most of the particles after the primary collision will maintain the initial rebound direction and directly collide with the downstream area, and gradually form strip-shaped erosion marks which tend to be aligned in parallel (the maximum erosion area of the secondary erosion in Figure 13). However, after RD ≥ 9, this secondary erosion trace shows signs of starting to weaken, suggesting that the continued increase in subsequent RD also improves the follow-through of the rebounded particles, as well as reducing their change in particle kinetic energy and weakening erosion capacity.
Figure 17 shows the erosion data from the outer arch of the elbow to the centerline of the straight downstream pipe for different curvature ratios, from which it can be seen that two peak points of erosion occur when RD ≥ 5. For a visual comparison of the effect of changing curvature ratios on erosion intensity, the maximum erosion rates at the two peak erosion points corresponding to different curvature ratios are presented as shown in Figure 18a,b. The first occurrence of the erosion peak is the result of the initial direct collision of the high-velocity particles with the pipe wall and decreases as the RD increases. The second occurrence of the erosion peak is a secondary direct collision of the rebounding accelerated particles with the pipe wall, which reaches a maximum at RD = 8 and decreases slowly thereafter. In order to calculate the average erosion of the overall surface of the pipeline, we defined the integral form of the overall erosion rate:
E R average = E R d S
where E R average is the overall erosion rate of the pipeline, kg/(m2·s); d S is the erosion unit area of the integral pipeline, m2. The fitted curves for the average erosion rates for different curvature ratios are obtained from the integral equation in Figure 18c, which shows that the average erosion of the pipe as a whole is at its maximum at an RD of around 8. In summary, although increasing the curvature ratio RD can effectively reduce the severity of the maximum erosion area, it will expand the distribution of secondary erosion near the pipe downstream of the bend. It is necessary to avoid setting the RD at about 8 as far as possible to prevent the secondary erosion from becoming more severe.

5.3. Effect of Particle Factors on Erosion

The increase in sulfur particle size from 10 μm to 80 μm erosion was simulated with other simulation parameters held constant. As shown in Figure 19, the erosion trace at the elbow changed significantly with the increase in particle size from 10 μm to 60 μm. The 10 μm particles formed a similar elongated erosion trace on the outer central axis near the elbow outlet. The elongated erosion traces on the central axis and the degree of erosion around them increase when the particles are 20 μm. As the particle size increases from 30 μm to 60 μm, the maximum erosion area at the elbow gradually transitions into a triangle (red erosion area) and forms a fully developed V-shaped erosion trace when the particle size is 60 μm, subsequent increase in particle size will not significantly change the erosion trace. Figure 20 shows the erosion data for the centerlines of the external arches with different particle sizes, and the maximum erosion area at the elbow is mainly distributed between 48.2° and 84.2° according to the angle of the elbow corresponding to the centerlines. The maximum erosion rate curves corresponding to different particles and the average erosion rate curves of the whole pipeline were obtained by fitting, as shown in Figure 21a,b, and both show that the erosion degree becomes more serious with the increase of particle size.
We have calculated Stoke numbers for eight particle size conditions and explained the effect of particle movement on erosion by combining the calculation results in Table 6 with the erosion trace distribution on the side of the pipeline in Figure 22 and the particle trajectory in Figure 23. It was found in Figure 22a that most of the erosion area for the 10 μm particle condition was mainly distributed on the inner side of the downstream straight pipe near the outlet of the elbow, where the value of S t in this case is about 0.196 (the value of S t is much less than 1), and the movement of the particles is mainly influenced by the fluid drag force. As shown in Figure 23a, most of the particles follow the changing trend of the flow field and pass through the elbow. Due to the stable change in the particle velocity, some particles flowing through the outlet of the elbow will be more likely to impact the inner side of the pipe and its surrounding area under the action of gravity and secondary flow. However, as the particle size increases to 30 μm, the erosion area will redistribute to the outer side of the elbow, the maximum erosion area will become concentrated, the erosion on the inner side of the downstream disappears and secondary erosion forms on the sidewall under the influence of secondary flow becomes progressively more obvious. The S t calculated for these particles is much greater than 1, so the motion of the particles is dominated by inertial force and becomes more significant with the increase of particle size, with the number of collisions increasing gradually. As shown in Figure 23b–h, the motion of most particles is not restricted by the flow field and directly collides with the elbow wall under the premise of keeping the velocity and kinetic energy constant. The larger the particles, the more the number of collisions after rebound and the greater the erosion degree.

5.4. Effect of Pipe Diameter on Erosion

The same quantitative analysis of the effect on the size of the pipe diameter was also performed, simulating erosion in the range of 50 mm to 120 mm pipe diameters respectively. Figure 24 shows the erosion data for the centerlines of external arches with different pipe diameters, with the maximum erosion area distributed between 46.6° and 50.2° of the elbow. Both the maximum erosion rate and the average erosion rate curve of the whole pipeline decrease with the increase of the pipe diameter, and the overall decrease trend is slow, as shown in Figure 25. As the increase of pipe diameter leads to the decrease of Stoke number, the ability of particle motion affected by inertial force is weakened and the number of particles colliding on the unit cross-sectional area of the elbow is reduced, thus weakening the degree of erosion. Besides, the increase of flow field space enables the particles to have sufficient collision surface area and collision space and the movement of the particles in front of the collision elbow wall will become more dispersed.

6. Conclusions

The CFD-DPM coupled model was used to numerically analyze the erosion distribution characteristics of sulfur-containing particulate gas in the 90-degree elbow. The experimental results in the literature verify the rationality of the selected erosion model. The causes of the formation of the main erosion distributions are analyzed by describing the trajectories of the particles and the secondary flow effects to which they are subjected, and the effects of different curvature ratios, particle sizes and pipe diameters on the erosion behavior are investigated. The following conclusions can be drawn from the results:
  • The Stoke number considered in this case is 19.61 and the Dean number is 4.6 × 10⁴, and the motion of the sulfur particles will be significantly influenced by the secondary eddy currents. The secondary erosion trace developed from the tip of the V-shaped erosion trace to the outlet on the side wall of the pipeline may be caused by the secondary vortex effect.
  • Increasing the curvature ratio RD can reduce the severity of the maximum erosion area, but it will cause a new secondary erosion distribution near the pipe downstream of the elbow and reach the maximum when RD = 8. For the transportation of sulfur-containing gas pipelines, bends with RD of 8 or so should be avoided as far as possible to prevent the secondary erosion from becoming serious.
  • The maximum erosion areas at the elbow are mainly distributed between 48.2° and 84.2° for sulfur particle sizes from 10 μm to 80 μm, and the inertial movement is more pronounced when the particle size exceeds 30 μm; the maximum erosion areas at the elbow are mainly distributed between 46.6° and 50.2° for the pipe diameter range from 50 mm to 120 mm. The change of Stoke number can reflect the movement state of particles in the fluid. If the value is greater, the more obvious it is that particles will remain their original initial movement state when passing through the elbow, and the more serious the erosion degree in the elbow will be. Therefore, the erosion rate can be reduced by appropriately increasing the pipe diameter and reducing the polymerization phenomenon of sulfur by using a separator.

Author Contributions

Conceptualization, R.Z. and H.R.; methodology, R.Z. and C.L.; software, Q.F.; validation, Y.R. and D.J.; formal analysis, Y.L.; investigation, S.L.; writing—original draft preparation, R.Z.; writing—review and editing, R.Z.; visualization, R.Z. and D.T.; supervision, D.T.; project administration, C.L. funding acquisition, C.L. All authors have read and agreed to the published version of the manuscript.

Funding

This research received no external funding.

Data Availability Statement

The data presented in this study are available in Numerical study of the erosion distribution of sulfur-containing particulate gas in 90-degree gathering elbow.

Acknowledgments

The authors are grateful to the referee for her or his careful reading of the manuscript and helpful suggestions on this work. This work was supported by CDB Gas Mine of PetroChina Southwest Oil and Gas Field Company.

Conflicts of Interest

The authors declare no conflict of interest.

References

  1. Liu, X.; Liu, S.; Wang, Y.; Xiang, Y.; Qing, C.; Zhang, H.; Ren, H.; Li, C. Estimation method of heterogeneous sulfur saturation distribution in high sulfur content gas reservoirs based on well test data. Environ. Earth Sci. 2023, 82, 115. [Google Scholar] [CrossRef]
  2. Habib, M.A.; Badr, H.M.; Ben-Mansour, R.; Kabir, M.E. Erosion rate correlations of a pipe protruded in an abrupt pipe contraction. Int. J. Impact Eng. 2007, 34, 1350–1369. [Google Scholar] [CrossRef]
  3. Ferng, Y.M.; Lin, B.H. Predicting the wall thinning engendered by erosion-corrosion using CFD methodology. Nucl. Eng. Des. 2010, 240, 2836–2841. [Google Scholar] [CrossRef]
  4. Finnie, I. The Mechanism of Erosion of Ductile Metals. Proc. 3rd Natl. Cong. Appl. Mech. 1958, 527–532. [Google Scholar] [CrossRef]
  5. Bitter, J. A Study of Erosion Phenomena. Wear 1963, 6, 5–21. [Google Scholar] [CrossRef]
  6. Levy, A.V. The erosion of structural alloys, cermets and in situ oxide scales on steels. Wear 1988, 127, 31–52. [Google Scholar] [CrossRef]
  7. Evans, A.G.; Biswas, D.R.; Fulrath, R.M. Accept/Reject Criteria for Structural Ceramics: Some Effects of Cavities on the Fracture of Ceramics Cylindrical Holes. J. Am. Ceram. Soc. 1979, 62, 95–100. [Google Scholar] [CrossRef]
  8. Berger, S.A.; Talbot, L.; Yao, L.S. Flow in Curved Pipes. Annu. Rev. Fluid Mech. 1983, 15, 461–512. [Google Scholar] [CrossRef]
  9. Smith, F.T. Fluid Flow into a Curved Pipe. Proc. R. Soc. A Math. Phys. Eng. Sci. 1976, 351, 71–87. [Google Scholar]
  10. Ahlert, K.R. Effects of Particle Impingement Angle and Surface Wetting on Solid Particle Erosion of AISI 1018 Steel. Ph.D. Thesis, University of Tulsa, Tulsa, OK, USA, 1994. [Google Scholar]
  11. Oka, Y.I.; Okamura, K.; Yoshida, T. Practical estimation of erosion damage caused by solid particle impact: Part 1: Effects of impact parameters on a predictive equation. Wear 2005, 259, 95–101. [Google Scholar] [CrossRef]
  12. Zhang, Y.; Reuterfors, E.P.; Mclaury, B.S.; Shirazi, S.A.; Rybicki, E.F. Comparison of computed and measured particle velocities and erosion in water and air flows. Wear 2007, 263, 330–338. [Google Scholar] [CrossRef]
  13. Veritas, N. Recommended Practice, RP O501: Erosive Wear in Piping Systems. DNV Recomm. Pract. 2007, 4, 1–34. [Google Scholar]
  14. Khan, R.; Ya, H.H.; Shah, I.; Niazi, U.M.; Ahmed, B.A.; Irfan, M.; Glowacz, A.; Pilch, Z.; Brumercik, F.; Azeem, M.; et al. Influence of Elbow Angle on Erosion-Corrosion of 1018 Steel for Gas–Liquid–Solid Three Phase Flow. Materials 2022, 15, 3721. [Google Scholar] [CrossRef]
  15. Wang, J.; Shirazi, S.A. A CFD Based Correlation for Erosion Factor for Long-Radius Elbows and Bends. J. Energy Resour. Technol. 2003, 125, 26–34. [Google Scholar] [CrossRef]
  16. McLaury, B.S.; Shirazi, S.A.; Burden, T.L. Effect of entrance shape on erosion in the throat of chokes. J. Energy Resour. Technol.-Trans. ASME 2000, 122, 198–204. [Google Scholar] [CrossRef]
  17. Edwards, J.K.; Mclaury, B.S.; Shirazi, S.A. Evaluation of alternative pipe bend fittings in erosive service. ASME 2000, 253. Available online: https://www.researchgate.net/publication/285907230 (accessed on 18 January 2023).
  18. Haugen, K.; Kvernvold, O.; Ronold, A.; Sandberg, R. Sand erosion of wear-resistant materials: Erosion in choke valves. Wear 1995, 186, 179–188. [Google Scholar] [CrossRef]
  19. Bozzini, B.; Ricotti, M.E.; Boniardi, M.; Mele, C. Evaluation of erosion–corrosion in multiphase flow via CFD and experimental analysis. Wear 2003, 255, 237–245. [Google Scholar] [CrossRef]
  20. Zeng, D.Z.; Zhang, E.B.; Ding, Y.Y.; Yi, Y.G.; Xian, Q.B.; Yao, G.J.; Zhu, H.J.; Shi, T.H. Investigation of erosion behaviors of sulfur-particle-laden gas flow in an elbow via a CFD-DEM coupling method. Powder Technol. 2018, 329, 115–128. [Google Scholar] [CrossRef]
  21. Zhang, E.; Zeng, D.; Zhu, H.; Li, S.; Chen, D.; Li, J.; Ding, Y.; Tian, G. Numerical simulation for erosion effects of three-phase flow containing sulfur particles on elbows in high sour gas fields. Petroleum 2018, 4, 158–167. [Google Scholar] [CrossRef]
  22. Chen, J.; Wang, Y.; Li, X.; He, R.; Chen, Y. Reprint of: Erosion prediction of liquid-particle two-phase flow in pipeline elbows via CFD-DEM coupling method. Powder Technol. 2015, 282, 25–31. [Google Scholar] [CrossRef]
  23. Pei, J.; Lui, A.; Zhang, Q.; Xiong, T.; Jiang, P.; Wei, W. Numerical investigation of the maximum erosion zone in elbows for liquid-particle flow. Powder Technol. 2018, 333, 47–59. [Google Scholar] [CrossRef]
  24. Peng, W.; Cao, X. Numerical simulation of solid particle erosion in pipe bends for liquid–solid flow. Powder Technol. 2016, 294, 266–279. [Google Scholar] [CrossRef]
  25. Sommerfeld, M.; Lain, S. From elementary processes to the numerical prediction of industrial particle-laden flows. Multiph. Sci. Technol. 2008, 21, 123–140. [Google Scholar] [CrossRef]
  26. Sommerfeld, M.; Lain, S. Parameters influencing dilute-phase pneumatic conveying through pipe systems: A computational study by the Euler/Lagrange approach. Can. J. Chem. Eng. 2015, 93, 1–17. [Google Scholar] [CrossRef]
  27. Lain, S.; Sommerfeld, M. Numerical prediction of particle erosion of pipe bends. Adv. Powder Technol. 2019, 30, 366–383. [Google Scholar] [CrossRef]
  28. Laín, S.; Sommerfeld, M. Numerical calculation of pneumatic conveying in horizontal channels and pipes: Detailed analysis of conveying behaviour. Int. J. Multiph. Flow 2012, 39, 105–120. [Google Scholar] [CrossRef]
  29. Shih, T.H.; Liou, W.W.; Shabbir, A.; Yang, Z.; Zhu, J. A New k-(Eddy Viscosity Model for High Reynolds Number Turbulent Flows: Model Development and Validation. Comput. Fluids 1994, 24. Available online: https://www.researchgate.net/publication/24292638 (accessed on 18 January 2023).
  30. Wilcox, D.C. Turbulence Modeling for CFD; DCW Industries: La Canada, CA, USA, 2006. [Google Scholar]
  31. Forder, A.; Thew, M.; Harrison, D. A numerical investigation of solid particle erosion experienced within oilfield control valves. Wear 1998, 216, 184–193. [Google Scholar] [CrossRef]
  32. Zhang, P.; Zheng, S.; Jing, J.; Zhou, Y.; Li, Q.; Wang, K.; Lv, N.; Sun, N. Surface erosion behavior of an intrusive probe in pipe flow. J. Nat. Gas Sci. Eng. 2015, 26, 480–493. [Google Scholar] [CrossRef]
  33. Souza, F.; Martins], D. Numerical prediction of the erosion due to particles in elbows. Powder Technol. 2014, 261, 105–117. [Google Scholar]
  34. Wang, H.; Yu, Y.; Yu, J.; Wang, Z.; Li, H. Development of erosion equation and numerical simulation methods with the consideration of applied stress. Tribol. Int. 2019, 137, 387–404. [Google Scholar] [CrossRef]
  35. Shirazi, S.A.; McLaury, B.S.; Karimi, S.; Mansouri, A.; Arabnejad, H. Improved CFD modeling and validation of erosion damage due to fine sand particles. Wear 2015, 338, 339–350. [Google Scholar]
  36. Chen, X.; Mclaury, B.S.; Shirazi, S.A. Application and experimental validation of a computational fluid dynamics (CFD)-based erosion prediction model in elbows and plugged tees. Comput. Fluids 2004, 33, 1251–1272. [Google Scholar] [CrossRef]
  37. Zolfagharnasab, M.H.; Salimi, M.; Zolfagharnasab, H.; Alimoradi, H.; Aghanajafi, C. A novel numerical investigation of erosion wear over various 90-degree elbow duct sections. Powder Technol. 2020, 380, 1–17. [Google Scholar] [CrossRef]
  38. Sommerfeld, M.; Huber, N. Experimental analysis and modelling of particle-wall collisions. Int. J. Multiph. Flow 1999, 25, 1457–1489. [Google Scholar] [CrossRef]
  39. Bahmani, S.; Nazif, H.R. Erosion of rectangular channel bend in two-phase natural gas particles turbulent flow. J. Braz. Soc. Mech. Sci. Eng. 2019, 41, 1–17. [Google Scholar] [CrossRef]
Figure 1. Schematic diagram of the structural model of the research object.
Energies 16 02707 g001
Figure 2. Schematic diagram of a geometric model of the pipeline.
Energies 16 02707 g002
Figure 3. Mesh distribution arrangement of pipeline and two-phase inlet.
Energies 16 02707 g003
Figure 4. Maximum erosion rates for different mesh numbers at a fluid flow rate of 15 m/s.
Energies 16 02707 g004
Figure 5. Comparison of simulated elbow erosion distribution with Chen’s experimental results.
Energies 16 02707 g005
Figure 6. Comparison of four erosion models at different angles with Chen’s experimental results.
Energies 16 02707 g006
Figure 7. Equal cross-sectional distribution of pressure and flow velocity at the elbow: (a) Sectional view of pressure distribution; (b) Sectional view of velocity distribution.
Energies 16 02707 g007
Figure 8. Erosion nephogram with 100 μm sulfur particle erosion at a flow rate of 15 m/s.
Energies 16 02707 g008
Figure 9. Cross-sectional view of collision trace of particles and elbow and a particle-free region.
Energies 16 02707 g009
Figure 10. Collision trace diagram of particles and outer sidewall surface of elbow and V-type collision trace of low-speed particles.
Energies 16 02707 g010
Figure 11. Section view of turbulence intensity development from 0° to 90° in the axial direction of elbow.
Energies 16 02707 g011
Figure 12. Section of axial 0° to 90° streamline development of elbow.
Energies 16 02707 g012
Figure 13. Erosion nephogram with different curvature ratios.
Energies 16 02707 g013
Figure 14. Average fluid velocity and contour fill plots for different curvature ratio pipe cross sections and elbow 45 axial sections.
Energies 16 02707 g014
Figure 15. Cross-sectional view of collision trace of particle and elbow at RD = 8.
Energies 16 02707 g015
Figure 16. Pressure gradient variation in section longitudinal direction at 45 of elbow with different curvature ratios.
Energies 16 02707 g016
Figure 17. Erosion data from external arch of bent pipe to the centerline of downstream straight pipe with different curvature ratios.
Energies 16 02707 g017
Figure 18. Fitting curves of erosion rate corresponding to different curvature ratios: (a) Primary maximum erosion rate with different curvature ratios (b) Secondary maximum erosion rate with different curvature ratios (c) Average erosion rate with different curvature ratios.
Energies 16 02707 g018
Figure 19. Erosion nephogram with different particle sizes.
Energies 16 02707 g019
Figure 20. Erosion data of the center line of elbow camber for different particles.
Energies 16 02707 g020
Figure 21. Fitting curve of erosion rate for different particles: (a) Maximum erosion rate for different particles (b) Average erosion rate for different particles.
Energies 16 02707 g021
Figure 22. Erosion nephogram with distribution on pipeline side with different particles.
Energies 16 02707 g022
Figure 23. Schematic diagram of particle trace of different particles at elbow.
Energies 16 02707 g023
Figure 24. Erosion data of the center line of the elbow external arch with different pipe diameters.
Energies 16 02707 g024
Figure 25. Fitting curves of erosion rates for different pipe diameters: (a) Maximum erosion rates for different pipe diameters (b) Average erosion rates for different pipe diameters.
Energies 16 02707 g025
Table 1. E/CRC erosion model constants.
R 1 R 2 R 3 R 4 R 5
5.3983−10.106810.9327−6.32831.4234
Table 2. Basic parameters of the model.
ParameterValueParameterValue
FluidMethaneMass flow rate (kg/s)0.05
ParticleSulfur particleTube wall materialSteel
Flow rate (m/s)15Tube wall density (kg/m3)7860
Fluid density (kg/m3)0.7174Brinell hardness (BH)120
Hydrodynamic viscosity (Pa/s)1.087 × 10−5Pipe diameter (mm)80
Particle density (kg/m3)2046Curvature ratio (RD)3
Particle diameter (μm)40Angle of bend (°)90
Particle shape coefficient0.2//
Table 3. Effect of mesh addition on time and difference variation.
Mesh numbers260,600356,610448,200581,000672,400770,000856,440950,000
Time (h)8.210.513.214.216.625.148.591.7
Maximum erosion rate (10−8)7.19.411.71313.914.314.514.7
Differential value/2.31.91.30.90.40.20.2
Table 4. Model parameters for verification.
ParameterValueParameterValue
FluidAirMass flow rate (kg/s)0.000208
ParticleSandTube wall materialAluminum
Flow rate (m/s)45.72Tube wall density (kg/m3)2700
Fluid density (kg/m3)1.225Brinell hardness (BH)95
Hydrodynamic viscosity (Pa/s)1.7894 × 10−5Pipe diameter (mm)25.4
Particle density (kg/m3)2320Curvature ratio (RD)1.5
Particle diameter (μm)150Angle of bend (°)90
Particle shape coefficient0.2//
Table 5. Difference of four erosion models at different angles with Chen’s experimental results.
E/CRCFinnieOkaDNV
25°2.30 × 10−62.48 × 10−62.80 × 10−64.40 × 10−6
50°2.33 × 10−61.17 × 10−55.33 × 10−61.97 × 10−5
70°2.49 × 10−62.89 × 10−62.29 × 10−62.69 × 10−6
Table 6. Stoke numbers for different particle sizes.
Gas Flow Rate (m/s)Particle Density (kg/m3)Pipe Diameter (mm)Hydrodynamic Viscosity (Pa/s)Particle Diameter (μm)Stoke Number
152046801.087 × 10−5100.196
200.784
301.765
403.137
504.902
607.058
709.607
8012.548
Disclaimer/Publisher’s Note: The statements, opinions and data contained in all publications are solely those of the individual author(s) and contributor(s) and not of MDPI and/or the editor(s). MDPI and/or the editor(s) disclaim responsibility for any injury to people or property resulting from any ideas, methods, instructions or products referred to in the content.

