

A Hyper-Integrated Mobility as a Service (MaaS) to Gamification and Carbon Market Enterprise Architecture Framework for Sustainable Environment


Department of Mechatronics Engineering, Istanbul Commerce University, Istanbul 34840, Turkey
Energies 2023, 16(5), 2480; https://doi.org/10.3390/en16052480
Submission received: 8 February 2023
/
Revised: 1 March 2023
/
Accepted: 2 March 2023
/
Published: 5 March 2023
(This article belongs to the Topic Energy Management and Sustainable Development from Economic, Social and Environmental Aspects)
Abstract
:Various human activities emit greenhouse gasses (GHGs) that contribute to global climate change. These include the burning of fossil fuels for energy production, transportation, and industrial uses, and the clearing of forests to create farmland and pasture, all for urban and industrial development. As a result, temperatures around the world are rising, extreme weather events are occurring more frequently, and human health is suffering because of these changes. As a result of massive traffic, agriculture, and urbanization, the natural environment is being destroyed, negatively affecting humans and other living things. Humanity plans to live in smart cities within this ecosystem as the world evolves around these mutations. A smart city uses technology and data to improve the quality of life of its citizens and the efficiency of its urban systems. Smart cities have the potential to be more sustainable because they use technology and data to improve the efficiency of urban systems and reduce the negative impact of human activities on the environment. Smart cities can also use technology to improve green transportation and waste management and reduce water consumption, which can help conserve natural resources and protect the environment. Smart cities can create livable, efficient, and sustainable urban environments using technology and data. This paper presents a new Enterprise Architecture Framework for reducing carbon emissions for environmental sustainability that combines gamification and green behavior with blockchain architecture to ensure a system that is trustworthy, secure, and scalable for shareholders, citizens, service providers, and technology vendors. In order to achieve this, the hyper-integrated framework approach explains a roadmap for how sustainability for reducing carbon emissions from transportation is based on an optimized MaaS approach improved by gamification. As part of this study, a computational model and a formulation are proposed to calculate the activity exchange values in the MaaS ecosystem for swapping, changing, and bartering for assets within the integrated system. This paper aims to propose the framework and a module interoperability approach, so numerical values for computation parameters are not included as they may belong to other research studies. In spite of this, a case study section has been provided as an example of a calculation approach.
1. Introduction
Climate change is caused by various human activities, particularly the emission of greenhouse gasses such as carbon dioxide and methane into the atmosphere [1]. The majority of these greenhouse gasses are produced by modern living standards, agriculture, and industrialization. Another massive carbon dioxide emission occurs from the production of cement that makes up buildings, factories, and human artifacts, as well as from the decomposition of organic material in landfills and other industrial processes [2]. These gasses in the atmosphere trap heat from the sun and cause the Earth’s temperature to rise. The impacts of climate change are far-reaching and include rising sea levels, more frequent and intense heat waves and storms, droughts and floods, and changes in the distribution and abundance of plants and animals [3]. These impacts can have negative consequences for human health, agriculture, biodiversity, water resources, and other aspects of human society [4].
Environmental factors, such as the endangered ozone layer, greenhouse gas emissions mentioned above, polluted rivers, and industrial waste discharged into freshwater resources and the environment, have been shown in recent studies to negatively affect quality of life. Climate change, for example, can negatively impact human health in several ways, including increased risk of heat stroke, respiratory problems, and infectious diseases [5]. It has also been shown that green space in the cities has a positive impact on mental health [6]. Moreover, there are other studies showing environmental factors increase various risk factors for human health [7,8].
Sustainable environmental management means reducing greenhouse gas emissions and adopting greener practices to mitigate the effects of climate change. Environmental sustainability requires balancing economic development, social needs, and environmental protection. For the benefit of present and future generations, environmental sustainability means preserving the natural environment, including biodiversity, natural resources, and ecological processes [9].
Measures to protect and preserve the natural environment and to use natural resources in ways that do not deplete or degrade them are critical to the continued existence of the natural environment [10]. In other words, it is about making decisions and acting in a way that takes into account the long-term impact on the environment, rather than focusing only on short-term economic or social benefits [11]. There are several approaches that can contribute to environmental sustainability, such as reducing resource use and waste, which reduces the environmental impacts associated with resource extraction, processing, and disposal [12]. By protecting and conserving natural habitats and biodiversity, human activities can have a less harmful effect on the environment [13], and the use of renewable energy sources can reduce the impact of energy production on the environment. Adopting green, sustainable practices at home, at work, and in the community can reduce daily environmental impact [14].
Measures to reduce energy consumption and reduce humanity’s carbon footprint include the use of energy-efficient appliances and lighting, public transportation, environmentally friendly transportation, and applications that can be used to reduce energy consumption and reduce humanity’s carbon footprint. These measures can help humanity reduce the negative impact of human activities on the environment and improve environmental health by promoting environmental sustainability [15].
With most of humanity’s carbon footprint occurring where people live, the idea of ’smart cities’ is gaining momentum. Smart cities are urban areas where technology is used and data is analyzed to improve the quality of life for residents and create a more efficient and sustainable environment [16]. Smart cities unite technology, community, and people for a better future. All the different dimensions of technological improvements, but especially ICT, give the city the opportunity to have a creative, diverse, and educated population and management by ensuring a link between the two dimensions to drive sustainable expansion and improve the quality of life [17].
Throughout this paper, the organization and hierarchy will be the following. Section 1.1 is an introduction to smart cities. The purpose of Section 1.2 is to demonstrate the relationship between sustainability and smart cities. Section 1.3, how the concept of the paper and gamification with an ICT system can attract citizens to support and use it is discussed. Finally, Section 1.4 describes how such a complex system can be achieved technically.
1.1. Smart Cities
Smart cities have a long history, dating back to the 1970s when the first urban Big Data project was launched in Los Angeles: “A Cluster Analysis of Los Angeles” [18]. Studies have been conducted around the world on smart cities that have reviewed and explored different perspectives and dimensions [19,20,21,22,23,24,25]. Smart cities are a type of city management model that has gained worldwide attention due to the development and spread of digital technology. The development of smart cities has led to the construction of smart cities in many countries around the world. In 2006, the Singapore government introduced the “Smart Nation 2015” plan, the South Korean government implemented its plan to build “U-City”, a a smart city, and in 2011, the Netherlands also launched its “Smart City and Planning and Construction for Amsterdam” program. In 2010, IBM proposed “Smarter Cities” and built the first unified urban data management center in Rio de Janeiro. China began building smart cities in 2012, and 277 sites (including cities, counties, and municipalities) are currently designated as pilot projects [26]. Urban areas are experiencing continuous improvements in smart city technologies that aim to improve citizens quality of life, increase efficiency, and reduce the impact on the environment.
Major examples for those improvements are 5G connectivity, Internet of Things, artificial intelligence applications, blockchain technologies, and so on. The deployment of 5G networks is set to revolutionize how cities function with its ultra-fast speed and low latency for real-time data transmission, which is essential for smart city applications, such as autonomous vehicles, traffic management, and remote healthcare [27,28,29]. The Internet of Things (IoT) for Smart sensors is now used in traffic management, air quality monitoring, waste management, and other applications [30,31,32]. Artificial intelligence for analyzing data collected from IoT sensors is providing insights that assist city officials in making informed decisions [33,34,35]. Blockchain technology can improve the security and transparency of smart city systems. This technology can help protect personal data, prevent fraud, and ensure the integrity of transactions [36,37]. Smart grids are being developed to help manage energy consumption in cities more efficiently by using advanced analytics and automation to optimize energy usage and reduce waste [38,39].
One such improvement implemented for smart city solutions is MaaS, which stands for Mobility as a Service and involves the integration of different modes of transportation such as busses, trains, cabs, and car-sharing services into a single system accessible via a single integrated digital platform and payment method [40]. It is important to adapt the implementation of MaaS to the specifics of the place where the service is to be provided in order for the service to be successful. Multimodality, infrastructures, regulations, user goals, and user willingness to use and pay for MaaS services must all be considered when determining a city’s maturity [41]. The MaaS concept is reflected in the reduction of dependence on private cars [42] and has gained attention as a strategy to reduce emissions by promoting the use of public transit as part of a strategy to manage transportation demand and support environmental sustainability [43].
Moreover, MaaS systems can reward users for choosing sustainable modes of transportation or provide discounts to encourage environmentally friendly behaviors. Users who agree to walk or bike more often or use public transit less often can receive discounts on public transit fares or car-sharing rates or other promotions and support from shareholders through a MaaS platform. Citizens are an essential part of the process of smartification and sustainable development of cities, as they need to adopt, understand, and interact with the technologies that enable the digital transformation of societies, cities, and public administration. Therefore, technology adoption is crucial for creating smart and citizen-centric cities. This is even more challenging in small cities, which suffer from aging populations, desertification, lack of infrastructure, and above all, the digital divide [44]. Providing sustainable and transferable transportation options to communities and individuals in convenient, accessible, and affordable ways has the potential to encourage environmentally friendly behaviors.
1.2. Sustainability in Smart Cities
A sustainable approach to managing natural resources such as fresh water, energy, land, and biodiversity involves allocating and using limited resources in ways that meet the needs of current and future generations. It also includes finding more efficient ways to use resources, protecting and conserving them, and exploring alternatives to resource use [45]. To effectively manage scarce environmental resources, it is important to understand the environmental, economic, and social factors that influence the availability and use of these resources. Policy, regulation, and other measures can be used to manage resource use and promote sustainability [46]. The carbon footprint is primarily caused by the greenhouse gasses that humans emit into the atmosphere to produce energy. As a result of these emissions, climate change poses a major threat to environmental sustainability as mentioned before [47,48]. Reducing humanity’s carbon footprint is critical to preserving the environment for future generations. Through efficient energy use and conservation, the use of renewable energy sources, shifting from high carbon footprint activities to low carbon footprint activities, and reducing the use of fossil fuels in transportation and other emission generating activities in smart cities that contribute to carbon emissions, this paper focuses on improving energy efficiency and conservation through energy efficient vehicles, transportation, and reducing emissions caused by transportation.
As a smart city strives for environmental sustainability, its target audience is its customers and citizens. Customers and citizens have to make some decisions based on their needs and requirements to achieve their goals. Nevertheless, some approaches to environmental sustainability do not fit into the customers’ comfort zones, especially those related to mobility and transportation. Replacing the exclusive or unnecessary use of private vehicles with public transportation or even carbon-free alternatives, such as walking and biking, requires a positive attitude toward customer behavior and an understanding of green approaches.
1.3. Citizen Behaviors for Sustainability in Smart Cities
Green products, programs, and approaches to environmental sustainability are developed and promoted through green marketing. Green customer value refers to the perceived benefits that customers derive from environmentally friendly and sustainable products and services. Moreover, consumers who exhibit environmentally conscious behaviors make choices and take actions that result from their concern for the environment. Green marketing (GM) and green customer value (GCV) contribute to environmentally conscious consumer behavior (ECB), and PEB’s are key factors to consider in behavioral approaches to achieve successful goals [49]. In green marketing (GM), products or services are marketed on the basis of their environmental benefits or features. The use of eco-labels, promotion of energy efficiency, or promotion of sustainable materials are examples of this type of marketing [50]. Green customer value (GCV) refers to the value that environmentally conscious consumers place on products and services that are environmentally friendly. In addition to having an environmental benefit, such as reducing carbon emissions or reducing waste, this value may also reflect factors such as social responsibility as well as ethical considerations [51]. The term “pro-environmental behavior” refers to actions taken by individuals or organizations to reduce their environmental impact [52]. Recyclables, energy-efficient products, and the use of public transportation are some examples of these behaviors. Eco-conscious consumer behavior (ECB) refers to consumer attitudes and behavior that take into account how they affect the environment and make purchasing decisions accordingly. There may be consumers who are seeking out products that are environmentally friendly or sustainable, and they may be willing to pay a higher price for products that align with their values [53]. These concepts are important for businesses and marketers to understand in light of the increasing awareness of the environment among consumers and their desire to purchase sustainable products and services. Businesses may be able to attract and retain eco-conscious customers through the use of green marketing strategies, as well as contribute to a more sustainable future through the adoption of such strategies [54,55].
Four different types of PEBs were identified, including environmental activism, non-activist behavior in the public sphere, environmental awareness in the private sphere, and other environmental behaviors. Participating in environmental social movements, donating money, holding demonstrations, and signing petitions are also forms of PEB in the public sphere [56]. In the public sphere, PEB refers to environmental behavior that involves collective action, such as filing environmental complaints, participating in environmental protection activities and organizations, and accepting environmental protection policies [57]. In contrast, private-sphere PEBs focus on ecological protection behaviors in citizen’s personal lives [58]. Purchasing, using, and disposing of household and personal products has a significant impact on the environment, and it is included under private-sphere PEB. Private-sphere PEBs include new energy vehicles, public transportation, recycling, green consumption, and energy-saving behaviors [59,60].
Psychology explains attitudes, subjective norms, perceptions of behavioral control, and the likelihood of engaging in a particular behavior using the Theory of Planned Behavior. This model is often referred to as the ABC model because it considers personal attitudes (A), subjective norms and perceived behavioral control as major factors (C) in determining behavior (B) [61]. In addition to energy conservation, recycling, and environmentally conscious purchasing, the ABC model has been applied to a variety of environmentally friendly behaviors. Several interventions have been developed to increase the likelihood of pro-environmental behaviors in individuals by understanding why some individuals engage in more pro-environmental behaviors than others [62].
1.4. Enterprise Architecture for Smart City Applications
Generally speaking, Enterprise Architecture (EA) refers to the discipline of proactively and holistically leading an enterprise response to destructive forces through identifying and analyzing the execution of change towards the attainment of our desired business outcomes and visions. To achieve such a complex and integrated sustainable system, a good Enterprise Architecture is required for end-to-end MaaS implementation on a large scale. Organizations are structured and operated according to an Enterprise Architecture (EA), which is a conceptual blueprint. An Enterprise Architecture is intended to help determine how an organization can achieve its current and future objectives in an efficient manner [63]. The practice of Enterprise Architecture involves analyzing, planning, designing, and eventually implementing the results of the analysis within an organization, provide a systematic approach for the products, services, information systems, system of systems, or business enterprises. Four well-known Enterprise Architectur’s are the Zachman Framework, the Federal Enterprise Architecture Framework (FEAF), the Department of Defense Architecture Framework (DoDAF), and the Open Group Architecture Framework (TOGAF) [64]. The Zachman Framework initially emerged in the 1980s as a two-dimensional 30-cell taxonomy for architectural descriptions [65]. The Federal Enterprise Architecture Framework (FEAF) is a rather comprehensive EA guidance developed specifically for the U.S. Federal Government in the end of the 1990s [66]. The Department of Defense Architecture Framework (DoDAF) emerged in the mid-2000s as a common approach to architecture for the U.S. Department of Defense (DoD) and represents an evolution of the earlier C4ISR framework born in the 1990s [67]. The Open Group Architecture Framework (TOGAF) was created by the Open Group in the mid-1990s from the materials of the earlier TAFIM framework [68].
The paper is organized in parts providing the information for understanding the overall sustainability of the environment as described in the this introduction. The materials and methods section examines how to manage specific resources to reduce energy consumption and reduce humanity’s carbon footprint through transportation with MaaS in smart cities. How to achieve this goal with an ICT framework and an integration model that incorporates citizen behavior are explained in the framework model and modules section. Results and a case study for a sample metropolitan city demonstrate how the system can be implemented.
2. Materials and Methods
This paper aims at environmental sustainability to reduce energy consumption and reduce the carbon footprint of humanity in smart cities by using a MaaS solution. This is a mobility-as-a-service approach coupled with hyper-integrated ICT solutions, such as blockchain, cloud computing, microservices-based software architecture, and fully integrated web services, via API supported by DevSecOps practices and includes software features based on green marketing (GM), green customer value (GCV), pro-environmental behaviors (PEBs), and eco-conscious consumer behavior (ECB) approaches.
The theoretical framework for this work is based on the ABC and the PEBs, which state that internal and external factors influence pro-environmental behavior.The ABC model and the PEBs are both useful frameworks for designing products that are easy and appealing to use and that provide users with a sense of control and reward for using them. The idea of those frameworks supports the designed framework by a gamification which engages users to do more than others and also a reward system protected by blockchain infrastructure for their PEBs. Attitudinal factors are internal elements that include individuals’ views and opinions, while contextual variables are external elements that include social norms, financial support, and institutional influences [69]. Actions that promote the environment or reduce negative impacts on nature are considered environmentally friendly behavior. Conserving natural resources, reducing energy consumption, reducing waste, protecting biodiversity, and supporting environmentally friendly practices are all examples of environmentally friendly behavior. Turning off lights when not in use, using public transportation or a fuel-efficient vehicle, using reusable bags instead of disposable bags, supporting environmentally conscious businesses, and participating in activities that help the environment, such as recycling, are also examples of environmentally friendly behavior [70].
In addition to caring about the environment and wanting to preserve natural resources for future generations, environmentally friendly behavior can be motivated by moral or ethical principles [69]. Researchers have found that pro-environmental behavior is influenced by a number of factors, including personal values, social norms, perceived behavioral control, and available resources and infrastructure. Developing policies and strategies that encourage and support pro-environmental behavior can be facilitated by understanding the factors that influence this behavior [71,72,73].
By providing convenient and affordable alternatives to owning a car, MaaS can be a great way to combine MaaS and PEBs for sustainability, because it is more sustainable than owning a car, and it provides convenient and affordable options for transportation. Utilizing public transportation, carsharing, and active transportation (e.g., walking and biking) with MaaS systems can make it easier for people to choose more sustainable modes of transportation. The result is fewer cars on the road and fewer transportation-related greenhouse gas emissions.
As mentioned earlier, there are many complicated and different systems for the end-to-end solution. In order to implement a sustainable smart city MaaS solution and transform urban transportation services, both the demand side of the transportation sector and the supply side of the transportation sector need to be transformed from the perspective of all stakeholders. Traditionally, urban services have been delivered in silos and isolated services and applications using the traditional approach. Instead of the traditional management model with functionally oriented service providers that rely on individual communication of city residents with vertical silos that do not cooperate in the use of services, the smart city approach requires that users receive an uninterrupted and holistic service based on their transportation needs. In traditional governance models, urban services are delivered through closed systems that are disconnected, resident-centric, and ineffective. They are not open to innovation and cross-system integration and cannot respond quickly to changes in city size, data sharing between application silos, streamlined data distribution and use, levels of service delivery, and innovation by residents, technology vendors, and service providers based on the smart city approach. Thus, for smart city solutions to be successful, urbanization services must be user-centric, fully integrated and developed/improved according to user expectations, and enhanced by new technologies.
2.1. Proposed Enterprise Architecture Framework
To achieve environmental sustainability with MaaS in smart cities, the application framework and interoperability model must be adaptable to citizens’ daily routines. As mentioned earlier, sustainability and pro-environmental behavior are closely related, as eco-friendly behaviors can contribute to the long-term sustainability of natural resources and ecosystems. Eco-friendly practices can be adopted and consumed by individuals, organizations, and communities to reduce negative ecological impacts and promote the long-term sustainability of natural systems. A recent study shows that it is possible to adopt environmentally beneficial technologies and products that are new to the market (called eco-innovations), such as electric cars or cultured meats, or to adopt new forms of activities to mitigate new environmental threats, such as using public transportation rather than private cars or following new environmental regulations [74].
Figure 1 shows the high-level architecture of the proposed framework with hyper-integrated service architecture. As you can see from the figure, the high-level architecture enables various integrations, starting from IoT sensors for smart city applications that support and provide information such as air quality, noise level, traffic congestion, availability of green vehicles, such as e-scooters and e-bikes and their battery level for travel planning, etc. The architecture also connects blockchain services via a dynamic hub that allows the system to use public and private blockchain services seemingly seamlessly. Users have the ability to access the system through a mobile application, as the majority of users will be on the go while using the application. However, for back-office users, reports, logging, system definitions, campaigns, rules, and settings, the traditional enterprise web applications are available.
Figure 2 shows the technical perspective of architecture as a functional approach. The functional approach includes all the detailed DevSecOps practices, such as governance, cybersecurity, log management, regulation engine, authentication, single sign on, microservice-based continuous integration and continous delivery approach, scalability, and usage capabilities. Since these technical details are broad technical issues and are not the focus of the paper, the details are explained as a resource. To achieve this, such an integrated system should meet the key requirements and features explained in the figures and satisfy certain conditions, which are listed below in alphabetical order;
- Achievable environmental sustainability goals;
- Distributed and flexible infrastructure for easy implementation;
- Easy integration of potential shareholders, policy makers and citizens;
- Easy maintenance with affordable technology requirements;
- Implemented governance and security;
- Interactive and attractive to users;
- Responsible practices for all sides;
- Respect for the sensitivity and priorities of users and shareholders;
- Support of social media to spread acceptanc;e
- Transparent operation with respect for privacy;
- User-friendly interface across different platforms for all parties as well as different generations.
Because of these requirements and expectations, today’s ICT systems provide this framework and interoperability model through the use of hyper-integration with microservices via cloud services. The main modules are the gamification module, blockchain infrastructure module, commodity exchange, rules and carbon calculations, and system core integration module and support modules, such as security, governance, privacy, and fraud.
2.2. Modules
2.2.1. Gamification Module
Gamification uses game principles and mechanisms in non-game contexts to motivate and engage people. Education, information studies, human–computer interaction, and health are just a few of the areas where gamification has attracted the interest of researchers, practitioners, and businesses [75].
A gamification approach to environmentalism encourages environmentally friendly behavior by making it more fun and engaging [76]. There are good examples of different gamification techniques for various areas, such as education [77] and training [78]. The use of gamification can motivate people to recycle more, save energy, or get involved with the environment. Gamification can also be used to create a sense of competition or community around environmental goals in smart cities, which can increase motivation and support for environmental actions [79].
In many organizations today, gamification consists of points, badges, levels, and rewards. Businesses, marketing campaigns, websites, applications, online communities, as well as school classes and college courses have proved to be effective and fun ways to engage target audiences with game mechanics [80]. It is predicted that the gamification market will grow by 27.4 percent between 2020 and 2025, reaching USD 30.7 billion in value [81]. Some successful examples of gamification are Verizon Wireless increasing visitors’ browsing time by 30 percent by using badges and points on its website [82], and a gamified annual review experience was developed by LivingSocial, which resulted in over 90 percent of its users participating voluntarily [83]. Within the use of gamification in business, four main types of gamification elements employees encounter are the use of badges (71 percent), apps that score employee performances (59 percent), virtual or physical rewards (56 percent), and leader boards (51 percent) [84].
A pre-research exercise conducted by the author and colleagues from the Turkish–German University from Istanbul, Turkey, the University of Maribor and ACE Kıbla from Slovenia, and the ZentralWeb GmbH from Germany in the EU funded the Erasmus+ Green Energy Skills for Youth Project which deals with the comprehensive collection of ‘green education’ programs and activities for youth aged between 13 and 25. The main objectives of the project are to increase awareness and competencies of youth for green energies so that they will master skills on climate change, ecosystem, energy production and conservation, management of waste and recycling, pollution, carbon footprint, etc. Mobile and web-based games support the education and training for young people in green energy and environmental sustainability and awareness. The usability data has been collected since 2017 from the games for badges and rankings. We also collected pre- and post-surveys from users. The surveys included 128 young people from 3 different countries: 36 students from Turkey, 29 students from Germany, and 63 students from Slovenia who took the trainings and also played the games. According to the feedbacks, the top three types of games are action, arcade, and adventure games as their first choice. This is followed by trivia and puzzles in second place and simulations as their third choice. The ratios vary between genders, education, and ages as well as their time for playing without a significant model. This result illustrates that gamification requirements should be made player- and user-specific within general parameters. With the addition of leader boards and badges for these games, the attention and willingness to play and learn increased with different ratios from 8 percent to 20 percent. This result was calculated by game playing time as well as achievement points and scores from game servers. However, it is obvious that young people play more when they are close to a badge or a level increase in the leader board.
As a result of the game research, a variety of game-like elements are included in the proposed framework and gamification module to encourage and reward specific behaviors, such as points, badges, leader boards, and other game-like elements for environmental sustainability goals. Gamification can be integrated into smart city applications through the use of framework technology, mobile native apps, and project websites or more traditional methods of education and outreach. This is because gamification holds great potential as a tool to encourage environmentally friendly behavior and support the adoption of more sustainable practices in MaaS applications. The framework supports the following features for gamification purposes: citizens can collect rewards, points, badges, leader boards, and direct carbon sustainability coins from the system by using the following methods;
- Scenarios as a series of events to be completed or achieved, such as using a bicycle at least once a week, switching from private to public transportation, using electric vehicles for a certain distance, checking in and out of special venues, and so on;
- Supported scenarios and events of shareholders and sponsors using the MaaS system in combination with campaigns;
- Social impact, society jobs and duties, performing outreach and raising awareness;
- Events and attractions, such as attending a sponsorship event, seminars, training, online training, information gathering related to carbon footprint, environmental sustainability, pollution, global warming, habitats and biodiversity, etc.
2.2.2. Blockchain Infrastructure Module
Blockchain is actually a distributed ledger database or registry that is accessible to all authorized participants. The ledger or database records every transaction of all participants. Through this registration process, a chain is created by taking information from the block to which it is to be added. To change a record in this chain, all records up to that record must also be changed. Because of this distributed architecture, blockchain servers keep records anonymous so that in the event of a dispute or disagreement, the correct record is always stored. Blockchain servers are used for verification and control to ensure that consensus is reached. During all these stages, records and transactions can be encrypted according to the blockchain algorithm [85]. There is a lot of speculation about blockchain technology today, as it is an infrastructure technology that is also mixed with cryptocurrency processes and cryptocoin markets. A well-known cryptocurrency called Bitcoin was introduced to the world as a digital currency in the paper Bitcoin: A Peer-to-Peer Electronic Cash System, which is also based on blockchain infrastructure [86].
However, the use of blockchain infrastructures is completely safe and free from speculation. The main reason for implementing such blockchain architecture is to create transparency, distributed security, and globalization for carbon markets and carbon coins. There are several examples of blockchain use in education, healthcare, and financial services [87,88,89]. There are a number of different technologies used in the implementation of the blockchain module in the framework, using two major blockchain ecosystems. Ethereum and Hyperledger are two major ecosystems to implement practical private and public blockchain infrastructure. A smart contract is a computer program that is stored on a blockchain and is designed to execute when certain conditions are met [90]. Programming languages, such as Solidity, are commonly used, and blockchain networks, such as Ethereum, are commonly used to deploy them. In addition to being secure, transparent, and immutable, smart contracts have a number of other advantages [91]. All network participants can see the execution of a protocol once it has been deployed on the blockchain, and they cannot be altered or deleted once they have been deployed [92].
In the proposed framework, blockchain modules implement cryptographic techniques to secure data on the blockchain and verify transactions based on selected ecosystems, and distributed ledger technology enables decentralized storage and management of data on a blockchain, allowing multiple parties to access the same information without a central authority. In this way, the system and framework do not need a central authority to be successful. Since humanity has a world with many different countries, policies, laws, and agreements, a system without central authority is much more sustainable. All transactions in the framework, such as gamification processes, carbon credit revenues, rewards, mobility offers, personal choices for a low carbon footprint, sponsorship events, badges, promotions, and events, are stored as smart contracts. Smart contracts ensure that transactions are executed according to the predetermined rules and conditions in the proposed framework, which makes them more secure and reduces the risk of fraud or errors. The rules and conditions are also used to enforce the contract terms through an automation process of the framework. Since there are many potential users, the system shareholders need a consensus algorithm that ensures the integrity and security of the blockchain by allowing participating server nodes to agree on the validity of transactions. Blockchain interoperability protocols within the framework enable cross-chain transactions and the creation of hybrid blockchain systems by allowing communication and exchange of data between blockchain systems between modules.
2.2.3. Commodity Exchange Market, Rules, and Carbon Calculations Module
To combine gamification with real-use cases, scientifically accepted and explainable measurement and counting systems are required. The system consists of different dimensions, and the formulas for the calculations vary from smart city to smart city, as do the MaaS services, even depending on the time zone. This module calculates the points and credits required for carbon trading, bartering, discounts and promotions, gamification points and rewards, free-to-use goods, and transactions for framework coin wallets. Since it is all about environmental sustainability and the framework focuses on emissions, a carbon credit is a unit of measurement used to quantify and reduce greenhouse gas emissions. Governments and businesses often use them to reduce carbon footprints and mitigate the negative effects of climate change.
Carbon credits represent a reduction in carbon dioxide emissions or their equivalent in other greenhouse gasses. Carbon markets, such as the European Union Emissions Trading System (EU ETS) and the Chicago Climate Exchange (CCX), allow carbon credits to be bought and sold. The two main types of carbon credits are compliance credits and voluntary credits. Compliance credits are used by governments and companies to meet mandatory emission reduction targets. On the other hand, voluntary credits are purchased by individuals or organizations who wish to offset their own emissions or support emission reduction projects. Our framework offers both mandatory and voluntary credits.
A voluntary carbon credit is a carbon emissions reduction credit that individuals or organizations purchase to offset their own carbon emissions and can be used for commodity exchange and gaming purposes in the system. The credits are not purchased to meet mandatory emissions reduction targets but to reduce an individual or organization carbon footprint or support sustainability initiatives in the system. Some examples of voluntary carbon credits in this module include renewable energy credits, such as for using electricity in MaaS systems; carbon offset credits, such as for switching from private vehicles to public transportation or zero-emission alternatives; verified carbon standard (VCS) credits provided by sponsors, municipalities, and government agencies in smart cities; and gold standard credits for meeting the highest standards for sustainability, environmental sustainability, and social and economic benefits for the smart city.
On the other hand, carbon credits are used by governments, cities, and companies to meet mandatory emissions reduction targets. These are the shareholders of the system to benefit from the results and environmental sustainability of the system aimed at national or international agreements such as the Paris Agreement or other national or regional laws and regulations, such as credits from the European Union Emissions Trading System (EU ETS), credits from the Kyoto Protocol, credits from the Clean Development Mechanism (CDM), and credits from the Regional Greenhouse Gas Initiative (RGGI).
2.2.4. System Core Integration Module
The integration module integrates activities within a city and between shareholders, and the system is also used for national and international collaborations, as well as for the integration of sensors, data analytics, and the Internet of Things (IoT). It is a fully managed protocol system that includes fail over approaches, real-time tracking and monitoring systems, relational database system integration for regular software engineering best practices, and blockchain implementations.
This geo-redundant cloud-based architecture operates as a PaaS system with a hyper-converged approach. All smart city data center components are tightly integrated and optimized for collaboration and managed by a software platform framework. A hyper-integrated and hyper-convergent architecture enables easy scaling up or down as new cities, new activities, and new stakeholders want to collaborate, resources can be quickly and easily added or removed as requirements change.
2.2.5. Support Modules and Algorithms
Enterprise-level ICT approaches are provided in the framework support modules. Examples include fraud detection and the introduction of greater enterprise level cybersecurity. Detecting fraud usually involves using advanced analytics and machine learning algorithms to analyze large volumes of data to find patterns, anomalies, and other indicators of fraud [93,94,95]. Especially in gamification and voluntary carbon credits, any fraudulent or dishonest activity should be detected within these modules. In addition, developing comprehensive cyber security strategies and practices is crucial to reducing cybersecurity risks, and protecting cities against cyberattacks and threats is crucial [96,97].
2.3. The Formulation of Activities for Gamification and Smart Contracts
The formulation of any activity for the gamification and smart contracts for the MaaS for a smart city is calculated by a multi-criteria and multi-objective function. This paper aims to propose a framework and module interoperability, so numerical values for computation parameters are not included as they may belong to other research studies. In spite of this, a case study section has been provided as an example of a calculation approach. All these parametric fields are not mandatory and can be flexibly evaluated or excluded for different purposes, goals, and cultures. It is quite normal that the goals and expectations of a tourist city and a city with industrial production are different in terms of sustainability. The activity credit value is then calculated using the following formulation;
Activity parameters are transferred in a JSON file. JSON (JavaScript Object Notation) is a lightweight data interchange format that is easy for humans to read and write and easy for machines to parse and generate. JSON data are represented as key-value pairs, where the keys are strings, and the values can be any valid JSON data type, such as a string, number, object, array, boolean, or null. The system offers to use JSON Schema for the application, a vocabulary that allows shareholders to validate JSON data against a defined set of rules for the system. JSON is used for transferring all the index and attribute values.
2.3.1. Activity-Specific Parameters
x: This is an activity metering numerical values, such as distance, duration, time, carbon cost, etc. Since x is a required field, it is shown outside the JSON file. Normally, it will be transferred within the JSON.
Base Activity Attribute (BAA): This is the multiplier measurement value for the calculation, such as the traffic intensity, weather status, temperature, and the time of day to use the system.
Switching Index (SI): Switching costs for low-carbon products or services refer to the costs associated with switching to products or services with a lower carbon footprint. Learning costs for new products and services and fees or penalties are associated with terminating existing products and services, so citizens may need to be encouraged to leave their comfort zone. It is important to note that the costs associated with switching can be a significant barrier to adoption. This is especially true for individuals and organizations with an already high standard of living. The switching index is also required for the referral system in conjunction with the comfort level. Switching from a private car to crowded public transportation during rush hour should be different than switching from an e-bike to an e-scooter.
Activity Constant Parameters: This is a specific activity related to the activity generated by sending all required information in a JSON to an integrated web API function. They include mplementing dynamic rules related to the activity, verifying that certain conditions are met, such as verifying the time of day, location zone, activity prior to the request, or image processing, by the rules engine that verifies that safety equipment and wearing reflective gear is visible on a selfie taken with the mobile application.
2.3.2. City-Specific Parameters
For metropolitan cities with high population and traffic activity, these data may be very high, but for coastal tourism cities with seasonal and seasonal visitors, they will be different. In a city with high carbon sequestration capacity and abundant trees and water resources, a net zero carbon target approach might differ from one in a fully built city. It is possible to support the user in using the system with different parameters depending on what kind of city they live in.
City Specific Index (CSI): The multipliers for the city index constants are dynamic values for cities, city regions, time of activity, such as rush hour, and high-energy-demand time zones, weather, renewable energy production capacity, and similar indices to improve the adaptability and usability of the system.
City Environmental and Pollution Index (CEPI): The index measures and evaluates a city’s environmental quality and sustainability, such as air and water quality, greenhouse gas emissions, waste management, air pollution, water pollution, noise pollution, and other environmental factors. Some examples of this index are the Air Quality Index, the Water Quality Index, and the Noise Pollution Index.
City Environmental Sustainability Index (CESI): The index measures and evaluates the sustainability of a city, including economic and social factors. Some examples of this index are the Global Cities Index, the Arcadis Sustainable Cities Index, and the Green City Index.
City Public Transportation Index (CPTI): The index measures and evaluates the quality and accessibility of public transportation in a city, such as the availability and reliability of different modes of transportation, the efficiency of the transportation system, and the level of service provided to users. The number of public transportation modes available, frequency of service, service area, number of trips provided for MaaS, speed and reliability of service, and customer satisfaction are measured. Some examples of this index are Transit Score and the Public Transport Accessibility Level (PTAL) Index.
City Demography Index (CDI): The index measures and evaluates the characteristics of a city’s population, such as its size, age structure, racial and ethnic composition, and other demographic characteristics. Population size and density, age distribution, sex ratio, racial and ethnic diversity, income level, education level, and employment status are measured. Some examples of this index are the United Nations Development Program’s Human Development Index and the United States Census Bureau’s American Community Survey.
City Technology Index (CTI): The index measures and evaluates the technological infrastructure and level of adoption in a city. It typically consists of a set of indicators that reflect the availability and use of different types of technology, such as broadband Internet, mobile coverage, and other digital technologies. Some examples of this index are the Broadband Quality Index and the Digital Capital Index.
City Culture and Knowledge Index (CCKI): The index measures and evaluates the knowledge and cultural resources of a city. It usually consists of a set of indicators that reflect the availability and quality of educational and cultural facilities, as well as the level of cultural participation and engagement of the city’s population, reflecting its adaptability to the framework. Some examples of this index are the Global Cities Education Network Index and the Cultural Vitality Index.
2.3.3. Policy-Specific Credit Parameters
Voluntary carbon credits (VCC): This is the multiplier for the credits that are constant for carbon credits for transactions as defined by local authorities, sponsors, and events.
Compliance credits (CC): The transaction multiplier is set by the international and national authorities and company policies, such as withholding taxes or fees, salary promotions due to carsharing, and carsharing or cycling to work.
An unfair advantage over other users can be gained by cheating, manipulating game mechanisms, or exploiting vulnerabilities in the system. To protect the system and the model, cheating should be avoided to improve the user experience. Recommendation systems (RS) filter out information and suggest items of interest to users based on their preferences for MaaS [98]. The framework also has a recommendation system that suggests different MaaS alternatives for citizen transportation needs. Depending on different activity types as mentioned below, the framework recommendation system offer alternatives to the users;
- Direct Activity: A direct activity includes mobility and transportation activities in the MaaS system. Direct activities can be organized as single activities or as a sequence of activities, such as starting mobility with public transportation, such as the subway, then transferring to a public bus, using an e-scooter, and finally walking to the destination.
- Indirect Activities: Indirect activities do not include physical contributions through transportation, but they do include education, sponsorship of events, volunteer tasks, participation in seminars, social media activities, and information gathering. Direct activities can be organized individually or in a sequence or mix of activities, such as participating in an online seminar on carbon footprint, posting sponsor or government events on social media, reading a QR code from a billboard, or participating in a sports activity within a month.
- Hybrid Activity: Hybrid activities consist of both direct and indirect activities in a sequence or mixed sequence.
The recommender system algorithm is given in Algorithm 1. As be can seen from the algorithm, a constraint checker service is implemented before and after the selection of activities, which independently checks the rules, regulations, and principles. The system organizes hyper-integration with synchronized microservices within the system, as well as connection to service providers and shareholder cooperation services. For example, a discount for a service provided by the city, such as transportation, natural gas bill, property tax, or even a simple treatment from sponsors, can be organized, controlled, and distributed with these integrated systems.
| Algorithm 1: Activity Recommender System |
|
Collaborative filtering, carbon footprint-based filtering, and hybrid approaches can be implemented in this module. Mobile and native web applications that simulate citizen locations, from and to destinations, time and other constraints, user preferences, habits, dynamic scoring and gamification approaches, bundled services, asset availabilities, value-added shareholder services and recommendations, and carbon calculations and present them to system users to choose between different MaaS alternatives. Service provider and shareholder back-office systems also provide a similar approach from their perspective to set rules, adjust constraints, and implement new alternatives.
3. Results and Case Study for the Framework
The city of Istanbul, which has a suitable technological and communication infrastructure as well as alternative transportation options, is first and foremost necessary for the verification and successful functioning of this system. An adaptable, dynamic, environmentally sensitive potential user population that can utilize the proposed system is selected, as well as an individual who believes in smart city processes and has implemented projects in this regard. Istanbul is the fifth-largest city in the world, with more than 18 million residents, nearly 2 million students, and nearly 5 million vehicles. The economy of Istanbul surpasses that of more than 130 countries. The city has a variety of public transportation options, including the metro, railways, light rail, public buses, metro buses, sea buses, and ferries. In addition, there are three bridges over the Bosphorus channel and one underground tunnel. The city also offers city bikes, e-scooters, and shared car service providers, making it a good PoC proof of concept approach for MaaS. Currently, municipality transportation systems have a payment-only based MaaS infrastructure based on the Istanbul Metropolitan Municipality (IMM) RFID Card. However, this system is not connected to e-bike, taxi, and scooter rental companies [99].
As can be seen from Table 1 and the min/max normalized values of the data from Figure 3, traffic intensity affects air quality indicators and creates a cycle during the day. As part of the sustainable environment approach, more emission-free vehicles and transportation alternatives are sought to reduce traffic. The data are taken from the open data platform for June to August to exclude emissions caused by fossil-fuel-fired space and house heating and extra traffic caused by school services.
3.1. Activity Switching Scenarios
This section examines the possibility of providing alternative transportation as a service in the context of two sample activity chains. Among these scenarios, the first provides a viable plan for travel with a single person in a vehicle, which has the greatest impact on traffic congestion as well as emissions. In the second alternative, alternative transportation plans for a person who uses public transportation were evaluated. The basic indexes of the city will be the same in both scenarios. For the scenarios, 3 basic time spans are taken as can be easily seen in Figure 3 as morning rush hour 7–10, midday 11–17, and afternoon rush hour 18–22 h. The zones can either be selected with more intermittent time spans or can be obtained directly from an open data service provided by the city, which is not the purpose and scope of this study.
3.1.1. Parameter Setting
The parameters for calculating the activity credit are selected from fuzzy-like scale multipliers. In fuzzy domain scales, the multipliers are not numerical but consist of linguistic terms such as “very low”, “low”, “medium”, “high”, and “very high” for the city sustainability plans. The terms are not defined precisely but are meant to be interpreted by city decision makers understanding the city sustainability priority plans. Since the system is hyper-integrated and complex, such simplification is preferred for better implementation for a case study. Each multiplier is then normalized and adjusted according to the activity. However, as mentioned before, the system is not limited to using fuzzy-like scales; any numerical approach can be used in the system.
3.1.2. Switching Scenarios and Plans
Table 2 shows a sample calculation for parameters. As mentioned, those values will be different based on the city, user, and policies. However, switching from a private car to public transportation can be offered as the highest impact parameters, but for the individuals already using public transportation, different supports and sponsor contributions may be required. The change in the comfort zone will not be the same for every citizen, such as voluntary carbon credits.
4. Conclusions
Smart cities use information and communication technologies to improve the quality of life of their citizens by making the city more efficient, livable, and sustainable. Using renewable energy sources, promoting sustainable transportation, and implementing energy-efficient buildings will reduce greenhouse gas emissions and improve air quality in smart cities. This will improve the quality of life for citizens by providing better urban services, reducing congestion and pollution, and creating more livable and walkable neighborhoods. By demonstrating their commitment to sustainability and innovation, sustainable cities attract new business and investment, leading to economic development. In addition, smart cities can help reduce social inequality by giving all citizens equal access to urban services and public spaces.
Mobility as a Service (MaaS) combines a variety of transportation services into a single, convenient package that can be accessed through a single platform, provider or cloud service. These include public transportation, subways and buses, ridesharing, bike-sharing, electric vehicles, carpooling, scooters, and other forms of alternative transportation within the urban transportation network. For daily needs, getting to work, school, and social events, MaaS makes getting around the city easier and more convenient. Thanks to Big Data analytics, machine learning, privacy-friendly computing, and boundary applications, MaaS can also reduce traffic congestion and air pollution, making efficient use of transportation resources. This study is also focused on developing a computational model for calculating the swapping, changing, and bartering activity that takes place in the MaaS ecosystem in order to calculate the amount of assets moving through the ecosystem.
This paper presents a new Enterprise Architecture Framework and modules to achieve a high level of MaaS for smart cities from an environmental sustainability perspective. Dynamic, hyper-integrated ICT systems with microservices provide end-to-end solutions for all stakeholders. Gamification and blockchain infrastructure ensure system attractiveness, usability, traceability, and scalability through distributed implementation. As a novel outcome of this study, a computational model and a formulation is also proposed to calculate the activity exchange values in the MaaS ecosystem for real sustainable implementation for swapping, changing, and bartering for assets within the integrated system.
The objective of future studies is to numerically analyze results that lead to the identification of the most effective preferences of individual behaviors in gamification processes to be applied to the given architecture. In addition, with the commissioning of the system as a pilot, it is intended to create Big Data on the transportation alternatives proposed by stakeholders in the ecosystem and the reasons for preference of these alternatives, as well as to create suggestions and gamification models specific to individuals with artificial intelligence algorithms, synthetic data, and simulation alternatives based on this data. In addition, the objective is to evaluate the numerical results related to the reduction of total carbon emissions with the most suitable estimation in MaaS processes using statistical models based on the data to be collected.
Funding
This research received no external funding. Planned to apply for EU project fundings for 2023 calls.
Institutional Review Board Statement
Not applicable.
Informed Consent Statement
Not applicable.
Data Availability Statement
The data and functional details presented in this study are available on request from the corresponding author.
Acknowledgments
This work and the research on which it is based would not have been possible without the extraordinary support of Sinem Altuncu, who assisted us throughout in developing the idea, developing business plans for the project, and finding potential partners with funding prospects, and her excellent team member Ahmet İşlemecioğlu from incentive supports, Uluer Sinici for full stack DevOps perspective, Busra Berfin Orhan for her young sprit in coding for mobile applications all from Paycore and Tugkan Tuglular for his support in blockchain module and implementations.
Conflicts of Interest
The author declares no conflict of interest.
Sample Availability
Samples of the framework coding and detailed technical details are available from the authors.
Abbreviations
The following abbreviations are used in this manuscript:
| CDM | Clean Development Mechanism |
| CCX | Chicago Climate Exchange |
| DoDAF | Department of Defense Architecture Framework |
| EA | Enterprise Architecture |
| EU | European Union |
| FEAF | Federal Enterprise Architecture Framework |
| JSON | Java Script Object Notification |
| ICT | Information and Communication Technologies |
| IMM | Istanbul Metropolitan Municipality |
| MaaS | Mobility as a Service |
| RFID | Radio Frequency Identification Systems |
| RGGI | Regional Greenhouse Gas Initiative |
| TOGAF | The Open Group Architecture Framework |
| VCS | Verified Carbon Standard |
References
- Montzka, S.A.; Dlugokencky, E.J.; Butler, J.H. Non-CO2 greenhouse gases and climate change. Nature 2011, 476, 43–50. [Google Scholar] [CrossRef] [PubMed]
- Crawford, R. Life Cycle Assessment in the Built Environment; Routledge: Abingdon-on-Thames, UK, 2011. [Google Scholar]
- Michener, W.K.; Blood, E.R.; Bildstein, K.L.; Brinson, M.M.; Gardner, L.R. Climate change, hurricanes and tropical storms, and rising sea level in coastal wetlands. Ecol. Appl. 1997, 7, 770–801. [Google Scholar] [CrossRef]
- Pimentel, D.; Berger, B.; Filiberto, D.; Newton, M.; Wolfe, B.; Karabinakis, E.; Clark, S.; Poon, E.; Abbett, E.; Nandagopal, S. Water resources: Agricultural and environmental issues. BioScience 2004, 54, 909–918. [Google Scholar] [CrossRef] [Green Version]
- Haines, A.; Kovats, R.S.; Campbell-Lendrum, D.; Corvalán, C. Climate change and human health: Impacts, vulnerability and public health. Public Health 2006, 120, 585–596. [Google Scholar] [CrossRef]
- World Health Organization. Climate Change and Human Health: Risks and Responses; World Health Organization: Geneva, Switzerland, 2003. [Google Scholar]
- Knowlton, K.; Sorensen, C.; Lemery, J. Global Climate Change and Human Health: From Science to Practice; John Wiley & Sons: Hoboken, NJ, USA, 2021. [Google Scholar]
- Patz, J.A.; Campbell-Lendrum, D.; Holloway, T.; Foley, J.A. Impact of regional climate change on human health. Nature 2005, 438, 310–317. [Google Scholar] [CrossRef]
- Goodland, R. The Concept of Environmental Sustainability. Annu. Rev. Ecol. Syst. 1995, 26, 1–24. [Google Scholar] [CrossRef]
- Bernstein, L. Climate Change 2007; desLibris: Ottawa, ON, Canada, 2013. [Google Scholar]
- Chen, A.J.W.; Boudreau, M.; Watson, R.T. Information systems and ecological sustainability. J. Syst. Inf. Technol. 2008, 10, 186–201. [Google Scholar] [CrossRef]
- Dinan, T.M. Economic efficiency effects of alternative policies for reducing waste disposal. J. Environ. Econ. Manag. 1993, 25, 242–256. [Google Scholar] [CrossRef]
- Dearborn, D.C.; Kark, S. Motivations for conserving urban biodiversity. Conserv. Biol. 2010, 24, 432–440. [Google Scholar] [CrossRef]
- Coaffee, J. Risk, resilience, and environmentally sustainable cities. Energy Policy 2008, 36, 4633–4638. [Google Scholar] [CrossRef]
- Rusinko, C. Green manufacturing: An evaluation of environmentally sustainable manufacturing practices and their impact on competitive outcomes. IEEE Trans. Eng. Manag. 2007, 54, 445–454. [Google Scholar] [CrossRef]
- Batty, M.; Axhausen, K.W.; Giannotti, F.; Pozdnoukhov, A.; Bazzani, A.; Wachowicz, M.; Ouzounis, G.; Portugali, Y. Smart cities of the future. Eur. Phys. J. Spec. Top. 2012, 214, 481–518. [Google Scholar] [CrossRef] [Green Version]
- Yin, C.; Xiong, Z.; Chen, H.; Wang, J.; Cooper, D.; David, B. A literature survey on smart cities. Sci. China Inf. Sci. 2015, 58, 1–18. [Google Scholar] [CrossRef]
- Bureau, L.A.C.C.A.; Division, L.A.C.C.A. Planning. In The State of the City Report: A Cluster Analysis of Los Angeles: A Report; Community Analysis Bureau: Los Angeles, CA, USA, 1974. [Google Scholar]
- Dashkevych, O.; Portnov, B.A. Criteria for Smart City Identification: A Systematic Literature Review. Sustainability 2022, 14, 4448. [Google Scholar] [CrossRef]
- Zheng, C.; Yuan, J.; Zhu, L.; Zhang, Y.; Shao, Q. From digital to sustainable: A scientometric review of smart city literature between 1990 and 2019. J. Clean. Prod. 2020, 258, 120689. [Google Scholar] [CrossRef]
- Hajek, P.; Youssef, A.; Hajkova, V. Recent developments in smart city assessment: A bibliometric and content analysis-based literature review. Cities 2022, 126, 103709. [Google Scholar] [CrossRef]
- Cocchia, A. Smart and digital city: A systematic literature review. Smart City: How to Create Public and Economic Value with High Technology in Urban Space; Springer: Berlin/Heidelberg, Germany, 2014; pp. 13–43. [Google Scholar]
- van Twist, A.; Ruijer, E.; Meijer, A. Smart cities & citizen discontent: A systematic review of the literature. Gov. Inf. Q. 2023, 101799. [Google Scholar]
- Stübinger, J.; Schneider, L. Understanding smart city—A data-driven literature review. Sustainability 2020, 12, 8460. [Google Scholar] [CrossRef]
- Anthopoulos, L.G. Understanding the smart city domain: A literature review. In Transforming City Governments for Successful Smart Cities; Springer: Berlin/Heidelberg, Germany, 2015; pp. 9–21. [Google Scholar]
- Ma, Z.; Wu, F. Smart City, Digitalization and CO2 Emissions: Evidence from 353 Cities in China. Sustainability 2022, 15, 225. [Google Scholar] [CrossRef]
- Rao, S.K.; Prasad, R. Impact of 5G technologies on smart city implementation. Wirel. Pers. Commun. 2018, 100, 161–176. [Google Scholar] [CrossRef]
- Guevara, L.; Auat Cheein, F. The role of 5G technologies: Challenges in smart cities and intelligent transportation systems. Sustainability 2020, 12, 6469. [Google Scholar] [CrossRef]
- Gohar, A.; Nencioni, G. The role of 5G technologies in a smart city: The case for intelligent transportation system. Sustainability 2021, 13, 5188. [Google Scholar] [CrossRef]
- Theodoridis, E.; Mylonas, G.; Chatzigiannakis, I. Developing an iot smart city framework. In Proceedings of the 4th International Conference on Information, Intelligence, Systems and Applications (IISA), Piraeus, Greece, 10–12 July 2013; pp. 1–6. [Google Scholar]
- Kim, T.h.; Ramos, C.; Mohammed, S. Smart city and IoT. Future Gener. Comput. Syst. 2017, 76, 159–162. [Google Scholar] [CrossRef]
- Ghazal, T.M.; Hasan, M.K.; Alshurideh, M.T.; Alzoubi, H.M.; Ahmad, M.; Akbar, S.S.; Al Kurdi, B.; Akour, I.A. IoT for smart cities: Machine learning approaches in smart healthcare—A review. Future Internet 2021, 13, 218. [Google Scholar] [CrossRef]
- Allam, Z.; Dhunny, Z.A. On big data, artificial intelligence and smart cities. Cities 2019, 89, 80–91. [Google Scholar] [CrossRef]
- Ullah, Z.; Al-Turjman, F.; Mostarda, L.; Gagliardi, R. Applications of artificial intelligence and machine learning in smart cities. Comput. Commun. 2020, 154, 313–323. [Google Scholar] [CrossRef]
- Chen, Q.; Wang, W.; Wu, F.; De, S.; Wang, R.; Zhang, B.; Huang, X. A survey on an emerging area: Deep learning for smart city data. IEEE Trans. Emerg. Top. Comput. Intell. 2019, 3, 392–410. [Google Scholar] [CrossRef] [Green Version]
- Xie, J.; Tang, H.; Huang, T.; Yu, F.R.; Xie, R.; Liu, J.; Liu, Y. A survey of blockchain technology applied to smart cities: Research issues and challenges. IEEE Commun. Surv. Tutorials 2019, 21, 2794–2830. [Google Scholar] [CrossRef]
- Biswas, K.; Muthukkumarasamy, V. Securing smart cities using blockchain technology. In Proceedings of the 2016 IEEE 18th International Conference on High Performance Computing and Communications; IEEE 14th International Conference on Smart City; IEEE 2nd International Conference on Data Science and Systems (HPCC/SmartCity/DSS), Sydney, NSW, Australia, 12–14 December 2016; pp. 1392–1393. [Google Scholar]
- Liu, Y.; Yang, C.; Jiang, L.; Xie, S.; Zhang, Y. Intelligent edge computing for IoT-based energy management in smart cities. IEEE Netw. 2019, 33, 111–117. [Google Scholar] [CrossRef]
- Strielkowski, W.; Veinbender, T.; Tvaronavičienė, M.; Lace, N. Economic efficiency and energy security of smart cities. Econ. Res.-Ekon. Istraživanja 2020, 33, 788–803. [Google Scholar] [CrossRef]
- Hietanen, S. Mobility as a Service. New Transp. Model 2014, 12, 2–4. [Google Scholar]
- Caballini, C.; Corazza, M.V.; Costa, V.; Delponte, I.; Olivari, E. Assessing the Feasibility of MaaS: A Contribution from Three Italian Case Studies. Sustainability 2022, 14, 16743. [Google Scholar] [CrossRef]
- Martinčević, I.; Brlek, P.; Kačarević, N.D. Mobility as a Service (MaaS) as a Sustainability Concept for Tourist Destinations. Sustainability 2022, 14, 7512. [Google Scholar] [CrossRef]
- Kim, S.; Choo, S.; Choi, S.; Lee, H. What factors affect commuters’ utility of choosing mobility as a service? An empirical evidence from seoul. Sustainability 2021, 13, 9324. [Google Scholar] [CrossRef]
- Baldi, G.; Megaro, A.; Carrubbo, L. Small-Town Citizens’ Technology Acceptance of Smart and Sustainable City Development. Sustainability 2022, 15, 325. [Google Scholar] [CrossRef]
- Wilson, K.A.; Underwood, E.C.; Morrison, S.A.; Klausmeyer, K.R.; Murdoch, W.W.; Reyers, B.; Wardell-Johnson, G.; Marquet, P.A.; Rundel, P.W.; McBride, M.F. Conserving biodiversity efficiently: What to do, where, and when. PLoS Biol. 2007, 5, e223. [Google Scholar] [CrossRef]
- Mckenzie-Mohr, D. New ways to promote proenvironmental behavior: Promoting sustainable behavior: An introduction to community-based social marketing. J. Soc. Issues 2000, 56, 543–554. [Google Scholar] [CrossRef]
- Owusu, P.A.; Asumadu-Sarkodie, S. A review of renewable energy sources, sustainability issues and climate change mitigation. Cogent Eng. 2016, 3, 1167990. [Google Scholar] [CrossRef]
- Beg, N.; Morlot, J.C.; Davidson, O.; Afrane-Okesse, Y.; Tyani, L.; Denton, F.; Sokona, Y.; Thomas, J.P.; La Rovere, E.L.; Parikh, J.K.; et al. Linkages between climate change and sustainable development. Clim. Policy 2002, 2, 129–144. [Google Scholar] [CrossRef]
- Chen, L.; Matloob, S.; Sunlei, Y.; Qalati, S.A.; Raza, A.; Limón, M.L.S. A Moderated–Mediated Model for Eco-Conscious Consumer Behavior. Sustainability 2023, 15, 897. [Google Scholar] [CrossRef]
- Cronin, J.J.; Smith, J.S.; Gleim, M.R.; Ramirez, E.; Martinez, J.D. Green marketing strategies: An examination of stakeholders and the opportunities they present. J. Acad. Mark. Sci. 2011, 39, 158–174. [Google Scholar] [CrossRef]
- Almoussawi, Z.A.; Sarhed, J.N.; obay Saeed, M.; Ali, M.H.; Wafqan, H.M.; Abd Alhasan, S.A. Moderating The Role of Green Trust in The Relationship of Green Brand Positioning, Green Marketing, Green Production, and Green Consumer Value on Green Purchase Intention of University Students in Iraq. Transnatl. Mark. J. 2022, 10, 738–750. [Google Scholar]
- Lange, F.; Dewitte, S. Measuring pro-environmental behavior: Review and recommendations. J. Environ. Psychol. 2019, 63, 92–100. [Google Scholar] [CrossRef]
- Connell, K.Y.H. Internal and external barriers to eco-conscious apparel acquisition. Int. J. Consum. Stud. 2010, 34, 279–286. [Google Scholar] [CrossRef]
- Pastakia, A. Grassroots ecopreneurs: Change agents for a sustainable society. J. Organ. Change Manag. 1998, 11, 157–173. [Google Scholar] [CrossRef]
- Hameed, I.; Waris, I.; Amin ul Haq, M. Predicting eco-conscious consumer behavior using theory of planned behavior in Pakistan. Environ. Sci. Pollut. Res. 2019, 26, 15535–15547. [Google Scholar] [CrossRef] [PubMed]
- Hadler, M.; Haller, M. Global activism and nationally driven recycling: The influence of world society and national contexts on public and private environmental behavior. Int. Sociol. 2011, 26, 315–345. [Google Scholar] [CrossRef]
- Steg, L.; Vlek, C. Encouraging pro-environmental behaviour: An integrative review and research agenda. J. Environ. Psychol. 2009, 29, 309–317. [Google Scholar] [CrossRef]
- Balzekiene, A.; Telesiene, A. Explaining Private and Public Sphere Personal Environmental Behaviour. Soc. Sci. 2012, 4, 7–19. [Google Scholar] [CrossRef]
- Stern, P.C. Psychological dimensions of global environmental change. Annu. Rev. Psychol. 1992, 43, 269–302. [Google Scholar] [CrossRef]
- Stren, P.C. Toward a coherent theory of environmentally significant behaviour. J. Soc. Issues 2000, 56, 407–424. [Google Scholar] [CrossRef]
- Ertz, M.; Karakas, F.; Sarigöllü, E. Exploring pro-environmental behaviors of consumers: An analysis of contextual factors, attitude, and behaviors. J. Bus. Res. 2016, 69, 3971–3980. [Google Scholar] [CrossRef] [Green Version]
- Farrow, K.; Grolleau, G.; Ibanez, L. Social norms and pro-environmental behavior: A review of the evidence. Ecol. Econ. 2017, 140, 1–13. [Google Scholar] [CrossRef]
- Dandashi, F.; Siegers, R.; Jones, J.; Blevins, T. The Open Group Architecture Framework (TOGAF) and the US Department of Defense Architecture Framework (DoDAF); Technical Report; The Open Group: San Francisco, CA, USA, 2006. [Google Scholar]
- Kotusev, S. A comparison of the top four enterprise architecture frameworks. British Computer Society (BCS) 2020. Available online: https://www.bcs.org/articles-opinion-and-research/a-comparison-of-the-top-four-enterprise-architecture-frameworks/ (accessed on 20 January 2023).
- Zachman, J.A. A framework for information systems architecture. IBM Syst. J. 1987, 26, 276–292. [Google Scholar] [CrossRef]
- Chief Information Officers Council. Federal Enterprise Architecture Framework Version 1.1; Chief Information Officers Council: Washington, DC, USA, 1999; Volume 80, pp. 1–3.
- DoD Architecture Framework Working Group. DoD Architecture Framework Version 1.0, Volume I: Definitions and Guidelines; Department of Defense: Washington, DC, USA, 2004.
- Kotusev, S. TOGAF Version 9.2: What’s New. British Computer Society (BCS) 2020. Available online: https://www.bcs.org/articles-opinion-and-research/togaf-version-92-whats-new/ (accessed on 20 January 2023).
- Xing, Y.; Li, M.; Liao, Y. Trust, Identity, and Public-Sphere Pro-environmental Behavior in China: An Extended Attitude-Behavior-Context Theory. Front. Psychol. 2022, 13, 919578. [Google Scholar] [CrossRef]
- Thomas, C.; Sharp, V. Understanding the normalisation of recycling behaviour and its implications for other pro-environmental behaviours: A review of social norms and recycling. Resour. Conserv. Recycl. 2013, 79, 11–20. [Google Scholar] [CrossRef]
- Karp, D.G. Values and their effect on pro-environmental behavior. Environ. Behav. 1996, 28, 111–133. [Google Scholar] [CrossRef]
- Schultz, P.; Kaiser, F.G. Promoting pro-environmental behavior. In The Oxford Handbook of Environmental and Conservation Psychology; Oxford University Press: Oxford, UK, 2012. [Google Scholar]
- Turaga, R.M.R.; Howarth, R.B.; Borsuk, M.E. Pro-environmental behavior: Rational choice meets moral motivation. Ann. N. Y. Acad. Sci. 2010, 1185, 211–224. [Google Scholar] [CrossRef] [PubMed]
- Kronrod, A.; Tchetchik, A.; Grinstein, A.; Turgeman, L.; Blass, V. Promoting new pro-environmental behaviors: The effect of combining encouraging and discouraging messages. J. Environ. Psychol. 2023, 86, 101945. [Google Scholar] [CrossRef]
- Seaborn, K.; Fels, D.I. Gamification in theory and action: A survey. Int. J. Hum.-Comput. Stud. 2015, 74, 14–31. [Google Scholar] [CrossRef]
- Sailer, M.; Hense, J.; Mandl, J.; Klevers, M. Psychological perspectives on motivation through gamification. Interact. Des. Archit. J. 2014, 28–37. [Google Scholar]
- Pérez-Muñoz, S.; Sánchez Muñoz, A.; De Mena Ramos, J.M.; Rodríguez-Cayetano, A. Mario and Sonic at the Olympic Games: Effect of Gamification on Future Physical Education Teachers. Appl. Sci. 2022, 12, 9459. [Google Scholar] [CrossRef]
- Chaldogeridis, A.; Tsiatsos, T. Gamification Techniques and Best Practices in Computerized Working Memory Training: A Systematic Literature Review. Appl. Sci. 2022, 12, 9785. [Google Scholar] [CrossRef]
- Harwood, T.; Garry, T. An investigation into gamification as a customer engagement experience environment. J. Serv. Mark. 2015, 29, 533–546. [Google Scholar] [CrossRef]
- 54 Gamification Statistics You Must Know: 2023 Market Share Analysis & Data. Available online: https://financesonline.com/gamification-statistics/ (accessed on 20 January 2023).
- Gamification Market Growth Drivers & Opportunities. Markets and Markets. Available online: https://www.marketsandmarkets.com/Market-Reports/gamification-market-991.html (accessed on 20 January 2023).
- Harville, B. How You Win Big With Gamification in Marketing? Optinmonster 2020. Available online: https://optinmonster.com/gamification-in-marketing/ (accessed on 20 January 2023).
- Gamification Market Analysis—Industry Report—Trends, Size & Share. Available online: https://www.mordorintelligence.com/industry-reports/gamification-market (accessed on 20 January 2023).
- Apostolopoulos, A. Gamification at Work: The 2019 Survey Results; Talentlms: San Francisco, CA, USA, 2019. [Google Scholar]
- Yaga, D.; Mell, P.; Roby, N.; Scarfone, K. Blockchain technology overview. arXiv 2019, arXiv:1906.11078. [Google Scholar]
- Nakamoto, S. Bitcoin: A peer-to-peer electronic cash system. Decentralized Bus. Rev. 2008, 21260. [Google Scholar]
- Guo, Y.; Liang, C. Blockchain application and outlook in the banking industry. Financ. Innov. 2016, 2, 24. [Google Scholar] [CrossRef] [Green Version]
- Mettler, M. Blockchain technology in healthcare: The revolution starts here. In Proceedings of the 2016 IEEE 18th International Conference on e-Health Networking, Applications and Services (Healthcom), Munich, Germany, 14–17 September 2016; pp. 1–3. [Google Scholar]
- Sharples, M.; Domingue, J. The blockchain and kudos: A distributed system for educational record, reputation and reward. In Proceedings of the European Conference on Technology Enhanced Learning, Toulouse, France, 12–16 September 2016; pp. 490–496. [Google Scholar]
- Mohanta, B.K.; Panda, S.S.; Jena, D. An overview of smart contract and use cases in blockchain technology. In Proceedings of the 2018 9th International Conference on Computing, Communication and Networking Technologies (ICCCNT), Bengaluru, India, 10–12 July 2018; pp. 1–4. [Google Scholar]
- Watanabe, H.; Fujimura, S.; Nakadaira, A.; Miyazaki, Y.; Akutsu, A.; Kishigami, J. Blockchain contract: Securing a blockchain applied to smart contracts. In Proceedings of the 2016 IEEE International Conference on Consumer Electronics (ICCE), Las Vegas, NV, USA, 7–11 January 2016; pp. 467–468. [Google Scholar]
- Montes, J.M.; Ramirez, C.E.; Gutierrez, M.C.; Larios, V.M. Smart Contracts for supply chain applicable to Smart Cities daily operations. In Proceedings of the 2019 IEEE International Smart Cities Conference (ISC2), Casablanca, Morocco, 14–17 October 2019; pp. 565–570. [Google Scholar]
- Kou, Y.; Lu, C.T.; Sirwongwattana, S.; Huang, Y.P. Survey of fraud detection techniques. In Proceedings of the IEEE International Conference on Networking, Sensing and Control, Taipei, Taiwan, 21–23 March 2004; Volume 2, pp. 749–754. [Google Scholar]
- Bolton, R.J.; Hand, D.J. Statistical fraud detection: A review. Stat. Sci. 2002, 17, 235–255. [Google Scholar] [CrossRef]
- Sadiq, A.S.; Faris, H.; Ala’M, A.Z.; Mirjalili, S.; Ghafoor, K.Z. Fraud detection model based on multi-verse features extraction approach for smart city applications. In Smart Cities Cybersecurity and Privacy; Elsevier: Amsterdam, The Netherlands, 2019; pp. 241–251. [Google Scholar]
- Habibzadeh, H.; Nussbaum, B.H.; Anjomshoa, F.; Kantarci, B.; Soyata, T. A survey on cybersecurity, data privacy, and policy issues in cyber-physical system deployments in smart cities. Sustain. Cities Soc. 2019, 50, 101660. [Google Scholar] [CrossRef]
- Baig, Z.A.; Szewczyk, P.; Valli, C.; Rabadia, P.; Hannay, P.; Chernyshev, M.; Johnstone, M.; Kerai, P.; Ibrahim, A.; Sansurooah, K.; et al. Future challenges for smart cities: Cyber-security and digital forensics. Digit. Investig. 2017, 22, 3–13. [Google Scholar] [CrossRef]
- Arnaoutaki, K.; Bothos, E.; Magoutas, B.; Aba, A.; Esztergár-Kiss, D.; Mentzas, G. A recommender system for mobility-as-a-service plans selection. Sustainability 2021, 13, 8245. [Google Scholar] [CrossRef]
- Turkish Statistical Institute Web Site. Available online: https://www.tuik.gov.tr/ (accessed on 20 January 2023).
- Open Data Portal for Istanbul’s Municipality. Available online: https://https://data.ibb.gov.tr/en/ (accessed on 20 January 2023).
Figure 1.
Framework high-level architecture.

Figure 2.
Framework functional diagram.

Figure 3.
Normalized air quality indicators and traffic intensity.


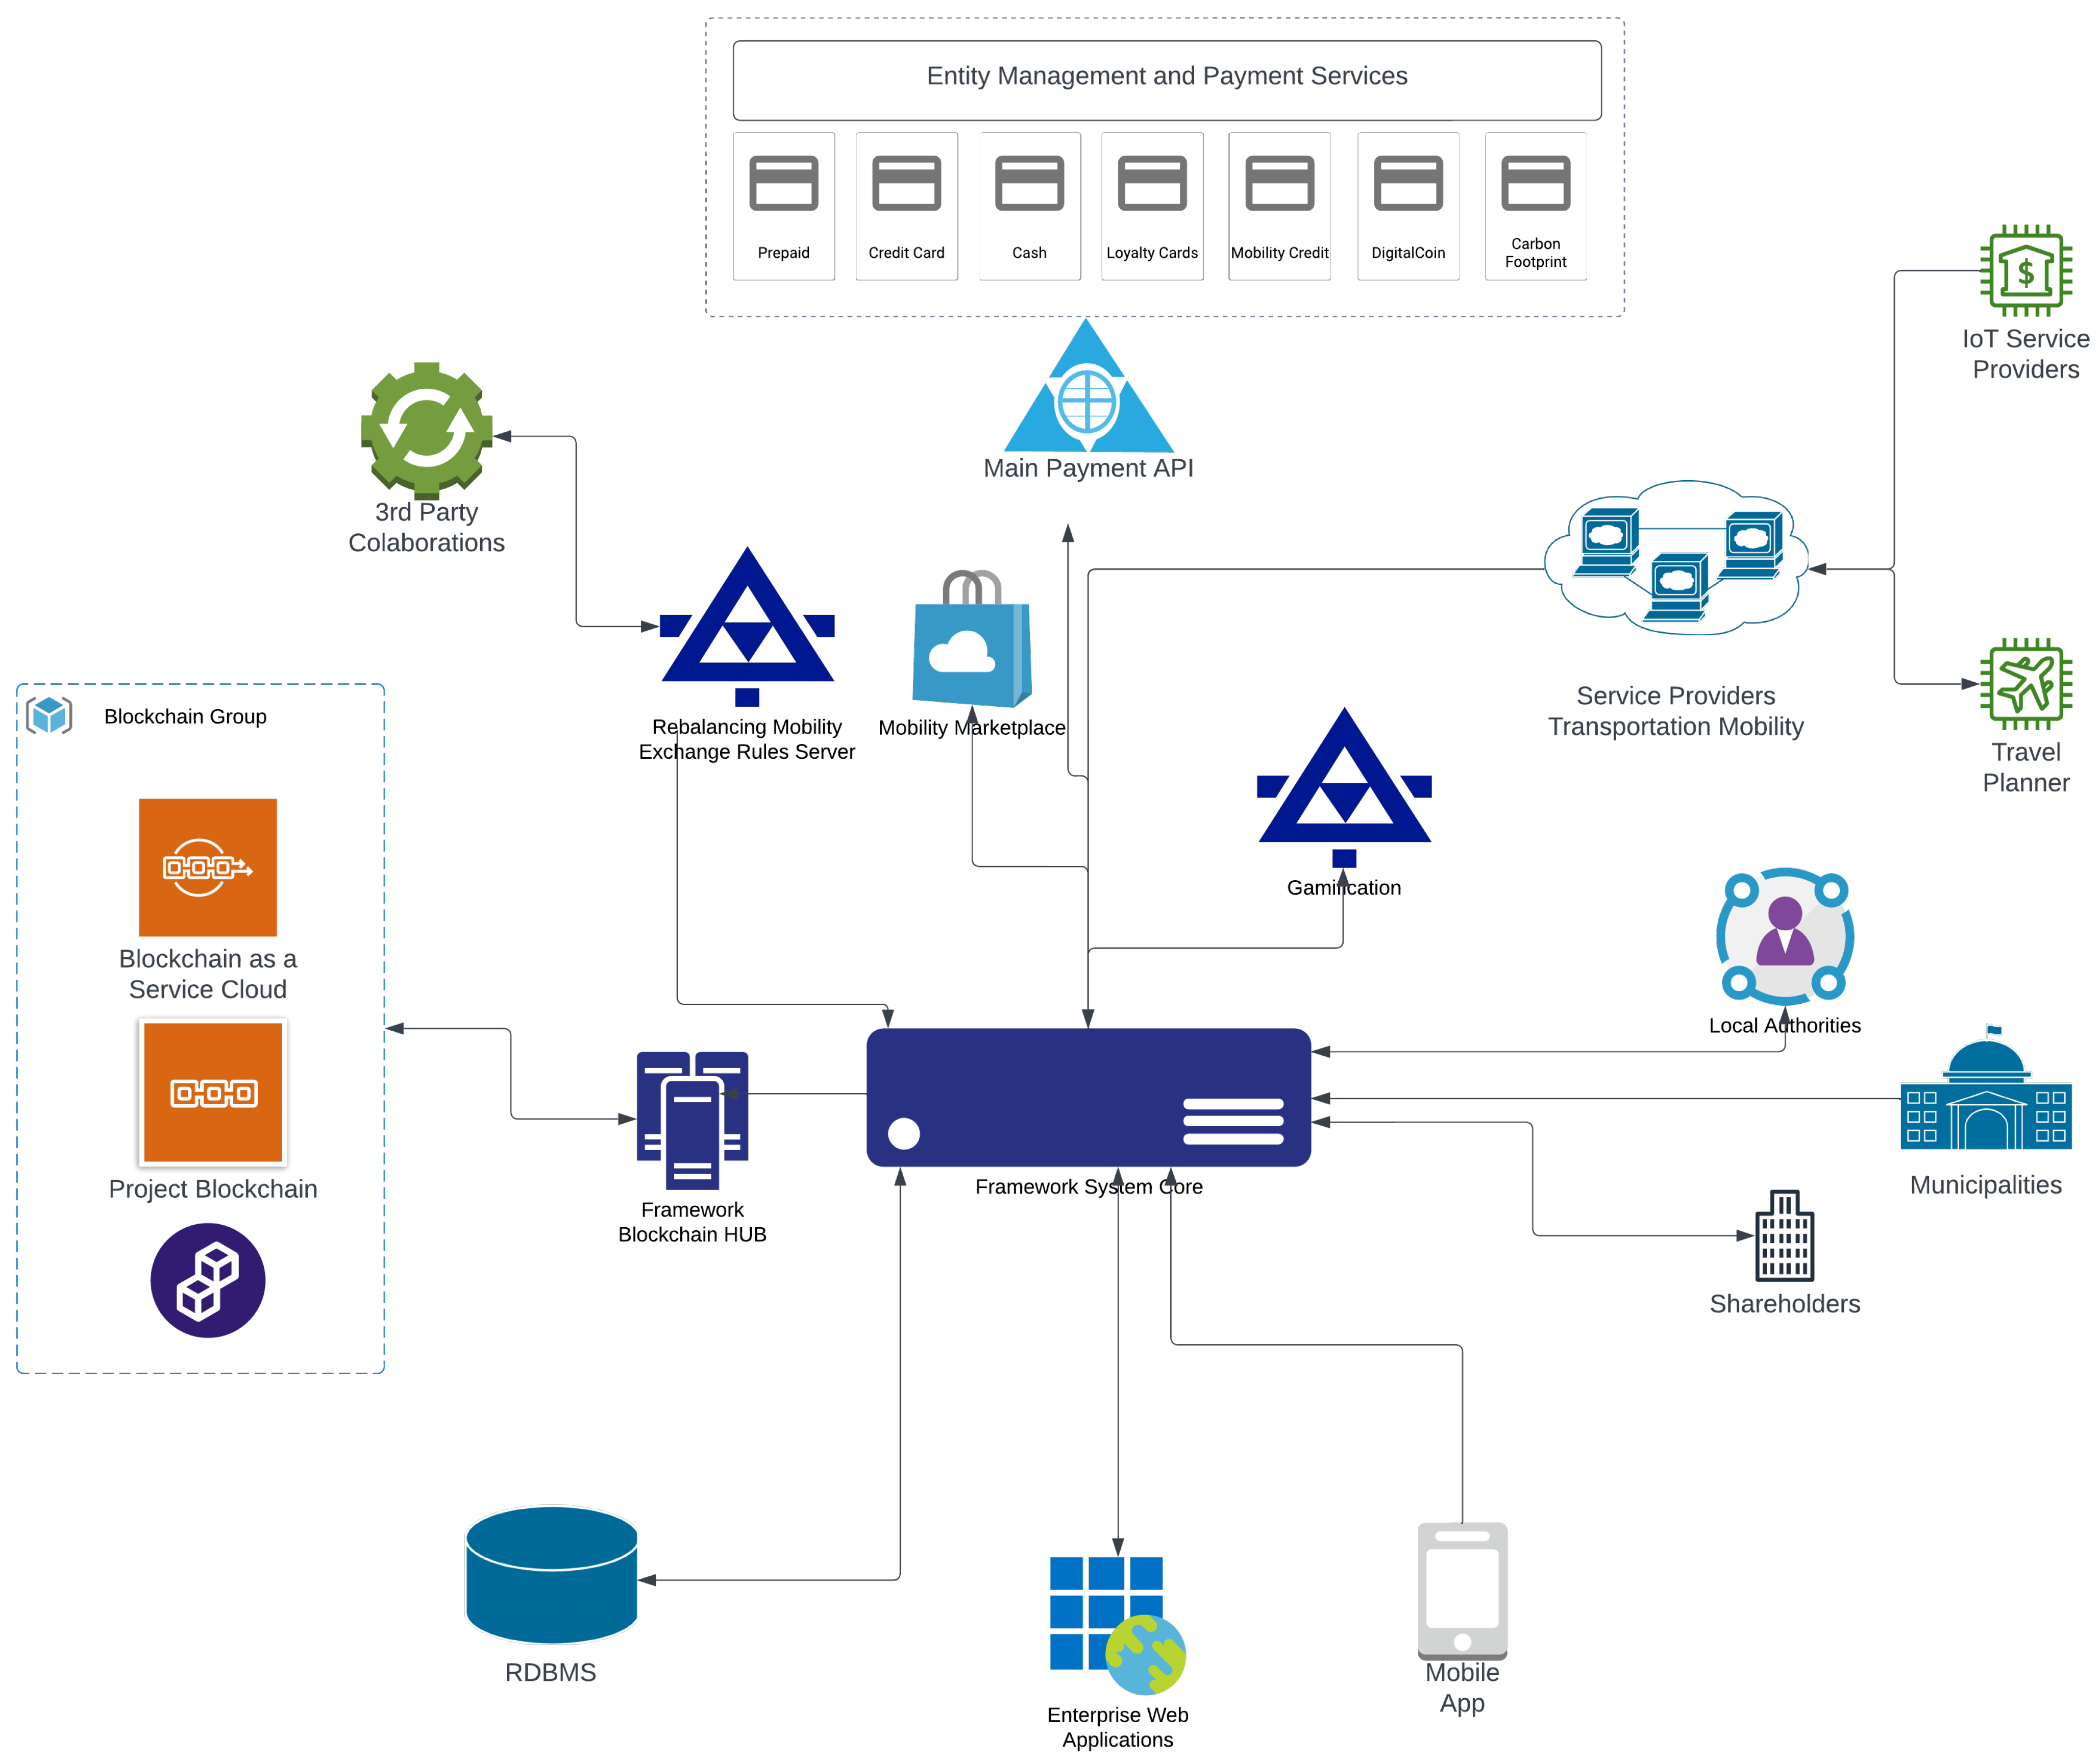
Table 1.
Air quality indicators and traffic density for Istanbul June–August 2022 for selected city center [100].
Table 1.
Air quality indicators and traffic density for Istanbul June–August 2022 for selected city center [100].
| Hour | CO (µg/m3) | NO2 (µg/m3) | NOX (µg/m3) | NO (µg/m3) | Traffic Level |
|---|---|---|---|---|---|
| 5 | 785.2 | 33.1 | 73.3 | 21.4 | 1 |
| 6 | 780.9 | 33.4 | 73.6 | 21.2 | 2.5 |
| 7 | 789 | 42.8 | 110.7 | 38 | 2.8 |
| 8 | 836.8 | 52.6 | 159.3 | 62.6 | 4.9 |
| 9 | 874.8 | 52.4 | 163.7 | 66 | 4.6 |
| 10 | 862.6 | 50.4 | 151.9 | 59.4 | 4 |
| 11 | 815.8 | 46 | 127 | 46.7 | 4.2 |
| 12 | 779.9 | 44.4 | 113.3 | 38.8 | 4.3 |
| 13 | 771.1 | 43.8 | 107.3 | 35.3 | 4.3 |
| 14 | 771.4 | 44.5 | 107.3 | 35.1 | 4.8 |
| 15 | 782.3 | 46.2 | 110.6 | 36.1 | 5 |
| 16 | 785.8 | 48.9 | 116.9 | 38 | 5.3 |
| 17 | 803.7 | 50.5 | 120.1 | 38.8 | 5.6 |
| 18 | 840.7 | 56.4 | 137.7 | 45.8 | 5.9 |
| 19 | 908.3 | 61.8 | 160.2 | 55.9 | 6.3 |
| 20 | 938.7 | 64.1 | 162.1 | 55.6 | 5 |
| 21 | 955.8 | 62.8 | 152.6 | 50.6 | 3.4 |
| 22 | 961.6 | 61.7 | 147.3 | 47.7 | 3 |
| 23 | 961.7 | 60.3 | 145.4 | 47.5 | 2.5 |
| 0 | 951 | 57.2 | 133.8 | 42.1 | 2.2 |
| 1 | 943.4 | 53.9 | 128.8 | 41.2 | 2 |
| 2 | 925.8 | 49.3 | 121.1 | 39.7 | 1.5 |
| 3 | 864.1 | 41.3 | 97.1 | 30.2 | 1.3 |
| 4 | 801.1 | 35.3 | 77.9 | 22.5 | 1 |
Table 2.
Switching scenarios and plans with sample parameters.
| Scenario | Morning | Midday | Afternoon | Switching Index (SI) | Voluntary Carbon Credits (VCC) |
|---|---|---|---|---|---|
| Park the Car Continue with Metro/Bus | High | Medium | Very High | Very High | High |
| Car Sharing | High | Medium | Very High | High | High |
| Car to Public transportation twice a week | High | Medium | Very High | High | High |
| Car to Public transportation once a week | High | Medium | Very High | Medium | High |
| Public Bus to Metro | Low | Very Low | Medium | Medium | Medium |
| Public Bus to Bike | Medium | Low | High | Medium | Very High |
| Public Bus to Scooter | Medium | Low | High | Medium | High |
Disclaimer/Publisher’s Note: The statements, opinions and data contained in all publications are solely those of the individual author(s) and contributor(s) and not of MDPI and/or the editor(s). MDPI and/or the editor(s) disclaim responsibility for any injury to people or property resulting from any ideas, methods, instructions or products referred to in the content. |
© 2023 by the author. Licensee MDPI, Basel, Switzerland. This article is an open access article distributed under the terms and conditions of the Creative Commons Attribution (CC BY) license (https://creativecommons.org/licenses/by/4.0/).
Share and Cite
MDPI and ACS Style
Ozpinar, A. A Hyper-Integrated Mobility as a Service (MaaS) to Gamification and Carbon Market Enterprise Architecture Framework for Sustainable Environment. Energies 2023, 16, 2480. https://doi.org/10.3390/en16052480
AMA Style
Ozpinar A. A Hyper-Integrated Mobility as a Service (MaaS) to Gamification and Carbon Market Enterprise Architecture Framework for Sustainable Environment. Energies. 2023; 16(5):2480. https://doi.org/10.3390/en16052480
Chicago/Turabian StyleOzpinar, Alper. 2023. "A Hyper-Integrated Mobility as a Service (MaaS) to Gamification and Carbon Market Enterprise Architecture Framework for Sustainable Environment" Energies 16, no. 5: 2480. https://doi.org/10.3390/en16052480
Note that from the first issue of 2016, this journal uses article numbers instead of page numbers. See further details here.