
Edge-Based Real-Time Occupancy Detection System through a Non-Intrusive Sensing System

1
Department of Electrical Engineering, Qatar University, Doha 2713, Qatar
2
College of Engineering and Information Technology, University of Dubai, Dubai 14143, United Arab Emirates
3
Iberdrola Innovation Middle East, Doha 210177, Qatar
*
Author to whom correspondence should be addressed.
Energies 2023, 16(5), 2388; https://doi.org/10.3390/en16052388
Submission received: 12 January 2023
/
Revised: 23 February 2023
/
Accepted: 28 February 2023
/
Published: 2 March 2023
(This article belongs to the Special Issue Internet of Energy and Artificial Intelligence for Sustainable Cities)
Abstract
:Building automation and the advancement of sustainability and safety in internal spaces benefit significantly from occupancy sensing. While particular traditional Machine Learning (ML) methods have succeeded at identifying occupancy patterns for specific datasets, achieving substantial performance in other datasets is still challenging. This paper proposes an occupancy detection method using non-intrusive ambient data and a Deep Learning (DL) model. An environmental sensing board was used to gather temperature, humidity, pressure, light level, motion, sound, and Carbon Dioxide (CO) data. The detection approach was deployed on an edge device to enable low-cost computing while increasing data security. The system was set up at a university office, which functioned as the primary case study testing location. We analyzed two Convolutional Neural Network (CNN) models to confirm the optimum alternative for edge deployment. A 2D-CNN technique was used for one day to identify occupancy in real-time. The model proved robust and reliable, with a 99.75% real-time prediction accuracy.
1. Introduction
Energy demand is rapidly growing as the population’s reliance on electrical equipment increases. However, most energy usage patterns are unsustainable since energy resources are becoming more scarce. Additionally, rising device usage is imposing a strain on the present electrical infrastructure [1]. As a result, there is an increased need for energy efficiency education and endorsement to motivate usage when essential. For instance, home appliances that consume the most power, such as air conditioning and lights, should only be operated once a person is occupying the space [2]. All of this invokes the concept of occupancy detection, where a system is designed to determine whether people are occupying a place and, in accordance with that information, the state of the appliance must be adjusted. This information can be used for various purposes, such as improving energy efficiency by turning off lights and Heating Ventilation Air Conditioning (HVAC) systems in unoccupied rooms, or for security purposes by alerting authorities to unexpected or suspicious movements.
Nonetheless, occupancy is not the only factor that determines power expenditure. Physical variables, such as building attributes, equipment efficiency, and weather conditions, can influence a building’s power consumption pattern [3]. However, people cannot simply manage or modify these aspects during building use. Occupancy is an essential component of human factors that characterize the presence of inhabitants, consumption habits, and interior environmental conditions [4,5]. Occupancy detection systems are primarily based on the deployment of various environmental sensors (e.g., Carbon Dioxide (CO), Passive Infrared (PIR), temperature, humidity, and light sensors), specialized devices (e.g., smart meters, wearable devices, and cameras), or wireless technologies [6] (e.g., Bluetooth, and Wi-Fi). However, cameras and wearable electronics are the most prominent in detecting human presence. Unfortunately, these gadgets have privacy and intrusiveness problems. The development of occupancy monitoring methods poses research challenges, such as how to protect tenant privacy. The design of an environmental-based system should prevent occupant or activity identification. Therefore, developing non-intrusive occupancy detection methods, or enhancing those already in place, is necessary [7].
The presence of humans influences their surroundings through heat or CO emission, so environmental data are an ideal source of information for occupancy detection that does not risk the privacy of residents in a specific area. Nonetheless, it is only possible to quantify something with data. Machine Learning (ML) and Deep Learning (DL) approaches examine data for patterns; using these patterns, it is feasible to confirm occupancy with a certain degree of certainty [8]. Although some contributions have been made in this regard, there is still potential for improvement, which is the emphasis of this study proposal [9,10,11]. The system is hosted locally to further protect the occupants’ information, and an edge network implemented for data storage and analysis.
The approach proposed in this work employs non-intrusive ambient sensors and a DL (i.e., Convolutional Neural Network (CNN)) framework to identify occupancy. An environmental sensor board collected temperature, humidity, pressure, light level, motion, sound, and CO data. The detection method was deployed on an edge device to enable low-cost data computation while improving data security. The system was installed at a university office, which served as the primary case study testing site. The data gathered at the office was leveraged to train and test the detection system. Following the pre-processing of the collected data, five days of data were used to train the DL model. The trained model was exported so as to be employed on the edge device. The testing was carried out on the edge device for one day. The occupancy detection system attained an accuracy of 99.75%. Overall, the contributions of this paper can be summarized as follows:
- Introducing a novel approach for detecting occupancy in indoor spaces using non-intrusive ambient data and a deep learning model. Using an environmental sensing board to gather environmental data, including temperature, humidity, pressure, light level, motion, sound, and CO.
- Deploying the occupancy detection method on an edge device for low-cost processing and increased data security.
- Investigating the performance of one-dimensional CNN (1D-CNN) and two-dimensional CNN (2D-CNN) to find the best option for edge deployment.
- Demonstrating the superiority of the 2D-CNN technique in providing robust and reliable results with 99.75% real-time prediction accuracy.
The remainder of the paper is organized as follows: Section 2 addresses the related work in developing a real-time edge-based occupancy detection system. Section 3 introduces the methodology adopted to detect real-time occupancy patterns. Section 4 details the data collection setup and flow. Section 5 explains and analyzes the performance results of the proposed approach. Finally, Section 6 summarizes the paper’s findings and suggests new study directions.
2. Related Work
There are several taxonomies for occupancy detection systems; however, the most prevalent is the intrusive versus non-intrusive distinction. Localization strategies [12,13,14,15,16] and cameras [17,18,19] are used in intrusive occupancy detection systems. Non-intrusive solutions include estimating occupancy based on smart meters [20] or interior ambient data [21]. The sub-sections summarize the relevant research that employs edge-based occupancy detection.
2.1. Intrusive Edge-Based Occupancy Detection Systems
Monti et al. [22] suggested a method for counting individuals that relies on cameras and Raspberry Pi platforms. The technique seeks to be adopted in varied indoor contexts without requiring a customized training phase. This was achieved using an edge-based transfer learning architecture augmented with unique image processing strategies.
Kommey et al. [23] designed and implemented an automated ceiling fan speed regulator utilizing a web camera and a temperature sensor. The occupancy detection model extracted human characteristics from the video broadcast using a Histogram of Gradient (HOG), which was then categorized using Support Vector Machines (SVM) to increase the detection accuracy. The system was integrated into a Raspberry Pi, a resource-limited edge computing platform.
Aszkowski et al. [24] presented an annotated collection of low-resolution thermal pictures from several office spaces with varying numbers of people present. A performance and energy consumption comparison of CNN architecture on low-power edge devices was conducted. The results showed that the Raspberry Pi with the Coral USB Accelerator produced the best performance in applications demanding minimal latency.
Metwaly et al. [25] developed a unique approach for people counting with significant prediction performance. Since the suggested algorithms had minimal computational, power, and memory needs, they were appropriate for resource-constrained devices utilized in Internet of Things (IoT)-based applications. It was discovered that thermal imaging technology is more successful and a better prospect for counting individuals than other systems, like those relying on optical cameras. Among the studied algorithms, the Feed-forward Neural Network (FNN) produced the best accuracy compared to the CNN and Gated Recurrent Unit (GRU). Similarly, Gomez et al. [26] introduced a people-counting CNN algorithm based on thermal imaging, compact enough to operate on a limited-memory low-power edge device.
2.2. Non-Intrusive Occupancy Detection Systems
Below, we provide an overview of studies that used non-intrusive methods to detect occupancy. Researchers frequently use ML tactics to uncover the association between predictor variables and target categories, as demonstrated by the reviewed articles, all of which addressed ML methodologies to detect occupancy patterns. Furthermore, we discuss the studies deploying edge computing and real-time implementation, both of which were limited, as is shown later.
2.2.1. Edge and ML-Based
In their study, Zemouri et al. [27,28] addressed the effectiveness of machine learning algorithms used to predict human occupancy in closed office areas using temperature and humidity data as occupancy predictors. They employed a Raspberry Pi as an edge device to perform real-time occupancy detection. The findings revealed that k Nearest Neighbors (kNN) outperformed the other algorithms in all performance measures.
Rastogi et al. [29] developed a methodology for estimating indoor occupancy using Linear Regression (LR) and Quantile Regression (QR) algorithms. The suggested approach estimated the occupancy of an interior area using CO, temperature, relative humidity, and motion levels. Since the data generated by the setup is vast, sending it all to the cloud for processing may result in delayed prediction; hence, the suggested models were designed to be executed on an edge device.
2.2.2. ML-Based
Ali and Bouguila [3] proposed and thoroughly investigated a novel approach for employing Hidden Markov Models (HMMs) in occupancy detection applications. They utilized the prominent environmental dataset published in [30] for their analysis and the analysis was considered a benchmark for the occupancy detection task.
Tan et al. [31] introduced a multimodal sensor fusion approach that integrates many data sources, such as camera pictures, audio data, and interior environmental data, for occupancy identification in residential buildings. They tested the framework’s performance using three open-source datasets: the Electricity Consumption and Occupancy (ECO) dataset [32], the University of California Irvine (UCI) [30] building occupancy detection dataset, and the HPDmobile dataset [33], which they gathered and made available. They showed that on the aforementioned open-source datasets, a prediction accuracy of 90.00% was reached and a prediction accuracy of 95.00% was reached with their own gathered dataset.
Dutta and Roy [34] developed the OccupancySense model, which detects human presence and estimates interior occupancy count by combining IoT indoor air quality data with static and dynamic context data. OccupancySense utilized the CatBoost algorithm for detection purposes. A real-world case study using 91 continuous days of interior data with 33 distinct exterior factors verified the proposed model. The model had accuracy of 99.85%, 93.20%, and 95.60% in predicting the room’s binary occupancy, headcount, and occupancy density, respectively.
Footstep-induced floor vibrations were employed as predictors by Drira and Smith [35] to develop a comprehensive framework for occupant recognition, localization, and tracking. The approach was successfully verified using full-scale case studies. Both model-free and model-based techniques were used in the occupant detection, localization, and tracking framework. SVM was used for occupancy detection and count.
The study by Tekler and Chong [36] anticipated occupancy based on a minimum sensing strategy using a wide range of sensor data (i.e., indoor and outdoor ambient factors, Wi-Fi devices, electricity consumption data, HVAC operations, and time-related information). The most significant features were identified through a proposed feature selection algorithm. Then, occupancy predictions were established in an office, library, and lecture hall using several deep learning architectures, including Long Short-Term Memory (LSTM), Bi-directional LSTM (Bi-LSTM), GRU, and Bi-directional GRU (Bi-GRU).
The study in [37] concentrated on determining whether a room is inhabited or empty using thermal comfort indices, which may result in better resource management by effectively controlling systems like lighting and HVAC, resulting in energy savings in buildings. Data from fluctuations in light, CO, and humidity levels were examined and evaluated to determine the reliability of occupancy prediction. Furthermore, kNN, Artificial Neural Networks (ANNs), and Decision Trees (DTs) were employed as classification techniques. The findings showed that the kNN outperformed the DT and ANN classification models with 99.50% accuracy. Similarly, in their study, Mohammadabadi et al. [38] suggested a CNN–XGBoost model for occupancy detection in residential buildings with a balanced mechanical ventilation system and interior climate sensors. Measurements recorded included CO, relative humidity, and temperature for 13 days in December, 2021. CNN–XGBoost surpassed other algorithms in forecasting occupancy levels in all of the test building’s rooms.
A summary of the related works describing edge-based and ML-based occupancy detection approaches is provided in Table 1. The table shows that most research employing edge devices for occupancy detection mainly use intrusive techniques (i.e., optical and thermal cameras). The utilization of edge devices for non-intrusive occupancy detection systems is still quite limited and has not been extensively studied.
3. Proposed Edge-Based Deep Occupancy Detection System
The primary objective of this study was to improve occupancy detection accuracy and reliability by using edge-based occupancy detection with a non-intrusive in-house designed environmental board. This was achieved by designing and implementing a system that utilizes an image transformation approach in a real-time environmental sensing system to identify occupancy using a CNN model. Deploying edge devices also improves the system’s dependability, enabling real-time occupancy monitoring and a high level of privacy and security. Figure 1 depicts a high-level summary of the system. The system collects data from environmental sensors that monitor temperature, humidity, pressure, light, motion, sound, and CO levels. The measured data is then transmitted and stored in the database. The edge device can access the stored data to analyze the factors and determine occupancy patterns. The detected patterns are stored in the database to utilize them in energy-saving applications.
3.1. Environmental Factors Selection
The human body is like a machine, requiring energy to carry out operations. It is impossible to produce energy from nothing, and a warm body transfers its energy to a cool one, according to thermodynamics’ first and second principles. Therefore, these laws apply to the human body. However, the presence of people, often in a warm region, may cause the temperature to drop due to turning on an Air Conditioner (AC) [7]. As a result, the quantity of people present affects the environment’s warmth. CO, like heat, is a byproduct of human presence. Although it is a necessary gas for life, it may be harmful at very high doses (e.g., more than 5000 Parts Per Million (ppm)). Regular building CO concentrations (i.e., 400–1000 ppm) should not pose a direct health threat, but they can be utilized as a sign of occupancy.
As people affect their surroundings, pressure and humidity levels can also be linked to their presence. People, for example, release moisture through perspiration and breathing, raising the humidity level in a confined area. Human actions, such as opening and shutting doors, using electrical devices, and changing temperatures can also affect the pressure levels in a space. Monitoring these variables provides information about whether or not people are present in a given region.
Likewise, the amount of light in a room may change when humans are present. By switching the light on and off, one may observe this influence. This makes it possible to associate occupancy in interior areas with light sources. Additionally, the noise level is affected by the number of people in a room. As a result, it is reasonable to assume that as the inhabitants of a place increase, so does the noise level. Indoor surroundings typically feature background noise created by home appliances or other static sources of sound, an essential element that should be considered. Moreover, humans are dynamic and move frequently; thus, the justification for including the motion feature is straightforward.
Consequently, the following environmental parameters are recorded: temperature, humidity, pressure, light, motion, sound level, and CO.
3.2. Deployed Edge Device
Edge computing is distinct from conventional cloud computing. It is a novel paradigm that executes computation at the edge of the network. The fundamental concept behind it is to bring computation closer to the data source [39,40]. The edge computing premise is based on storing and analyzing data on edge devices rather than uploading it to a cloud-based server. Hence, edge computing provides clear advantages over cloud computing because of this attribute [41,42]. Firstly, edge computing provides reaction time benefits in contrast to conventional cloud computing. The need for intermediary data transmission is diminished by edge computing since it is located closer to the data source, as storage and computing operations are executed there. Secondly, conventional cloud computing employs uniform processing, a centralized processing model, and requires all data to be uploaded to the cloud [43,44]. Data loss and leakage are risks associated with this procedure, which cannot ensure security and privacy preservation. Finally, less of the network’s bandwidth is required because edge computing is performed locally. As a result, the demand on the network’s bandwidth is minimized, and intelligent devices at the network’s edge consume far less energy. The NVIDIA Jetson Nano Developed Kit was employed in this study, due to the various benefits of edge computing [44].
3.3. Deep Learning Classifiers
DL is regarded as one of the most recent advances in machine learning. Due to a lack of data management and processing resources, it could not previously be deployed. We employed 1D-CNN in this study to identify occupancy. 1D-CNN is specially built to work with one-dimensional data. In addition, we compared the performance of 1D-CNN with 2D-CNN. Employing a time-series to 2D image transformation technique enabled the adoption of a 2D-CNN approach [11]. The image transformation approach is demonstrated in Figure 2.
- 1D-CNN: The model included three convolutional layers, one max-pooling layer with a 2 × 2 pixel window, and one fully connected layer. The three convolutional layers were padded to retain the input size. The learning rate was set at 0.001, and a Leaky Rectified Linear Unit (ReLU) was used as an activation layer on all the hidden layers. The SoftMax activation function was used on the output layer.
- 2D-CNN: We adopted a basic model for the 2D-CNN. The model comprised five convolutional layers, five max-pooling layers with a 2 × 2 pixel window, and one fully connected layer. The five convolutional layers were padded to preserve the input size. The learning rate was set at 0.0008, and a ReLU was used as an activation layer on all the hidden layers.
Regarding the training iterations, we utilized 5-fold cross-validation and 50 epochs along with early stopping to eliminate overfitting. To ensure adequate training samples, and to fit and analyze the performance of the CNN techniques, a ratio of 80% for training and 20% for testing was employed. The training was done locally on a personal computer, and the trained model was exported and imported to the edge device to detect occupancy in real-time.
4. Data Collection Setup
4.1. Board Description, Placement, and Ground Truth Method
The designed sensing board collects various environmental features, such as temperature, humidity, pressure, light, motion, sound level, and CO. These features are collected via various sensors, shown in Table 2. The selection of the recorded environmental features was based on the reasons previously mentioned.
After deciding on the relevant sensors that strongly correlate with occupancy labels, we developed the environmental board, encompassing the sensors and the micro-controller. The micro-controller deployed was the esp32 devkit v1. The esp32 is a dual-core processor with low cost and power requirements with Wi-Fi and Bluetooth wireless capabilities. The esp32’s primary function is to transmit environmental data to the database once every ten seconds. Figure 3 depicts the final environmental board design, with the Printed Circuit Board (PCB) and the 3D-printed cover. The board also includes a Liquid Crystal Display (LCD) screen to enable real-time indoor environmental monitoring. The data collection, in a single-occupant office at Qatar University, was carried out using the environmental board deployed in the position seen in green in Figure 4. Several board placements will be explored in future research to establish the optimal position, similar to [45]. In addition, we plan to investigate the use of many boards and possibly perform data fusion. The office occupant recorded ground truth data manually on an Excel sheet.
4.2. Data Flow
The central back-end is housed on a single-board computer (i.e., Raspberry Pi 4B+) that serves as a local server and an access point to which the sensing board and the edge device may be synced, resulting in a private local network. CouchDB structured the central database as a local server, producing a local store that various devices can communicate with via “POST” or “GET” queries in a real-time manner. In our scenario, the sensing board posted data every 10-seconds, and the edge device retrieved the data in order to evaluate the data. The data flow between the system’s modules is shown in Figure 5. Modules in the present architecture may directly access the database via HTTP requests, decreasing latency and offering a local and secure network. Data stored in CouchDB are in the JavaScript Object Notation (JSON) format. Wi-Fi communication was leveraged to connect the micro-controller and gateway, utilizing the 802.11 protocol and a 2.4 GHz frequency band. A bandwidth of 2.4 GHz was chosen because of its greater spectrum, which allowed for greater coverage of the gateways (i.e., sensing board, edge device, and the local server).
4.3. Data Pre-Processing
Over a period of five days, data from various sensors were gathered every 10-s for observation. Data from many sensor devices, with varying settings, were aligned and combined into a standard format with ground truth occupancy labels. The inhabitants’ reported ground truth data were the primary reference for analyzing the performance of various sensors and the detection technique. To rectify the inaccuracies in the collected data, an initial data cleansing was a crucial pre-processing step before performing data analysis and occupancy detection.
Any missing data issues is addressed using one of the following approaches. The first approach uses the MissForest method [46], which involves non-parametric imputation using a random forest algorithm for mixed-type data. This approach can handle missing values in both categorical and continuous variables, as well as in a combination of both, making it a versatile method for imputing missing data. Alternatively, we may utilize the generative adversarial multiple imputation network approach proposed by Low et al. [47]. This approach uses a deep learning method to impute missing data, specifically for predicting commercial vehicle parking duration. This method has shown promise in handling complex missing data patterns and producing accurate imputations.
4.4. Correlation Study
We performed a correlation study between the predictors and the response variables to assess the significance of the collected environmental features on the occupancy status. In Equation (1), the correlation formula is depicted with x representing the ith x-value and indicating the mean of the x-values in the data sample. The y-values might also be attributed in that way.
The results obtained from the said correlation study are shown in Figure 6. It is clear from the correlation matrix that the light features had the strongest positive correlation with the occupancy status, with a value of 0.99. The temperature, humidity, and sound elements also held high to moderate correlation values of −0.84, 0.56, and 0.33, respectively.
The motion data had a minimal correlation with the occupancy labels, attributable to various factors. Motion sensors may not detect movement from individuals who are moving slowly or remaining still, such as those sitting at workstations. This may result in erroneous negative readings. Furthermore, interference from other electronic equipment or electromagnetic radiation sources may cause the motion sensor to provide inaccurate data. Lastly, occupancy detection is a complex process, and a motion sensor alone may not be enough to identify occupancy in some situations, such as a room with numerous individuals or a space with a high amount of ambient movement. Thus, more sophisticated systems that use multiple sensors and deep learning algorithms can help improve the accuracy of occupancy detection.
It was observed that eliminating predictors with poor correlation to the occupancy labels resulted in reduced training time and, in most cases, reduced accuracy. Therefore, all sensor variables were utilized in the following data processing phases.
5. Experimental Results and Discussion
5.1. Performance Assessment
Various performance measures were used to assess the deployment performance of ML and DL algorithms. Overall, the performance metrics used were based on an understanding of True Positive (TP), False Positive (FP), True Negative (TN), and False Negative (FN) data. If the test data match the correct label class, TP and TN indicate the proper categorization. If an entry does not belong to either the negative or positive categories, it is labeled with FN or FP. Accuracy is defined as the number of successfully classified data instances divided by the total number of data instances, as shown in Equation (2).
In addition to the accuracy metric, the precision in Equation (3), recall in Equation (4), and F1-score in Equation (5) were employed as performance metrics.
We additionally compared the required time to train the models. The time it takes to train a ML model can vary significantly depending on a number of factors, including the model’s complexity and the dataset’s size. Training an ML model can generally take a few minutes to several days or weeks, depending on the aforementioned factors.
5.2. Classifiers Performance
Table 3 summarizes the findings obtained from employing the aforementioned classifiers. As seen in the table, 2D-CNN produced the most significant results across all performance criteria, most notably with an accuracy of 99.76%. It is worth mentioning that the 1D-CNN algorithm generated good results with an accuracy of 99.72% and required less training time. This was anticipated, given that the 1D-CNN technique has fewer layers than the 2D-CNN method. This might also have contributed to the other performance outcomes.
The confusion matrices produced by the models with the data obtained are shown in Figure 7. In Figure 7a,b the false rates were quite minor, indicating that the models were highly accurate. However, the 2D-CNN had fewer false rates, particularly for the false positive class. Taking this into account, the 2D-CNN technique was selected to be deployed on the edge device to perform real-time occupancy detection.
5.3. Real-Time Occupancy Detection
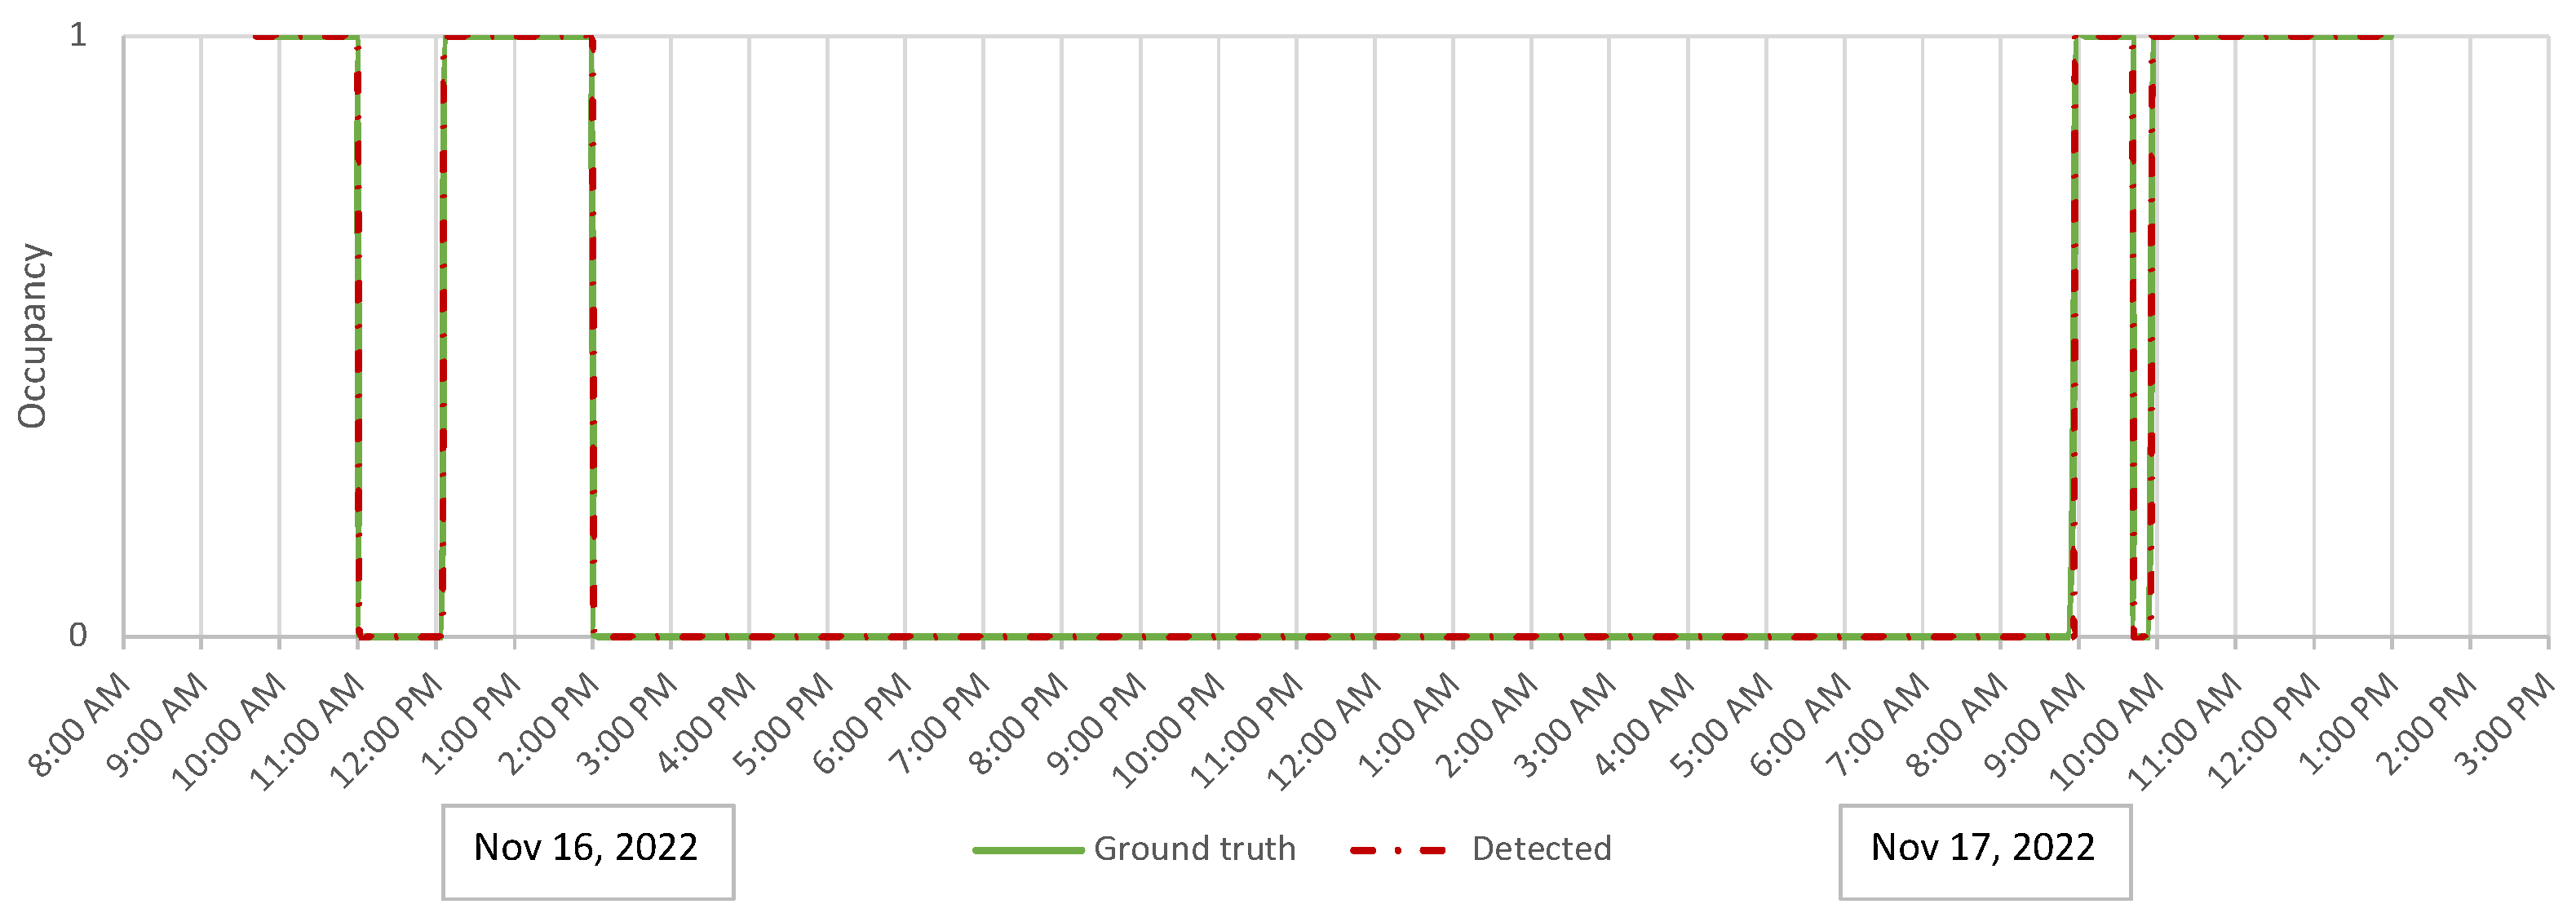
The source model for occupancy estimation was trained with data collected from a small office room at Qatar University between 7–14 November 2022. To make the dataset more balanced to prevent overfitting, we eliminated entries from 9:00 p.m. to 6:00 a.m. since the office would likely be unoccupied during those periods. After training the model locally, the 2D-CNN was imported on the edge device, and real-time detection was conducted for one day in the office. Figure 8 depicts the target model’s performance compared to the measured ground truth occupancy data. It can be observed that the model was very robust as the measured occupancy labels were in sync with the ground truth data. The real-time testing achieved a prediction accuracy of 99.75%. The detection was done instantly at 1-min intervals, and the recorded labels were transmitted to the database via a post request. The environmental parameters were displayed on the LCD screen over a 10-s interval. However, a 1-min detection was used, since the occupancy labels did not fluctuate quickly.
The critical barrier to adopting such an approach is acquiring the ground truth data for training ML models. This might be reduced by employing a transfer learning strategy. The approach can achieve high occupancy detection accuracy with a previously trained model on a huge dataset and a small quantity of ground truth data (e.g., two days) from a target room.
6. Conclusions
Reliable occupancy monitoring is essential to promote energy efficiency and optimize building energy management systems. Hence, this work aimed to design an edge-based occupancy detection system that utilizes non-intrusive ambient data as occupancy predictors. An environmental sensing board collected temperature, humidity, pressure, light, motion, sound level, and CO data. The detection was accomplished through an image transformation approach and a custom CNN model. The data collection, detection, and storage of occupancy labels occurred in real-time in an office. Five days’ worth of data were gathered for training purposes. Following one day of testing, the edge-based detection systems achieved a prediction accuracy of 99.75%.
The proposed study examined the feasibility of detecting occupancy patterns using solely environmental factors. However, it is important to recognize certain constraints. Specifically, the study’s outcomes may have limited applicability beyond the particular context it examined, necessitating the utilization of transfer learning models on edge to expand the scope of the results. In light of these limitations, future research should consider these concerns and pursue alternative approaches to enhance the generalizability and practicality of the conclusions.
Author Contributions
Conceptualization, A.N.S., F.B., Y.H. and M.H.; Methodology, A.N.S., F.B. and Y.H.; Data Curation, A.N.S. and F.B.; Validation and Analysis, A.N.S.; Writing—Original Draft Preparation, A.N.S.; Writing—Review & Editing, A.N.S., F.B., Y.H. and M.H.; Supervision, F.B., Y.H. and M.H.; Funding Acquisition, F.B. All authors have read and agreed to the published version of the manuscript.
Funding
This research was funded by the Graduate Assistantship (GA) program provided by Qatar University (QU).
Acknowledgments
This paper was made possible by the Graduate Assistantship (GA) program provided by Qatar University (QU). The statements made herein are solely the responsibility of the authors.
Conflicts of Interest
The authors declare no conflict of interest.
Abbreviations
The following abbreviations are used in this manuscript:
| ANN | Artificial Neural Networks |
| CNN | Convolutional Neural Network |
| CO | Carbon Dioxide |
| DL | Deep Learning |
| DT | Decision Trees |
| FN | False Negative |
| FNN | Feed-forward Neural Network |
| FP | False Positive |
| GRU | Gated Recurrent Unit |
| HVAC | Heating Ventilation Air Conditioning |
| IoT | Internet of Things |
| kNN | k Nearest Neighbors |
| LSTM | Long Short-Term Memory |
| ML | Machine Learning |
| PCB | Printed Circuit Board |
| PIR | Passive Infrared |
| ppm | Parts Per Million |
| ReLU | Rectified Linear Unit |
| SVM | Support Vector Machines |
| TN | True Negative |
| TP | True Positive |
References
- Wilberforce, T.; Olabi, A.; Sayed, E.T.; Elsaid, K.; Maghrabie, H.M.; Abdelkareem, M.A. A review on zero energy buildings—Pros and cons. Energy Built Environ. 2023, 4, 25–38. [Google Scholar] [CrossRef]
- Hong, Y.; Yoon, S.; Choi, S. Operational signature-based symbolic hierarchical clustering for building energy, operation, and efficiency towards carbon neutrality. Energy 2023, 265, 126276. [Google Scholar] [CrossRef]
- Ali, S.; Bouguila, N. Towards scalable deployment of hidden Markov models in occupancy estimation: A novel methodology applied to the study case of occupancy detection. Energy Build. 2022, 254, 111594. [Google Scholar] [CrossRef]
- Rueda, L.; Agbossou, K.; Cardenas, A.; Henao, N.; Kelouwani, S. A comprehensive review of approaches to building occupancy detection. Build. Environ. 2020, 180, 106966. [Google Scholar] [CrossRef]
- Sayed, A.N.; Hamila, R.; Himeur, Y.; Bensaali, F. Employing Information Theoretic Metrics with Data-Driven Occupancy Detection Approaches: A Comparative Analysis. In Proceedings of the 2022 5th International Conference on Signal Processing and Information Security (ICSPIS), Dubai, United Arab Emirates, 7–8 December 2022; pp. 50–54. [Google Scholar] [CrossRef]
- Tekler, Z.D.; Low, R.; Gunay, B.; Andersen, R.K.; Blessing, L. A scalable Bluetooth Low Energy approach to identify occupancy patterns and profiles in office spaces. Build. Environ. 2020, 171, 106681. [Google Scholar] [CrossRef]
- Abade, B.; Perez Abreu, D.; Curado, M. A non-intrusive approach for indoor occupancy detection in smart environments. Sensors 2018, 18, 3953. [Google Scholar] [CrossRef] [Green Version]
- Sayed, A.N.; Himeur, Y.; Bensaali, F. Deep and transfer learning for building occupancy detection: A review and comparative analysis. Eng. Appl. Artif. Intell. 2022, 115, 105254. [Google Scholar] [CrossRef]
- Colace, S.; Laurita, S.; Spezzano, G.; Vinci, A. Room Occupancy Prediction Leveraging LSTM: An Approach for Cognitive and Self-Adapting Buildings. In IoT Edge Solutions for Cognitive Buildings; Springer: Berlin/Heidelberg, Germany, 2023; pp. 197–219. [Google Scholar]
- He, Y.; Zhang, H.; Arens, E.; Merritt, A.; Huizenga, C.; Levinson, R.; Wang, A.; Ghahramani, A.; Alvarez-Suarez, A. Smart detection of indoor occupant thermal state via infrared thermography, computer vision, and machine learning. Build. Environ. 2023, 228, 109811. [Google Scholar] [CrossRef]
- Sayed, A.N.; Himeur, Y.; Bensaali, F. From Time-Series to 2D Images for Building Occupancy Prediction using Deep Transfer Learning. Eng. Appl. Artif. Intell. 2023, 119, 105786. [Google Scholar] [CrossRef]
- Demrozi, F.; Turetta, C.; Chiarani, F.; Kindt, P.H.; Pravadelli, G. Estimating indoor occupancy through low-cost BLE devices. IEEE Sens. J. 2021, 21, 17053–17063. [Google Scholar] [CrossRef]
- Wang, Z.; Hong, T.; Piette, M.A.; Pritoni, M. Inferring occupant counts from Wi-Fi data in buildings through machine learning. Build. Environ. 2019, 158, 281–294. [Google Scholar] [CrossRef] [Green Version]
- Natarajan, A.; Krishnasamy, V.; Singh, M. Occupancy detection and localization strategies for demand modulated appliance control in Internet of Things enabled home energy management system. Renew. Sustain. Energy Rev. 2022, 167, 112731. [Google Scholar] [CrossRef]
- Wainer, G.; Aloqaily, M. Machine learning-based indoor localization and occupancy estimation using 5G ultra-dense networks. Simul. Model. Pract. Theory 2022, 118, 102543. [Google Scholar]
- Tekler, Z.D.; Low, R.; Yuen, C.; Blessing, L. Plug-Mate: An IoT-based occupancy-driven plug load management system in smart buildings. Build. Environ. 2022, 223, 109472. [Google Scholar] [CrossRef]
- Hu, S.; Wang, P.; Hoare, C.; O’Donnell, J. Building Occupancy Detection and Localisation using CCTV Camera and Deep Learning. IEEE Internet Things J. 2022, 10, 597–608. [Google Scholar] [CrossRef]
- Wei, S.; Tien, P.W.; Chow, T.W.; Wu, Y.; Calautit, J.K. Deep learning and computer vision based occupancy CO2 level prediction for demand-controlled ventilation (DCV). J. Build. Eng. 2022, 56, 104715. [Google Scholar] [CrossRef]
- Yang, Y.; Yuan, Y.; Pan, T.; Zang, X.; Liu, G. A framework for occupancy prediction based on image information fusion and machine learning. Build. Environ. 2022, 207, 108524. [Google Scholar] [CrossRef]
- Feng, C.; Mehmani, A.; Zhang, J. Deep learning-based real-time building occupancy detection using ami data. IEEE Trans. Smart Grid 2020, 11, 4490–4501. [Google Scholar] [CrossRef]
- Wang, C.; Jiang, J.; Roth, T.; Nguyen, C.; Liu, Y.; Lee, H. Integrated sensor data processing for occupancy detection in residential buildings. Energy Build. 2021, 237, 110810. [Google Scholar] [CrossRef]
- Monti, L.; Tse, R.; Tang, S.K.; Mirri, S.; Delnevo, G.; Maniezzo, V.; Salomoni, P. Edge-Based Transfer Learning for Classroom Occupancy Detection in a Smart Campus Context. Sensors 2022, 22, 3692. [Google Scholar] [CrossRef]
- Kommey, B. Automatic Ceiling Fan Control Using Temperature and Room Occupancy. JITCE J. Inf. Technol. Comput. Eng. 2022, 6, 1–7. [Google Scholar] [CrossRef]
- Law Aszkowski, P.; Piechocki, M. Thermo Presence: The Low-resolution Thermal Image Dataset and Occupancy Detection Using Edge Devices. In Proceedings of the 3rd Polish Conference on Artificial Intelligence, Gdynia, Poland, 25–27 April 2022. [Google Scholar]
- Metwaly, A.; Queralta, J.P.; Sarker, V.K.; Gia, T.N.; Nasir, O.; Westerlund, T. Edge computing with embedded ai: Thermal image analysis for occupancy estimation in intelligent buildings. In Proceedings of the INTelligent Embedded Systems Architectures and Applications Workshop 2019, New York, NY, USA, 13–18 October 2019; pp. 1–6. [Google Scholar]
- Gomez, A.; Conti, F.; Benini, L. Thermal image-based CNN’s for ultra-low power people recognition. In Proceedings of the 15th ACM International Conference on Computing Frontiers, Ischia, Italy, 8–10 May 2018; pp. 326–331. [Google Scholar]
- Zemouri, S.; Gkoufas, Y.; Murphy, J. A machine learning approach to indoor occupancy detection using non-intrusive environmental sensor data. In Proceedings of the 3rd International Conference on Big Data and Internet of Things, Melbourn, Australia, 22–24 August 2019; pp. 70–74. [Google Scholar]
- Zemouri, S.; Magoni, D.; Zemouri, A.; Gkoufas, Y.; Katrinis, K.; Murphy, J. An edge computing approach to explore indoor environmental sensor data for occupancy measurement in office spaces. In Proceedings of the 2018 IEEE International Smart Cities Conference (ISC2), Kansas City, MO, USA, 16–19 September 2018; pp. 1–8. [Google Scholar]
- Rastogi, K.; Lohani, D. IoT-Based Indoor Occupancy Estimation Using Edge Computing. Procedia Comput. Sci. 2020, 171, 1943–1952. [Google Scholar] [CrossRef]
- Candanedo, L.M.; Feldheim, V. Accurate occupancy detection of an office room from light, temperature, humidity and CO2 measurements using statistical learning models. Energy Build. 2016, 112, 28–39. [Google Scholar] [CrossRef]
- Tan, S.Y.; Jacoby, M.; Saha, H.; Florita, A.; Henze, G.; Sarkar, S. Multimodal sensor fusion framework for residential building occupancy detection. Energy Build. 2022, 258, 111828. [Google Scholar] [CrossRef]
- Kleiminger, W.; Beckel, C.; Santini, S. Household occupancy monitoring using electricity meters. In Proceedings of the 2015 ACM International Joint Conference on Pervasive and Ubiquitous Computing, Osaka, Japan, 7–11 September 2015; pp. 975–986. [Google Scholar]
- Jacoby, M.; Tan, S.Y.; Henze, G.; Sarkar, S. A high-fidelity residential building occupancy detection dataset. Sci. Data 2021, 8, 280. [Google Scholar] [CrossRef]
- Dutta, J.; Roy, S. OccupancySense: Context-based indoor occupancy detection & prediction using CatBoost model. Appl. Soft Comput. 2022, 119, 108536. [Google Scholar]
- Drira, S.; Smith, I.F. A framework for occupancy detection and tracking using floor-vibration signals. Mech. Syst. Signal Process. 2022, 168, 108472. [Google Scholar] [CrossRef]
- Tekler, Z.D.; Chong, A. Occupancy prediction using deep learning approaches across multiple space types: A minimum sensing strategy. Build. Environ. 2022, 226, 109689. [Google Scholar] [CrossRef]
- Abdel-Razek, S.A.; Marie, H.S.; Alshehri, A.; Elzeki, O.M. Energy Efficiency through the Implementation of an AI Model to Predict Room Occupancy Based on Thermal Comfort Parameters. Sustainability 2022, 14, 7734. [Google Scholar] [CrossRef]
- Mohammadabadi, A.; Rahnama, S.; Afshari, A. Indoor Occupancy Detection Based on Environmental Data Using CNN-XGboost Model: Experimental Validation in a Residential Building. Sustainability 2022, 14, 14644. [Google Scholar] [CrossRef]
- Cao, K.; Liu, Y.; Meng, G.; Sun, Q. An overview on edge computing research. IEEE Access 2020, 8, 85714–85728. [Google Scholar] [CrossRef]
- Alsalemi, A.; Himeur, Y.; Bensaali, F.; Amira, A. An innovative edge-based Internet of Energy solution for promoting energy saving in buildings. Sustain. Cities Soc. 2022, 78, 103571. [Google Scholar] [CrossRef]
- Thinh, T.N.; Le, L.T.; Long, N.H.; Quyen, H.L.T.; Thu, N.Q.; La Thong, N.; Nghi, H.P. An Edge-AI Heterogeneous Solution for Real-time Parking Occupancy Detection. In Proceedings of the 2021 International Conference on Advanced Technologies for Communications (ATC), Ho Chi Minh City, Vietnam, 14–16 October 2021; pp. 51–56. [Google Scholar]
- Sayed, A.; Himeur, Y.; Alsalemi, A.; Bensaali, F.; Amira, A. Intelligent edge-based recommender system for internet of energy applications. IEEE Syst. J. 2021, 16, 5001–5010. [Google Scholar] [CrossRef]
- Rastogi, K.; Lohani, D. Edge computing-based internet of things framework for indoor occupancy estimation. In Research Anthology on Edge Computing Protocols, Applications, and Integration; IGI Global: Hershey, PA, USA, 2022; pp. 619–643. [Google Scholar]
- Alsalemi, A.; Himeur, Y.; Bensaali, F.; Amira, A. Smart Sensing and End-Users’ Behavioral Change in Residential Buildings: An Edge-Based Internet of Energy Perspective. IEEE Sens. J. 2021, 21, 27623–27631. [Google Scholar] [CrossRef]
- Azizi, S.; Rabiee, R.; Nair, G.; Olofsson, T. Effects of Positioning of Multi-Sensor Devices on Occupancy and Indoor Environmental Monitoring in Single-Occupant Offices. Energies 2021, 14, 6296. [Google Scholar] [CrossRef]
- Stekhoven, D.J.; Bühlmann, P. MissForest—Non-parametric missing value imputation for mixed-type data. Bioinformatics 2012, 28, 112–118. [Google Scholar] [CrossRef] [Green Version]
- Low, R.; Tekler, Z.D.; Cheah, L. Predicting commercial vehicle parking duration using generative adversarial multiple imputation networks. Transp. Res. Rec. 2020, 2674, 820–831. [Google Scholar] [CrossRef]
Figure 1.
High-level overview of the occupancy detection system using edge computing.
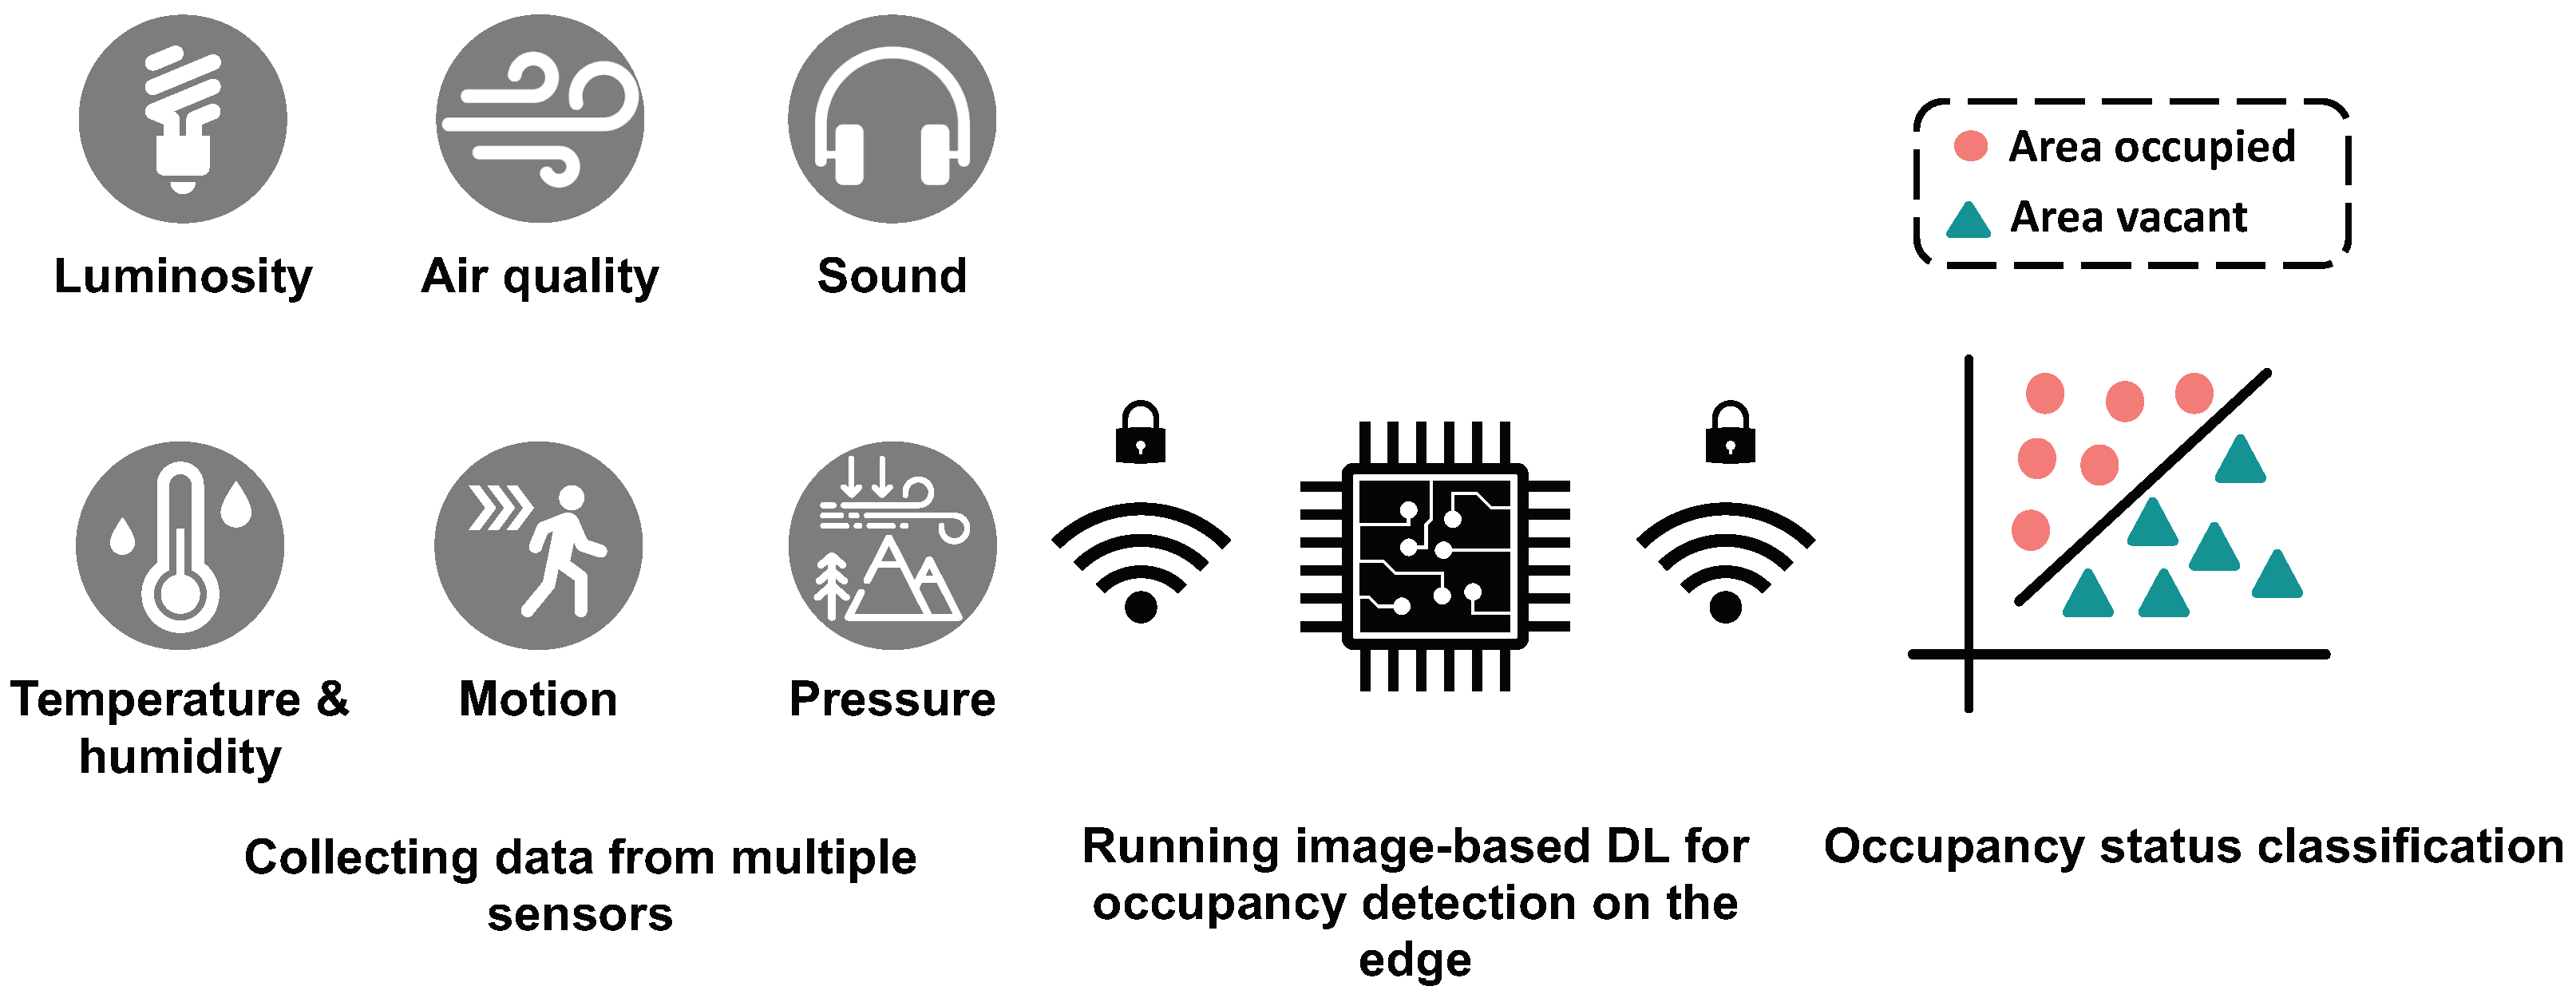
Figure 2.
Time-series data to images encoding approach.
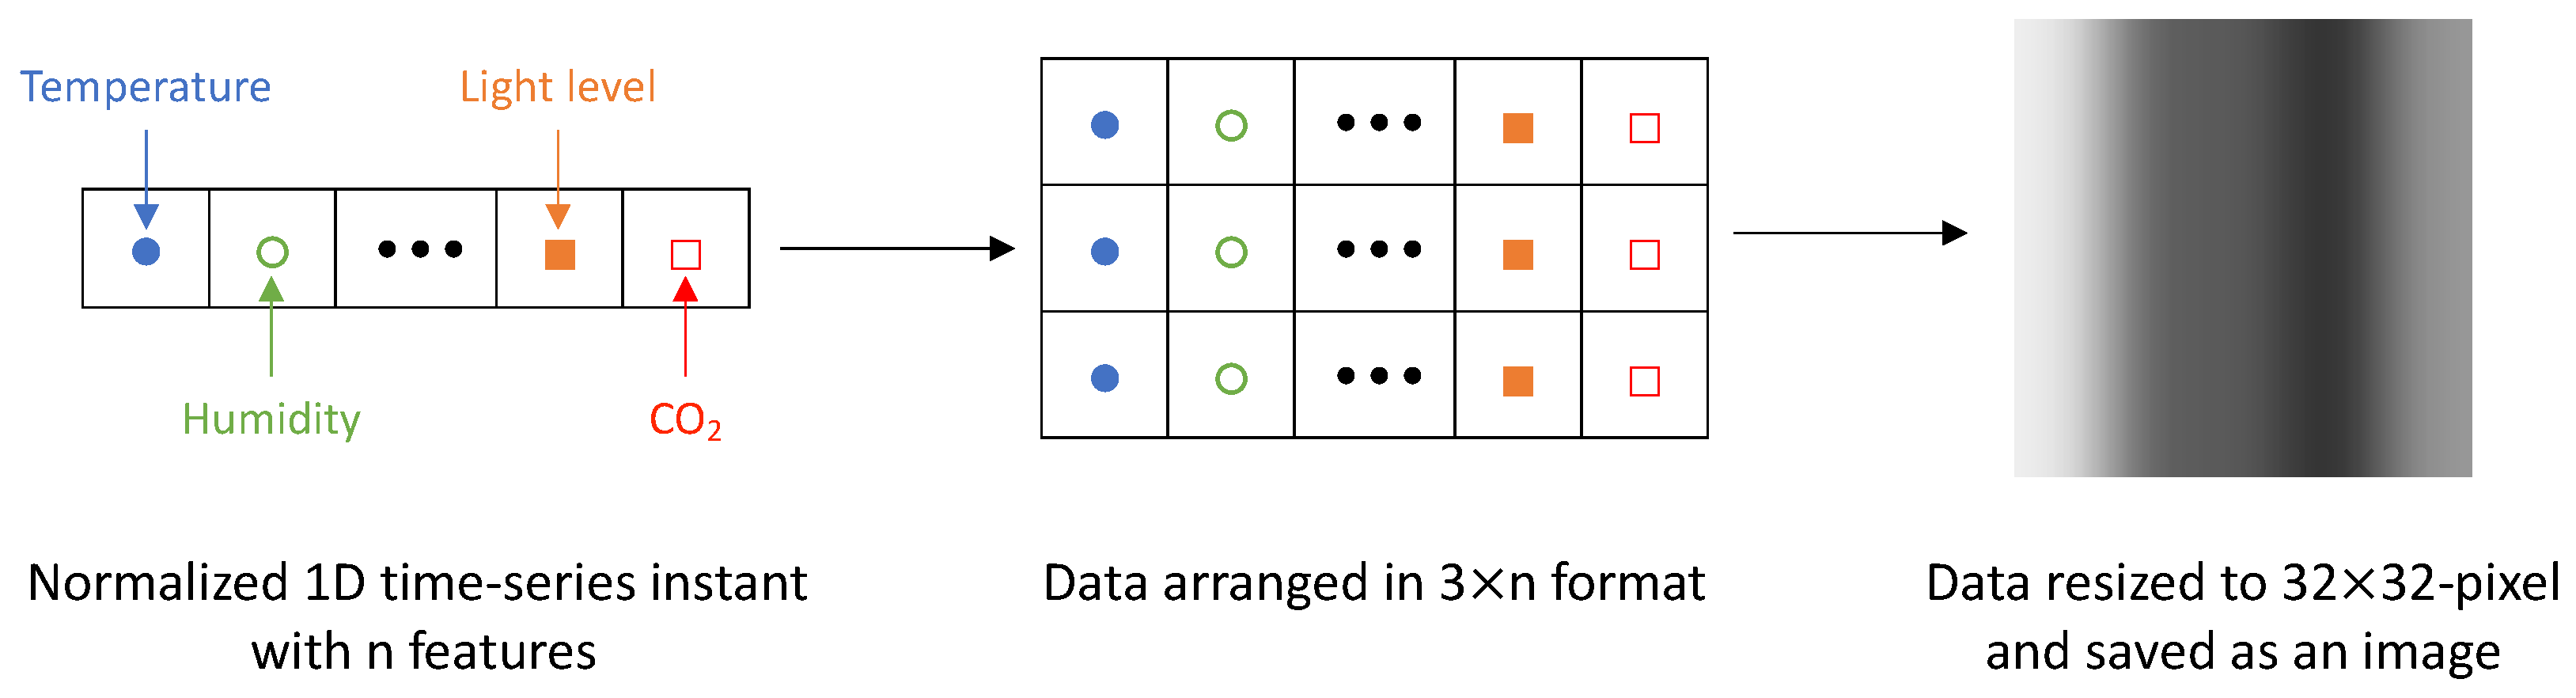
Figure 3.
Environmental board showcasing the (a) PCB configuration, and (b) cover.
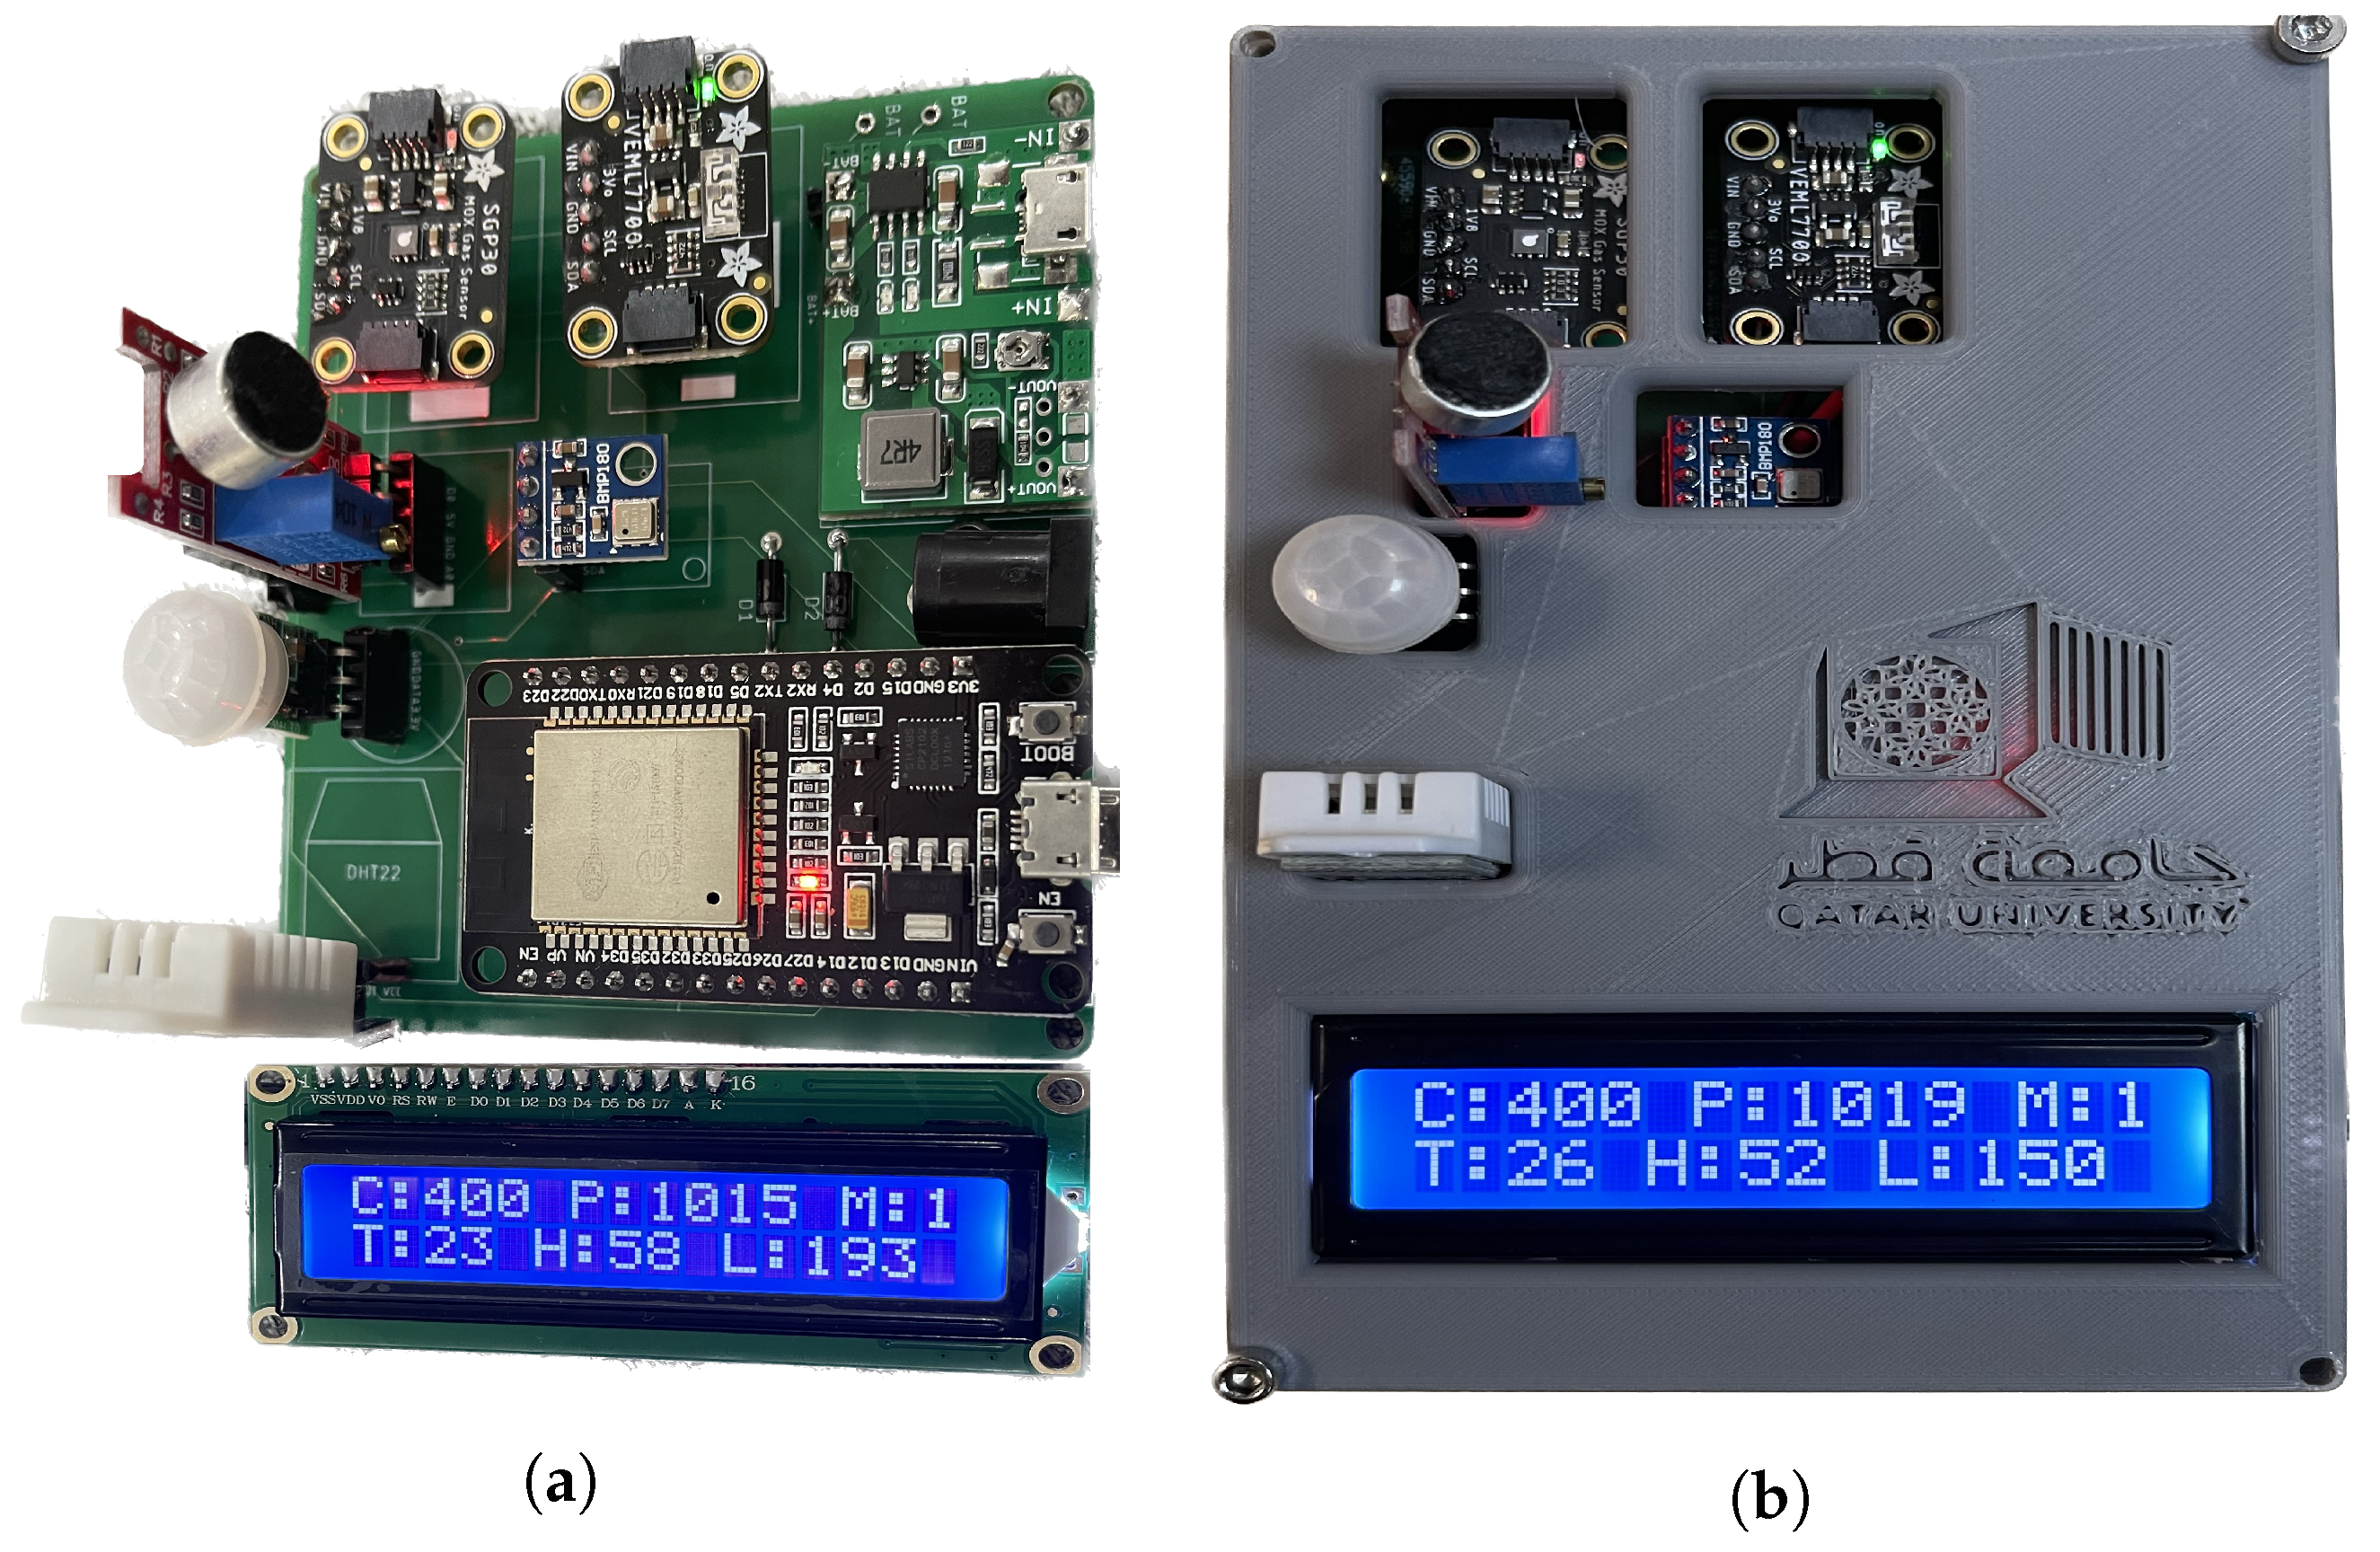
Figure 4.
Schematic layout of the office and environmental board positioning.
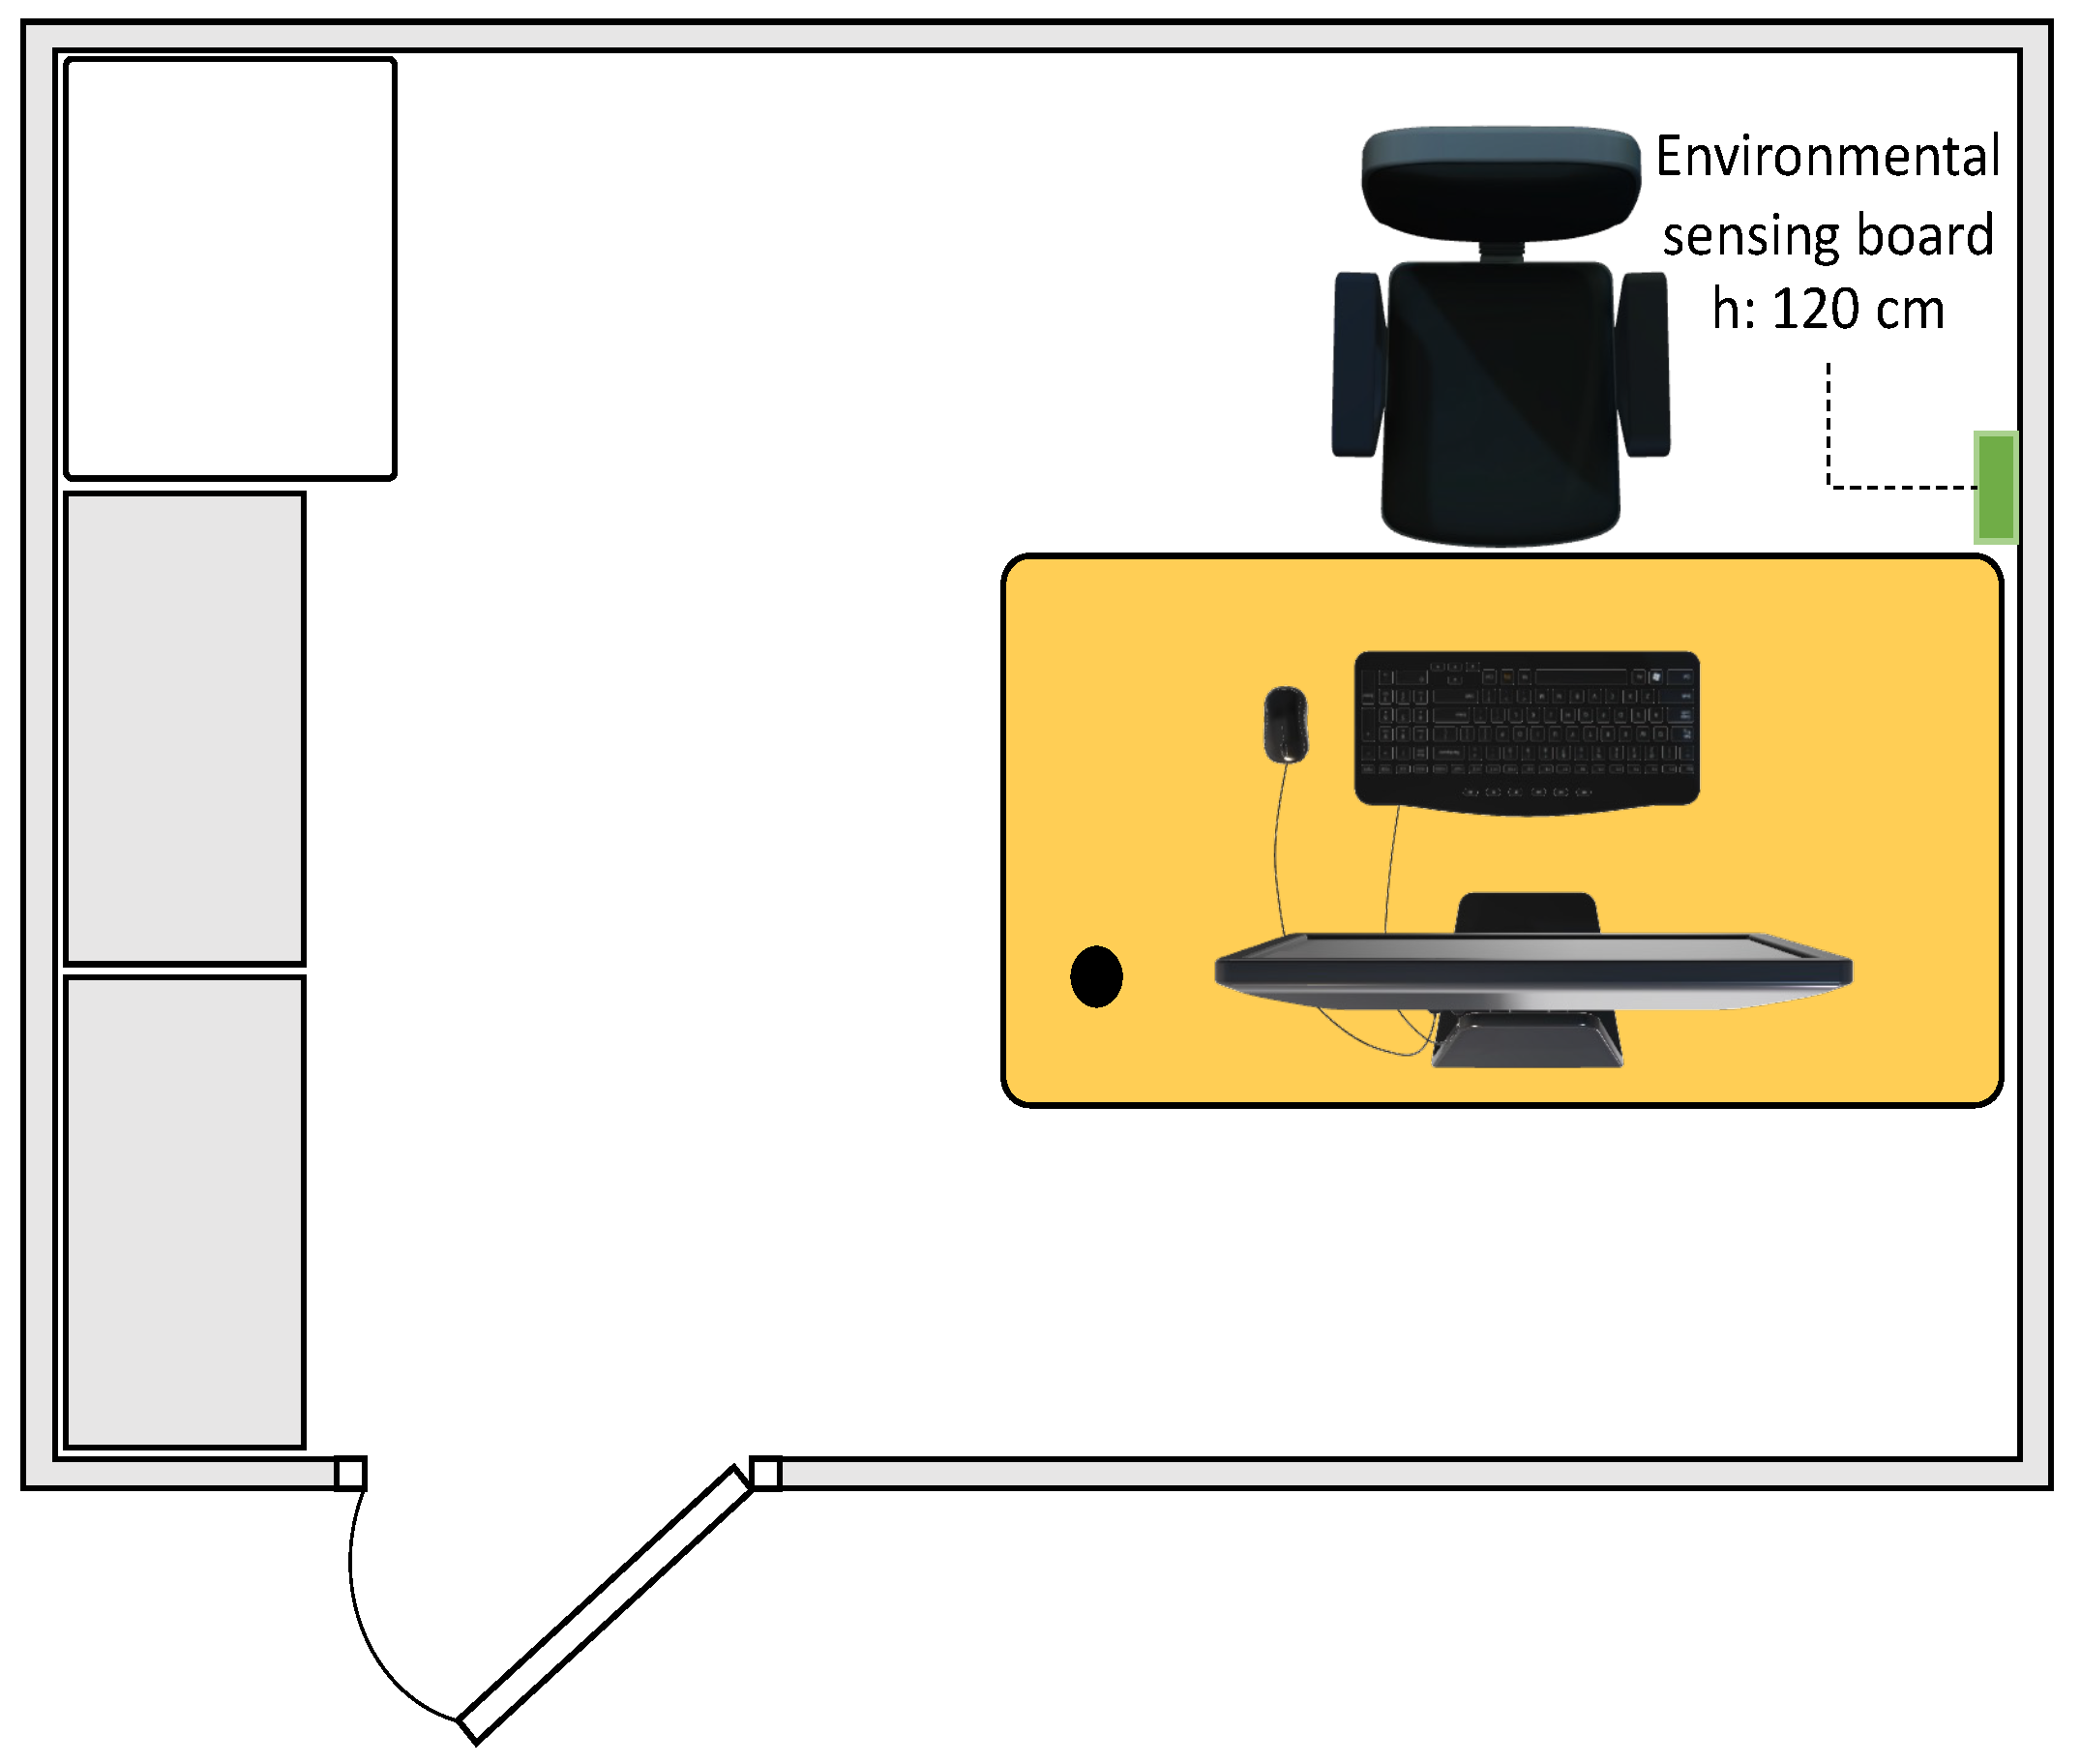
Figure 5.
Data flow between the database, the environmental sensing board, and the edge device.
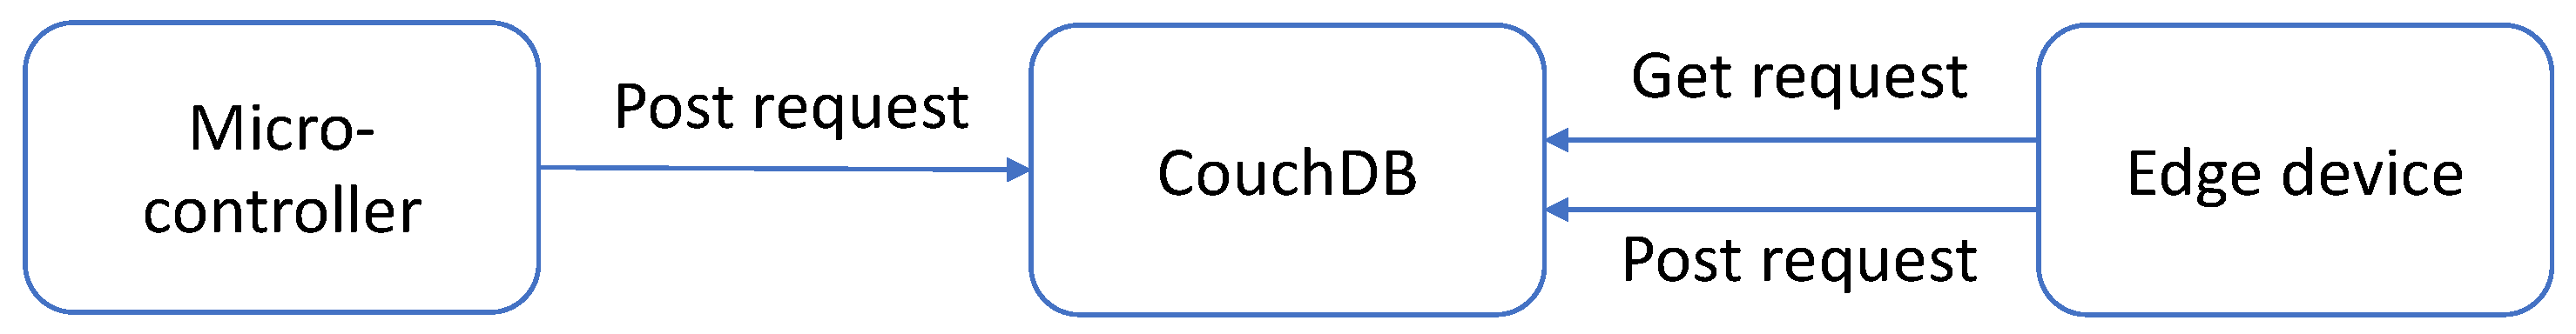
Figure 6.
Correlation matrix considering all the variables.
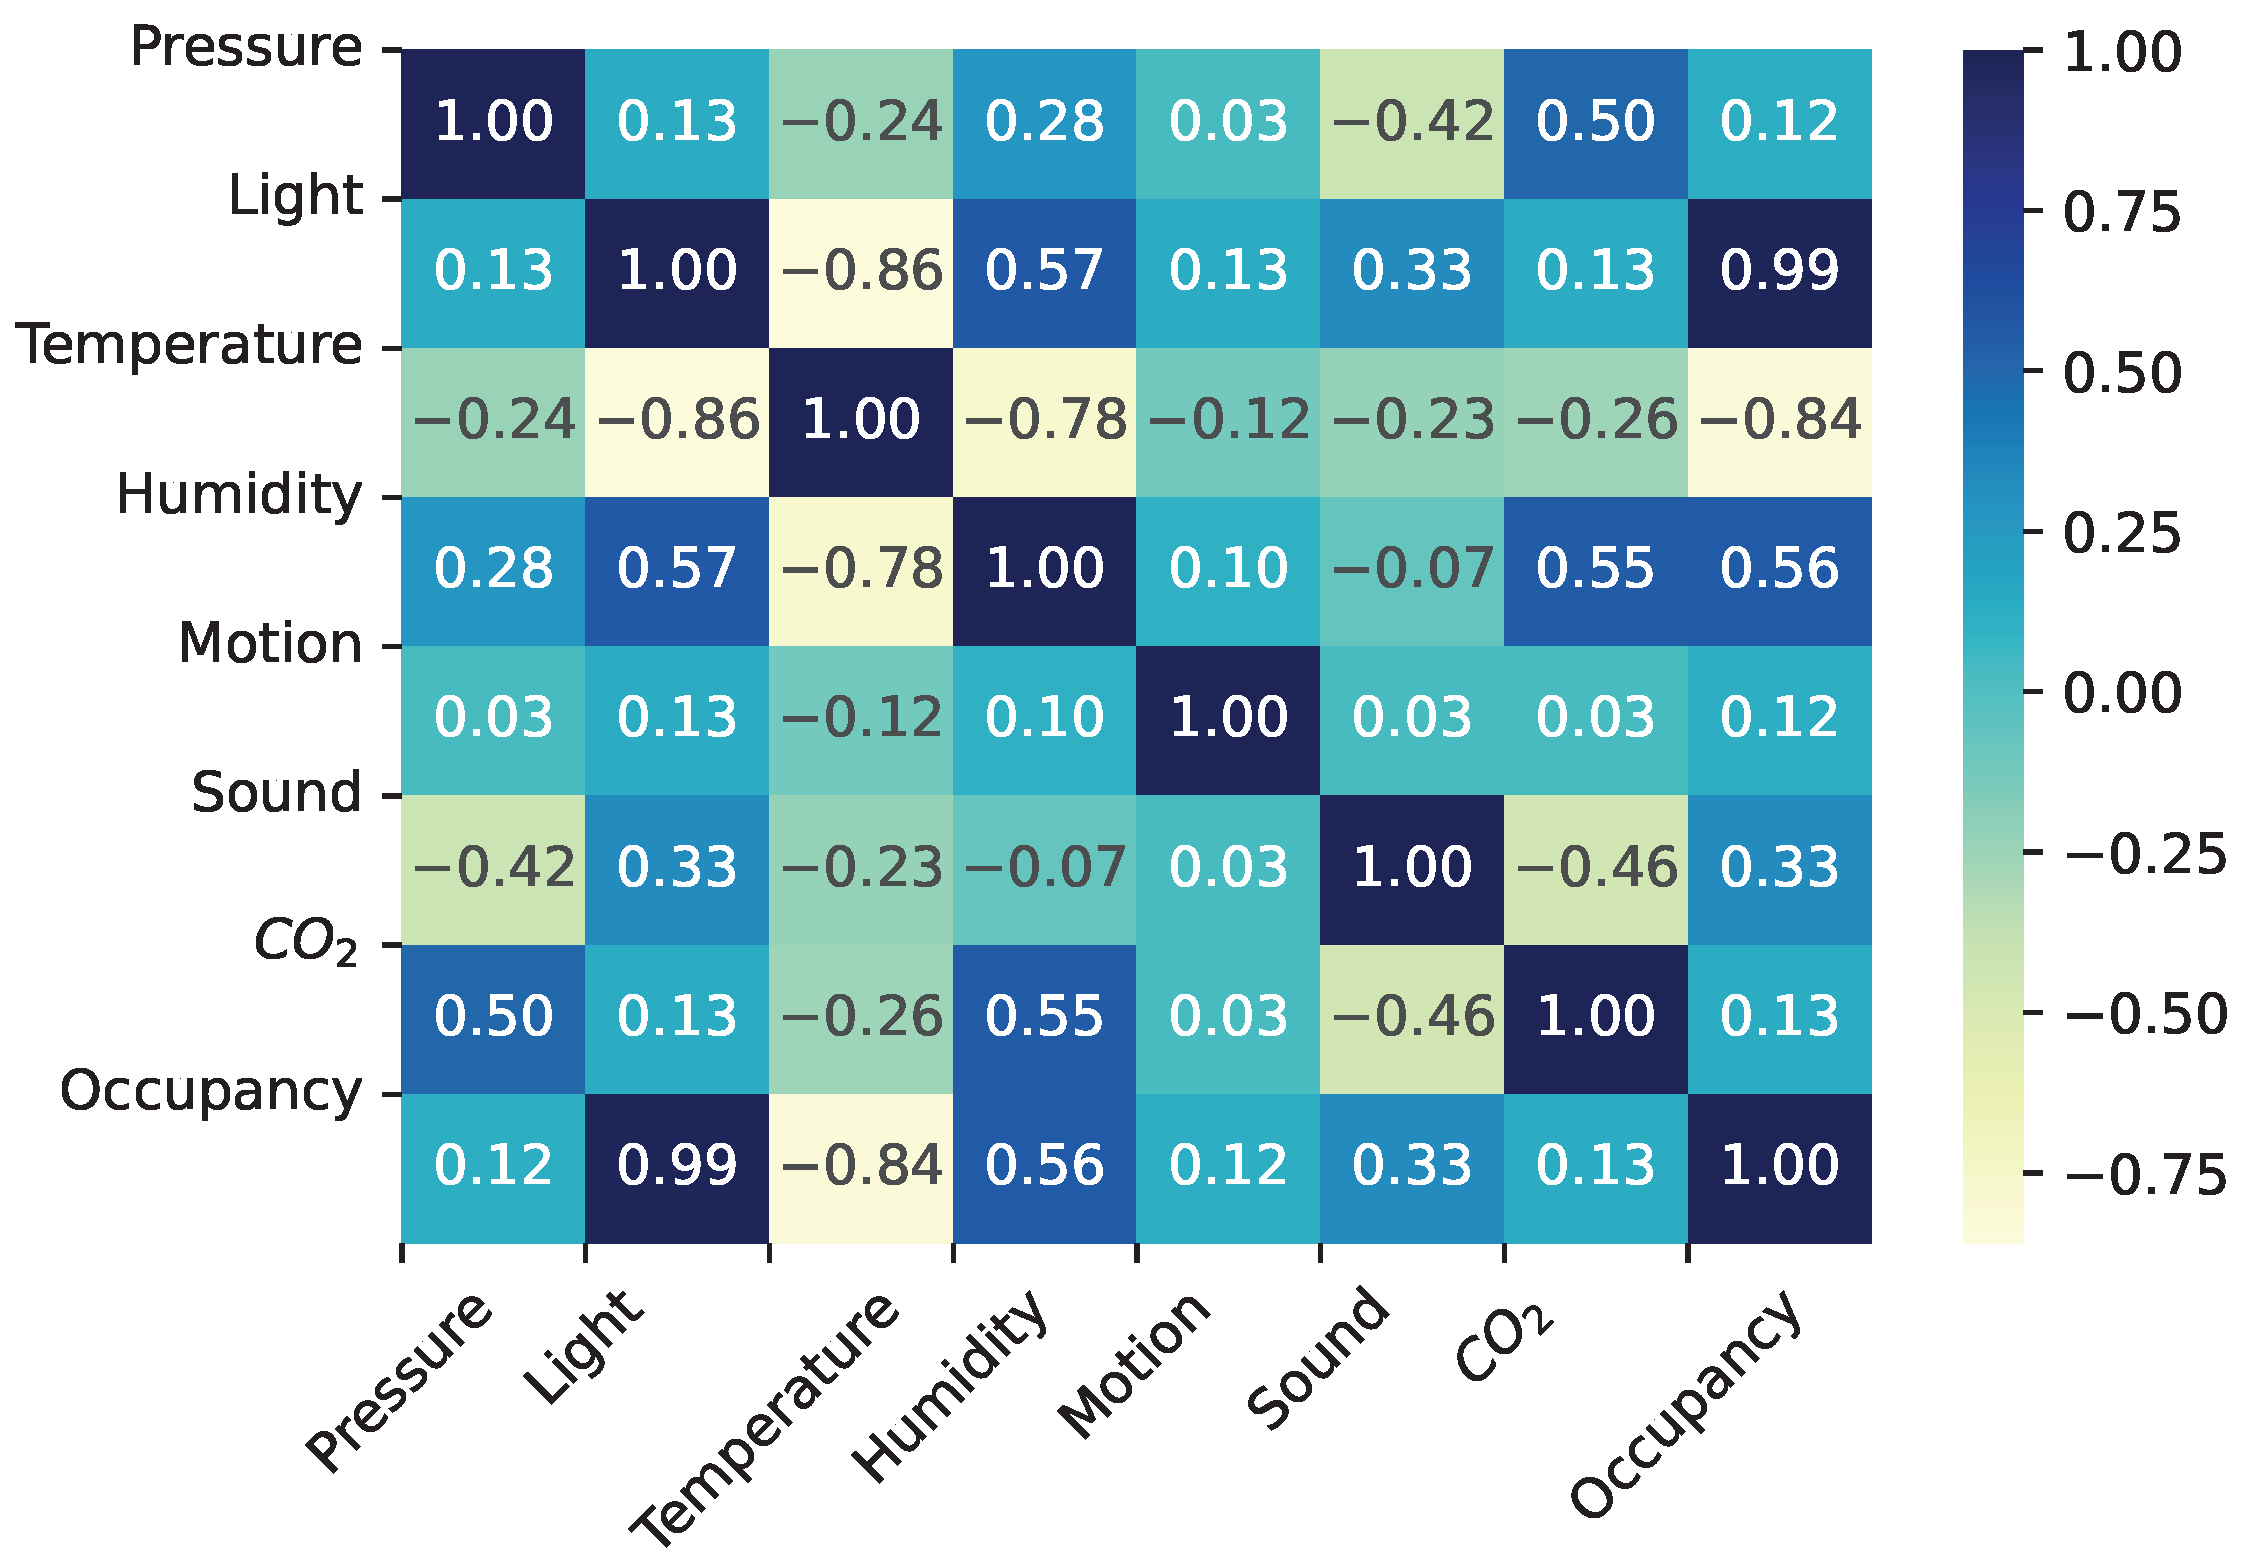
Figure 7.
Confusion matrix for the (a) 1D-CNN and (b) 2D-CNN.
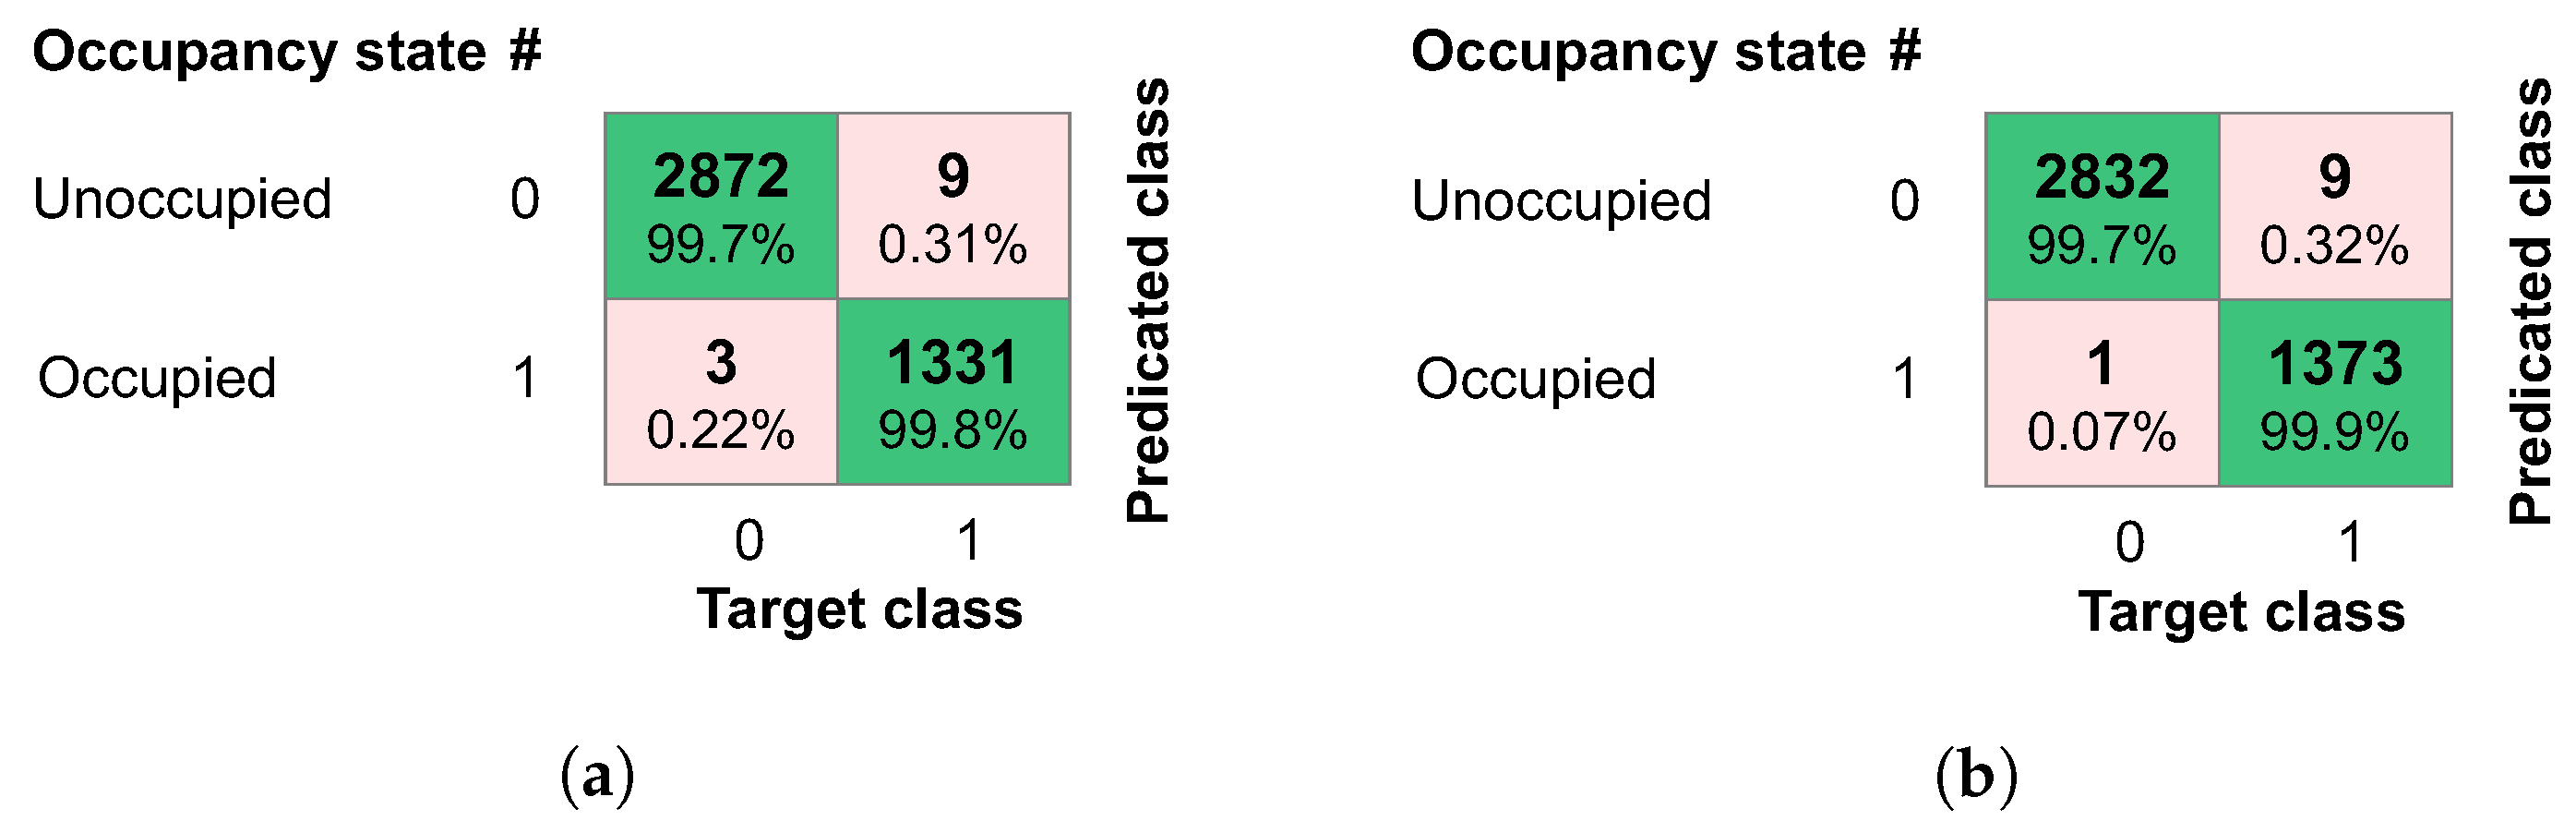
Figure 8.
Edge-based occupancy detection in real-time with one day of testing data.

Table 1.
A summary of the studies discovered employing edge devices or ML methods for occupancy detection.
Table 1.
A summary of the studies discovered employing edge devices or ML methods for occupancy detection.
| Reference | Sensors/Devices Used | Edge Device Used | Algorithm |
|---|---|---|---|
| [22] | Optical cameras | Raspberry Pi | CNN |
| [23] | Optical camera and a temperature sensor | Raspberry Pi 3B+ | HOG, SVM |
| [24] | Thermal array sensor | Raspberry Pi 4B with a Coral USB Accelerator | CNN |
| [25] | Thermal array sensor | STM32F | FNN |
| [26] | Thermal array sensor | ARM Cortex | CNN |
| [27,28] | Temperature and humidity sensors | Raspberry Pi | kNN |
| [29] | Temperature, humidity, motion, and CO sensors | Raspberry Pi | LR, QR |
| [3] | Temperature, humidity, light, and CO | N/A | HMM |
| [31] | Environmental sensors, audio data, and cameras | N/A | Depends on input source |
| [34] | Air quality | N/A | CatBoost |
| [35] | Floor vibration measurements | N/A | SVM |
| [36] | CO and Wi-Fi devices | N/A | LSTM, GRU |
| [37] | Light, CO, and humidity | N/A | kNN, DT, ANN |
| [38] | CO, relative humidity, and temperature | N/A | CNN-XGBoost |
Table 2.
Sensor used for data collection: types and measurement ranges.
| Variable and Unit | Sensor Type | Measurement Range |
|---|---|---|
| Temperature (C) | DHT22 | −40–80 C |
| Humidity (%) | DHT22 | 0–100% |
| Pressure (hPa) | BMP180 | 300–1100 hPa |
| Light level (Lux) | VEML7700 | 0–120 kLux |
| Motion (on/off) | AM312 | 3 m |
| Sound level (dB) | KY-037 | 3–6 kHz |
| eCO (ppm) | SGP30 | 400–60,000 ppm |
Table 3.
1D-CNN and 2D-CNN models’ performance.
| DL Approach | Accuracy (%) | Precision (%) | Recall (%) | F1-Score (%) | Training Time (s) |
|---|---|---|---|---|---|
| 1D-CNN | 99.72 | 99.33 | 99.78 | 99.55 | 52.37 |
| 2D-CNN | 99.76 | 99.35 | 99.93 | 99.64 | 69.62 |
Disclaimer/Publisher’s Note: The statements, opinions and data contained in all publications are solely those of the individual author(s) and contributor(s) and not of MDPI and/or the editor(s). MDPI and/or the editor(s) disclaim responsibility for any injury to people or property resulting from any ideas, methods, instructions or products referred to in the content. |
© 2023 by the authors. Licensee MDPI, Basel, Switzerland. This article is an open access article distributed under the terms and conditions of the Creative Commons Attribution (CC BY) license (https://creativecommons.org/licenses/by/4.0/).
Share and Cite
MDPI and ACS Style
Sayed, A.N.; Bensaali, F.; Himeur, Y.; Houchati, M. Edge-Based Real-Time Occupancy Detection System through a Non-Intrusive Sensing System. Energies 2023, 16, 2388. https://doi.org/10.3390/en16052388
AMA Style
Sayed AN, Bensaali F, Himeur Y, Houchati M. Edge-Based Real-Time Occupancy Detection System through a Non-Intrusive Sensing System. Energies. 2023; 16(5):2388. https://doi.org/10.3390/en16052388
Chicago/Turabian StyleSayed, Aya Nabil, Faycal Bensaali, Yassine Himeur, and Mahdi Houchati. 2023. "Edge-Based Real-Time Occupancy Detection System through a Non-Intrusive Sensing System" Energies 16, no. 5: 2388. https://doi.org/10.3390/en16052388
Note that from the first issue of 2016, this journal uses article numbers instead of page numbers. See further details here.