
Development of the Biomethane Market in Europe


1
Institute of Economics and Finance, Warsaw University of Life Sciences–SGGW, Nowoursynowska 166, 02-787 Warsaw, Poland
2
Institute of Agriculture, Warsaw University of Life Sciences–SGGW, Nowoursynowska 159, 02-766 Warsaw, Poland
*
Author to whom correspondence should be addressed.
Energies 2023, 16(4), 2001; https://doi.org/10.3390/en16042001
Submission received: 12 January 2023
/
Revised: 9 February 2023
/
Accepted: 15 February 2023
/
Published: 17 February 2023
(This article belongs to the Topic Advances in Biomass Conversion)
Abstract
:The challenges related to climate policy and the energy crisis caused the search for alternative ways of obtaining energy, one of the essential tasks faced by scientists and political decision-makers. Recently, much attention has been paid to biomethane, which is perceived as a substitute for natural gas. Compared to the traditional combustion of biogas in cogeneration units (CHP), upgrading it to the form of biomethane can bring both environmental benefits (reduction in GHG emissions) and economic benefits (higher efficiency of energy use contained in biomass). The purpose of this review was a comprehensive assessment of the conditions and opportunities for developing the biomethane sector in the EU in the face of challenges generated by the energy and climate crisis. The article reviews the condition of the biomethane market in the European Union, focusing on such issues as biomethane production technologies, current and future supply and demand for biomethane, and biomethane production costs with particular emphasis on upgrading processes and financial support systems used in the EU countries. The review showed that the market situation in biomethane production has recently begun to change rapidly. However, the share of biomethane in meeting the needs for natural gas remains small. Moreover, the available expert studies indicate a significant development potential, which is desirable because of the need to increase energy security and environmental and economic reasons. However, this will require organizing the legal environment and creating a transparent system of incentives.
1. Introduction
One of the current key challenges is climate change mitigation caused by greenhouse gas emissions (GHG) [1]. Energy sector-related processes (energy industries, fuel combustion by energy users, and transport) are responsible for 77% of greenhouse gas emissions in the EU [2]. Hence, searching for and disseminating alternative energy sources is one of the key tasks of the energy transformation and transition to the zero-emission economy [3]. One of the most promising renewable energy sources (RES) is biogas (including, in particular, agricultural biogas). Compared to other renewable energy sources, it is characterized by much greater stability and allows reducing greenhouse gas emissions from managing organic matter in agriculture, e.g., manure [4]. It is assumed that reducing every kilogram of carbon dioxide equivalent (CO2e) emission resulting from manure management by the production of biogas allows for mitigating the same amount of CO2e by replacing fossil fuels with renewable sources. Despite the many advantages, biogas-based electricity is more expensive than other RES (which have become significantly cheaper in recent years). Investment in biogas plants used to be economically profitable only with support higher than for wind and solar energy. This fact increases the pressure to look for more effective ways of biogas management [5]. Thus far, the development of the biogas sector in many countries has been based on the cogeneration model (CHP), consisting of using biogas in combustion units to produce electricity and heat simultaneously [6]. In many cases, effective thermal energy management is complicated, meaning that part of the primary energy is dissipated (the efficiency of cogeneration units is estimated at less than 40%) [7]. The mentioned problem can be eliminated by upgrading biothermal energy management [8]. At present, biogas and biomethane are perceived as the core of the circular economy [9]. Increasing the production level of biomethane is also considered an opportunity to reduce the economic significance of natural gas imports [10]. Biomethane has a high potential for reducing GHG emissions—it can be assumed that replacing fossil fuels with biomethane reduces emissions by 80%. However, in some solutions, it is possible to achieve a reduction of 200% when in addition to the emissions avoided from replacing fossil fuel, a similar amount of GHG is effectively removed from the atmosphere and stored on the land or can be avoided in adjacent systems [11]. As a result, lifecycle emission is expected to be below zero [11]. The development of biomethane production is important not only from the environment but also from the political point of view. The gas price increases of late 2021 and the escalation of the Russia–Ukraine crisis have made it necessary to step up the pace of EU and UK energy mix change proposals, all of which stand on existing plans, to reduce fossil fuel commitment [12]. The response to the energy crisis proposed by the European Commission is to decarbonize further and extend the use of renewable energy in all sectors of the economy—which is in line with the objectives of The Paris Agreement and the European Climate Law (Regulation 2021/1119 of the European Parliament and of the Council of 30 June 2021 Establishing the Framework for Achieving Climate Neutrality and Amending Regulations).
It is expected that electricity and hydrogen-based fuels will replace many fossil fuels in transport by 2050, with bioenergy playing an important role. Biogas energy is often cited as a tool for changing the energy mix and reducing emissions (in both the energy, agricultural, and industrial sectors) [13]. Many authors indicate the further use of biomethane (i.e., methane extracted by processing biomass), which is particularly applicable in Europe’s current situation [14,15]. Biomethane is a carbon-neutral [11,16] substitute for natural gas and has many applications (liquefaction, compression, grid injection, and industrial use) [17,18,19]. Moreover, 83% of biogas production in the EU is currently used locally to produce electricity and heat by CHP units [20]. Due to the CHP’s lower primary energy conversion efficiency compared to bio-gas utilization in the heating sector and the often occurring problem of waste heat usage, many scientists and experts indicate alternative options for biogas management [21].
The set of problems, challenges, and opportunities outlined above already indicate that the assessment of the development potential of the biomethane sector is a complex task, the implementation of which requires at least several dimensions to be taken into account. These include environmental, technological, and economic aspects and political conditions. The issue of the development of the biomethane sector in EU countries has already been the subject of academic and industry analysis several times [9,10,11,19,22,23,24,25,26]. However, authors usually focus on selected aspects of the discussed issue, e.g., technological progress, production potential, or economic conditions. In this context, the purpose of this review was a comprehensive assessment of the conditions and opportunities for the development of the biomethane sector in the EU in the face of challenges generated by the energy and climate crisis. The study takes into account such dimensions of the sector as available production technologies (including upgrading methods), regulatory and policy framework for biomethane production, market situation (including the demand and supply potential), production economics (taking into account the costs of production, upgrading and biomethane prices), and producer support systems. This article fills the gap in the literature through a comprehensive and synthetic presentation of the conditions for the development of the biomethane sector in the EU in the context of intensifying energy crisis. This study may also be useful to practitioners, as the most important and current conditions regarding the biogas sector in the EU have been collected and described here, the recognition and understanding of which is important when making investment decisions.
The methodological basis of this article was a systematic review of the literature covering five stages typically implemented in this type of research [27], i.e.,:
- (a)
- Pre-search to plan the review and define its purpose;
- (b)
- Full search and literature retrieval;
- (c)
- Extraction and ocean of the harvested material;
- (d)
- Synthesis and analysis of results;
- (e)
- Making the results available.
In the first stage of the study, the existence of alleged gaps in the literature was verified, and the available range of the literature was assessed by searching known electronic databases (Google Scholar, WoS, ScienceDirect, AgEcon Search) and websites of organizations dealing with energy issues (International Energy Agency, European Biogas Association, GasforClimate, Eurostat). The identified databases were free-text searched (without descriptors) [27]. The keywords used included the following phrases: “biomethane”, “biomethane upgrading”, “biomethane production”, “bio-methane development”, “biomethane cost production and upgrading”, “biomethane economics”, “biomethane support in the EU”, “biomethane technologies”, and “biomethane demand and supply”. The titles and abstracts were analyzed in the selection process, and the geographical scope was limited to EU countries. Selected titles, which, based on the title and abstract, seemed adequate to prepare the review, were fully analyzed, dividing the collected studies into subcategories according to “technology”, “legislation and policy”, “economics”, “market”, and “support”. Selected studies were collected in the “cloud” using the Mendeley service, which was also used to compile a list of the literature. The study also uses sources unavailable online, including industry reports received from experts working in the agricultural biogas industry. At the “extraction” stage, information was selected from individual studies, which made it possible to characterize specified aspects of the functioning of the biomethane sector, which is reflected in the paper in individual sections. The last stage of the research was the synthesis of the collected information, which was synthetically reflected in the summary.
2. Biomethane—Characteristics and Production Methods
Biomethane (sometimes referred to as renewable natural gas RNG) describes methane derived from biomass. After obtaining the appropriate quality, biomethane is equivalent to fossil gas and compatible with existing natural gas engines and infrastructure. Processes to produce biomethane are commercially available, with the most common solutions being anaerobic digestion followed by biogas upgrading (Figure 1).
According to the International Energy Agency (IEA) data [10], in 2019, 90% of biomethane produced worldwide was obtained due to the biogas upgrading process. However, biomethane can also be obtained through biomass gasification followed by syngas methanation or conversion of biomass-derived CO2 with H2 into CH4 (bio methanation process).
2.1. Biogas Upgrading
Biogas is produced by the anaerobic digestion of manure, slurry, agricultural residues, energy crops, by-products from the agri-food industry or wastewater treatment plants, and other organic wastes [28]. The process occurs spontaneously in nature, e.g., during the storage of manure or slurry or in the stomach of ruminants [29,30]. On a chemical basis, biogas is a mixture of methane (50–75%), carbon dioxide (25–45%), and other gases present in small quantities [31]. These are ammonia, hydrogen sulfide, and hydrogen (Table 1).
Biogas upgrading aims to increase the methane (CH4) concentration by its separation from other biogas compounds. Usually, these are water (H2O), carbon dioxide (CO2), hydrogen sulfide (H2S), dinitrogen (N2), dioxygen (O2), carbon monoxide (CO), ammonia (NH3), volatile organic compounds (VOCs), siloxanes, hydrocarbons, and aromatic and halogenated compounds [32].

Table 1.
Biogas, biomethane, and natural gas parameters comparison.
| Gas Composition | Biogas * | Biomethane ** | Natural Gas *** |
|---|---|---|---|
| CH4 | 50–75% | 94–99.9% | 93–98% |
| CO2 | 25–45% | 0.1–4% | 1% |
| Nitrogen | <2% | <3% | 1% |
| Oxygen | <2% | <1% | - |
| Hydrogen | <1% | - | - |
| H2S | 20–20,000 ppm | <10 ppm | - |
| Water | 2–7% | - | - |
| LHV | 16–28 MJ/m3 | 36 MJ/m3 | 37–40 MJ/m3 |
Biogas upgrading technologies come mainly from the gas refining industry. These technologies use the differences in the chemical and physical properties of individual gaseous compounds [32]. They are primarily based on physical and chemical absorption and adsorption, in addition to cryogenic or membrane separation [30]. The decision on the upgrading technology depends on the composition of biogas, requirements or biomethane legislation, equipment costs, CH4, CO2 losses, energy consumption, and the price of biomethane.
2.1.1. Membrane Separation
The membrane separation functional principle is based on exploiting differences in properties between gases contained in biogas. CO2 has the highest permeability of gases found in biogas, while CH4 has the lowest [37]. Due to the high selection precision, affordability, and thermal and structural stability under high-pressure, organic polymers (such as cellulose acetates, polycarbonyls, polysulfones, polyimides, and polydimethylsiloxane) are used to manufacture membranes. Single membrane separation guarantee 92–94% CH4 purity level. The highest purity level (96–98% CH4) can be reached using multi-step gas–gas units under high-pressure conditions. The membrane process is characterized by relatively low energy consumption and a relatively uncomplicated installation process and is also suitable for low gas flow rates. However, the process requires compressing biogas to pressures of 10–20 bar and its pre-treatment (H2O, H2S, and NH3 separation). Moreover, membranes undergo regular wear and tear, conditioning the necessity of their replacement after a particular time. According to the IEA report authors’ findings, membrane lifetime is up to 4–5 years [38].
2.1.2. Physical Absorption
One of the most popular physical absorption technology is water scrubbing which utilizes the different solubility levels of the various biogas compounds in water. According to Towler and Sinnott [39], CO2 is 26 times more soluble in water at 25 °C than CH4. This technology requires preliminary removal of H2S from the biogas because its solubility in water is very high, and it could damage the scrubber.
Some technologies use organic solvents instead of water. The most commonly used is dimethyl ethers of polyethylene glycol, which has a higher ability to bind CO2 and H2S than water.
2.1.3. Chemical Absorption
Amine scrubbing systems dominate in the group of chemical absorption technologies. In this system, aqueous amine solutions (i.e., mono-, di-, or tri-ethanolamine) are used to remove the CO2 from biogas. However, NaOH, KOH, and Ca(OH)2 also can be used as a solvent reacting with CO2 [32].
According to Yoo et al. [40], to remove 1 ton of CO2 from biogas, 1.39 tons of monoethanolamine or 0.9 tons of NaOH is needed. The chemical scrubbing technology is performed at the temperature of 120–160 °C under atmospheric pressure (1.01325 bar) in absorption and a stripper column. The main advantages of this method are high efficiency in biogas upgrading (95–99% CH4) and very low CH4 losses (<0.1%).
2.1.4. Pressure Swing Absorption
Pressure swing adsorption (PSA) technology removes different gasses from biogas via their adsorption on material with high surface area, e.g., activated carbon, zeolite, or silica gel. The PSA is based on the principles of selective adsorption affinity for various molecular sizes. The mentioned process consists of four steps: adsorption, blow-down, purge, and pressurization [41]. The adsorbent material is regenerated by the pressure-decreasing, which releases gases. PSA technology makes it possible to obtain a high concentration of CH4 (96–98%), but its losses cannot be avoided since CH4 is also adsorbed on a solid surface [42].
2.1.5. Cryogenic Separation Process
Cryogenic separation technology is based on biogas components’ different liquefaction and solidification temperatures. The boiling point of CH4 is at −162 °C, and the sublimation of CO2 is at −78.5 °C (both at the standard pressure) [37]. The separation is carried out by multiple compressing of the biogas up to 80 bars and intermittent cooling stages up to −110 °C [43]. The cycles of cooling and compression are repeated. Then, the gas goes to the distillation column, where it is separated into biomethane (98–98% CH4) and impurities, such as CO2, H2O, H2S, siloxanes, and halogens.
The cryogenic separation process is high energy-consuming, limiting this technology’s practical application [44]
In Table 2, upgrading technologies are compared in terms of consumption for raw biogas, energy requirement, biomethane purity level, CH4 losses, operation pressure, cost, and share in the market.
2.2. Biomass Gasification
An alternative method of biomethane production is the gasification of solid biomass followed by synthesis gas (often called syngas) methanation. The most common technology is thermal gasification, carried out in high temperatures (700–800 °C) under high pressure and low oxygen access [11,48]. Syngas consists mainly of hydrogen (28–40%) and carbon monoxide (16–25%), while the methane content ranges from 6 to 12% [49]. The produced syngas can be used to generate electricity and heat or component for methanol or ethanol production. Synthetic gas can also be used as a source of green hydrogen [50].
The production of biomethane from syngas requires using a water–gas shift reaction to convert CO to CO2, which is combined with H2 to CH4 in a step called methanation [51]. The reaction requires using catalysts, of which Ru- and Ni-based are the most common [52]. Thermochemical methanation often operates at temperatures up to 300 °C and under high pressure (30 bar).
3. The Regulatory and Policy Framework for Biomethane Production in Selected EU Countries
The external environment significantly influences the development and current state of the biomethane market. Both national and international regulations are significant [56]. In the European Union, directives, regulations, recommendations, and strategic documents determine the future shape of binding legal acts.
3.1. EU’s Strategic Regulations
On December 12 2019, the European Council approved the objectives of the EU strategy “European Green Deal” [57], which assumes a shift away from fossil fuels and consequently met its commitments due to the Paris Agreement (reducing greenhouse gas emissions) [58]. An initial step towards implementing this strategy was the publication of the European Commission’s document called the Clean Energy for All Europeans Package in November 2016 [59]. One of the eight components of the package was a Directive (EU) 2018/2001 of the European Parliament and of the Council of December 11 2018, on the promotion of the use of energy from renewable sources [60]. The directive, commonly known as RED II Directive, established:
- −
- EU’s target of RES share in the energy mix in 2030 on 32% of gross final energy consumption (Article 3(1), point 128);
- −
- EU’s target RES share in the transport sector of 14% (3.5% of advanced biofuels) (Article 25(1));
- −
- Regulations for energy prosumers;
- −
- A standard set of rules for the use of renewable energy in all sectors;
- −
- A guarantee of origin system;
- −
- Sustainability criteria for bioenergy.
From the point of biomethane market development, an essential provision of the directive has been introducing a mandatory target for RES’s share in the transport sector. Due to its characteristics, biomethane can be used directly as a biofuel (in liquefied or compressed form) or a source of biohydrogen [61].
In 2021, European Green Deal strategic assumptions turned into the European Climate Law [62], which determines legally binding targets for EU climate neutrality by 2050 and a 55% reduction in GHG emissions by 2030. The monitoring of progress toward the reduction and RES share targets is to be based on existing systems, such as Member States’ National Energy and Climate Plans (introduced in 2018 [63]). According to European Commission’s assumptions from 2019, biomethane should cover up to 10% of projected natural gas consumption in 2030 (350 TWh) [59]. Furthermore, the need for an urgent revision of the existing directives was mentioned.
3.2. Updated Energy and Climate Regulations
In line with earlier announcements underlining the need to revise existing climate law, on 14 July 2021, the “Fit for 55” package was published. This document provides the basis for implementing the updated EU target of reducing greenhouse gas emissions by 55% by 2030 [64]. The package contains legislative proposals (directives and other amendments to regulations) on “The EU Emissions Trading Scheme update; Effort Sharing regulation; Land use and forestry (LULUCF); alternative fuels infrastructure; CO2-price adjustment mechanism at; REfuelEU Aviation and FuelEU Maritime; CO2 emission standards for cars and vans; energy taxation; renewable energy; energy efficiency” [65]:
The most significant element of the package from the point of view of renewable energy producers was the proposed revision of the RED II directive. The new revision of the Renewable Energy Directive [66] assumes to increase in the EU target of renewables in the energy mix to 40% by 2030 and new targets at the national level, such as:
- −
- A new reference level of 49% renewable energy use by 2030 in buildings;
- −
- A new benchmark of a 1.1 percentage point annual increase in the use of energy from renewable sources in the industry;
- −
- A binding annual increase of 1.1 percentage points for the Member States in the use of renewable energy sources for heating and cooling.
According to the assumptions included in the draft directive, fuel suppliers will be obliged to supply renewable fuels and renewable electricity in an amount that will make it possible to achieve a reduction in greenhouse gas emissions of at least 13% by 2030. Moreover, as set out in the proposed directive, the share of advanced biofuels and biogas produced from the feedstocks listed in Part A of Annex IX of RED II in energy supplied to the transport sector must be at least 0.2% in 2022, 0.5% in 2025 and 2.2% in 2030. Responsibility for achieving these targets is assigned to fuel suppliers in each Member State. As highlighted in the BP report [67] referring to the proposed changes, introducing flexibility in this respect will allow individual Member States to choose the most efficient solutions. Regulation may also provide an opportunity to stimulate the further use of advanced biomethane in the transportation sector [67]. The most important changes in the RED II Directive are presented in Table 3.
Just a few months after the publication of Fit for 55, the EU authorities have already presented another legislative initiative—crucial for the biomethane market development. On December 2021, the European Commission announced a new package of proposals amending the UE Gas Directive (2009/73/EC)—remaining in legal force since 2009 [70]. The announced revision, known as Decarbonization Package, includes a set of measures to replace natural gas in the energy mix of EU countries with renewable and low-carbon gases—hydrogen and biomethane [71].
To date, these natural gas alternatives are affected by several regulatory barriers, such as non-inclusion in network security regulations and unfavorable legal settings within cross-border trade and infrastructure development [72]. Against this background, the European Commission has introduced a revision of two European Union legal acts:
- −
- Proposal for a Directive of the European Parliament and of the Council on common rules for the internal markets in renewable and natural gases and in hydrogen COM(2021) 803 final [70];
- −
- Proposal for a Regulation of the European Parliament and of the Council on the internal markets for renewable and natural gases and for hydrogen (recast), COM(2021) 804 final [73].
According to the framework concept presented, biomethane will be included in the definition of both natural gas (Article 2(1)) and renewable gas (Article 2(2)). Such a solution would standardize the status of biomethane as an energy carrier with the same specific properties as fossil natural gas. Following the idea of unifying the status of gases injected into the grid, the European Commission proposes obliging the Member States to allow renewable and low-carbon gases access to the market and infrastructure—regardless of the type of producer’s installation connection (distribution, transmission grid). Moreover, according to Article 37(2) of the revision of the Directive, distribution system operators will not be entitled to reject economically and technically justified requests for the connection of a new production installation of renewable and low-carbon gases.
3.3. RE Power EU Action Plan—Biomethane Role in the Context of the 2022 Energy Crisis
Escalation of the Russian–Ukrainian crisis resulting in intensified military action in Ukraine after 24 February 2022, has significantly affected the European energy market. (biggest energy crisis in Europe since 1973 [74]). Current difficult geopolitical urged the authorities of European countries to redefine their current energy policies. The impact of the conflict escalation has been particularly acute for EU member states, heavily dependent on Russian supplies of natural gas, petroleum products, and solid fossil fuels [75,76], with 43.29 and 54% of the share in EU’s energy carriers import, respectively [77]. The scale of the European economies’ dependence on Russian energy resources is shown in Figure 2.
In response to the energy crisis, the EU published the REPower EU Action Plan in May 2022 [78], envisaging measures to diversify the EU’s supply of fossil fuels and petroleum products and reduce demand for them. Due to its thin market, dependency on Russian natural gas reduction is seen as one of the biggest challenges for EU countries. The communication states that reinforcing the “Fit for 55” package efforts (resulting in a 30% reduction in natural gas demand and diversifying supply) could result in a decrease of 155 billion cubic meters (bcm) (equivalent to 1514.3 TWh) of gas demand from Russia by 2030.
The European Commission highlighted the key role of renewable energy sources in this process, particularly mentioning biomethane—the renewable natural gas equivalent. One of the objectives set in the package is to increase biomethane consumption in member states from 17 to 35 bcm (166.1–341.9 TWh) per year. The target could be possible to reach due to the Biomethane Action Plan, which assumes supporting the development of the Member States’ biomethane markets with an additional 35 billion EUR [79]. Despite financial support, the plan’s objectives include more accessible access to modern technology and increased availability of financing. An essential element is also the assumption that a separate collection of organic waste will be required by 2024, which allows for increasing sustainable (waste-based) biomethane production. A further step towards achieving the biomethane target was the establishment of a Biomethane Industry Partnership that brings government, science, and industry representatives together to provide substantive support to the UE’s authorities (Figure 3).
4. Biomethane Market in EU—Current Situation and Development Potential
4.1. Current Situation
The European Union is currently the largest producer of biomethane in the world and has significant potential for further development [25,80]. The first biomethane plant in Europe was probably established in the UK in 2009 [81]. Since then, the number of biomethane plants has increased significantly, and in 2020, almost 900 installations were producing 3.3 bcm biomethane (32 TWh). However, the 32 TWh of biomethane produced in the EU in 2020 accounted for only 17% of the total biogas production of 191 TWh [82,83]. Figure 4 shows the rate of development of biomethane production in the EU since 2011. It can be stated that the number of biomethane plants in the analyzed period increased nearly five-fold, while the production of biomethane increased six-fold. In 2020, biomethane production was at 32 TWh, while in 2011, it was less than 5 TWh [82]. The latest EBA data [82] also indicate that, in 2021, there was a significant increase in the number of biogas plants—in August 2021, it was at the level of 992 facilities.
The largest producer of biomethane in Europe is Germany, where 11 TWh (1.13 bcm) of biomethane was produced in 2020 in 242 biomethane plants (out of 32 TWh—3.28 bcm in the entire EU). The largest number of biomethane plants was located in France and amounted to 306 facilities, although at the same time, France in 2020 produced only 2 TWh of biogas, which indicates different directions of development (small plants dominate in France) [55]. It is also worth noting that the total share of Germany and France in the number of biogas plants in the EU in 2020 reached almost 55%. Regarding the amount of biomethane produced, the second place after Germany was Denmark, which produces over 4 TWh (0.41 bcm) of biomethane and has 52 plants at its disposal. Significant European producers of biomethane, apart from the countries mentioned above, also include the Netherlands and Italy, with production similar to France (i.e., about 2 TWh). Slightly less biomethane was produced in 2020 in Sweden, where 71 biomethane plants were located. The total share of these countries was ~ 73% of the total biomethane production in the EU (2020) and 77% in the total number of biomethane plants (August 2021) [55,82] (Figure 5).
The development of methane production in recent years has been accompanied by remarkable progress in the reliability and efficiency of upgrading technologies [5]. The current dominant upgrading technology of biomethane is membrane separation, covering 35% of biomethane plants [55]. The second and third places are held by water scrubbing (22%) and chemical scrubbing (18%). Other biomethane plants use pressure swing adsorption, mental scrubbing, or cryogenic separation. However, in terms of the technologies used, a change in the trend can be observed. In the early years of the industry’s development (until 2012), chemical scrubbing technology dominated, while in recent years, newly launched installations have been based on membrane separation technology [6]. However, there are significant differences between countries in terms of the current mix of technologies used; for example, membrane separation plays a relatively minor role in Germany. At the same time, it dominates in France, the Netherlands, and Italy. In turn, Swedish installations are based on water scrubbing [6]. The structure of treatment methods used on average in the entire EU and in the main producer countries is shown in Figure 6.
Biomethane production is based on various categories of organic waste, including first-generation substrates such as agricultural residues, intermediate energy crops (cultivated between two main crops), bio waste, industrial waste from the agroindustry sector, livestock manure, and green waste; second-generation substrates include forest residues, forest wood, and pruning [56,69]. Until 2016, the structure of biomethane plants was dominated by units for which energy crops were the primary feedstock. The production model dominant in Germany, which is also the biggest producer of biomethane and biogas in the EU, had the most significant impact. Changes in this area should be associated with the RED II Directive, according to which biomass for sustainable biogas production should not create competition for agricultural land—considered as devoted to food and feed production. The growing awareness of sustainable biomethane already reduces the availability and dimension of public support for unsustainable biomethane plants [84]. For most biomethane plants installed since 2018, the basic substrate is agricultural residues, manure, and plant residues [6]. On the other hand, the share of new installations using energy crops as the primary substrate decreased dramatically. Changes in this respect are presented in Figure 7.
4.2. Potential for the Development of Biomethane Production
Biomass availability can be considered the crucial factor determining the production potential of biogas and biomethane. Based on estimated assumptions regarding the future level of available biomass, several analytical institutions have recently analyzed the potential of biomethane production between 2030 and 2050. Information on the total biomethane production potential according to various sources is provided in Table 4. The quoted estimates refer to the total methane potential of anaerobic digestion and gasification. According to the ENGIE report [69], the total biomethane production potential based on the indicated feedstock categories in the EU countries can be estimated in 2050 for nearly 1.5 thousand TWh (153 bcm). Slightly lower levels of production potential are indicated by other studies, although in most of the available sources, the biomethane production potential in total exceeds 1000 TWh in the perspective of 2050. According to the IEA [6], this potential can be estimated at 1.3 thousand TWh (from the standpoint of 2040, technical potential). Other results have been obtained through the studies conducted by Gas for Climate [25] (1.039 thousand. TWh), Eurogas (1.08 thou. TWh [85]), and Center on Regulation in Europe [86] (1.3 thousand TWh, but without specifying a specific moment in time). Despite notable differences between individual analyses, it can be stated that in most cases, the biomethane production potential for 2030 is in the range of about 350 to 460 TWh (35.8 to 47.1 bcm). Moreover, in 2050′s forecasts, the production level is expected to be about 1000 to 1500 TWh (102.4 to 153.5 bcm) 2050. Regardless of the observed, it can be stated that the predicted biogas production in the perspective of the indicated dates is to be many times higher than currently. In 2030, production can be expected to be more than ten times higher than in 2020 (32 TWh, 3.28 bcm). The observed differences in the assessment of the production potential result primarily from the adopted assumptions regarding the available biomass (e.g., the issue of taking into account sequential crops is important (in the GfC analysis [25], the share is almost half in the anaerobic digestion potential, while in the ICCT analysis, this type of substrate was not taken into account). The assumptions made regarding advancements in gasification technology [11] also notably impacted the studies’ results differences.
Some of the projections mentioned above also assess the biomethane production potential at the level of individual EU countries. Figure 8 shows the potential of biomethane production and its structure for 2050 in the EU (+UK) countries according to the study “Gas for Climate” [25] and ENGIE [69]. According to these analyses, in 2050, the largest biomethane producers will be Germany and France, whose total share in the supply is around 25–30%. The importance of countries such as Spain and Poland will increase significantly, becoming the third and fourth producers of biomethane in the EU, respectively, in both analyses mentioned above. Significant development potential is also seen in countries such as Italy, Romania, and Sweden, but in the latter case, this potential lies mainly in thermal gasification.
In relative terms, the importance of Denmark, which already uses a much larger part of its production capacity than other countries, will decrease. The share of countries such as Germany, France, Spain, Poland, and Italy exceeds 50% of the production potential in 2050. It can be seen that the production potential results primarily from the area of individual countries—the largest future producers are countries with the largest size (which is a source of biomass) (Figure 9).
According to ENGIE analyses [69], the most important source of bio-mass production potential in the EU and UK should be seen in the perspective of 2050 in forest wood and residues (almost 500 TWh, 51.6 bcm), intermediate crops (nearly 390 TWh, 39.9 bcm), agricultural residues (about 200 TWh, 20.5 bcm), manure (over 180 TWh, 18.42 bcm), and green waste (165 TWh, 16.9 bcm) [69] (Figure 10). It should be emphasized that the presented estimates do not include energy crops because, according to the RED II Directive, biomass for sustainable biogas production should not create competition for agricultural land devoted to food and feed production. In 2010–2015, nearly half of the newly installed biomethane plants were based on Energy crops [82].
4.3. Potential Demand for the Biomethane
4.3.1. Demand for Biomethane—Applications and Market Conditions
The demand for biomethane is derived from the possibility of its use for various applications. In the most straightforward view, one can imagine that biomethane is used to replace methane (natural gas). About 60% of natural gas is used directly in final energy consumption without prior transformation. The rest is transforming mainly into electricity and heat generation (about 4% flows into non-energy sectors) [61]. Although biomethane (as opposed to biogas) can be directly injected into the gas network, entirely replacing methane with biomethane is impossible—the structure of using this gas is different from that of methane. First, it should be emphasized that only a dozen biogas produced in the EU are treated to biomethane. Currently, most biogas is used close to production on-site for heating, electricity generation, or CHP. Biomethane injections into the gas grid are less popular due to higher production costs, gas quality, and technical constraints connected with access to the gas grid [71].
In 2019, biogas and biomethane production made it possible to meet only 3.8% of the EU’s gas demand. In 2030, the European Commission expects a doubling of biogas production. As we advance to 2050 projections, EC claimed that a four-fold increase in biomethane production level could make it possible to cover 25% of the EU countries’ gas demand while assuming efficiency improvement [71]. According to another source, biogas and biomethane production can cover approximately 4.6% of the EU’s gas demand in 2020. It is assumed that in 2030 it will be 11%, and in 2050 even between 30 and 40% [82].
Even today, a significant share of the gas demand could be covered by biomethane in some countries, with the assumption of purifying all the biogas produced. In Sweden, it would be 19%; in Denmark, 18%; in Germany, 9%; in Czechia, 9%; in Finland, 5%; in the UK, 3%; in Slovakia, 3%; in Spain, 2%; in France, 2% [82]. According to GfC analyses [11], the demand for biomethane in the EU will largely depend on the scenario of the implemented climate policy and biomethane support policy—in the case of implementing the policy assumptions from 2018, the demand for 2040 can be expected at the level of 140 TWh (14.33 bcm of biomethane per year), while in the case of “sustainable development scenario designed to achieve energy-related sustainability goals”, the estimated biomethane demand is 418 TWh (42.8 bcm) in 2040.
Biomethane can be used in either the transportation, heating, or electricity sectors—while there are also non-energy applications in the chemical industry [26]. The method of using the biomethane produced differs significantly between different countries, which can be associated with the implemented policy of supporting the biogas sector. It is worth noting that the interest in biomethane in hard-to-electrify industries is growing because replacing natural gas with biomethane does not generate carbon costs under EU ETS [11]. Furthermore, biomethane can replace methane in fertilizers or methanol production in the chemical industry. An interesting use in that area is also subjecting biomethane to steam reforming to obtain biohydrogen. In the steel industry, biomethane can replace fossil fuels in processes that cannot be electrified, and in the food processing sector, it can be used as a substitute for natural gas [10]. All of these uses allow entrepreneurs to decarbonize their heat and electricity use.
Additionally, growing interest is observed in biogenic CO2 (climate-friendly) obtained during biogas upgrading to biomethane. This solution can happen due to CCU technology (carbon capture and utilization); therefore, CO2 received from biomethane is an alternative to fossil-fuel-produced industrial use CO2. Moreover, the CO2 generated during the combustion of biogas or biomethane can be captured and further recycled. In the transport sector, biomethane is being used in compressed form bio CNG (mainly passenger vehicles) and liquefied bioLNG (heavy road and maritime transport) [25].
4.3.2. Biomethane Demand Potential—Findings of Current Studies
According to the DNV GL report [85], the future demand structure for biomethane may vary significantly depending on external conditions (e.g., CO2 price), which are described in two scenarios. Regardless of the scenario, a significant increase in demand for biomethane used for hydrogen production is expected in 2050, reaching up to 25% of the total biomethane production (with only a few percent in 2030). According to the cited source, the share of demand for biomethane used for energy production will also be at a similar level in 2050. Compared to 2030, the need for biomethane used in the building sector will decrease. Less clear-cut predictions concern changes in the relative level of demand for biomethane for manufacturing and non-energy use and in the section “other and energy own use” (Figure 11). Relatively little importance in the cited study is attributed to the demand for biomethane by the transport sector, although EBA [82] emphasizes that some countries plan to direct most of the biomethane production to be used for transportation-related applications (Estonia, 100%; Sweden, 83%, Finland, 100%, France, 34%, Italy, 100%, The Netherlands, 19%). In total, there are 4056 CNG and 441 LNG filling stations in service in the EU, of which it is estimated that 1500 provide Bio-CNG and 100 Bio-LNG (most in Italy and Germany) [82]. According to GfC [56], in 2050, half of biomethane can be used by the transport sector, ¼ by the energy sector, 16% by the buildings sector, and 6% by the industry sector (Figure 11). However, GfC analysis does not include the use of biomethane in hydrogen production.
When considering the demand for biomethane in the EU, it is worth noting that one of the factors that will determine the demand for biomethane in the coming years is the plans to diversify UE gas supply sources. By the end of 2022, the reduction in natural gas supplies from Russia is to amount to 99 bcm (967.2 TWh), half of which was planned to be replaced with LNG gas, and approximately 10% with gas from other suppliers (20% solar and wind energy, around 14% improved efficiency, and around 3.5% biomethane) [89]. In the perspective of 2030, the importance of biomethane in replacing gas from Russia is to increase significantly (by another 14 bcm, 136.8 TWh) [89].
In discussing the expected directions of biomethane development, it is also worth paying attention to the possibilities of international trade. Two basic solutions are possible in this regard—transport between countries using high-pressure pipelines or transport in liquefied form through shipping [83]. Thus far, biomethane trade between EU countries is small; in 2020, it was only about 3 TWh, which corresponded to 0.06% of natural gas consumption in the EU [83].
5. Economics of Biomethane Production
The variety and diversity of biomethane production technologies and pathways result in extensive economic performance data obtained during a literature review. Due to the above, the overview of research results was divided into two segments, focusing mainly on biogas production (anaerobic digestion) and upgrading technologies. Another factor causing the difficulty of biomethane cost comparison is the adopted scope of analysis (whether to include or not final gas management costs—i.e., related to liquifying or compressing). In order to ensure at least partial comparability of the current research results, biomethane utilization costs were not considered. Based on the literature review, the two most important biomethane production costs are (1) primary gas production costs (syngas or biogas) and (2) costs of upgrading and further processing for final use. An important parameter that determines the profitability of the entire business is also the revenue resulting from the price of the final product and the intensity of financial support. Both at the stage of biogas production and biogas processing, two basic categories of costs can be distinguished, i.e., CAPEX and OPEX. CAPEX includes capital expenditures, while OPEX refers to operating expenses. A detailed list of potential costs that make up the CAPEX and OPEX categories is shown in Table 5.
Despite the methodological differences observed, most studies [55,56,88,91] estimated the raw biomethane unit production as a sum of OPEX and CAPEX-based annual capital costs divided by the estimated production volume (the investment lifetime was generally set at 15 years, while the cost of capital ranged from 5 to 10%). Estimating the biomethane processing costs generally proceeds similarly [13]. Capital and operational costs are calculated in relation to the assumed production (expressed in volume or energy units, depending on the particular study). However, research results are difficult to compare due to the distribution of grid connection costs and gas quality requirements, which differ in each member state (refers to the gas network injection scenario). Similar to other mentioned parameters, several economic and political factors determine the unit revenue for the biomethane producer. Besides market-specific conditions, the form of the end product (electricity, grid gas, bio LNG, bio CNG) and the intensity of operational support are often identified as crucial determinants of producers’ revenue [10,56]. The biomethane plant can also generate income from other sources depending on the technological and business model adopted. The most common examples are the sale of digestate as fertilizer [92] or the disposal fee of certain waste materials [93].
5.1. Biogas Production
Under industrial conditions, biogas is produced in a specifically designed technological installation—an AD (anaerobic digestion) plant. The biogas production system comprises highly comprehensive facilities, including buildings, digesters, large-scale machinery, and advanced equipment [29]. These components’ functional activities are integrated in time into a single production scheme system using automation and management programs [94]. Although several studies consider the anaerobic digestion production process a mature technology [95], certain divergences (i.e., the number, size, and type of digestion tanks; different process parameters, etc.) affect the range of feedstock possible to use (often appointed as crucial for cost efficiency level) [96,97,98]. According to analyzed studies [56,91,99,100,101,102], the capital cost of the biogas production phase is relatively high for small-scale plants, which indicates the impact of scale effects (Table 6). Bortoluzzi [100] assumed that a capacity increase from about 200 kW to 999 kW results in a CAPEX decrease of 5000 EUR/kW. In this regard, a comprehensive study of 40 Austrian agricultural biogas plants was conducted as a part of the BIOSURF project [101]. Based on the data obtained, the authors of the report developed an equation providing an approximation of the biomethane production economics of scale:
where P is the price of biomethane (EUR/m3), and x is the biomethane production capacity (m3/h).
P [€ m−3] = 39,180 ∗ x −0.244,
This relationship is graphically depicted in Figure 12.
In simplified terms, the production process of a biogas plant consists of the following steps [104,105]: (1) feedstock delivery and storage; (2) substrate insertion to the digester; (3) biogas production and storage; and (4) digestate management. As some costs cannot be precisely related to the phase in which its incurred, in most considered studies, authors classified them similarly to as presented below:
- Feedstock (In several papers, feedstock cost was excluded from OPEX its total distribution cost was presented) and transportation;
- Digestate managing;
- Heat and electricity;
- Labor;
- Maintenance and overhead (M&O);
- Insurance.
According to the literature review, feedstock, energy, and digestate management costs were the most significant [56,91]. The level of operational expenditures is often related to the type of feedstock used due to the wide possible range of prices. Some authors even exclude feedstock cost from the OPEX category, considering it a separate position [56,101]. According to IEA [5], the price of feedstock ranges from 0 (agricultural waste, manure) to 102 USD/t DM (energy crops).
However, despite high prices, energy crops are still the base feedstock for biogas (and biomethane) production in certain countries. In particular, it refers to the German biogas and biomethane production model, for which the use of co-digestion of maize silage and slurry is the principle basis [20]. On the other hand, Italy and Denmark’s dominant production model is based on the utilization of animal manure, waste from crop production, and the agri-food industry [86]. Costs included in the O&M compound are also related to feedstock type and scale—2 to 7%/annual CAPEX cost referring to the IEA Report [5].
5.2. Biogas Upgrading
The full costs of biomethane production include the costs of biogas production (as discussed above) plus the costs required for upgrading. Although progress has been made in the field of biogas upgrading in recent years, the economic feasibility of this process remains ambiguous, and the known analyses mainly concern chemical-based upgrading methods [106]. Upgrading costs include the treatment unit investment costs (CAPEX) and operating costs (OPEX). The range of unit costs of biogas upgrading (EUR/MWh) is determined by the treatment technology and installation size (IEA 2020). As the IEA [5] reported, the unit cost of biogas upgrading range is approximately 5–12 EUR/MWh. Like previous segments, economies of scale impact unit CAPEX cost reduction was observed, estimated by Mazzega and Mathieu [9] as 1–2 EUR/m3 of raw biogas (equivalent to 0.16–0.33 EUR/MWh). In general, solutions based on CO2 removal are much cheaper per kWh than upgrading the raw biogas by reacting CO2 with H2, which results from the high costs of obtaining hydrogen and investment costs related to the construction of a methanation plant [32]. In the short term, the cost of upgrading by simply removing CO2 remains clearly lower than binding CO2 to H2 and producing additional CH4. However, this may change in the future (assuming a decrease in hydrogen costs). Presented by Angelidaki et al. [32] (quoted after [107]), estimates of investment costs for physicochemical methods of biogas upgrading indicate that these costs may range from approximately EUR 6000/(Nm3/h) at installations with a capacity of about several dozen Nm3/h to about EUR 2000/(Nm3/h) for plants with a capacity of >1000 Nm3/h. A similar range is indicated by the table prepared by [108], with the most considerable differences in CAPEX per unit of flow shown for the water scrubbing technology, which results from the fact that it was used in both small and large installations. In the cited study [108], an additional comparison of the traditional amine scrubbing method with biological methanation was made by analyzing three variants of solutions, i.e., Scenario 1: “biogas production + amine scrubbing”; scenario 2: “biogas production+amine scrubbing + ex-situ biological methanation”; and scenario 3: “biogas production + ex-situ biological methanation”. A comparison of the CAPEX values showed that the lowest investment costs per flow unit (m3/h) occurred in the case of “amine scrubbing” (less than 2000 EUR/(Nm3/h); in the case of “biological methanation,” it was almost EUR 4000/(Nm3/h), and in the case of “Amine+Biological Methanation”, it was almost EUR 5000/(Nm3/h). However, these relations are quite different if the CAPEX value refers to the total annual methane production—due to the additional amount of methane obtained by methanation, the total investment costs per unit of the product turned out to be the lowest in the case of the “ex-situ biological methanation” scenario, and highest in the case of “amine scrubbing”. The analysis of Lawson et al. leads to similar conclusions [106], which shows that the inclusion of CH4 produced from methanation results in a significant reduction in unit costs (in the quoted analysis from 0.48 to 0.32 EUR/(Nm3 CH4/year).
These results indicate that an unequivocal assessment of the treatment economics is complex. The final conclusions depend not only on the scale of the plant and the method but also on the adopted assessment criterion—whether the comparison of costs applies to a unit of installed power (capacity) or units of the final product. According to Paturska et al. [109], the relationship between the specific investment cost (EUR/(m3/h)) and biogas input flowrate (m3/h) for the most commonly used treatment technologies can be described using the regression function achieving a very high fit of the model (Table 7).
In addition to the investment costs, the biogas treatment process involves operational costs that vary depending on the scale of production and technology. The main operating costs associated with biogas upgrading include water consumption (important for methods such as “water scrubbing” and “amine scrubbing”), electricity consumption (important for “water scrubbing”, “physical scrubbing”, and “pressure swing adsorption”; less important in “amine scrubbing”), and thermal energy consumption (important in “amine scrubbing”) [109,110]. Different technological solutions and the scale of the installation make the level of OPEX for biogas upgrading referred to in the literature very diverse, and it is difficult to precisely determine the ranges of operating costs with the current (small) level of experience. The data provided by the authors of the “BIOSURF” project [101] show that OPEX for upgrading units in France ranges from 1.2 to 4.4 EUR/kWh for installations of 136 Nm3 CH4/h and 37 Nm3 CH4/h, respectively, while in the UK it was 0.4 EURc/kWh for installation with a capacity of 500 Nm3 CH4/h. In the same study [97], there are data on installations of 500 Nm3 CH4/h, where operating costs range from 1 to 1.3 EURc/kWh. However, methanation costs are much higher—for example, the analyses of EA Energyanalyse and SDU [111] cited by [32] show that the cost of H2 alone is at the level of 9 EURc/kWh (and there are also the costs of the methanation plant constituting an additional 15–20%), while the total production cost of upgraded biogas by CO2 removal indicated in the same study was estimated as 7 EURc/kWh. The list of basic cost categories of upgrading for selected technologies is presented in Table 8.
Comparing the costs of biogas upgrading with other segments leads to the conclusion that, in most cases, they account for between 20 and 40% of the total biomethane production costs [97,105]. However, in the case of biological methanation, their share may reach even 70% of the production costs [106], but it should be taken into account that CH4 produced from methanation drops by 34%.
According to the IEA [10], biogas upgrading costs account for 10 to 20% of the total biomethane production costs. Based on an analysis of various studies, Angelidaki et al. [32] found that the upgrading methods with higher costs include “chemical absorption”, “cryogenic”, and “membrane separation”, while moderate cost methods include “water scrubbing”, “physical scrubbing”, “Sabatier process”, and “pressure swing adsorption”.
5.3. Total Costs of Biomethane Production
The data on the total costs of biomethane production are varied due to all the factors mentioned so far (type and method of obtaining the substrate for biogas production, the scale of production, the treatment technology, the location, or the lifetime of the installation assumed in the calculation). The latest report of the European Biogas Association [112] indicates that the current costs of biomethane production in Europe are average of EUR 80/MWh, of which 20% are feedstocks, 40% are CAPEX, and 40% are OPEX.
Similarly, according to an analysis [56], the total costs of biomethane production (anaerobic digestion), including feedstock costs, can be estimated at around EUR 70–90/MWh, with the upper level for smaller plants and the lower level for larger plants (at the same time, the type of feedstock is of fundamental importance here). According to the cited source, these costs in the perspective of 2050 may decrease by approx. EUR 20/MWh to the level of EUR 57/MWh (approx. half of capital costs). Similarly, the EBA report [112] indicates that over the next 30 years, biomethane production costs should be expected to decrease to about EUR 57–66/MWh. It is expected due to an increase in the production scale, reduction in upgrading costs (biogas upgrading units can be fed with biogas from different digesters, reducing the up-grading costs), reduction in feedstock costs, improvements in pre-treatment technologies increasing the efficiency of anaerobic digestion and valorizing the biogenic CO2 obtained during biogas upgrading [113]. By comparing the mentioned costs with the current prices of natural gas, which in November 2022 were at the level of EUR 120/MWh, the profitability of biomethane production can be indicated. The estimated level of biomethane production costs in relation to natural gas prices is shown in Figure 13.
It should be emphasized that in addition to the production of biomethane, apart from the costs of biogas production and upgrading, it is also associated with the costs of transferring biomethane to the grid (or other management). According to [56], about 5% of the total costs may be the costs of the connection to the network. In absolute terms, these costs may be around EUR 3–4/MWh. The costs of liquefaction are estimated at around EUR 12/MWh.
5.4. Biomethane Production by Gasification
At the current stage of development, the cost level for biomass gasification is significantly higher than for anaerobic digestion [5,56]. Thermal gasification is still a poorly developed technology, facing several challenges, the overcoming of which can substantially reduce costs. According to Terlouw et al. [56], by 2050, thermal gasification costs can be expected to be reduced by 50% compared to 2019. Developing this technology may lead to the construction of many thermal gasification installations (dissemination of the solution), which will enable the reduction in costs incurred by technology suppliers, scaling up plants (benefits of economies of scale), improvement of efficiency resulting from the advance of syngas cleaning methods, more robust methanation catalysts, and higher pressure gasification [56]. According to the analyses mentioned above, the total costs (LCOE) of biomethane production through gasification in 2019 could be estimated at an average of EUR 88/MWh (including capital costs of approximately 41%, O&M of about 39%, and feedstock of approximately 20%). In the perspective of 2050, a decrease to EUR 47/MWh is assumed (the share of capital costs will also decrease to 28%, feedstock costs will decrease to 32%, and the importance of O&M costs will increase).
6. Biomethane Production Support Systems
6.1. Current EU Policy
The production of biomethane in the current market conditions is not competitive due to the relatively low prices and availability of natural gas. However, the need to reduce CO2 emissions and, in the long term, the decarbonization of the economy provides grounds for supporting biomethane production [5].
European Union Member States are legally entitled to implement support schemes for renewable energy producers to achieve EU climate and energy policy goals. The legal basis for establishing such mechanisms is the provisions of Article 107(2) and (3) of the Treaty on the Functioning of the European [110], allowing state interference in the EU internal market under certain circumstances. Detailed rules for public support have been contained in the European Commission Communication “Guidelines on State aid for Climate, Environmental Protection and Energy” [114] (in force since 1 January 2022).
However, the detailed way in which aid for support of biogas or biomethane is injected into the grid, used for transport, and aid for electricity generation is not precisely defined in the guidelines. Hence, Member States may apply different support mechanisms, framing the value of the aid they receive within the limits of the abovementioned provisions.
Despite the ongoing legal force of the acts mentioned above, as of 9 November 2022, the European Commission temporarily facilitated the implementation of support schemes [115]. However, in terms of support for biomethane production, supported installations still have to meet the sustainability criteria set out in the EU Renewable Energy Directive.
6.2. The General Framework of Biomethane Support Schemes
In the most basic terms, support schemes for biomethane production can be divided into investment and operational support [5], as presented in Figure 14.
The most common support mechanisms used for this purpose are as follows:
Feed in Tarif—Based on specific remuneration per unit of renewable energy. The usual advantages of feed-in tariffs are long-term contracts, a guarantee of access to the grid, and prices based on production costs [116,117].
Feed-in Premium—A bonus paid over the specific market price per unit of renewable energy. The base for calculating the rate might be the estimation of avoided externalities or differences in cost production for a given technology [116,118].
Quota/green certificates—Green energy is sold to the grid at the market price, while the producer receives supplementary revenue from selling a given amount of green certificates on the market [116,117].
Fiscal incentives—Usually used as an additional support system in the form of tax exemptions (e.g., carbon tax) or tax reductions. Producers of green energy receive compensation for the market’s lower competitiveness and incentive for green energy market development. The impact is dependent on the tax rate [118].
Investment support—A fixed amount received due to investment in building the plant, which meets the criteria of the support scheme. The subsidy amount is not directly dependent on the quantities of renewable energy produced within the plant’s lifetime [26].
Support schemes can also be related to the production process stage, which is related to [84]:
- −
- Feedstock obtaining—support for the use of specific substrates (premies for manure utilization);
- −
- The production process itself (investment support, feed-in tariff for gas);
- −
- Biomethane final use—quota systems in particular sectors, bonuses for gas use in the transport sector.
Support schemes differ in terms of the resulting financial compensation:
- −
- One-off (usually investment support);
- −
- Operating subsidy for certain years.
Finally, schemes could be divided into supply-side and demand-side instruments (Figure 15).
6.3. Support Schemes in Selected EU Countries
6.3.1. Italy
The Italian support system for energy production from biomethane, approved by the decision of the European Commission of 1 March 2018 [119], provides for granting aid only for the production of biomethane used in transport. The program introduces two support options. The National Energy Agency is responsible for managing the support system. The support system is based on the allocation of certificates of release for use (Certificati di Immissione in Consumo di biocarburanti “CIC”). CIC is awarded to biomethane plants, which then sell these certificates to producers of fuels used in transport.
Producers of biomethane injected into the natural gas network for use in the transport sector may choose to sell the biomethane produced to GSE, the company responsible for managing the scheme, at the market price of gas (equal to the monthly weighted average price of natural gas on the market), less than 5%. The producer will also receive a bonus corresponding to the CIC value, reflecting the calorific value of the purchased biomethane. Under this mechanism, the value of one CIC is fixed at EUR 375. One CIC will be issued per 5 GCal of biomethane. Alternatively, biomethane producers can opt to trade biomethane directly without GSE intervention, only earning a premium of EUR 375/CIC [9].
6.3.2. Denmark
Two decisions of the European Commission have approved Danish biogas support programs, the first [117] in 2013 [116] and the second in 2015 [120]. The Danish Energy Agency is responsible for granting the support. At the end of 2020, biogas accounted for around 21% of gas consumption [121].
The owner of a biomethane plant supplying biomethane to the natural gas network may obtain aid for the production of biomethane, which consists of three parts:
- −
- Price surcharge 1: Annually indexed surcharge;
- −
- Price surcharge 2: Adjusted for natural gas price;
- −
- Price surcharge 3: Reduced annually by 2 DKK/GJ from 1 January 2016.
The future support system will be based on the same price for each cubic meter of biomethane injected into the gas network. Currently, it is the difference between the cost of biomethane production and the market price of natural gas (thus, the exact scope of support may change up to a year, depending on the market price). The biomethane producer sells the biomethane at the price of natural gas and then receives the difference between the production costs and the market price of natural gas (there is currently no market price for biomethane in Denmark). The biomethane producer receives support [9].
6.3.3. Germany
German support programs do not include either a tariff for biomethane at the entrance to the gas network or direct financing of biomethane production itself. Instead, several indirect support schemes or commitments focus on increasing the share of renewable energy (including biomethane) in electricity generation, heating, and mobility. The most important support schemes include producing energy from biomethane in cogeneration units, biomethane as fuel for natural gas vehicles, and heating and cooling of buildings. Since 2017, the support system has been changed—the transition from “feed-in tariffs” (FiT) to the auction model (pay-as-bid). In this support model, all entities interested in installing a biogas plant or extending their operational support must apply to the auction. The auction is won by each consecutive auction bidder who has offered the lowest price until the bid size is reached. In the case of bids for the same amount, the system with the lower capacity was re-bided. With this initiative, an 8-year period has begun to eliminate government support for biogas. Such measures are intended to introduce an element of competition between different generation technologies.
Biogas production in Germany increased significantly between 2011 and 2017, reaching more than 81 TWh in 2017. After switching from the German FiT to the bidding system, biogas production started to decline, falling to 71 TWh by 2020.
Specific growth targets for different technologies have been introduced, which is a novelty in the German support system. REA 2017 aims for an annual increase in gross capacity of 150 MW from 2017 to 2019 and 200 MW from 2020 to 2022 [122].
6.3.4. France
The biomethane producer has a guaranteed price for 15 years (the feed-in-tariff support system has been in force since 2011); the amount of support depends on the size of the installation and the raw material (less for landfill waste) and compensates wastewater treatment and municipal waste services with bonuses.
GRDF (gas network operator in France) has been keeping a register of guarantees of origin since 2012, due to which a “green offer” can be presented to customers by the supplier [123].
6.3.5. Sweden
The Swedish support system for biogas used in transport is based on the exemption from excise duty [124]. This tax, concerning energy as the subject of taxation, consists of energy and climate tax. Biomethane used for transport purposes is fully exempt from both parts of the tax to compensate for its higher production costs in relation to the price of natural gas. The current scheme is the development of earlier support systems for biofuels.
7. Conclusions
The escalating energy crisis has recently intensified efforts to search for alternative energy sources in EU countries. A special part of this process is attributed to biomethane, which began to be perceived as a viable option to replace natural gas imports. The role of biomethane has also increased significantly in the context of the intense Russia–Ukraine crisis outbreak for European economies. As a result of this situation, the European Commission revised its earlier plans for developing biomethane production to diversify energy sources more quickly and become independent of imports of fossil fuels.
The review of available studies on biomethane showed that this market developed very poorly until now. However, both supply and demand have a high growth potential, and the existing technological possibilities enable biomethane production in an economically justified way. Thus, one can expect a significant acceleration in the development of this sector. In 2019, biomethane covered less than 4% of the EU’s demand for natural gas. The Biomethane Action Plan assumes doubling biomethane consumption in the EU Member States by 2030 (from 17 to 35 bcm). The expected increase in biomethane use is determined by the need to increase energy security and environmental and economic considerations. It is connected with the fact that traditional biogas combustion in a cogeneration unit (CHP) and electricity generation is a low-efficiency process determined by the internal combustion engine’s efficiency (about 40%). Treatment of the produced biogas in the form of biomethane allows for its long-term storage (e.g., in the gas network) and more effective management. It is expected that up to 2030, biomethane supply will be mainly based on the anaerobic digestion of waste and residual biomass from agri-business and municipal waste. After 2030, other pathways, such as the gasification of forestry residues, will help to increase further the potential to achieve over 1000 TWh per year by 2050, which would be a significant share of the future gas mix [87,125].
To date, mainly physicochemical methods have been used for treatment, the costs of which are relatively low (and usually account for about 20–40% of the total cost of biomethane production). Methods based on methanation are much more expensive, consisting of binding CO2 present in biogas with hydrogen, increasing methane production, and preventing CO2 emissions. In the long-term perspective, the legitimacy of such an upgrading method will be determined by the costs of obtaining hydrogen (it can be expected that in the long-term, they will decrease, which will increase the attractiveness of methanation as a method of biogas treatment).
In addition to the costs of upgrading, the key factors determining the economic viability of biogas production include the costs of biogas production itself, among which the costs of obtaining the raw material (which can be very different depending on the origin of the raw material) are of key importance. Investment costs are also very important from an economic point of view. The investment costs of both the biogas production section and the treatment section depend on the production scale (capacity)—the larger the plant, the higher the unit costs (there is the phenomenon of economies of scale). In general, available estimates indicate that over the next few years, natural gas prices will be higher than the estimated average biomethane production costs, which indicates this activity’s profitability. However, it should be remembered that both the prices of natural gas and the costs of biomethane production are burdened with a very high level of uncertainty, making a long-term assessment of biomethane production profitability difficult. The mentioned problems and uncertainties are a big challenge for the policy of support with public funds. Developing a system of incentives with possibly rational spending in such a volatile environment requires much effort and perceptiveness by policymakers. The rules regarding the support for producing renewable energy other than electricity give Member States much freedom in shaping the way of supporting biomethane. This also applies to the issue of determining the amount of support.
8. Policy Implication
It seems that in view of the current low level of development of the biomethane market, the existing supply potential, and the many advantages of this fuel over other renewable energy sources, policymakers should continue their efforts to implement ambitious goals in terms of increasing biomethane production in the EU in practice. In the context of the accumulated knowledge, it can be stated that both economic, environmental, and political considerations favor the treatment of biogas in the form of biomethane. However, this requires a revision of existing support systems so that treatment is more competitive than burning biogas in CHP units. It is important to limit that the support should not be greater than the difference between LCOE and the reference market price of gas. Development of the biomethane sector requires infrastructural and legislative adjustments to enable producers to sell the produced biomethane (e.g., injection into the gas network). The development of the biomethane sector will require new investments; therefore, educational activities are also recommended since, in the past, investments in bio-gas plants were often associated with strong resistance from local residents.
Author Contributions
Conceptualization, P.S., W.I. and A.W.; methodology, P.S., W.I. and A.W; validation, P.S. and W.I.; formal analysis, P.S., W.I. and M.S.; investigation, P.S., W.I., M.S. and A.W; resources, P.S. and A.W.; data curation, P.S., W.I. and M.S.; writing—original draft preparation, P.S., W.I., M.S. and A.W; writing—review and editing, P.S., W.I. and A.W; visualization, P.S. and W.I.; supervision, A.W.; project administration, A.W. All authors have read and agreed to the published version of the manuscript.
Funding
This research received no external funding.
Data Availability Statement
Not applicable.
Conflicts of Interest
The authors declare no conflict of interest.
References
- IPCC. Mitigation of Climate Change Climate Change 2022 Working Group III Contribution to the Sixth Assessment Report of the Intergovernmental Panel on Climate Change; IPCC: Geneva, Switzerland, 2022. [Google Scholar]
- European Union: Energy System Restructuring towards a Long-Term Low-Emission Pathway Where Are We? Available online: https://unfccc.int/sites/default/files/resource/365_COMMIT%20Fact%20Sheet%20EU%20-%20a%20long-term%20low-emission%20pathway.pdf (accessed on 15 November 2022).
- Olhoff, A.; Christensen, J. Emissions Gap Report 2021. The Heat Is On. A World of Climate Promises Not yet Delivered; United Nations Environment Programme: Nairobi, Kenya, 2021. [Google Scholar]
- Kowalczyk-Juśko, A. Biogazownie i Instalacje Do Biometanu, Jako Element Dochodzenia Do Neutralności Emisyjnej, Poprawy Wizerunku Hodowli i Wsparcie w Budowie Obiektów Inwentarskich. In Wieprzowina—Nowa Perspektywa; Kowalski, A., Ed.; Związek Polskie Mięso: Warszawa, Poland, 2021. [Google Scholar]
- Fritsche, U.R.; Gress, H.W. Renewable Gas-Deployment, Markets and Sustainable Trade Summary Report of the IEA Bioenergy Intertask Project Renewable Gas: Deployment, Markets and Sustainable Trade Renewable Gas-Deployment, Markets and Sustainable Trade Summary Report of the IEA Bioenergy Intertask Project “Renewable Gas: Deployment, Markets and Sustainable Trade.” IEA Bioenergy. 2022. Available online: https://www.ieabioenergy.com/wp-content/uploads/2022/03/Fritsche-et-al-2022-IEA-Bioenergy-Renewable-Gas-Intertask-Summary-Report.pdf (accessed on 15 November 2022).
- European Biogas Association. EBA Statistical Report 2020; European Biogas Association: Brussels, Belgium, 2020; Available online: https://www.europeanbiogas.eu/wp-content/uploads/2021/01/EBA_StatisticalReport2020_abridged.pdf (accessed on 10 December 2022).
- Riley, D.M.; Tian, J.; Güngör-Demirci, G.; Phelan, P.; Rene Villalobos, J.; Milcarek, R.J. Techno-Economic Assessment of CHP Systems in Wastewater Treatment Plants. Environments 2020, 7, 74. [Google Scholar] [CrossRef]
- Grecchi, M.; Stroppa, S.; Baiocchi, F. Biomethane, the Green Molecule to Enable Energy Transition Challenges and Barriers of a Developing Market in Italy; Business Integration Partners: Milan, Italy, 2022. [Google Scholar]
- Eyl-Mazzega, M.-A.; Mathieu, C. Biogas and Biomethane in Europe: Lessons from Denmark, Germany and Italy, Études de l’Ifri; IFRI: Paris, France, 2019; Available online: https://www.ifri.org/sites/default/files/atoms/files/mathieu_eyl-mazzega_biomethane_2019.pdf (accessed on 10 December 2022).
- IEA. Outlook for Biogas and Biomethane 2020. Prospects for Organic Growth. Available online: https://iea.blob.core.windows.net/assets/03aeb10c-c38c-4d10-bcec-de92e9ab815f/Outlook_for_biogas_and_biomethane.pdf (accessed on 15 December 2022).
- Alberici, S.; Moultak, M.; Peters, J.; Guidehouse. The Future Role of Biomethane Gas for Climate, Gas for Climate 2021. Available online: https://gasforclimate2050.eu/wp-content/uploads/2021/12/The_future_role_of_biomethane-December_2021.pdf (accessed on 10 December 2022).
- Economic and Social Committee and the Committee of the Regions Repowereu: Joint European Action for More Affordable, Secure and Sustainable Energy. Available online: https://ec.europa.eu/commission/presscorner/detail/en/IP_22_1511 (accessed on 15 November 2022).
- Koonaphapdeelert, S.; Aggarangsi, P.; Moran, J. Biomethane: Production and Applications; Springer: Singapore, 2020; ISBN 978-981-13-8306-9. [Google Scholar]
- IEA. World Energy Investment 2022; IEA: Paris, France, 2022; Available online: https://iea.blob.core.windows.net/assets/b0beda65-8a1d-46ae-87a2-f95947ec2714/WorldEnergyInvestment2022.pdf (accessed on 15 December 2022).
- Pelkmans, L. IEA Bioenergy Countries’ Report-Update 2021 Implementation of Bioenergy in the IEA Bioenergy Member Countries; IEA Bioenergy: Paris, France, 2021; Available online: https://www.ieabioenergy.com/wp-content/uploads/2021/11/CountriesReport2021_final.pdf (accessed on 15 December 2022).
- National Centre for Emission Management (KOBiZE). Poland’s National Inventory Report 2022 Gas Inventory for 1988–2020; Ministry of Climate and Environment: Warsaw, Poland, 2022. Available online: https://unfccc.int/documents/461818 (accessed on 15 December 2022).
- Berdechowski, K. Analysis of Biohydrogen Production Methods in Terms of GHG Emission Value. Naft.-Gaz 2019, 4, 230–235. [Google Scholar] [CrossRef]
- Holewa, J.; Kukulska-Zając, E.; Pęgielska, M. Analysis of the Possibility of Introducing Biogas into the Transmission Network. Naft. -Gaz 2012, 8, 523–529. [Google Scholar]
- Grządzielski, W.; Dziadowiec, M.; Blacharski, T. Planning the Development of a Distribution Gas Network Fuelled by Liquefied Natural Gas or Biogas. Rynek Energii 2017, 3, 77–84. [Google Scholar]
- Abdalla, N.; Bürck, S.; Fehrenbach, H.; Köppen, S.; Staigl, T.J. Biomethane in Europe; Institut für Energie und Umweltforschung Heidelberg GmbH: Heidelberg, Germany, 2022. [Google Scholar]
- Pfau, S.F.; Hagens, J.E.; Dankbaar, B. Biogas between Renewable Energy and Bio-Economy Policies—Opportunities and Constraints Resulting from a Dual Role. Energy Sustain. Soc. 2017, 7, 17. [Google Scholar] [CrossRef] [Green Version]
- Piechota, G.; Iglí Nski, B.; Zaborowicz, M.; Qiao, W. Biomethane in Poland—Current Status, Potential, Perspective and Development. Energies 2021, 14, 1517. [Google Scholar] [CrossRef]
- Pavičić, J.; Mavar, K.N.; Brkić, V.; Simon, K. Biogas and Biomethane Production and Usage: Technology Development, Advantages and Challenges in Europe. Energies 2022, 15, 2940. [Google Scholar] [CrossRef]
- Casasso, A.; Puleo, M.; Panepinto, D.; Zanetti, M. Economic Viability and Greenhouse Gas (Ghg) Budget of the Biomethane Retrofit of Manure-Operated Biogas Plants: A Case Study from Piedmont, Italy. Sustainability 2021, 13, 7979. [Google Scholar] [CrossRef]
- Alberici, S.; Grimme, W.; Toop, G. A Gas for Climate Report Feasibility of REPowerEU 2030 Targets, Production Potentials in the Member Biomethane Production Potentials in the EU; Gas for Climate: Utrecht, The Netherlands, 2022. [Google Scholar]
- Decorte, M.; Tessens, S.; Fernández, D.; Repullo, F.; McCarthy, P.; Oriordan, B.; Maggioni, L.; Pieroni, C.; Protas, M.; Rogulska, M.; et al. D6.1 Mapping the State of Play of Renewable Gases in Europe. 2020. Available online: https://www.regatrace.eu/wp-content/uploads/2020/02/REGATRACE-D6.1.pdf (accessed on 7 December 2022).
- Booth, A.; Sutton, A.; Papaioannou, D. Systematic Approaches to a Successful Literature Review; SAGE Publications: Los Angeles, CA, USA; London, UK; New Delhi, India; Singapore; Washington, DC, USA; Melbourne, Australia, 2016; ISBN 978-1-4739-1245-8. [Google Scholar]
- Szymańska, M.; Ahrends, H.E.; Srivastava, A.K.; Sosulski, T. Anaerobic Digestate from Biogas Plants—Nuisance Waste or Valuable Product? Appl. Sci. 2022, 12, 4052. [Google Scholar] [CrossRef]
- Hofmann, F.; Plättner, A.; Scholwin, F.; Kaltschmitt, M. Institute for Energy and Environment Möglichkeiten Der Einspeisung von Biogas in Das Österreichische Gasnetz. 2005. Available online: https://www.e-control.at/documents/1785851/1811042/studie-biogaseinspeisung-ife-2005.pdf/ (accessed on 15 November 2022).
- Wojnowska-Baryła, I.; Gołaszewski, J.; Bernat, K. Conversion of Waste from Agri-Food Industry to Biogas—A System Approach; Wydawnictwo Uniwersytetu Warmińsko-Mazurskiego w Olsztynie: Olsztyn, Poland, 2014. [Google Scholar]
- Agroenergetyki, I. Biogazownia w Twojej Gminie, Praktyczny Przewodnik Dla Pracowników Samorządu Terytorialnego; Instytut Agroenergetyki Sp. z o.o.: Warszawa, Poland, 2014. [Google Scholar]
- Angelidaki, I.; Treu, L.; Tsapekos, P.; Luo, G.; Campanaro, S.; Wenzel, H.; Kougias, P.G. Biogas Upgrading and Utilization: Current Status and Perspectives. Biotechnol. Adv. 2018, 36, 452–466. [Google Scholar] [CrossRef] [Green Version]
- Persson, M.; Jönsson, O.; Wellinger, A. Biogas Upgrading to Vehicle Fuel Standards and Grid Injection; Task 37; IEA Bioenergy: Paris, France, 2006; Available online: https://www.ieabioenergy.com/wp-content/uploads/2007/12/upgrading_report_final.pdf (accessed on 7 December 2022).
- Herout, M.; Malaták, J.; Kucera, L.; Dlabaja, T. Biogas Composition Depending on the Type of Plant Biomass Used. Res. Agric. Eng. 2011, 57, 137–143. [Google Scholar] [CrossRef] [Green Version]
- Moya, C.; Santiago, R.; Hospital-Benito, D.; Lemus, J.; Palomar, J. Design of Biogas Upgrading Processes Based on Ionic Liquids. Chem. Eng. J. 2022, 428, 132103. [Google Scholar] [CrossRef]
- Rasi, S. Biogas Composition and Upgrading to Biomethane; University of Jyväskylä: Jyväskylä, Finland, 2009; Available online: https://jyx.jyu.fi/bitstream/handle/123456789/20353/9789513936181.pdf?seque (accessed on 11 December 2022).
- Scholz, M.; Melin, T.; Wessling, M. Transforming Biogas into Biomethane Using Membrane Technology. Renew. Sustain. Energy Rev. 2013, 17, 199–212. [Google Scholar] [CrossRef]
- IEA Bioenergy. Membrane Up-Grading of Biogas to Biomethane for Grid Injection. Available online: https://www.ieabioenergy.com/wp-content/uploads/2018/01/success_bruck_austria2013.pdf (accessed on 7 December 2022).
- Towler, G.; Sinnott, R.K. Chemical Engineering Design—Principles, Practice and Economics of Plant and Process Design, 2nd ed.; Butterworth-Heinemann: Oxford, UK, 2013. [Google Scholar]
- Yoo, M.; Han, S.J.; Wee, J.H. Carbon Dioxide Capture Capacity of Sodium Hydroxide Aqueous Solution. J. Environ. Manag. 2013, 114, 512–519. [Google Scholar] [CrossRef]
- Augelletti, R.; Conti, M.; Annesini, M.C. Pressure Swing Adsorption for Biogas Upgrading. A New Process Configuration for the Separation of Biomethane and Carbon Dioxide. J. Clean Prod. 2017, P3, 1390–1398. [Google Scholar] [CrossRef]
- Bauer, F.; Persson, T.; Hulteberg, C.; Tamm, D. Biogas Upgrading—Technology Overview, Comparison and Perspectives for the Future. Biofuels Bioprod. Biorefining 2013, 7, 499–511. [Google Scholar] [CrossRef]
- Ryckebosch, E.; Drouillon, M.; Vervaeren, H. Techniques for Transformation of Biogas to Biomethane. Biomass Bioenergy 2011, 35, 1633–1645. [Google Scholar] [CrossRef]
- Hashemi, S.E.; Sarker, S.; Lien, K.M.; Schnell, S.K.; Austbø, B. Cryogenic vs. Absorption Biogas Upgrading in Liquefied Biomethane Production—An Energy Efficiency Analysis. Fuel 2019, 245, 294–304. [Google Scholar] [CrossRef]
- Calise, F.; Cappiello, F.L.; Cimmino, L.; D’accadia, M.D.; Vicidomini, M. A Review of the State of the Art of Biomethane Production: Recent Advancements and Integration of Renewable Energies. Energies 2021, 14, 4895. [Google Scholar] [CrossRef]
- Thieme, E.; Fischer, E.; Schuhmann, E.; Hofmann, J.; Janke, L.; Stur, M.; Manig, R.; Schmidt, T.; Raabe, T.; Becher, U.; et al. Coletânea de Publicações do Probiogás Série Desenvolvimento do Mercado de Biogás; Ministério das Cidades: Brasilia, Brazil, 2015. Available online: https://www.giz.de/en/downloads/probiogas-catalogo.pdf (accessed on 11 December 2022)ISBN 9788579580383.
- Sinigaglia, T.; Evaldo Freitag, T.; Machado, A.; Pedrozo, V.B.; Rovai, F.F.; Gondim Guilherme, R.T.; Metzka Lanzanova, T.D.; Dalla Nora, M.; Santos Martins, M.E. Current Scenario and Outlook for Biogas and Natural Gas Businesses in the Mobility Sector in Brazil. Int. J. Hydrogen Energy 2022, 47, 12074–12095. [Google Scholar] [CrossRef]
- Kruse, A. Hydrothermal Biomass Gasification. J Supercrit Fluids 2009, 47, 391–399. [Google Scholar] [CrossRef]
- Ardolino, F.; Arena, U. Biowaste-to-Biomethane: An LCA Study on Biogas and Syngas Roads. Waste Manag. 2019, 87, 441–453. [Google Scholar] [CrossRef]
- de Kam, M.J.; Vance Morey, R.; Tiffany, D.G. Biomass Integrated Gasification Combined Cycle for Heat and Power at Ethanol Plants. Energy Convers Manag. 2009, 50, 1682–1690. [Google Scholar] [CrossRef]
- van der Meijden, C.M.; Veringa, H.J.; Rabou, L.P.L.M. The Production of Synthetic Natural Gas (SNG): A Comparison of Three Wood Gasification Systems for Energy Balance and Overall Efficiency. Biomass Bioenergy 2010, 34, 302–311. [Google Scholar] [CrossRef]
- Li, H.; Larsson, E.; Thorin, E.; Dahlquist, E.; Yu, X. Feasibility Study on Combining Anaerobic Digestion and Biomass Gasification to Increase the Production of Biomethane. Energy Convers. Manag. 2015, 100, 212–219. [Google Scholar] [CrossRef]
- Searle, S.; Baldino, C.; Pavlenko, N. What Is the Role for Renewable Methane in European Decarbonization? The Growing Focus On Renewable Methane. 2018. Available online: https://theicct.org/sites/default/files/publications/Role_Renewable_Methane_EU_20181016.pdf (accessed on 12 December 2022).
- Jafri, Y.; Waldheim, L.; Consulting, W.; Lundgren, J. Emerging Gasification Technologies for Waste & Biomass; IEA Bioenergy, 2020. Available online: https://www.ieabioenergy.com/wp-content/uploads/2021/02/Emerging-Gasification-Technologies_final.pdf (accessed on 15 December 2022).
- Jaro, J.; Gräf, D.; Schimmel, M. A Gas for Climate Report Market State and Trends in Renewable and Low-Carbon Gases in Europe. Guidehouse Netherlands B.V.: Utrecht, The Netherlands, 2021; Available online: https://www.europeanbiogas.eu/wp-content/uploads/2021/12/Gas-for-Climate-Market-State-and-Trends-report-2021.pdf (accessed on 12 December 2022).
- Terlouw, W.; Peters, D.; van Tilburg, J.; Schimmel, M.; Berg, T.; Cihlar, J.; Mir, G.; Spöttle, M.; Lejaretta, A.V.; Buseman, M.; et al. Gas for Climate. The Optimal Role for Gas in a Net Zero Emissions Energy System; Navigant: Utrecht, The Netherlands, 2019. Available online: https://gasforclimate2050.eu/wp-content/uploads/2020/03/Navigant-Gas-for-Climate-The-optimal-role-for-gas-in-a-net-zero-emissions-energy-system-March-2019.pdf (accessed on 11 December 2022).
- European Union. Communication from the Commission to the European Parliament, the European Council, the Council, the European Economic and Social Committee and the Committee of the Regions, The European Green Deal; European Commission: Brussels, Belgium, 2019. [Google Scholar]
- United Nations. Paris Agreement; United Nations Framework Convention on Climate Change: Paris, France, 2015. [Google Scholar]
- Directorate-General for Energy (European Commission). Clean Energy for All Europeans; Directorate-General for Energy (European Commission): Luxembourg, 2019. [Google Scholar]
- European Union. Directive (EU) 2018/2001 of the European Parliament and of the Council of 11 December 2018 on the Promotion of the Use of Energy from Renewable Sources. RED II; European Parliament and the EU Council: Brussels, Belgium, 2018. [Google Scholar]
- Zachmann, G.; Holz, F.; Roth, A.; McWilliams, B.; Sogalla, R.; Meissner, F.; Kemfert, C. Decarbonisation of Energy Determining a Robust Mix of Energy Carriers for a Carbon-Neutral EU STUDY Requested by the ITRE Committee; European Parliament: Luxembourg, 2021. [Google Scholar]
- European Union. Regulation (EU) 2021/1119 of the European Parliament and of the Council of 30 June 2021 Establishing the Framework for Achieving Climate Neutrality and Amending Regulations (EC) No 401/2009 and (EU) 2018/1999 (‘European Climate Law’); The European Parliament and the Council of The European Union: Brussels, Belgium, 2021. [Google Scholar]
- European Union. Regulation (EU) 2018/1999 of the European Parliament and of the Council of 11 December 2018 on the Governance of the Energy Union and Climate Action; European Parliament and the EU Council: Brussels, Belgium, 2018. [Google Scholar]
- European Union. “Fit for 55”: Delivering the EU’s 2030 Climate Target on the Way to Climate Neutrality; European Commission: Brussels, Belgium, 2021. [Google Scholar]
- European Union. Fit for 55—The EU’s Plan for a Green Transition—Consilium. Available online: https://www.consilium.europa.eu/en/policies/green-deal/fit-for-55-the-eu-plan-for-a-green-transition/ (accessed on 8 January 2023).
- European Union. Proposal for a Directive of the European Parliament and of the Council Amending Directive (EU) 2018/2001 of the European Parliament and of the Council, Regulation (EU) 2018/1999 of the European Parliament and of the Council and Directive 98/70/EC of the European Parliament and of the Council as Regards the Promotion of Energy from Renewable Sources, and Repealing Council Directive (EU) 2015/652; European Parliament: Brussels, Belgium, 2021. [Google Scholar]
- BP. Full Report—Statistical Review of World Energy 2021; BP: London, UK, 2021. [Google Scholar]
- Schwartzkopff, J. The Future Role of Gas in a Climate-Neutral Europe. Report Based on the Discussions of an Expert Group Convened by the Heinrich-Böll-Stiftung European Union and Environmental Action Germany (Deutsche Umwelthilfe); Heinrich-Böll-Stiftung European Union and Environmental Action Germany (DUH): Brussels, Belgium, 2022; Available online: https://eu.boell.org/sites/default/files/2022-06/Future_role_of_gas_EU_FINAL.pdf (accessed on 16 December 2022).
- Birman, J.; Burdloff, J.; de Peufeilhoux, H.; Erbs, G.; Feniou, M.; Lucille, P.-L. Geographical Analysis of Biomethane Potential and Costs in Europe in 2050: Potential and Cost in 2050. ENGIE. 2021. Available online: https://www.engie.com/sites/default/files/assets/documents/2021-07/ENGIE_20210618_Biogas_potential_and_costs_in_2050_report_1.pdf (accessed on 11 December 2022).
- European Commission. Proposal for a Directive of the European Parliament and of the Council on Common Rules for the Internal Markets in Renewable and Natural Gases and in Hydrogen; COM(2021) 803 final; European Commission: Brussels, Belgium, 2021; Available online: https://eur-lex.europa.eu/resource.html?uri=cellar:2f4f56d6-5d9d-11ec-9c6c-01aa75ed71a1.0001.02/DOC_1&format=PDF (accessed on 5 January 2023).
- European Commission. Commission Proposes New EU Framework to Decarbonise Gas Markets, Promote Hydrogen and Reduce Methane Emissions. Available online: https://ec.europa.eu/commission/presscorner/detail/en/ip_21_6682 (accessed on 5 January 2023).
- Nevzorova, T.; Kutcherov, V. Barriers to the Wider Implementation of Biogas as a Source of Energy: A State-of-the-Art Review. Energy Strategy Rev. 2019, 26, 100414. [Google Scholar] [CrossRef]
- European Union. Proposal for a Regulation of the European Parliament and of the Council on the Internal Markets for Renewable and Natural Gases and for Hydrogen (Recast); European Parliament the Eu Council: Brussels, Belgium, 2021. [Google Scholar]
- Raimondi, P.; Bianchi, M. Energy Unity or Breakup? The EU at a Crossroads. IAI Comment. 2022. Available online: https://www.iai.it/en/pubblicazioni/energy-unity-or-breakup-eu-crossroads (accessed on 5 January 2023).
- IEA. National Reliance on Russian Fossil Fuel Imports—Analysis. Available online: https://www.iea.org/reports/national-reliance-on-russian-fossil-fuel-imports/which-countries-are-most-reliant-on-russian-energy (accessed on 4 January 2023).
- Anderson, R.J. Europe’s Dependence on Russian Natural Gas: Perspectives and Recommendations for a Long-Term Strategy. 2008. Available online: https://www.marshallcenter.org/en/publications/occasional-papers/europes-dependence-russian-natural-gas-perspectives-and-recommendations-long-term-strategy-0 (accessed on 5 January 2023).
- Eurostat from Where Do We Import Energy? Available online: https://ec.europa.eu/eurostat/cache/infographs/energy/bloc-2c.html (accessed on 8 January 2023).
- European Union. Communication from the Commission to the European Parliament, the European Council, the Council, the European Economic and Social Committee and the Committee of the Regions Repowereu Plan; European Commission: Brussels, Belgium, 2022. [Google Scholar]
- European Union. Commission Staff Working Document Implementing the Repower eu Action Plan: Investment Needs, Hydrogen Accelerator and Achieving the Bio-Methane Targets; European Commission: Brussels, Belgium, 2022. [Google Scholar]
- IGU. Global Renewable and Low-Carbon Gas Report 2021; IGU: Egham, UK, 2021. [Google Scholar]
- Czekała, W.; Dach, J.; Jasiński, T.; Kolasiński, M.; Kowalczyk-Jusko, A.; Kulesa, M.; Majchrzak, H.; Orzech, A.; Piechota, G.; Pituła, M.; et al. Raport Biogaz w Polsce 2022; Magazyn Biomasa: Poznań, Poland, 2022. [Google Scholar]
- European Biogas Association. EBA Statistical Report 2021; European Biogas Association: Brussels, Belgium, 2021; Available online: https://www.europeanbiogas.eu/wp-content/uploads/2021/11/EBA-STATISTICAL-REPORT-2021-SHORT-VERSION.pdf (accessed on 10 December 2022).
- Cozzi, L.; Gould, T.; Bouckaert, S.; Coppel, J.; McGlade, C.; Spencer, T.; Wanner, B.; Wetzel, D. World Energy Outlook 2022. DVN: Høvik, Norway, 2022. [Google Scholar]
- Liebetrau, J.; Fritsche, U.; Gress, H.W. Biomethane-Factors for a Successful Sector Development. Synthesis Report of WP1 of the IEA Bioenergy Intertask Project “Renewable Gas: Deployment, Markets and Sustainable Trade” Biomethane-Factors for a Successful Sector Development Synthesis. Report of WP1 of the IEA Bioenergy Intertask Project Renewable Gas-Deployment, Markets and Sustainable Trade. Available online: https://www.ieabioenergy.com/wp-content/uploads/2022/03/IEA-Bioenergy-Renewable-Gas-Intertask-WP1-Synthesis-report_2021.pdf (accessed on 5 December 2022).
- ten Kate, W.; van den Noort, A.; Vos, M.; Özgün, O. European Carbon Neutrality: The Importance of Gas—A Study for Eurogas Report No. OGNL.180049. 2020. Available online: https://www.europeangashub.com/wp-content/uploads/2020/07/DNV-GL-Eurogas-Report-Reaching-European-Carbon-Neutrality-Full-Report.pdf (accessed on 10 December 2022).
- Moraga, J.L.; Mulder, M.; Perey, P. Future Markets for Renewable Gases and Hydrogen. What Would Be the Optimal Regulatory Provisions? CERRE. 2019. Available online: https://cerre.eu/wp-content/uploads/2020/05/cerre_report_future_markets_for_renewable_gases_and_hydrogen.pdf (accessed on 5 December 2022).
- European Union. In-Depth Analysis in Support of the Commission Communication Com(2018) 773: A Clean Planet for All—A European Long-Term Strategic Vision for a Prosperous, Modern, Competitive and Climate Neutral Economy; European Union: Brussels, Belgium, 2018; Available online: https://climate.ec.europa.eu/system/files/2018-11/com_2018_733_analysis_in_support_en.pdf (accessed on 5 December 2022).
- Kampman, B.; Leguijt, C.; Scholten, T.; Tallat-Kelpsaite, J.; Brückman, R.; Maroulis, G.; Lesschen, J.P.; Meesters, K.; Sikirica, N.; Elbersen, B. Optimal Use of Biogas from Waste Streams. An Assessment of the Potential of Biogas from digestion in the EU beyond 2020. European Commission. 2016. Available online: https://energy.ec.europa.eu/system/files/2017-03/ce_delft_3g84_biogas_beyond_2020_final_report_0.pdf (accessed on 5 December 2022).
- Magness, J. European Renewables an Increasingly Attractive Environment. EDISON. 2022. Available online: https://d3s3shtvds09gm.cloudfront.net/cba8c7214608d417d09a53879af95334.pdf (accessed on 10 December 2022).
- IEA. Scaling up Biomethane in the European Union: Background Paper. Available online: https://iea.blob.core.windows.net/assets/9c38de0b-b710-487f-9f60-f19d0bf5152a/IEAWorkshop_Scalingupbiomethane_backgroundpaper.pdf (accessed on 12 November 2022).
- IRENA Global Energy Transformation. Available online: https://irena.org/publications/2019/Apr/Global-energy-transformation-A-roadmap-to-2050-2019Edition (accessed on 12 August 2020).
- Peng, W.; Pivato, A. Sustainable Management of Digestate from the Organic Fraction of Municipal Solid Waste and Food Waste Under the Concepts of Back to Earth Alternatives and Circular Economy. Waste Biomass Valorizat. 2019, 10, 465–481. [Google Scholar] [CrossRef]
- Ricardo Energy & Environment. Assessment of Cost and Benefits of Biogas and Biomethane in Ireland; Ricardo Energy & Environment: Dublin, Ireland, 2017; Available online: https://www.seai.ie/publications/Assessment-of-Cost-and-Benefits-of-Biogas-and-Biomethane-in-Ireland.pdf (accessed on 12 August 2020).
- Mertins, A.; Wawer, T. How to Use Biogas? A Systematic Review of Biogas Utilization Pathways and Business Models. Bioresour. Bioprocess. 2022, 9, 59. [Google Scholar] [CrossRef]
- Labriet, M.; Tosato, G. Biogas and Bio-Syngas Production. Available online: https://iea-etsap.org/E-TechDS/PDF/P11_BiogasProd_ML_Dec2013_GSOK.pdf (accessed on 5 December 2022).
- Liberti, F.; Pistolesi, V.; Mouftahi, M.; Hidouri, N.; Bartocci, P.; Massoli, S.; Zampilli, M.; Fantozzi, F. An Incubation System to Enhance Biogas and Methane Production: A Case Study of an Existing Biogas Plant in Umbria, Italy. Processes 2019, 7, 925. [Google Scholar] [CrossRef] [Green Version]
- Mao, C.; Feng, Y.; Wang, X.; Ren, G. Review on Research Achievements of Biogas from Anaerobic Digestion. Renew. Sustain. Energy Rev. 2015, 45, 540–555. [Google Scholar] [CrossRef]
- McKendry, P. Overview of Anaerobic Digestion and Power and Gas to Grid Plant CAPEX and OPEX Costs Citation: McKendry P (2019) Overview of Anaerobic Digestion and Power and Gas to Grid Plant CAPEX and OPEX Costs. Int. J. Bioprocess. Biotech. Rev. Artic. McKendry P. Int. J. Bioprocess. Biotech 2018, 2, 109. [Google Scholar] [CrossRef]
- Huseby, H.H. Biogas Upgrading: Techno-Economic Evaluation of Different Technologies Based on Norwegian Potential of Raw Materials. Master’s Thesis, Norwegian University of Life Sciences, Ås, Norway.
- Bortoluzzi, G.; Gatti, M.; Sogni, A.; Consonni, S. Biomethane Production from Agricultural Resources in the Italian Scenario: Techno-Economic Analysis of Water Wash. Chem. Eng. 2014, 37, 259–264. [Google Scholar] [CrossRef]
- Stürmer, B.; Kirchmeyr, F.; Kovacs, K.; Hofmann, F.; Collins, D.; Ingremeau, C.; Stambasky, J. Deliverable: Technical-Economic Analysis for Determining the Feasibility Threshold for Tradable Biomethane Certificates D3.4. European Biogas Association—BIOSURF. 2016. Available online: https://ec.europa.eu/research/participants/documents/downloadPublic?documentIds=080166e5aa5ba7aa&appId=PPGMS (accessed on 12 December 2022).
- Havrysh, V.; Kalinichenko, A.; Mentel, G.; Olejarz, T. Commercial Biogas Plants: Lessons for Ukraine. Energies 2020, 13, 2668. [Google Scholar] [CrossRef]
- Tsiropoulos, I.; Hoefnagels, R.; de Jong, S.; van den Broek, M.; Patel, M.; Faaij, A. Emerging Bioeconomy Sectors in Energy Systems Modeling—Integrated Systems Analysis of Electricity, Heat, Road Transport, Aviation, and Chemicals: A Case Study for the Netherlands. Biofuels Bioprod. Biorefining 2018, 12, 665–693. [Google Scholar] [CrossRef]
- Teferra, D.M.; Wubu, W. Biogas for Clean Energy. In Anaerobic Digestion; Rajesh Banu, J., Ed.; InTechOpen: London, UK, 2018; Available online: https://www.intechopen.com/chapters/62959 (accessed on 5 December 2022). [CrossRef] [Green Version]
- Heiker, M.; Kraume, M.; Mertins, A.; Wawer, T.; Rosenberger, S. Biogas Plants in Renewable Energy Systems—A Systematic Review of Modeling Approaches of Biogas Production. Appl. Sci. 2021, 11, 3361. [Google Scholar] [CrossRef]
- Lawson, N.; Alvarado-Morales, M.; Tsapekos, P.; Angelidaki, I. Techno-Economic Assessment of Biological Biogas Upgrading Based on Danish Biogas Plants. Energies 2021, 14, 8252. [Google Scholar] [CrossRef]
- Hoyer, K.; Hulteberg, C.; Svensson, M.; And, J.J.; Nørregård, Ø. Biogas Upgrading-Technical Review; 2016. Available online: https://lup.lub.lu.se/search/publication/9e1c64bd-efe6-4cc4-88d5-c79eab06fcc5 (accessed on 5 December 2022).
- Vo, T.T.Q.; Wall, D.M.; Ring, D.; Rajendran, K.; Murphy, J.D. Techno-Economic Analysis of Biogas Upgrading via Amine Scrubber, Carbon Capture and Ex-Situ Methanation. Appl. Energy 2018, 212, 1191–1202. [Google Scholar] [CrossRef]
- Paturska, A.; Repele, M.; Bazbauers, G. Economic Assessment of Biomethane Supply System Based on Natural Gas Infrastructure. Energy Procedia 2015, 72, 71–78. [Google Scholar] [CrossRef] [Green Version]
- Angelidaki, I.; Xie, L.; Luo, G.; Zhang, Y.; Oechsner, H.; Lemmer, A.; Munoz, R.; Kougias, P.G. Biogas Upgrading: Current and Emerging Technologies. Biofuels Altern. Feed. Convers. Process. Prod. Liq. Gaseous Biofuels 2019, 817–843. [Google Scholar] [CrossRef]
- Ea Energy Analyses. Biogas Og Andre VE Braendstoffer Til Tung Transport. Analyse Af Muligheder Og Udfordringer Ved Udfasning Af Fossile Brændsler. 2016. Available online: https://ens.dk/sites/ens.dk/files/Bioenergi/biogas_og_anden_ve_til_tung_transport.pdf (accessed on 10 December 2022).
- European Biogas Association. EBA Statistical Report 2022; European Biogas Association: Brussels, Belgium, 2022; Available online: https://www.europeanbiogas.eu/wp-content/uploads/2022/12/EBA-Statistical-Report-2022_-Short-version.pdf (accessed on 10 December 2022).
- ENEA. Renforcer La Compétitivité de La Filière Biométhane Française: De Nombreux Leviers Activables à Court et Moyen Termes; ENEA: Paris, France, 2018; Available online: https://www.enea-consulting.com/static/2c384b567e2a1180be38aebfec309344/enea-renforcer-la-competitivite-de-la-filiere-biomethane-francaise.pdf (accessed on 12 December 2022).
- European Union. Communication from the Commission Guidelines on State Aid for Climate, Environmental Protection and Energy 2022; European Commission: Brussels, Belgium, 2022. [Google Scholar]
- European Union. Communication from the Commission Temporary Crisis Framework for State Aid Measures to Support the Economy Following the Aggression against Ukraine by Russia; European Commission: Brussels, Belgium, 2022. [Google Scholar]
- Couture, T.D.; Cory, K.; Kreycik, C.; Williams, E. Technical Report: A Policymaker’s Guide to Feed-in Tariff Policy Design; 2010. Available online: https://www.nrel.gov/docs/fy10osti/44849.pdf (accessed on 12 December 2022).
- Menanteau, P.; Finon, D.; Lamy, M.L. Prices versus Quantities: Choosing Policies for Promoting the Development of Renewable Energy. Energy Policy 2003, 31, 799–812. [Google Scholar] [CrossRef]
- EurObserv’ER. Country Policy Profile Croatia. Log File of Changes in Support Policies as Compared to Latest Member State Progress Report. Available online: https://www.eurobserv-er.org/pdf/res-policy/EurObservER-RES-Policy-Report-Country-Profile-2014-10-Croatia.pdf (accessed on 12 December 2022).
- European Union. State Aid SA.48424 2017/N Support Scheme for Advanced Biomethane and Other Advanced Biofuels for Use in Transport in Italy; European Commission: Brussels, Belgium, 2017; Available online: https://ec.europa.eu/competition/elojade/isef/case_details.cfm?proc_code=3_SA_48424 (accessed on 12 December 2022).
- European Union. State Aid SA.36659 2013/N Aid for All Forms of Biogas Use—B; European Commission: Brussels, Belgium, 2015. [Google Scholar]
- Dano, J. New Record for Biogas in the Gas System in 2021. Available online: https://en.energinet.dk/About-our-news/News/2022/01/07/New-record-biogas/ (accessed on 5 January 2023).
- Yuxia, Y.; Ryssel, M.; Scholwin, F.; Grope, J.; Clinkscales, A.; Bowe, S. Biomethane Production and Grid Injection: German Experiences, Policies, Business Models and Standards; National Energy Administration: Beijing, China; Berlin, Germany, 2020. Available online: https://www.energypartnership.cn/fileadmin/user_upload/china/media_elements/publications/Biomethane_German_Experience_Study_EN_Final.pdf (accessed on 5 January 2023).
- Reizine, S. Biomethane Injection in France; Ministère de l’Ecologie. du Développement durable et de l’Energie: Paris, France, 2015. [Google Scholar]
- European Commission. Statligt Stöd SA. 43302 (2015/N)—Sverige—Skattebefrielser För Biogas Som Används Som Motorbränsle. 2015. Available online: https://ec.europa.eu/competition/state_aid/cases/260835/260835_1759154_146_2.pdf (accessed on 5 January 2023).
- Natural Gas Supply Statistics—Statistics Explained. Available online: https://ec.europa.eu/eurostat/statistics-explained/index.php?title=Natural_gas_supply_statistics (accessed on 8 February 2023).

Figure 2.
Share of Russian fossil fuel imports in total domestic consumption in 2019. Source: Eurostat.
Figure 2.
Share of Russian fossil fuel imports in total domestic consumption in 2019. Source: Eurostat.
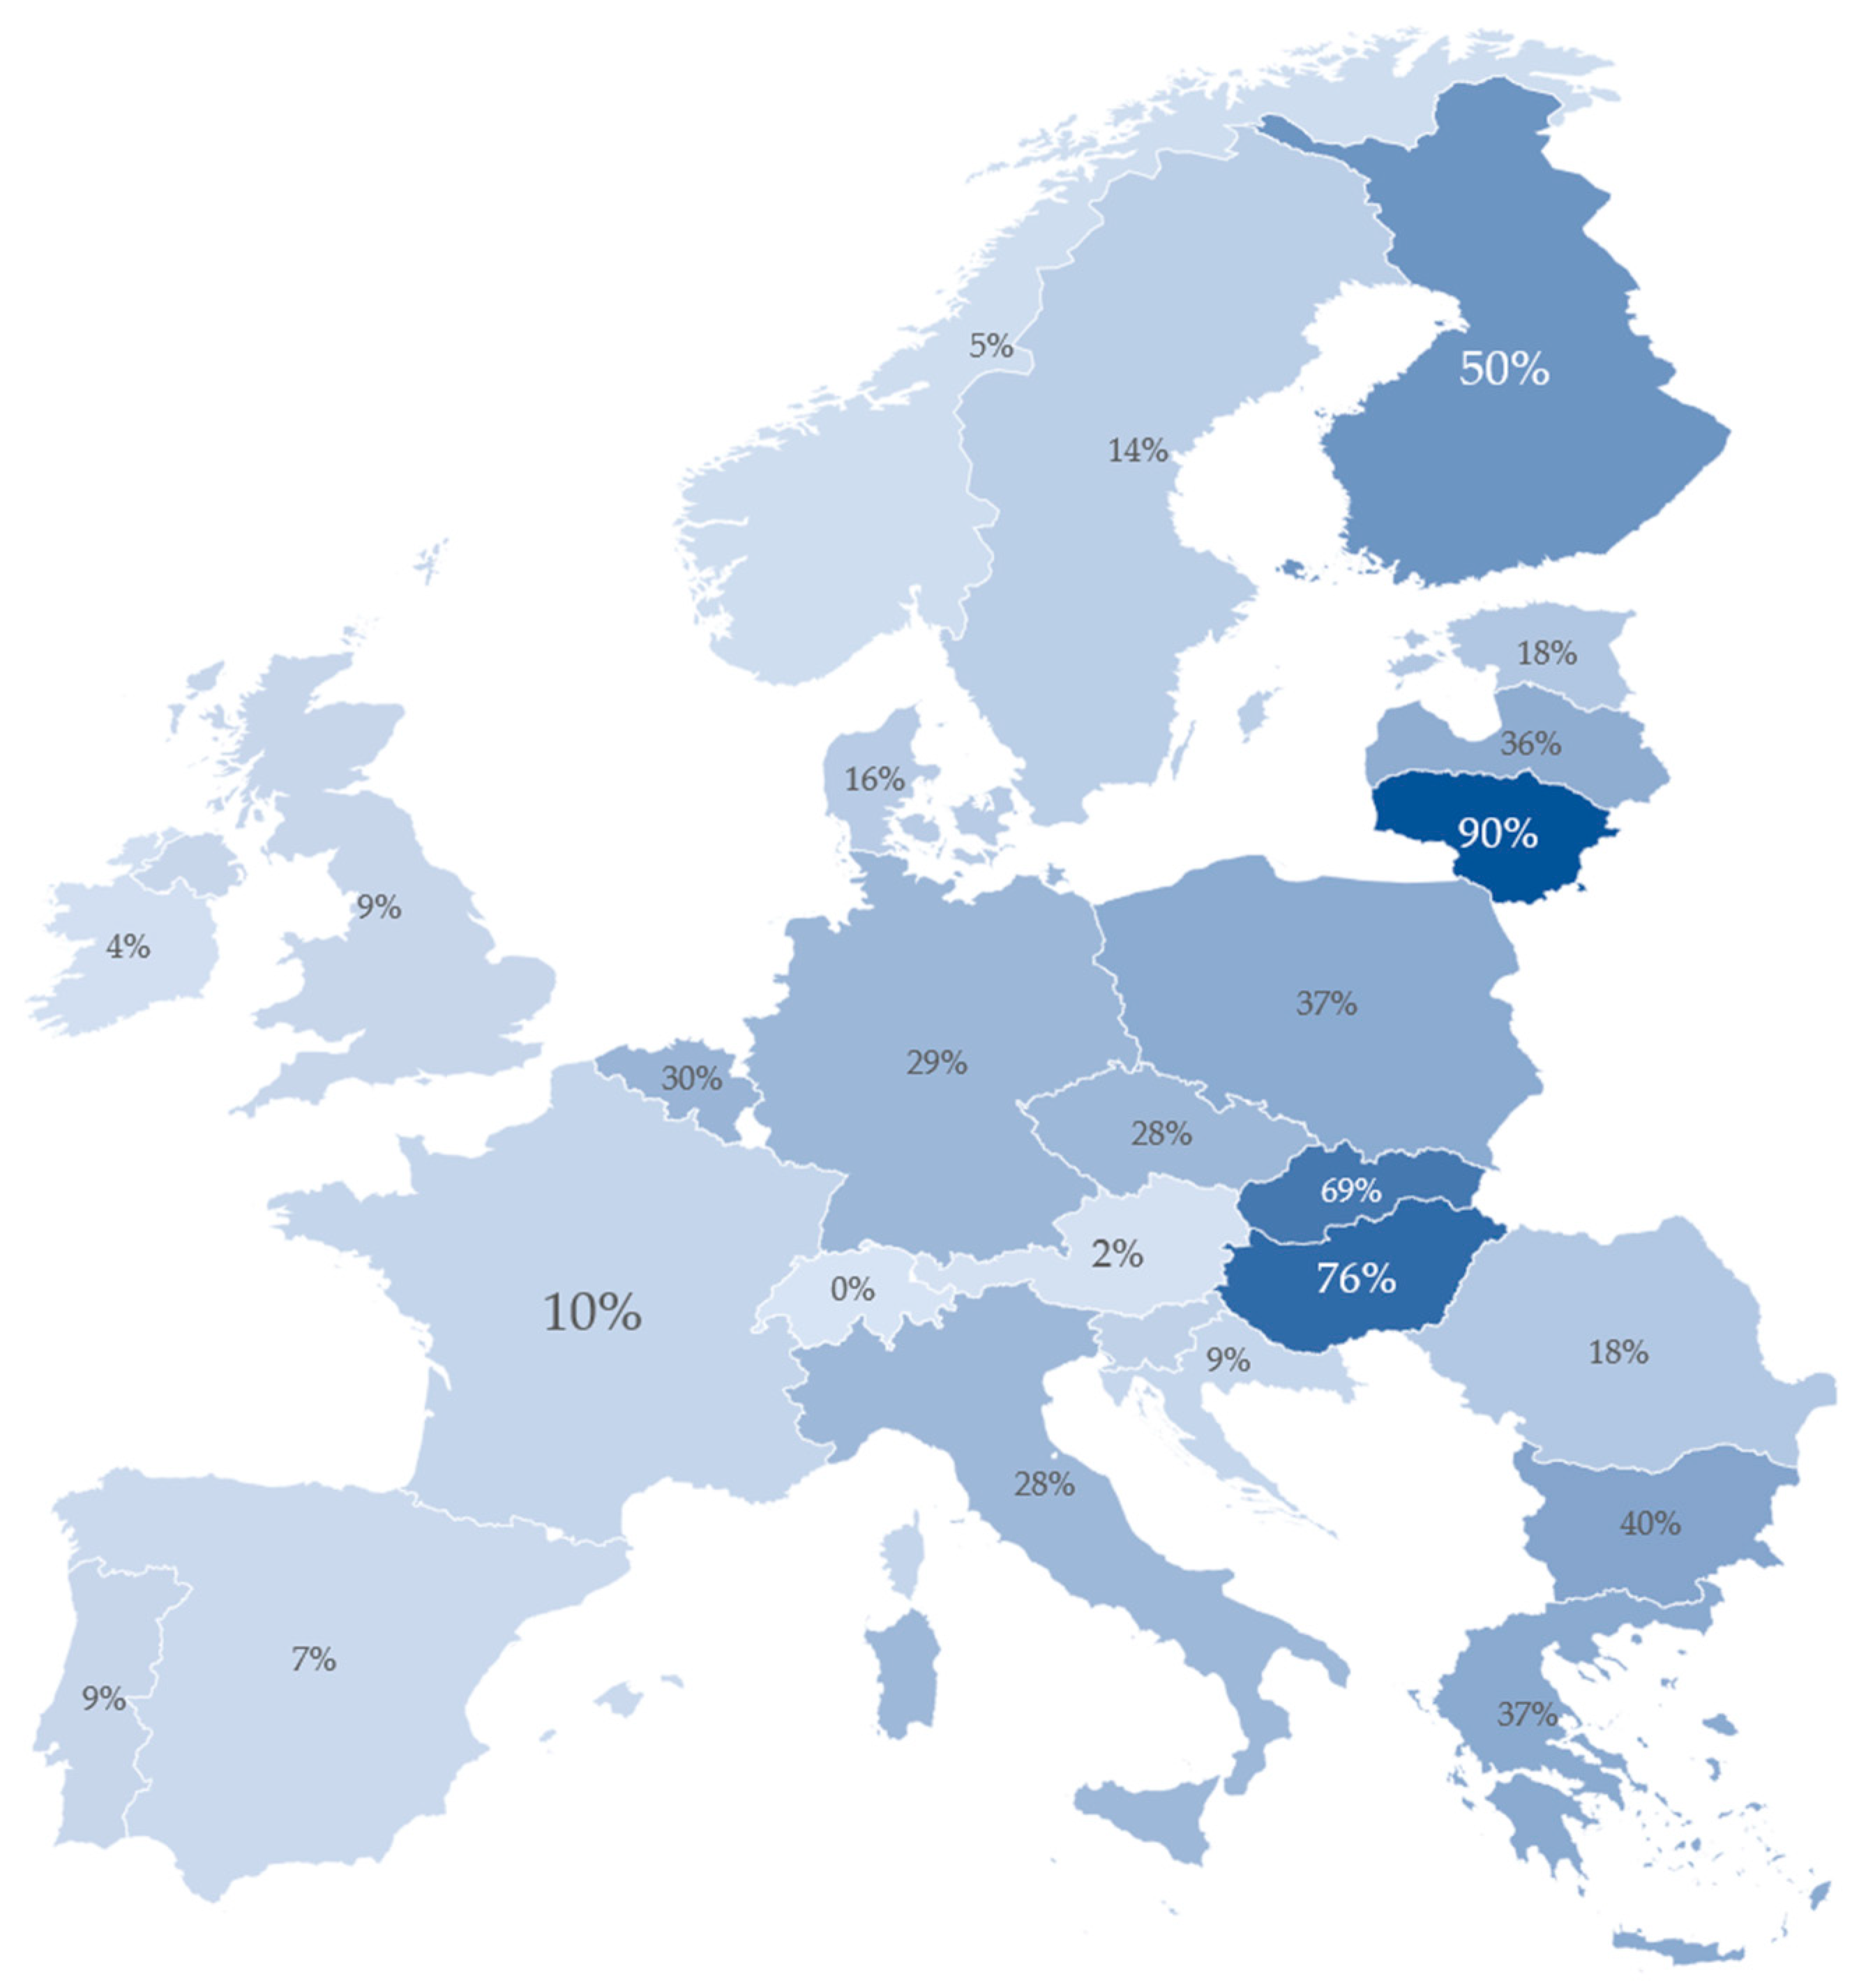
Figure 3.
Scheme of REPower EU’s biomethane target realization. Source: own elaboration.

Figure 4.
Number of biomethane plants and biomethane production in the EU (2011–2020). Source: EBA [82].
Figure 4.
Number of biomethane plants and biomethane production in the EU (2011–2020). Source: EBA [82].
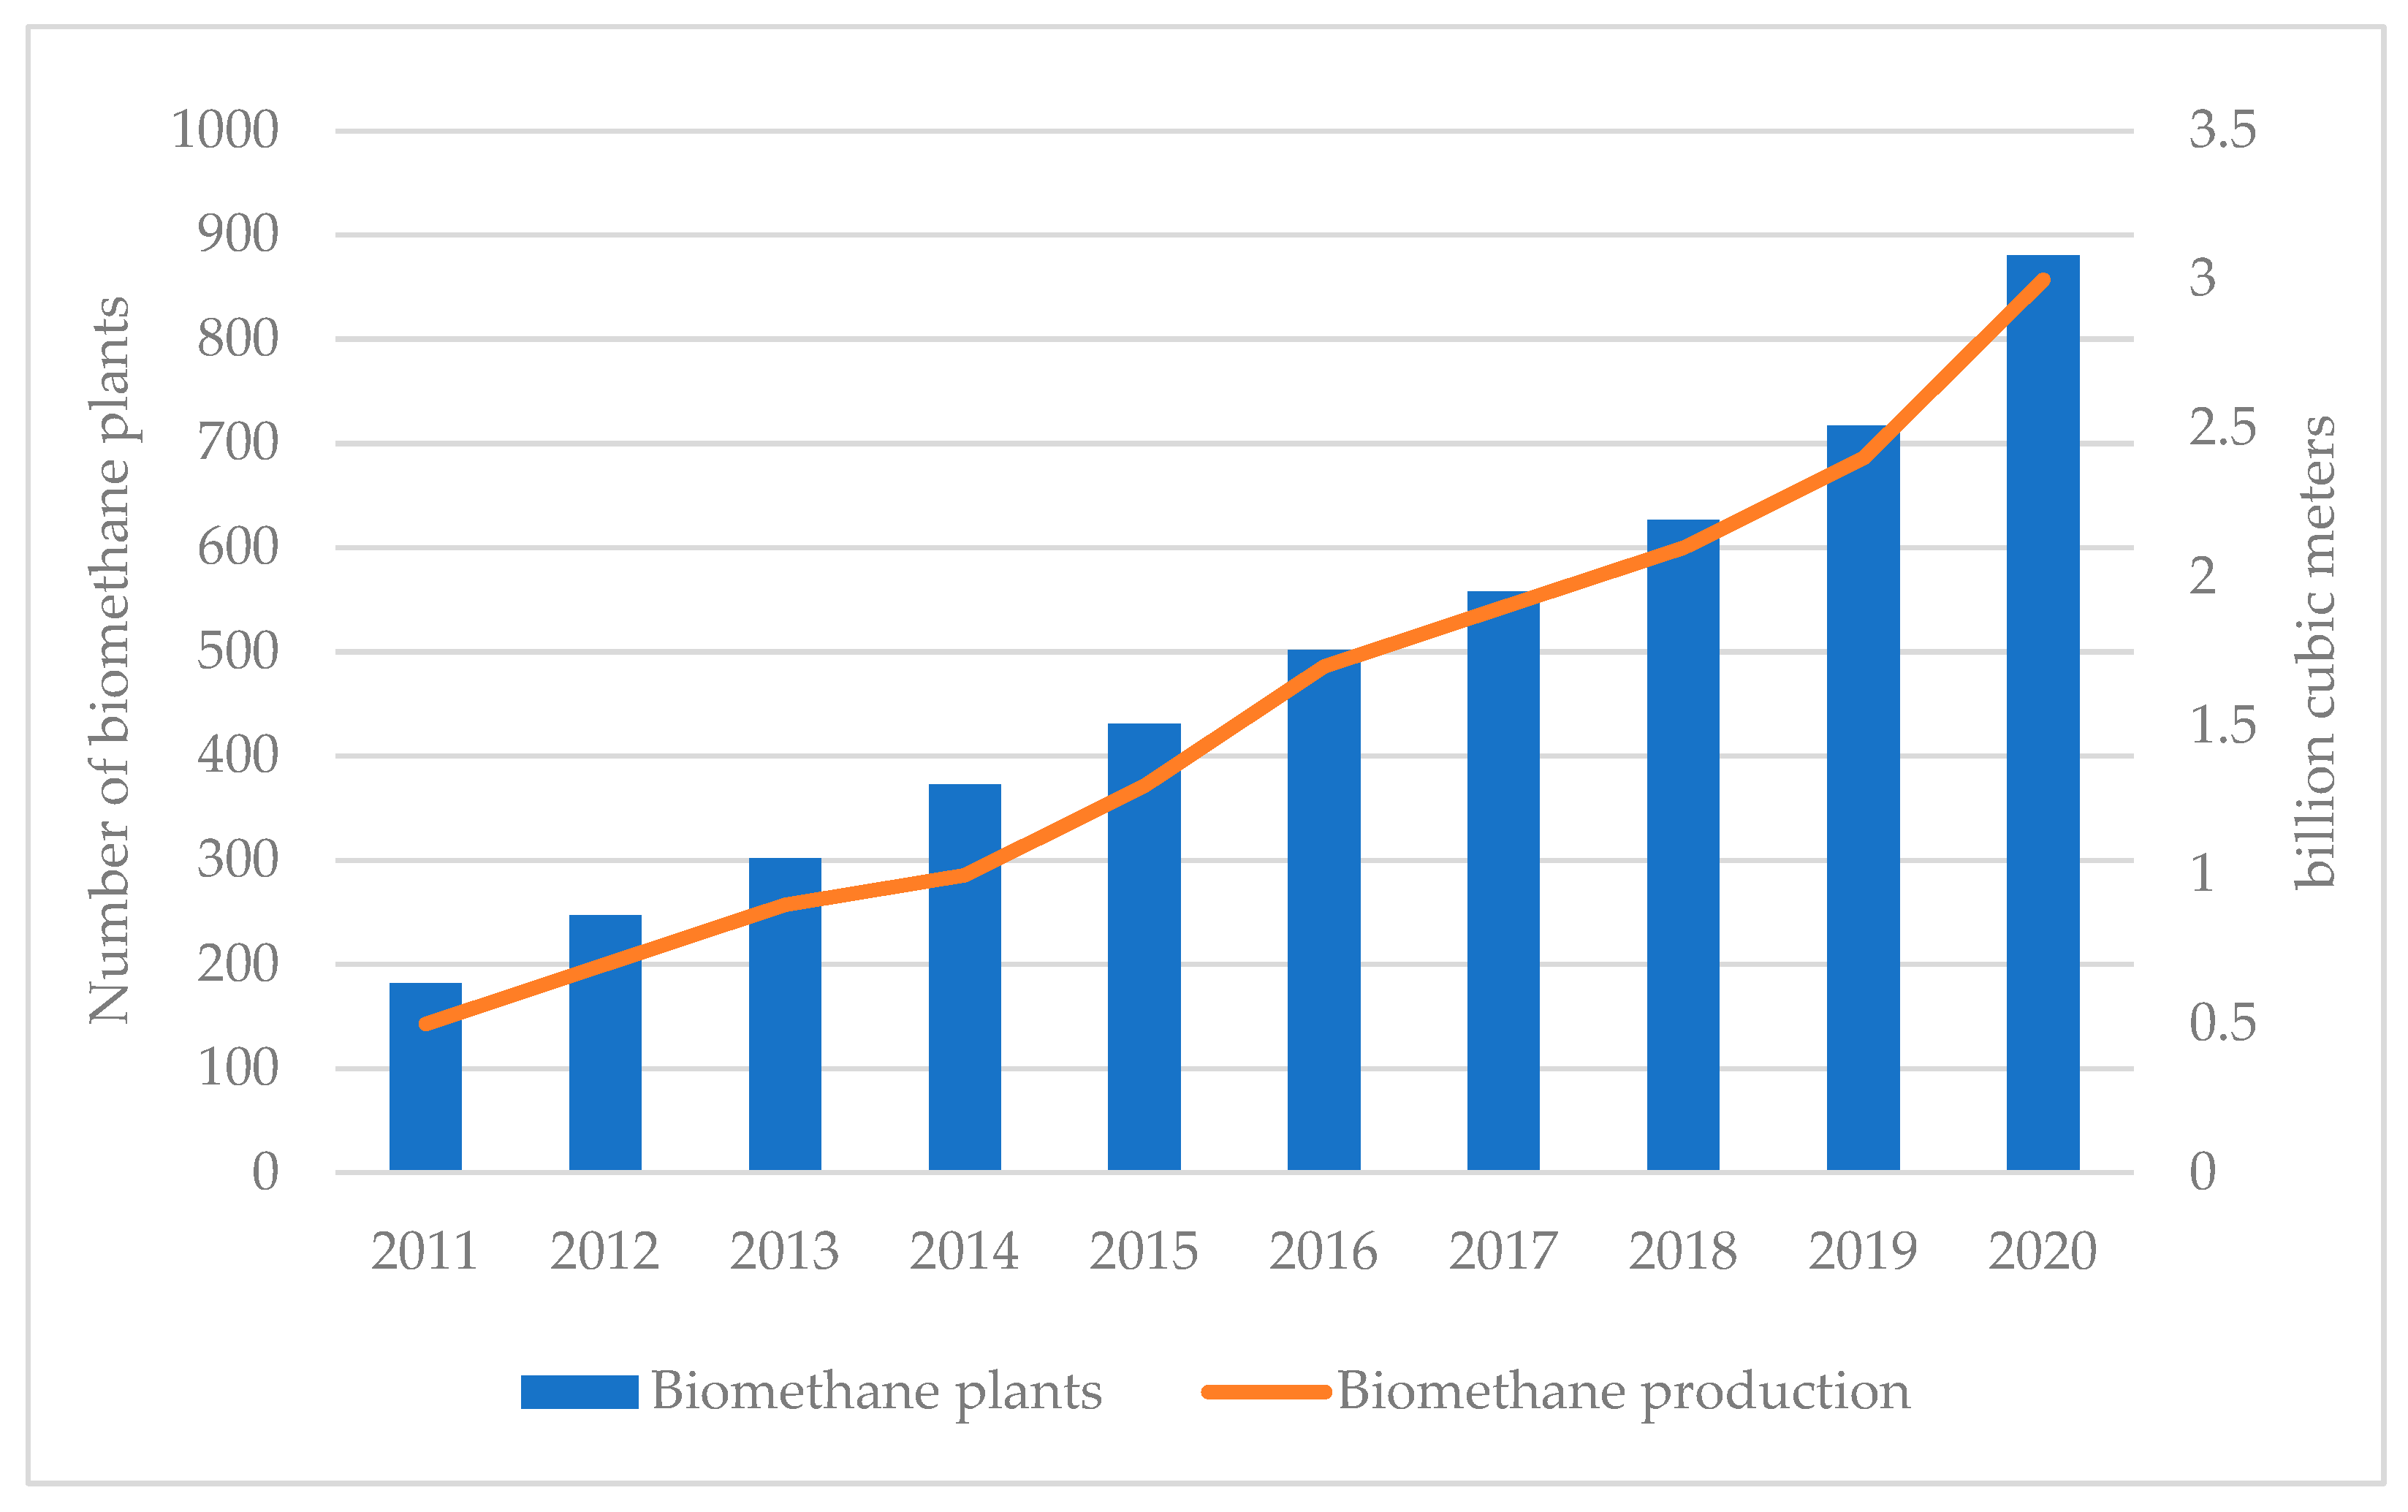
Figure 5.
Main producers of biomethane in EU (share in total numbers of biomethane plants and biomethane production). Source: own elaboration based on Jaro et al. [55] and EBA [82].

Figure 6.
The structure of biomethane upgrading methods. Source: own elaboration based on EBA [6].
Figure 6.
The structure of biomethane upgrading methods. Source: own elaboration based on EBA [6].

Figure 7.
Changes in the structure of newly commissioned biomethane plants in the EU by the main substrate in 2011–2022. Source: own elaboration based on EBA [6].
Figure 7.
Changes in the structure of newly commissioned biomethane plants in the EU by the main substrate in 2011–2022. Source: own elaboration based on EBA [6].

Figure 8.
The potential of biomethane production in the perspective of 2050 in EU countries and the UK. Source: own elaboration based on Alberici et al. and Birman et al., 2021 [25,69].
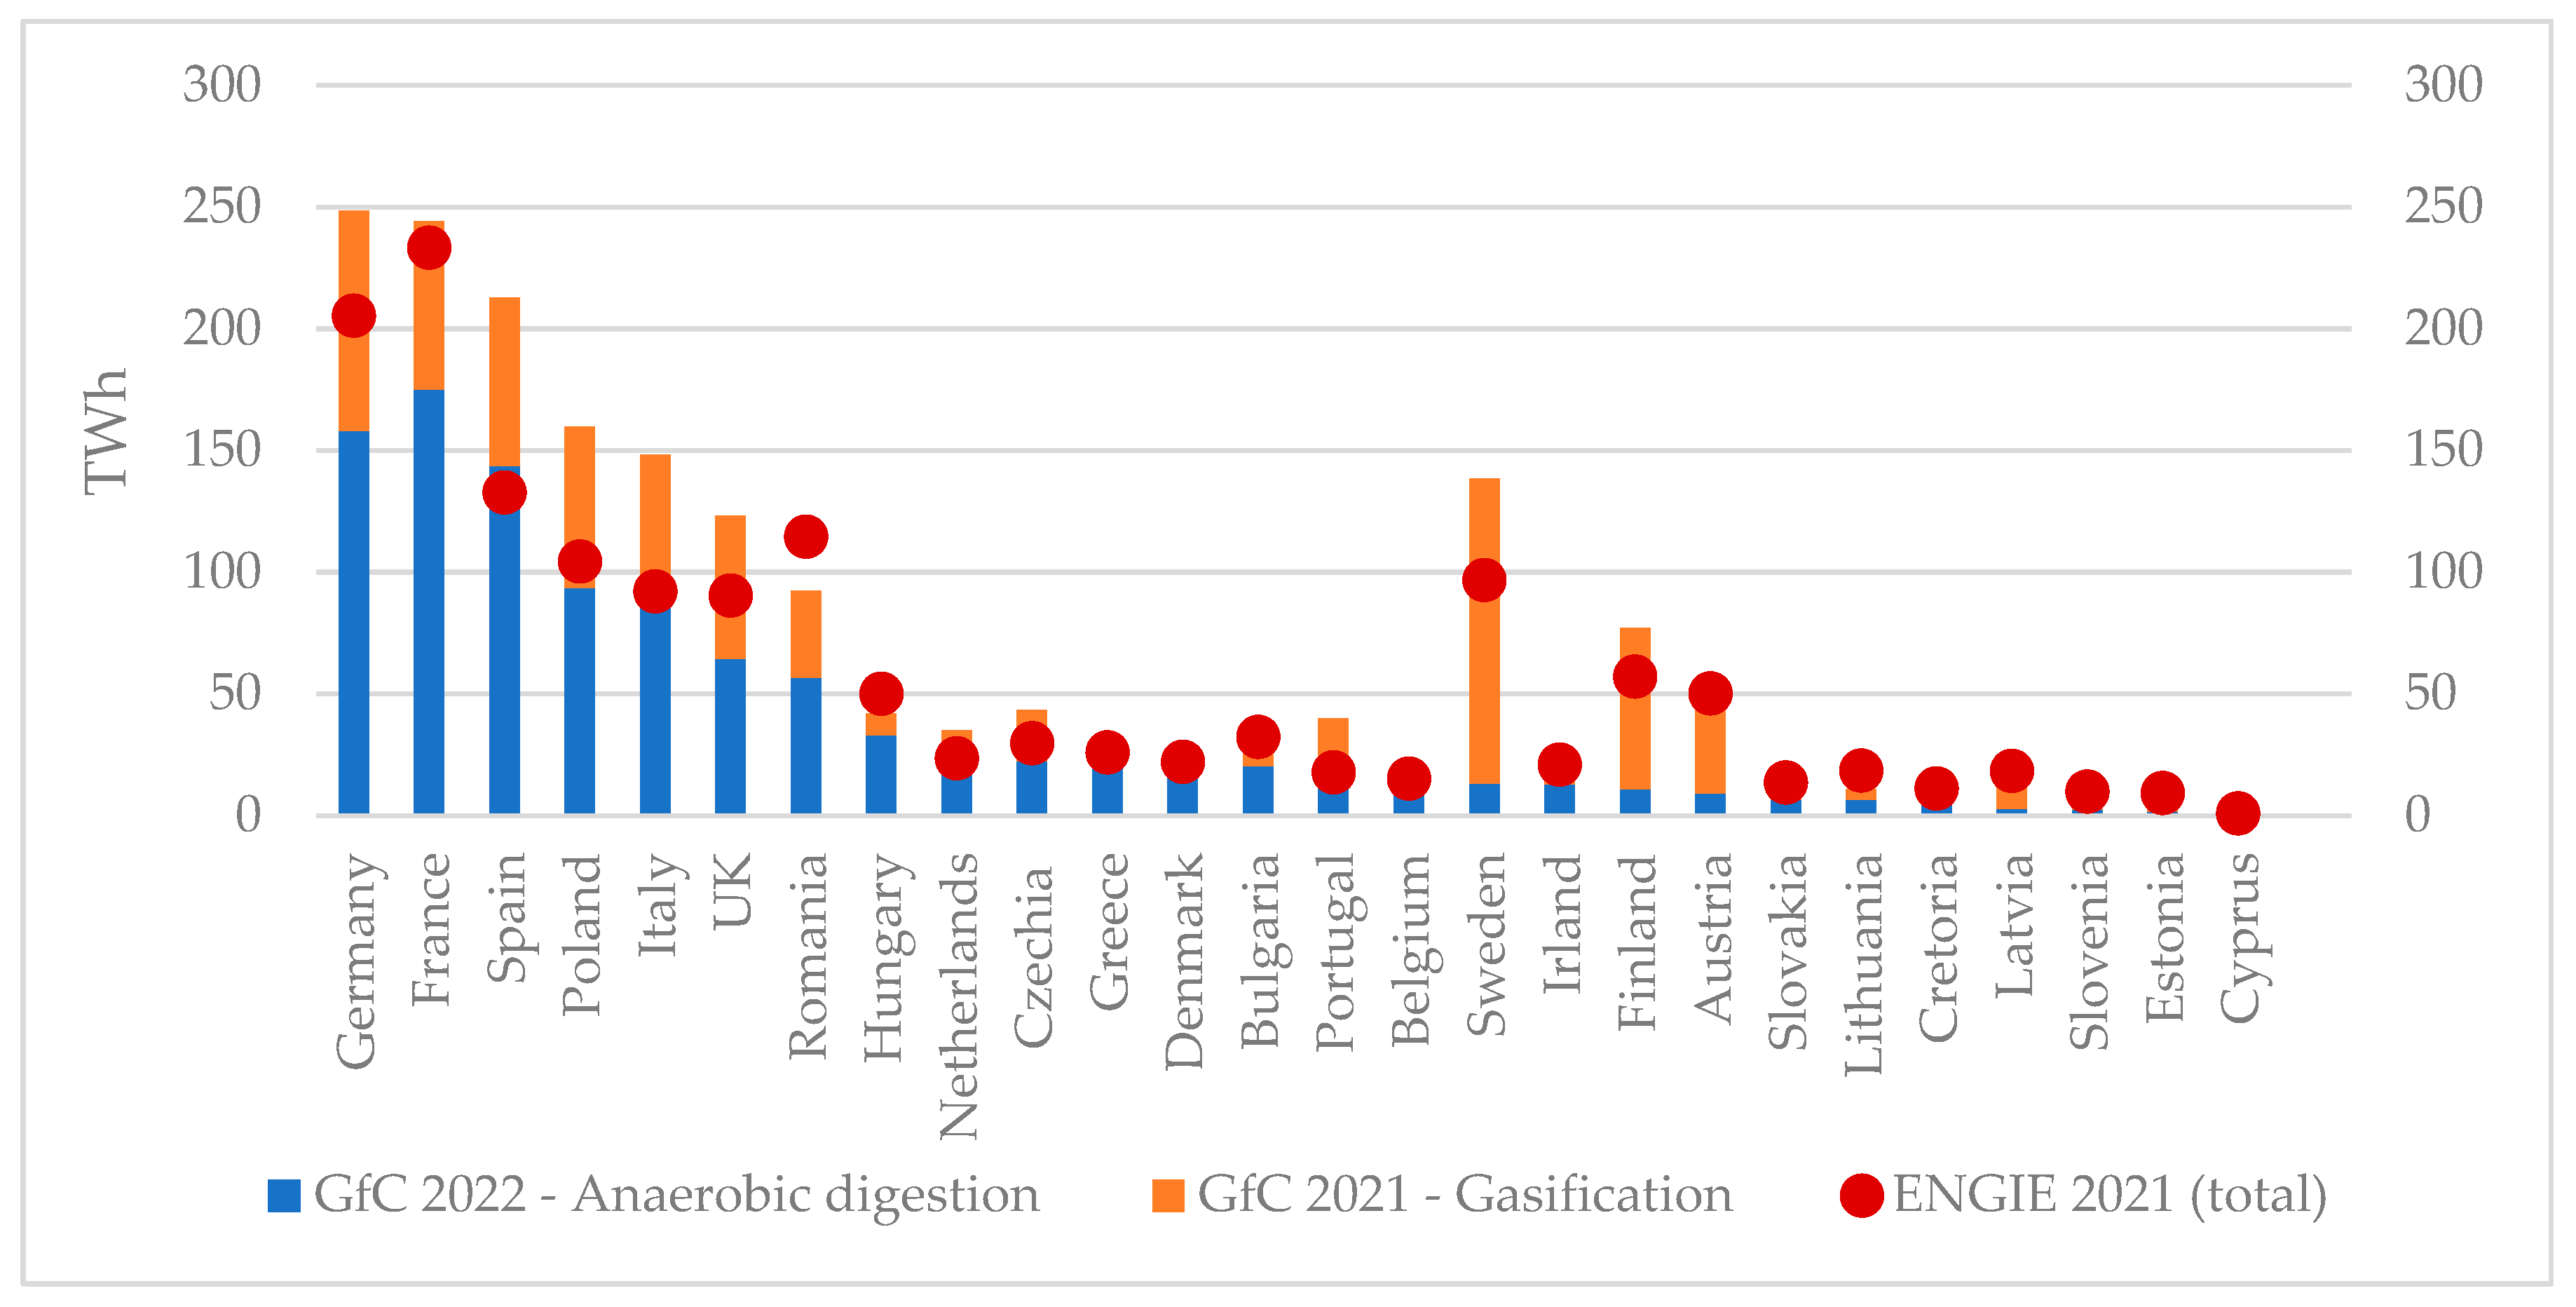
Figure 9.
Structure of theoretical potential of biomethane production from various categories of biomass in EU(+UK) in perspective 2050. Source: own elaboration based on Birman et al. [69].
Figure 9.
Structure of theoretical potential of biomethane production from various categories of biomass in EU(+UK) in perspective 2050. Source: own elaboration based on Birman et al. [69].
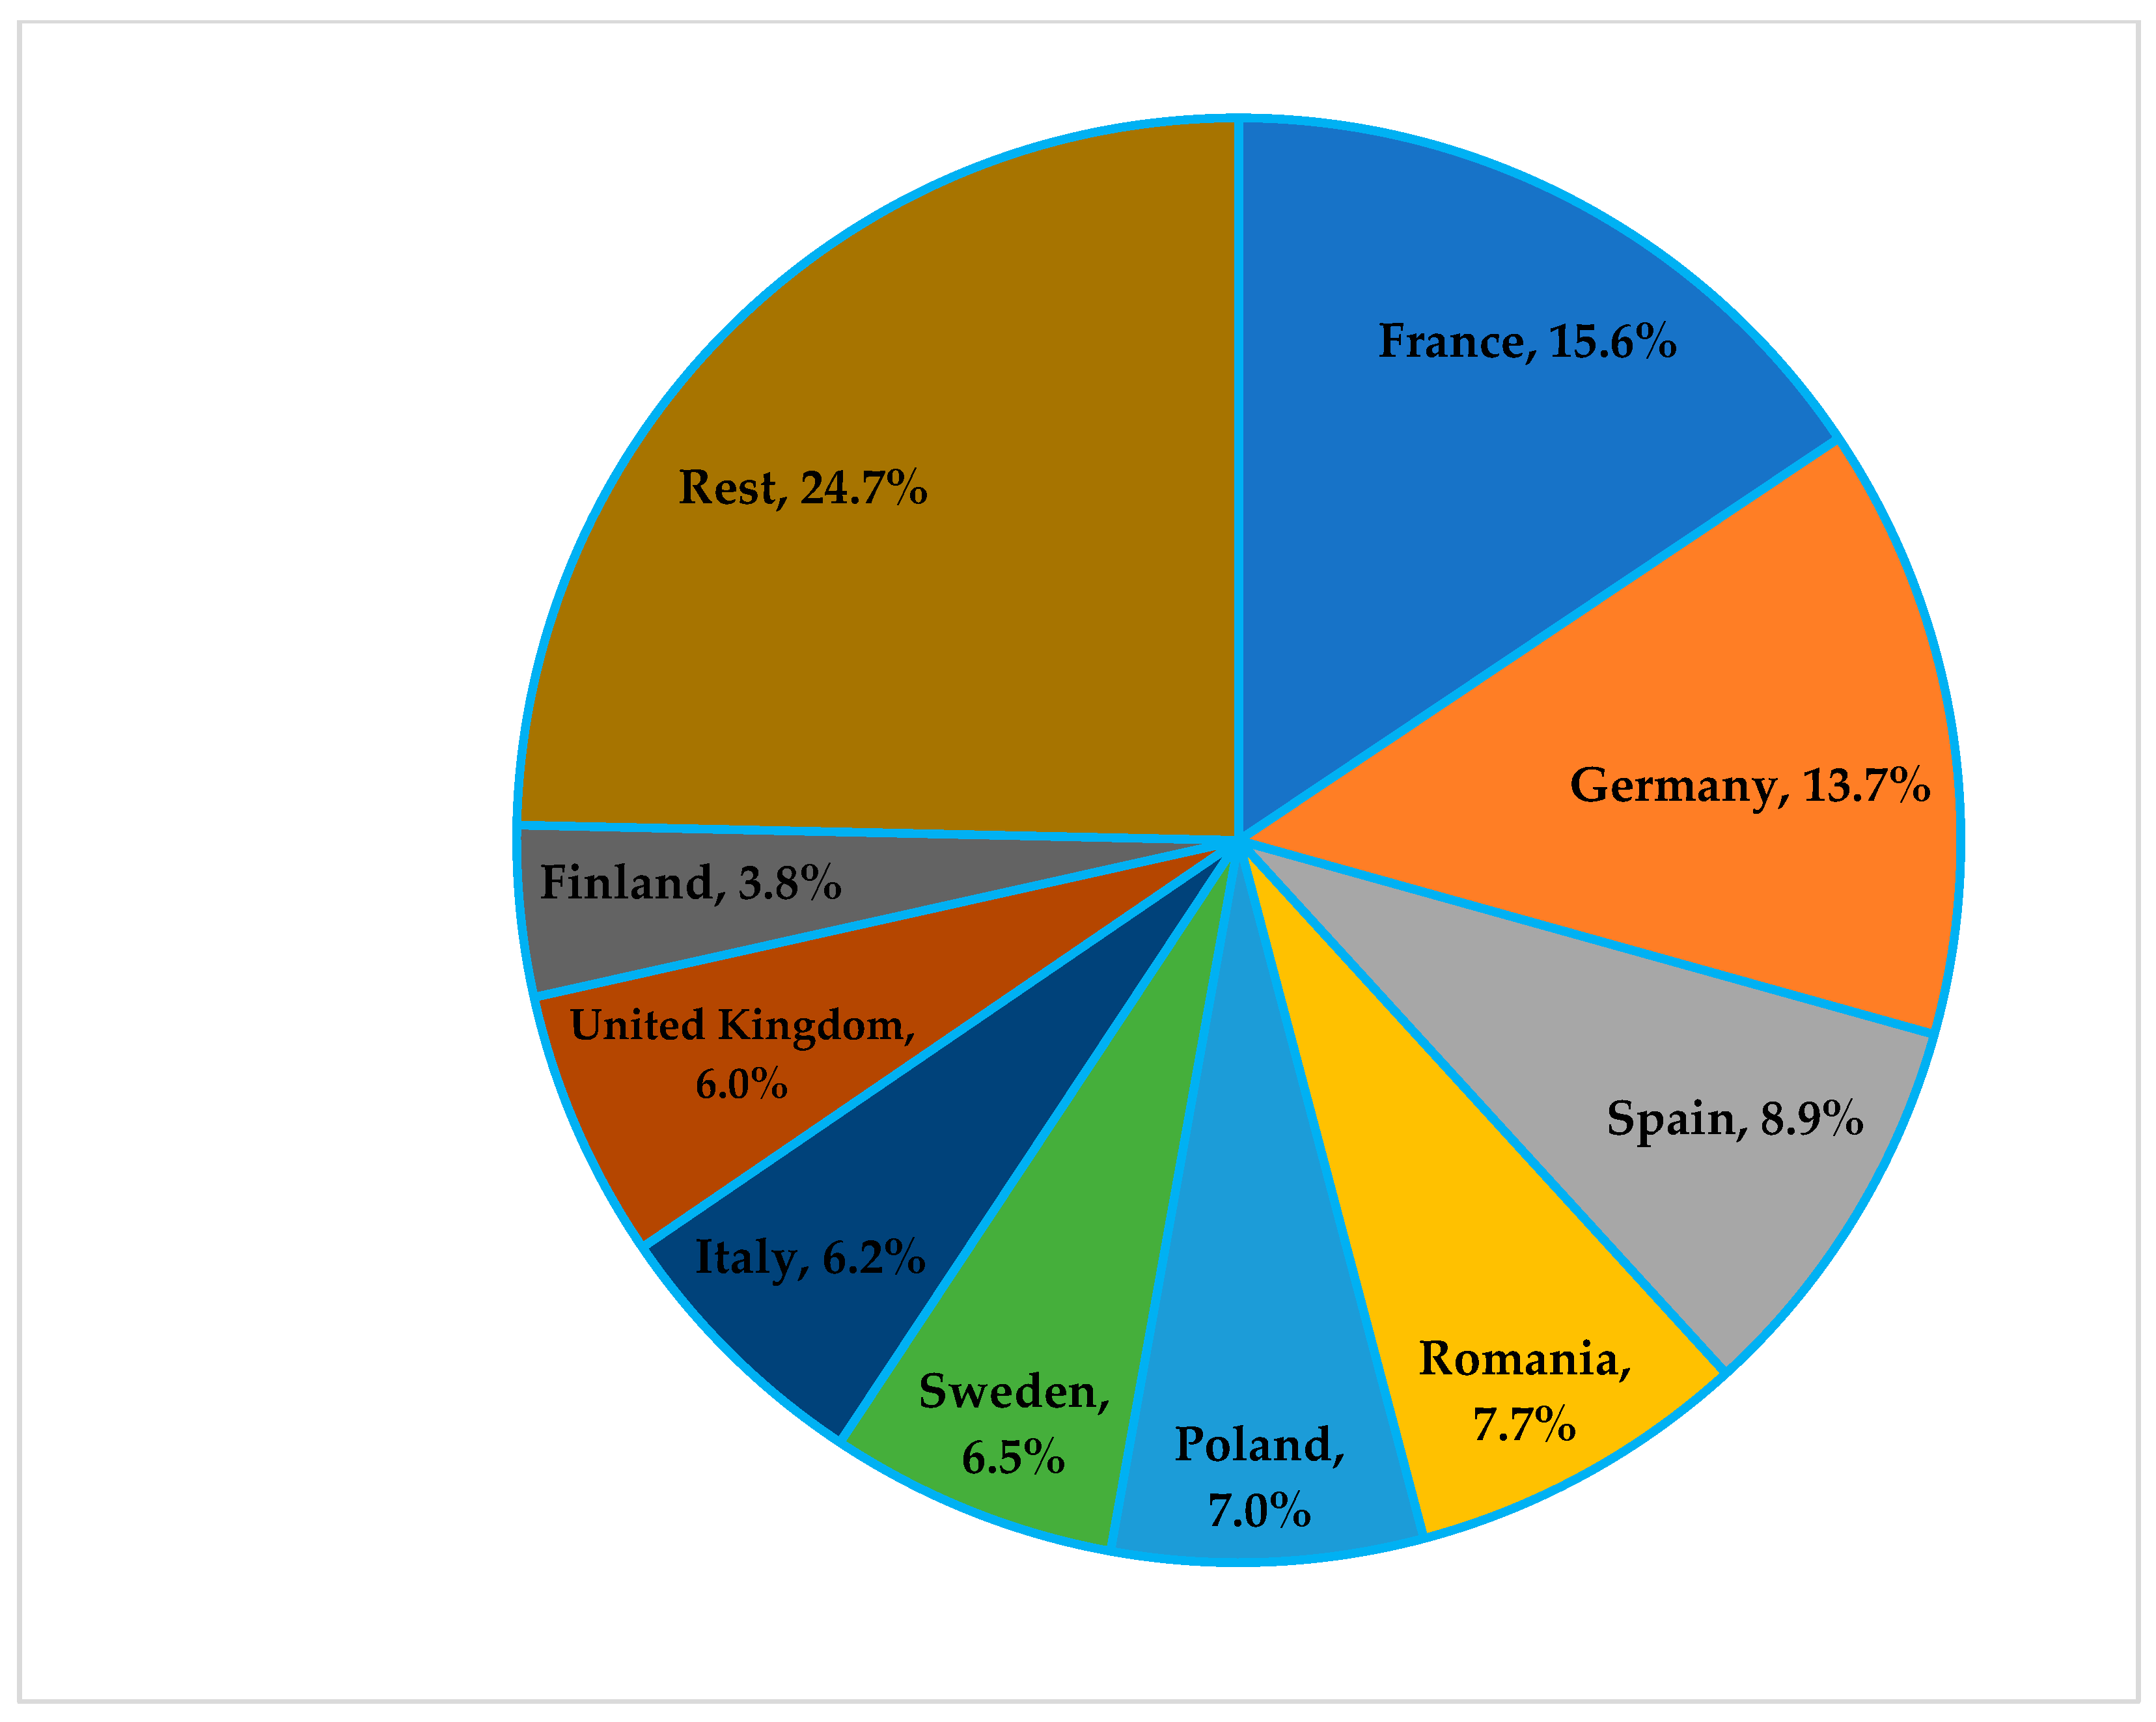
Figure 10.
The theoretical potential of biomethane production (TWh) from various categories of biomass in EU and UK in perspective 2050. Source: own elaboration based on Birman et al. [69].
Figure 10.
The theoretical potential of biomethane production (TWh) from various categories of biomass in EU and UK in perspective 2050. Source: own elaboration based on Birman et al. [69].

Figure 11.
The expected structure of demand for biomethane in 2030 and 2050 in the EU. Source: own elaboration based on Kate et al. and Terlouw et al. [56,85].
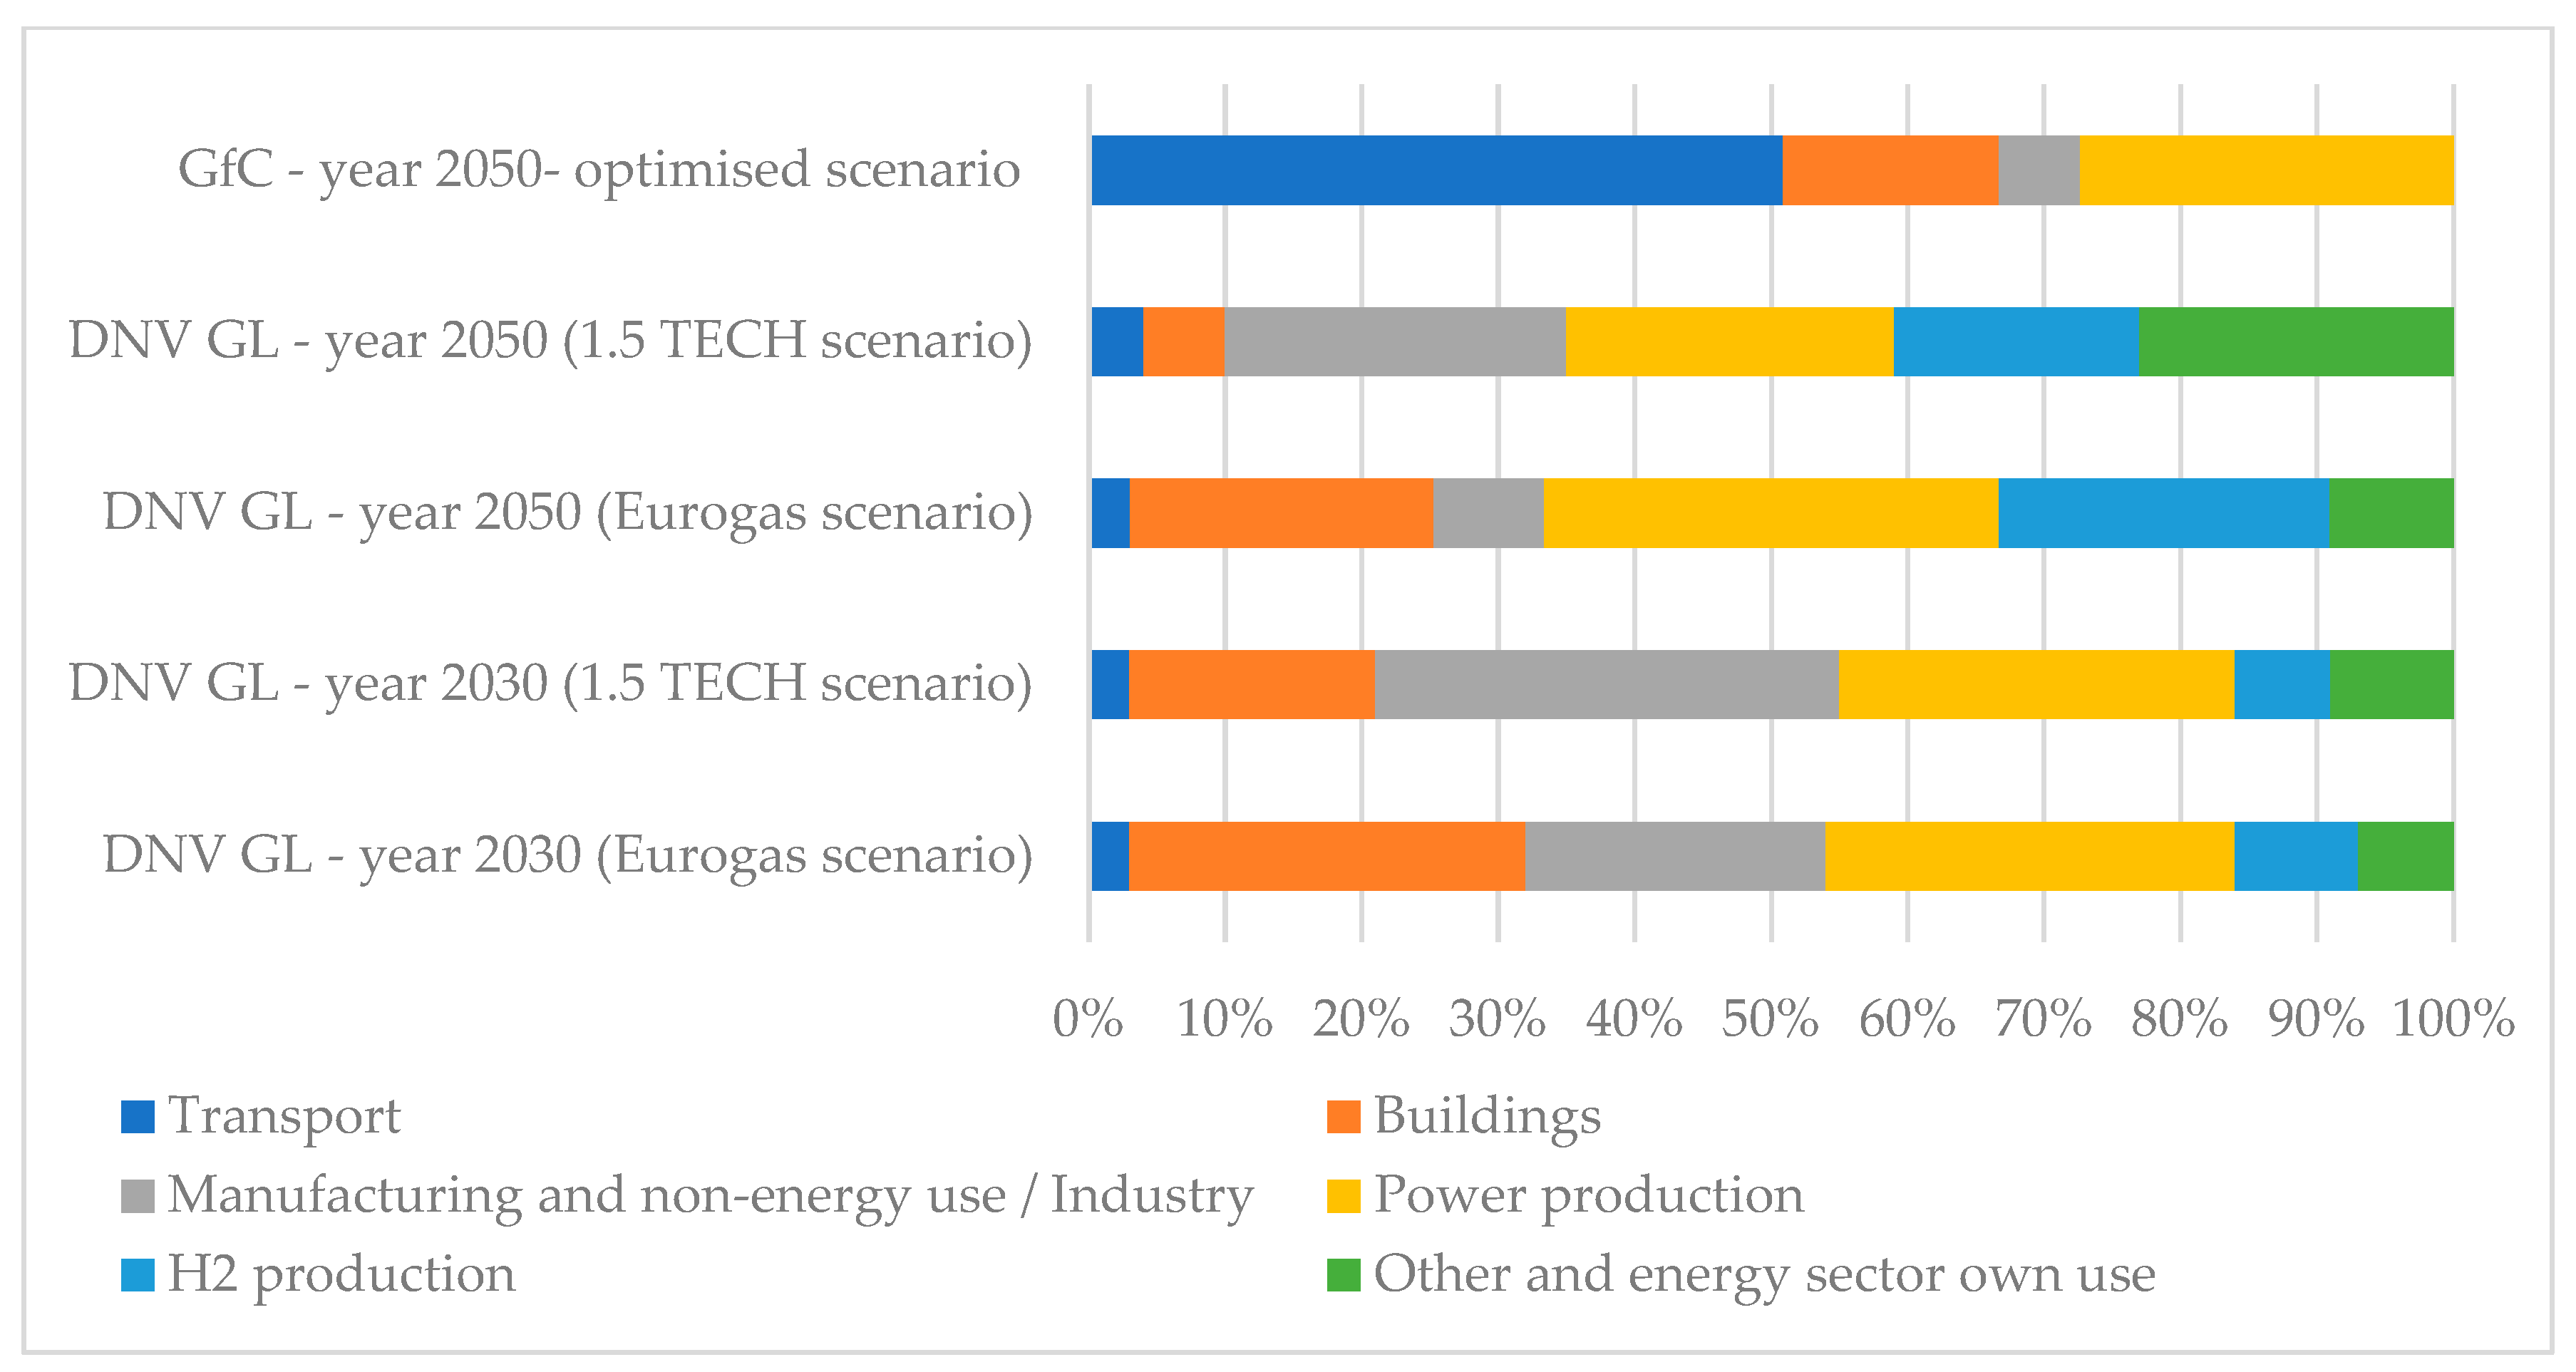
Figure 12.
Biomethane production’s economy of scale estimation—based on the BIOSURF 2016 project [101].
Figure 12.
Biomethane production’s economy of scale estimation—based on the BIOSURF 2016 project [101].
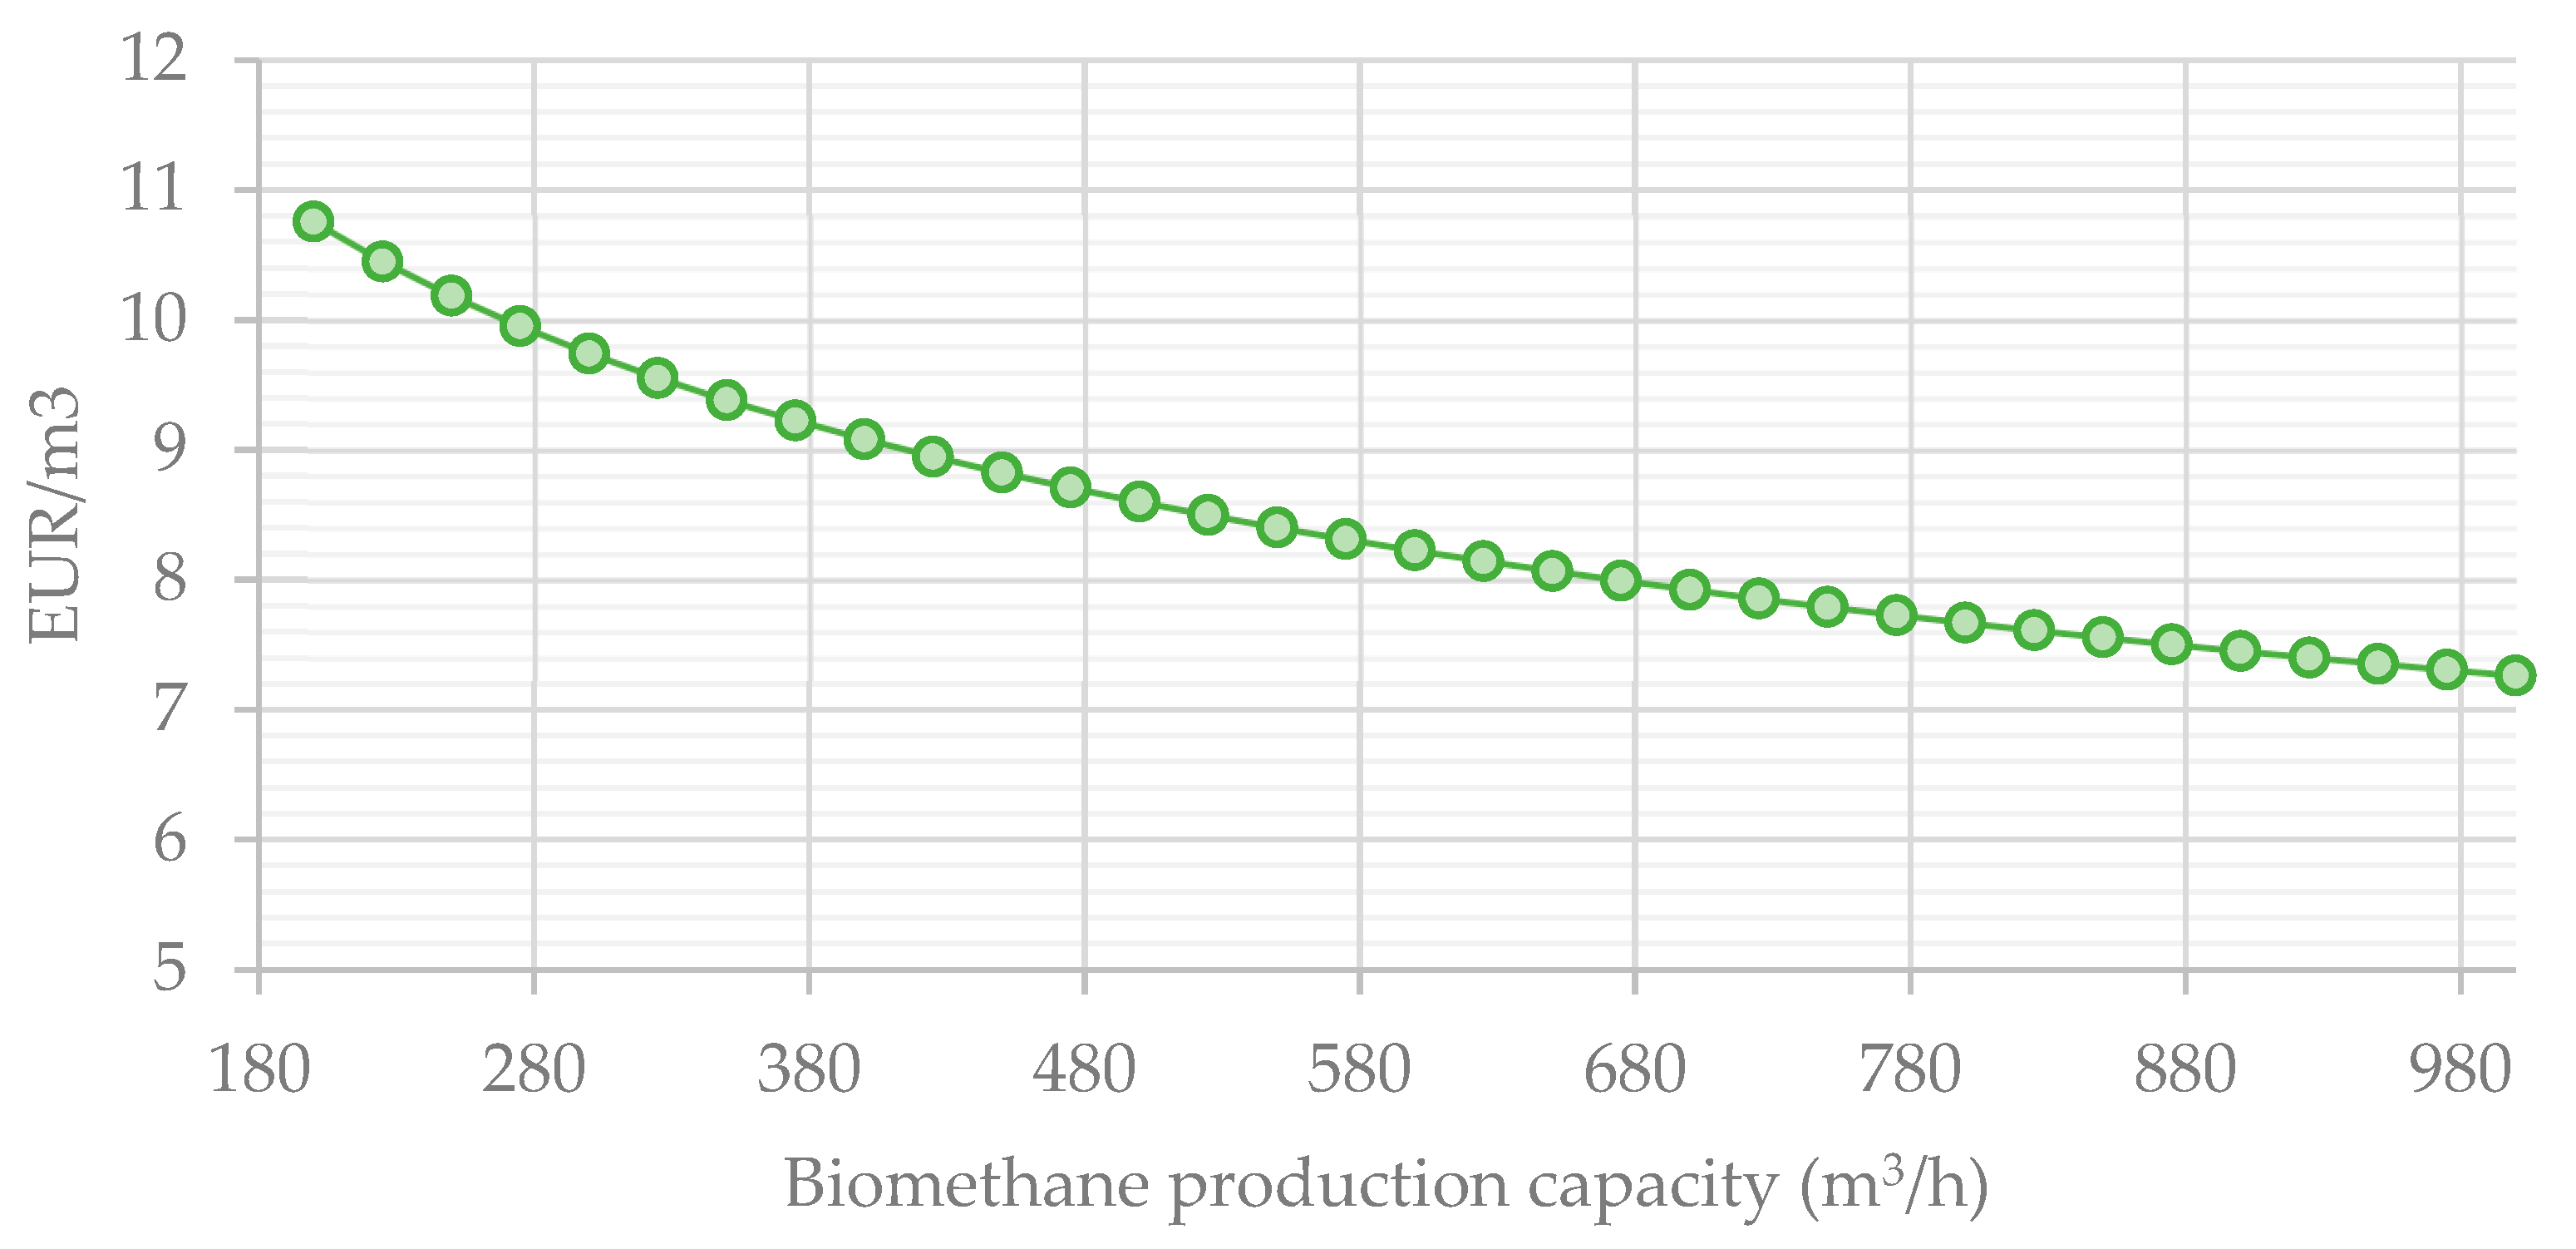

Figure 14.
Schemes of biomethane support systems. Source: Own elaboration based on Frishte et al., 2022 [5].
Figure 14.
Schemes of biomethane support systems. Source: Own elaboration based on Frishte et al., 2022 [5].
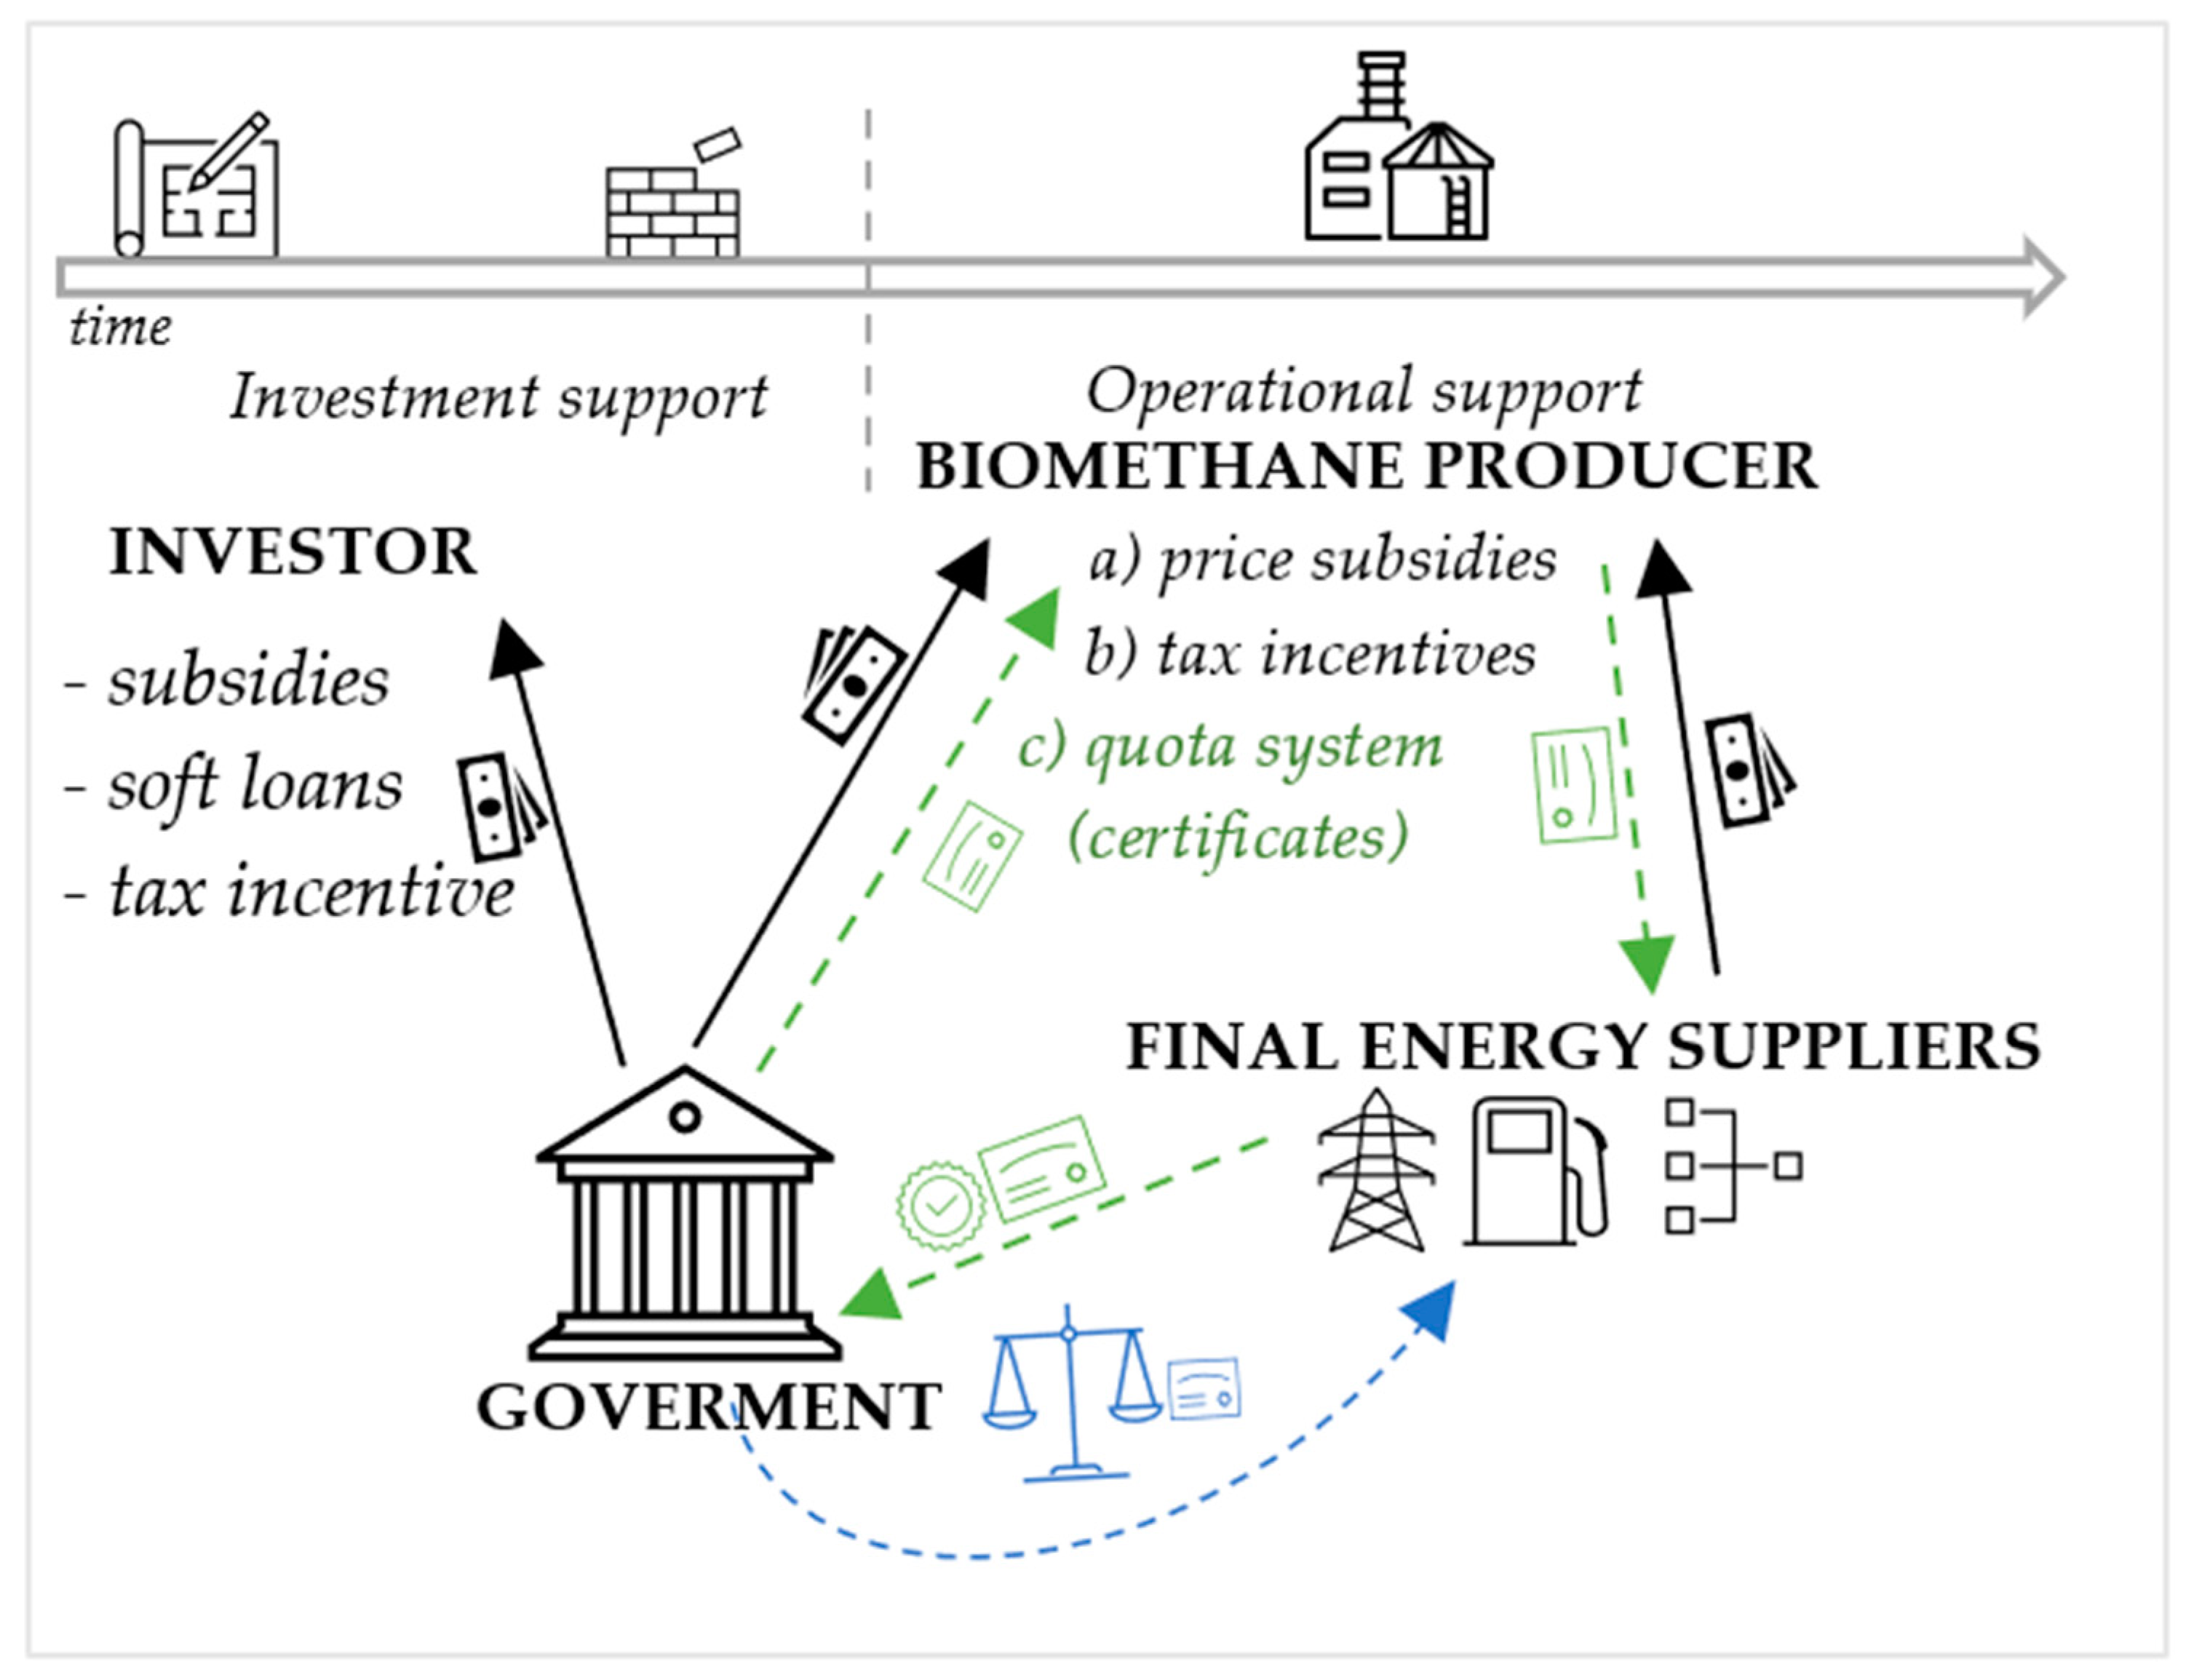
Figure 15.
Supply and demand side schemes of biomethane support systems. Source: own elaboration.

Table 2.
Comparison of different biogas upgrading technologies.
| Membrane Separation | Water Scrubbing | Organic Solvent Scrubbing | Chemical Scrubbing | PSA | Cryogenic | |
|---|---|---|---|---|---|---|
| The basis of the operation | Differences in the solubility and permeability of different gases through the membrane | Different solubility levels of gases in water | Different solubility levels of gases in an organic solvent | Amine-based solvent absorbs and chemically reacts with CO2 | CO2 adsorption with, e.g., activated carbon, zeolite, or silica gel | Different liquefaction and solidification temperatures |
| Consumption of raw biogas (kWh/Nm3) | 0.18–0.20 | 0.25–0.3 | 0.2–0.3 | 0.05–0.15 | 0.23–0.30 | 0.76 |
| Energy requirement | Medium | Medium | High | High | Medium | High |
| Heat demand (°C) | 55–80 | 120–160 | −110 | |||
| Final CH4 concentration (%) | 92–98 | 80–99 | >97 | 95–99 | 96–98 | 96–98 |
| CH4 losses (%) | 1–9 | 0.5–2 | 1–4 | <0.1 | 1–8 | 2 |
| Pre-purification | Recommended | Recommended | Recommended | Recommended | Recommended | Recommended |
| Operation pressure (bar) | 5–20 | 4–10 | 4–8 | 1.01325 | 3–10 | 80 |
| Cost | High | Medium | Medium | High | Medium | High |
| Other | Multiple modules are required for high efficiency | Biomethane drying is required | High energy needs for solvent regeneration | Possible reaction between O2 and amines, high corrosion rates | Complicated process control | Potential for producing liquefied biomethane |
| Share in the market (%) | 27 | 37 | 19 | 15 | 2 | |
Table 3.
Revision of the RED II Directive—a selected issue in the context of the biomethane market.
| Proposals | Significance for the Biomethane Market |
|---|---|
| RES share from 32 to 40% by 2030, The share of advanced biofuels and biogas (produced from Annex IX substrates) in total energy supplied to the transport sector is expected to be 2.2% in 2030) | Without a significant increase in the share of biomethane, targets in the heating and transport sectors will be difficult to meet [25,68] |
| 49% of energy use from renewable sources by 2030 in buildings; 1.1 p.p. annual increase in the use of RES in industry | Biomethane can be a valuable source of energy in the:
|
Strengthened sustainability criteria for biomass:
| Due to the woody biomass supply possible decrease, biogas upgrading might be a dominant biomethane-obtaining technology [10,56,69] |
Table 4.
Biomethane production potential in 2030 and 2050 summary of available reports.
| Source | Study/Scenario | Date of Publication | Biomethane Potential (TWh) | |
|---|---|---|---|---|
| 2030 | 2050 | |||
| Gas for Climate | Biomethane production potentials in the Member States and outlook to 2050. | 2022 | 404 | 1039 |
| Gas for Climate | The optimal role for gas in net-zero emissions energy system. Navigant. | 2019 | 370 | 1010 |
| CE Delft, Eclareon, Wageningen Research—“Growth Scenario” | Optimal use of biogas from waste streams. An assessment of the potential of biogas from digestion in the EU beyond 2020 | 2016 | 335 | - |
| CE Delft, Eclareon, Wageningen Research—“Accelerated growth scenario.” | Optimal use of biogas from waste streams. An assessment of the potential of biogas from digestion in the EU beyond 2020 | 2016 | 467 | - |
| EC—2030 | In-Depth Analysis In Support Of The Commission Communication COM (2018) 773. A Clean Planet for all A European long-term strategic vision for a prosperous, modern, competitive, and climate neutral economy | 2018 | 349 | - |
| EC—Energy Efficiency Scenario | In-Depth Analysis in Support of The Commission Communication Com(2018) 773. A Clean Planet for all A European long-term strategic vision for a prosperous, modern, competitive, and climate neutral economy | 2018 | - | 523 |
| EC—P2X scenario | In-Depth Analysis in Support of The Commission Communication COM(2018) 773 A Clean Planet for all A European long-term strategic vision for a prosperous, modern, competitive, and climate-neutral economy | 2018 | - | 919 |
| ENGIE | Geographical analysis of biomethane potential and costs in Europe in 2050 | 2021 | 1495 | |
| ICCT (The International Council on Clean Transportation) | What is the role of renewable methane in European decarbonization | 2018 | - | 382 |
| DNV-GL | European Carbon Neutrality: The importance of Gas. A study for Eurogas. | 2020 | - | 1008 |
| IEA | Outlook for biogas and biomethane. Prospects for organic growth—year 2040 | 2020 | - | year 2040: 1248 (EU); 1700 (total Europe) |
| Centre on Regulation in Europe | Future markets for renewable gases and hydrogen. What would be the optimal regulatory provisions? | 2019 | ~1300 TWh (without indication-specific year) | |
Table 5.
CAPEX and OPEX components in the biomethane production process.
| CAPEX | OPEX |
|---|---|
1. Biomethane production
| 1. Biomethane production
|
Table 6.
AD plant investment and capital cost level concerning the production scale of biomethane.
| Production Scale (Nm3/h) | Average Investment Cost MEUR2015 | Capital Cost Level (EUR2015/MWh of Production) |
|---|---|---|
| Small (to 500) | ≈1.5 | 25–35 |
| Medium (500–800) | 3.10–5.86 2.8–4.3 | 20 |
| Large (above 800) | 7.5–9.89 | 15 |
Table 7.
Estimated relation between biogas input flow (m3/h) and specific investment costs (EUR/m3/h).
Table 7.
Estimated relation between biogas input flow (m3/h) and specific investment costs (EUR/m3/h).
| Biogas Upgrading Method | The Equation for Calculation of the Specific Investment (x—Biogas Input Flow in m3/h; y—Investment Cost in EUR | R Squared |
|---|---|---|
| Water scrubbing | y = 980,693x−0.991 | 0.86 |
| Amine scrubbing | y = 239,254x−0.696 | 0.99 |
| Membrane separation | y = 81,046x−0.534 | 0.98 |
| Physical scrubbing | y = 980,693x−0.991 | 0.86 |
| Pressure swing adsorption | y = 185,034x−0.67 | 0.98 |
Source: Paturska A. et al. [109].
Table 8.
CAPEX and OPEX of biogas upgrading by technology and scale of production (measured by capacity).
Table 8.
CAPEX and OPEX of biogas upgrading by technology and scale of production (measured by capacity).
| Upgrading Technology | Capacity (Nm3 CH4/h) | CAPEX (EUR/(Nm3 CH4/h)) | OPEX (EUR/(Nm3 CH4/h)) | Source | Comments |
|---|---|---|---|---|---|
| Water scrubbing | 2000–~100 | ~1000–5000 | n.d. | Vo et al., 2018 | - |
| 80 | 2300 | 1750 | Stürmer et al. 2016 | including injection | |
| 500 | 734 | 1026 | Stürmer et al. 2016 | including injection | |
| Amine scrubbing | 800 | 1936 | n.d. | Vo et al., 2018 | - |
| ~600–~1800 | ~3200–1800 | n.d. | Vo et al., 2018 | - | |
| 80 | 2038 | 1862.5 | Stürmer et al. 2016 | including injection | |
| 500 | 832 | 1376 | including injection | ||
| Membrane separation | 80 | 1812.5 | 1750 | including injection | |
| 500 | 798 | 1324 | including injection | ||
| Pressure swing adsorption | 80 | 2237.5 | 1512.5 | including injection | |
| 500 | 826 | 1114 | including injection | ||
| Biological metanation | 800 | ~3900 | - | Vo et al., 2018 | - |
| Amine + biological Methanation | 800 | ~5000 | - | Vo et al., 2018 | - |
Disclaimer/Publisher’s Note: The statements, opinions and data contained in all publications are solely those of the individual author(s) and contributor(s) and not of MDPI and/or the editor(s). MDPI and/or the editor(s) disclaim responsibility for any injury to people or property resulting from any ideas, methods, instructions or products referred to in the content. |
© 2023 by the authors. Licensee MDPI, Basel, Switzerland. This article is an open access article distributed under the terms and conditions of the Creative Commons Attribution (CC BY) license (https://creativecommons.org/licenses/by/4.0/).
Share and Cite
MDPI and ACS Style
Sulewski, P.; Ignaciuk, W.; Szymańska, M.; Wąs, A. Development of the Biomethane Market in Europe. Energies 2023, 16, 2001. https://doi.org/10.3390/en16042001
AMA Style
Sulewski P, Ignaciuk W, Szymańska M, Wąs A. Development of the Biomethane Market in Europe. Energies. 2023; 16(4):2001. https://doi.org/10.3390/en16042001
Chicago/Turabian StyleSulewski, Piotr, Wiktor Ignaciuk, Magdalena Szymańska, and Adam Wąs. 2023. "Development of the Biomethane Market in Europe" Energies 16, no. 4: 2001. https://doi.org/10.3390/en16042001
Note that from the first issue of 2016, this journal uses article numbers instead of page numbers. See further details here.