Article

Comparison on Hydraulic Characteristics of Vertical and Horizontal Air-Cushion Surge Chambers in the Hydropower Station under Load Disturbances

1
College of Water Conservancy and Hydropower Engineering, Hohai University, Nanjing 210098, China
2
Department of Civil and Environmental Engineering, University of Alberta, Edmonton, AB T6G 1H9, Canada
*
Authors to whom correspondence should be addressed.
Energies 2023, 16(3), 1501; https://doi.org/10.3390/en16031501
Submission received: 9 January 2023 / Revised: 23 January 2023 / Accepted: 27 January 2023 / Published: 2 February 2023
(This article belongs to the Special Issue Advanced Modeling and Control of Hydropower Generation Systems)

Abstract

:
Hydroelectric energy is an increasingly vital and effective renewable energy for modern society. The protective effect on the water hammer in the pipeline, the operational stability of the hydropower system, and the flow regime in the air-cushion surge chamber (ACSC) are three main problems during the design of the hydropower station with an ACSC. Comprehensively comparing the above issues between the horizontal and vertical ACSCs is meaningful. This study established the one-dimensional (1D) model based on the Method of Characteristics (MOC) under large load disturbances (LLD) and the rigid water column theory under small load disturbances (SLD). At the same time, the three-dimensional (3D) model was built based on the Volume of Fluid (VOF) to obtain a more detailed flow regime in the ACSC under the load acceptance condition. The results showed that the vertical ACSC was superior to the horizontal one for its large safe water depth, smaller maximum air pressure, and more stable flow under LLD. In contrast, the horizontal one was better than the vertical one for its extensive water area to calm the SLD during the transient process and smaller fluctuation of the surge under SLD. This study will provide a reference for a future project on selecting the structure of the ACSC.

1. Introduction

With renewable and sustainable energy development, hydroelectric energy is still playing an important role in modern society. Water hammer protection is an essential issue in the design and construction of the hydropower system. The air-cushion surge chamber (ACSC) is the most effective way to restrain the water hammer pressure rise in the pipeline and the water level fluctuation in hydropower stations or pump stations [1,2,3]. The ACSC is also called the pressured air vessel, the closed surge tank, or the pneumatic tank. It could be placed near the factory building for easy maintenance and management [4,5].
Generally, there are many structures of the ACSC. According to the different ways of installation, the ACSC could also be divided into vertical and horizontal types. The vertical ACSC commonly has a uniform cross-section, while the horizontal has a non-uniform cross-section. The horizontal ACSC could be placed under the ground and has advantages in convenient construction, easy maintenance, high safety and stability, and good thermal insulation performance. However, it also has disadvantages in increased excavation and cost growth [6,7]. Sun et al. [8] considered the connecting configuration of vertical and horizontal ACSCs. They proposed an optimal design of the ACSC based on sequential quadratic programming. However, they did not compare the vertical and horizontal ACSCs under the same connecting configuration. Different structures have the different cross-sectional area, air volume, and air–water ratio, which will influence the protective effects on the water hammer [9,10]. As a result, it is meaningful to consider the influence of the vertical and horizontal ACSCs. However, there are few papers on whether the vertical ACSC has a different effect from the horizontal ACSC on the protective effects on the water hammer.
The stability of water level fluctuation is the most crucial issue in the hydraulic design of ACSC. Chaudhry et al. [11] investigated the stability of the hydropower system under large and small load disturbances. They provided two conditions to determine the critical area and air volume of the ACSC. Guo et al. [12] established the mathematical model of the waterpower-speed control system for a hydropower station with an ACSC. They found that the stability improved with the increased chamber height and area and the decreased air pressure and the exponent index. The round-shaped ACSC with the same cross-section had better hydraulic performance due to the smaller amplitude of surge, the smaller maximum gas pressure, and the smaller maximum pressure at the outlet of the spiral case [13]. Because the ACSC parameters influence the critical area and the system stability of the hydropower station, it is meaningful to study the influence of the different structures of the ACSCs on the stability. However, whether the vertical and horizontal ACSC affect the operational stability under small load disturbances (SLD) is unknown.
Moreover, some complex flow regime, such as the air-trapped vertical vortices, occurs during the large load acceptance conditions, which should be avoided for the safe operation of the hydropower station. The air-trapped vertical vortices in the surge chamber were simulated based on the three-dimensional (3D) model, and they would not be formed due to the sufficient water depth [14,15]. Although 3D simulations to study the flow regime in an open surge chamber are not surprising, little research has been conducted on the ACSC. Most research on hydraulic transients in the piping system equipped with the ACSC was based on a one-dimensional (1D) model solved by the Method of Characteristics (MOC) [16,17,18]. One-dimensional simulations could not reflect the flow regime in the ACSC or precisely simulate a transient flow with an air pocket. Unlike the open surge chamber, the compressed high-pressure air in the ACSC makes the situation more complex. High-pressure air can be brought into the pipeline if the safe water depth is not sufficient, which can cause a more dangerous accident. As a result, Besharat et al. [19] studied the transient two-phase flow in a pipe system with an ACSC based on 2D simulation. They illustrated that the Volume of Fluid (VOF) model and the realizable k-ε turbulence model presented good prediction performance for the air–water interface. Xia et al. [20] established a 3D VOF model to optimize the shape of a long corridor-shaped ACSC, where the open channel waves were superimposed on the mass fluctuation waves. Because the flow regimes in different ACSC types may vary under large load disturbances (LLD), it is necessary to simulate both the vertical and the horizontal ACSCs based on a 3D model, considering the 3D flow regime when selecting a suitable ACSC structure for the pipeline system.
Motivated by these reasons, the selection of the ACSC should be judged by thoroughly considering the safe water depth, the flow regime under LLD, and the stability of the hydropower system under SLD. Therefore, in this paper, the vertical and horizontal ACSCs in a hydropower station were compared comprehensively based on the 1D model solved by the Method of Characteristics and the rigid water column theory, as well as the 3D numerical simulation based on the Volume of Fluid. The main contribution of this research was to evaluate the influence of two ACSCs during hydraulic transients and then provide a reference for selecting ACSCs in the practical engineering project. The structure of this paper is as follows: Firstly, both 1D and 3D mathematical models are set up. Secondly, the background materials and specific scenarios are introduced. Thirdly, the vertical ACSC is compared with the horizontal ACSC on the surge fluctuation, the pressure variation, and the flow regime based on 1D and 3D simulations. Finally, the conclusions are listed for the suggested selection of ACSCs.

2. Mathematical Model

2.1. One-Dimensional Model

For the safe operation of the hydropower station, the most dangerous conditions occur under the LLD condition, including rejecting or accepting loads instantly. At the same time, it is also essential to evaluate the stability of the hydraulic–mechanical–electric coupled system in a hydropower station under the SLD condition. As a result, a 1D mathematical model under LLD and SLD conditions was set up to obtain the simulation results during hydraulic transients of the hydropower station with an ACSC, respectively. Then, the difference in the variation of the operation characteristics between vertical and horizontal ACSCs was compared.
Firstly, the 1D mathematical model under the LLD condition was based on the Method of Characteristics. The water hammer equation in the pipeline is shown by Formulae (1) and (2) [4]:
v t + g H x + v v x + f 2 D v v = 0
H t + v H x + a 2 g v x = 0
where v is the pipe velocity; g is the acceleration of gravity; H is the water head of pressure;   f is Darcy–Weisbach friction coefficient;   D is the diameter of the pipeline; a is water hammer wave velocity;   x is the distance; and t is the time.
The governing equations of unsteady flow in the transition process of the diversion system of a hydropower station with an ACSC consist of the dynamic equation as shown by Formula (3), the continuity equation as shown by Formula (4), and the gas state equation as shown by Formula (5) [11]:
H 0 + p a γ = Z + p γ + h w + L g d v d t
v A + F d Z d t = Q T
P m = C
where H 0 is the reservoir water level (relative to the bottom elevation of the ACSC);   p a is the atmospheric pressure; p is the absolute air pressure in ACSC; γ is the bulk density of water; Z is the fluctuation water level of the surge chamber;   h w is the head loss along the pipe; F is the section area of the ACSC; Q T is the reference flow rate of the turbine;   A is the section area of the pipe; is the air volume in the chamber; m is the exponent index of the ideal gas, m = 1.0 for isothermal processes and m = 1.4 for adiabatic processes; and   C is the control constant of the ACSC during operation.
Secondly, the mathematical model of SLD was based on the rigid water column theory. It was assumed that:
  • The inertia of the water body in the chamber was ignored;
  • The turbine efficiency remained constant in the process of fluctuation;
  • The power station ran separately.
The flow rate, speed, power, and equations of motion of the hydro-turbine are as shown by Formulae (6)–(9) [21]:
Q t = D 2 Q t H
n = n H D
P t = 9.81 η Q H
I d w d t = m t m g
where Q t is the discharge; D is the diameter of the runner; P t is power; η is efficiency; n is rotational speed; H is the head across the turbine; Q t is the unit discharge; n is the unit speed; I is the moment of inertia of the unit; w is its rotational speed; and m t   and   m g are its dynamic torque and resistance, respectively.
b t + b p T d d μ d t + b p μ = T d T n d φ 2 d t 2 T n + T d d φ d t φ
where b p ,   b t ,   T d ,   and   T n are the permanent drop in speed, the temporary drop in speed, the dashpot time constant, and the time constant of the promptitude of the governing equation, respectively. φ and μ are dimensionless variables of speed and torque, respectively.

2.2. Three-Dimensional Model

Because the 1D model could not reflect the flow regime in the ACSC during the transition process, a 3D model of the flow regime in the ACSC during the transition process was established to provide the additional evaluation. The 3D simulation object was the ACSC of a hydropower station.
In this study, governing equations were used to describe CFD calculation by conservation law, continuity equation, Navier–Stokes equation, energy equation, and state equation for numerical simulation and solution [20].
As for the turbulence model, the calculation was based on RNG k-ε viscous model, as shown by Formulae (11) and (12):
ρ k t + ρ k u i x i = x j α k μ e f f k x j + G k + ρ ε
ρ ε t + ρ ε u i x i = x j α ε μ e f f ε x j + C 1 ε * ε k G k C 2 ε ρ ε 2 k
where μ e f f = μ + μ t ,   μ t = ρ C μ k 2 ε ,   C μ = 0.0845 ,   α k = α ε = 1.39 ,   C 1 ε * = 1.42 η 1 η / 4.377 1 + 0.012 η 3 ,   C 2 ε = 1.68 ,   η = 2 E i j E i j 0.5 k ε ;   E i j = 1 2 μ i x j + μ j x i ;   G k = μ t u i x j + u j x i u i x j , ρ is density; μ t is turbulent viscosity; G k is the producing term of k caused by the average velocity gradient; ρ ε is the dissipative term of k ; C 1 ε * ,   C 2 ε , C μ are constant coefficients; and E i j is the time-averaged strain rate reflecting the main stream.
The Volume of Fluid model is an effective numerical simulation method to track the interface between two fluids. For the air–water two-phase flow, the relationship between the volume fraction of water and the volume fraction of air is given as Formula (13):
α a + α w = 1
where α w = 1 means full of water; α w = 0 means full of air; and α w = 0.5 means the air–water interface.

3. Case Study

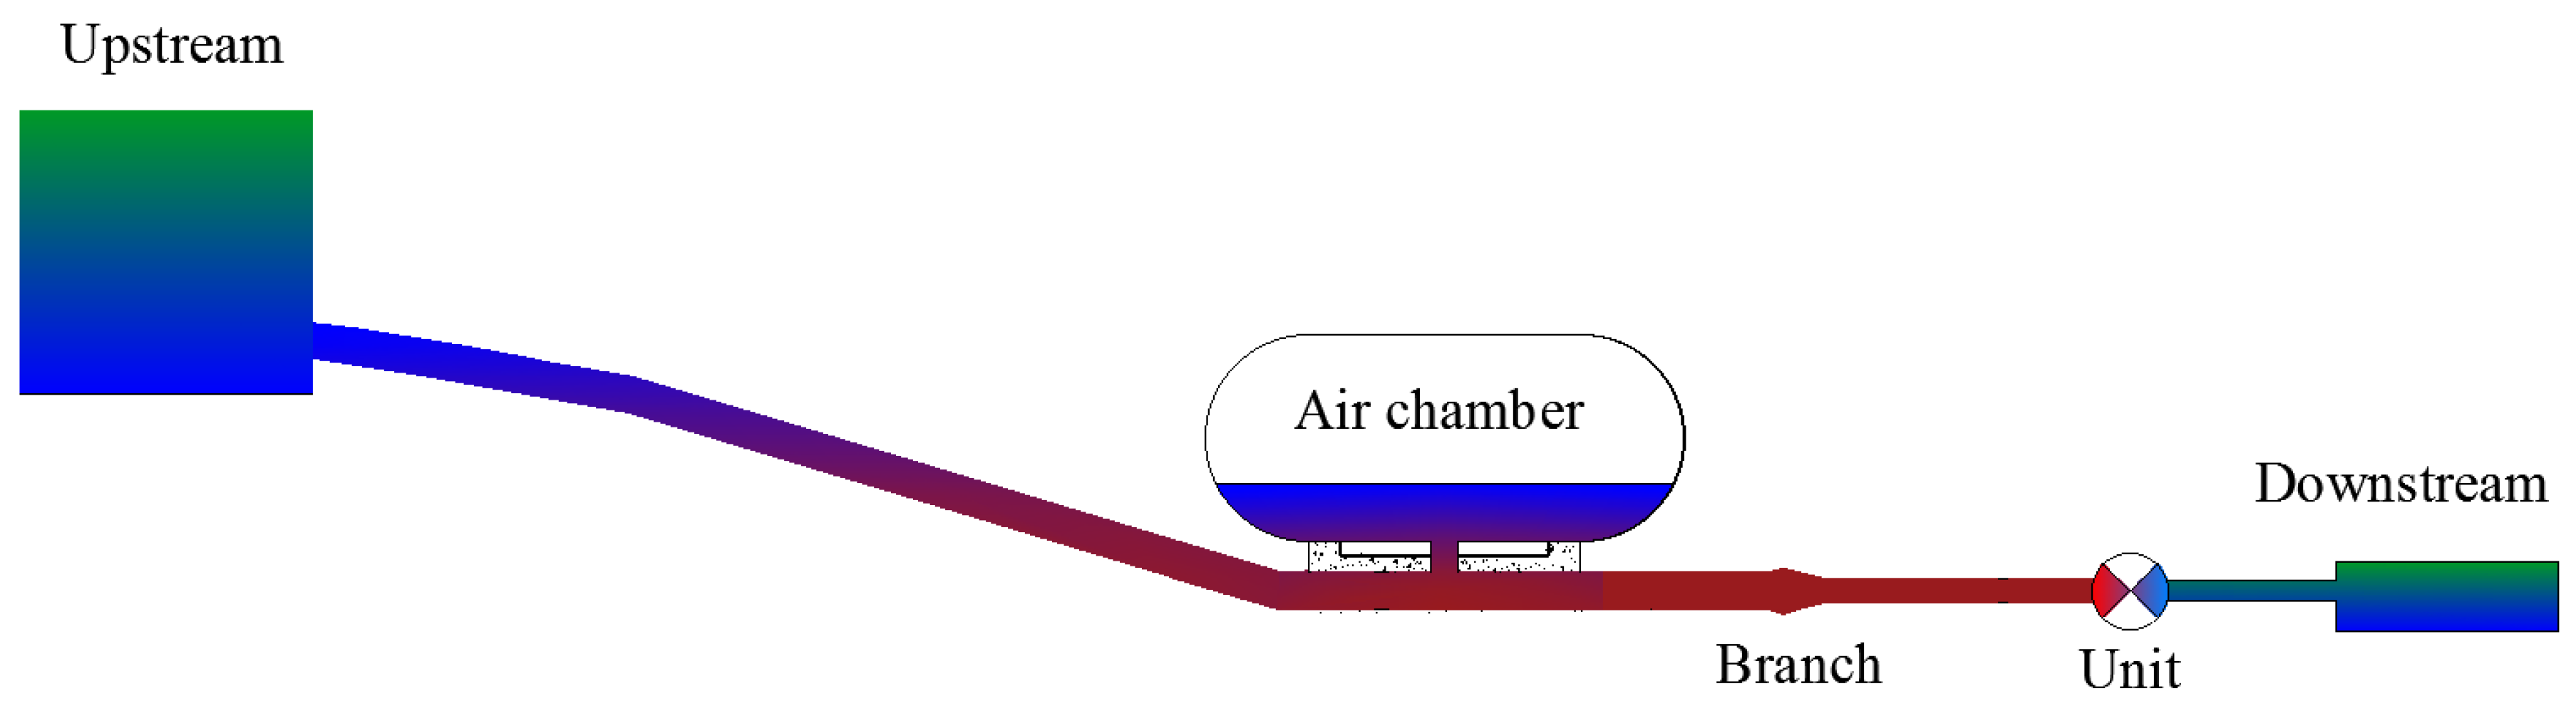
3.1. Description of Case Study

To better compare these two types of ACSCs in a practical engineering project, the background of a case study is introduced in this part. This study considered two types of ACSCs with round cross-section shapes, the same total volume, and placed in the same situation in the hydropower station system. The vertical one has a fixed water surface area, while the horizontal one has a different water surface area varying with water depth. The pipeline system of the hydropower station with an ACSC is shown in Figure 1. The basic parameters of the hydropower station are given in Table 1.
The 3D simulation object was the ACSC of a hydropower station. The calculation length is 16 m before and after the ACSC. The computational domain of two models of 3D simulation is shown in Figure 2. The mesh-independent analysis of the horizontal ACSC is shown in Table 2. As shown in Table 2, four cases of 24 million, 21 million, 41 million, and 68 million were carried out for the 3D model of the vertical ACSC. For different numbers of mesh cells, the transient simulation was carried out respectively to extract the minimum water volume fraction. The absolute error analysis was carried out between each case. The minimum water volume fraction in the ACSC represents the minimum air–water interface ( α w = 0.5 ) when the water level falls to the lowest. The results show that the absolute relative error of the minimum water volume fraction is within 0.6% for all numbers of mesh cells. With an increase in the number of cells, the results are not dependent on the grid size. The minimum water fraction in the ACSC was close to 0.163. In order to balance the simulation accuracy and computational efficiency, a computational model with 32 million cells was adopted. The 3D simulation results of the ACSC have reached mesh independence.
Moreover, numerical solution techniques of pressure implicit with the splitting of operators (PISO) for coupling the solutions of the pressure–velocity equations were considered, with a time step of 0.01 s and a convergence standard of 10−4. We selected the time step of 0.01 s after the time-step independent analysis. The time-step independent analysis of the horizontal ACSC is shown in Table 3. As shown in Table 3, four cases of 0.001 s, 0.005 s, 0.01 s, and 0.02 s were carried out for the 3D model of the vertical ACSC. As with the mesh-independent analysis, the minimum water fraction was selected as the evaluation index during the time-step independent analysis. The absolute error was calculated between each adjacent case. The results show that the absolute relative error of the minimum water fraction is less than 0.5% when the time step is smaller than 0.01 s. From the various sets of time steps, 0.01 s was considered to be sufficiently reliable to ensure time-step independence. In order to obtain the minimum water fraction of the chamber under load acceptance conditions, the first-100 s-time was focused, which included the time when the smallest water depth of the ACSC occurred. The simulation needs to consider the influence of gravity, and the acceleration is defined as 9.81 m/s2, pointing to the Z-axis direction. As for the boundaries of this model, the inlet boundary was pressure, and the outlet boundary was velocity with a user-defined expression from the variation data of 1D simulation under the transient load acceptance condition. The remaining boundary conditions are imposed by the non-slip wall boundary using the wall function. The selected area defined the initial air–water interface position to patch and the initial air pressure in the chamber. The ideal gas law for compressible flows was used to determine the behavior of the air pocket.

3.2. Scenarios Set-Up

In order to compare vertical and horizontal ACSCs comprehensively, scenarios were set up in this part. Three representative conditions under transient load disturbances are shown in Table 4. Both transient load acceptance and transient load rejection were considered in 1D simulation under the LLD condition to evaluate the influence of structures of ACSCs on the surge and the water hammer protection effect in a hydropower station. The flow regime in the ACSC when providing the water to the pipe was also considered. SLD Condition C was considered to compare the stability of the hydraulic–mechanical–electric coupled system with the ACSC.
During practical operation, air leakage is inevitable in the ACSC, which needs a regular or irregular air supplement [22,23]. There are some typical control modes to operate the ACSC safely under different conditions, e.g., ensuring the same initial water depth ( Z 0 ) or air volume ( 0 ) in the ACSC every time before operating and ensuring the same control constant ( C ) of the ACSC during operation as shown by Formula (5) under all conditions. In this paper, the same C , the same Z 0 , and the same 0 could be taken as the control variates to compare vertical and horizontal ACSCs more comprehensively.
Firstly, for the 1D model under the LLD condition, the minimum water depth, the surge variation, the maximum and the minimum absolute air pressure, the maximum pressure at the end of the hydro-turbine spiral case, the minimum pressure at the inlet of the hydro-turbine draft tube, and flow regime were taken as the evaluation indexes. The hydro-turbine spiral case is a housing designed to provide uniform water intake around the entire circumference of the distributor. The hydro-turbine draft tube is a diverging tube fitted at the exit of the runner of the turbine and used to utilize the kinetic energy available with water at the exit of the runner. The ACSC was commonly buried deep underground in the stable surrounding rock. The greater the air pressure in the gas chamber, the higher the requirement is for the strength of the material structure and the stability of surrounding rock. As a result, the maximum air pressure of the ACSC should be properly controlled with full adjustment to ensure design. It also suggests a two-meter safe water depth to avoid the high-pressure air entering the pipeline. As a result, it is safer for an ACSC with a higher minimum water depth and smaller maximum air pressure under transient LLD conditions. Comparatively small extreme values of the water head in the system are easier to meet the requirement for the project standards.
Secondly, under the SLD condition, the maximum surge in the chamber, response time, number of oscillations, the maximum relative speed of the units, overshoot, and attenuation degree were taken as the evaluation indexes. The oscillation is stable if its damping and final stable position occur within a reasonable duration [4]. In this study, the system was considered stable when the maximum unit speed oscillation quickly damped within a small range (generally ±0.4%). The number of oscillations and the overshoot during this response time were as minor as possible.
Thirdly, for the 3D model under the transient acceptance condition, the minimum water fraction in the chamber and local flow regime were also taken as the evaluation indexes. Less fluctuation of the water fraction and more significant minimum water fraction and simple and stable flow regime mean more safety for ACSC.
Conditions A, B, and C were based on the horizontal ACSC. Then, the same C , the same Z 0 , and the same 0 could be taken as the control variates and set specific scenarios for the vertical ACSC to compare the characteristics of the vertical and horizontal ACSCs under LLD and SLD conditions. Specific scenarios for comparing vertical and horizontal ACSCs are set up in Table 5. Based on the 1D numerical simulation, comparisons of two chambers under the transient load acceptance condition were made between No.4 and 1, No.5 and 1, and No.6 and 1, respectively. At the same time, comparisons of two chambers under the transient load rejection condition were made between No.7 and 2, No.8 and 2, and No.9 and 2, with the same Z 0 , the same C , and the same 0 , respectively. Moreover, comparisons of two chambers under the SLD condition were made between No.10 and 3, No.11 and 3, and No.12 and 3, respectively. In addition, based on the 3D numerical simulation, a comparison of the flow regime of two chambers was made between No.4 and 1.

4. Results and Discussion

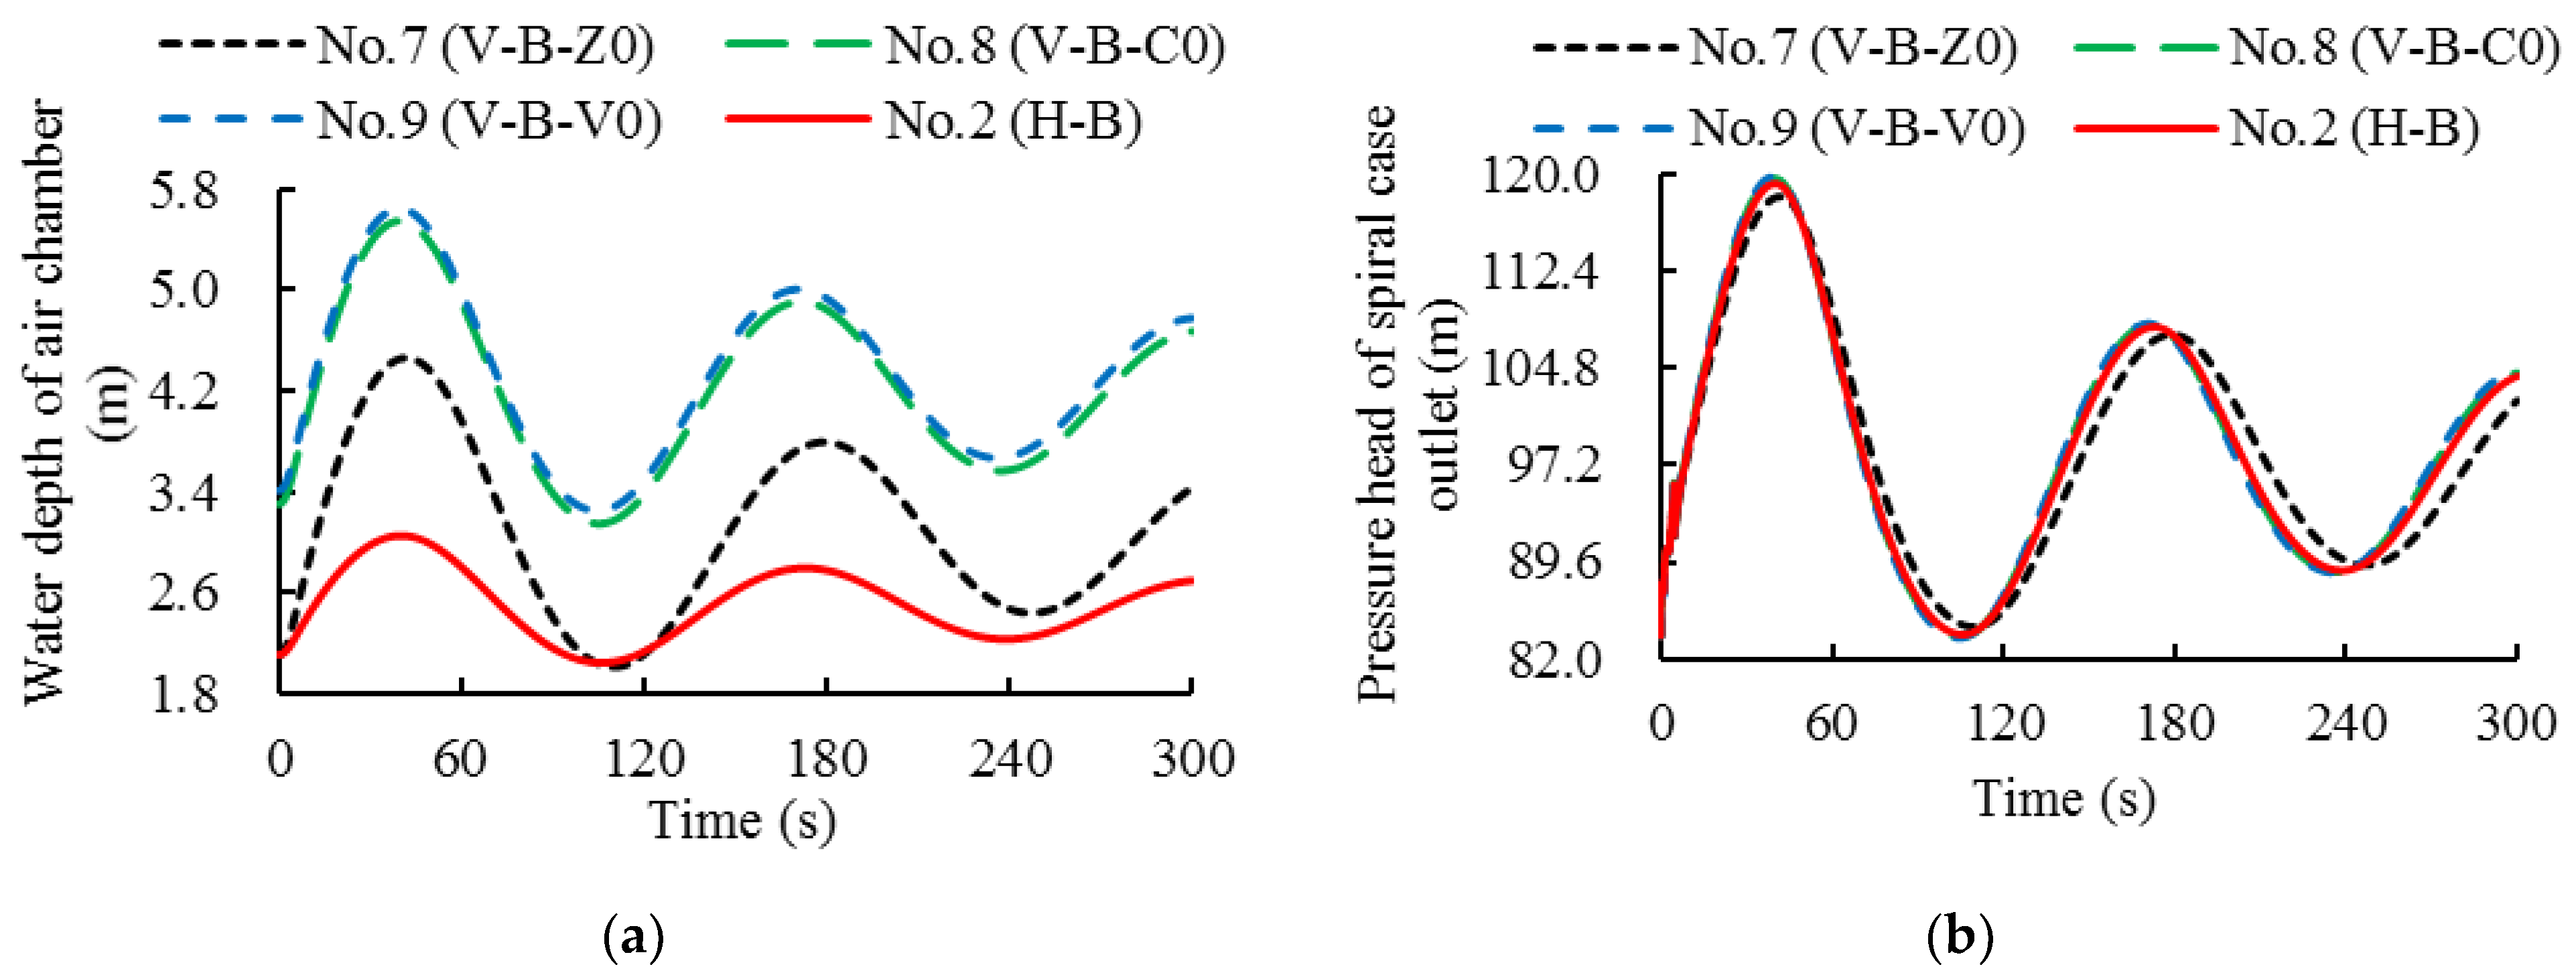
4.1. Large Load Disturbance

The 1D numerical simulations were carried out on LLD conditions in the hydraulic–mechanical–electric coupled system between the vertical and horizontal ACSCs under different initial parameters. The initial parameters included C , Z 0 , and 0 . m = 1.0 for Condition A, and m = 1.4 for Condition B. The results are shown in Table 6 and Figure 3 and Figure 4.
As for the large load acceptance Condition A shown in Figure 3 and Table 6, firstly, with the same Z 0 , the minimum water depth of the vertical ACSC was below the bottom. Even though there was a 1.2 m long connection pipe of the impedance hole, the ACSC without enough safe water depth would cause a danger to the safety of the system when the high-pressure air is in the pipeline. Because the safe water depth for the horizontal ACSC was larger than the vertical ACSC, the horizontal ACSC was superior to the vertical one. With the same Z 0 , the vertical ACSC required a more considerable initial water depth, while the horizontal ACSC stored more water volume for its large cross-section area. The range of surge in the vertical ACSC was more extensive than in the horizontal ACSC. The water level dropped to the minimum, occurring more slowly in the vertical ACSC. Because the water was flowing into the pipeline and the pressure dropped quickly under load acceptance conditions, the maximum pressure occurred at the initialization. In that case, the maximum absolute air pressure and the extreme pressure values at the end of the spiral case and draft tube were always the same for both ACSCs under three control modes.
Secondly, with the same C , the vertical ACSC had more safe water depth when it had the same 0 as the horizontal one. The vertical ACSC’s surge was more prominent than the horizontal’s because the cross-sectional area affected the ability to calm the fluctuation. The water level of the vertical ACSC dropped to the minimum, occurring more quickly. The maximum absolute air pressure of the vertical ACSC was smaller, which was also related to the different initial water depths.
Thirdly, with the same 0 , the minimum water depth and the first wave of the surge in the vertical ACSC were more considerable, occurring slightly more quickly than in the horizontal ACSC. The maximum absolute air pressure in the vertical ACSC was relatively smaller than in the horizontal ACSC.
The result shows that the vertical ACSC had different surge fluctuations and pressure variations from the horizontal ACSC under the transient load acceptance condition. The surge in the horizontal ACSC was smaller than in the vertical ACSC because of the ability to store much more water with the large water area. Because the lowest water depth is the primary evaluation index under load acceptance conditions, more water depth ensures more operation safety. Situations where the high-pressure air leaked into the pipeline, could be effectively avoided. The vertical ACSC was better than the horizontal ACSC with the same C and initial air volume. However, the vertical ACSC was worse than the horizontal ACSC with the same Z 0 , especially when the initial water level was a little low. Among three control modes, the vertical ACSC with the slightest air volume ensures the highest water level, which provides a large amount of surplus to obtain the minimum water depth when the water flows out of the ACSC under the load acceptance condition. As a result, the selection of the ACSC should also consider the control mode. Under different control modes, the results will be different.
As for the large load rejection Condition B shown in Figure 4 and Table 6, firstly, with the same Z 0 , the first wave of the surge in the vertical ACSC was more significant than that in the horizontal ACSC. The time point water depth rising to the maximum occurred slowly in the vertical ACSC. The maximum absolute air pressure and the maximum pressure at the end of the spiral case were smaller in the vertical ACSC. The minimum pressure at the inlet of the draft tube of the vertical ACSC was always larger under three control modes than in the horizontal ACSC.
Secondly, with the same C , the range of the first surge in the vertical ACSC was more extensive than that in the horizontal ACSC. The water depth rose to the maximum, occurring more quickly in the vertical ACSC, with smaller absolute air pressure. The maximum pressure at the end of the spiral case was more prominent in the vertical ACSC than in the horizontal ACSC.
Thirdly, with the same 0 , the range of the first surge in the vertical ACSC was more extensive than that in the horizontal ACSC. The water depth rose to the maximum, occurring more quickly in the vertical ACSC, with smaller absolute air pressure. The maximum pressure at the end of the spiral case was more considerable in the vertical ACSC than in the horizontal ACSC. Because the enormous pressure in the pipeline is the primary evaluation index under transient load rejection conditions, smaller pressure at the end of the spiral case ensures more safety during operation. The vertical ACSC was better than the horizontal ACSC with the same Z 0 . Because the maximum pressure was comparatively small under the transient load rejection condition, the water hammer behavior was better in the vertical ACSC than in the horizontal ACSC.
In summary, the horizontal and vertical ACSC could positively affect water hammer protection under the LLD condition in the hydropower station. The horizontal and vertical ACSC could operate safely under proper initial parameters. Different implements of such cylinder ACSC had little influence on the water hammer protection. However, the surge and air pressure in the chamber varied considerably in their characteristics. The vertical ACSC with enough water volume had a better performance on safe water depth and smaller maximum air pressure. At the same time, among these three control modes, the variation of the ACSC parameters under the same 0 was close to the same C for their close initial parameters.

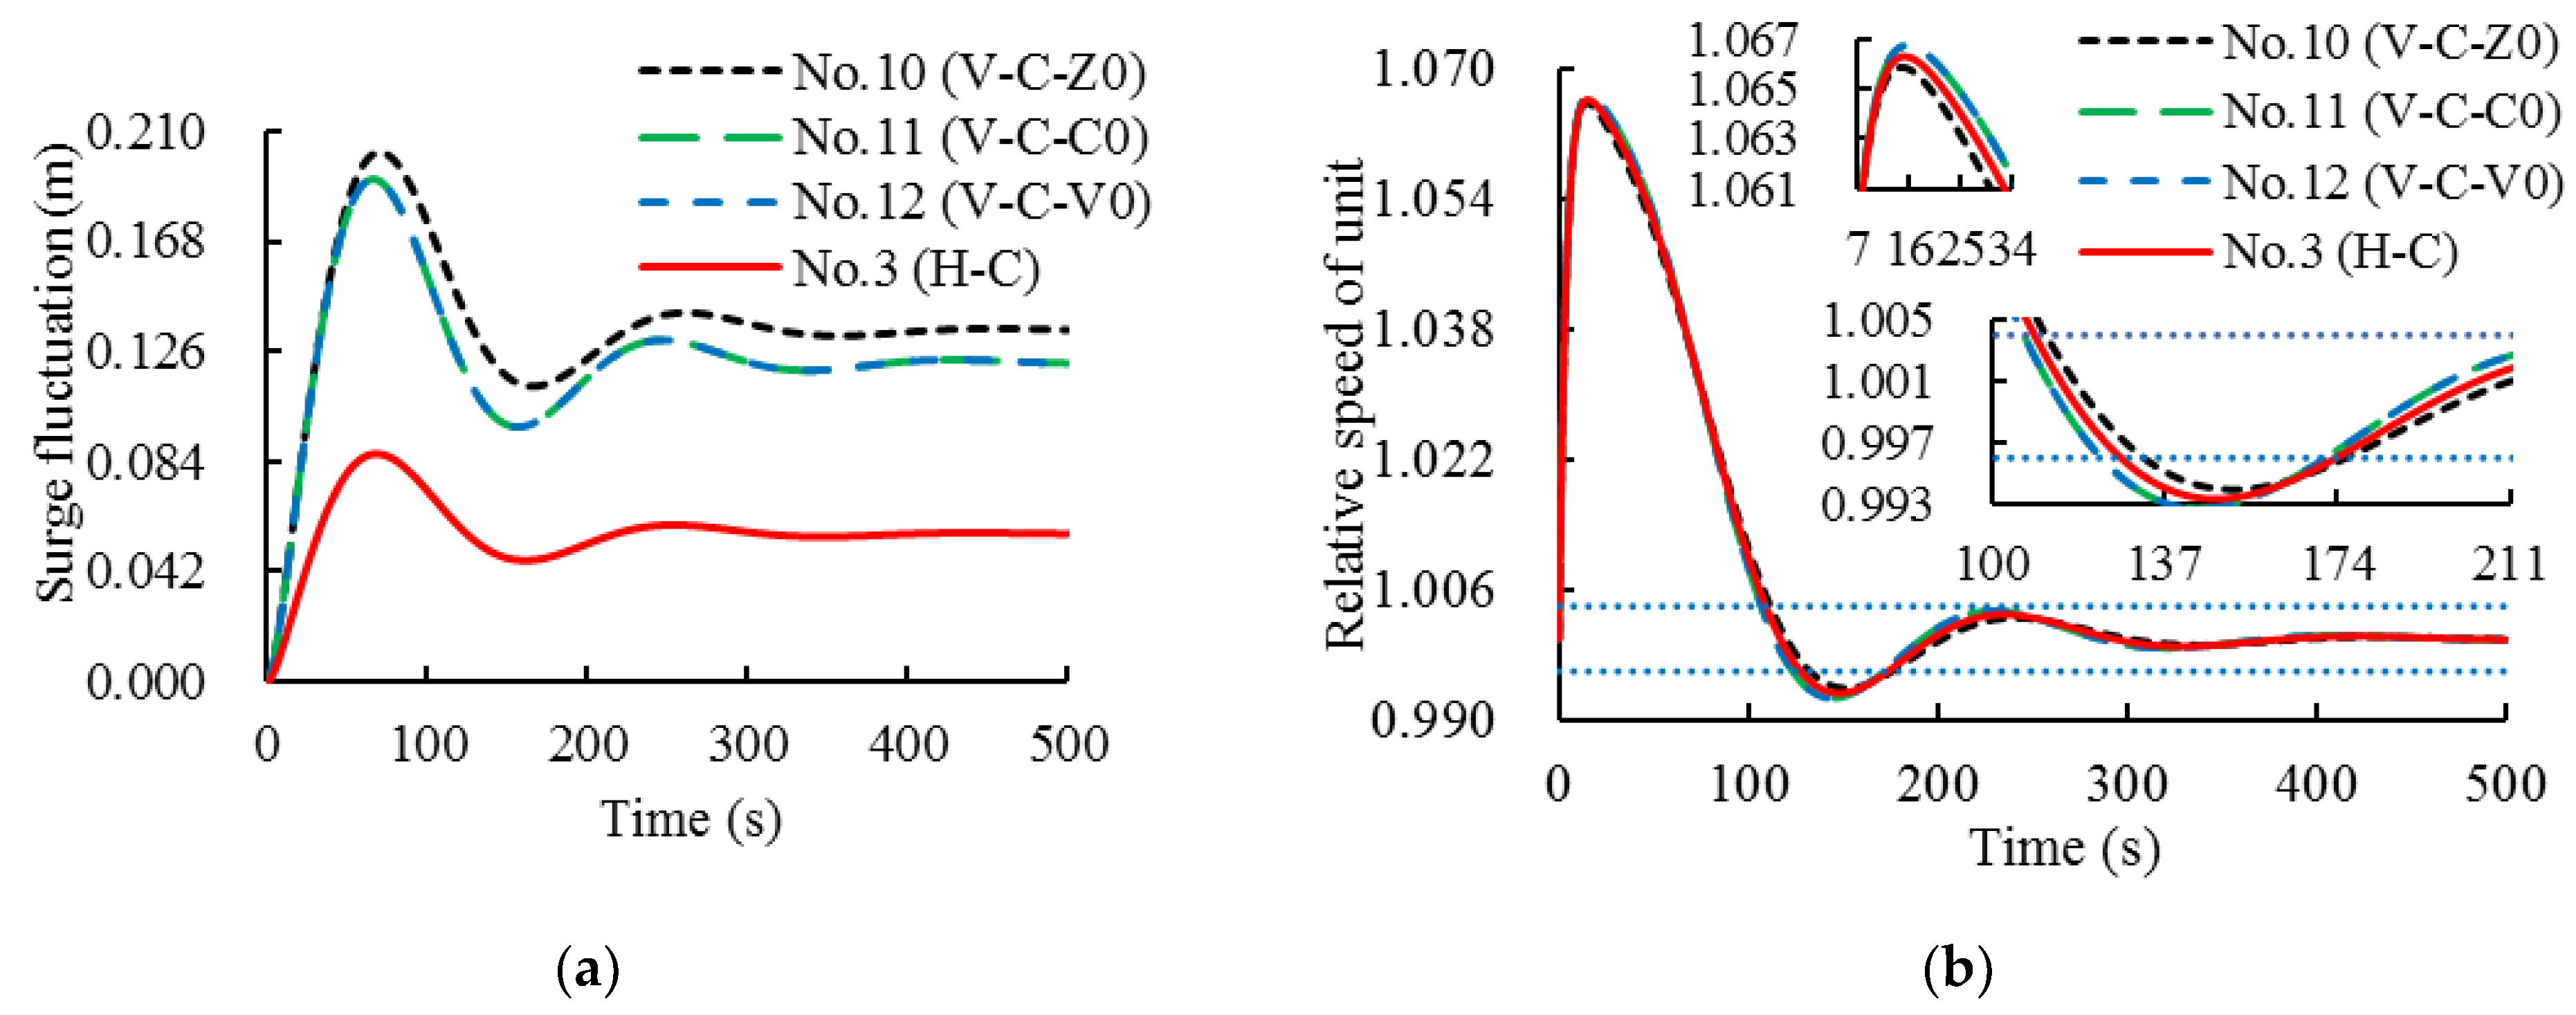
4.2. Small Load Disturbance

After comparing the results under LLD condition, numerical simulation of SLD condition in the hydraulic–mechanical–electric coupled system was also compared between the horizontal ACSC and vertical ACSC. The governor parameters were as follows: T d = 19.8 ,   b t = 1.95 ,   b p = 0 ,   t n = 1.5 . The exponent index was 1.4. The results are shown in Table 7 and Figure 5.
As shown in Figure 5, the maximum relative speed rise of the unit, the number of oscillations during the regulating time, the overshoot, and the attenuation degree were almost the same in the vertical ACSC under three control modes.
Firstly, when it was with the same Z 0 , the range of surge in the vertical ACSC was more extensive than that in the horizontal ACSC. The maximum water depth occurred more slowly in the vertical ACSC. The regulating time that finally entered the frequency range of ±0.4% was 176 s in the vertical ACSC, more slowly than in the horizontal ACSC.
Secondly, when it was the same C , the surge in the vertical ACSC was more significant than that in the horizontal ACSC. The maximum water depth occurred more quickly in the vertical ACSC. The regulating time finally entered the frequency range of ±0.4% and was 171.5 s with the vertical ACSC under three control modes.
Thirdly, when it was with the same 0 , the range of surge in the vertical ACSC was more extensive than that in the horizontal ACSC. The maximum water depth occurred more quickly in the vertical ACSC.
In summary, both ACSCs had good stability under the transient SLD condition. The horizontal ACSC was better than the vertical ACSC of its large cross-sectional water surface area to calm. The fluctuation of the surge in the horizontal ACSC was smaller than in the vertical ACSC. The oscillation of unit speed was similar under these three control modes, especially with the same C or air volume. The regulating time was quicker for the same C and air volume than the initial water depth.

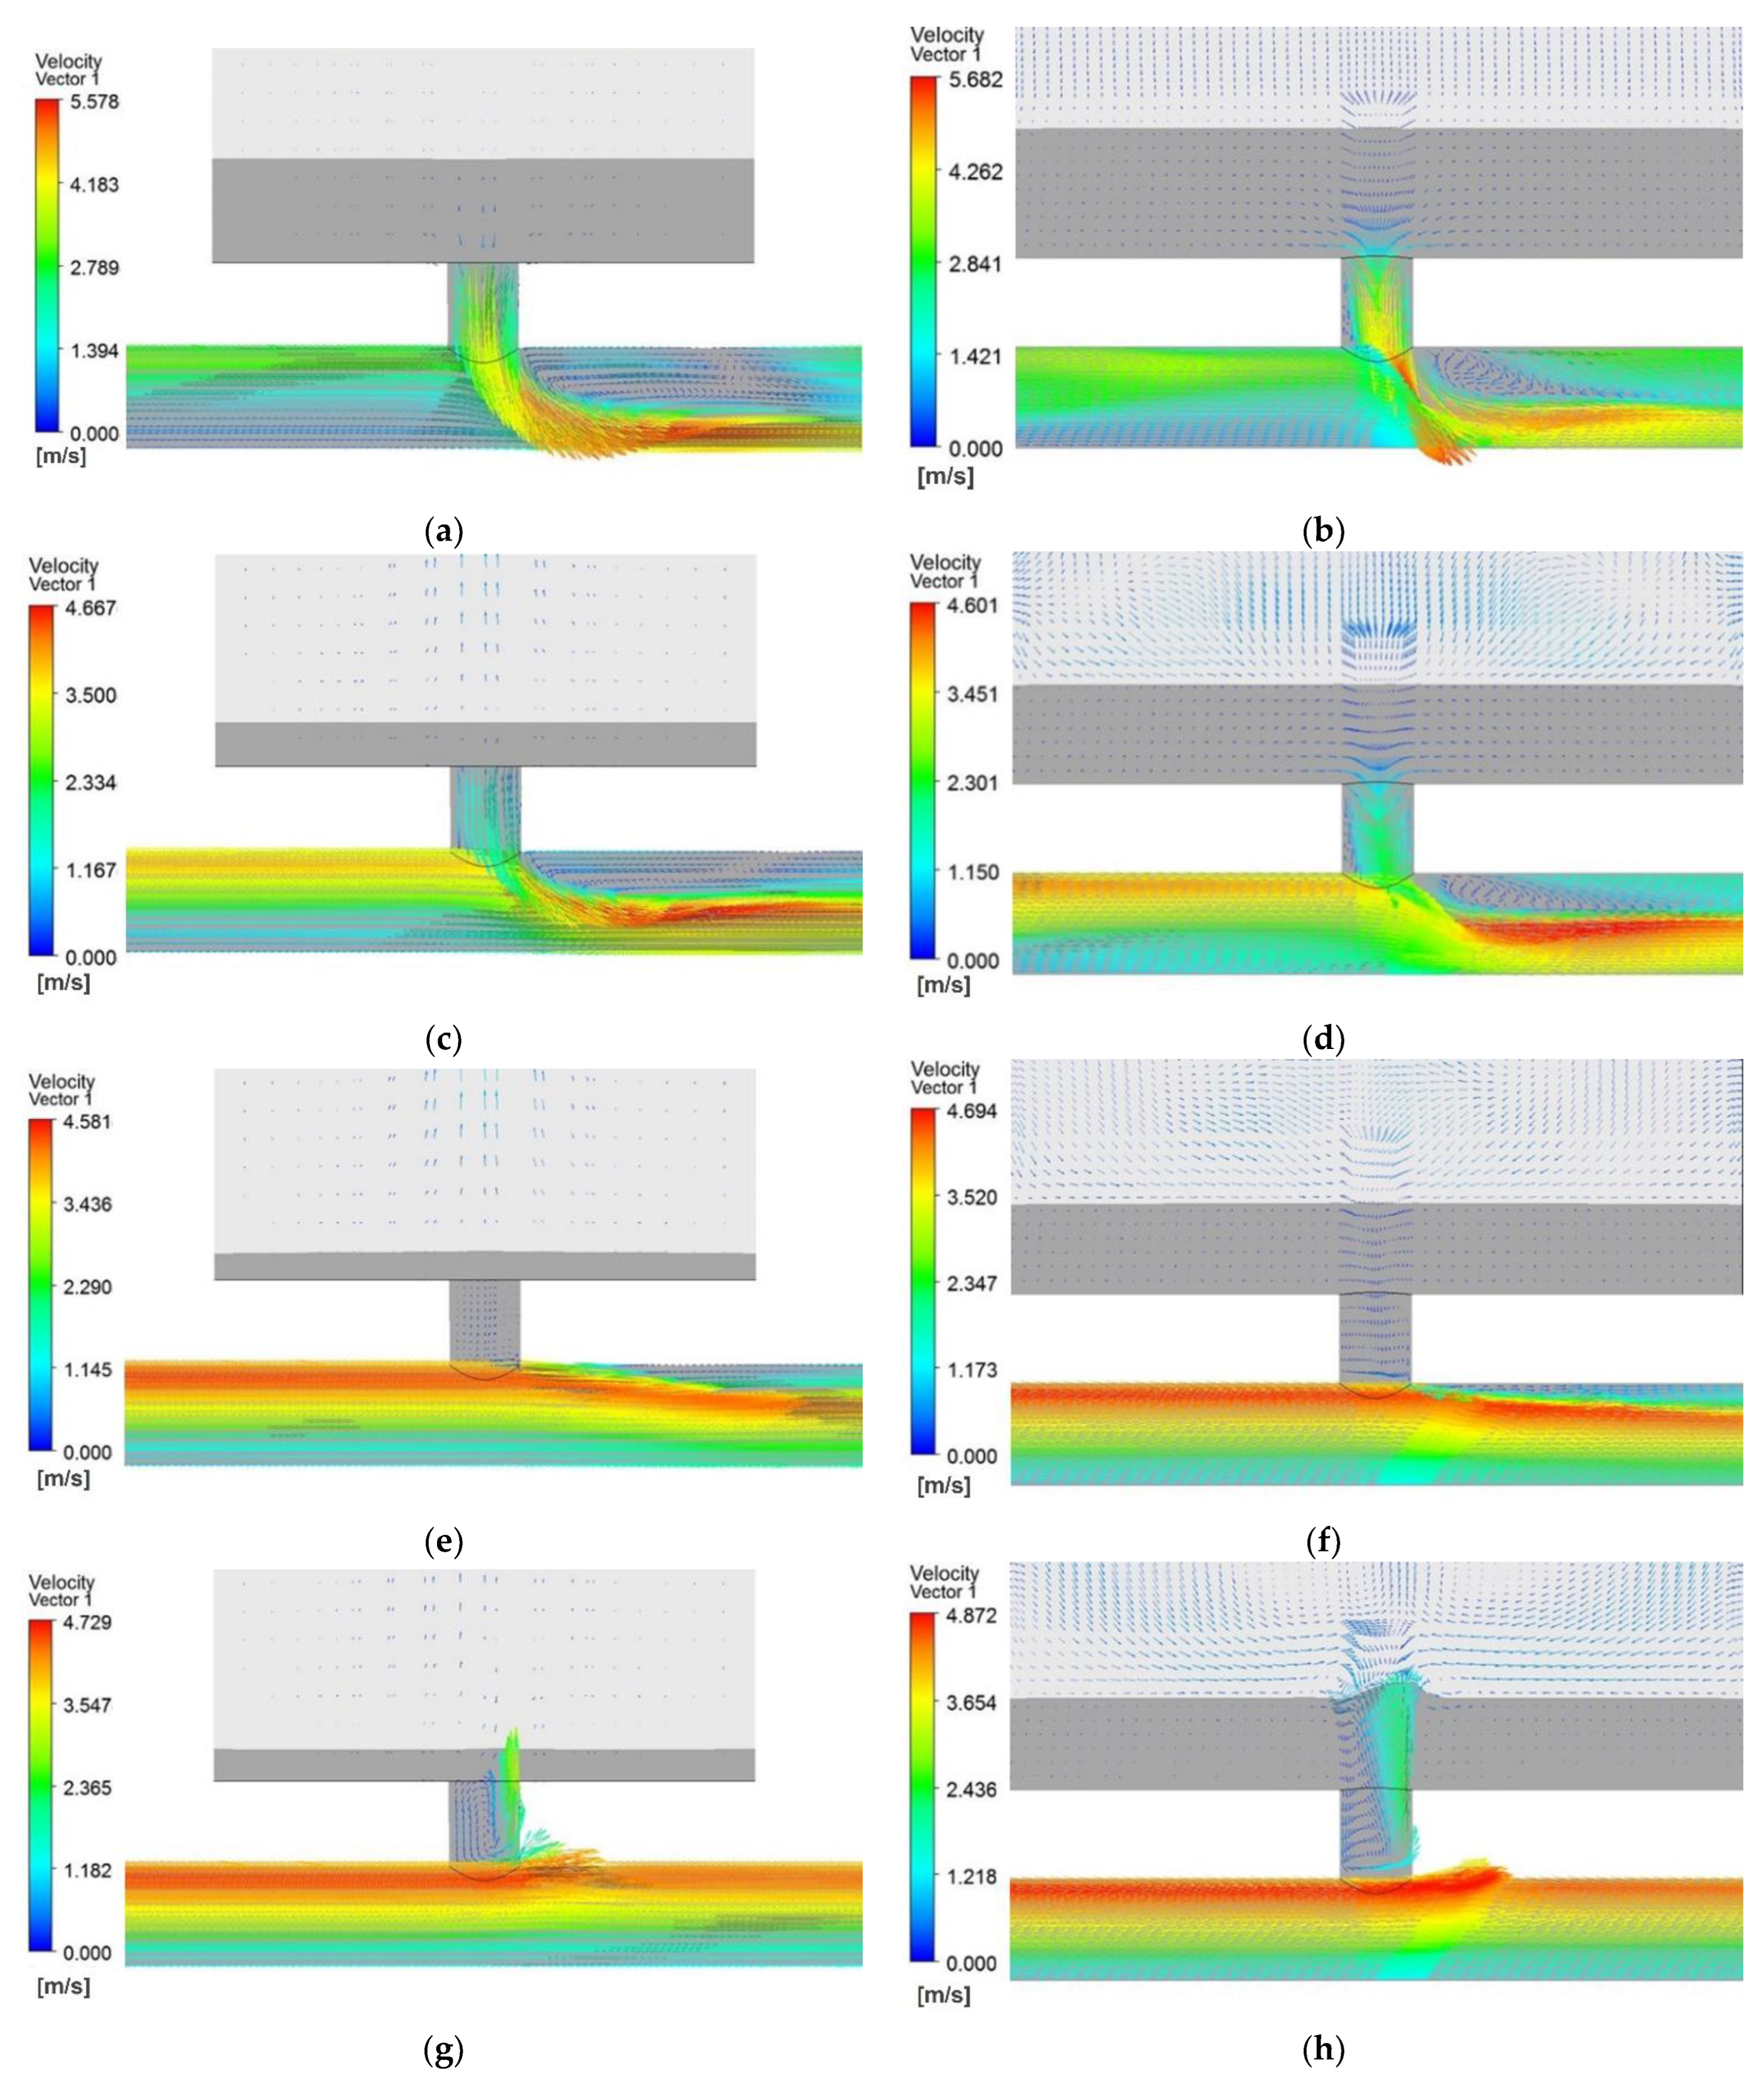
4.3. Flow Regime in the ACSC

Before the 3D numerical simulation on local flow regimes in vertical and horizontal ACSCs, it is necessary to compare the results between 1D and 3D simulations. Take the vertical ACSC as an example. The difference in the water volume fraction in the vertical ACSC between 1D and 3D simulations is shown in Figure 6.
As shown in Figure 6, the initial water volume fraction of the ACSC was 0.140. The minimum water volume fraction in the 1D result was −0.002, occurring at 62.38 s, while the minimum in the 3D result was 0.025 at 67.24 s. The difference in the minimum water volume fraction was 0.028 (maximum relative error of 2.8%). The difference in the time point of the minimum value was 4.86 s. Xia et al. [20] introduced the relative error between the 3D model and the 1D model as 2.1%~2.3%, which was regarded as a good agreement between the two models. Because the relative error of 2.8% in this study was small enough and close to others’ research, the 3D model and 1D model were in good agreement. The minimum water fraction in the chamber of the 3D result was higher because the 3D model considered the wall friction and turbulent dissipation. In contrast, the 1D model considered a smaller local head loss coefficient of the impedance hole of the ACSC, which caused a lower minimum water depth in the chamber. Generally, two variation curves of the water volume fraction matched well with each other in the 1D model and 3D model, which showed the reliability of the 3D model result.
Then, the flow regime of the two chambers was compared based on 3D simulations. Results of the vertical ACSC and the horizontal ACSC at four different time points (23.5 s, 45 s, 67 s, and 80 s) are shown in Figure 7, respectively.
As is shown in Figure 7, the surge variation under the transient load acceptance was evident at four different time points. Firstly, the water of the ACSC accelerated supplying the pipeline. When T = 23.5 s, the water went out of the vertical ACSC the fastest among the four periods, which quickly caused the water volume fraction to become smaller with time. The flow in the impedance hole was uniform due to the constant cross-section of the vertical ACSC. There was obvious circulation reflux behind the impedance hole of the chamber. The outflow of the impedance hole was close to the maximum. Secondly, the outflow velocity decreased. When T = 45 s, the water continued to flow out, and the water level dropped. The circulation reflux behind the impedance hole gradually disappeared. Thirdly, the water level dropped to a minimum. When T = 67 s, the water volume of the vertical ACSC was the smallest, 16.92 m3, with the lowest water volume fraction of 0.025. Fourthly, the water in the pipeline was supplied to the ACSC reversely. The water began to flow into the chamber. The circulation reflux behind the impedance hole was nearly gone. When T = 80 s, the water flowed into the chamber, and the water level rose. Another circulation reflux in the impedance hole occurred. The streamline in the pipe was comparatively smooth.
The overall variation of the surge of the horizontal ACSC was close to the vertical ACSC. However, the water ripple in the horizontal ACSC was more evident than in the vertical ACSC. The horizontal ACSC had much more water volume than the vertical ACSC with the same Z 0 . Because the flow velocity vector of the central axis of the impedance hole was much quicker than the velocity vector around the circle, a surface vortex existed in the horizontal ACSC’s water. As a result, when T = 23.5 s, the water vortex was observed, and the water volume quickly become smaller with time. There was significant circulation reflux behind the impedance hole of the chamber. When T = 67 s, the water volume fraction was the smallest, 0.163 (water volume 113.71 m3). The next time, the water began to flow into the chamber. When T = 80 s, the water vortex disappeared, and a slight bulge of flow was observed at the air–water interface when the water flowed into the chamber, and the water level rose.
In summary, the flow regime of the air–water surface of the horizontal ACSC was more complex than that of the vertical ACSC. The air-trapped vertical vortices will not occur in the chamber for the sufficient water depth. A surface vortex existed in the horizontal ACSC’s water. The flow regime around the impedance hole of the two chambers was similar to each other. The circulation reflux after the impedance hole was gradually becoming smaller with time during the transient process.

5. Conclusions

This paper compared the vertical and horizontal ACSCs under LLD and SLD conditions during the hydraulic transients based on the 1D MOC model. The flow regime was combined to compare the ACSC based on the 3D VOF model. The conclusions are as follows:
  • Both ACSCs could positively affect water hammer protection under proper initial parameters under LLD. Different implements of such cylinder ACSC had little influence on the water hammer protection. However, the surge and air pressure in the chamber varied considerably in their characteristics. The vertical ACSC with enough water volume had a better performance on safe water depth and smaller maximum air pressure under LLD.
  • Both ACSCs had good stability under the transient SLD condition with similar unit speed oscillations. However, the horizontal ACSC was better than the vertical ACSC for its extensive water area to calm the SLD during the transient process and smaller fluctuation of the surge.
  • The flow regime of the air–water surface of the horizontal ACSC was more complex than that of the vertical ACSC. It was difficult to form the air-trapped vertical vortices in the chamber for sufficient water depth. Only a surface vortex existed in the horizontal ACSC’s water.
  • After a comprehensive comparison, the vertical ACSC was more advisable because of a safer operation under LLD during hydraulic transients.
This study adopted the most popular simulation method. In the next stage, physical tests need to be set up for additional reference to compare the vertical and horizontal ACSC and increase the precision of the 1D and 3D models.

Author Contributions

Conceptualization, T.X. and J.Z.; methodology, X.Y. and J.Z.; validation, X.Y., S.C. and J.Z.; writing—original draft preparation, T.X.; writing—review and editing, J.L. and H.Y. All authors have read and agreed to the published version of the manuscript.

Funding

This research was funded by the Postgraduate Research & Practice Innovation Program of Jiangsu Province (Grant No. KYCC1_0522) and the National Natural Science Foundation of China (Grant No. 51879087 and No. 51839008).

Data Availability Statement

The data that support the findings of this study are available within the article.

Conflicts of Interest

The authors declare no conflict of interest.

References

  1. Stephenson, D. Simple Guide for Design of Air Vessels for Water Hammer Protection of Pumping Lines. J. Hydraul. Eng. 2002, 128, 792–797. [Google Scholar] [CrossRef]
  2. Yazdi, J.; Hokmabadi, A.; JaliliGhazizadeh, M.R. Optimal Size and Placement of Water Hammer Protective Devices in Water Conveyance Pipelines. Water Resour. Manag. 2018, 33, 569–590. [Google Scholar] [CrossRef]
  3. Siddiqui, M.A.; Ahmed, H.; Javed, M.B.; Shahid, U. Numerical analysis and parametric optimization of surge protection devices in a long up-pumping water pipeline. J. Mech. Sci. Technol. 2019, 33, 367–376. [Google Scholar] [CrossRef]
  4. Chaudhry, M.H. Applied Hydraulic Transients, 3rd ed.; Springer: New York, NY, USA, 2014; 583p. [Google Scholar] [CrossRef]
  5. Wan, W.; Huang, W.; Li, C. Sensitivity Analysis for the Resistance on the Performance of a Pressure Vessel for Water Hammer Protection. J. Press. Vessel. Technol. Trans. Asme 2014, 136, 3464. [Google Scholar] [CrossRef]
  6. Lee, T.S. Effects of Air Entrainment on the Ability of Air Vessels in the Pressure Surge Suppressions. J. Fluids Eng. 2000, 122, 499–504. [Google Scholar] [CrossRef]
  7. Khurana, M. Temperature Distribution in Vertical and Horizontal High Pressure Vessels and its Impact On Food Safety. Ph.D. Thesis, The State University of New Jersey, New Brunswick, NJ, USA, 2012. [Google Scholar]
  8. Sun, Q.; Wu, Y.; Xu, Y.; Jang, T. Optimal Sizing of an Air Vessel in a Long-Distance Water-Supply Pumping System Using the SQP Method. J. Pipeline Syst. Eng. Pract. 2016, 7, 05016001. [Google Scholar] [CrossRef]
  9. Shi, L.; Zhang, J.; Yu, X.; Chen, S. Water hammer protective performance of a spherical air vessel caused by a pump trip. Water Supply 2019, 19, 1862–1869. [Google Scholar] [CrossRef]
  10. Shi, L.; Zhang, J.; Yu, X.-D.; Wang, X.-T.; Chen, X.-Y.; Zhang, Z.-X. Optimal volume selection of air vessels in long-distance water supply systems. J. Water Supply: Res. Technol. 2021, 70, 1053–1065. [Google Scholar] [CrossRef]
  11. Chaudhry, M.H.; Sabbah, M.A.; Fowler, J.E. Analysis and Stability of Closed Surge Tanks. J. Hydraul. Eng. 1985, 111, 1079–1096. [Google Scholar] [CrossRef]
  12. Guo, W.C.; Yang, J.D.; Chen, J.P.; Teng, Y. Study on the stability of waterpower-speed control system for hydropower station with air cushion surge chamber. IOP Conf. Series: Earth Environ. Sci. 2014, 22, 42004. [Google Scholar] [CrossRef]
  13. Xu, T.; Zhang, J.; Chen, S.; He, W.; Yu, X.; Zhu, D.Z. Operational Stability of a Hydropower Plant with a Pipe-Shaped Air-Cushion Surge Chamber. J. Press. Vessel. Technol. 2021, 143, 044501. [Google Scholar] [CrossRef]
  14. Cai, F.; Cheng, Y.-G.; Xia, L.-S.; Jiang, Y.-Q. Mechanism of air-trapped vertical vortices in long-corridor-shaped surge tank of hydropower station and their elimination. J. Hydrodyn. 2017, 29, 845–853. [Google Scholar] [CrossRef]
  15. Yang, Z.Y.; Cheng, Y.G.; Liu, K.; Wang, Q.; Yang, F. Optimization of surge tank structures in hydropower station based on VOF method. In Proceedings of the 2nd IAHR—Asia Symposium on Hydraulic Machinery and Systems, Busan, Republic of Korea, 24–25 September 2019. [Google Scholar]
  16. Vereide, K.; Lia, L.; Nielsen, T.K. Hydraulic scale modelling and thermodynamics of mass oscillations in closed surge tanks. J. Hydraul. Res. 2015, 53, 519–524. [Google Scholar] [CrossRef]
  17. Vereide, K.; Tekle, T.; Nielsen, T.K. Thermodynamic Behavior and Heat Transfer in Closed Surge Tanks for Hydropower Plants. J. Hydraul. Eng. 2015, 141, 06015002. [Google Scholar] [CrossRef]
  18. Kheav, K.; Duan, Y.; Egusquiza, M.; Xu, B.; Chen, D.; Egusquiza, E. Transient analysis to air chamber and orifice surge tanks in a hydroelectric generating system during the successive load rejection. Energy Convers. Manag. 2021, 244, 114449. [Google Scholar] [CrossRef]
  19. Besharat, M.; Tarinejad, R.; Aalami, M.T.; Ramos, H.M. Study of a Compressed Air Vessel for Controlling the Pressure Surge in Water Networks: CFD and Experimental Analysis. Water Resour. Manag. 2016, 30, 2687–2702. [Google Scholar] [CrossRef]
  20. Xia, L.; Cheng, Y.; Zhou, D. 3-D simulation of transient flow patterns in a corridor-shaped air-cushion surge chamber based on com-putational fluid dynamics. J. Hydrodyn. 2013, 25, 249–257. [Google Scholar] [CrossRef]
  21. Liu, J.; Zhang, J.; Yu, X.; Xie, H. Study on Small Fluctuation Stability in Air Cushion Surge Chamber Based on State Space Method. In Proceedings of the ASME 2017 Fluids Engineering Division Summer Meeting, Waikoloa, HI, USA, 30 July–3 August 2017. [Google Scholar]
  22. An, J.; Zhang, J.; Hazrati, A. Safe control of air cushion surge chambers in hydropower systems. Sci. Iran. A 2013, 20, 1605–1611. [Google Scholar]
  23. Xu, T.; Zhang, J. Study on control mode of operation parameter in hydropower air chamber. MATEC Web Conf. 2018, 246, 01038. [Google Scholar] [CrossRef]
Figure 1. The pipeline system of the hydropower station with an ACSC.
Energies 16 01501 g001
Figure 2. Computational domain of two models of 3D simulation. (a) Vertical ACSC; (b) Horizontal ACSC.
Energies 16 01501 g002
Figure 3. Comparison of horizontal and vertical ACSCs under load acceptance condition A: (a) Water depth varying with time; (b) Pressure at the end of spiral case varying with time.
Energies 16 01501 g003
Figure 4. Comparison of horizontal and vertical ACSCs under load rejection condition B: (a) Water depth varying with time; (b) Pressure at the end of spiral case varying with time.
Energies 16 01501 g004
Figure 5. Comparison of horizontal and vertical ACSCs under SLD Condition C: (a) Surge varying with time; (b) Relative unit speed varying with time.
Energies 16 01501 g005
Figure 6. Difference of variation of water volume fraction between 1D and 3D models.
Energies 16 01501 g006
Figure 7. Comparison of horizontal and vertical ACSC flow regimes at different time points: (a) vertical ACSC at T = 23.5 s; (b) horizontal ACSC at T = 23.5 s; (c) vertical ACSC at T = 45 s; (d) horizontal ACSC at T = 45 s; (e) vertical ACSC at T = 67 s; (f) horizontal ACSC at T = 67 s; (g) vertical ACSC at T = 80 s; (h) horizontal ACSC at T = 80 s.
Energies 16 01501 g007
Table 1. Basic parameters of the studied hydropower station.
ParameterValue
Rated water head of the power station (m)84.4
Inflow (m3/s)4.6
Installed capacity (MW)2 × 1.5
Length between upstream and ACSC (m)2047.97
Length between ACSC and unit (m)31.37
Length between unit and downstream (m)4.33
Diameter of the pipe (m)1.4
Bottom elevation of ACSC (m)1.9 *
Diameter of cross-section of ACSC (m)7.6
Length of ACSC (m)10.0
Diameter of impedance hole of ACSC (m)1.0
* The centerline of the horizontal pipe under the ACSC was taken as the datum elevation.
Table 2. Mesh independent analysis of the horizontal ACSC.
Number of Cells
(M)
Minimum Water FractionTime Point
(s)
Absolute Relative Error
(%)
240.16366.8
320.16367.70.05
410.16366.90.05
680.16466.90.59
Table 3. Time-step independent analysis of the horizontal ACSC.
Time Steps
(s)
Minimum Water FractionTime Point
(s)
Absolute Relative Error
(%)
0.0010.16467.1
0.0050.16366.90.41
0.010.16367.70.16
0.020.15267.47.03
Table 4. Representative conditions under transient load disturbances.
ConditionUpstream Water Level
(m)
Downstream Water Level
(m)
Variation of Discharge
(m3/s)
Variation of Units
A98.133 *0.38 *0→4.60→2 in 30 s
B98.923 *0.38 *4.6→02→0 in 5 s
C98.133 *0.38 * 5% load disturbance
* The centerline of the horizontal pipe under the ACSC was taken as the datum elevation.
Table 5. Scenarios for comparing vertical and horizontal ACSCs.
No.Condition Z 0
(m)
V 0
(m3)
C 0 ( ×   10 5 m4) Evaluation Index
1H-A2.11528.680.55
2H-B2.11528.686.06
3H-C2.11528.680.49
4V-A-Z02.11587.770.611D maximum surge in the chamber
1D minimum water depth in the chamber
1D maximum and minimum pressure in the system
3D minimum water fraction in the chamber
3D local flow regime
5V-A-C03.28534.730.55
6V-A-V03.41528.680.541D maximum surge in the chamber
7V-B-Z02.11587.787.031D minimum water depth in the chamber
8V-B-C03.31533.576.061D maximum and minimum pressure in the system
9V-B-V03.41528.685.98
10V-C-Z02.11587.770.541D maximum surge in the chamber
11V-C-C03.31534.730.491D response time, number of oscillations, maximum relative speed of the units, overshoot, attenuation degree
12V-C-V03.41528.680.49
Note: Condition x-y-z, where x means type of the ACSC, H refers to horizontal ACSC, and V refers to vertical ACSC; y means type of load disturbance, A refers to large load acceptance condition, B refers to transient load rejection condition, and C refers to SLD; z means type of control variables, Z 0 ,   C 0 ,   and   V 0 mean the initial water depth and the C value and air volume, respectively.
Table 6. Numerical Results under LLD conditions.
No.First Surge
(m)
Range of Absolute Air Pressure
(m)
Maximum Head of Spiral Case Outlet
(m)
Minimum Head of Draft Tube Inlet
(m)
11.0487.47~103.3595.43−1.87
20.9491.78~126.07119.22−2.36
42.1588.66~103.3595.43−1.86
52.0687.00~102.1895.43−1.87
62.0486.81~102.0495.43−1.86
72.3592.40~123.63118.19−2.26
82.2390.32~124.03119.77−2.26
92.2490.49~123.99119.63−2.26
Table 7. Numerical Results under SLD conditions.
No.Surge in Chamber
(m)
Response Time T p
(s)
Number of Oscillations x Maximum Relative Unit Speed Overshoot δ (%) Attenuation Degree ψ
(%)
30.09 174.00.51.06610.0795.48
100.20 176.00.51.0669.2196.11
110.19 171.50.51.06710.9394.82
120.19 171.50.51.06710.9394.82
Note: T p is the time that the difference between the maximum oscillation and stable state of speed is within ± 0.4 % ; x is half of the number of wave peaks of the oscillations during T p ; δ is the ratio of the minimum relative speed and the maximum relative speed; and ψ is the ratio of the difference with maximum relative speed of the first wave and the second wave and the maximum relative speed.
Disclaimer/Publisher’s Note: The statements, opinions and data contained in all publications are solely those of the individual author(s) and contributor(s) and not of MDPI and/or the editor(s). MDPI and/or the editor(s) disclaim responsibility for any injury to people or property resulting from any ideas, methods, instructions or products referred to in the content.

