Article

Water Entry of a Heated Axisymmetric Vertical Cylinder

1
Faculty of Mechanical Engineering and Naval Architecture, University of Zagreb, 10002 Zagreb, Croatia
2
Paul Scherrer Institute, Forschungsstrasse 111, Villigen PSI, 5232 Villigen, Switzerland
3
Department of Mechanical and Process Engineering, Eidgenössische Technische Hochschule Zurich (ETHZ), Leonhardstrasse 21, 8092 Zurich, Switzerland
*
Author to whom correspondence should be addressed.
Energies 2023, 16(24), 7926; https://doi.org/10.3390/en16247926
Submission received: 26 October 2023 / Revised: 22 November 2023 / Accepted: 27 November 2023 / Published: 5 December 2023
(This article belongs to the Special Issue Multiphase Flow in Energy and Process Systems)

Abstract

:
The computational model that is able to estimate the temperature distribution inside a solid specimen during the film boiling phase of immersion quenching (water entry) process has been presented in this paper. It is based on the prescribed initial temperatures of the solid specimen and the liquid quenchant. In addition, the turbulence effects have to be considered using the assumed turbulence kinetic energy value, i.e., the “frozen turbulence” approach, that remains constant thorough the simulation. The studied material is nickel alloy, Inconel 600, for which extensive experimental data are available. The work has been carried out using ANSYS Fluent computational fluid dynamics software and the methods for solution of Stefan problem by Eulerian two fluid VOF model. A satisfactory agreement between the experimental and the calculated data has been achieved, yielding thereby the computationally obtained data that fit to a great extent the prescribed error band of ±10% during the estimated film boiling phase of the immersion quenching process itself. It was, however, found that the temperature calculated in the center of a specimen fits this error band until reaching somewhere t < 6 s due to low presumed turbulence level in the domain. In addition, the explosion of the vapor phase after the body reaches the free surface of the quenchant has also been successfully tracked using the numerical simulation model proposed herein. The major novelty of the present research lies in the fact that a moving boundary problem has been successfully resolved in conjunction with, to a great extent, basic-principle-based heat and mass transfer in a turbulent flow conjugate heat transfer (CHT) numerical simulation using moderate computational resources.

1. Introduction

In naval hydrodynamics, water entry is an interesting phenomenon from the viewpoint of investigation of hydrodynamic loads on floating bodies during their immersion into liquid medium. These studies usually focus on wedges-like objects, spheres and horizontal cylinders. The analytical solutions from Wagner and Von Kármán exist to this end; both being presented in the PhD thesis by Toso [1]. In the numerical simulation of such a phenomena, two distinct approaches may be found with respect to the way the body is immersed: a free fall, and a constant velocity drop-down; both approaches being applied in Kleefsman et al. [2], whilst the latter has been, although in a fully Lagrangian manner, solved in Bašić et al. [3]. Within the studies focused on free fall, two further modeling approaches are used with regard to the computation of drop-down velocity, i.e., from considering the forces that act on a falling body: the 6-degrees of freedom (DOF) and the computation of velocity upon a previous time step. More recently, the former approach was adopted within the parametric study of a 3D sphere impacting the free surface of water in Yu et al. [4], being noted in the recent theoretical exposure in Lu et al. [5].
Apart from the isothermal water entry studies, we shall outline the studies with immersion of heated solids into liquid mediums. To this end, in a study by Li et al. [6], the stability of vapor–liquid interface was studied for different degrees of subcooling and/or wall superheats. Still within the context of naval hydrodynamics is the application of so-called air lubrication systems (ALS), but using water vapor as a medium instead of air bubbles. In this sense is the study by Jetly et al. [7], wherein the influence of vapor film formation around a sphere on flow hydrodynamics was examined during water entry of heated sphere in a liquid FC-72 medium using experimental investigation. The influence of the Leidenfrost effect within the framework of water entry, i.e., the formation of vapor blanketed around a spherical body on flow enhancement during immersion of a heated sphere in liquid, has been discussed from a theoretical perspective in Gylys et al. [8]. The authors evaluated the energy consumption required in the realization of such cases.
However, a study that encompasses the water entry and immersion of a heated cylindrical body, investigating thereby also the temperature evolution inside the material (conjugate heat transfer, CHT) together with incorporating the phase-change phenomena that occur in the liquid phase, using numerical simulation technique and, at least when a mass transfer process is considered, basic principles approach, has not been found in the open literature.
Hence, a major novelty that correlates the moving boundary problem with basic principle based, at least to a great extent, heat and mass transfer in conjunction with turbulent flow and CHT is present within the framework of this paper.
On the other hand, the temperature field investigations within solid bodies usually involve the inverse heat transfer analysis (IHTA) models that require previously obtained experimental data in order to make estimates of the heat transfer characteristics during the immersion quenching process. In this regard, the IHTA of the Inconel 600 probe is presented in the PhD thesis by Felde [9]. Since only one temperature is measured, that is, at the center of the probe, only the heat transfer coefficient in the immediate vicinity of that axial point (at the radius of that axial point) may be obtained, hc( r , T), where index c denotes the central point of a specimen, r is the position vector, and T is the absolute temperature in degrees Kelvin. The obtained heat transfer coefficient values may either compose steep and/or linear distribution. The IHTA has also been used in a study by Demirel [10]. The author coupled it with finite element method (FEM) in order to predict the temperature evolution in a solid material; it is clearly shown by the author how the heat transfer coefficient estimated by the IHTA refers to a specific, local, zone of the material in question. An investigation on temperature–time distributions during quenching of a nickel Inconel 600 alloy has been reported in Landek et al. [11]. The authors, among other data, have also shown the temperature and the heat transfer coefficient calculations using an analytical expression and inverse heat transfer analysis, respectively. Only the temperature in a geometric center of a probe was evaluated experimentally using a K-type thermocouple; whilst the surface temperature has been calculated on the basis of a transient heat conduction analytical model. In addition, two distinct approaches were used in estimation of temperature, and thus the time; distributions of the heat transfer coefficient; the one proposed by the authors, and the one obtained by the ivfSmartQuench v.1.1 (Swerea IVF AB, Mölndal, Sweden) system commercial software. Speaking in terms of the aforementioned software, the ivfSmartQuench system is the standardized method for estimation of quenching power of liquids and is explained in more detail in Troell et al. [12]. Furthermore, the fundamentals of the IHTA together with the examples in a realistic quenching application using computational software are described in the paper.
Furthermore, in Landek [13], the influence of thermal effusivity, b = ρ s c s λ s , a material’s ability to transfer the heat into the surrounding medium has been studied; however, in the framework of the spray quenching processes. It was observed in a PhD thesis by Tenzer [14], that the Leidenfrost temperature decreases with the increase in thermal effusivity, also within the context of spray quenching. A recent study by Jagga and Vanapalli [15] reveals how the standard boiling modes are only valid in the case of high thermal effusivity materials, whilst in the opposite situation the materials may exhibit different behavior. Its value in calculation of Leidenfrost temperature in the case of forced convection film boiling has been reported in [16]. As can be concluded from the above mentioned studies that dealt with the phenomena in solid, that is, the quenching studies, the heat transfer coefficient has been selected as an input parameter, determined using previously conducted experiment and an inverse heat transfer analysis. Thus, a temperature field inside the material is obtained and can be supplemented for further analysis (stress and strain analysis).
A main goal of the present research is to establish a conjunction between the two distinct approaches; that is, to encompass an immersion process (usually isothermal) with conjugate heat transfer study (mostly without moving boundaries), incorporating thereby the phase change and turbulence phenomena that occur in the liquid phase. With this conjunction, a novel numerical approach is proposed that alleviates the experimental input of cooling curve recorded in a solid specimen and provides sufficiently accurate results for temperatures and heat transfer coefficients on the specimen surface using only the initial temperature of the solid and a quenchant medium.

2. Materials and Methods

2.1. Description of the Quenching Experiment

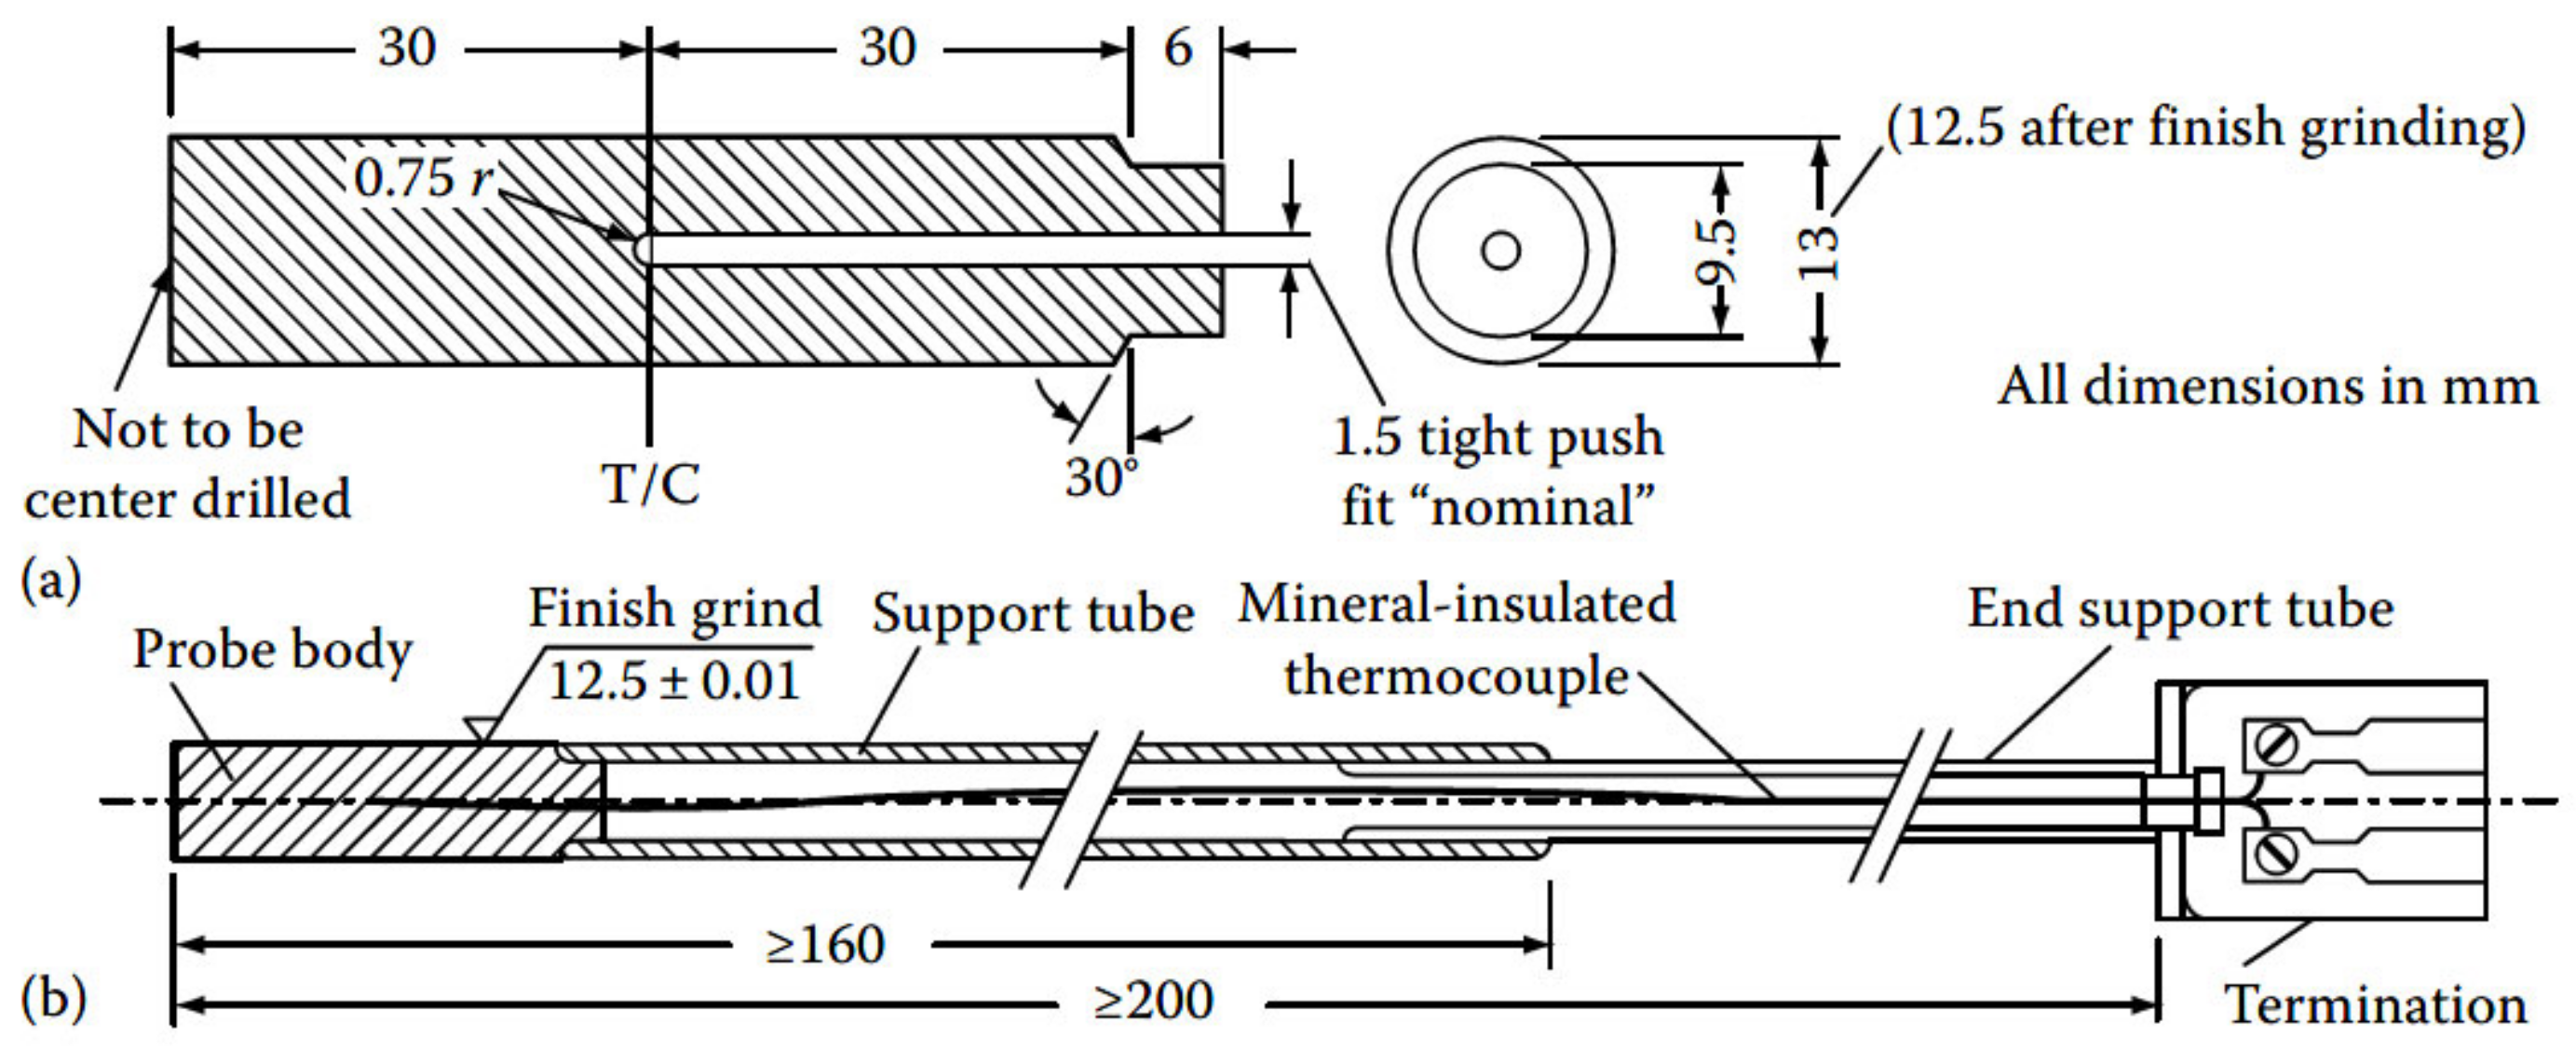
Specimen used in all cooling tests was a temperature probe made of Inconel 600 alloy according to the ISO 9950:1995 [17] norm. The diameter of the probe is 12.5 mm, and the length is 60 mm. A NiCr/Ni shielded thermocouple (type K) is installed in the center of the probe, as shown in Figure 1. The temperature is monitored in the central point of the specimen, i.e., 30 mm above the bottom surface. The temperature probe is welded to a thin tube of austenitic stainless steel, wall thickness 1 mm. There is still air inside the tube. This design of the temperature probe holder reduces the axial heat dissipation and enables cooling of the sample mainly by radial heat dissipation into the liquid in which the sample is immersed. The thermal properties of Inconel 600 nickel alloy used for the ISO probe are listed in Table 1.
Table 1. ISO Inconel 600 probe material properties [11,18] *.
Temperature
T, (K)
Heat Conductivity
λ (W/mK)
Specific Heat
c (kJ/kgK)
Density
ρ (kg/m3)
Thermal Diffusivity
a (mm2/s)
300.1514.800.444084203.9600
368.4515.840.48013.9178
468.9517.360.50384.0925
478.1517.500.50384.1253
619.7519.770.50414.6583
827.1523.100.54535.0314
869.1523.800.55365.1059
935.1524.900.59584.9634
1069.4527.140.68174.7280
* Note: italic numbers are calculated by interpolation from published values.
Figure 1. Construction of the ISO Inconel 600 temperature probe according to the ISO 9950:1995 norm [19]: (a) probe body with measures for thermocouple installation, (b) probe with holder and connection of the thermocouple to the measuring device.
Energies 16 07926 g001
For the validation of the mathematical model, the results of measuring the cooling curve of the ISO Inconel 600 temperature probe in still water heated to 60 °C were used, according to the conditions described in the paper by Landek et al. [11]. The ivf SmartQuench® system (Swerea IVF AB, Mölndal, Sweden) used in experiments consisting of a certified standard test probe, data acquisition unit, small electrical furnace and software for data acquisition and analysis as shown in Figure 2.
Before the experiment, the temperature probe together with holder at a height of 120 mm above the probe is uniformly heated in an electric furnace at 855 °C for 10 min. During transfer from the furnace to the receptacle above the container with water, the center of the probe may cool down to 850 °C. The temperature probe (specimen) is initially placed 170 mm above the free surface of water and is manually immersed into the quenchant medium. A constant velocity translatory motion of the specimen 0.13 m/s may be assumed in the model according to the analysis of video recordings of the experiment using the open-source program Tracker and estimation in [11,18]. This velocity input is in the range of the immersion velocities used in the study by Demirel [10], from 0.1 m/s to 0.2 m/s. In doing so, a steel rod is connected to the specimen’s top horizontal surface. This steel tube has been neglected in the present numerical study for the sake of simplicity. Also, the density of the axially conducted heat flux to the still air in the tube is two orders of magnitude smaller than the density of the heat flux that is conducted radially through the probe section into the liquid. The temperature acquisition starts when the temperature at the measuring location reaches approximately 850 °C. The immersion stops when the bottom surface of the specimen is 260 mm below the free surface of the water. The thermoelement is expected to register the radial temperature change before the axial one, due to small radial thickness in comparison to the axial one, i.e., the distance from the thermocouple to the cylinder bottom surface. The sampling interval of cooling curve data was Δt = 0.1 s. The sampling time for recorded cooling curves was 60 s. The quenching test has been repeated three times with the same temperature. The repeated recordings of the cooling curves showed small scattering of results, less than 5% in the entire cooling interval. However, for further analysis, mean arithmetic values of temperature for every time step of recorded cooling curves have been determined [11].
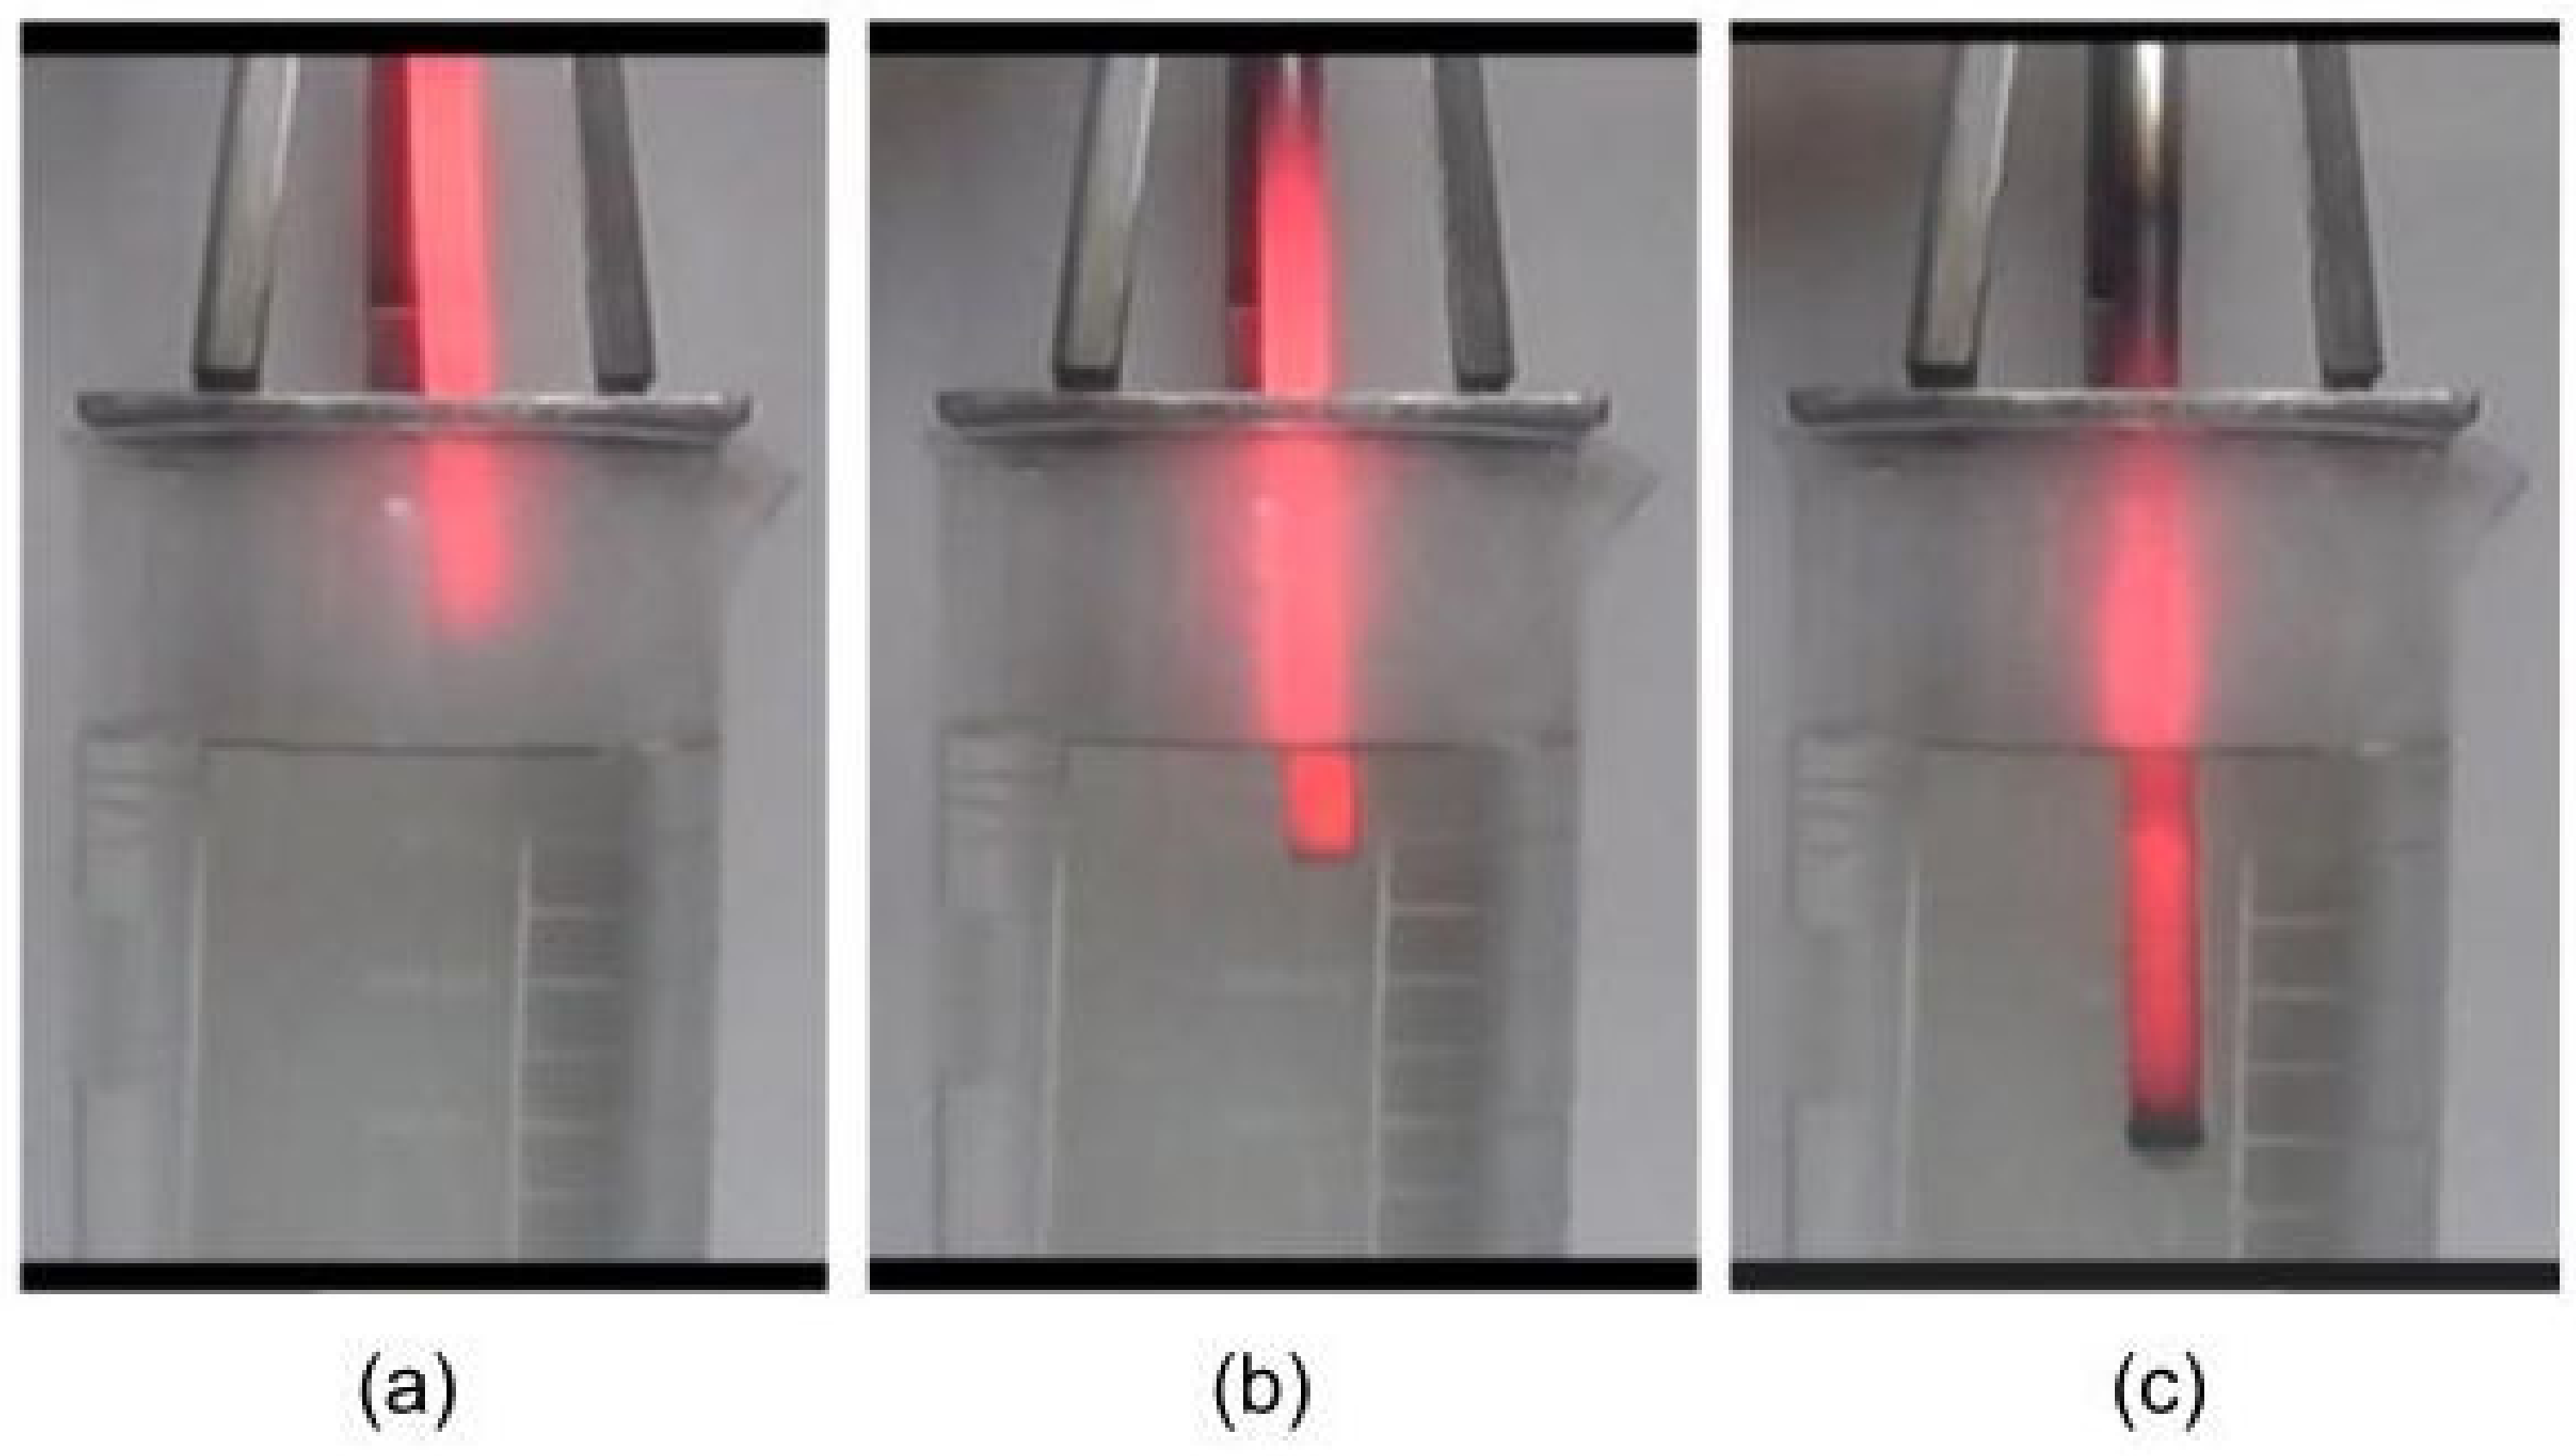
For the visual analysis of the appearance of the Leidenfrost effect on the surface of the ISO Inconel 600 temperature probe during cooling in water, a repeated cooling experiment was carried out in still water heated to a temperature of 55 + 5 °C. The cooling test was recorded with a Sony HDR-AS50 camera (Sony Group Corporation, Tokyo, Japan) with a resolution of 1280 × 720/120 fps. The studied specimen is again heated to a predefined high temperature 855 °C in a small electric furnace, and then dipped down into the still water that has been previously heated until the temperature of ca. 52 ℃ is reached. The snapshots of the solid specimen immersion quenching are shown in Figure 3. The red-hot part of the sample is at a temperature higher than 800 °C and there is a vapor envelope around it. Please note the vapor bubble formation beneath the horizontal bottom surface, and at the cylindrical surface of the specimen, indicating the start of the boiling phase at the bottom of the probe.
From the immersion snapshots, one can identify the advancement of the temperature in a bottom-up fashion in the axial direction, and from the outer side to the inner part of the body in the radial direction. Thus, behavior featuring the existence of significant temperature gradients with respect to space in the solid object, i.e., the cooling case with a large Biot number (Bi → +∞). This is a consequence of formation of a vapor film around the temperature probe immediately after immersion in water which acts as a thermal insulator and results in large values of the Biot number. Furthermore, the significant temperature gradients with respect to space are present in a specimen during the immersion quenching process, as shown in Figure 3c, with the temperature decrease at the bottom part of the specimen and at the side parts (black zones), and therefore this assumption holds.
This temperature of ca. 52 °C has been chosen in this experimental part and has a qualitative analysis purpose, since the final data were taken from Landek et al. [11]. Hence, using this temperature regime, the experimentally determined qualitative data on the temperature field, and the vapor evolution shown in Figure 3 were obtained.

2.2. Mathematical Modeling of an Immersion Process

2.2.1. The Eulerian Two-Fluid VOF Model

In the Eulerian two-fluid VOF model applied here, the mass, momentum, and energy conservation equations are defined on a per-phase basis, that is, for each phase involved in computation, a separate set of governing equations is being solved. The communication between the sets of the governing equations is established via the source terms that describe the interphase transfer between the phases. The description on the mathematical model underlying the selected approach is available in [20], while the generalities and application of the mesh motion has been tackled in [21]. Turbulent flow characteristics, associated with the flow studied herein, is extensively described in the recent paper by Cukrov et al. [22]. In order to establish a linear translatory motion of a solid specimen, an arbitrary Lagrangian–Eulerian (ALE) scheme is used for conduction of the motion of the computational mesh in conjunction with the constant velocity in the downward direction and the remeshing technique. Therefore, the transport equation for a general scalar, ϕ, would read:
d d t V   ρ ϕ d V + V   ρ ϕ u u g · d A = V   Γ 𝛻 ϕ · d A + V   S ϕ d V
where the first term on the left-hand side in Equation (1) represents the rate of change of the dependent scalar variable Φ in a cell volume that is changing its dimensions; the second term is the advection flux of a general scalar across the cell volume’s face, and is the term that accounts for the motion of the solid boundary, u g , together with the motion of the fluid with the velocity u ; whilst on the right-hand side of the equation are the diffusion flux across the cell face, and the source term, respectively. Hence, the governing equation for all the dependent variables in the case of mesh motion involves the velocity of the moving zone. The volumetric rate of change, i.e., the change in the cell volume with respect to time has to satisfy the so-called volume conservation law, also known as space conservation law, that may be expressed as:
d V d t = i n f u g , i · A i
where n f is the number of cell faces that compose the surface of a computational cell; u g , i is the velocity component in the normal direction to the i-th face of the cell; whilst A i is the area of the i-th face of the computational cell subjected to the mesh motion. The historical evolution of the approach together with its mathematical foundations has been addressed in dipping study by Aubram [23].
The numerical method used in this investigation is based on the Eulerian two-fluid VOF method implemented in commercial CFD software ANSYS Fluent 2022 R2, and its detailed description is given in Cukrov et al. [20]. Briefly, two sets of governing equations are solved on a per phase basis, while the connection between them is established via the source terms. In this research, however, an asymptotic case of the two-fluid model is invoked by involvement of asymptotic like limits in the momentum and energy conservation equations via the anisotropic drag (momentum equations) and zero-resistance (energy equations) models. The mass transfer, however, is established via the novel approach that stems from the balance between the energy jump model and the thermal phase change model.

2.2.2. Geometry Domains

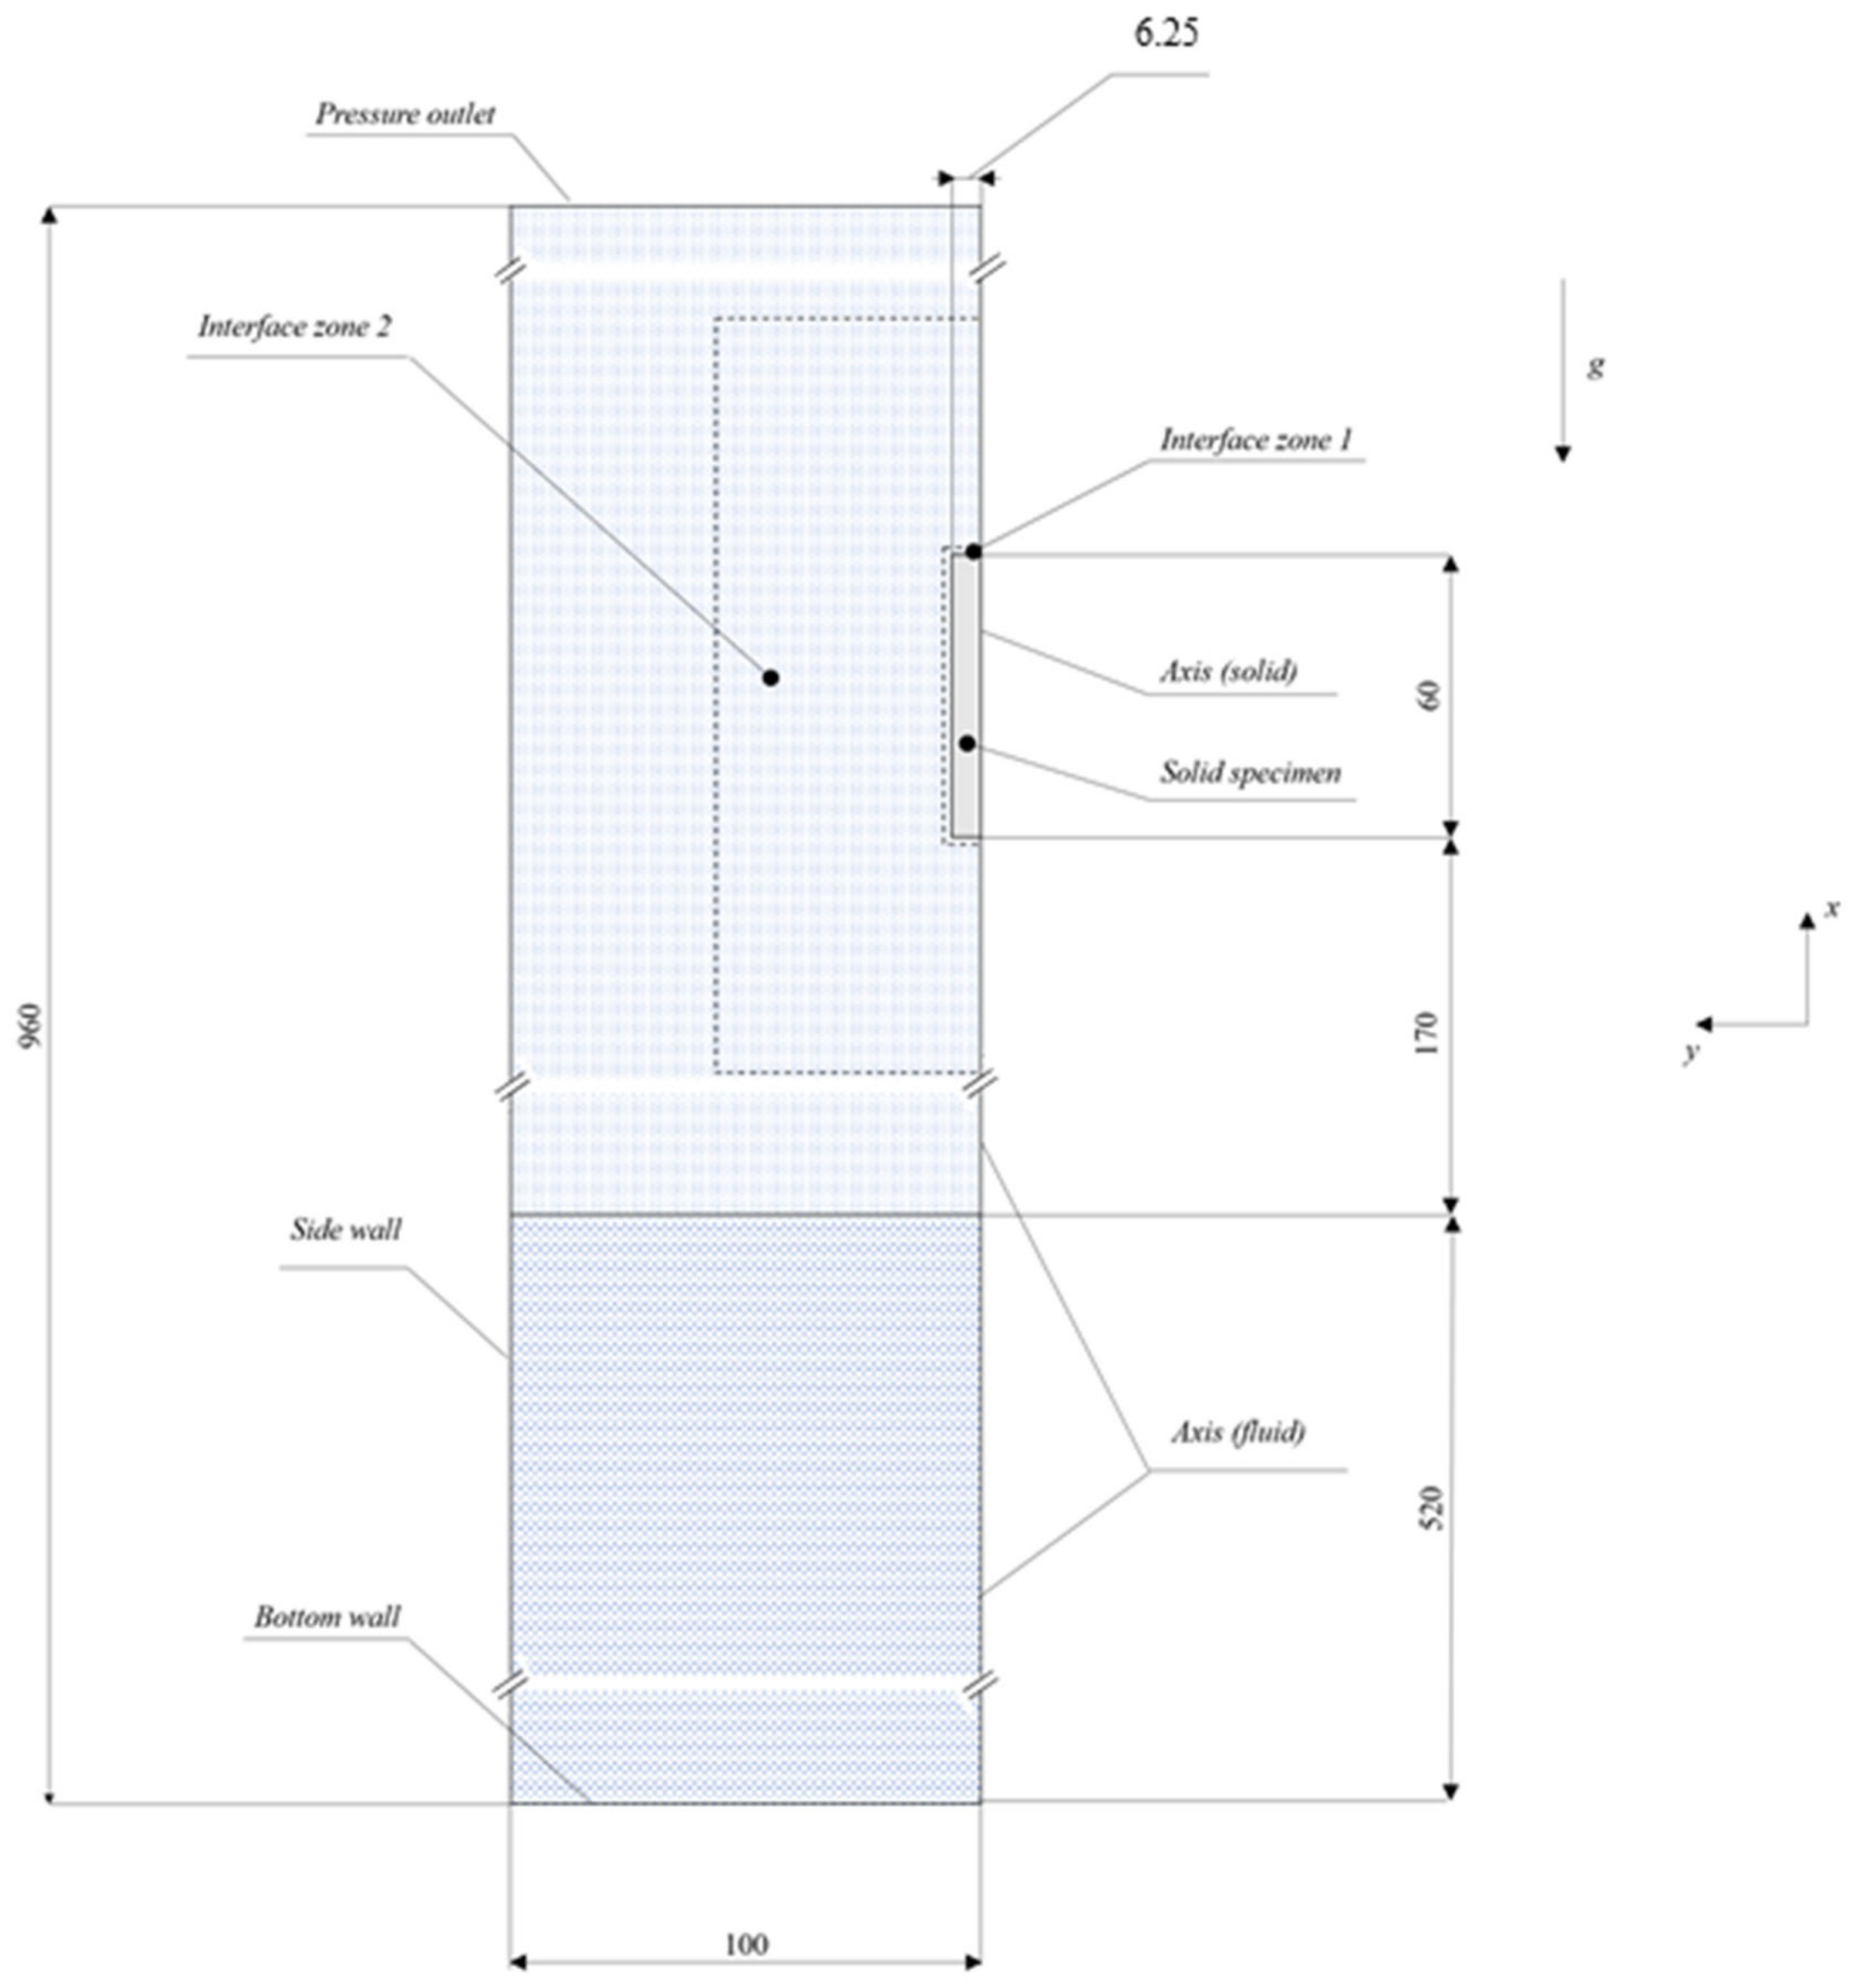
The test case is designed as shown in Figure 4. Two distinct fluid zones, namely vapor and a liquid zone, are present in the domain, together with one cell zone occupied by a solid. The computational domain is designed as an axis-symmetric and of dimensions 100 mm in radius and 960 mm in height, divided into two continua: fluid and a solid continuum; the fluid part thereby contains vapor and water medium, whilst the solid material is made of Inconel 600 alloy and its material properties are discussed in the forthcoming section. The material properties of the liquid and a vapor phase are defined based on the interface temperature as in [20]; hence, a thermal equilibrium is assumed at the interface, that is, the interface is kept at the saturation temperature due to macroscopic scale of the studied film boiling phenomena. Furthermore, one may also need to distinguish between two types of interfaces that are present during the water entry of a heated cylinder: the free surface and the interface. The free surface of water relates to a large-scale interface between two bulk mediums; whilst the interface is designated as the surface between the two phases in a phase-change process, that is, between the vapor phase, generated in boiling process, and a bulk liquid phase.
The solid continuum is of dimensions 6.25 mm radius and 60 mm height and occupies a zone on a symmetry axis as shown in Figure 4. These physical properties, namely: density, ρ s , thermal conductivity, λ s , and specific heat capacity, c s , assigned to the solid part are those of Inconel 600, nickel alloy used in the experiment from Landek et al. [11] shown in Table 1, and were taken from the properties listed in a Hännoschöck [24]; however, due to strong temperature dependence of thermal conductivity and the specific heat capacity, these values were approximated using piecewise-linear segments according to data listed in [24]. Thus, four different points: 200 °C, 400 °C, 600 °C, and 800 °C, were taken in approximation of specific heat capacities; whilst five points were used in extraction of thermal conductivity data: 200 °C, 400 °C, 600 °C, 800 °C, and 900 °C. The values of thermal properties between these temperatures are determined by linear interpolation.
The initial distributions of volume fraction (both liquid and vapor), TKE (liquid only) and temperature are imposed in the computational domain together with the zero-velocity field in a manner similar as before, using the Define-init user defined function. Figure 4 depicts the initial vapor and liquid fields, i.e., the respective volume fraction distributions, while dashed lines outline the two interface zones; first one being as in the former case, used in order to induce the mass transfer and specify the laminar zone in an initial vapor layer, the so-called “Interface zone 1”; whilst the second one is used for turbulence modeling purposes, i.e., the TKE value, that may calculated by the procedure similar to those in validation part, is imposed only in these cells, the so-called “Interface zone 2”. In order to prevent the occurrence of the mass transfer between two bulk phases, vapor and a liquid, the complete domain, with the exception of a single cell layer adjacent to the specimen wall, is set to 60 °C. Otherwise, due to the existence of temperature and volume fraction gradients at the interface, a mass transfer would take place. This prevention is necessary since in the real conditions there is air instead of the vapor zone, and hence no mass transfer would take place.

2.3. Generating a Finite Volume Mesh

As was noted before, the solid body is immersed using 130 mm/s velocity in the downward direction; thus, invoking the necessity to treat the problem as the moving boundary problem, since the specimen boundary changes its position with respect to certain part of the performed numerical simulation. This is accomplished via the “interface zone 2”, shown in Figure 4, which moves at a constant speed downward, embracing thereby all the subset zones: “interface zone 1”, and the solid zone. The motion is established for initial ~2 s, that is determined by the known distance that is to be passed by the bottom horizontal surface of the specimen.
Hence, in order to clearly denote the moving part of the domain, let the Ωmot. denotes to moving part, and Ωs, Ωint.1, Ωint.2 denote the solid body part of the domain, “interface zone 1”, and “interface zone 2”, respectively. Then, the motion part, Ωmot., reads:
Ω m o t . = Ω s     Ω i n t . 1 Ω i n t . 2 .  
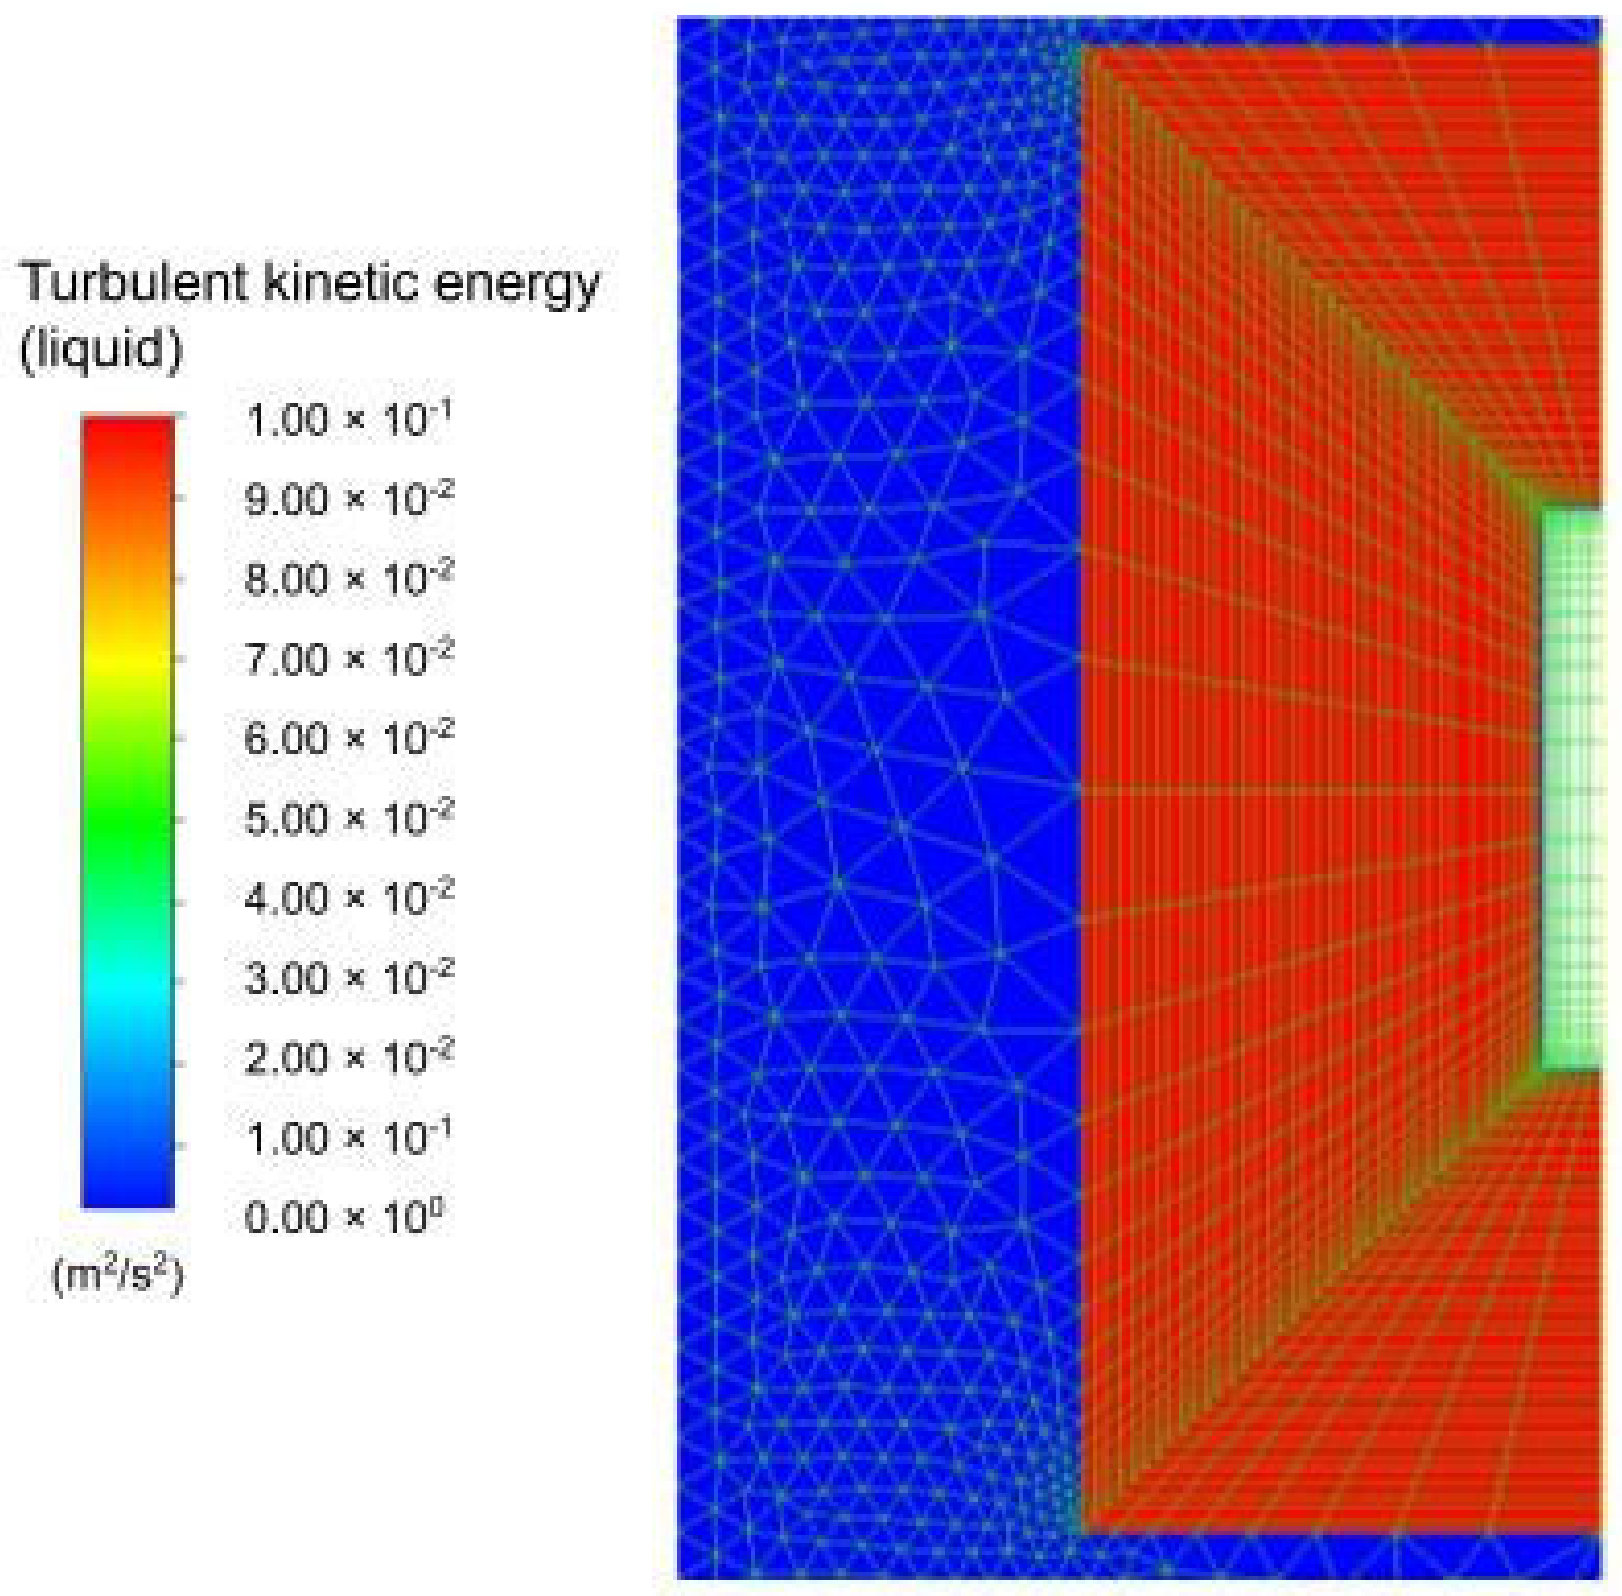
The hybrid mesh composed of both the triangular and quadrilateral cells is used in the present numerical simulation, as depicted in Figure 5.
The computational mesh is composed of 254 cells that consist of the solid part, contributing to, in total, 10,354 initial cells that compose the whole computational mesh, generated using GMSH open source mesh generator [25], that was also applied in structural ship analysis in Grubišić et al. [26]. The mesh sensitivity check, however, has not been carried out, since the Eulerian two-fluid model is used within the study. This is justified by the research conducted in Gauss et al. [27]. The authors have shown that in the case of bubble rise, a standard interface tracking case, the mesh resolution does not play a significant role in correct estimation of the terminal velocity of the bubble. Furthermore, the irrelevance of the grid resolution within the scope of Euler–Eulerian modeling has been explicitly stated in the study by Liu and Pointer [28]. This mesh size is not constant during the computation; yet it is increased due to remeshing procedure. The mesh is designed as a hybrid mesh, since it is composed of both the isotropic triangular and quadrilateral finite volumes. The mesh is by purpose designed to have a jump in cell height in transition from quadrilateral to triangular cells in order to impose the stringent conditions that are to appear in the industrial practice. The quadrilateral cell zone adjacent to the specimen is designed due to the highest accuracy of the numerical solution that is to be obtained on this type of grid. This has been found in the one in the Ph.D. thesis by Yoshikawa [29], wherein it is applied in the wind tunnel study. This, however, would mean that the continuum surface stress (CSS) model should be applied to model the surface tension, due to its robustness in handling coarse meshes as noted in the review by Kharangate and Mudawar [30]. However, within this research, the continuum surface model (CSF) proposed by Brackbill et al. [31] is employed, as in the previous study on stable film boiling in [22]. The usage of triangular cells is now mandatory due to remeshing technique that is used for immersion of a solid object into liquid medium.
Regarding the mesh quality metrics, the orthogonality on the initial mesh (without being subjected to a topological change due to mesh motion) is 3.33 × 10⁻¹ (minimum orthogonal quality), with the maximum cell aspect ratio of 1.4 × 101. The cell equivolume skewness, its facet maximum value, is found to be 0.67 upon the surface reports available in the graphical user interface.

2.4. Turbulence Modeling

In the former subsection, it has been outlined that the turbulence kinetic energy (TKE) is specified in the region outside the near wall adjacent zone consisted of one-cell layer, that may be denoted as “interface region 1”, but being thereby limited in the outer region with the boundary of “interface region 2” according to Figure 6.
The turbulence kinetic energy levels in the case of pool film boiling may be found to be similar to those in the case of wave flow, according to results obtained in the preceding chapter; a detailed Smoothed Particle Hydrodynamics (SPH) case of the wave flow is given in Makris et al. [32]; whilst the former (TKE values in pool film boiling studied herein) has been obtained merely using a parametric study, that was lately justified with a computational model, the latter (field TKE distributions) were confirmed with detailed numerical simulations.

2.5. Solution Procedure

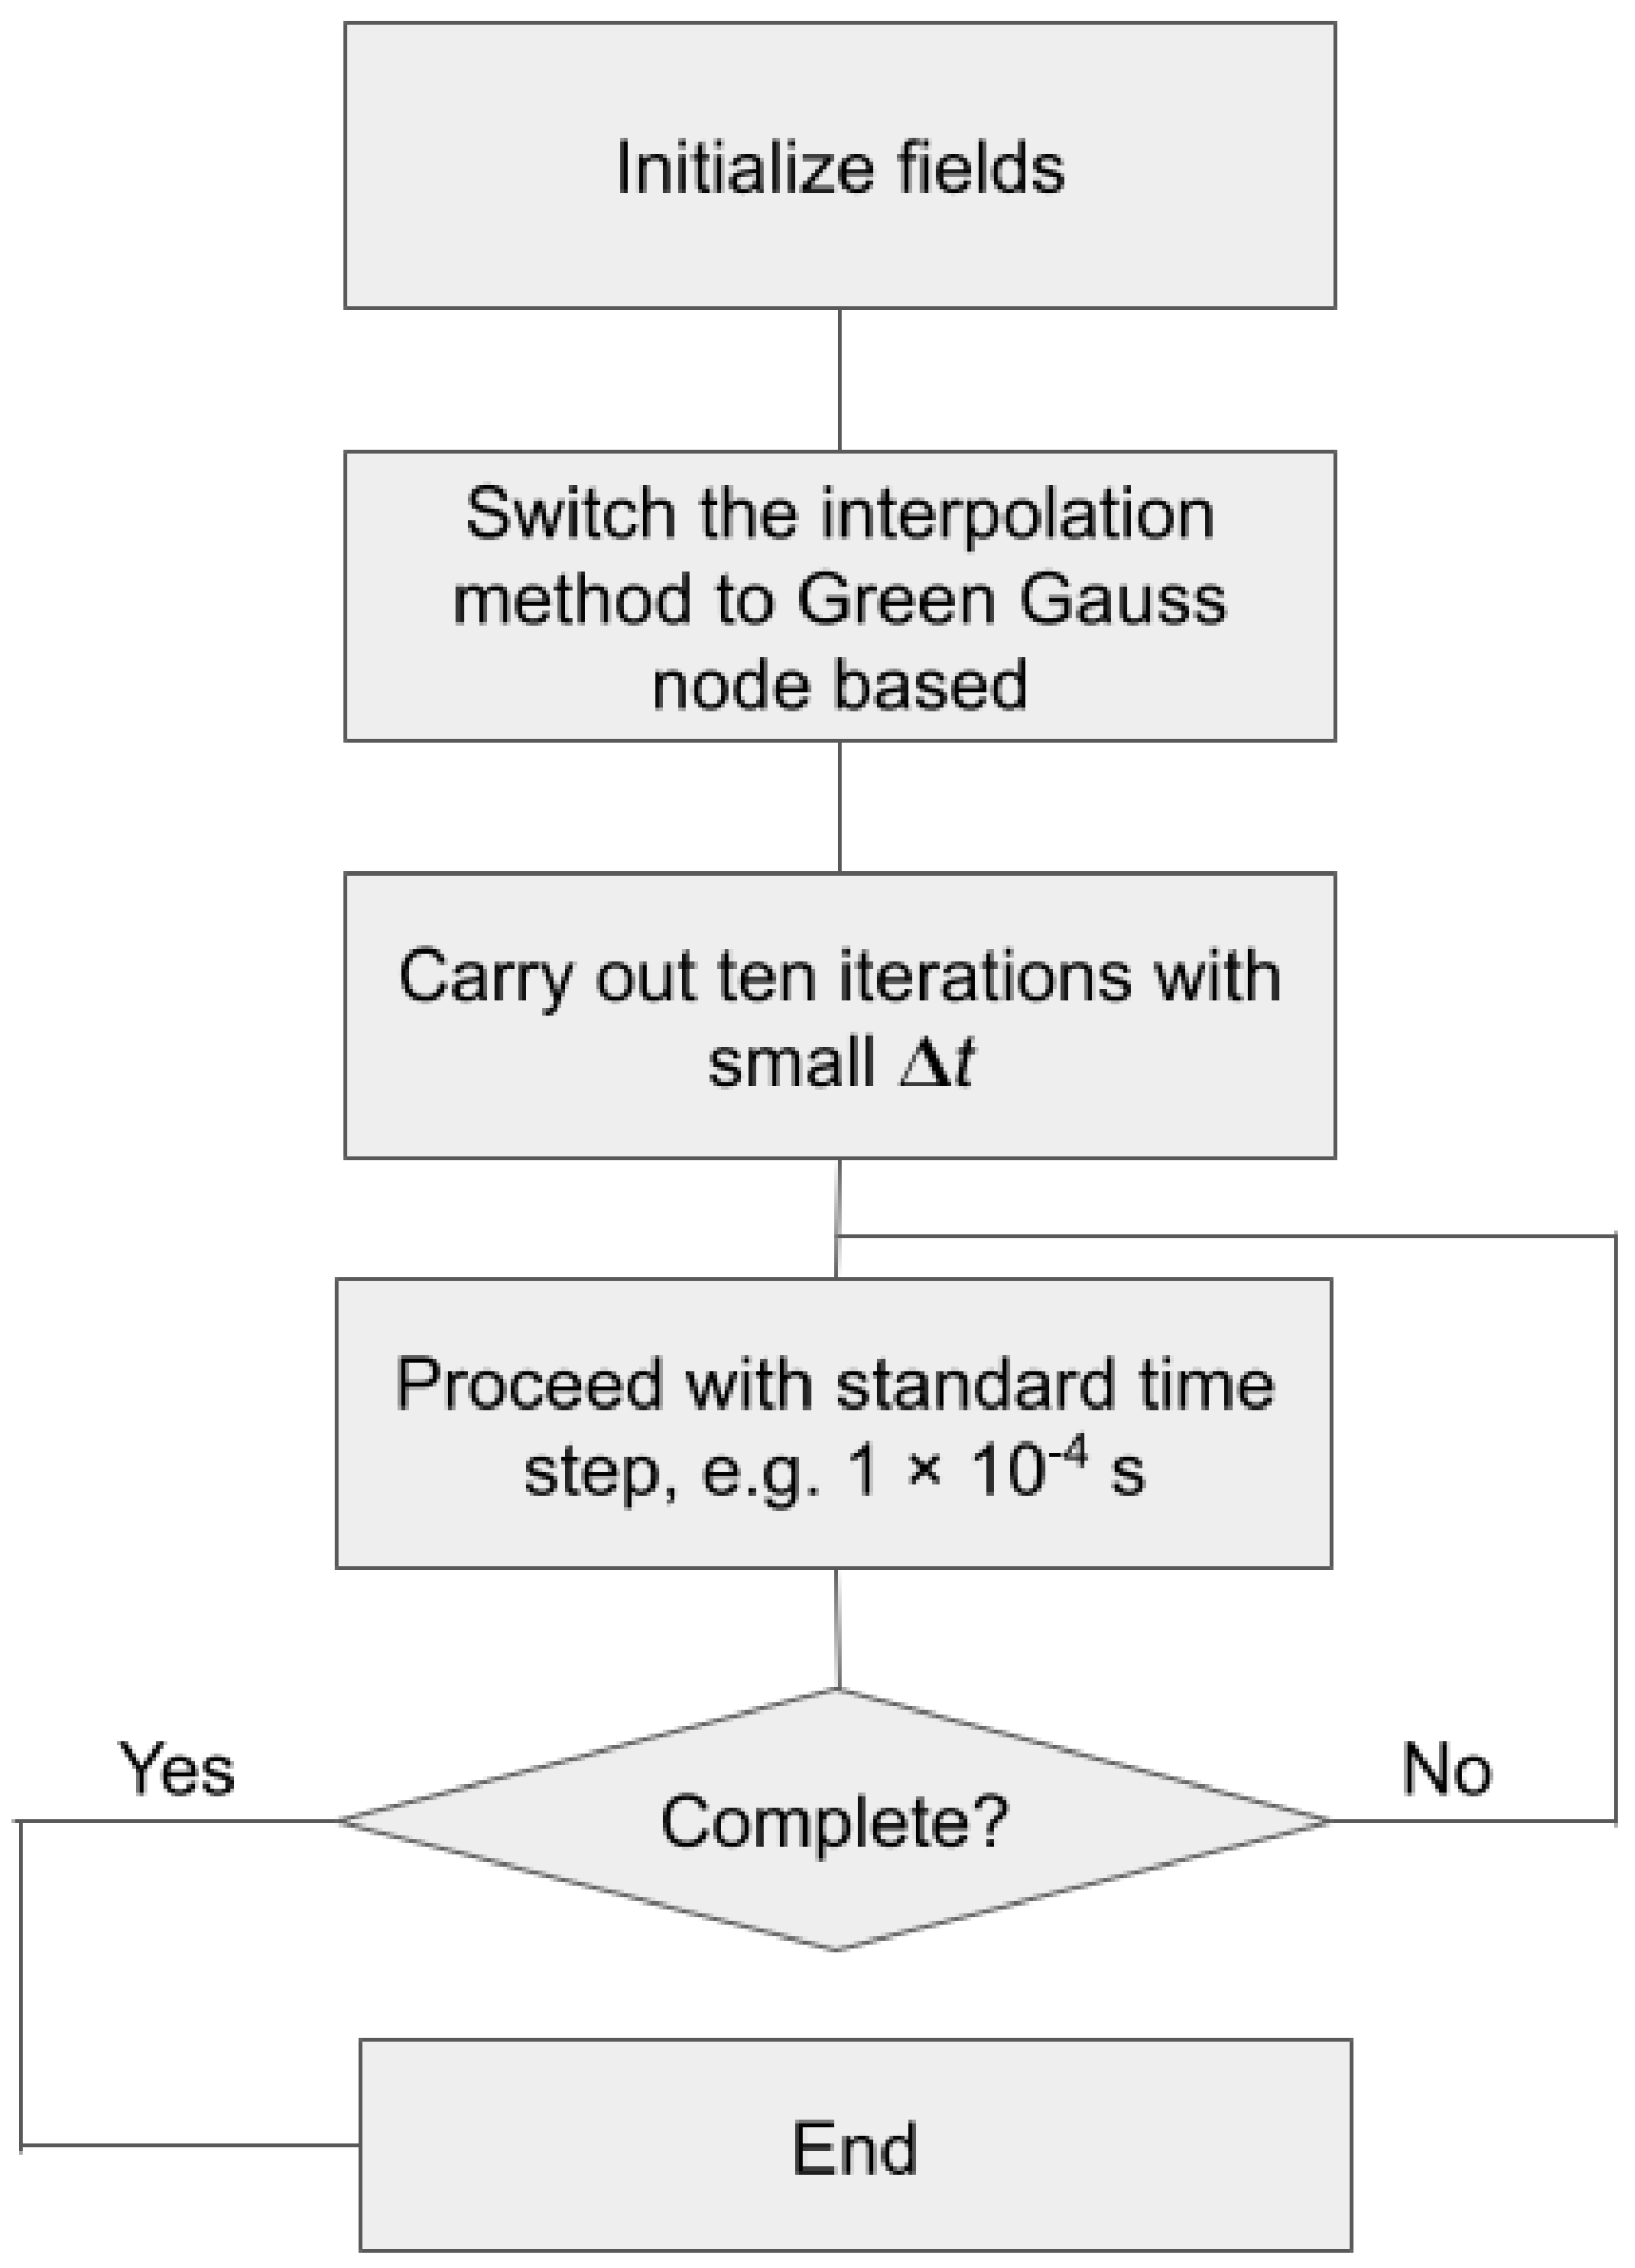
Firstly, ten iterations with a very small-time step were used for initialization. A stabilized bi-conjugate gradient method was switched in order to establish a stable computation; this has been addressed in the documentation as a stability measure in the case of convergence problems. Figure 7 shows the concise flowchart of the solution process.
It is noteworthy that, after the initialization has been carried out, the interpolation method is changed from the default least squares cell based to Green–Gauss node based, according to recommendation in the official documentation regarding the computations that involve triangular and/or tetrahedral meshes. The dipping of a solid specimen has been solved predominantly using 1 × 10⁻⁴ s. The temperature is limited to a lower-level value of 333.15 K, thus mimicking the Newton–Raphson numerical nonlinear equation system solution method, wherein a solution interval needs to be assumed [33]. This is due to some unphysical temperatures below the minimum temperature that were observed in the simulation.

3. Results and Discussion

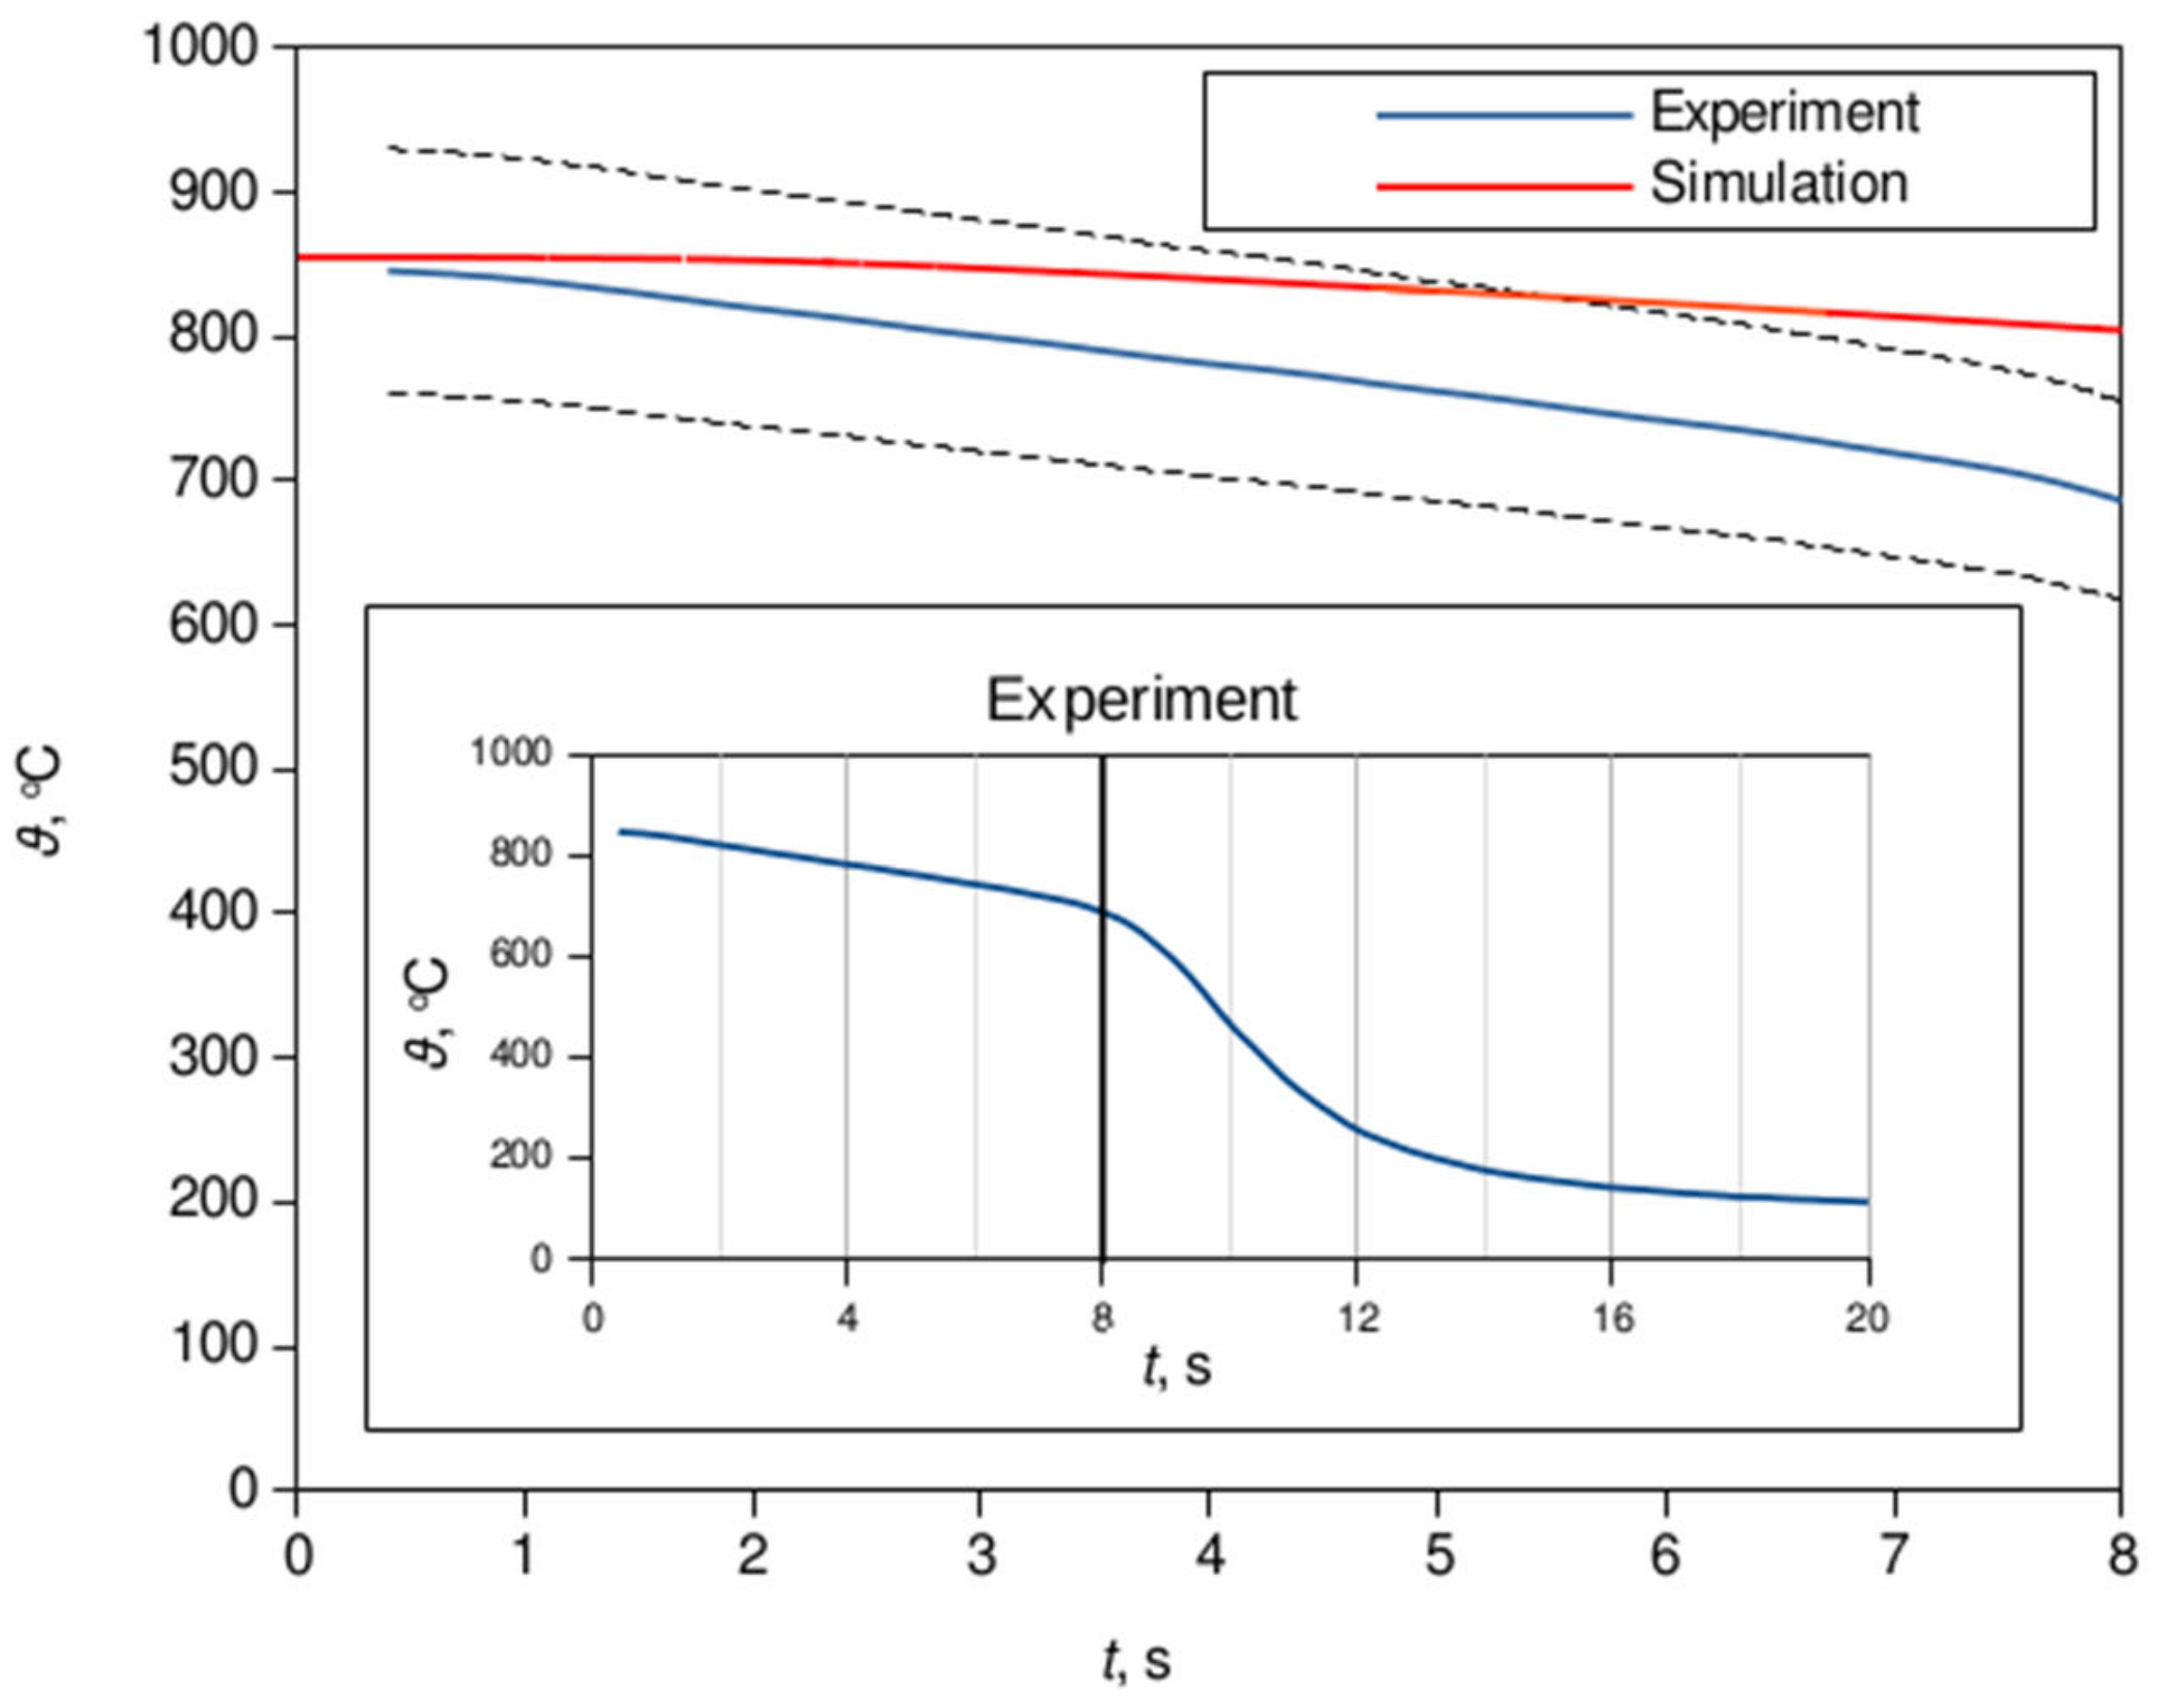
The temperatures were sampled in a vicinity of a specimen’s center, a volume-weighted average value in two cells in the immediate neighborhood of the specimen center was used due to mesh motion, i.e., the axial coordinate of a specimen’s cell center is being changed thorough the simulation, in particular during the immersion process, say, the initial ~2 s. The obtained temperature distribution exhibits the slope shown in Figure 8, and a fairly good agreement with the experimental data, with approximate ±10% error. The applied error band corresponds to the slightly higher one used in estimation of the heat transfer coefficients in Momoki et al. [34], that is, ±15%.
Furthermore, it is obvious that this error band covers the majority of the data before an inflection point of the experimental curve is reached; this can be deduced from the prescribed 10% error band and the auxiliary plot of the experimental data in Figure 8. It should be noted that the experimental data were tracked after the temperature in the specimen’s center had reached 849.9 °C [18].
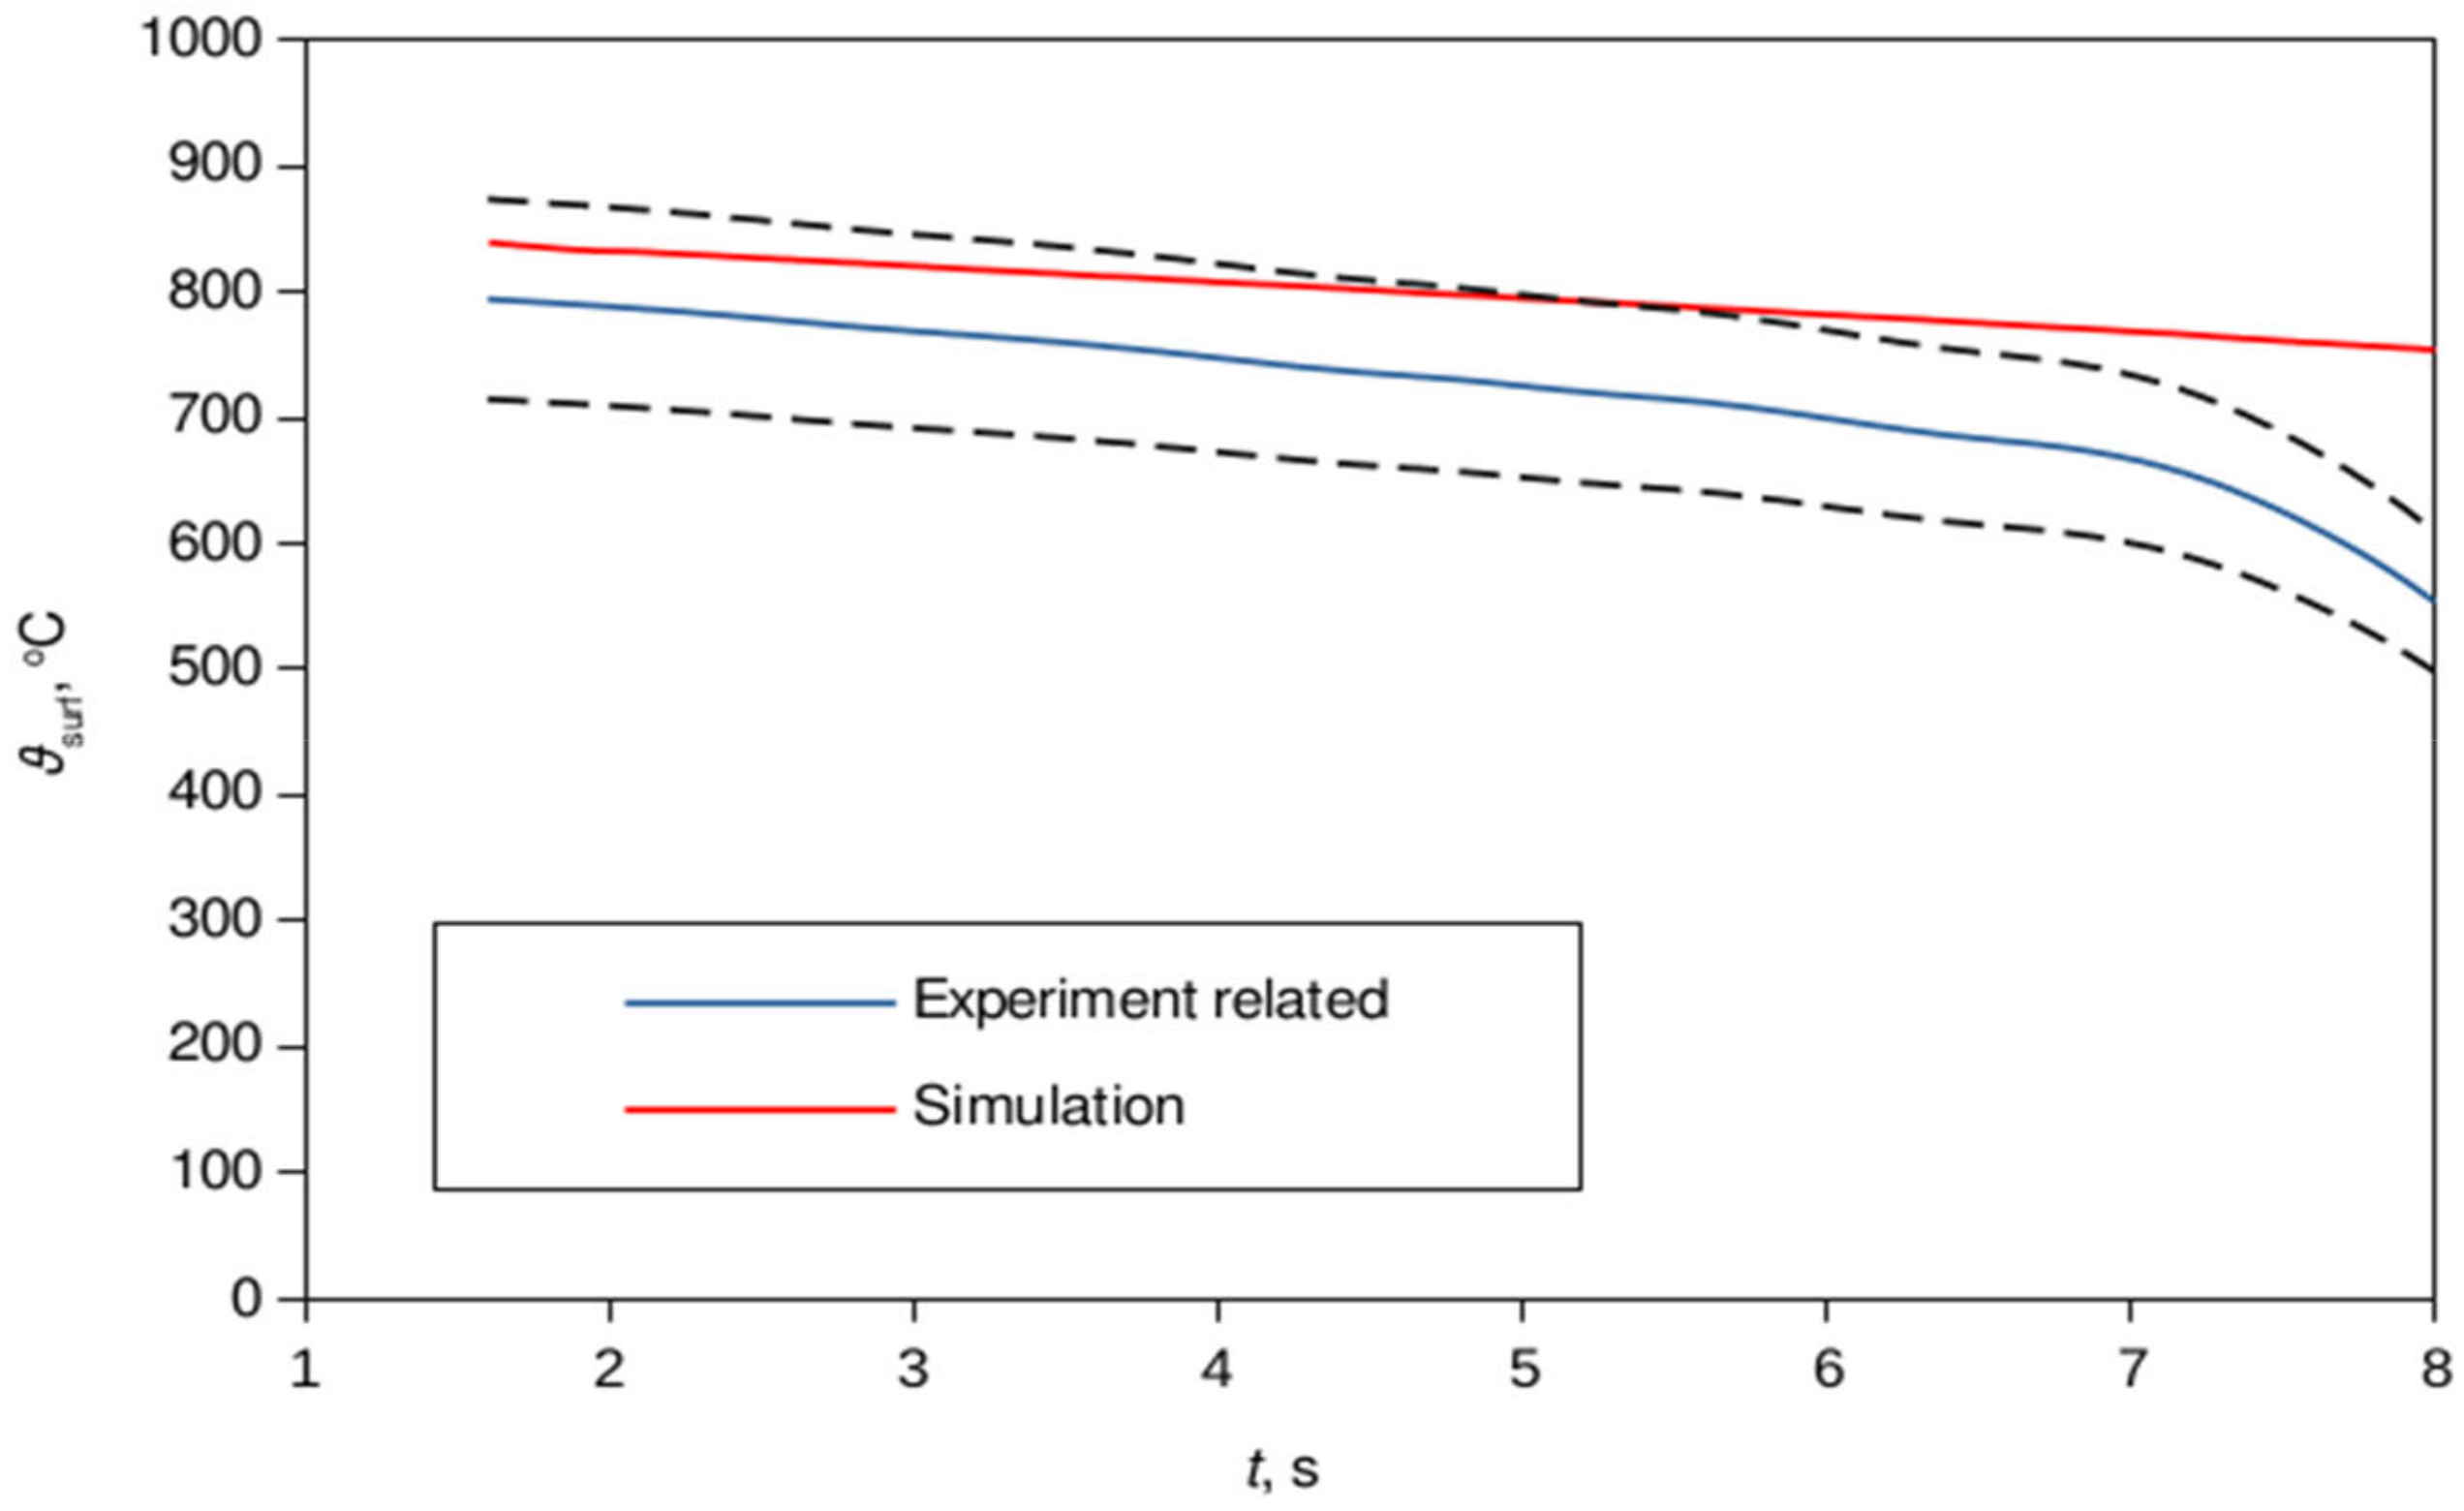
It is noteworthy that the experimentally based plot in Figure 9 is calculated from the inverse heat transfer analysis; hence, it is supposed that it has its own computational errors that should be taken into consideration.
We may note that further fine-tuning of TKE may lead to a more accurate result, but, since the intention of the present research is to have a model that is fully, or at least to a great extent, derived from the basic principles, this should not be regarded as an appropriate approach; yet, we use the TKE value of 0.1 m2/s2.
Since the applied TKE value in the frozen turbulence is too low, and, as noted before, the fine-tuning of any variable has been found as inappropriate due to basic principles approach that is to be kept throughout the complete investigation, the calculated temperature field using numerical simulation exceeds the prescribed ±10% error band somewhere at t > 6 s.
Figure 10 represents the temporal distribution of the vapor phase (Figure 10a) and the temperature field in a solid specimen, Figure 10b. The explosion of the vapor phase is noticeable from the change in vapor volume fraction at the liquid free surface, Figure 10a, whilst the temperature distribution shows the evolution of the cooling from the bottom surface up to the radial and longitudinal directions as shown in Figure 10b.
This confirms that using the Eulerian two-fluid method enables the accurate prediction of the temperature distribution in a solid material during film boiling mode of the immersion quenching process.

4. Conclusions

The numerical simulation setup required for calculation of temperature field in a solid specimen during the film-boiling phase of immersion quenching process has been presented in this paper. The context of this immersion process may be inherited from naval hydrodynamics application within the framework of water entry problems, in the sense that a cylinder water entry has been studied first. Additionally, this case, among others, also involves heat and mass transfer in contrast to the classical water entry problem, in conjunction with CHT.
Furthermore, the computational results of the numerical simulation of immersion quenching process have been obtained. The expected outcomes, i.e., the temperature distribution with respect to time in the specimen center and on its surface were obtained and compared to experimental (central temperatures) and experiment related, calculated, values (surface temperatures). A satisfactory agreement was achieved, thereby yielding data that fit to a great extent the prescribed error band of ±10%.
It was also shown that the method provides the detailed inspection in the flow fields as well as in the solid temperature distribution, that confirms that by using the Eulerian two-fluid model one may obtain the accurate field distribution of the temperature evolution in a solid material, based on known initial temperatures of the solid specimen and quenchant medium.
In addition, the further refinement of the applied TKE value would provide a more accurate result, but, since we want, to a great extent, the model that is based on the basic principles and the derivatives thereof, fine-tuning was found as an inappropriate approach in the context of the present study. Further theoretical treatises are needed in order to obtain a more comprehensive approach in further modeling of TKE. For example, a study by Takamatsu et al. [36] deals with stability analysis of the vapor film thickness in the case of subcooled film boiling around a horizontal wire.
In conclusion, this approach can be employed to tackle skin-resistance reduction via the vapor phase, that in contrast to standard air phase used in air lubrication systems (ALS) employed in naval hydrodynamics, possess superior thermophysical properties in the sense of heat rejection (for example, the specific heat capacity of air can be taken as the value at 0 °C 1.005 kJ/kg/K, while in the case of superheated vapor it has the value 1.93 kJ/kg/K). Thus, the boiling flow, which has been limited to the high-resolution meshes, if tackled using DNS of interface motion, or empiricism, when modeled using the Eulerian two-fluid models, can now be modeled at a moderate computational cost using the approach proposed within this work.

5. Future Work Perspectives

Since the proposed method is relatively simple to implement and covers a broad range of applications, a wide variety of possibilities could stem from the present research.
Moreover, as a subset of this approach, the general (isothermal) naval hydrodynamics problems may be tackled with the anisotropic drag model applied in the momentum equations in the present approach. Thus, a detailed computational meshes, as in the study in [37], may be tackled with moderate computational cost, that is, with lower-resolution meshes as is proven in a standard interface tracking case in [27]. The authors have shown the application of two-fluid model in the bubble rise case, and have proven that by the appropriate momentum transfer modeling the standard VOF case can be successfully resolved on a coarser grid. Furthermore, since the approach shown in the present paper uses asymptotic behavior of the two-fluid model, that is, the limiting case when the two-fluid model behaves as the one-fluid model (the equality of velocities at the interface shown in [20], there may be no need for the involvement of empiricism in the model.
Finally, we can conclude that by applying this approach we are a step forward to the application of naval hydrodynamics CFD practices in everyday use in the industry due to the moderate computational cost associated with it.

Author Contributions

Conceptualization, A.C. and D.L.; methodology, A.C. and Y.S.; software, I.B.; validation, A.C. and D.L.; formal analysis, A.C., D.L. and I.B.; investigation, A.C. and D.L.; resources, D.L. and I.B.; data curation, D.L.; writing—original draft preparation, A.C.; writing—review and editing, D.L. and Y.S.; visualization, A.C. and D.L.; supervision, D.L., Y.S. and I.B.; project administration, B.N.; funding acquisition, I.B. and B.N. All authors have read and agreed to the published version of the manuscript.

Funding

This research received no external funding.

Institutional Review Board Statement

Not applicable.

Informed Consent Statement

Not applicable.

Data Availability Statement

The data presented in this study are available on request from the corresponding author. The data are not publicly available due to privacy restrictions.

Acknowledgments

The inputs from Kai Zhang, Zhangjiang Laboratory, Shanghai, China, have been acknowledged. Furthermore, the help received by Izabela Martinez in conducting the experiment and reproducing the data has been also gratefully acknowledged. The first author would, furthermore, like to thank Daniel Zadravec for helping with obtaining the computational data.

Conflicts of Interest

The authors declare no conflict of interest.

References

  1. Toso, N.R.S. Contribution to the Modelling and Simulation of Aircraft Structures Impacting on Water. (Beitrag zur Modellierung und Simulation von Luftfahrtstrukturen beim Wasseraufprall). Ph.D. Thesis, Stuttgart University, Stuttgart, Germany, 2009. [Google Scholar] [CrossRef]
  2. Kleefsman, K.M.T.; Fekken, G.; Veldman, A.E.P.; Iwanowski, B.; Buchner, B. A Volume-of-Fluid Based Simulation Method for Wave Impact Problems. J. Comput. Phys. 2005, 206, 363–393. [Google Scholar] [CrossRef]
  3. Bašić, J.; Degiuli, N.; Werner, A. Simulation of Water Entry and Exit of a Circular Cylinder Using the ISPH Method. Trans. FAMENA 2014, 38, 45–62. [Google Scholar]
  4. Yu, P.; Shen, C.; Zhen, C.; Tang, H.; Wang, T. Parametric Study on the Free-Fall Water Entry of a Sphere by Using the RANS Method. J. Mar. Sci. Eng. 2019, 7, 122. [Google Scholar] [CrossRef]
  5. Lu, Y.; Del Buono, A.; Xiao, T.; Iafrati, A.; Xu, J.; Deng, S.; Chen, J. Parametric Study on the Water Impacting of a Free-Falling Symmetric Wedge Based on the Extended von Karman’s Momentum Theory. Ocean. Eng. 2023, 271, 113773. [Google Scholar] [CrossRef]
  6. Li, J.-C.; Wei, Y.-J.; Wang, C.; Xia, W.-X. Cavity Formation during Water Entry of Heated Spheres. Chin. Phys. B 2018, 27, 094703. [Google Scholar] [CrossRef]
  7. Jetly, A.; Vakarelski, I.U.; Yang, Z.; Thoroddsen, S.T. Giant Drag Reduction on Leidenfrost Spheres Evaluated from Extended Free-Fall Trajectories. Exp. Therm. Fluid Sci. 2019, 102, 181–188. [Google Scholar] [CrossRef]
  8. Gylys, J.; Skvorčinskienė, R.; Paukštaitis, L. Peculiarities of the Leidenfrost Effect Application for Drag Force Reduction. Mechanics 2014, 20, 266–273. [Google Scholar] [CrossRef]
  9. Felde, I. Új Módszer Acélok Edzéséhez Használatos Hűtőközegek Hűtőképességének Minősítésére. Ph.D. Thesis, Miskolci Egyetem, Miskolc, Hungary, 2007. [Google Scholar]
  10. Demirel, C. Experimentelle Untersuchung und Simulation des Abschreckprozesses von Bauteilähnlichen Geometrien aus G-AlSi7Mg. Ph.D. Thesis, Technical University Berlin, Berlin, Germany, 2009. [Google Scholar]
  11. Landek, D.; Župan, J.; Filetin, T. A Prediction of Quenching Parameters Using Inverse Analysis. Matls. Perf. Charact. 2014, 3, 229–241. [Google Scholar] [CrossRef]
  12. Troell, E.; Kristoffersen, H.; Bodin, J.; Segerberg, S.; Felde, I. Unique Software Bridges the Gap between Cooling Curves and the Result of Hardening∗. HTM J. Heat Treat. Mater. 2007, 62, 110–115. [Google Scholar] [CrossRef]
  13. Landek, D. Models and Algorithms for Computer-Aided Planning of Induction Hardening Process. Ph.D. Thesis, University of Zagreb, Zagreb, Croatia, 2005. [Google Scholar]
  14. Tenzer, F.M. Heat Transfer during Transient Spray Cooling: An Experimental and Analytical Study. Ph.D. Thesis, Technische Universität, Darmstadt, Germany, 2020. [Google Scholar]
  15. Jagga, S.; Vanapalli, S. Cool-down Time of a Polypropylene Vial Quenched in Liquid Nitrogen. Int. Commun. Heat Mass Transf. 2020, 118, 104821. [Google Scholar] [CrossRef]
  16. Afify, M.; Gentile, D.; Llory, M. Courbes d’ébullition en convection forcée. Deuxième partie: Effets paramétriques et corrélations. Houille Blanche 1986, 72, 463–474. [Google Scholar] [CrossRef]
  17. ISO 9950:1995; Industrial Quenching Oils—Determination of Cooling Characteristics—Nickel-Alloy Probe Test Method. International Organization for Standardization: Geneva, Switzerland, 1995.
  18. Župan, J.; Landek, D.; Filetin, T. Cooling Characteristics of Water Based Nanofluids with Agitation. Mater. Perform. Charact. 2014, 3, 326–336. [Google Scholar] [CrossRef]
  19. Liščić, B.; Tensi, H.M.; Canale, L.C.F.; Totten, G.E. Quenching Theory and Technology; CRC Press & Taylor & Francis Group, LCC.: Boca Raton, FL, USA, 2010. [Google Scholar]
  20. Cukrov, A.; Sato, Y.; Boras, I.; Ničeno, B. A Solution to Stefan Problem Using Eulerian Two-Fluid VOF Model. Brodogr. Teor. Praksa Brodogr. Pomor. Teh. 2021, 72, 141–164. [Google Scholar] [CrossRef]
  21. Zhu, H.J.; Lin, Y.H.; Xie, L.H. FLUENT Fluid Analysis and Simulation Practical Tutorial; People’s Posts and Telecommunications Press: Beijing, China, 2010. [Google Scholar]
  22. Cukrov, A.; Sato, Y.; Boras, I.; Ničeno, B. Film Boiling around a Finite Size Cylindrical Specimen—A Transient Conjugate Heat Transfer Approach. Appl. Sci. 2023, 13, 9144. [Google Scholar] [CrossRef]
  23. Aubram, D. An Arbitrary Lagrangian-Eulerian Method for Penetration into Sand at Finite Deformation. Ph.D. Thesis, TU Berlin, Berlin, Germany, 2014. [Google Scholar]
  24. Hannoschöck, N. Wärmeleitung und -Transport: Grundlagen der Wärme- und Stoffübertragung; Springer: Berlin/Heidelberg, Germany, 2018; ISBN 978-3-662-57571-0. [Google Scholar]
  25. Geuzaine, C.; Remacle, J.-F. Gmsh: A 3-D Finite Element Mesh Generator with Built-in Pre- and Post-Processing Facilities. Int. J. Numer. Methods Eng. 2009, 79, 1309–1331. [Google Scholar] [CrossRef]
  26. Grubišić, L.; Lacmanović, D.; Tambača, J. Preconditioning the Quad Dominant Mesh Generator for Ship Structural Analysis. Algorithms 2022, 15, 2. [Google Scholar] [CrossRef]
  27. Gauss, F.; Lucas, D.; Krepper, E. Grid Studies for the Simulation of Resolved Structures in an Eulerian Two-Fluid Framework. Nucl. Eng. Des. 2016, 305, 371–377. [Google Scholar] [CrossRef]
  28. Liu, Y.; Pointer, W.D. Eulerian Two-Fluid RANS-Based CFD Simulations of a Helical Coil Steam Generator Boiling Tube; Oak Ridge National Lab. (ORNL): Oak Ridge, TN, USA, 2017. [Google Scholar]
  29. Yoshikawa, M. A Study on Wind Load Estimation of High-Rise Buildings by Unstructured Grid LES. Ph.D. Thesis, Tokyo Institute of Technology, Tokyo, Japan, 2016. [Google Scholar]
  30. Kharangate, C.R.; Mudawar, I. Review of Computational Studies on Boiling and Condensation. Int. J. Heat Mass Transf. 2017, 108, 1164–1196. [Google Scholar] [CrossRef]
  31. Brackbill, J.U.; Kothe, D.B.; Zemach, C. A Continuum Method for Modeling Surface Tension. J. Comput. Phys. 1992, 100, 335–354. [Google Scholar] [CrossRef]
  32. Makris, C.V.; Memos, C.D.; Krestenitis, Y.N. Numerical Modeling of Surf Zone Dynamics under Weakly Plunging Breakers with SPH Method. Ocean. Model. 2016, 98, 12–35. [Google Scholar] [CrossRef]
  33. Čančarević, M. Približno rješavanje nelinearnih sustava (Newton–Raphsonova metoda). Poučak Čas. Metod. Nastavu Mat. 2010, 11, 64–72. [Google Scholar]
  34. Momoki, S.; Yamada, T.; Shigechi, T.; Kanemaru, K.; Yamaguchi, T. Film Boiling Around a Vertical Cylinder with Top and Bottom Horizontal Surfaces; American Society of Mechanical Engineers Digital Collection. In Proceedings of the ASME/JSME 2007 Thermal Engineering Heat Transfer Summer Conference, Vancouver, BC, Canada, 8–12 July 2007; pp. 611–619. [Google Scholar]
  35. Rohatgi, A. WebPlotDigitizer, Version 4.5; Pacifica, CA, USA. 2021. Available online: https://automeris.io/WebPlotDigitizer/ (accessed on 19 August 2022).
  36. Takamatsu, H.; Yamashiro, H.; Honda, H. Theoretical Analysis of the Stability of Vapor Film in Subcooled Film Boiling on a Horizontal Wire. Heat Transf. Jpn. Res. 1997, 26, 219–235. [Google Scholar] [CrossRef]
  37. Degiuli, N.; Farkas, A.; Martić, I.; Zeman, I.; Ruggiero, V.; Vasiljević, V. Numerical and Experimental Assessment of the Total Resistance of a Yacht. Brodogr. Teor. Praksa Brodogr. Pomor. Teh. 2021, 72, 61–80. [Google Scholar] [CrossRef]
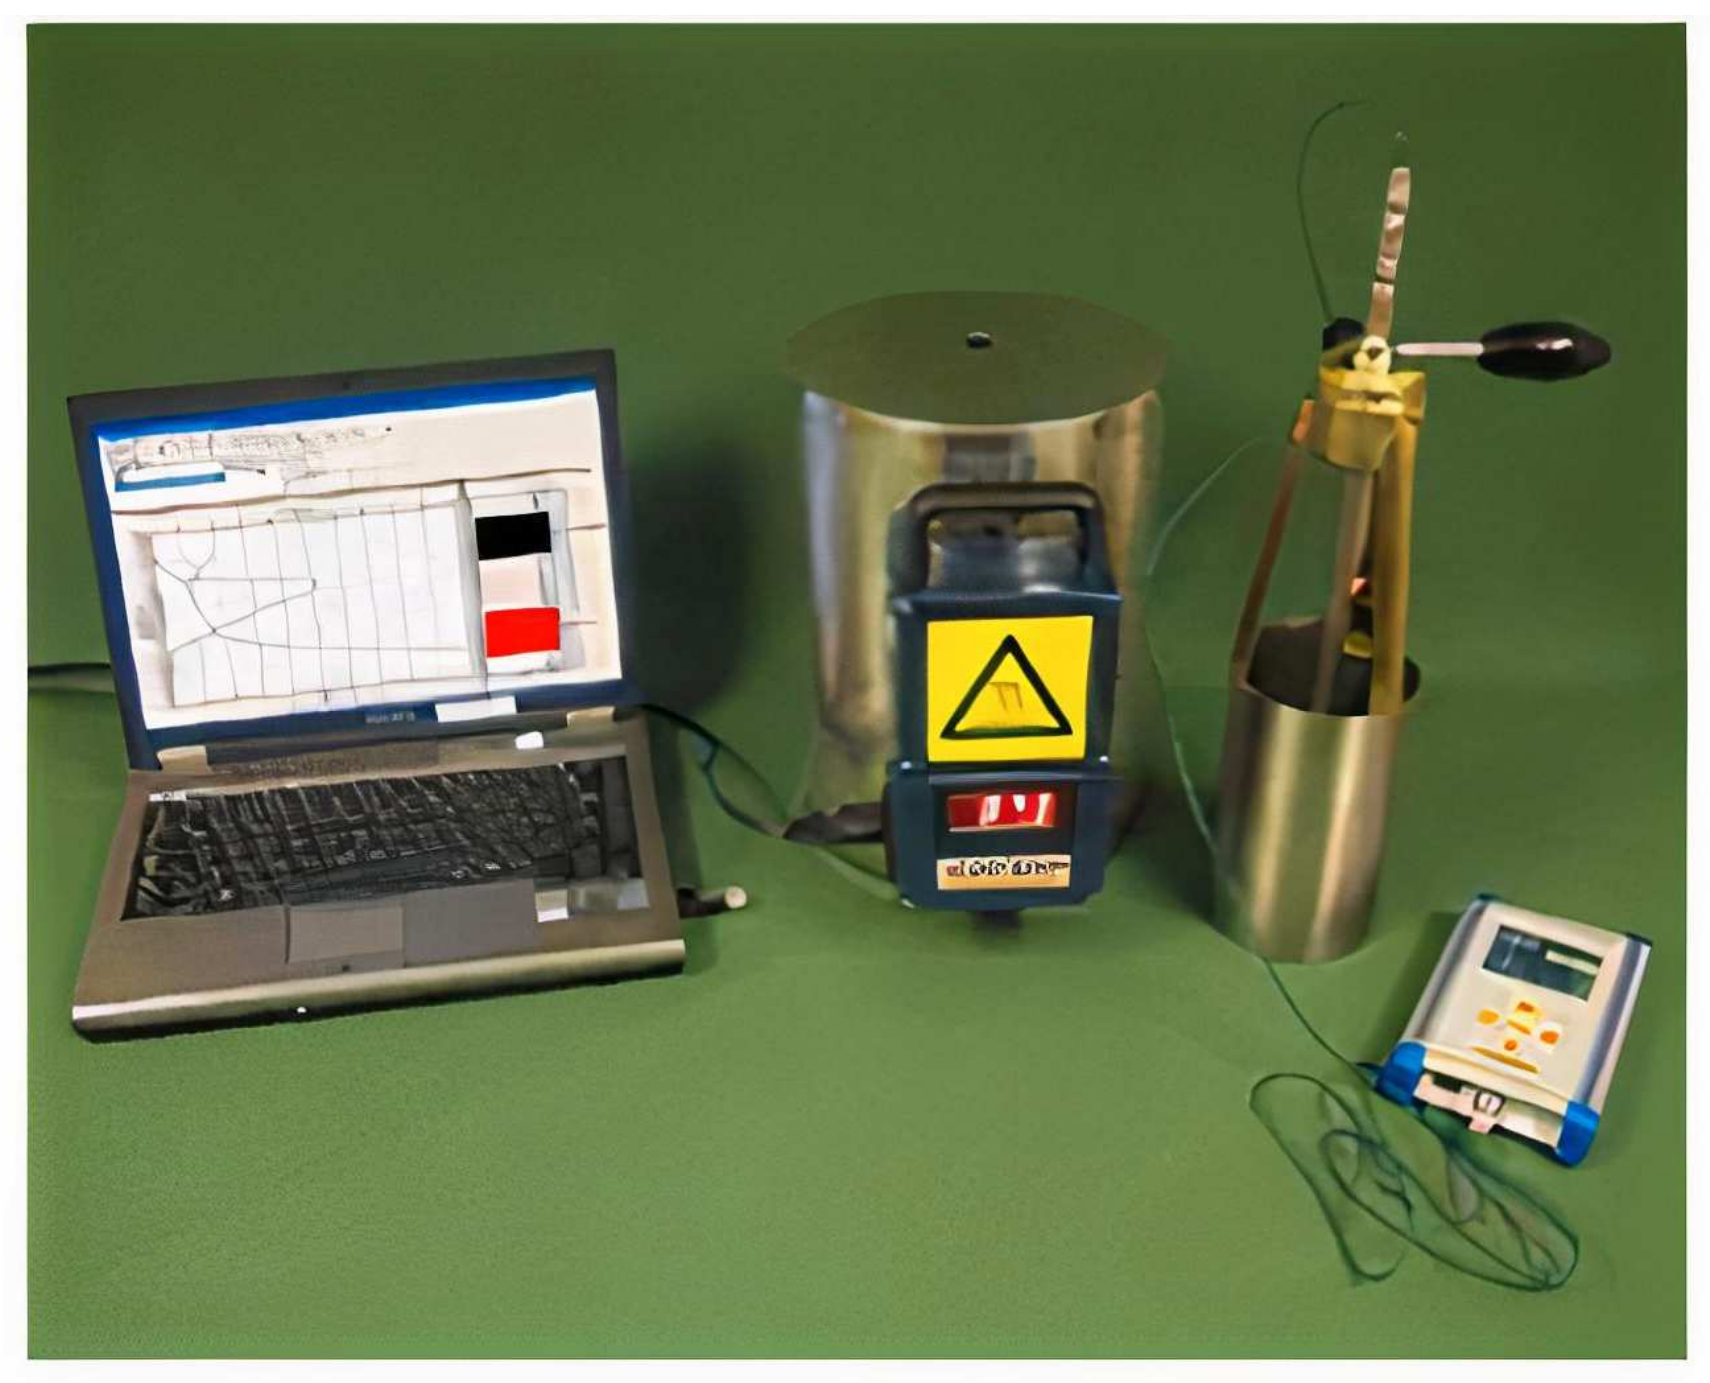
Figure 2. The ivf SmartQuench® system for recording cooling curve due to the ISO 9950 standard.
Energies 16 07926 g002
Figure 3. The water entry of an Inconel 600 nickel alloy during the immersion of the specimen quenching in a quiescent liquid-water pool at the initial pool temperature of ca. 52 °C: (a) immediately before the immersion; (b) 1 s after the top of the body has been immersed; (c) 3 s later on during the immersion quenching process.
Energies 16 07926 g003
Figure 4. An overview of the computational domain with the selected boundary conditions; a “Coupled” boundary condition that is prescribed boundary condition is omitted from the sketch for the sake of clarity. All the dimensions are expressed in mm.
Energies 16 07926 g004
Figure 5. A view on computational mesh: (a) the area in the vicinity of the specimen; (b) a broader view.
Energies 16 07926 g005
Figure 6. The initial TKE distribution in the analyzed case.
Energies 16 07926 g006
Figure 7. Flowchart of the simulation process conducted herein.
Energies 16 07926 g007
Figure 8. Comparison of the computational result in the vicinity of the specimen center with the data available from the experiment in Landek et al. [11]; extracted using [35]. The dashed lines represent 10% discrepancy from the experimental data.
Energies 16 07926 g008
Figure 9. Comparison of the surface temperature obtained using the data from the experiment in Landek et al. [11] and the simulation data. The dashed lines denote 10% discrepancy from the published data.
Energies 16 07926 g009
Figure 10. The volume fraction field evolution in time (a) together with the spatial temperature distribution in degrees Kelvin in solid (b), both being addressed during the water entry, i.e., the immersion process.
Energies 16 07926 g010
Disclaimer/Publisher’s Note: The statements, opinions and data contained in all publications are solely those of the individual author(s) and contributor(s) and not of MDPI and/or the editor(s). MDPI and/or the editor(s) disclaim responsibility for any injury to people or property resulting from any ideas, methods, instructions or products referred to in the content.