Article

Enhanced Gas Recovery for Tight Gas Reservoirs with Multiple-Fractured Horizontal Wells in the Late Stages of Exploitation: A Case Study in Changling Gas Field

1
School of Petroleum Engineering, China University of Petroleum (Beijing), Beijing 102249, China
2
Research Institute of Petroleum Exploration & Development, PetroChina, Beijing 100083, China
3
Science and Technology Management Department, China National Petroleum Corporation (CNPC), Beijing 100007, China
4
School of Petroleum Engineering, Yangtze University, Wuhan 430100, China
5
Research Institute of Petroleum Exploration & Development, Tarim Oilfield Company, PetroChina, Korla 841000, China
*
Author to whom correspondence should be addressed.
Energies 2023, 16(24), 7918; https://doi.org/10.3390/en16247918
Submission received: 6 November 2023 / Revised: 28 November 2023 / Accepted: 1 December 2023 / Published: 5 December 2023
(This article belongs to the Special Issue Advances in the Development of Unconventional Oil and Gas Resources)

Abstract

:
To initially improve the gas production rate and shorten the payback period for tight gas reservoirs, the multiple-fractured horizontal well (MFHW) model is always applied. However, in the late stages of exploitation, it is difficult to adopt reasonable measures for enhanced gas recovery (EGR), particular for continental sedimentary formation with multiple layers, and efficient strategies for EGR in this type of gas field have not yet been presented. Therefore, in this paper, a typical tight gas reservoir in the late stages of exploitation, the Denglouku gas reservoir in Changling gas field, in which MFHWs were utilized and contributed to the communication of the higher Denglouku formation (0.34 mol% CO2) and lower Yingcheng formation (27 mol% CO2) during hydraulic fracturing, is studied comprehensively. Firstly, alongside the seismic, logging, drilling and experimental data, 3D geological and numerical simulation models are developed. According to the differences in CO2 mole fractions for different formations, the gas production rate of MFHWs produced from Denglouku formation is accurately calculated. Then, the well gas production rate (WGPR) and the well bottom-hole pressure (WBHP) history are matched with the calculated values, and thus the types of remaining gas are provided through the fine reservoir description. Finally, in a combination of gas recovery and economics, the optimal infill well type and the adjustment scheme are determined. The results show that there are three main categories of remaining gas, which are areal distribution, abundant points, and marginal dispersion, and the ratios of reaming gas reserve for these three types are 80.3%, 4.2%, and 15.5%, respectively. For the tight gas reservoir developed by MFHWs with parallel and zipper patterns, the best infilling well type is the vertical well. The combination of patching holes, sidetracking, infilling and boosting can obtain the highest gas recovery, while the scheme with patching holes and sidetracking has the best economic benefits. To balance the gas recovery and economics, the measurement of patching holes, sidetracking and infilling with vertical wells is utilized. In the final production period, compared with the basic schemes, the gas recovery can increase by 5.5%. The primary novelty of this paper lies in the determination of the optimal infilling well types and its presentation of a comprehensive adjustment workflow for EGR in tight gas reservoirs. The conclusions in this paper can provide some guidance for other similar tight gas reservoirs developed with MFHWs in the later period.

1. Introduction

Tight gas reservoirs in the late stages of exploitation are always faced with low production/productivity, low gas recovery factors, and high decline rate. It is urgent to propose reasonable adjustment schemes and strategies for EGR. For example, take the Denglouku gas reservoir in Changling gas field, it was developed with MFHWs from 2012. In 2018, the gas production rate had decreased from 4.27 × 10⁸ m3 to 1.69 × 10⁸ m3, and the sum of gas productivity for MFHWs decreased from 20.70 × 10⁴ m3/d to 5.89 × 10⁴ m3/d. Due to the large CO2 mole fraction of produced gas, it was therefore believed that the Yingcheng formation (27 mol% CO2) had communicated with the Denglouku formation (0.34 mol% CO2) via these MFHWs during drilling or fracturing. After completing a precise splitting calculation, the cumulative gas production rate produced from Denglouku formation is 12.68 × 10⁸ m3, and the gas recovery is merely 13.7% [1,2]. There is great potential for EGR in this gas reservoir.
In China, most of the tight gas reservoirs originate from continental deposits, which also include the target gas reservoir in this paper. In terms of the distribution type of remaining gas for the gas reservoir generated from the continental sedimentary environment, according to the differences in origin, it can be divided into four classical types, which are the uncontrolled gas reserve in an area, the unpenetrated gas reserve in the vertical direction, the remaining gas reserve caused by uncompleted perforation or fracturing, and the remaining gas caused by an internal choke zone in composite sand body [3,4,5,6,7]. However, these types are identified primarily from the geological aspects, and currently there is shortage in classifications for the remaining gas from the aspect of production dynamics. In addition, although some studies have presented various pore-scale water–gas immiscible flow models, and described the distribution law of the water and remaining gas in porous media, the scale and the form of remaining gas are indeed difficult to obtain, which only serves to provide some insights into the occurrence of the remaining gas [8,9].
To enhance the gas recovery and exploit the remaining gas in the formation, many technologies, such as infilling wells, CO2/N2 flooding and injection of chemical agents, have been applied in practice. The mechanisms for these methods are the increasing in production degree of reserves, pressure drawdown sweep efficiency and pressure depletion efficiency [10,11,12]. Currently, for tight gas reservoirs exploited with vertical wells, the technologies for infilling wells for EGR have been presented, which are mainly based on the quantitative geological model, the dynamic drainage area, the ratio of inter-well interference, the dynamic inversion of numerical simulation and the critical well space [13,14,15,16,17,18,19,20,21]. For tight gas reservoirs developed by MFHWs, to improve the gas recovery, the methods of side tracking for old wells and placement optimization for new infilling wells have been presented [22,23,24,25,26]. Nevertheless, these methods have not been applied on a large scale due to their immaturity, and are kept in the process of pilot tests. In recent years, due to the combined advantages of CO2 injection for efficient displacement of methane and sequestration in tight gas reservoirs, the studies on the CO2 flooding for EGR in conventional and unconventional gas reservoirs have become popular. Through a larger number of experiments and numerical simulations, the results show that under the mechanisms of superior adsorption of CO2 in shale or tight gas reservoirs, the gas recovery can be increased by 6~20%, and the effective storage of CO2 can also be achieved simultaneously, which is a promising technology for reducing greenhouse gas emissions and increasing the ultimate gas recovery [27,28,29,30,31,32]. However, currently, these studies are restricted to laboratory experiments and numerical simulations; influenced by the economics and immaturity of the technology, there are rare pilot tests carried out in practice. In addition, apart from the above technologies, to reduce the formation damages that are caused by water blocking, some researchers have developed the drying agents for EGR in tight gas reservoirs, and evaluated the basic properties, injection modes and drying effects for this type of agent [33,34,35,36,37,38]. Though it shows that this agent can greatly reduce water saturation, and improve the gas seepage capacity and the productivity, this study is an exploratory work, and is not currently used in practice.
With consideration of the insufficiency of studies into EGR in tight gas reservoirs, in this paper, Denglouku gas reservoir in Changling gas field is taken as a typical example to study the types of remaining gas and the optimal adjustment schemes. Firstly, with the seismic, logging, drilling and experimental data, the geological and numerical simulation models for this reservoir are developed. Through the precise splitting for gas production, the gas production produced from the Denglouku formation is obtained. Thus, after the history match with the monitored WGPR and WBHP data, the types of remaining gas are provided. Based on the current well patterns, the optimal infilling well type is determined by comparing the simulation results that are obtained from conceptual models. Finally, multiple adjustment schemes are designed, and with the numerical simulation model, the optimal adjustment strategies are determined through the comprehensive evaluation on the gas recovery and net present value (NPV). The research results and workflow are of great importance to the design of EGR schemes for tight gas reservoirs developed with MFHWs in the late stages of exploitation. In addition, there are some scientific novelties, which include the revelation of the remaining gas type in tight gas reservoirs from the aspect of production dynamics and the determination of optimal infilling gas well types for tight gas reservoirs developed with MFHWs through the utilization of numerical simulation methods.

2. Detailed Description of Remaining Gas

2.1. Background of Gas Reservoir

The structure of Denglouku formation and Changling gas field is flat, while in the high locations, the formation does not exist. The depth for this reservoir is about 3400~3900 m, and the sedimentary type is shallow lake facies and delta facies, in which there are four microfacies: distributary channel, interdistributary bay, natural levee and crevasse splay. In the vertical direction, the formation can be divided into eight sandstone zones (D1–D8), and according to the sedimentary cycle, it can be divided into twenty further layers. The average thickness of layers for the sandstones D1–D5 is 10~15 m, and the thickness for the sandstones D6–D8 is larger than others, while they do not exist in the high locations. However, compared with the sandstone thickness, the thickness of the effective formation is relatively smaller. The well-logging results demonstrate that the drilled average thickness of the net pay zone for each well is 38.19 m only, and the thickness for the sandstones D3 and D4 is 26.47 m, which occupies the proportion of 69.3%. In addition, the net-to-gross ratio for these two sandstones are larger than 60%, which can be seen as the dominant formation for this tight gas reservoir. For sandstones D1, D2, D5 and D6, the net-to-gross ratio is relatively low, and the net pay zone only exists in part of the reservoir, while for sandstones D7 and D8, there is no effective zone.
The core is mainly composed of fine siltstone and mudstone, and the ratio for these two rocks are 88.64% and 11.23%. The analysis for the rock shows that the weight proportion of quartz, feldspar and lithic fragments are 35~40%, 20~30% and 30~40%, respectively. In this reservoir, interparticle dissolution pores and intragranular pores are the main storage space, and there are few natural fractures. In a combination of well logging and laboratory experimental results, it shows that the average formation porosity, gas saturation and permeability are 6.35%, 51.86% and 0.08 × 10⁻³ μm2, respectively. According to the definition of the tight gas reservoir (the matrix permeability under the confining pressure is lower than 0.1 × 10⁻³ μm2), the target gas reservoir in this study is a typical tight gas reservoir.
The pressure coefficient for the target formation is 1.15, which belongs to the normal pressure system. The analysis for fluid components shows that the CH4 is the main component, and the CO2 and N2 are present in such low quantities that they can be ignored. The formation water contains NaHCO3, Na2SO4 and CaCl2. With the volumetric method, the estimated gas reserve for this reservoir is 93.87 × 10⁸ m3. Through the comprehensive evaluation of the above parameters, it is believed that this reservoir is a typical tight gas reservoir that is controlled by the geological structure. Currently, there are 37 wells in this reservoir, and the field gas and water production rate are 34.2 × 10⁴ m3/d and 48.3 m3/d. The cumulative gas production rate for this reservoir is 12.8 × 10⁸ m3, and the recovery factor is only 13.7%. The well tubing and casing head pressure are 3.5 MPa and 6.7 MPa, respectively. According to the pressure magnitude, the reservoir has entered into the late stages of exploitation.

2.2. Geological Model

Based on the geological characteristics of this tight gas reservoir, the stratified information, the distribution of micro facies, the contour lines of the net pay zone, and the gas saturation for each layer can be obtained. Thus, in combination with the seismic interpretation, drilling and well logging data, through the utilization of deterministic and stochastic modeling using the Petrel software, the geological model for reservoir structure, facies and physical properties, such as porosity and permeability, can be presented, which are shown in Figure 1.
For this reservoir, as shown in Figure 1b, there are four main sedimentary microfacies, distributary channel, interdistributary bay, natural levee and crevasse splay. For the distributary channel microfacies, the upper rock is siltstone and the sorting is improved. Meanwhile, for the natural levee, the sediments are silt, muddy silt and the silt with a muddy layer. The crevasse splay has abundant fine sandstone and siltstone. For the interdistributary bay, the lithology of rocks is mudstone and silty mudstone. Through the careful analysis for the distribution of microfacies, it is obvious that the distributary channel and interdistributary bay are the dominant microfacies for this reservoir.

2.3. Numerical Simulation Model

On the basis of the developed geological model, considering the requirement of simulation precision and the restriction in calculation capacity, the areal grid size is coarsened into 50 m × 50 m. Vertically, according to the differences in layer thickness, the formation is divided into 22 layers. The number of grids for this reservoir is 155 × 199 × 49, and the area for simulation is 64.29 km2. The PVT data show the gas is composed of CH4, C2H6, C3H8, N2 and CO2, and the mole fractions for these components are 91.1%, 1.5%, 0.2%, 6.0% and 1.2%, respectively. The formation pressure is 38.8 MPa. Then, the relationship between gas formation factor, viscosity and pressure can be presented, as shown in Figure 2a. The gas–water relative permeability curve is also acquired from the laboratory experiments, which is shown in Figure 2b. With the above data, the numerical simulation model for target gas reservoir can be developed. The reservoir numerical simulator Eclipse [39], which is developed by Schlumberger Ltd. (Houston, TX, USA), is used to simulate the reservoir and well production performance in this paper. In essence, after the input of the reservoir (geological model), fluids (PVT and relative permeability), initialization and production data (Schedule), the governing equations for this numerical simulation model are presented, and with the finite volume method (FVM), the gas reservoir and well production data are obtained.

2.4. Splitting of Gas Production Rate
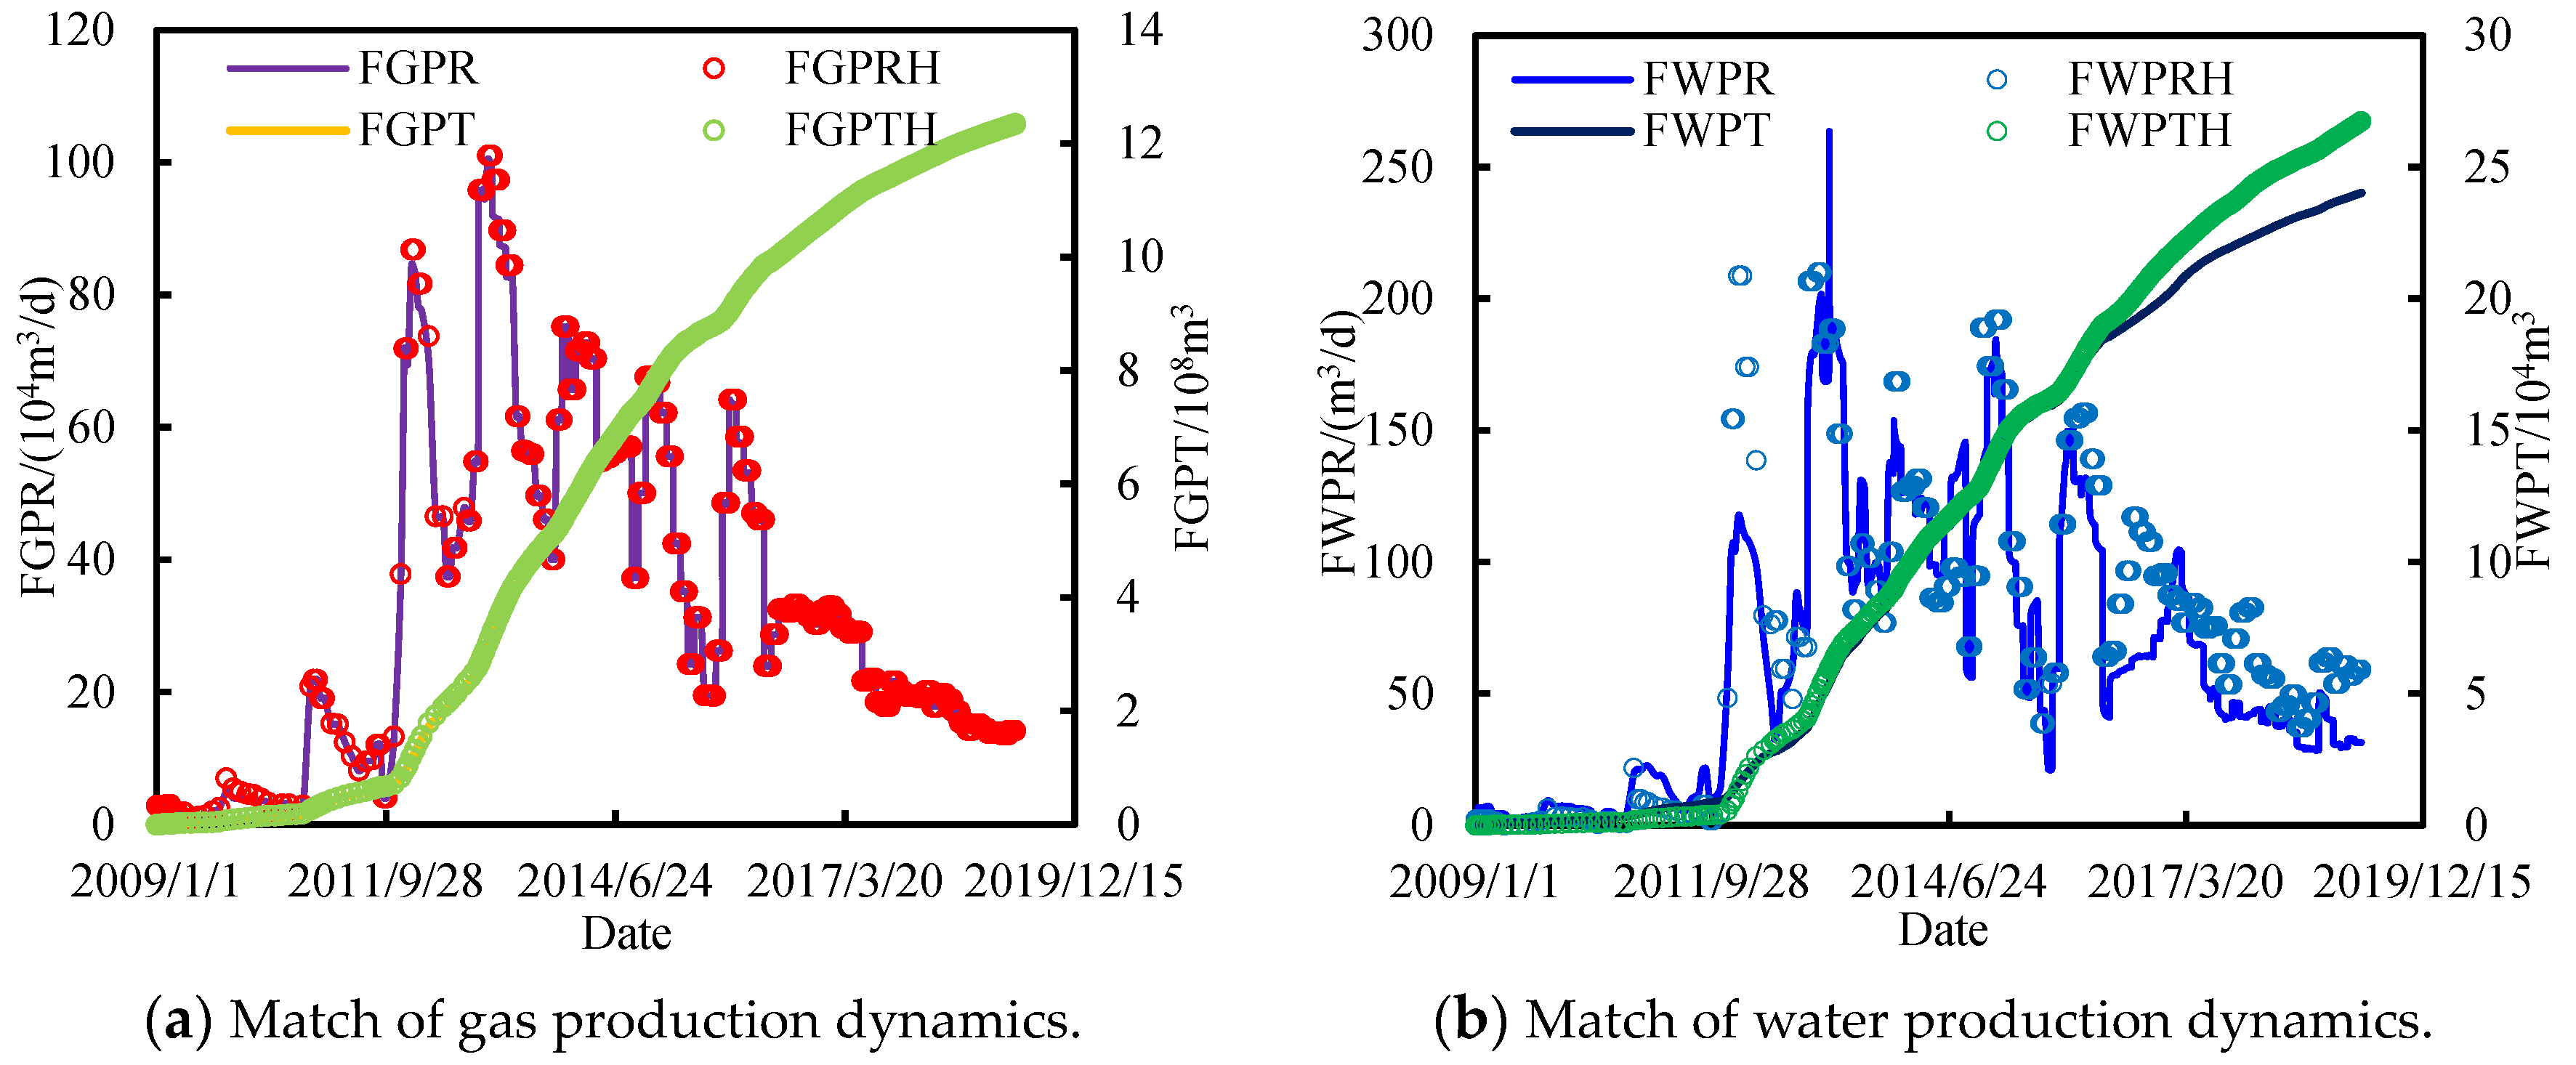
Since the effective formation of Denglouku is absent in the high locations, during the drilling or hydraulic fracturing, a part of the MFHWs communicates between the Yingcheng formation and the Denglouku formation. To calculate the gas recovery for the Denglouku formation accurately, it is necessary to split the gas production rate. The CO2 mole fraction for the Yingcheng formation is 27.2%, while it is only 0.34% for the Denglouku formation. The statistical results show that there are 16 wells that may communicate with the Yingcheng formation, and the CO2 mole fractions for these wells are 1.5~24%, which is larger than the Denglouku formation and lower than the Yingcheng formation. The magnitude of the CO2 mole fraction depends on the extent of communication. Thus, according to the great difference between these two formations, it is possible to obtain the precise production rate produced from the Denglouku formation, and the calculated equation can be expressed as Equation (1):
Q dlk = Q t ( C yc C t ) / ( C yc C dlk )
where Qdlk and Qt are the gas production rate of the Denglouku formation and the actual well production rate, 104 m3/mon; Cyc and Cdlk are the CO2 mole fraction for Yingcheng and Denglouku formations, which are 27.2% and 0.34%, respectively. Ct is the CO2 mole fraction of MFHWs with a high CO2 mole fraction, %.

2.5. History Match

To obtain an accurate model that can predict the future performance for this reservoir, it is necessary to conduct a historical match, which includes the gas reserve and the production dynamic for the reservoir and wells.
(1)
Match of gas reserve
The initial estimated gas reserve for the Denglouku gas reservoir is 172.8 × 10⁸ m3, and after the recalculation, the actual gas reserve for this reservoir is only 93.87 × 10⁸ m3, which is 45.7% lower than the initial estimated value. The gas reserve calculated by the numerical simulation model is 93.75 × 10⁸ m3, which is 0.12 × 10⁸ m3 lower than the recalculated value. The relative error between the value of numerical simulation model and the value obtained from the volumetric method is 0.13% (the accuracy is 99.87%), which conforms to the requirement.
(2)
Match of gas reservoir performance
With the presented splitting method of gas production rate, the gas production for MFHWs with high CO2 is allocated accurately, which provide basis for the history match of gas reservoir and wells. The match indices include field gas production rate (FGPR), field cumulative gas production (FGPT), field water production rate (FWPR) and field cumulative gas production (FWPT), and “H” represents the historical value for these indices. The match of gas and water production dynamics for the gas reservoir is shown in Figure 3. It is discovered that there is a positive match between FGPR and FGPT, and the accuracy of these two indices are as high as 99.7% and 98.8%, which is a great deal larger than the specified criterion (it is usually set to be 80% in practice). Before 2016, the match of FWPR and FWPT is relatively good; meanwhile, after that the match becomes worse. The accuracy of match results for these two factors is 92.1% and 88.8%, respectively. Although the match precision for water production performance (FWPR and FWPT) is lower than the gas production performance (FGPR and FGPT), the match accuracy can meet the requirements of practical use. The reasons for this phenomenon can be attributed to the water production from the Yingcheng formation. In contrast to the Denglouku formation, the Yingcheng formation has an abundant aquifer, and the water production rate for the wells in this formation is large. Initially, there are only a few wells that communicate with the Yingcheng formation; however, as the number of wells rises along with the areal range of communication, the water production rate for MFHWs increases drastically. In addition, since there is no splitting for the water production, it causes a deviation in the simulation results and the monitored data.
(3)
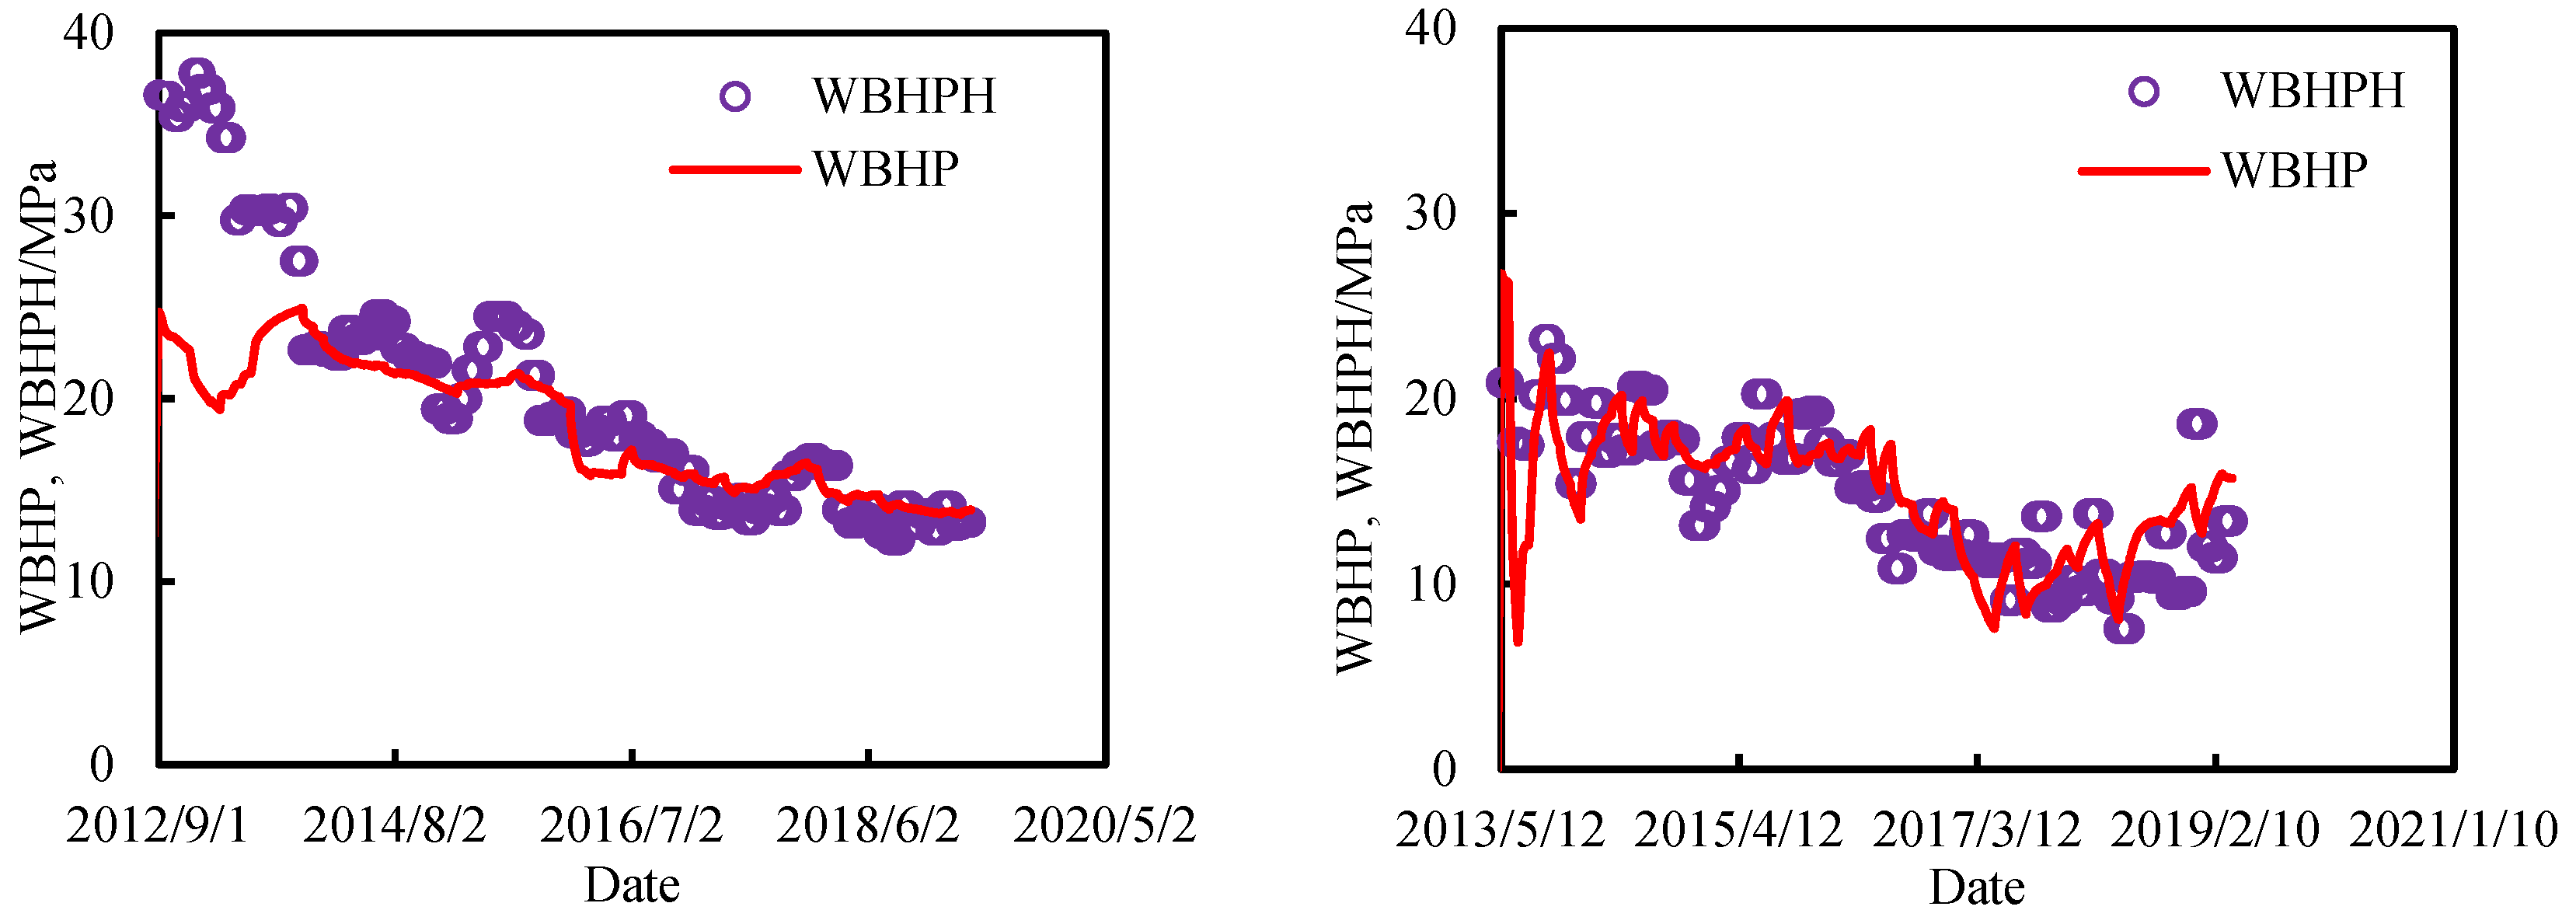
Match of well production performance
For tight gas reservoirs, since the wells are set to produce with the actual gas production rate, therefore, the match of WBHP is the primary objective. With consideration of water production, the method of Hagedorn–Brown is used to calculate the actual WBHP [40]. The match results for two typical wells are shown in Figure 4.
During the process of historical matching, due to the lack of historical data for part of the wells, there are difficulties in matching for WBHP. The statistical results show that the accuracy of historical match for WBHP is larger than 80%, which can meet the requirements in practice.

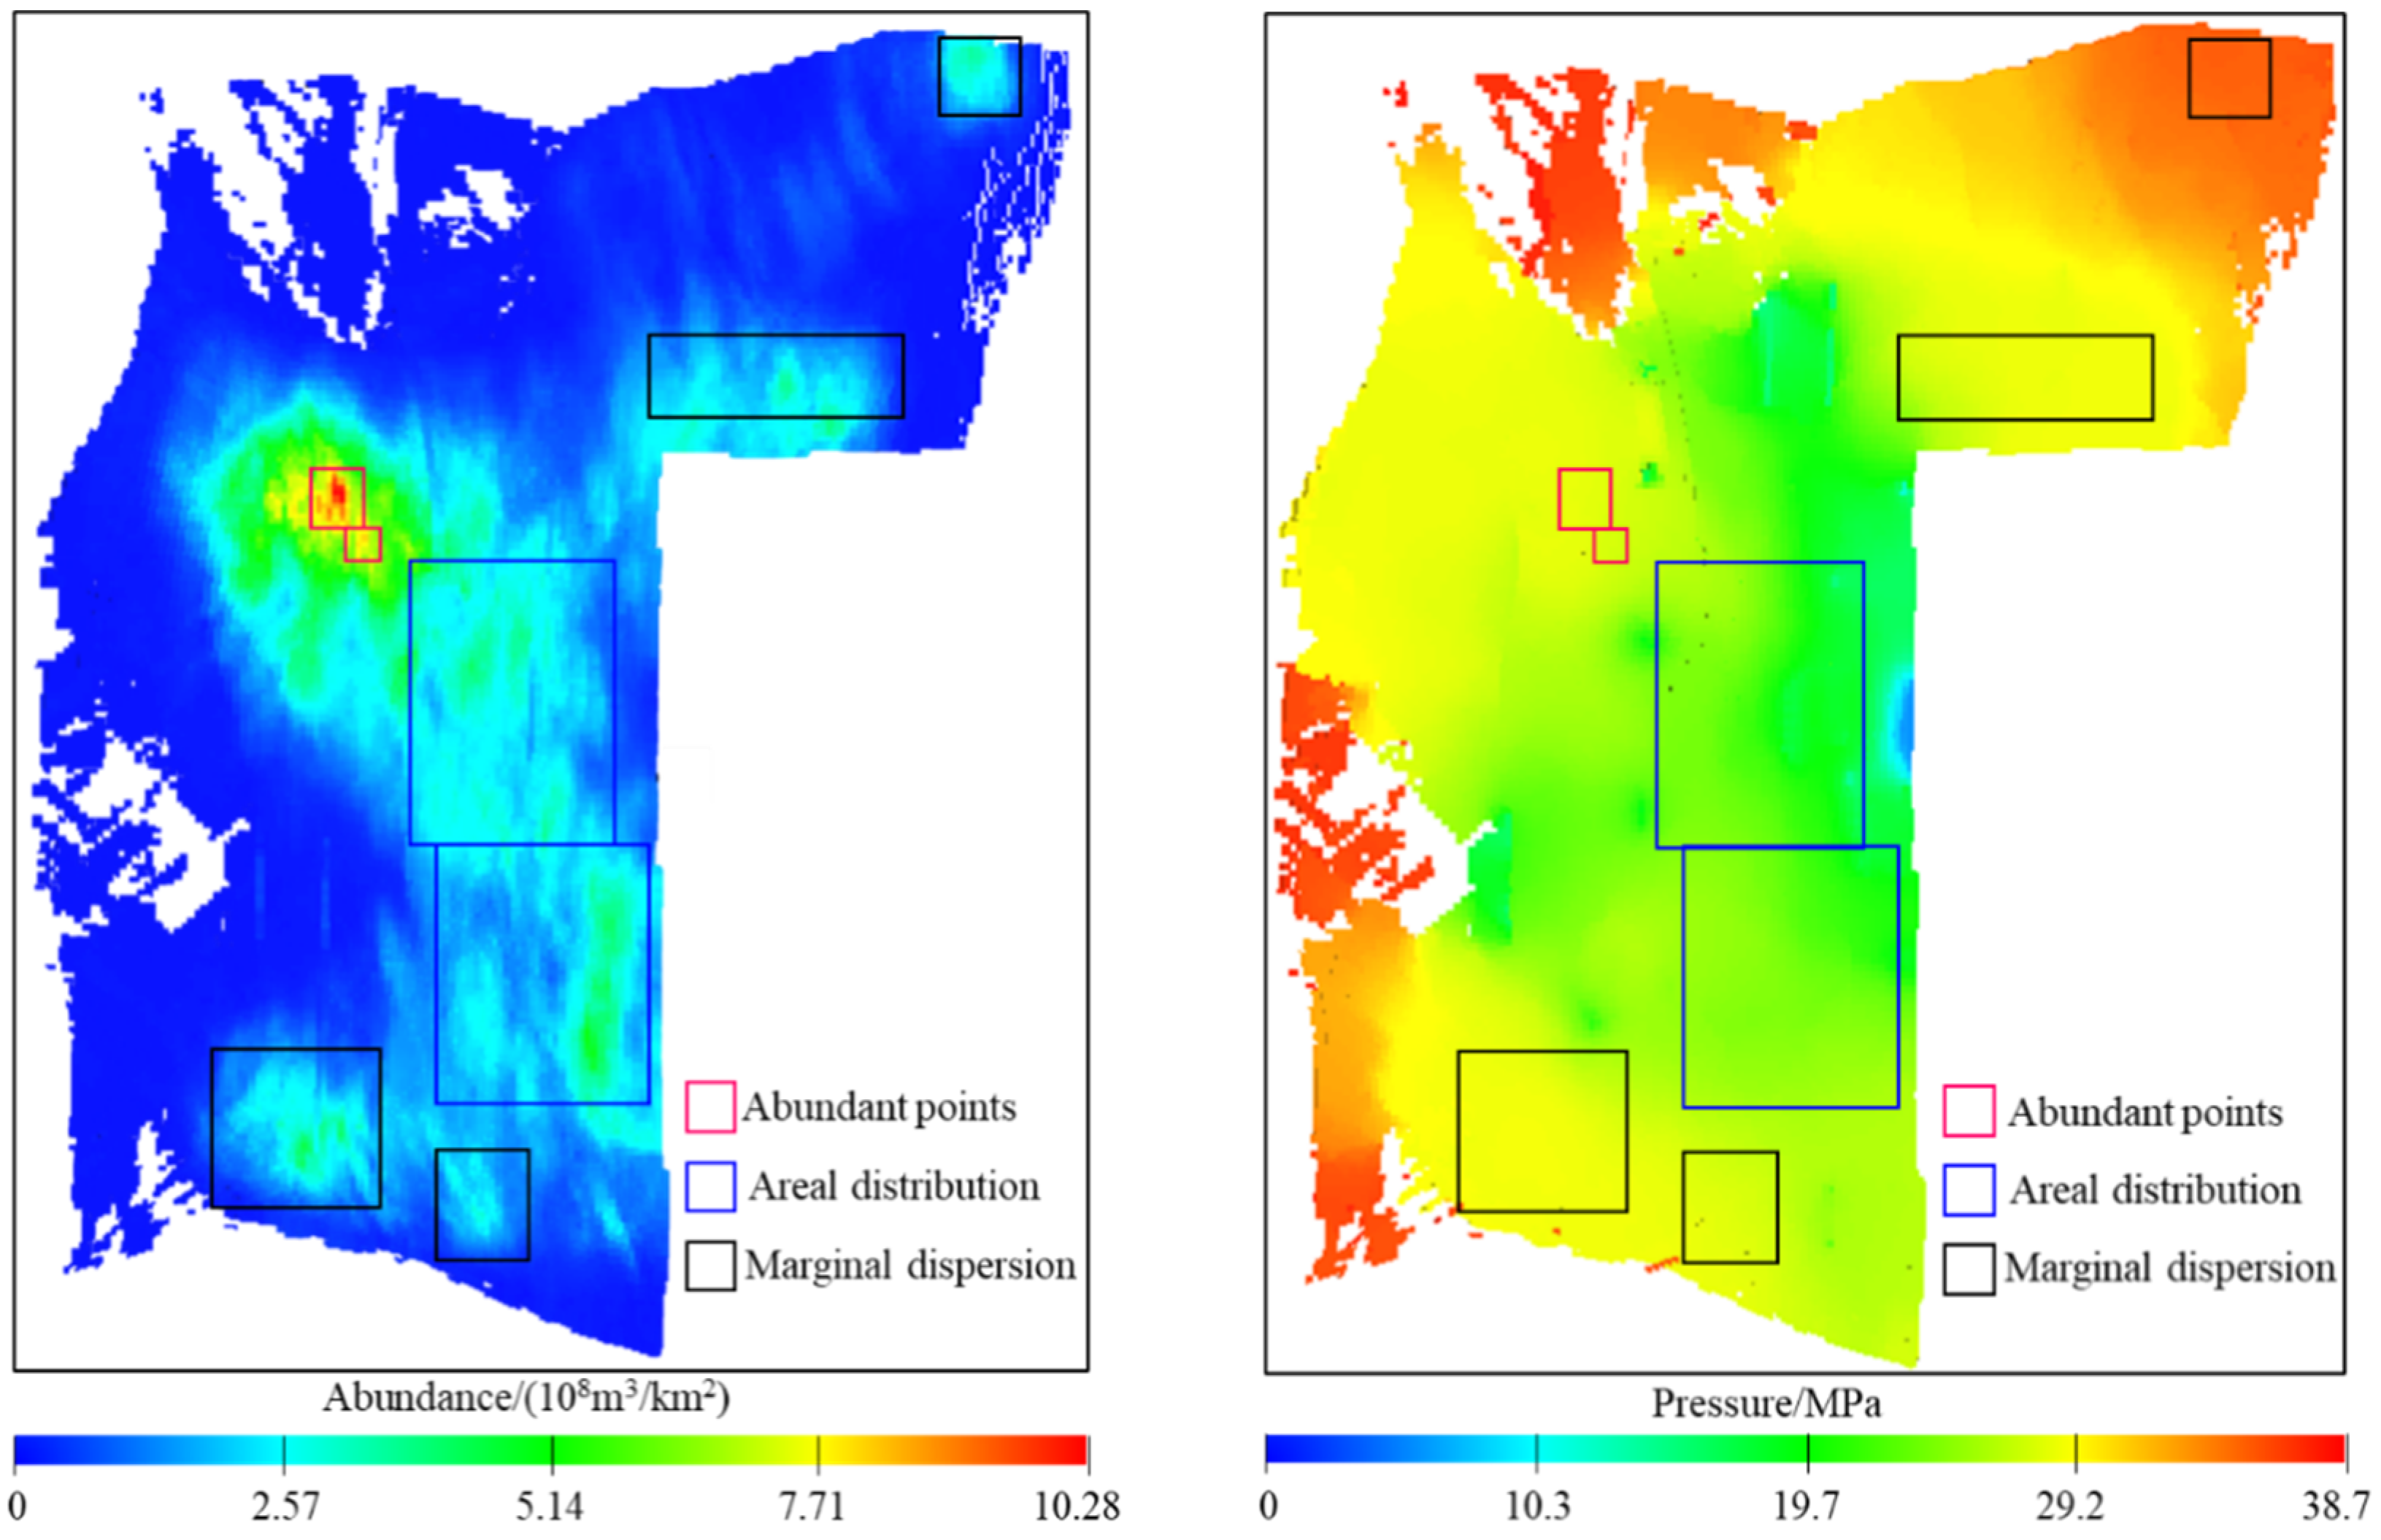
2.6. Division of Remaining Gas Types

Through the comprehensive analysis on the abundance of reservoirs and the formation pressure for each layer, according to the distribution area, the scale and the origin of the remaining gas, the remaining gas can be divided into three types, which are areal distribution, abundant points and marginal dispersion, as shown in Figure 5.
(1)
The marginal dispersion type. This type of remaining gas is mainly located in the marginal area, and the distribution of effective sands is dispersed. Additionally, the net pay zone for these sands is relatively low, the physical properties and the gas abundance is usually low, that is, lower than 2.57 × 10⁸ m3/km2. The proportion for this type of remaining gas is about 15.5%. Due to its poor properties, the wells in these locations are rare, and the controlled range by wells is small, which causes the pressure to be high and larger than 29 MPa. The productivity of MFHWs in these places is low, and due to the immature technology, there is no economic benefit. In the vertical direction, this type of remaining gas is primarily located in the sands of D1, D2 and the layer of D3-1, D3-2. For this type of remaining gas, it should not be seen as the primary objective for EGR, and it may be reasonable to adopt measures of patching holes and sidetracking for improving the gas production rate.
(2)
The abundant points type. In the reservoir, this type is distributed as the local points, and the scale is small, which makes it difficult to form continuous distribution. Nevertheless, the thickness, formation properties and gas abundance are relatively large. The gas abundance for this type of remaining gas is larger than 7.71~10.28 × 10⁸ m3/km2, and the formation pressure is greater than 29 Mpa. The proportion for this type of remaining gas is about 4.2%. Due to the initial immature recognition for the effective formation, there are no wells that dominate this area. This type of remaining gas is mainly distributed in unexploited sand and layers, which are D2, D3-1, D3-2 and D5-2. It is necessary to evaluate the distribution range, and the infilling vertical/horizontal wells or sidetracking of old wells can be used to EGR for the type of remaining gas.
(3)
The areal distribution type. This type of remaining gas is mainly distributed in the main body of the gas reservoir, which is continuous in the horizontal direction. The thickness and physical properties are stable in the plane, and the gas abundance of the reservoir is 2.57~5.14 × 10⁸ m3/km2. Due to the highly controlled extent of MFHWs and after a long period of exploitation, the formation pressure is lower than the other types of remaining gas, and is about 19.7 Mpa. The proportion is 80.3%, which is the largest of the three types of remaining gas. Vertically, it locates primarily in the sands of D4, D6 and the layers of D3-3, D3-4 and D5-2. This type of remaining gas is the main objective of EGR, and with consideration of the existing well patterns, it is suitable for optimizing the infilling well type to improve the gas production and gas recovery factor.

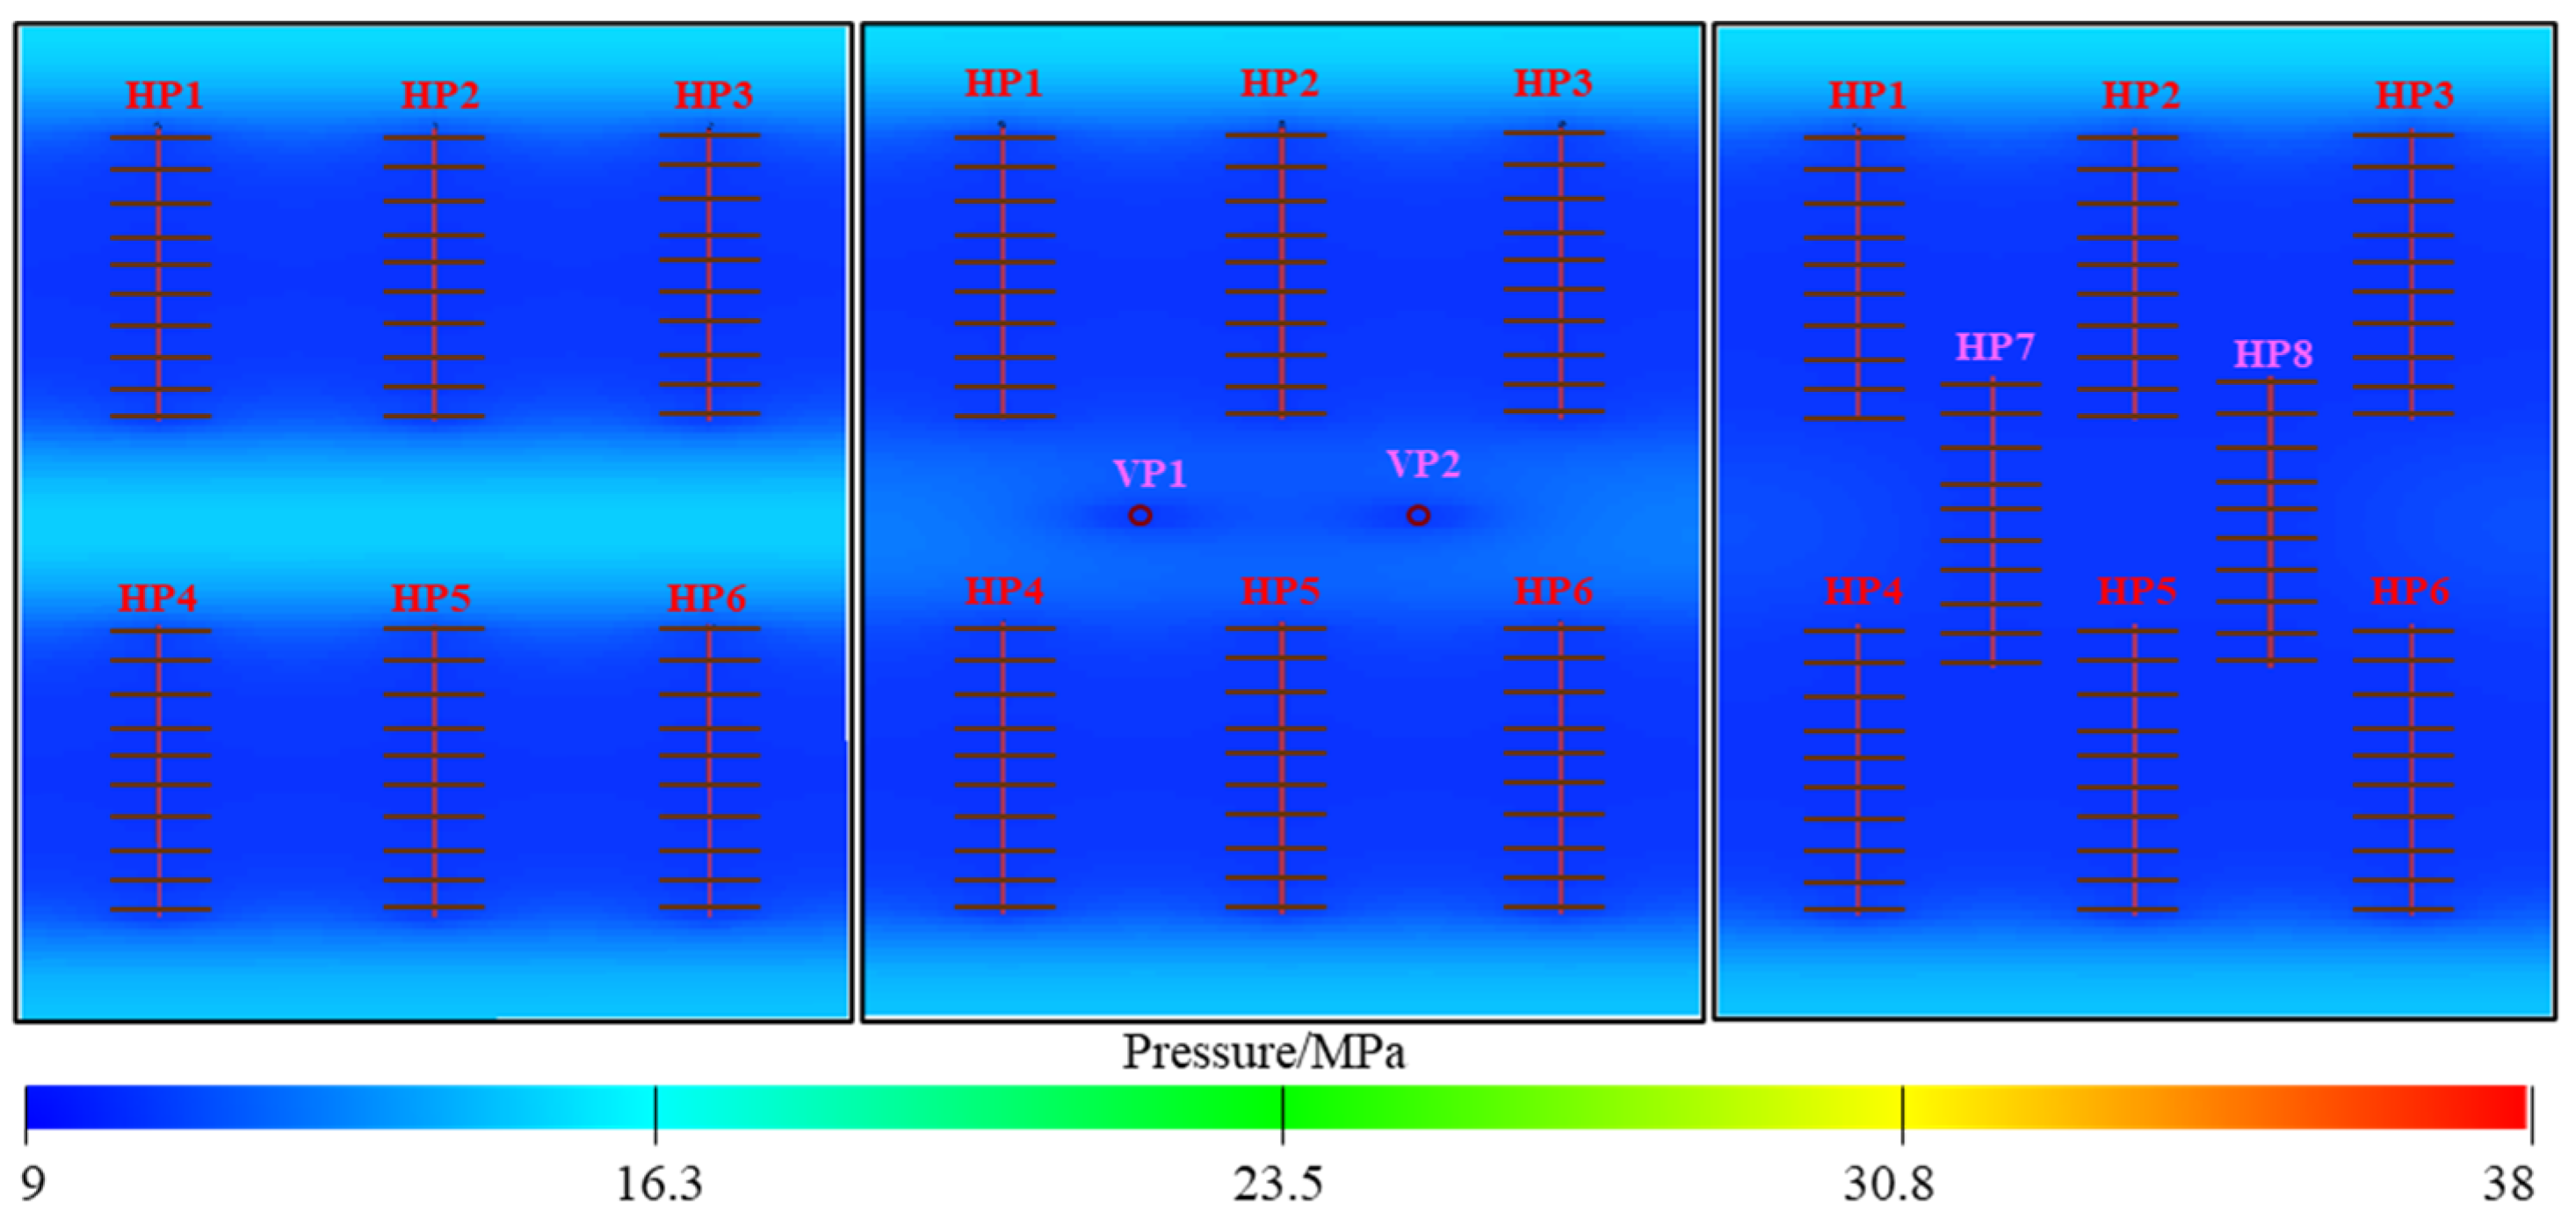
3. Optimization of Infilling Well Types

According to the differences in the pattern of MFHWs, there are mainly two types of well pattern for the Denglouku gas reservoir, which are parallel and zipper patterns. The zipper pattern can be divided into two further types, which are rows and columns of the zipper well pattern [41,42]. To compare the production performance of infilling wells for diverse well patterns, according to the geological characteristics and the techniques of drilling and completing for the Denglouku gas reservoir, a typical well group is selected, and the basic parameters of numerical simulation for the above-mentioned well pattern are determined (see Table 1). For hydraulic fracturing, the method of logarithmic local grid refinement (LGR) is used to simulate the fractures. Since this gas reservoir was exploited in 2012, the average production time for MFHWs is 6 years, thus at the end of the sixth year, the infilling wells are added in the numerical simulation model, and the prediction period is 10 years.

3.1. Parallel Pattern with MFHWs

For the parallel pattern, the horizontal wells are arranged in a row and aligned with each other, as shown in Figure 6. There is abundant remaining gas between the rows of horizontal wells, and the formation pressure in these locations is higher. Therefore, it is impossible to infill the vertical wells or horizontal wells for EGR. Compared with the production indices, such as formation pressure, gas production rates and cumulative gas production, for vertical and horizontal infilling wells (Figure 7), it is found that the horizontal infilling wells have larger drainage areas than the vertical wells, and can improve the gas production rate in a short period. While the rate of decline for MFHWs is larger, the ultimate daily gas production rate is lower than the vertical wells. At the end of the production period, the increased gas production rate for these two well types are almost identical. Since the investment in horizontal wells is significantly higher than in the vertical wells, it is recommended to utilise the vertical wells for infilling and EGR.

3.2. Zipper Pattern with MFHWs

In practice, to improve the dominant area for the wells, the zipper pattern with MFHWs is always used. According to the difference in the array for horizontal wells, it can be divided into two further types, which are the rows and columns of the zipper well pattern. Due to the high dominant degree for the original well pattern, only the vertical infilling wells can be used. Compared with the formation pressure and the production performance for the original and the well pattern with infilling wells, as shown in Figure 8 and Figure 9, it can be found that for the rows of the zipper well pattern, there is abundant remaining gas between the different rows of horizontal wells, which is similar to the parallel well pattern (Figure 7). After the infilling of vertical wells, the dominant area obviously increases. Meanwhile, for the columns of horizontal wells, there is rarely any remaining gas, and the cumulative gas production rate is relatively high, which has a lower potential of infilling than the columns of the zipper well pattern.

4. Design and Optimization of Adjustment Schemes

4.1. Design of Adjustment Schemes

According to the analysis for different types of remaining gas and the optimization results of infilling wells under diverse well patterns, the types of abundant points and areal distribution for remaining gas are seen as the primary objectives for EGR. The vertical wells are used to infill, and with the consideration of reservoir geology and the production performance for surrounding wells, the locations of infilling wells are determined, which are shown in Figure 10. Through the statistic on the perforation layers for all of wells, and the analysis for the distribution of remaining gas and production performance, the layers that should be patched holes or the wells that are suitable for sidetracking can be determined. Currently, the pressure boost is used for the gas wells in this reservoir, and the average well-tubing head pressure (WTHP) for wells with low and high CO2 mole fraction is 2.5 MPa and 5.5 MPa, respectively. Through the replacement of the compressor with high power, the WTHP can be lowered further. Considering the conditions of practice, the eight adjustment schemes are designed properly, as shown in Table 2. According to the measures that are adopted for each adjustment scheme, the investments are calculated. It should be noted that Scheme 1 is seen as the basic one and is not adjusted. The prediction period is set to be 20 years.

4.2. Comparison and Optimization for Adjustment Schemes

(1)
Introduction of economical indices
To optimize the economic adjustment schemes, the internal rate of return (IPR), NPV and pay-back period are introduced to compare the economic benefits for each adjustment scheme. IPR is the discount rate when the cumulative present value of the annual net cash flow is equal to zero during the whole calculation period. It reflects the profit rate of the funds occupied by the project and is the main dynamic evaluation index that can show the project profitability. The equation can be expressed as Equation (2). Financial NPV is the sum of net cash flow that includes the transformation of the present value in the calculation period into the values at the beginning of construction, which is based on the target yield of the enterprise or the fixed discount rate. This equation is provided in Equation (3). The essence is the excess return of the project after obtaining the benchmark rate of return. The investment recovery period is the time that is required to recover all the investment with the net income of each year from the date of project construction.
t = 1 n ( C I C O ) t ( 1 + F I R R ) t = 0
F N P V = t = 1 n ( C I C O ) t ( 1 + i c ) t = 0
where CI and CO are the cash inflow and outflow, respectively, USD million; FIRR is internal rate of return, and n is the calculation period, years; FNPV is net present value, USD million; ic is the fixed internal rate of return.
(2)
Comparison and optimization of adjustment schemes
According to the designed adjustment schemes, the numerical simulation models for these schemes are presented, then the FGPR and FGPT for each scheme can be compared and analyzed, which are shown in Figure 11. It is discovered that after the utilization of adjustment schemes, the FGPR for all of schemes increases drastically; however, it cannot be stable over a long period. The FGPR for schemes that include the infilling wells is clearly higher than the other schemes. The FGPR and FGPT for scheme 8 is the highest, while there is little difference shown in the scheme 7. The difference in FGPR and FGPT for schemes 1 and 2 is small, which shows that when the measure of the pressure boost has been used, the application of a further pressure boost has little influence on the gas recovery factor.
To directly compare the results for each adjustment scheme, according to FGPT at the end of the period and the original gas in place (OGIP), the gas recovery can be calculated. In addition, based on the schemes with no measures, the increment in gas production for each adjustment scheme can be obtained, which are shown in Figure 12. It should be noted that in the horizontal axis, the ‘s’ is the abbreviation of ‘scheme’. It can be seen from this figure that the gas recovery for the basic scheme is about 19.5%, and through the aid of infilling wells, the gas recovery can be significantly improved (larger than 4%). Meanwhile, if the measures of pressure boost, infilling wells, patching holes and sidetracking are used, the gas recovery can be increased by 6%. The pressure boost has minimum effects on the gas recovery, and the others include sidetracking and patching holes, which also have little influence.
According to production and sales of natural gas for Changling gas field, the price of natural gas is USD 0.207 /m3, and the proportion for commercialization is 92%. The cost of gas production is USD 0.053 /m3, and the rate of value-added tax is 13%. According to the results of numerical simulation for each scheme, the annual gas production rate can be obtained. After the substitution of the above data into Equation (2), through the iterative calculation, the IPR and pay−back period for each scheme can be obtained. If the IPR is set to be 7% and 10%, the FNPN for each scheme in the end of the period can be computed, which are shown in Figure 13. It can be found that scheme 3, which uses patching holes and sidetracking, has the largest IPR (nearly 40%), and the pay−back period is shortest (3.2 years), which reflects that this scheme has high profitability. Scheme 6 that uses patching holes, sidetracking and infilling wells has the largest FNPV. When the IPR is 10%, the advantages for this scheme are more noticeable. The IPR for scheme 2 that uses pressure boost is negative, and the pay−back period is greater than 30 years, which has no economic benefits.
According to the principle of obtaining the highest level of gas recovery and economic benefits, through the comprehensive analysis and comparisons of cumulative gas production rate (Figure 10 and Figure 11) and the economic indices (Figure 12), scheme 6 comprising the utilization of patching holes, sidetracking and infilling wells is optimal, and is used in practice. The FGPT at the end of the production period is 23.44 × 10⁸ m3, and the gas recovery is 25%, which is larger than 5.5% compared with the basic schemes. Under the current production and sales conditions, the IPR is 15.5%, and the pay-back period is 6.1 years. When the IPR is 7% and 10%, the NPV is USD 10.26 million and USD 5.58 million, respectively.

5. Conclusions

(1)
This paper presented a comprehensive workflow for the adjustment of development schemes, which includes the establishment of geological and numerical simulation models, the match of reservoir and well production performance, the analysis for the remaining gas, and the design and optimization of adjustment schemes.
(2)
Based on the numerical simulation technology for gas reservoirs, according to the distribution, scale and origin for the remaining gas reserve, the remaining gas can be classified into three types, which are marginal dispersion, abundant points and areal distribution, and the ratios for these three types are 80.3%, 4.2% and 15.5%, respectively. The type of areal distribution is the largest, and is the main objective for EGR.
(3)
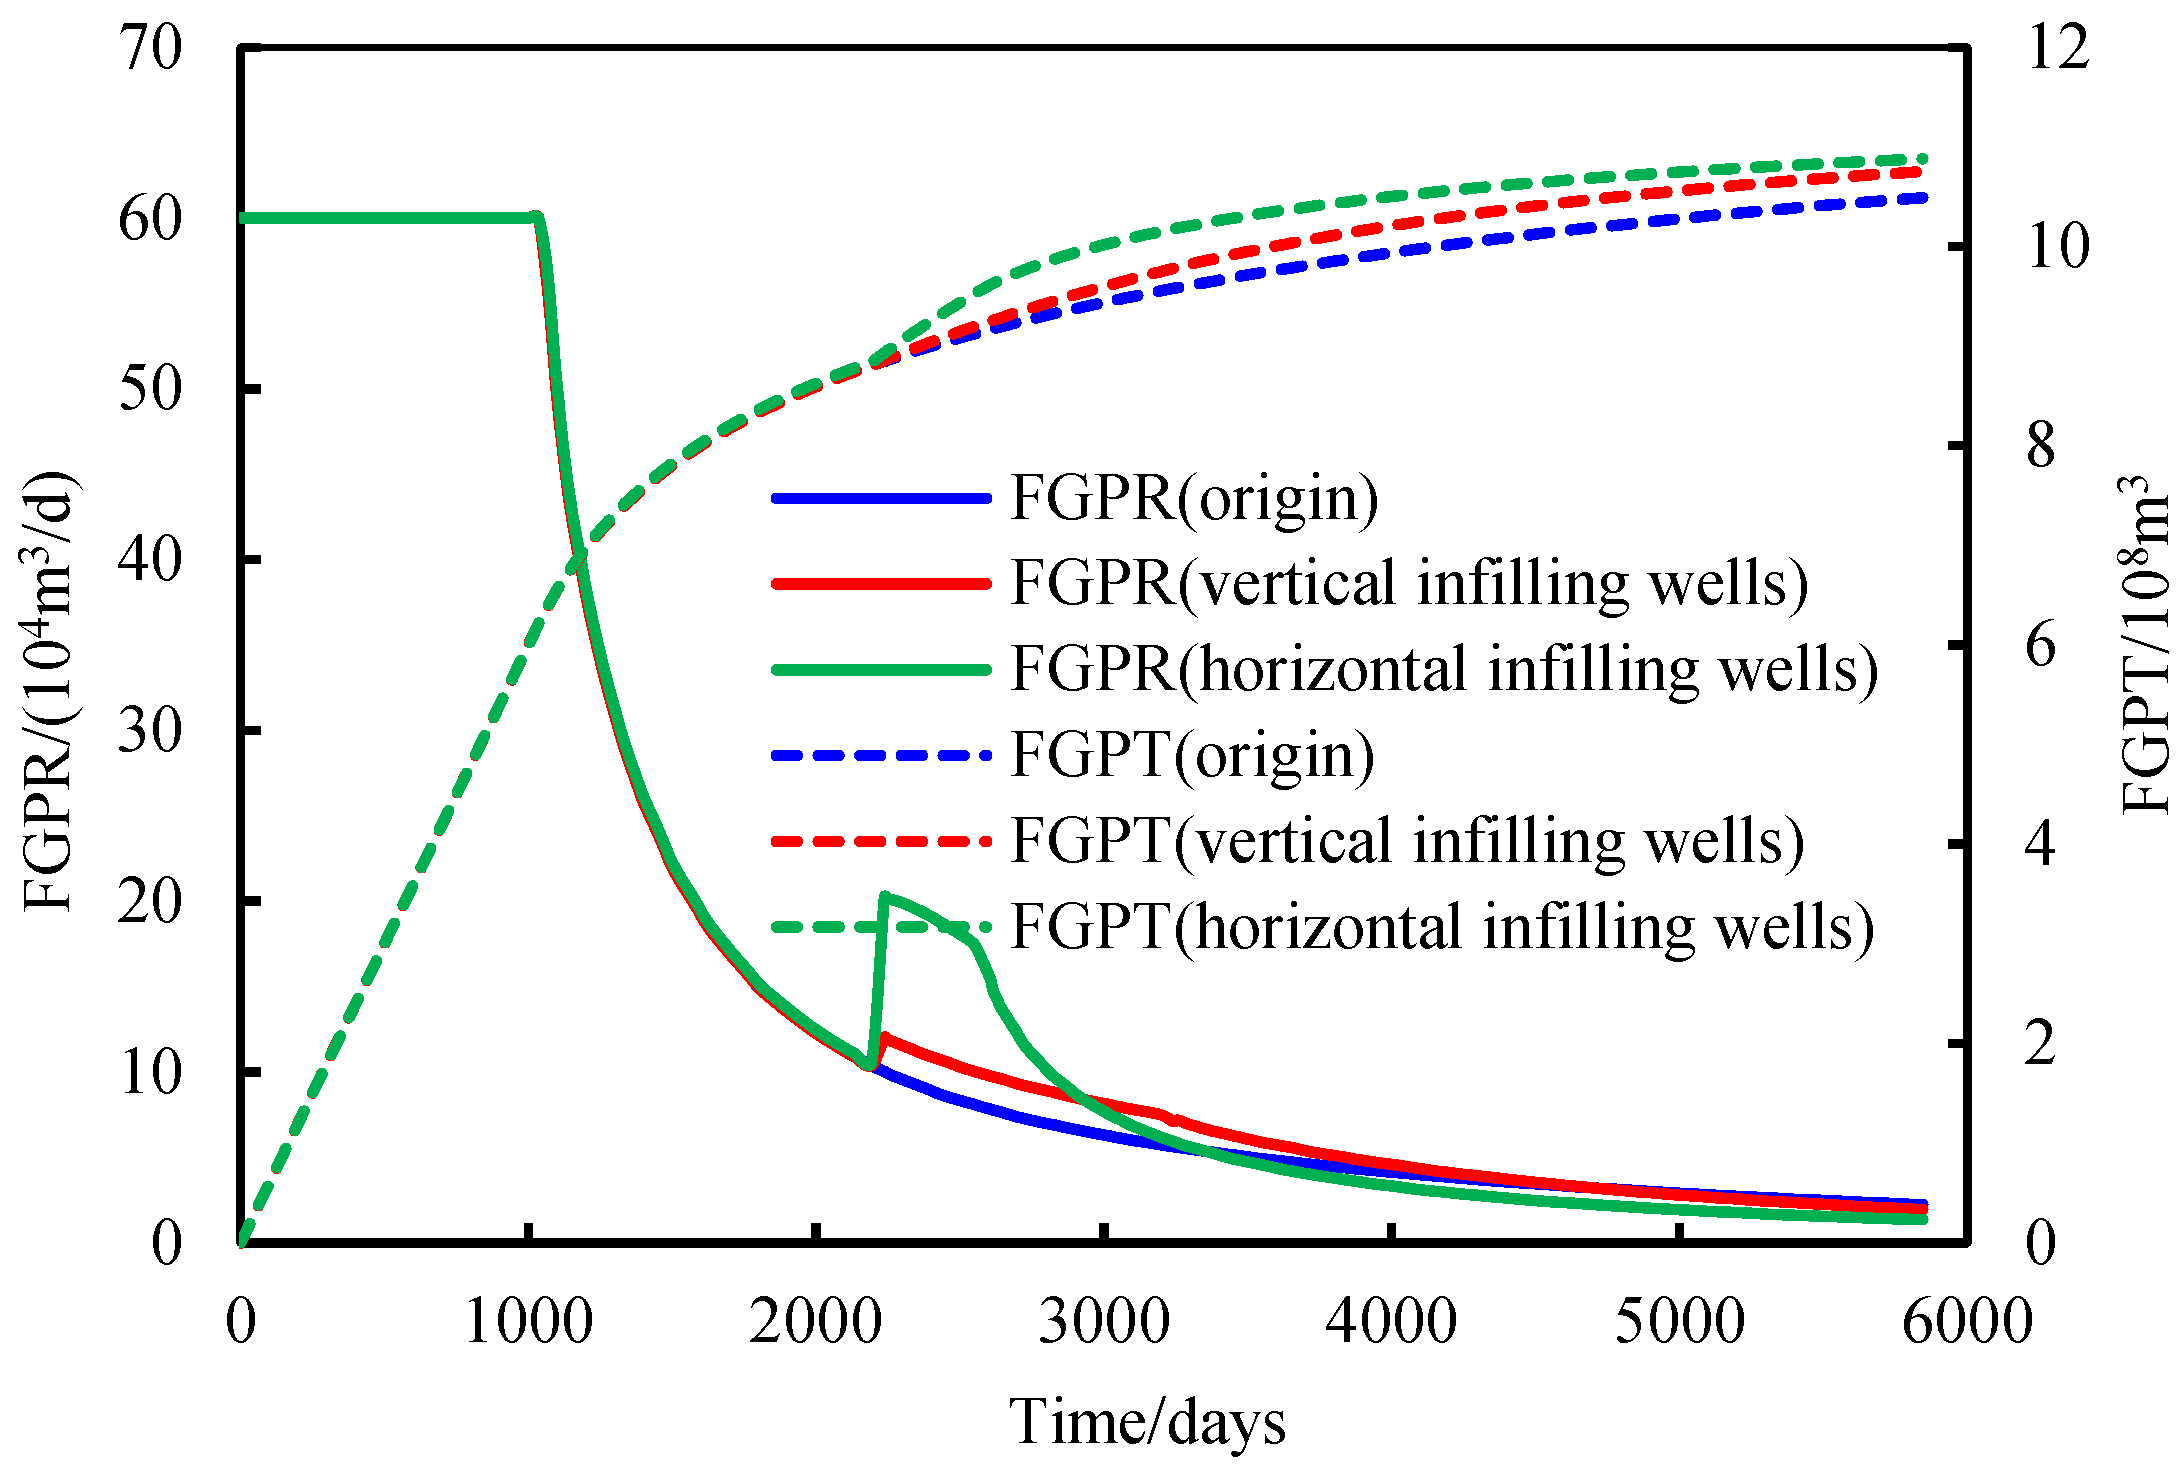
The remaining gas and production performance for parallel and zipper well patterns in columns are identical, which represents high potential for infilling. The vertical well is the optimal infilling well type. However, the FGPT for these two well patterns is lower than the zipper well patterns in rows, while the infilling potential for this well pattern is lower.
(4)
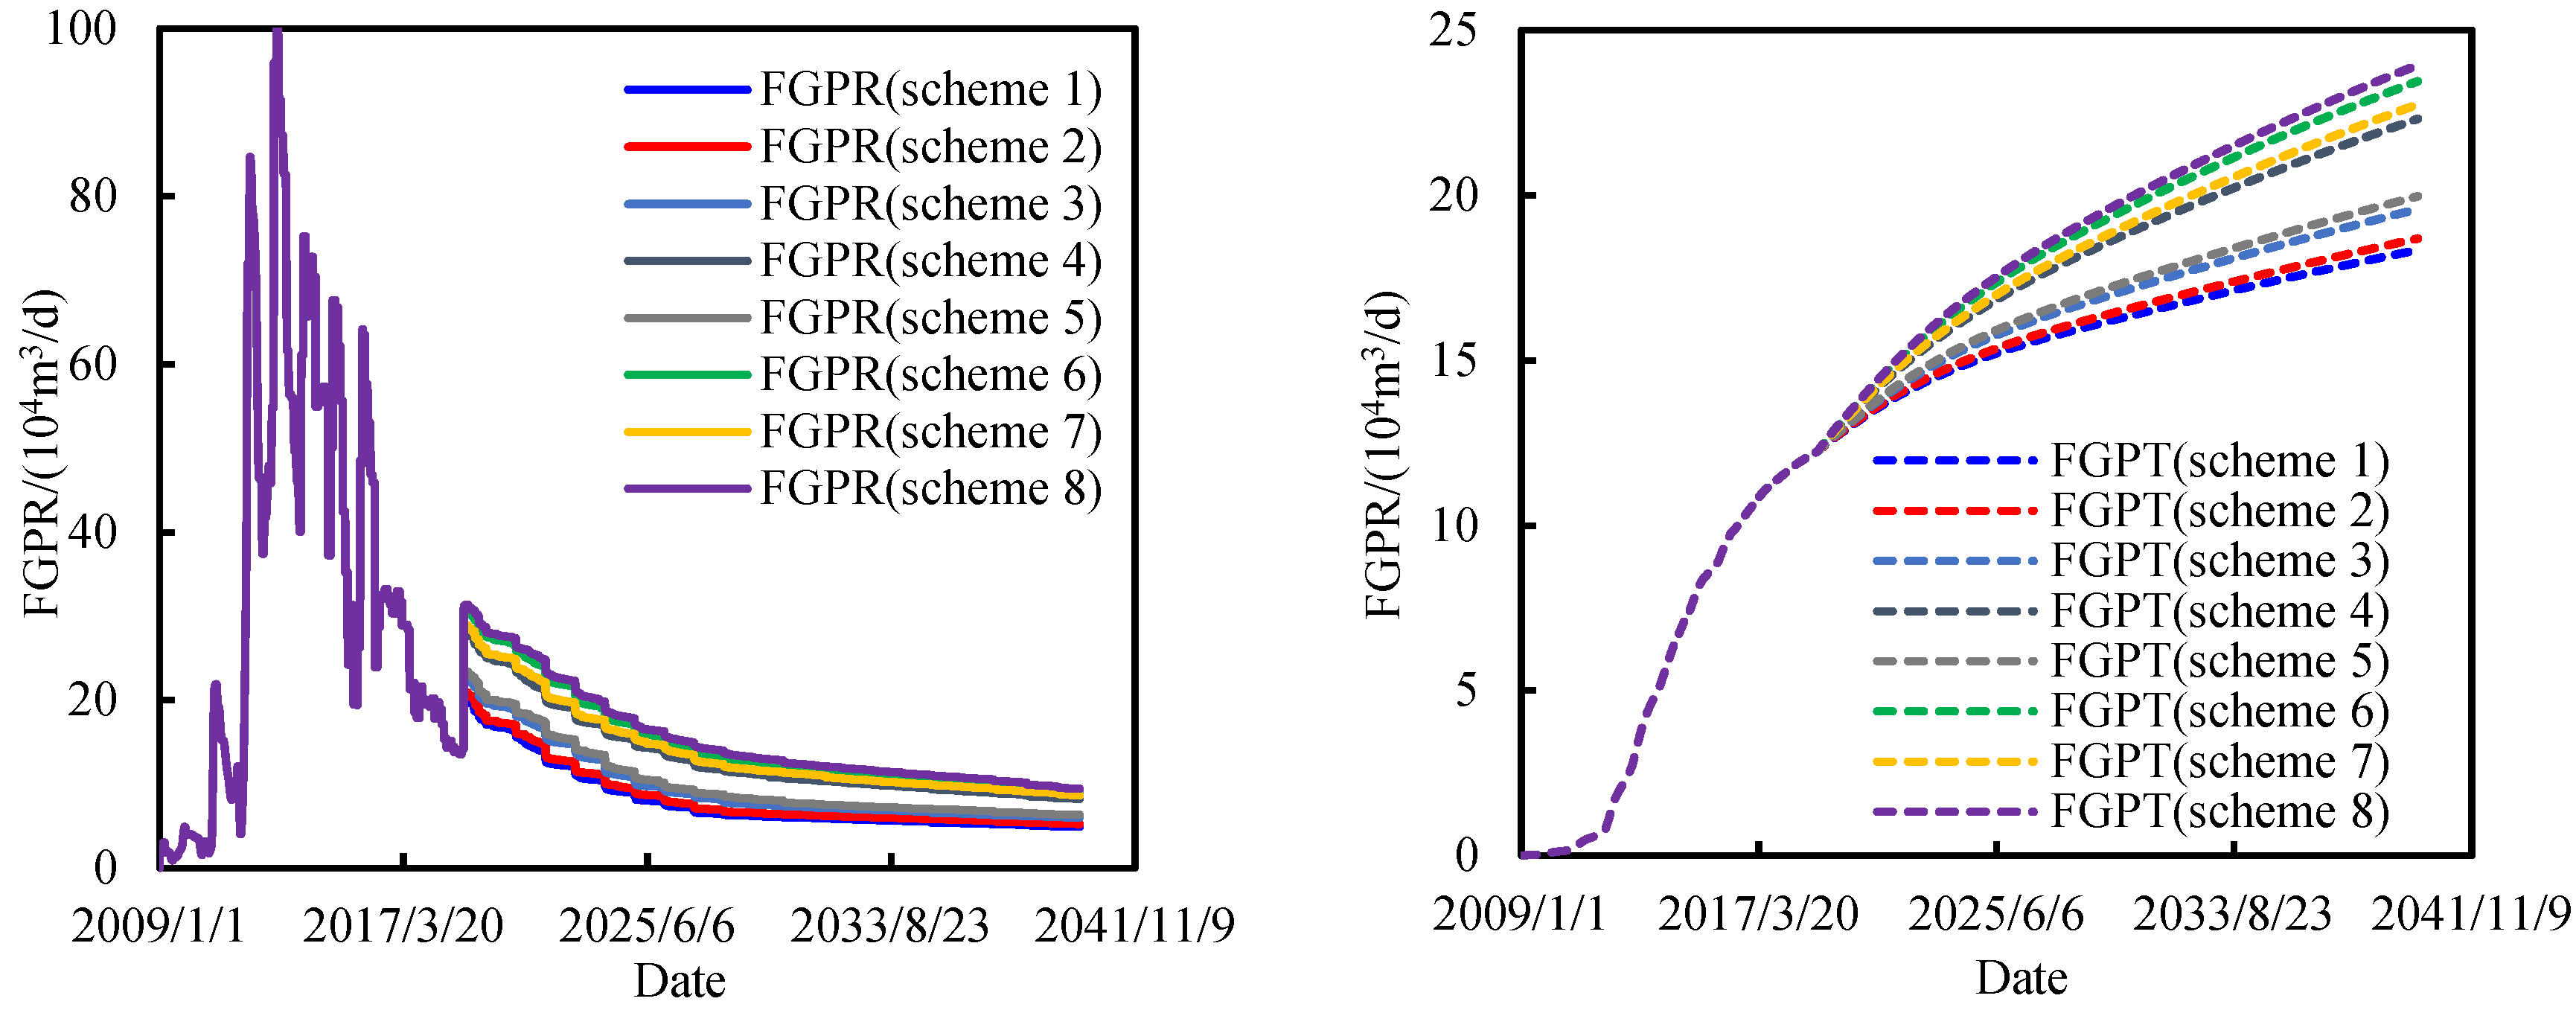
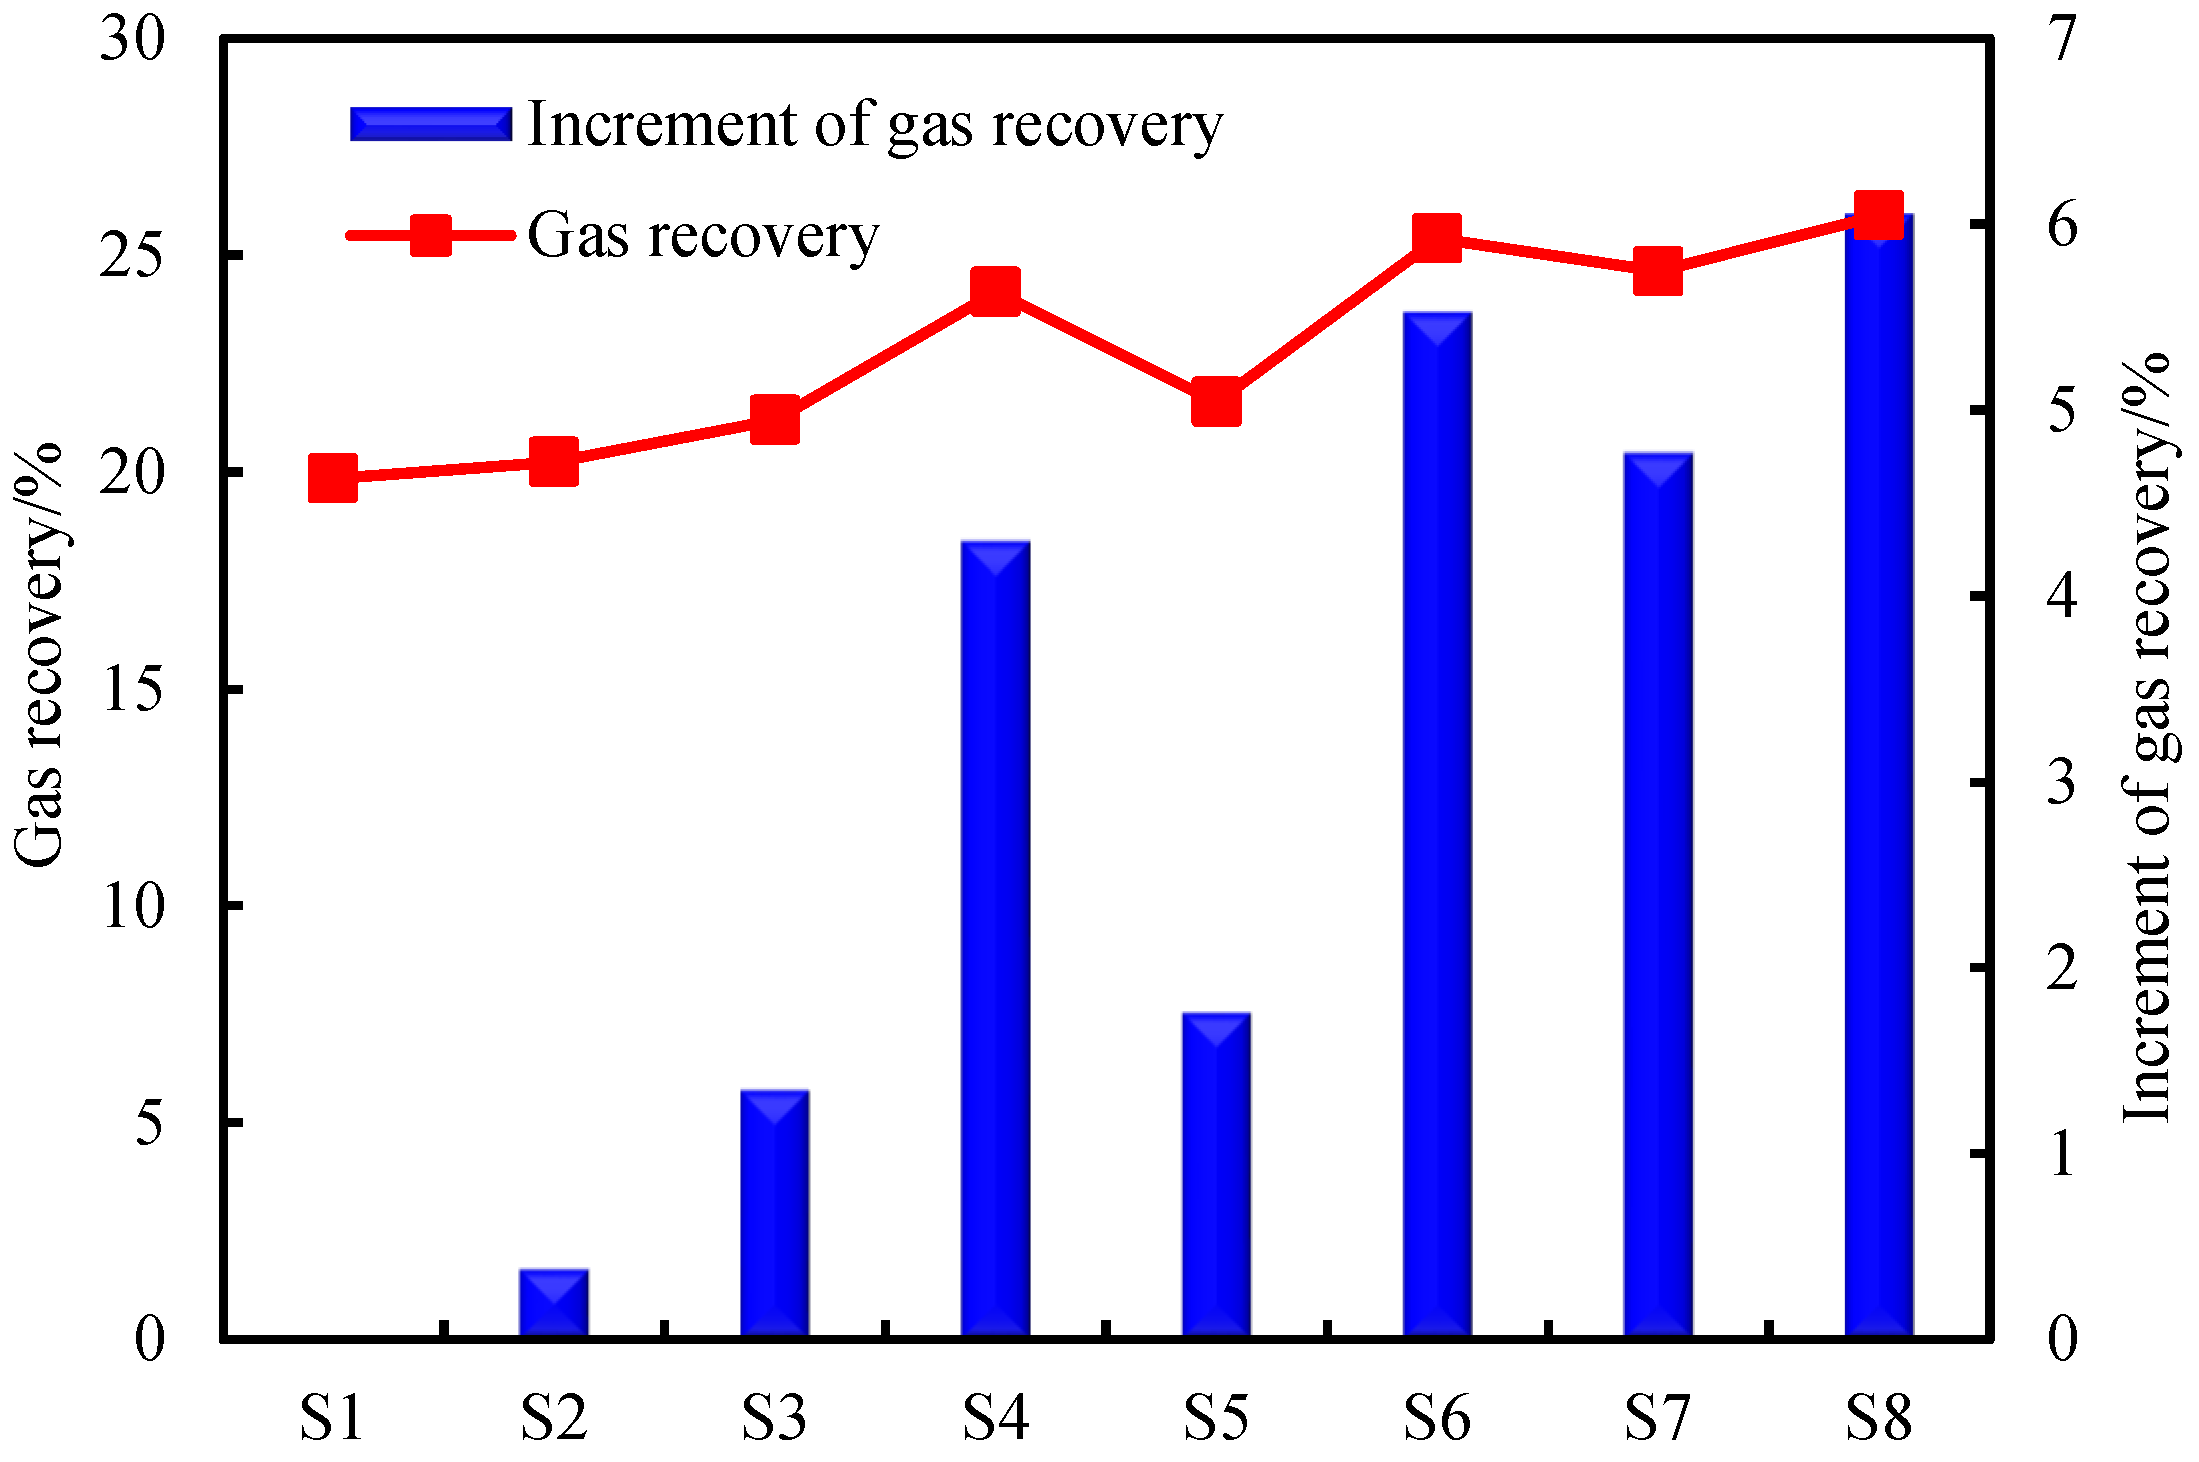
Through the comprehensive consideration of gas production and economic benefits, scheme 6 with patching holes, sidetracking and infilling is the optimal adjustment scheme for the Denglouku gas reservoir. At the end of the production period, the gas recovery factor is 25.4%, which is larger than 5.5% compared with the basic scheme. The IPR for the optimal scheme is 15.6%, and the pay-back period is 6.1 years. With the increase in IPR, the advantages for the scheme become greater.

Author Contributions

Conceptualization, B.N. and T.Z.; methodology, J.L.; formal analysis, J.G. and B.N.; investigation, Y.L.; resources, N.F.; data curation, F.M.; writing—original draft preparation, F.M.; writing—review and editing, J.L.; visualization, T.Z.; supervision, J.G.; project administration, K.B.; funding acquisition, T.Z All authors have read and agreed to the published version of the manuscript.

Funding

This work was supported by the CNPC Science and Technology Major Project (Grant No. 2021DJ1504).

Informed Consent Statement

Not applicable.

Data Availability Statement

All data used in this research are easily accessible by downloading the various documents appropriately cited in the paper.

Acknowledgments

The authors greatly appreciate the Exploration and Development Research Institute of Jilin Oilfield Company for providing data access and for permission to publish the results.

Conflicts of Interest

The authors declare no conflict of interest.

References

  1. Zhu, H.Y.; Xu, X.; Gao, Y.; Hu, Y.; An, L.Z.; Guo, C.M. Occurrence characteristics of tight sandstone pore water and its influence on gas seepage: A case study from the Denglouku gas reservoir in the Changling Gas Field, southern Songliao Basin. Nat. Gas Ind. 2014, 34, 54–58. [Google Scholar]
  2. Guo, S.C. Changling Denglouku Group Gas Reservoir Horizontal Well Overall Development Technology and the Evaluation of the Effect. Ph.D. Thesis, Northeast Petroleum University, Daqing, China, 2015. [Google Scholar]
  3. Jia, A.L.; Wang, G.T.; Meng, D.W.; Guo, Z.; Ji, G.; Cheng, L.H. Well pattern infilling strategy to enhance oil recovery of giant low-permeability tight gasfield a case study of Sulige gasfield, Ordos Basin. Acta Pet. Sin. 2018, 39, 802–813. [Google Scholar]
  4. Ji, G.; Jia, A.L.; Meng, D.W.; Guo, Z.; Wang, G.; Cheng, L.; Zhao, X. Technical strategies for effective development and gas recovery enhancement of a large tight gas field: A case study of Sulige gas field, Ordos Basin, NW China. Pet. Explor. Dev. 2019, 46, 602–612. [Google Scholar] [CrossRef]
  5. Guo, J.L.; Guo, Z.; Cui, Y.P.; Meng, D.W.; Wang, G.T.; Ji, G.; Cheng, L.H.; Sun, Y.Y.; Jia, C.Y. Recovery factor calculation method of giant tight sandstone gas field. Acta Pet. Sin. 2018, 39, 1389–1396. [Google Scholar]
  6. Guo, Z.; Jia, A.L.; Ji, G.; Ning, B.; Wang, G.T.; Meng, D.W. Reserve classification and well pattern infilling method of tight sandstone gasfield: A case study of Sulige gasfield. Acta Pet. Sin. 2017, 38, 1299–1309. [Google Scholar]
  7. Dong, S.; Guo, J.L.; Guo, Z.; Meng, D.W.; Ji, G.; Cheng, L.H. Evaluation of remaining reserves and strategies of enhanced oil recovery for Su 6 Block. Fault-Block Oil Gas Field 2020, 27, 74–79. [Google Scholar]
  8. Wu, K.L.; Zhu, Q.Y.; Chen, Z.X.; Li, J.; Feng, D.; Wang, M.Y.; Guo, S.Q.; Guo, Y.C. Microscopic gas displacement efficiency of enhanced gas recovery in carbonate gas reservoirs with edge and bottom water. Nat. Gas Ind. B 2023, 10, 372–382. [Google Scholar] [CrossRef]
  9. Guo, P.; Zhou, R.; Tian, Z.K.; Wang, Y.; Yang, L.H.; Zhao, J.F. Gas and water distribution characteristics of water-driven gas process in tight sandstone gas reservoirs: A microscale study by molecular simulation and experiment. Energy Rep. 2022, 8, 7025–7036. [Google Scholar] [CrossRef]
  10. Ma, X.H.; He, D.G.; Wei, Y.H.; Guo, J.L.; Jia, C.Y. Enhanced gas recovery: Theory, technology, and prospects. Nat. Gas Ind. B 2023, 10, 393–405. [Google Scholar] [CrossRef]
  11. Hasan, M.; Eliebid, M.; Mahmoud, M.; Elkatatny, S.; Shawabkeh, R.; King Fahd University of Petroleum & Minerals. Enhanced Gas Recovery (EGR) Methods and Production Enhancement Techniques for Shale & Tight Gas Reservoirs. In Proceedings of the SPE Kingdom of Saudi Arabia Annual Technical Symposium and Exhibition, Dammam, Saudi Arabia, 24–27 April 2017. [Google Scholar]
  12. Li, G.X.; Tian, J.; Duan, X.W.; Yang, H.J.; Tang, Y.L.; Bi, H.B.; Zhang, C.Z.; Xian, C.G.; Liu, H. Research and Practice on Enhancing Recovery of Tight Sandstone Gas Reservoirs in Kelasu Gas Field, Tarim Basin. In Proceedings of the SPE/AAPG/SEG Asia Pacific Unconventional Resources Technology Conference, Virtual, 16–18 November 2021. [Google Scholar]
  13. He, D.B.; Jia, A.L.; Ji, G.; Wei, Y.S.; Tang, H.F. Well type and pattern optimization technology for large scale tight sand gas, Sulige gas field. Pet. Explor. Dev. 2012, 39, 458–464. [Google Scholar] [CrossRef]
  14. Gao, S.S.; Liu, H.X.; Ye, L.Y.; Wen, Z.J.; Zhu, W.Q.; Zhang, C. A new method for well pattern density optimization and recovery factor evaluation of tight sandstone gas reservoirs. Nat. Gas Ind. 2019, 39, 58–65. [Google Scholar]
  15. Li, Y.G.; Xu, W.; Xiao, F.; Liu, L.L.; Liu, S.X.; Zhang, W. Development well pattern optimization based on dynamic characteristics: A case study from the Sulige tight sandstone gas field with great heterogeneity. Nat. Gas Ind. 2014, 34, 56–61. [Google Scholar]
  16. Zhou, Y.; King, M.J.; Du, S. A simulation-free approach for well placement in tight gas reservoirs. In Proceedings of the Intermational Peroleum Technology Conference, Beijing, China, 26–26 March 2013. [Google Scholar]
  17. Cheng, Y.; McVay, D.A.; Lee, J.W. Optimal infill drilling design for marginal gas reservoirs using a simulation-based inversion approach. In Proceedings of the SPE Eastern Regional Meeting, Canton, OH, USA, 11–13 October 2006. [Google Scholar]
  18. Luo, S.; Kelkar, M. Infill-Drilling Potential in Tight Gas Reservoirs. Soc. Pet. Eng. 2013, 135, 19–22. [Google Scholar] [CrossRef]
  19. Tison, J.K.; Agarwal, R.G.; Rosepiler, M.J.; Schlottman, B.W. A Method for Selecting Potential Infill Locations in the East Texas Cotton Valley Tight Gas Play. In Proceedings of the 57th Annual Fall Technical Conference and Exhibition of the Society of Petroleum Engineers of AlME, New Orleans, LA, USA, 26–29 September 1982. [Google Scholar]
  20. Hinn, R.L., Jr.; Glenn, J.M.; McNichol, K.C. Case history: Use of a multiwell model to optimize infill development of a tight-gas-sand reservoir. J. Pet. Technol. 1988, 40, 881–886. [Google Scholar] [CrossRef]
  21. Li, Q.; Li, Y.X.; Gao, S.H.; Liu, H.X.; Ye, L.Y.; Wu, H.H.; Zhu, W.Q.; An, W.G. Well network optimization and recovery evaluation of tight sandstone gas reservoirs. J. Pet. Sci. Eng. 2021, 196, 107705. [Google Scholar] [CrossRef]
  22. Zhang, T.L.; Wang, X.Z.; Yan, Y.K.; Qiao, X.Y.; Ma, C.; Lei, K.Y.; Tang, P.Z.; Feng, D.; Zhao, W. Efficient mobilization method of stereoscopic well patterm in low-permeability complex superimposed tight reservoir: A case study of Yan’an gasfield. Acta Pet. Sin. 2018, 39, 1279–1291. [Google Scholar]
  23. Lu, T.; Liu, Y.X.; Wu, L.C.; Wang, X.W. Challenges to and countermeasures for the production stabilization of tight sandstone gas reservoirs of the Sulige Gasfield, Ordos Basin. Nat. Gas Ind. 2015, 35, 43–52. [Google Scholar] [CrossRef]
  24. Tan, Z.Z.; Lu, T.; Liu, Y.X.; Wu, L.C.; Yang, Y. Technical ideas of recovery enhancement in the Sulige Gas field during the 13th Five-Year Plan. Nat. Gas Ind. 2016, 36, 30–40. [Google Scholar]
  25. Zhang, J.W.; Wang, G.Y.; He, K.; Ye, C.L. Practice and understanding of sidetracking horizontal drilling technology in old wells in Sulige Gas Field. Pet. Explor. Dev. 2019, 46, 370–377. [Google Scholar] [CrossRef]
  26. Guo, P.; Jing, S.S.; Peng, C.Z. Technology and countermeasures for gas recovery enhancement. Nat. Gas Ind. 2014, 34, 48–55. [Google Scholar]
  27. Jukić, L.; Vulin, D.; Lukić, M.; Sedlar, D.K. Enhanced gas recovery and storability in a high CO2 content gas reservoir. Int. J. Greenh. Gas Control 2022, 117, 103662. [Google Scholar] [CrossRef]
  28. Zhang, K.Q.; Jin, Z.J.; Li, G.S.; Liu, Q.Y.; Tian, L. Gas adsorptions of geological carbon storage with enhanced gas recovery. Sep. Purif. Technol. 2023, 311, 123260. [Google Scholar] [CrossRef]
  29. Omari, A.; Wang, C.; Li, Y.; Xu, X.G. The progress of enhanced gas recovery (EGR) in shale gas reservoirs: A review of theory, experiments, and simulations. J. Pet. Sci. Eng. 2022, 213, 110461. [Google Scholar] [CrossRef]
  30. Ding, J.C.; Yan, C.H.; He, Y.M.; Wang, C.C. Supercritical CO2 sequestration and enhanced gas recovery in tight gas reservoirs: Feasibility and factors that influence efficiency. Int. J. Greenh. Gas Control 2021, 105, 103234. [Google Scholar] [CrossRef]
  31. Kokal, S.; Sayegh, S. Enhanced Gas Recovery: Prospects and Technology. In Proceedings of the CIM 1993 Annual Technical Conference, Calgary, AB, Canada, 9–12 May 1993. [Google Scholar]
  32. Jia, Y.; Shi, Y.Q.; Yan, J. The feasibility appraisal for CO2 enhanced gas recovery of tight gas reservoir: Case analysis and economic evaluation. In Proceedings of the International Petroleum Technology Conference, Virtual, 23–25 March 2021. [Google Scholar]
  33. Zhang, L.H.; Xiong, Y.; Zhao, Y.L.; Tang, H.M.; Guo, J.L.; Jia, C.S.; Lei, Q.; Wang, B.H. A reservoir drying method for enhancing recovery of tight gas. Pet. Explor. Dev. 2022, 49, 144–155. [Google Scholar] [CrossRef]
  34. Deng, F.C.; Huang, B.; Li, X.S.; Liu, J.W.; Li, G.; Xu, Y.T.; Yin, B. Review of sand control and sand production in a gas hydrate reservoir. Energy Fuels 2022, 36, 11712–11723. [Google Scholar] [CrossRef]
  35. Deng, F.C.; Yin, B.; Li, X.S.; Wang, Y.; Xu, Y.T. Analysis of the scaling mechanism and characteristics of a double-defects screen based on data from Hafaya oilfield. J. Pet. Sci. Eng. 2022, 216, 110729. [Google Scholar] [CrossRef]
  36. Deng, F.C.; Deng, Z.Q.; He, L.; Wang, L.H.; Hu, H.T.; Xu, Y. Life prediction of slotted screen based on back-propagation neural network. Eng. Fail. Anal. 2021, 119, 104909. [Google Scholar] [CrossRef]
  37. Deng, F.C.; Li, X.R.; He, L.; Feng, Y.C. Experimental evaluation of metal foam for sand control. J. Pet. Sci. Eng. 2019, 176, 1152–1160. [Google Scholar] [CrossRef]
  38. Deng, F.C.; Yan, C.L.; Jia, S.P.; Chen, S.H.; Wang, L.H.; He, L. Influence of sand production in an unconsolidated sandstone reservoir in a deepwater gas field. J. Energy Resour. Technol. 2019, 141, 092904–092911. [Google Scholar] [CrossRef]
  39. Eclipse Industry-Reference Reservoir Simulator Page. Available online: https://www.software.slb.com/products/eclipse (accessed on 28 November 2023).
  40. Hagedorn, A.R.; Brown, K.E. Experimental study of pressure gradients occurring during continuous two-phase flow in small diameter vertical conduits. J. Pet. Technol. 1965, 17, 475–484. [Google Scholar] [CrossRef]
  41. Islam, J.; Rahaman, M.S.A.; Vasant, P.M.; Negash, B.M.; Hoqe, A.; Khalifa Alhitmi, H.; Watada, J. A modified niching crow search approach to well placement optimization. Energies 2021, 14, 857. [Google Scholar] [CrossRef]
  42. Zhou, J.; Wang, H.; Xiao, C.; Zhang, S. Hierarchical Surrogate-Assisted Evolutionary Algorithm for Integrated Multi-Objective Optimization of Well Placement and Hydraulic Fracture Parameters in Unconventional Shale Gas Reservoir. Energies 2023, 16, 303. [Google Scholar] [CrossRef]
Figure 1. The 3D geological model for Denglouku gas reservoir.
Energies 16 07918 g001
Figure 2. Experimental data of formation fluids: (a) relationships of formation factors, gas viscosity and pressure; (b) gas–water relative permeability curve.
Energies 16 07918 g002
Figure 3. Match of production data for Denglouku gas reservoir.
Energies 16 07918 g003
Figure 4. Match of WBHP for wells CSDP2 (left) and CSDP36 (right).
Energies 16 07918 g004
Figure 5. Distribution of gas abundance and pressure for Denglouku formation.
Energies 16 07918 g005
Figure 6. Formation pressure for origin (left), vertical infilling wells (middle) and horizontal infilling wells (right) in parallel pattern of MFHWs.
Energies 16 07918 g006
Figure 7. Comparison of FGPR and FGPT for origin, vertical infilling wells and horizontal infilling wells in parallel pattern of MFHWs.
Energies 16 07918 g007
Figure 8. Formation pressure for origin and vertical infilling wells in zipper pattern of MFHWs.
Energies 16 07918 g008
Figure 9. Comparison of FGPR and FGPT for zipper well pattern with origin and vertical infilling wells.
Energies 16 07918 g009
Figure 10. Design of infilling well locations.
Energies 16 07918 g010
Figure 11. FGPR and FGPT for all of adjustment schemes.
Energies 16 07918 g011
Figure 12. Gas recovery and increment of gas recovery for each adjustment scheme.
Energies 16 07918 g012
Figure 13. Comparisons of IPR and pay−back periods (left) and NPV for each adjustment scheme(right).
Energies 16 07918 g013
Table 1. Basic parameters for numerical simulation model.
ParameterValue ParameterValue
Formation length/m2025X grid size/m15
Formation width/m3300Y grid size/m25
Formation thickness/m21Z grid size/m3
Length of horizontal wells/m1000Fracture conductivity/(mD)150
Spacing of fractures/m675Gas production rate/(m3/d)100,000
Row spacing/m650Minimum BHP/Mpa10
Porosity/%6.55Fracture half-length/m112.5
Permeability/mD0.151Formation pressure/Mpa38.86
Depth of top face/m3900Fracturing stages 10
Table 2. Statistics for the measures for EGR in Denglouku gas reservoir.
No MeasuresDescriptionWellsFGPR/
104 m3/d
Investment/
USD Million
1Basic No measures39200
2Pressure boostWTHP is set to be 1.5 MPa and 4.5 MPa for wells with low and high CO2 mole fraction39204.1
3Patching holes, side trackingPatching holes for 11 wells, and sidetracking for 3 wells39202.9
4Infilling Add of 8 infill wells 472820.0
5Patching holes, side tracking, pressure boostPatching holes for 11 wells, and sidetracking for 3 wells, and WTHP is 1.5 MPa and 4.5 MPa for wells with low and high CO2 mole fraction39207.0
6Patching holes, side tracking, infillingPatching holes for 11 wells, and sidetracking for 3 wells, addition of 8 infill wells472822.9
7Infilling, pressure boostAddition of 8 infill wells, and WTHP is 1.5 MPa and 4.5 MPa for wells with low and high CO2 mole fraction472024.1
8Patching holes, side tracking, infilling, infilling, pressure boostPatching holes for 11 wells, and sidetracking for 3 wells, addition of 8 infill wells and WTHP is 1.5 MPa and 4.5 MPa for wells with low and high CO2 mole fraction472827.0
Disclaimer/Publisher’s Note: The statements, opinions and data contained in all publications are solely those of the individual author(s) and contributor(s) and not of MDPI and/or the editor(s). MDPI and/or the editor(s) disclaim responsibility for any injury to people or property resulting from any ideas, methods, instructions or products referred to in the content.

