
A Machine Learning Approach for Investment Analysis in Renewable Energy Sources: A Case Study in Photovoltaic Farms
 , , and
Abstract
:1. Introduction
2. Materials and Methods
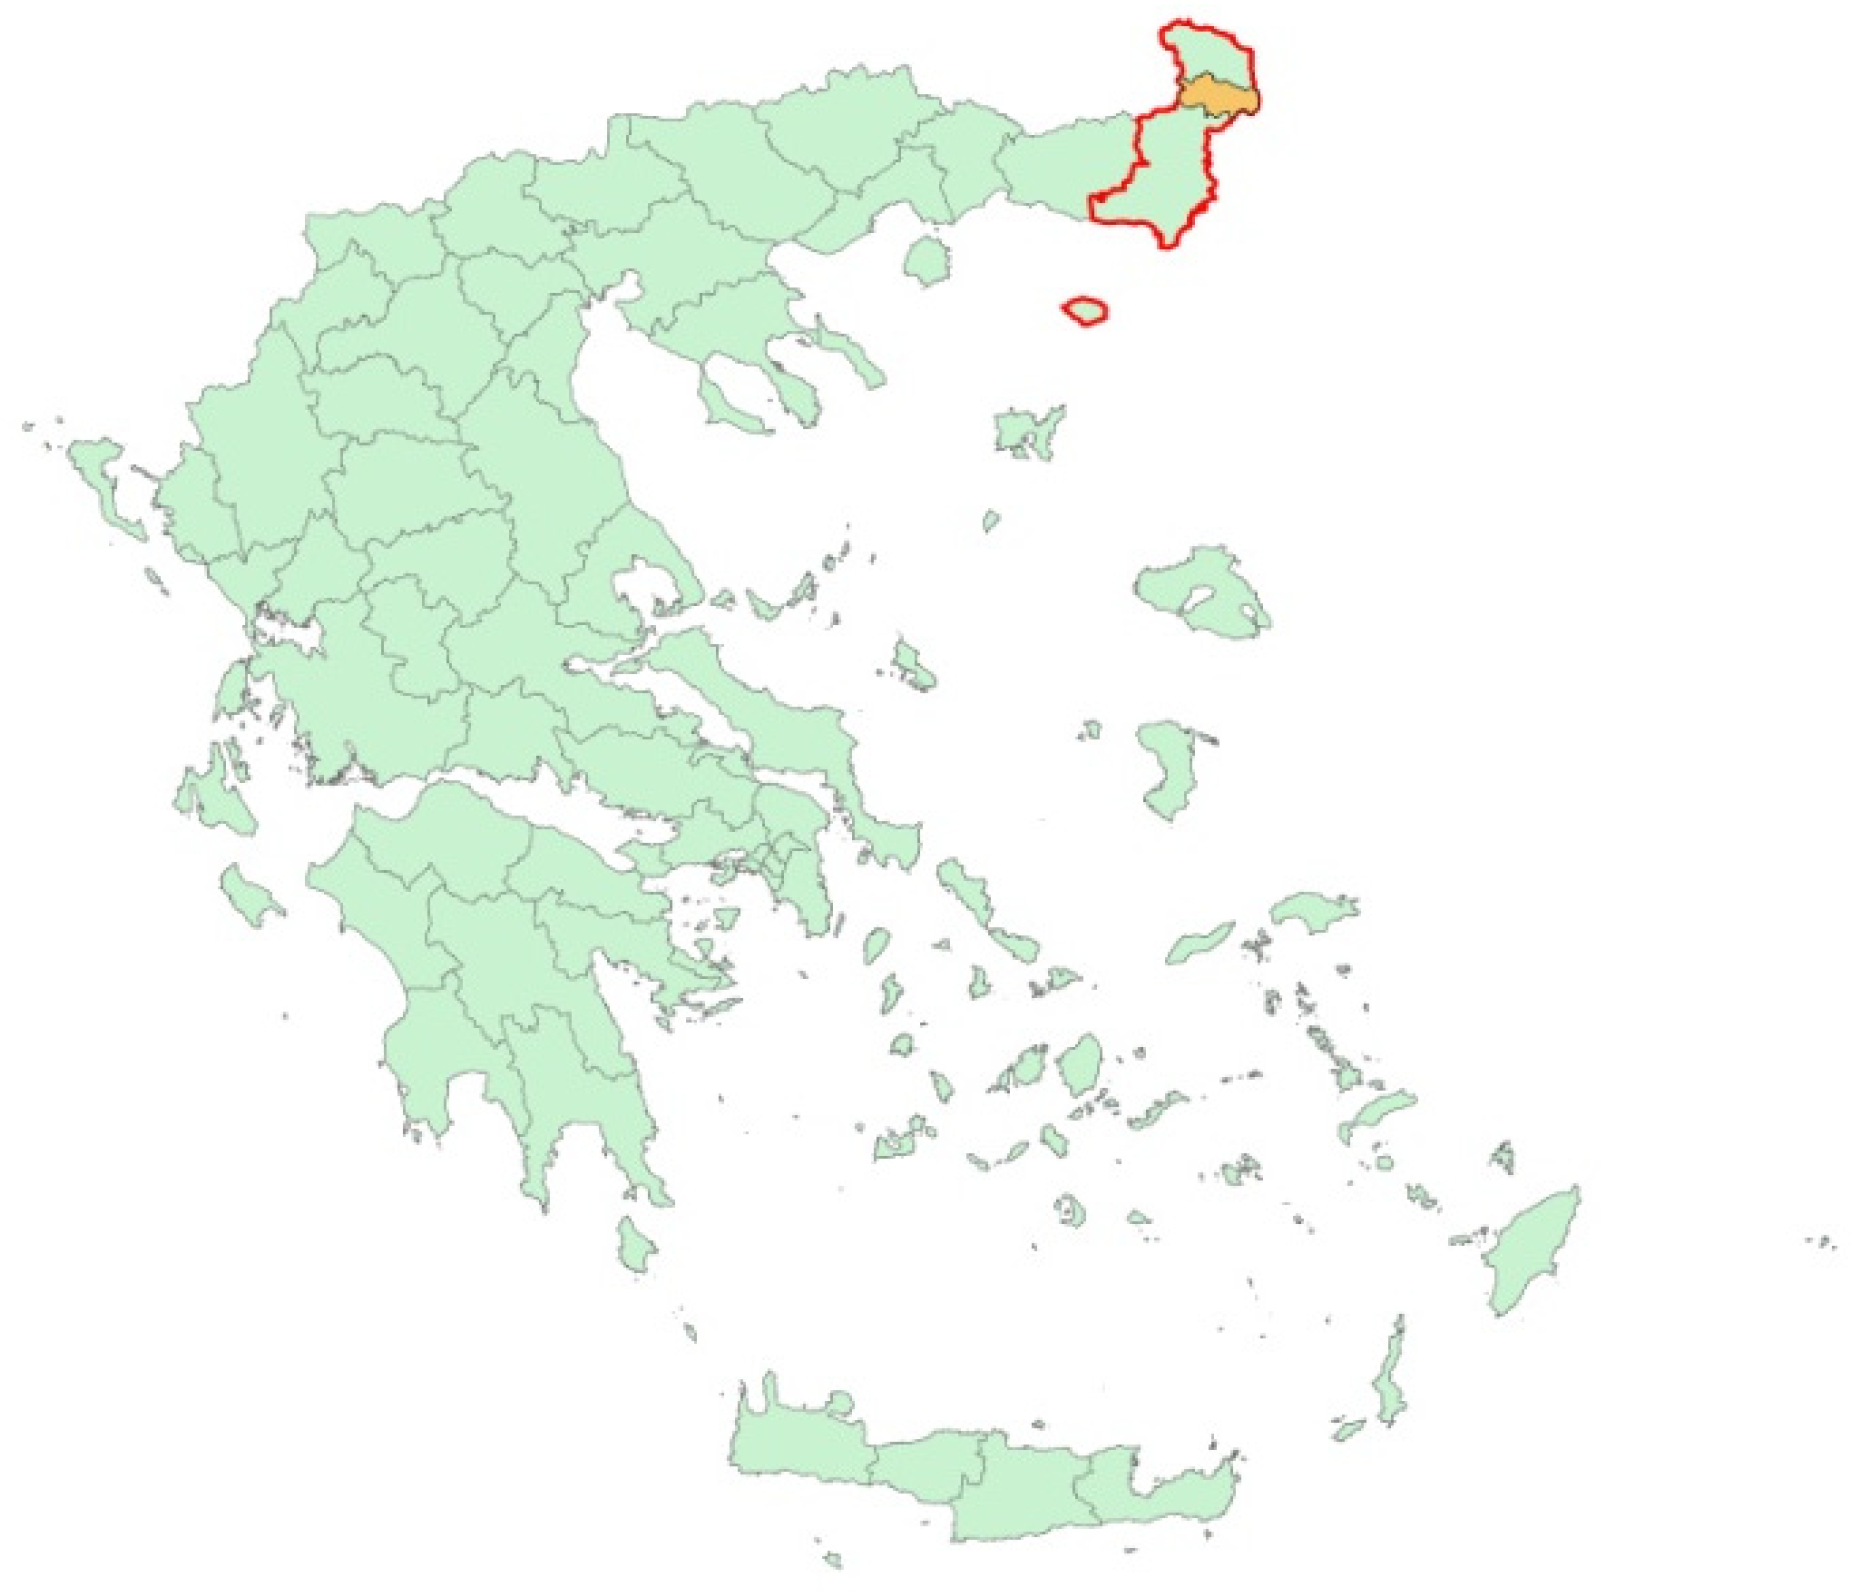
2.1. Data Description
2.2. Machine Learning
2.2.1. Linear Regression
2.2.2. Decision Trees
2.2.3. Random forests
2.2.4. Support Vector Machines
2.3. Data Preparation
2.4. Model Building
- Supervised. In this type, both X and Y values are known; therefore, the model is trained to predict the output from the input.
- Unsupervised. In this case, only X values are known; therefore, the model is trained to understand to model these values.
- Reinforced Training. In this case, the model decides on the next course of action, and it does this by learning through trial and error in an effort to maximize the reward.
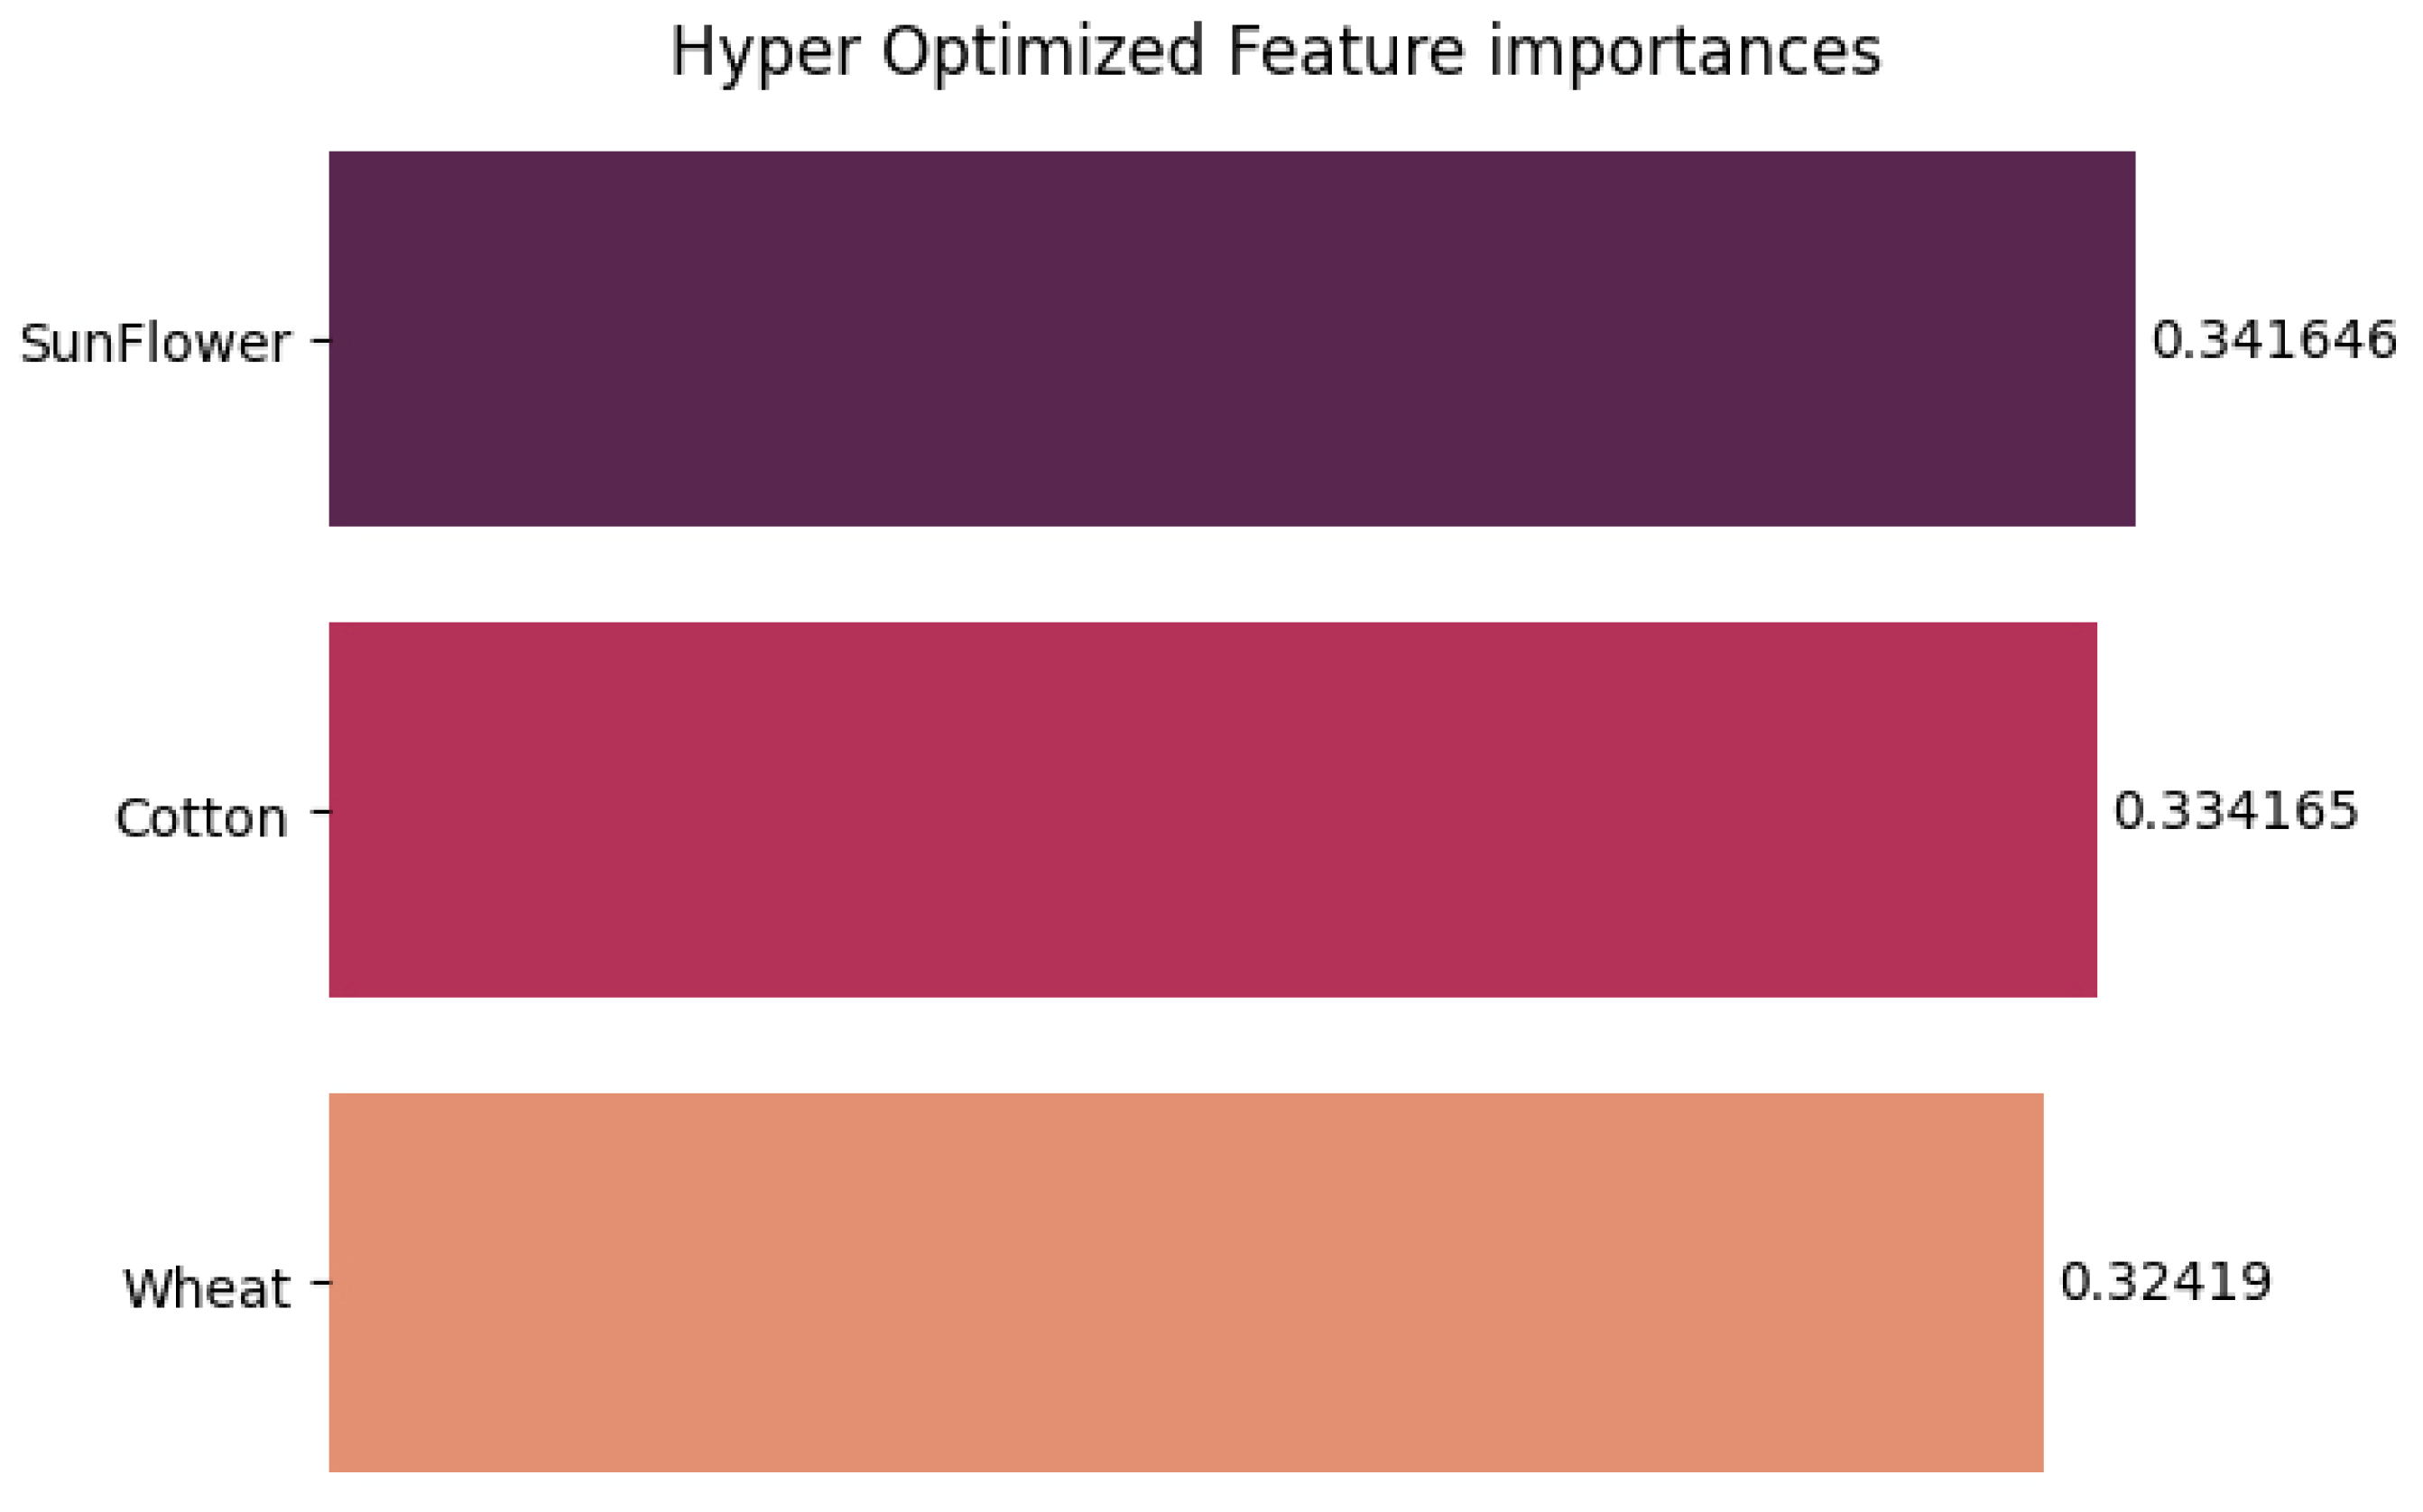
2.5. Hyperparameter Optimization
2.6. Coding
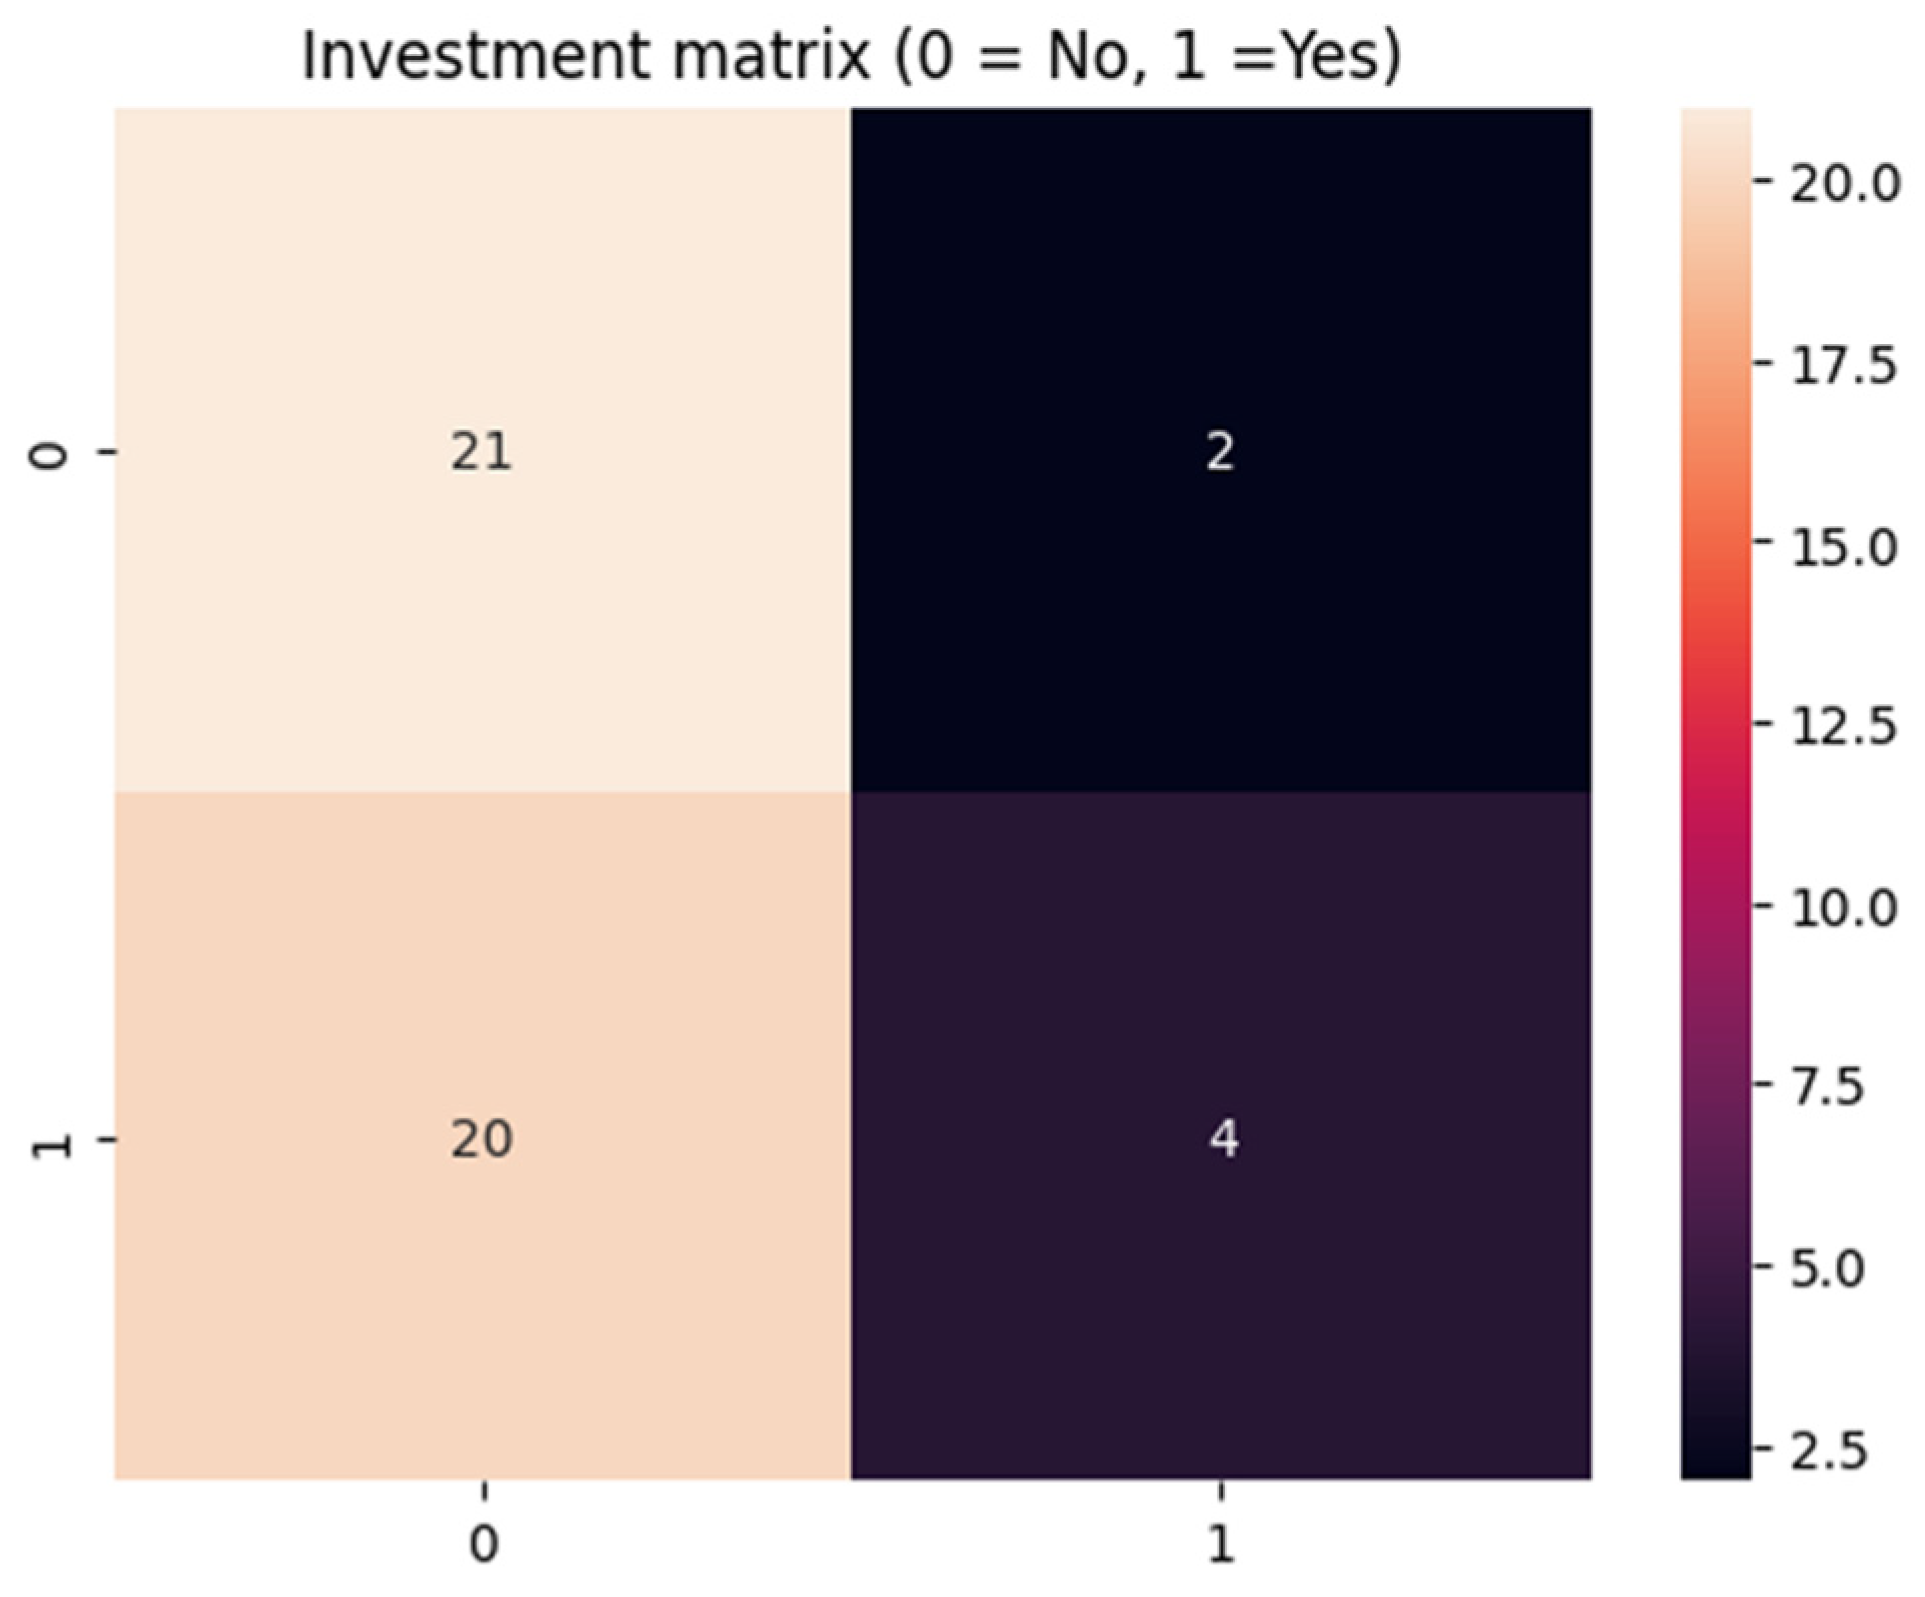
3. Results
3.1. Classified Regression
3.2. Decision Trees
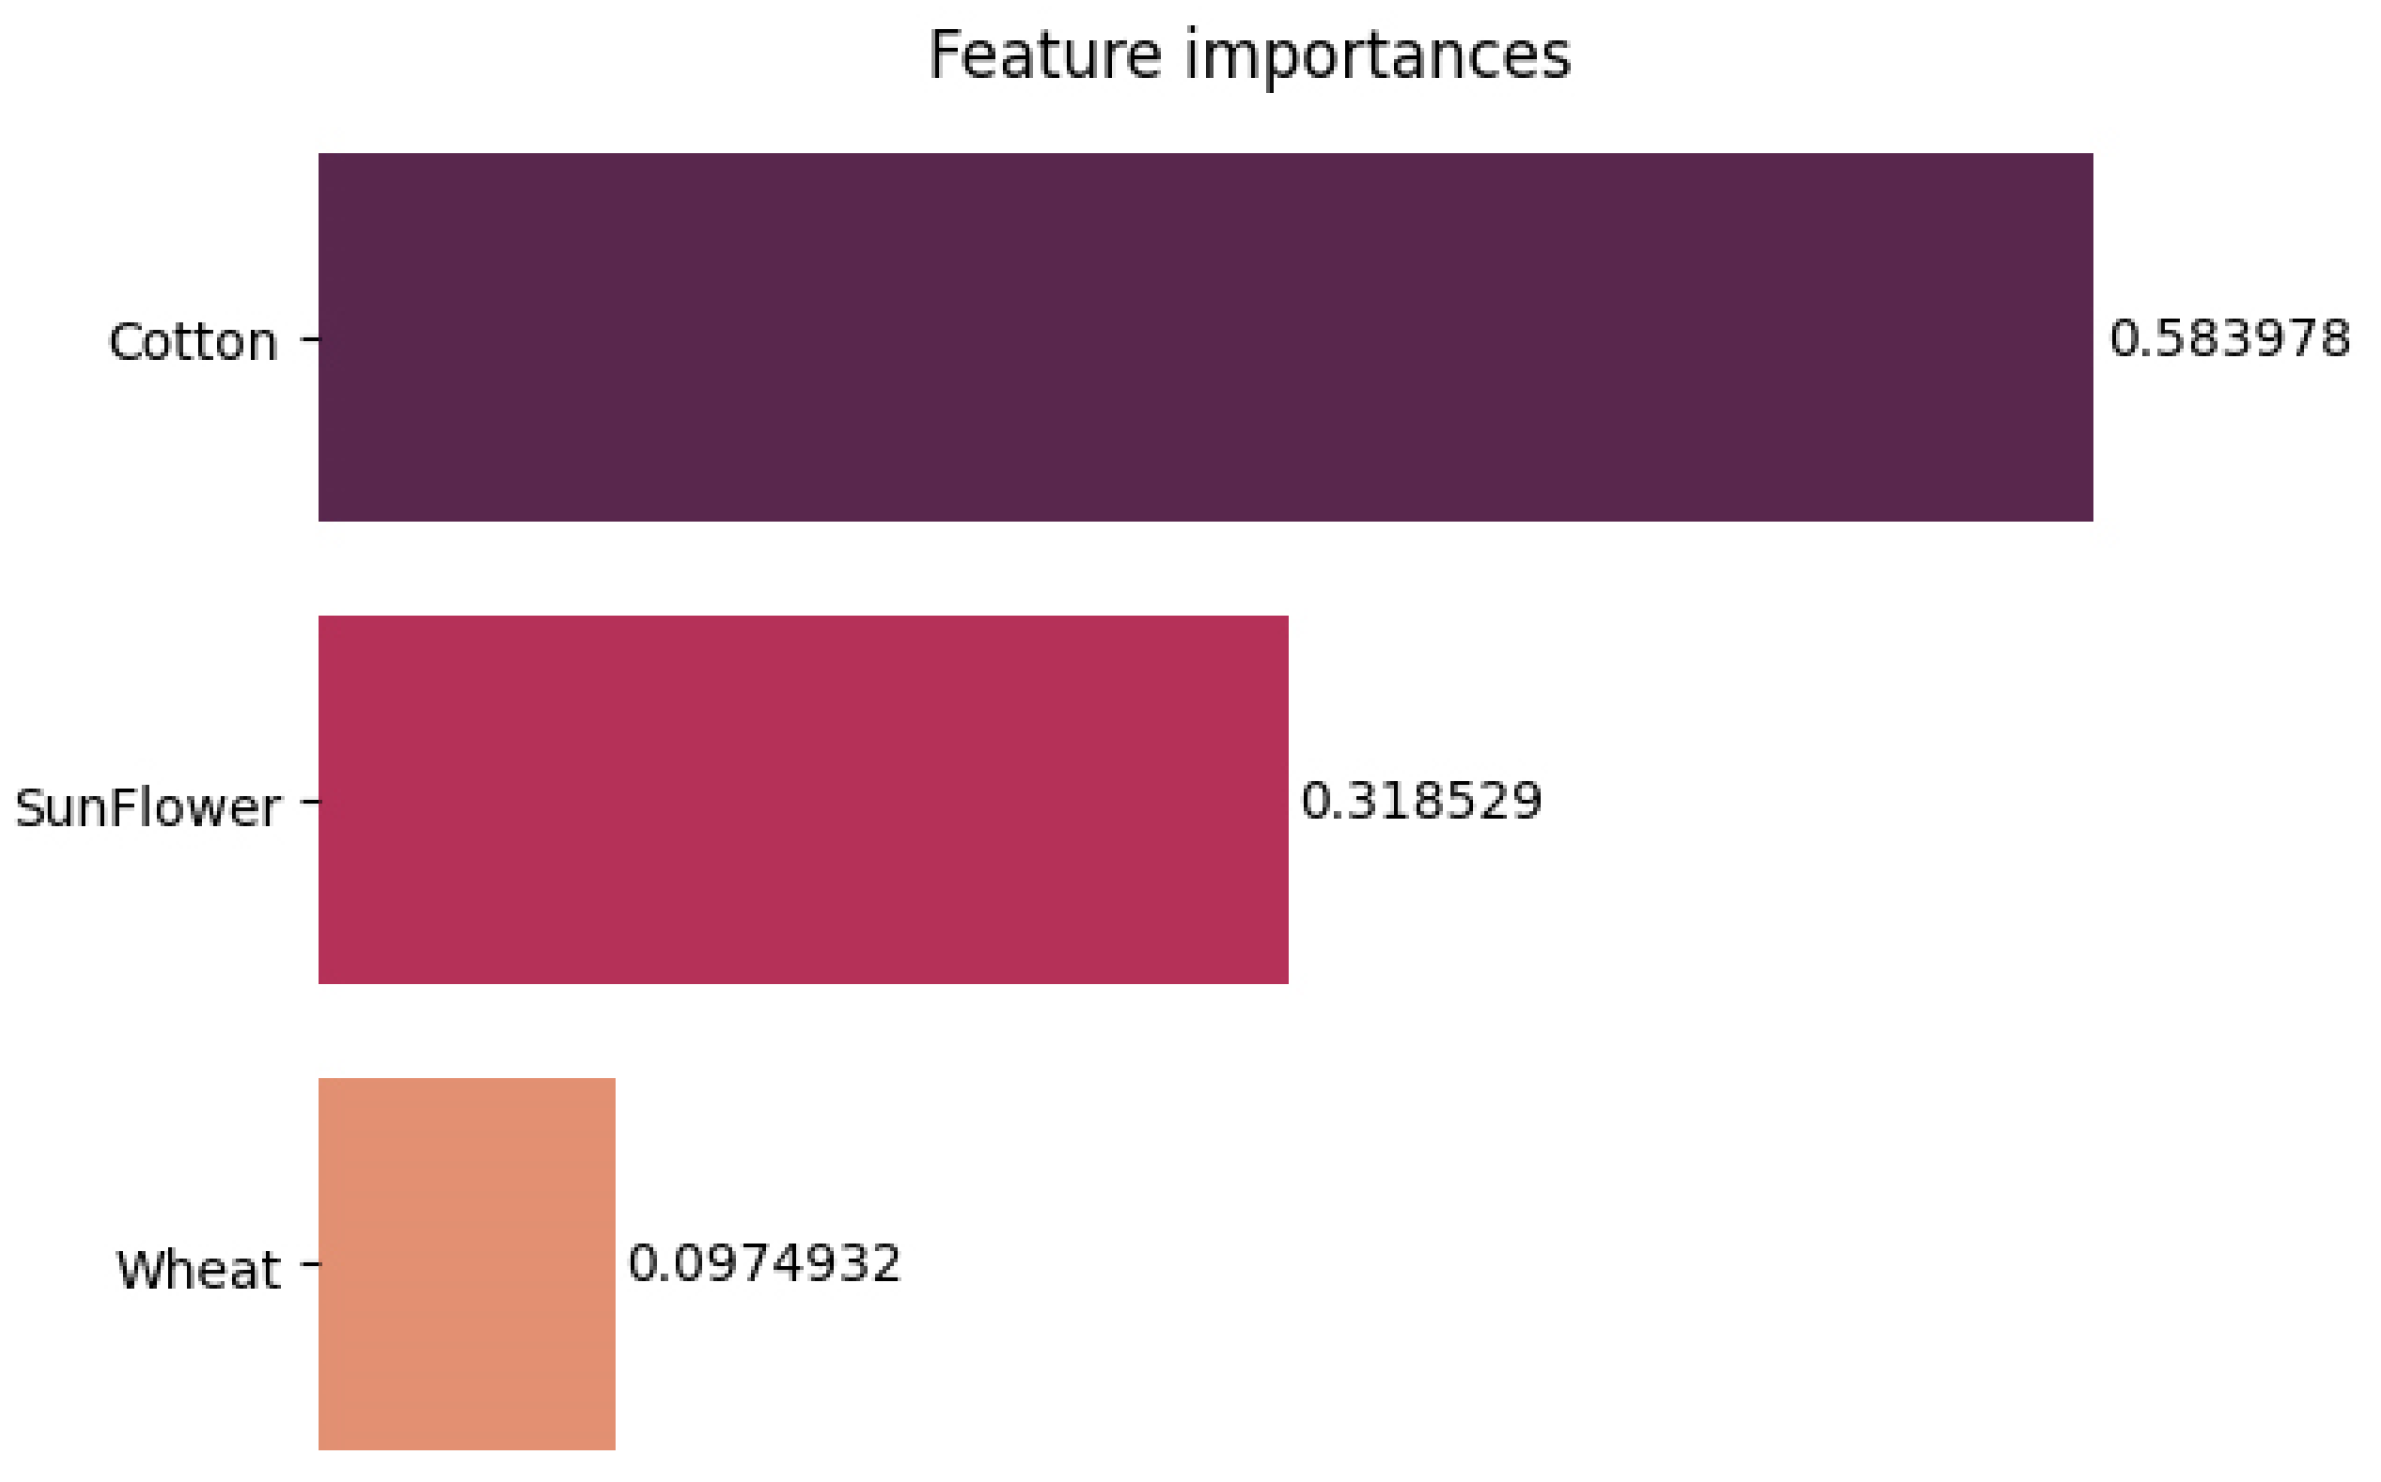
3.3. Random Forest
3.4. Support Vector Machine
4. Discussion
5. Conclusions
Author Contributions
Funding
Data Availability Statement
Conflicts of Interest
References
- Vyas, K. Solar Farming with Agricultural Land. Acta Sci. Agric. 2019, 3, 23–25. [Google Scholar] [CrossRef]
- Goldberg, Z.A. Solar Energy Development on Farmland: Three Prevalent Perspectives of Conflict, Synergy and Compromise in the United States. Energy Res. Soc. Sci. 2023, 101, 103145. [Google Scholar] [CrossRef]
- Adeh, E.H.; Good, S.P.; Calaf, M.; Higgins, C.W. Solar PV Power Potential Is Greatest Over Croplands. Sci. Rep. 2019, 9, 11442. [Google Scholar] [CrossRef] [PubMed]
- Lai, M.-C.; Wu, P.-I.; Liou, J.-L.; Chen, Y.; Chen, H. The Impact of Promoting Renewable Energy in Taiwan—How Much Hail Is Added to Snow in Farmland Prices? J. Clean. Prod. 2019, 241, 118519. [Google Scholar] [CrossRef]
- Pepermans, G.; Driesen, J.; Haeseldonckx, D.; Belmans, R.; D’haeseleer, W. Distributed Generation: Definition, Benefits and Issues. Energy Policy 2005, 33, 787–798. [Google Scholar] [CrossRef]
- Daniels, T.L. The Development of Utility-Scale Solar Projects on US Agricultural Land: Opportunities and Obstacles. Socio-Ecol. Pract. Res. 2023, 5, 205–213. [Google Scholar] [CrossRef]
- Feuerbacher, A.; Herrmann, T.; Neuenfeldt, S.; Laub, M.; Gocht, A. Estimating the Economics and Adoption Potential of Agrivoltaics in Germany Using a Farm-Level Bottom-up Approach. Renew. Sustain. Energy Rev. 2022, 168, 112784. [Google Scholar] [CrossRef]
- Crawford, J.; Bessette, D.; Mills, S.B. Rallying the Anti-Crowd: Organized Opposition, Democratic Deficit, and a Potential Social Gap in Large-Scale Solar Energy. Energy Res. Soc. Sci. 2022, 90, 102597. [Google Scholar] [CrossRef]
- Hu, Z. Towards Solar Extractivism? A Political Ecology Understanding of the Solar Energy and Agriculture Boom in Rural China. Energy Res. Soc. Sci. 2023, 98, 102988. [Google Scholar] [CrossRef]
- Delicado, A.; Figueiredo, E.; Silva, L. Community Perceptions of Renewable Energies in Portugal: Impacts on Environment, Landscape and Local Development. Energy Res. Soc. Sci. 2016, 13, 84–93. [Google Scholar] [CrossRef]
- Karasmanaki, E. Is It Safe to Live near Wind Turbines? Reviewing the Impacts of Wind Turbine Noise. Energy Sustain. Dev. 2022, 69, 87–102. [Google Scholar] [CrossRef]
- Prokopy, L.S.; Floress, K.; Klotthor-Weinkauf, D.; Baumgart-Getz, A. Determinants of Agricultural Best Management Practice Adoption: Evidence from the Literature. J. Soil Water Conserv. 2008, 63, 300–311. [Google Scholar] [CrossRef]
- Beckman, J.; Xiarchos, I.M. Why Are Californian Farmers Adopting More (and Larger) Renewable Energy Operations? Renew. Energy 2013, 55, 322–330. [Google Scholar] [CrossRef]
- Borchers, A.M.; Xiarchos, I.; Beckman, J. Determinants of Wind and Solar Energy System Adoption by U.S. Farms: A Multilevel Modeling Approach. Energy Policy 2014, 69, 106–115. [Google Scholar] [CrossRef]
- Bazen, E.F.; Brown, M.A. Feasibility of Solar Technology (Photovoltaic) Adoption: A Case Study on Tennessee’s Poultry Industry. Renew. Energy 2009, 34, 748–754. [Google Scholar] [CrossRef]
- Gazheli, A.; Di Corato, L. Land-Use Change and Solar Energy Production: A Real Option Approach. Agric. Financ. Rev. 2013, 73, 507–525. [Google Scholar] [CrossRef]
- Syal, S.M.; Ding, Y.; MacDonald, E.F. Agent-Based Modeling of Decisions and Developer Actions in Wind Farm Landowner Contract Acceptance. J. Mech. Des. 2020, 142, 091403. [Google Scholar] [CrossRef]
- Chatzipanagi, A.; Taylor, N.; Jaeger-Waldau, A. Overview of the Potential and Challenges for Agri-Photovoltaics in the European Union; Publications Office of the European Union: Luxembourg, 2023; ISBN 978-92-68-02431-7. [Google Scholar]
- SolarPower Europe. EU Market Outlook for Solar Power 2021–2025; SolarPower Europe: Brussels, Belgium, 2021. [Google Scholar]
- Karantininis, K. A New Paradigm for Greek Agriculture; Springer International Publishing: Cham, Switzerland, 2017; ISBN 978-3-319-59074-5. [Google Scholar]
- Pliakoura, A.; Beligiannis, G.N.; Mavrommati, A.; Kontogeorgos, A. Strengths and Weaknesses for the Young Farmers to Abide in the Greek Countryside: A Triangulation Approach. J. Agribus. Dev. Emerg. Econ. ahead-of-print. 2023. [Google Scholar] [CrossRef]
- Panhellenic Confederation of United Agricultural Cooperatives. Greek Agriculture 2040: Developmental Pillars of a Sustainable Ecosystem. 2021. Available online: https://www.greece2021.gr/Forum_GreeceIn2040/pdfs/%CE%9D%CE%95%CE%91_%CE%A0%CE%91%CE%A3%CE%95%CE%93%CE%95%CE%A3_%CE%95%CE%BB%CE%BB%CE%B7%CE%BD%CE%B9%CE%BA%CE%AE_%CE%93%CE%B5%CF%89%CF%81%CE%B3%CE%AF%CE%B1_2040.pdf (accessed on 2 August 2023).
- Kontogeorgos, A.; Sergaki, P.; Chatzitheodoridis, F. An assessment of new farmers’ perceptions about agricultural cooperatives. J. Dev. Entrep. 2017, 22, 1750003. [Google Scholar] [CrossRef]
- Kasimis, C.; Papadopoulos, A.G. Family Farming and Capitalist Development in Greek Agriculture: A Critical Review of the Literature. Sociol. Ruralis 1997, 37, 209–227. [Google Scholar] [CrossRef]
- Mishra, D.; Das, B.S.; Sinha, T.; Hoque, J.M.; Reynolds, C.; Rafiqul Islam, M.; Hossain, M.; Sar, P.; Menon, M. Living with Arsenic in the Environment: An Examination of Current Awareness of Farmers in the Bengal Basin Using Hybrid Feature Selection and Machine Learning. Environ. Int. 2021, 153, 106529. [Google Scholar] [CrossRef]
- Ding, Y.; Fan, L.; Liu, X. Analysis of Feature Matrix in Machine Learning Algorithms to Predict Energy Consumption of Public Buildings. Energy Build. 2021, 249, 111208. [Google Scholar] [CrossRef]
- Ghadami, N.; Gheibi, M.; Kian, Z.; Faramarz, M.G.; Naghedi, R.; Eftekhari, M.; Fathollahi-Fard, A.M.; Dulebenets, M.A.; Tian, G. Implementation of Solar Energy in Smart Cities Using an Integration of Artificial Neural Network, Photovoltaic System and Classical Delphi Methods. Sustain. Cities Soc. 2021, 74, 103149. [Google Scholar] [CrossRef]
- Matis. Forest Sampling, Assets Exploitation and Management Society; Democritus University of Thrace: Xanthi, Greece, 2001. [Google Scholar]
- Hellenic Statistical Authority Census of Crop and Livestock Farming. Available online: https://www.statistics.gr/statistics/agr (accessed on 2 August 2023).
- Pagano, M.; Gauvreau, K.; Mattie, H. Principles of Biostatistics; Chapman and Hall/CRC: Boca Raton, FL, USA, 2022; ISBN 9780429340512. [Google Scholar]
- Koza, J.R.; Bennett, F.H.; Andre, D.; Keane, M.A. Automated Design of Both the Topology and Sizing of Analog Electrical Circuits Using Genetic Programming. In Artificial Intelligence in Design ’96; Springer Netherlands: Dordrecht, The Netherlands, 1996; pp. 151–170. [Google Scholar]
- Yan, X.; Su, X.G. Linear Regression Analysis; World Scientific: Singapore, 2009; ISBN 978-981-283-410-2. [Google Scholar]
- Wu, X.; Kumar, V.; Ross Quinlan, J.; Ghosh, J.; Yang, Q.; Motoda, H.; McLachlan, G.J.; Ng, A.; Liu, B.; Yu, P.S.; et al. Top 10 Algorithms in Data Mining. Knowl. Inf. Syst. 2008, 14, 1–37. [Google Scholar] [CrossRef]
- Studer, M.; Ritschard, G.; Gabadinho, A.; Müller, N.S. Discrepancy Analysis of State Sequences. Sociol. Methods Res. 2011, 40, 471–510. [Google Scholar] [CrossRef]
- Ho, T.K. The Random Subspace Method for Constructing Decision Forests. IEEE Trans. Pattern Anal. Mach. Intell. 1998, 20, 832–844. [Google Scholar] [CrossRef]
- Breiman, L. Bagging Predictors. Mach. Learn. 1996, 24, 123–140. [Google Scholar] [CrossRef]
- Cortes, C.; Vapnik, V. Support-Vector Networks. Mach. Learn. 1995, 20, 273–297. [Google Scholar] [CrossRef]
- Frye, M.; Mohren, J.; Schmitt, R.H. Benchmarking of Data Preprocessing Methods for Machine Learning-Applications in Production. Procedia CIRP 2021, 104, 50–55. [Google Scholar] [CrossRef]
- Ioannou, K.; Myronidis, D. Automatic Detection of Photovoltaic Farms Using Satellite Imagery and Convolutional Neural Networks. Sustainability 2021, 13, 5323. [Google Scholar] [CrossRef]
- Buitinck, L.; Louppe, G.; Blondel, M.; Pedregosa, F.; Mueller, A.; Grisel, O.; Niculae, V.; Prettenhofer, P.; Gramfort, A.; Grobler, J.; et al. API Design for Machine Learning Software: Experiences from the Scikit-Learn Project. In Proceedings of the ECML PKDD Workshop: Languages for Data Mining and Machine Learning, Prague, Czech Republic, 23–27 September 2013; pp. 108–122. [Google Scholar]
- Kastner, I.; Stern, P.C. Examining the Decision-Making Processes behind Household Energy Investments: A Review. Energy Res. Soc. Sci. 2015, 10, 72–89. [Google Scholar] [CrossRef]
- Terry, J.C.D.; Roy, H.E.; August, T.A. Thinking like a Naturalist: Enhancing Computer Vision of Citizen Science Images by Harnessing Contextual Data. Methods Ecol. Evol. 2020, 11, 303–315. [Google Scholar] [CrossRef]
- Frey, U.J.; Klein, M.; Deissenroth, M. Modelling Complex Investment Decisions in Germany for Renewables with Different Machine Learning Algorithms. Environ. Model. Softw. 2019, 118, 61–75. [Google Scholar] [CrossRef]
- Izanloo, M.; Aslani, A.; Zahedi, R. Development of a Machine Learning Assessment Method for Renewable Energy Investment Decision Making. Appl. Energy 2022, 327, 120096. [Google Scholar] [CrossRef]
- Ni, W.; Huang, Y.; Wang, X.; Zhang, J.; Wu, K. Associations of Neonatal Lead, Cadmium, Chromium and Nickel Co-Exposure with DNA Oxidative Damage in an Electronic Waste Recycling Town. Sci. Total Environ. 2014, 472, 354–362. [Google Scholar] [CrossRef] [PubMed]
- Qi, L.; Zhang, Y. Effects of Solar Photovoltaic Technology on the Environment in China. Environ. Sci. Pollut. Res. 2017, 24, 22133–22142. [Google Scholar] [CrossRef]
- Barron-Gafford, G.A.; Minor, R.L.; Allen, N.A.; Cronin, A.D.; Brooks, A.E.; Pavao-Zuckerman, M.A. The Photovoltaic Heat Island Effect: Larger Solar Power Plants Increase Local Temperatures. Sci. Rep. 2016, 6, 35070. [Google Scholar] [CrossRef]
- Wu, Y.; Wang, Z. The Decision-Making of Agriculture & Solar Complementary Roof Power Generation Project in Rural Area. Energy Procedia 2017, 105, 3663–3672. [Google Scholar] [CrossRef]
- He, H.; Ling, Q.; Yangyang, Y.; Daowan, W. Smart-Power Generation Technology of Clean Energy with Water-Light Multi-Energy Complementary. Distrib. Energy 2020, 5, 21–26. [Google Scholar] [CrossRef]


| Independent Variables | Beta | Std Error | Df | Importance | F | p |
|---|---|---|---|---|---|---|
| Wheat | 0.013 | 0.082 | 1 | 0.028 | 0.024 | 0.878 |
| Cotton | 0.203 | 0.069 | 1 | 1.007 | 8.562 | 0.004 |
| Sunflower | −0.023 | 0.089 | 1 | −0.035 | 0.07 | 0.791 |
| Precision | Recall | f1-Score | Support | |
|---|---|---|---|---|
| No | 0.39 | 0.61 | 0.47 | 23 |
| Yes | 0.18 | 0.08 | 0.11 | 24 |
| Accuracy | 0.34 | 47 | ||
| Macro avg | 0.29 | 0.35 | 0.29 | 47 |
| Weighted avg | 0.56 | 0.53 | 0.29 | 47 |
| Precision | Recall | f1-Score | Support | |
|---|---|---|---|---|
| No | 0.51 | 0.83 | 0.63 | 23 |
| Yes | 0.60 | 0.25 | 0.35 | 24 |
| Accuracy | 0.53 | 47 | ||
| Macro avg | 0.56 | 0.54 | 0.49 | 47 |
| Weighted avg | 0.56 | 0.53 | 0.49 | 47 |
| Precision | Recall | f1-Score | Support | |
|---|---|---|---|---|
| No | 0.49 | 0.91 | 0.64 | 23 |
| Yes | 0.50 | 0.08 | 0.14 | 24 |
| Accuracy | 0.49 | 47 | ||
| Macro avg | 0.49 | 0.50 | 0.39 | 47 |
| Weighted avg | 0.49 | 0.49 | 0.38 | 47 |
| Precision | Recall | f1-Score | Support | |
|---|---|---|---|---|
| No | 0.51 | 0.91 | 0.66 | 23 |
| Yes | 0.67 | 0.17 | 0.27 | 24 |
| Accuracy | 0.53 | 47 | ||
| Macro avg | 0.59 | 0.54 | 0.46 | 47 |
| Weighted avg | 0.59 | 0.53 | 0.46 | 47 |
Disclaimer/Publisher’s Note: The statements, opinions and data contained in all publications are solely those of the individual author(s) and contributor(s) and not of MDPI and/or the editor(s). MDPI and/or the editor(s) disclaim responsibility for any injury to people or property resulting from any ideas, methods, instructions or products referred to in the content. |
© 2023 by the authors. Licensee MDPI, Basel, Switzerland. This article is an open access article distributed under the terms and conditions of the Creative Commons Attribution (CC BY) license (https://creativecommons.org/licenses/by/4.0/).
Share and Cite
Ioannou, K.; Karasmanaki, E.; Sfiri, D.; Galatsidas, S.; Tsantopoulos, G. A Machine Learning Approach for Investment Analysis in Renewable Energy Sources: A Case Study in Photovoltaic Farms. Energies 2023, 16, 7735. https://doi.org/10.3390/en16237735
Ioannou K, Karasmanaki E, Sfiri D, Galatsidas S, Tsantopoulos G. A Machine Learning Approach for Investment Analysis in Renewable Energy Sources: A Case Study in Photovoltaic Farms. Energies. 2023; 16(23):7735. https://doi.org/10.3390/en16237735
Chicago/Turabian StyleIoannou, Konstantinos, Evangelia Karasmanaki, Despoina Sfiri, Spyridon Galatsidas, and Georgios Tsantopoulos. 2023. "A Machine Learning Approach for Investment Analysis in Renewable Energy Sources: A Case Study in Photovoltaic Farms" Energies 16, no. 23: 7735. https://doi.org/10.3390/en16237735