
Assessing the Cost-Effectiveness of Incentives for Energy Transition Using Marginal Abatement Cost Curves


Institute for Renewable Energy, Eurac Research, Viale Druso 1, 39100 Bolzano, Italy
*
Author to whom correspondence should be addressed.
Energies 2023, 16(21), 7412; https://doi.org/10.3390/en16217412
Submission received: 28 September 2023
/
Revised: 25 October 2023
/
Accepted: 31 October 2023
/
Published: 2 November 2023
(This article belongs to the Special Issue Deep Decarbonization of Energy Systems with Hybrid Renewable Energy Integration)
Abstract
:Incentive policies play a crucial role in encouraging the adoption of renewable energy sources and energy efficiency measures. This study analyzes and compares the incentives for energy transition in the South Tyrol region of Italy using a marginal abatement cost (MAC) curve constructed with an expert-based approach. The incentives for residential energy efficiency, mobility, and boiler replacement are characterized based on assumptions for costs, energy savings, and parameters. The resulting expert-based MAC curve analysis reveals boiler replacement incentives to be the most cost-effective, yielding CO2 reductions at the lowest cost but with limited potential as the incentive is limited to apartment blocks that are not in district heating areas. Mobility incentives enabling electric vehicle adoption have the highest CO2 reduction potential, albeit at higher costs per ton abated. Residential energy efficiency incentives fall between the two for cost-effectiveness and potential. The MAC curve approach provides a useful comparison of cost-effectiveness versus potential, guiding policy prioritization. This techno-economic assessment methodology can be applied to other regions pursuing energy transition. Overall, a balanced policy mix encompassing transport, buildings, and heating is required for comprehensive low-carbon transition.
1. Introduction
Energy policies play a crucial role in addressing the growth and use of energy, encompassing aspects such as energy production, distribution, and consumption. The book “Energy for Sustainable Development—Demand, Supply, Conversion and Management” written by M.M. Islam and M. Hasanuzzman in 2020 states that an “Energy policy is the scheme in which the government (or any organization) addresses issues related to energy growth and usage including energy production, distribution, and consumption. The attributes of energy policy may include legislation, international treaties, incentives to investment, guidelines for energy conservation, taxation, and other public policy techniques” [1]. Energy policies and incentive programs are critical tools for promoting renewable energy sources, energy efficiency, and sustainable transitions [2]. Well-designed policies can help overcome barriers to technology adoption while optimizing social, economic, and environmental objectives [3].
The European Parliament has established an integrated energy market, the security of energy supply, and the sustainability of the sector as the core objectives of its energy policy [4]. South Tyrol is an autonomous province located in the northern Italian region of Trentino-Alto Adige. The Klimaplan is South Tyrol’s energy and climate strategy document outlining policies and targets to decarbonize the province’s energy system by 2040 [5,6].
This research focuses on a specific aspect of energy policy: incentives. Incentives, in this context, refer to financial motivations that encourage citizens to adopt certain actions or behaviors. These incentive policies are designed to overcome barriers that may hinder the implementation of specific interventions. In South Tyrol, the Province of Bozen/Bolzano aims to promote the use of renewable energy sources and the adoption of more sustainable energy solutions by providing economic benefits to the population [5].
By examining the incentives in South Tyrol as a case study, this research investigates the investment trends and incentives provided in South Tyrol for facilitating the energy transition, with the goal of identifying, through a techno-economic evaluation, which measures yield greater results in terms of CO2 emission savings at the same cost, and which have a higher emission reduction potential. The findings of this analysis contribute to the development of future decarbonization strategies aimed at achieving the best outcomes at the lowest possible cost.
To achieve this, the study constructs a Marginal Abatement Cost (MAC) curve, which enables the visualization of various incentives organized according to the cost of CO2 abatement. By analyzing and comparing these incentives, this research seeks to determine the most cost-effective and efficient measures for reducing CO2 emissions in South Tyrol, ultimately guiding policy-makers in implementing effective and sustainable energy transition strategies.
Various approaches have been employed to compare energy policies in the existing literature. The use of the Marginal Abatement Cost curve as a tool for comparing and evaluating energy policies has rarely been identified in the scientific literature in the past decades. For this reason, this section will first analyze the alternative methods used to estimate the effectiveness of energy policies and subsequently identify the most relevant studies that have made use of the MAC curve in the energy sector.
A growing body of research has focused on empirically assessing the effectiveness of subsidies and public funding programs. Caloffi et al. [7] conducted a comparative evaluation of regional subsidies for collaborative versus individual R&D projects in Italian SMEs. Using propensity score matching, they found that collaborative R&D subsidies increased later networking while individual R&D subsidies increased unsubsidized R&D spending. Chinetti [8] analyzed investment subsidies for innovation in Italian lagging regions, finding a positive effect on treated firms’ investment spending using a difference-in-differences approach.
Recent research has employed a range of methodological approaches to evaluate and compare energy policies. Indicator-based assessments using metrics spanning environmental, economic, social, and institutional dimensions are common [9]. Greenhouse gas (GHG) emissions reduction is a prominent environmental indicator, as demonstrated in Arbolino et al.’s (2019) study on the effectiveness of the European energy policy on the Italian system [10]. Within the economic concern, two subcategories have been identified: economic-cost and economic-competitiveness. Macro- and micro-economic indicators, such as Gross Domestic Product [11] and energy price [12], are considered in the economic-cost subcategory, while market orientation indicators, like investment incentives, are examined in the economic-competitiveness subcategory [13].
Schmid [14] empirically analyzes the impacts of India’s 2003 Electricity Act, 2006 Tariff Policy, feed-in tariffs, renewable quotas, and private sector participation on the development of grid-connected renewable power across nine Indian states from 2001 to 2009. Shrimali et al. [15] develop a levelized cost of electricity models to evaluate the cost-effectiveness of the policies needed to meet India’s 2022 renewable energy targets for wind and solar power. Li et al. [16] utilized panel regression models to evaluate the effectiveness of different economic policy instruments on photovoltaic (PV) and wind power development across European Union member countries. Their findings confirm feed-in tariffs as the most effective policy for promoting both PV and wind, while renewable portfolio standards had a positive but smaller impact on wind development. The results suggest that financial support to reduce initial investment costs is important for wind power expansion.
The social category also contains two subcategories: social-equity and social-employment, with key indicators including public acceptance of specific energy technologies [17] and the employment or unemployment rate influenced by energy policies [18]. The institutional concern comprises indicators related to the policy environment [19]. It appears that the economic concern is the most frequently addressed in the reviewed literature. This research employs an economic indicator, combined with an environmental one, by analyzing the euros spent per ton of CO2 emission saved.
The emphasis of this research was placed on the comparison of the efficiency of the energy policies using the Marginal Abatement Cost curve. The use of the MAC curve is crucial in this research, as it allows the identification of the incentives with the greatest emission abatement potential at the same cost for the public purse. In addition, the MAC curve makes it possible to display the various incentives according to their CO2 abatement cost.
In the literature, MAC curves have emerged as a useful tool for visualizing and comparing the costs and emission reduction potentials of various decarbonization measures. Huang et al. [20] identified two primary methods for constructing MAC curves: expert-based and model-based approaches. Expert-based MAC curves rely on individual assessments of abatement options to calculate incremental costs and CO2 savings. This generates a step-wise curve with each discrete step representing the emissions reduced by a specific measure [21]. However, expert curves can overlook the systemic interactions between sectors and have inconsistent baseline assumptions [22].
Alternatively, model-based MAC curves utilize an energy system model (bottom-up, top-down, or hybrid) to simulate progressive CO2 taxes or emissions constraints. This captures sectoral interactions and avoids double counting [23]. But bottom-up models lack macro-economic feedback [24] while top-down models lack technological detail [24]. The resulting MAC curve is smooth rather than step-wise [25]. Recent work by Kesicki [26] advanced model-based MAC curves by using MARKAL modeling with decomposition analysis. This allowed an inspection of mitigation costs and potentials while retaining technological specificity [27]. Another application of model-based MAC curves is given by Prina et al. [28], who developed the EPLANoptMAC model, which couples an optimization model to EnergyPLAN software [29] to obtain MAC curves. A similar approach has been implemented by Groppi et al. [30] to study the best decarbonization measures at an insular level. Chang et al. [31] used the EPLANoptMAC [28] to study Chile’s energy transition and compared the results to the ones obtained through simulated expert-based scenarios. Misconel et al. [32,33], through the use of the bottom-up linear optimization model ELTRAMOD, realized a similar approach and developed MAC curves to study the German sector-coupled power system in 2030.
However, applications of MAC curve analysis to incentive policies remain limited in the scientific literature. This research addresses this gap by constructing MAC curves to assess the incentives for energy transition. The analysis provides a novel application of MAC curves for comparing cost-effectiveness and the potential of distinct incentives targeting the building, transport, and heating sectors. The results yield actionable insights to guide incentive prioritization and the design of balanced policy mixes for cost-effective deep decarbonization. While focused on South Tyrol, the methodological approach is generalizable to incentive assessments for local energy transitions globally.
This research provides the reader with an overview of the current incentives provided in South Tyrol for energy transition with the intention of comparing them according to their emission reduction cost. After a brief introduction, Section 2 presents the materials and methods used to complete the research, while the following section presents the South Tyrol case study. In Section 3, the three incentive categories are characterized. For each incentive, the data necessary for the construction of the corresponding MAC curve are calculated and presented in Section 4. Finally, Section 5 contains the discussion of the results obtained in the previous section, while the Section 6 presents the concluding remarks of the paper.
2. Materials and Methods
This study utilizes the MAC curve to analyze and compare the incentives for energy transition in South Tyrol. The MAC curve is a graphical representation of the cost of the CO2 abatement associated with various energy transition measures. The MAC curve graphs the cost of abating CO2 emissions (y-axis) against the potential CO2 emission reductions (x-axis) for each incentive measure. This visualizes the relationship between abatement costs and emission reduction potentials. There are two main approaches to constructing a MAC curve: expert-based and model-based. Expert-based approach: This method, chosen for this study, relies on expert knowledge to estimate the costs and potential emission reductions associated with each incentive. The expert-based approach is typically used when detailed data are limited or when a high degree of flexibility in assumptions is required. Model-based approach: In contrast, the model-based approach uses a detailed mathematical model to simulate the impacts of different energy transition measures. This method is more appropriate when extensive data are available and a higher degree of precision is necessary.
In this study, the MAC curves have been developed using an expert-based approach, which relies on estimating costs and CO2 savings for each incentive based on available data and reasonable assumptions. This flexible approach is suitable when detailed quantified data may be limited, as in this case study of diverse incentive measures. The key parameters calculated for each incentive are: (i) tCO2 saved, actual lifetime CO2 emissions reduced due to the incentive, and (ii) potential tCO2 saved, maximum additional CO2 emissions that could be reduced if the incentive were fully adopted.
The general formula to calculate the cost of CO2 abatement (CCA) is given by Equation (1).
where:
- Amount of the contribution (€) is the total subsidy provided;
- tCO2 saved is the lifetime CO2 emissions reduced due to the incentive.
The potential tCO2 saved depends on the specific incentive. The potential tCO2 saved is given by the annual tCO2 saved per intervention times the number of feasible interventions. Annual tCO2 saved per intervention is the yearly CO2 reduction for intervention (in the energy efficiency of buildings, mobility, and boilers replacement sectors). The potential CO2 savings associated with each incentive depends on key parameters specific to that category.
For residential building efficiency incentives, the potential CO2 savings are determined by multiplying the annual CO2 reductions per home retrofitted by the total number of applicable homes in South Tyrol. The annual CO2 savings per home retrofit are estimated based on the energy savings from enhanced insulation, windows, etc., and the emission factor for natural gas heating. The total number of applicable homes is based on the housing type, age group, and heated area data for South Tyrol.
For mobility incentives, the potential CO2 savings are calculated by multiplying the annual CO2 reductions per vehicle switched from petrol/diesel to electric by the total number of private petrol/diesel vehicles currently on South Tyrol’s roads. The annual CO2 savings per vehicle switch are estimated from differences in fuel efficiency, annual mileage, and emissions factors.
And for boiler replacement incentives, the potential CO2 savings are estimated by multiplying the annual CO2 reductions per boiler replacement by the total number of apartment blocks still using gas/diesel boilers and the share without access to district heating. The annual CO2 savings per boiler switch depend on the old and new system efficiencies and fuels’ emission factors.
2.1. Residential Energy Efficiency
An important category of incentives for energy transition in South Tyrol targets improvements in residential energy efficiency through building insulation and window upgrades. Enhancing efficiency in the region’s building stock offers significant potential for emissions reduction given that space heating accounts for the majority of household energy demands. However, assessing the cost-effectiveness and potential of residential efficiency incentives requires a characterization of the building stock.
This section details the key assumptions made in modeling South Tyrol’s residential buildings to enable a comparison of the insulation and window replacement incentives. Housing Types: Four housing types were considered: single-family homes, small multi-family homes (<5 units), large multi-family homes (>5 units), and apartment blocks [6]. It is important to specify that the Province of Bozen/Bolzano defines a condominium as a building with at least five residential units [34]. According to this specification, small and large multi-family houses are also part of this category. Age Groups: Buildings were categorized into 7 age groups by year of construction, influencing energy savings: <1945, 1946–1969, 1970–1979, 1980–1989, 1990–1999, 2000–2010, and post-2010 [35]. Table 1 and Table 2 first show the heated surface area in [6] and then the consumption in kWh/ [35] for each type of housing unit and the corresponding year of construction.
As illustrated, single-family homes comprise the largest share of heated floor area and energy use. Older buildings from before 1980 generally have higher consumption, indicating greater efficiency improvement potential. Key parameters for estimating CO2 savings and costs of roof, wall, and window upgrades build on this housing data along with assumptions detailed further in Appendix A. The pie chart (Figure 1) demonstrates that 75 percent of the total consumption of residential buildings is accounted for by single-family houses.
2.2. Mobility
Transportation is a major contributor to greenhouse gas emissions globally. Decarbonizing the transport sector through electrification and other low-carbon alternatives is therefore essential for climate change mitigation. This makes incentives aimed at accelerating the transition to electric vehicles an important policy lever for reducing emissions. This section outlines the assumptions made in evaluating the cost-effectiveness and emission reduction potential of electric vehicle incentives in South Tyrol. Four scenarios were assessed based on switching from petrol or diesel vehicles to full electric or plug-in hybrid electric vehicles [36]. The key parameters modeled include annual vehicle kilometers traveled, vehicle lifetimes, energy consumption, and emissions factors. The analysis relies on reasonable assumptions for these factors based on data for South Tyrol and Italian driving patterns. The assumptions provide an indicative basis to compare the mobility incentives using the MAC curve methodology, although uncertainties remain. Further sensitivity analysis on the parameters could enrich the assessment.
In addition, it was assumed that the total number of cars in South Tyrol is about 450,000, with 259,650 diesel-powered and the remaining 58%, namely 180,900, petrol-powered [37]. Furthermore, it is supposed that the vast majority of citizens (80%) would opt to transition to a full electric vehicle and that the remaining 20 per cent would choose to transition to a plug-in hybrid vehicle. An average annual vehicle mileage of 11,200 km was utilized based on the data of the driving patterns of Italian motorists [6]. A higher annual mileage would improve the cost-effectiveness of electrification by allowing more fuel/emissions savings per vehicle. On the other hand, a lower annual mileage would reduce the relative benefit of electrification. An average lifetime of 10 years was assumed for all vehicle types [36]. This affects total lifetime emissions reductions. Longer assumed lifetimes would increase the total emissions savings, while shorter lifetimes would reduce it. Advanced batteries could potentially extend electric vehicle lifetimes in the future. Values for kWh/100 km were used to estimate EV efficiency. A value of 13.61 kWh/100 km was used for BEVs and 32 kWh/100 km for PHEVs based on typical efficiencies [6]. Factors of 0 tCO2/MWh for electric (considering the South Tyrol electricity mix mostly based on Hydro power [6,38]), 0.25 tCO2/MWh for petrol, and 0.27 tCO2/MWh for diesel were used based on a life cycle analysis of fuels [37]. This accounts for upstream emissions from fuel production and electricity generation. Lower grid emissions will enhance the benefits of electrification over time.
A high 80% BEV adoption share and 20% PHEV share was assumed if consumers switched from petrol/diesel vehicles [6]. This significant preference for BEVs maximizes potential emissions reductions but is dependent on battery prices, charging infrastructure, and consumer preferences. More conservative adoption shares could be tested in sensitivity analyses. The amount of the contribution for the purchase of the full electric or plug-in hybrid vehicles was calculated as follows. To the €2000 for the purchase of the electric vehicle or the €1000 for the hybrid vehicle, €248.75 was added for the exemption from car tax for the first five years of use and a further €55.96 for the reduction to 22.5% of the tax after the first five years [36].
2.3. Replacement of Diesel and Gas Boiler in Apartment Blocks
Transitioning from fossil fuel boilers to lower carbon heating technologies like heat pumps, district energy systems, and biomass offers significant decarbonization potential. Incentives can help drive this transition in the building sector. This section details the assumptions made in assessing the incentives for replacing old gas or diesel boilers in apartment blocks in South Tyrol. It must be recalled that the Province of Bozen/Bolzano defines an apartment block as a residential building with at least five residential units inside it; therefore “Small multi-family houses” and “Large multi-family houses” are also considered for the subsequent calculations. Seven alternatives have been identified [34], i.e., the transition from a:
- (1)
- Gas boiler—Connection to a district heating network;
- (2)
- Diesel boiler—Connection to a district heating network;
- (3)
- Gas boiler—Installation of a heat pump;
- (4)
- Diesel boiler—Installation of a heat pump;
- (5)
- Gas boiler—Installation of a hybrid heating system;
- (6)
- Diesel boiler—Installation of a hybrid heating system;
- (7)
- Gas boiler—Installation of biomass heating system.
The Province of Bozen/Bolzano specifies that “For the replacement of diesel and gas boilers within an area served by a district heating system delimited by the Autonomous Province of Bolzano-Alto Adige, subsidies are provided only for connection to the district heating system” [39]. This implies that if a citizen decides, for example, to replace his or her gas boiler with a hybrid heating system, when in fact he or she would have the possibility of connecting to district heating, he or she would not be able to receive the subsidies foreseen for the installation costs of the hybrid heating system.
The following assumptions were made regarding district heating in South Tyrol. It is assumed that the maximum potential extension of district heating in a city could be up to 70 per cent, following what was evaluated for the city of Copenhagen [24]. This resulted in approximately 20 per cent of the South Tyrolean population having possible access to district heating. The remaining 80% that cannot access district heating is assumed to be divided equally between the installation of a heat pump, a hybrid system, and a biomass system. In addition, it was assumed that 55.70% of the apartment blocks in South Tyrol dispose of a gas boiler and 10.07% of the apartment blocks own a diesel boiler [6].
3. Case Study
This research analyzes the incentives for energy transition in the Alpine region of South Tyrol, Italy. South Tyrol provides a relevant case for applying and assessing the MAC curve approach to analyze energy transition incentives. As an autonomous province, South Tyrol has autonomy in setting policies and incentive programs aligned with the local context. The comprehensive decarbonization framework outlined in South Tyrol’s Klimaplan, along with the suite of provincial incentive programs, provides a rich setting to examine and compare the cost-effectiveness of incentives targeting buildings, transport, and heating. The lessons learned from constructing the MAC curve and evaluating South Tyrol’s incentives can help guide other sub-national jurisdictions in balancing localized incentive programs for cost-effective deep decarbonization.
Initially, all incentives made available by the Province of Bozen/Bolzano for the promotion of energy efficiency and the use of renewable energy sources were identified in accordance with Article 2 of Provincial Law No. 9 of 7 July 2010 and subsequent amendments [40]. The subsidies are provided in implementing the principles contained in Directive 2010/31/EU of the European Parliament and the Council of 19 May 2010 on the energy performance of buildings [41] and Directive (EU) 2018/2001 of the European Parliament and of the Council of 11 December 2018 on the promotion of the use of energy from renewable sources [42].
First of all, the criteria for the granting of subsidies were established, defining the beneficiaries and general requirements. Concerning this research, incentives were considered only with regard to natural person and the interventions are considered eligible if the planned costs are not less than €1500.00, excluding VAT [39]. Finally, it is specified that the provincial contributions are not cumulative with other contributions or subsidies with the same admissible costs and calculated according to the same criteria, provided for by the state regulations [39].
Data on the incentives were collected from the website of the Province of Bozen/Bolzano, which aims to promote renewable energy and energy efficiency through economic benefits to citizens [5]. Table 3 shows the incentives considered in this study subdivided by sector. While the incentives assessed are not directly aimed at increasing renewable energy penetration, they exemplify measures targeting reduced energy consumption, improved efficiency, electrification, and lower-carbon heating sources. As such, this analysis of incentives for demand-side management and carbon abatement in buildings, transport, and heating provides insights into cost-effective technologies and policies to enable the deep decarbonization of South Tyrol’s energy system consistent with the focus of this special issue.
For each category of contributions, several assumptions were made. Appendix A describes in detail all the assumptions and sources selected for each of these three categories. Assumptions were made about the characteristics of each incentive. Table 4 shows the main assumption for each considered sector.
To evaluate the incentives for residential energy efficiency, mobility, and boiler replacement, certain simplifying assumptions were made, as described further in Appendix A. For the residential building incentives, assumptions were made regarding housing types, age groups, heated areas, and energy consumption profiles. The mobility incentives were modeled based on assumed vehicle lifetimes, annual mileages, energy use, and emissions factors. And the boiler replacement incentives relied on assumptions around potential replacement systems, district heating accessibility, boiler use shares, and emissions factors. These assumptions aimed to provide representative values to allow a fair comparison between the incentives using the MAC curve methodology. Unavoidably, the assumptions entail certain simplifications and uncertainties. Further sensitivity analyses could be beneficial to test the robustness of the findings. However, the assumptions provide a reasonable starting basis to apply the MAC framework for this initial comparison of the cost-effectiveness and emissions reduction potentials across the main categories of the energy transition incentives available in South Tyrol. The details of the assumptions and data sources are documented in Appendix A.
4. Results
The aim of this research is to identify which, among the incentives characterized in the previous section, produce the greatest results in terms of emission savings for the same costs and which of these have the greatest emission abatement potential. It is achieved by constructing a MAC curve, which allows the visualization of the various incentives organized according to their abatement cost. This section will present the specific MAC curves for each incentive and an overall MAC curve depicting all the measures.
4.1. Results for Residential Energy Efficiency
Figure 2 plots the MAC curve comparing the residential energy efficiency incentives for roof insulation, external wall insulation, and window replacement. The curve plots the cost of CO2 abatement in euros on the y-axis against the emission reduction potential in tonnes CO2 on the x-axis. The chart reveals window replacement as the least cost-effective option, requiring the highest spend per ton of CO2 abated. This is attributed to the relatively lower energy savings from window replacement. In contrast, roof insulation emerges as the most cost-effective option, achieving CO2 reductions at the lowest cost per ton. External wall insulation falls between the two with moderate cost-effectiveness.
Figure 3 provides further insights by examining the residential energy efficiency incentives across different house types. For all housing categories, roof insulation again shows the greatest cost-effectiveness. However, for single-family homes in particular, roof insulation dramatically outperforms the other two measures. This suggests that the existing incentives on roof insulation for single-family homes could be an impactful approach. For multi-family homes and apartment blocks, the relative cost-effectiveness between the measures is more balanced, implying that a broader intervention mix may be suitable.
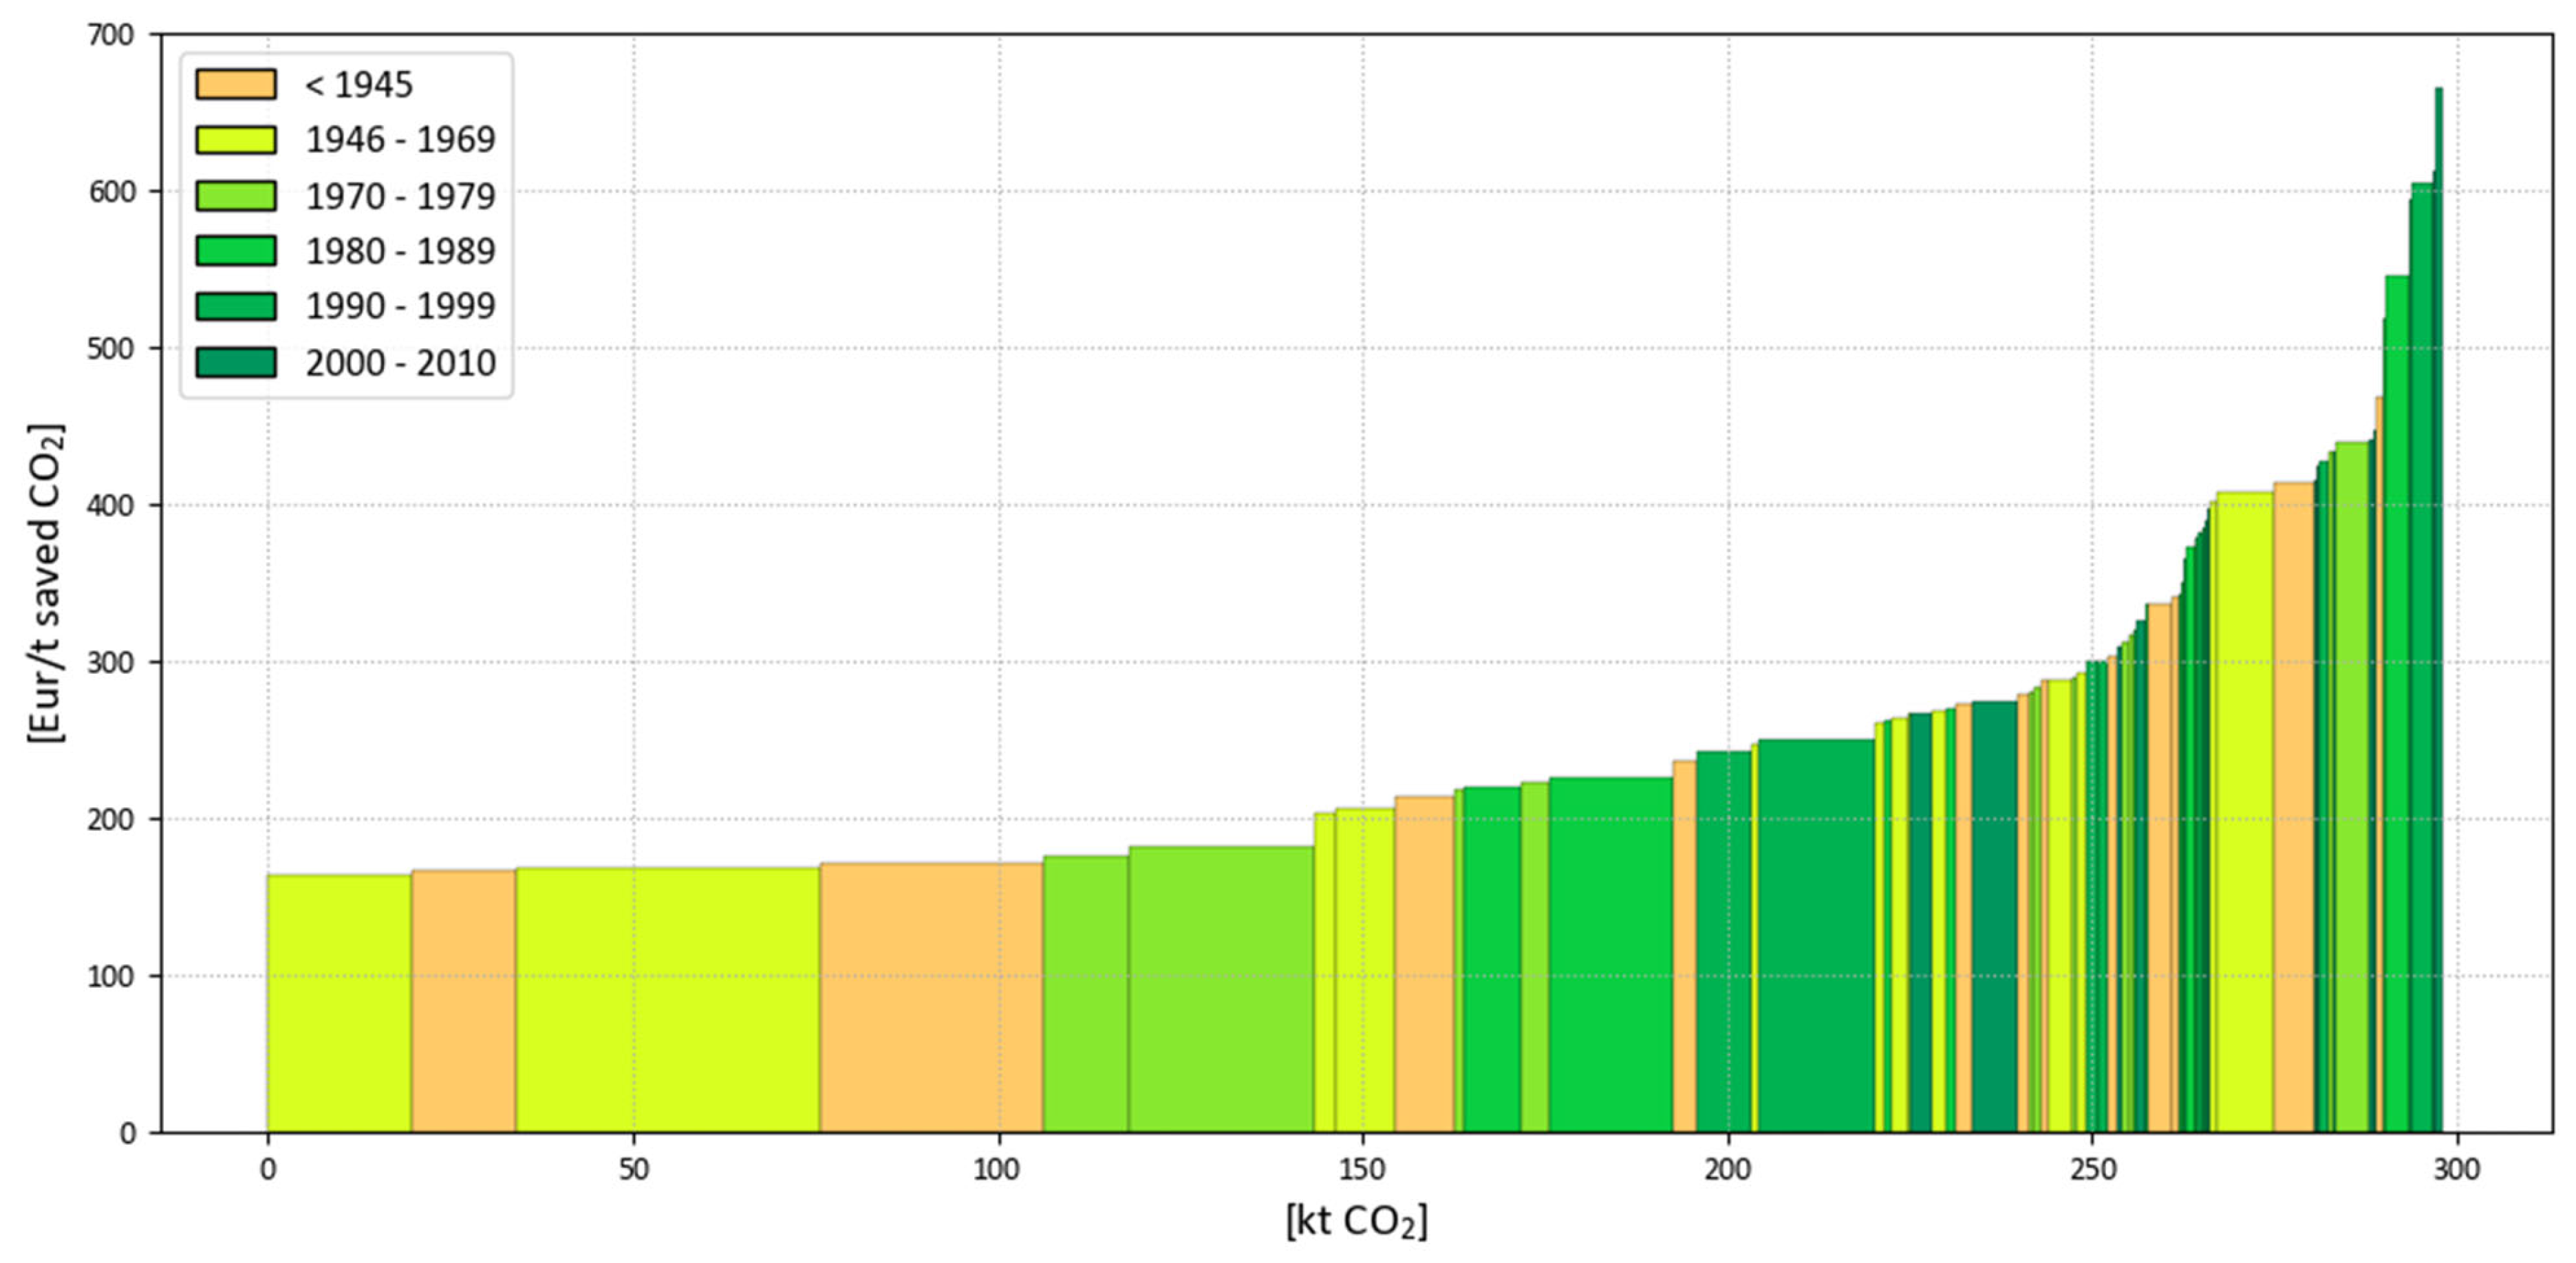
Figure 4 focuses on the influence of the building age on cost-effectiveness. The lowest values of the cost per t of saved CO2 are given by the incentives on roof insulation for buildings constructed before 1980. This indicates that well-targeted policies towards roof insulation for older single-family homes could be especially high-impact.
4.2. Results for Mobility
Figure 5 presents the MAC curve comparing the mobility incentives for electric vehicle adoption with two scenarios: (1) switching from petrol to full electric vehicle and (2) switching from petrol to plug-in hybrid. The chart illustrates full electric vehicles as substantially more cost-effective, achieving higher CO2 reductions per euro spent on incentives. This large cost-effectiveness gap arises from the higher efficiency of full electric vehicles compared to plug-in hybrids.
However, the emission reduction potential is significantly higher for full electric vehicle adoption. This is attributed to the assumption that most consumers would opt for a full electric vehicle if purchasing a new vehicle.
4.3. Results for the Replacement of Diesel and Gas Boilers in Apartment Blocks
Figure 6 displays the MAC curve comparing the incentives for replacing gas or diesel boilers in apartment blocks. Four replacement options are assessed: district heating, heat pump, hybrid system, and biomass boiler. The chart reveals a connection to district heating as the most cost-effective option, achieving the greatest CO2 reductions per euro of the incentive. The transition from a diesel boiler to district heating is especially cost-effective. This highlights the substantial benefits of incentivizing district heating connections where viable. However, district heating has lower overall emission reduction potential than heat pumps or biomass. This stems from the limited accessibility of district heating networks currently.
Heat pump adoption demonstrates both moderately high cost-effectiveness and potential, indicating that it could be an impactful technology target if district heating access is restricted. Hybrid systems show slightly lower cost-effectiveness than heat pumps, while biomass performs well on potential but is less cost-effective. These results emphasize the value of prioritizing district heating incentives where infrastructure allows. Beyond that, heat pumps present a balanced option between cost-effectiveness and potential. Hybrid systems and biomass may play more niche roles depending on the circumstances. The analysis underscores the importance of mapping local district heating accessibility to optimize cost-effective boiler replacement incentives. It also suggests that heat pumps warrant a high policy focus after the district heating potential is fulfilled, to maximize CO2 impact.
4.4. Overall Results
Figure 7 combines the individual MAC curves into one aggregated curve comparing all the assessed residential energy efficiency, mobility, and boiler replacement incentives. The consolidated curve illustrates the boiler replacement incentives as the most cost-effective, achieving maximum CO2 reductions per euro spent. However, these have a relatively low total emission reduction potential. This is mainly due to the assumptions set in the study. In fact, the incentives regarding boiler replacement are limited to apartment blocks which are not in district heating areas. In contrast, the mobility incentives enabling electric vehicle adoption demonstrate the highest potential for overall CO2 savings. But they are less cost-effective than the boiler measures, with higher costs per tonne abated.
The residential energy efficiency incentives, especially roof insulation, fall between boilers and mobility in cost-effectiveness. Certain measures like roof insulation for older single-family homes approach the cost-effectiveness of boiler replacement. The energy efficiency incentives also have a moderate total potential for CO2 reductions.
5. Discussion
The results of this study offer crucial insights into the cost-effectiveness and potential of various incentives of energy transition measures. Utilizing the MAC curve as an analytical tool, the study presents a comprehensive comparison of incentives in three primary categories: residential energy efficiency, mobility, and boiler replacement. The MAC curve analysis in this case study provides new insights beyond the existing literature on incentivizing energy transition. Previous studies of a quantitative comparison of energy policies have relied largely on indicator-based assessments focused on environmental, economic, social, and institutional metrics [9,10,13]. While helpful, such multi-criteria frameworks do not directly compare the cost-effectiveness of incentives targeting different sectors. The MAC analysis fills this gap by enabling a direct comparison of the abatement costs and potentials across key incentives for buildings, transport, and heating.
Focusing on the results of the analysis for South Tyrol, the MAC curve analysis indicated that boiler replacement incentives are the most cost-effective for generating CO2 emission reductions, albeit with the lowest emission reduction potential. In fact, the buildings to which these incentives can be applied are very limited as the incentives are limited to apartment blocks that are not in district heating areas. These measures are followed by specific residential energy efficiency incentives, particularly those associated with the insulating roofs and external walls of single-family houses built before 1980. It is noteworthy that the cost-effectiveness of residential energy efficiency measures in apartment buildings or multi-family houses is only marginally inferior (about 20%) to the mobility sector measures. In contrast, mobility incentives, particularly those promoting a shift from petrol or diesel-powered vehicles to full electric ones, demonstrated the highest potential for CO2 emission reduction as the majority of vehicles in the province are based on internal combustion engines and the share of full electric vehicles is still very low. It should be noted that this result is significantly influenced by the assumption that a large majority (80%) of people replacing their petrol or diesel car would opt for a full electric vehicle, with a smaller fraction (20%) choosing a plug-in hybrid. This assumption may be subject to change based on evolving consumer preferences and technological advancements in the automotive industry.
The analysis also underscores key uncertainties and areas for further research. The assumptions required for the MAC methodology, although based on current data, introduce simplifications. Sensitivity analysis on parameters like vehicle lifetimes, adoption rates, and annual mileages could strengthen the robustness of findings. Furthermore, coupling the analysis with energy system modeling realizing a model-based MAC curve could enrich insights, as could catching interactions and synergies between sectors [28,30,31,32,33].
These results underline the importance of a balanced and multi-faceted approach to energy transition. A mix of interventions targeting different sectors and aspects of energy use is necessary to achieve the best results. The insights from this study can be used to refine existing policies and to prioritize incentives based on their cost-effectiveness and emission reduction potential. Ultimately, a systematic and evidence-based approach to energy transition policy, as exemplified by this study, is crucial in our global pursuit of a sustainable and carbon-neutral future.
6. Conclusions
This research presented a comparative techno-economic analysis of the incentives for energy transition in South Tyrol, Italy, using marginal abatement cost (MAC) curves. The expert-based MAC approach provided vital insights on the cost-effectiveness and emission reduction potentials of distinct incentives targeting the building, transport, and heating sectors.
The analysis revealed that boiler replacement incentives achieved the greatest CO2 reductions per euro spent, making them the most cost-effective. However, their overall emission reduction potential was limited as the incentive is limited to apartment blocks that are not in district heating areas. These are followed by measures for the insulation of the roofs and external walls of single-family houses built before 1980. Next come the measures for the insulation of the roofs and external walls of apartment buildings built before 1980. Immediately afterwards are mobility incentives for a transition from a petrol- or diesel-powered vehicle to a full electric one. The other interventions for residential energy efficiency, mainly those related to the insulation of roofs and external walls in apartment blocks or large and small multi-family houses, only differ by about 20% in terms of cost-effectiveness in reducing CO2 emissions compared to those in the mobility sector. The remaining interventions experience a significant increase in the cost per tonne of CO2 saved. A mix of interventions, including the transition to plug-in hybrids and the replacement of windows in single-family houses built mainly after 1980, are therefore positioned at the end of Figure 7.
Mobility incentives have a higher potential reduction of CO2, especially those involving a change to a full electric vehicle. However, this result is strongly influenced by the assumption that 80 per cent of people who want to replace their petrol or diesel car would opt for a full electric car, while only 20 per cent would buy a plug-in hybrid vehicle. Immediately afterwards, interventions are placed on single-family houses built before 1980 for the insulation of roofs or external walls. Interventions for the replacement of boilers have the lowest emission abatement potential, being positioned on the left-hand side of Figure 7.
This analysis initially aimed to identify the incentives for energy transition available to a citizen in South Tyrol and then to evaluate and compare them both in terms of their cost and potential to abate CO2 emissions. Specifically, three categories of incentives were analyzed, namely residential energy efficiency, mobility, and boiler replacement. Particular emphasis was placed on the use of the MAC curve in the evaluation of incentive policies, as this graph displays on the y-axis the cost-effectiveness given in €/t saved CO2, and, on the x-axis, the potential abatement of emissions given in kt CO2. While marginal abatement cost curves have been used extensively to compare decarbonization measures, this study provides a novel application of the MAC approach focused on incentivizing energy transition technologies by evaluating and comparing the cost-effectiveness of distinct incentives targeting buildings, transport, and heating. It is hoped that this study and method will result in a systematic tool functional to policy-makers to evaluate energy policies.
Looking forward, integrating macro-economic considerations into the analysis and exploring uncertainties could enrich the insights. As clean energy transitions accelerate worldwide, rigorous policy assessments will remain crucial to steer our rapid decarbonization efforts and build equitable, sustainable energy systems. Given the findings that boiler replacement has emerged as the most cost-effective measure, policy-makers may want to evaluate the benefits of expanding the eligibility for these incentives beyond apartment blocks to also include other categories of buildings.
Author Contributions
Conceptualization, M.G.P. and W.S.; methodology, M.G.P. and W.S.; software, M.G.P.; formal analysis, S.B. and M.G.P.; resources, S.B., M.G.P., M.C. and W.S.; data curation, M.C., S.B. and M.G.P.; writing—original draft preparation, S.B. and M.G.P.; writing—review and editing, M.G.P., S.B. and W.S.; visualization, S.B. and M.G.P.; supervision, W.S.; project administration, W.S.; funding acquisition, W.S. All authors have read and agreed to the published version of the manuscript.
Funding
This study was co-founded by the PNRR research activities of the consortium iNEST (Interconnected North-Est Innovation Ecosystem) funded by the European Union Next-GenerationEU (Piano Nazionale di Ripresa e Resilienza (PNRR)—Missione 4 Componente 2, Investimento 1.5—D.D. 1058 23/06/2022, ECS_00000043). This manuscript reflects only the authors’ views and opinions; neither the European Union nor the European Commission can be considered responsible for them.
Data Availability Statement
Publicly available datasets were analyzed in this study. These data can be found here: https://www.eurac.edu/it/magazine/scenari-per-l-alto-adige-verso-la-neutralita-climatica (accessed on 11 September 2023), https://opv.aci.it/WEBDMCircolante/ (accessed on 11 September 2023).
Acknowledgments
The authors wish to acknowledge the use of Eurac Research internal funding of the MEM group, Institute for renewable energy, and the fruitful collaboration and exchanges with the Province of Bolzano, Ufficio Energia e tutela del clima, which contributed valuably to this research.
Conflicts of Interest
The authors declare no conflict of interest.
Appendix A
This appendix provides details on the assumptions and data sources used to characterize the incentives in each of the three categories analyzed in this study: residential energy efficiency, mobility, and boiler replacement. The appendix is structured as follows: (A.1) Appendix A.1 Residential Energy Efficiency. It provides assumptions on the housing types, age, heated surface area, and energy consumption used to model the residential building incentives. (A.2.) Appendix A.2 Mobility. It outlines assumptions on the annual vehicle kilometers, lifetimes, energy use, and emissions factors used for the mobility incentives. (A.3) Appendix A.3 Boiler Replacement. It presents assumptions about the potential boiler replacement systems, access to district heating, and emissions factors used for the boiler incentives.
Appendix A.1. Residential Energy Efficiency
This section provides details on the assumptions and sources for each considered incentive of the residential energy efficiency sector: insulation of roofs, attic floors, and terraces, insulation of external walls, first floors, and arcades, and incentives for the replacement of windows and balcony doors. A further necessary remark to be made is that this research always considers buildings heated with a natural gas boiler and built with a building permit issued before 2005 [39]. First measure the insulation of roofs, attic floors, and terraces, as characterized in Table A1.

Table A1.
Incentive for the insulation of roofs, attic floors, and terraces.
| Unit | Reference | Single-Family House | Small Multi-Family House | Large Multi-Family House | Apartment Blocks | |
| Roof area | [6] | 70.84 | 145.8 | 368.16 | 330.75 | |
| Intervention costs | €/ | [35] | 175 | 175 | 175 | 175 |
| Total costs | € | 12,397.00 | 25,515.00 | 64,428.00 | 57,881.25 | |
| Contribution | % | [34] | 45 | 70 | 70 | 70 |
| Amount of the contribution | € | 8677.90 | 17,860.50 | 45,099.60 | 40,516.88 | |
| Energy saving | % | [35] | 20.77 | 15.43 | 15.43 | 10.08 |
| Emission factor natural gas | t/MWh | [43,44] | 0.202 | 0.202 | 0.202 | 0.202 |
| Lifetime | years | [35] | 30 | 30 | 30 | 30 |
The total cost has been calculated by multiplying the intervention cost €/m2 by the roof area of the building. The amount of the contribution was obtained by multiplying the total cost by the percentage of the provincial contribution. The percentage of the contribution varies according to the type of housing unit. It corresponds to 70 per cent in the case of small and large multi-family houses and apartment blocks, because all three fall under the definition of apartment blocks according to the Province of Bozen/Bolzano. In regard to the single-family house the percentage is 45, because based on the calculations made, the energy saving achieved thanks to the intervention is not sufficient to achieve a ClimateHouse B certification; in this case, the contribution would instead rise to 60% [39].
Below are the characteristics and sources related to the incentives for the insulation of external walls, first floors, and arcades (Table A2) and the replacement of windows and balcony doors (Table A3). The total cost and amount of the contribution have been calculated in the same way as for the incentives for the insulation of roofs, attic floors, and terraces.
Table A2.
Incentive for the insulation of external walls, first floors, and arcades.
| Unit | Reference | Single-Family House | Small Multi-Family House | Large Multi-Family House | Apartment Blocks | |
| Facade area | [6] | 181.72 | 453.6 | 905.06 | 1367.1 | |
| Intervention costs | €/ | [35] | 150 | 150 | 150 | 150 |
| Total costs | € | 27,258.00 | 68,040.00 | 135,759.00 | 205,065.25 | |
| Contribution | % | [34] | 45 | 70 | 70 | 70 |
| Amount of the contribution | € | 19,080.60 | 47,628.00 | 95,031.30 | 143,545.50 | |
| Energy saving | % | [35] | 44.34 | 41.76 | 41.76 | 46.49 |
| Emission factor natural gas | t/MWh | [43,44] | 0.202 | 0.202 | 0.202 | 0.202 |
| Lifetime | years | [35] | 30 | 30 | 30 | 30 |
The same principle applies to the incentive for the insulation of external walls, first floors, and arcades for determining the percentage of the contribution (see Table A3).
Table A3.
Incentive for the replacement of windows and balcony doors.
| Unit | Reference | Single-Family House | Small Multi-Family House | Large Multi-Family House | Apartment Blocks | |
| Windowed area | [6] | 18.48 | 70.2 | 122.72 | 176.4 | |
| Intervention costs | €/ | [35] | 650 | 650 | 650 | 650 |
| Total costs | € | 12,012.00 | 45,630.00 | 79,768.00 | 114,660.00 | |
| Contribution | % | [34] | 45 | 45 | 45 | 45 |
| Amount of the contribution | € | 5405.40 | 20,533.50 | 35,895.60 | 51,597.00 | |
| Energy saving | % | [35] | 8.08 | 12.94 | 12.94 | 13.12 |
| Emission factor natural gas | t/MWh | [43,44] | 0.202 | 0.202 | 0.202 | 0.202 |
| Lifetime | years | [35] | 30 | 30 | 30 | 30 |
With respect to the replacement of windows, the percentage of the contribution is not increased for apartment blocks, but is equal to 45%, because the ClimateHouse B certification is not achieved as a result of the intervention [39].
Appendix A.2. Mobility
This section provides details on the assumptions and sources for each considered incentive of the mobility sector: switch from petrol to full electric car, switch from petrol to plug-in hybrid car, switch from diesel to full electric car, switch from diesel to plug-in hybrid car. Table A4 reports the characteristics and sources related to the incentives in the mobility sector.
Table A4.
Incentives for mobility.
| Unit | Reference | Full Electric | Plug-In Hybrid | Petrol | Diesel | |
| Annual km per car | km | [6] | 11,200 | 11,200 | 11,200 | 11,200 |
| Lifetime | years | 10 | 10 | 10 | 10 | |
| kWh/100 km | kWh/100 km | [6] | 13.61 | 32 | 52.78 | 46.11 |
| Emission factor | t/MWh | [37] | 0 | 0.25 | 0.25 | 0.27 |
| Contribution for vehicle acquisition | € | [36] | 2304.71 | 1304.71 | - | - |
| Contribution for charging systems | € | [36] | 1000.00 | 1000.00 | - | - |
| Amount of the contribution | € | 3304.71 | 2304.71 | - | - |
Appendix A.3. Replacement of Diesel and Gas Boilers in Apartment Blocks
This section provides details on the assumptions and sources for each considered incentive of the mobility sector: switch from gas boiler to connection to a district heating network, switch from diesel boiler to connection to a district heating network, switch from gas boiler to the installation of a heat pump, switch from diesel boiler to the installation of a heat pump, switch from gas boiler to the installation of a hybrid heating system, switch from diesel boiler to the installation of a hybrid heating system, and switch from gas boiler to the installation of a biomass heating system. Table A5, Table A6, Table A7, Table A8, Table A9, Table A10 and Table A11 report the characteristics and sources related to the incentives in the replacement of diesel and gas boilers sector.
Table A5.
Gas boiler—Connection to a district heating network.
| Unit | Reference | Small Multi-Family House | Large Multi-Family House | Apartment Blocks | |
| Heated surface area | [6] | 540 | 1535 | 2205 | |
| Total intervention cost | € | 10,067.00 | 11,111.75 | 11,815.25 | |
| Contribution | % | [34] | 30 | 30 | 30 |
| Amount of the contribution | € | 3020.10 | 3333.53 | 3544.58 | |
| Apartment blocks that can access district heating | % | [6] | 20.30 | 20.30 | 20.30 |
| Apartment blocks with gas boilers | % | 55.70 | 55.70 | 55.70 | |
| Emission factor natural gas | t/MWh_th | [43,44] | 0.202 | 0.202 | 0.202 |
| Emission factor district heating | t/MWh_th | [43,44] | 0.051 | 0.051 | 0.051 |
| Lifetime | years | [6] | 30 | 30 | 30 |
With regard to the connection to a district heating network, it is worth noting that the province also incentivizes companies that install the district heating network; therefore, the cost incurred by the province to incentivize the use of district heating is certainly higher than the amount of the contribution itself [26].
Table A6.
Diesel boiler—Connection to a district heating network.
| Unit | Reference | Small Multi-Family House | Large Multi-Family House | Apartment Blocks | |
| Heated surface area | [6] | 540 | 1535 | 2205 | |
| Total intervention cost | € | 10,067.00 | 11,111.75 | 11,815.25 | |
| Contribution | % | [34] | 30 | 30 | 30 |
| Amount of the contribution | € | 3020.10 | 3333.53 | 3544.58 | |
| Apartment blocks that can access district heating | % | [6] | 20.30 | 20.30 | 20.30 |
| Apartment blocks with diesel boilers | % | [6] | 10.07 | 10.07 | 10.07 |
| Emission factor diesel | t/MWh_th | [43,44] | 0.267 | 0.267 | 0.267 |
| Emission factor district heating | t/MWh_th | [43,44] | 0.051 | 0.051 | 0.051 |
| Lifetime | years | [6] | 30 | 30 | 30 |
Table A7.
Gas boiler—Installation of a heat pump.
| Unit | Reference | Small Multi-Family House | Large Multi-Family House | Apartment Blocks | |
| Heated surface area | [6] | 540 | 1535 | 2205 | |
| Total intervention cost | € | 51,030.00 | 145,057.50 | 208,372.50 | |
| Contribution | % | [34] | 30 | 30 | 30 |
| Amount of the contribution | € | 15,309.00 | 43,517.25 | 62,511.75 | |
| Apartment blocks that cannot access district heating | % | [6] | 26.57 | 26.57 | 26.57 |
| Apartment blocks with gas boilers | % | [6] | 55.70 | 55.70 | 55.70 |
| Emission factor natural gas | t/MWh_th | [43,44] | 0.202 | 0.202 | 0.202 |
| Emission factor heat pump | t/MWh_el | [43,44] | 0.030 | 0.030 | 0.030 |
| COP | [6] | 3 | 3 | 3 | |
| Lifetime | years | [6] | 20 | 20 | 20 |
Table A8.
Diesel boiler—Installation of a heat pump.
| Unit | Reference | Small Multi-Family House | Large Multi-Family House | Apartment Blocks | |
| Heated surface area | [6] | 540 | 1535 | 2205 | |
| Total intervention cost | € | 51,030.00 | 145,057.50 | 208,372.50 | |
| Contribution | % | [34] | 30 | 30 | 30 |
| Amount of the contribution | € | 15,309.00 | 43,517.25 | 62,511.75 | |
| Apartment blocks that cannot access district heating | % | [6] | 26.57 | 26.57 | 26.57 |
| Apartment blocks with diesel boilers | % | [6] | 10.07 | 10.07 | 10.07 |
| Emission factor diesel | t/MWh_th | [43,44] | 0.267 | 0.267 | 0.267 |
| Emission factor heat pump | t/MWh_el | [43,44] | 0.030 | 0.030 | 0.030 |
| COP | [6] | 3 | 3 | 3 | |
| Lifetime | years | [6] | 20 | 20 | 20 |
Table A9.
Gas boiler—Installation of a hybrid heating system.
| Unit | Reference | Small Multi-Family House | Large Multi-Family House | Apartment Blocks | |
| Heated surface area | [6] | 540 | 1535 | 2205 | |
| Use of heat pump | % | [6] | 90 | 90 | 90 |
| Use of gas boiler | % | [6] | 10 | 10 | 10 |
| Total intervention cost | € | 29,862.00 | 84,885.50 | 121,936.50 | |
| Contribution | % | [34] | 30 | 30 | 30 |
| Amount of the contribution | € | 8958.60 | 25,465.65 | 36,580.95 | |
| Apartment blocks that cannot access district heating | % | [6] | 26.57 | 26.57 | 26.57 |
| Apartment blocks with gas boilers | % | [6] | 55.7 | 55.7 | 55.7 |
| Emission factor natural gas | t/MWh_th | [43,44] | 0.202 | 0.202 | 0.202 |
| Emission factor heat pump | t/MWh_el | [43,44] | 0.030 | 0.030 | 0.030 |
| COP | [6] | 3 | 3 | 3 | |
| Lifetime | years | [6] | 20 | 20 | 20 |
Table A10.
Diesel boiler—Installation of a hybrid heating system.
| Unit | Reference | Small Multi-Family House | Large Multi-Family House | Apartment Blocks | |
| Heated surface area | [6] | 540 | 1535 | 2205 | |
| Use of heat pump | % | [6] | 90 | 90 | 90 |
| Use of gas boiler | % | [6] | 10 | 10 | 10 |
| Total intervention cost | € | 29,862.00 | 84,885.50 | 121,936.50 | |
| Contribution | % | [34] | 30 | 30 | 30 |
| Amount of the contribution | € | 8.958.60 | 25,465.65 | 36,580.95 | |
| Apartment blocks that cannot access district heating | % | [6] | 26.57 | 26.57 | 26.57 |
| Apartment blocks with diesel boilers | % | [6] | 10.07 | 10.07 | 10.07 |
| Emission factor natural gas | t/MWh_th | [43,44] | 0.202 | 0.202 | 0.202 |
| Emission factor heat pump | t/MWh_el | [43,44] | 0.030 | 0.030 | 0.030 |
| Emission factor diesel | t/MWh_th | [43,44] | 0.267 | 0.267 | 0.267 |
| COP | [6] | 3 | 3 | 3 | |
| Lifetime | years | [6] | 20 | 20 | 20 |
Table A11.
Gas boiler—Installation of biomass heating system.
| Unit | Reference | Small Multi-Family House | Large Multi-Family House | Apartment Blocks | |
| Heated surface area | [6] | 540 | 1535 | 2205 | |
| Total intervention cost | € | 32,560 | 46,490 | 55,870 | |
| Contribution | % | [34] | 30 | 30 | 30 |
| Amount of the contribution | € | 9768.00 | 13,947.00 | 16,761.00 | |
| Apartment blocks that cannot access district heating | % | [6] | 26.57 | 26.57 | 26.57 |
| Apartment blocks with diesel boilers | % | [6] | 10.07 | 10.07 | 10.07 |
| Emission factor gas | t/MWh_th | [43,44] | 0.267 | 0.267 | 0.267 |
| Emission factor biomass | t/MWh_th | [43,44] | 0 | 0 | 0 |
| Lifetime | years | [6] | 20 | 20 | 20 |
References
- Islam, M.M.; Hasanuzzaman, M. Introduction to energy and sustainable development. In Energy for Sustainable Development: Demand, Supply, Conversion and Management; Elsevier: Amsterdam, The Netherlands, 2020; pp. 1–18. [Google Scholar] [CrossRef]
- Daszkiewicz, K. Policy and regulation of energy transition. In The Geopolitics of the Global Energy Transition; Lecture Notes in Energy; Springer: Cham, Switzerland, 2020; Volume 73, pp. 203–226. [Google Scholar] [CrossRef]
- Pollitt, M.G. The role of policy in energy transitions: Lessons from the energy liberalisation era. Energy Policy 2012, 50, 128–137. [Google Scholar] [CrossRef]
- The European Green Deal. Available online: https://ec.europa.eu/info/sites/info/files/european-green-deal-communication_en.pdf (accessed on 4 April 2021).
- Klimaplan Südtirol 2040 | Landesagentur für Umwelt und Klimaschutz | Autonome Provinz Bozen—Südtirol. Available online: https://umwelt.provinz.bz.it/klimaplan-energie-suedtirol-2050.asp (accessed on 13 January 2023).
- Scenari per l’Alto Adige verso la Neutralità Climatica. Available online: https://www.eurac.edu/it/magazine/scenari-per-l-alto-adige-verso-la-neutralita-climatica (accessed on 25 November 2022).
- Caloffi, A.; Mariani, M.; Rossi, F.; Russo, M. A comparative evaluation of regional subsidies for collaborative and individual R&D in small and medium-sized enterprises. Res. Policy 2018, 47, 1437–1447. [Google Scholar] [CrossRef]
- Chinetti, S. Investment Subsidies Effectiveness: Evidence from a Regional Program. Ital. Econ. J. 2023, 9, 723–759. [Google Scholar] [CrossRef]
- Ortiz, D.; Leal, V. Energy Policy Concerns, Objectives and Indicators: A Review towards a Framework for Effectiveness Assessment. Energies 2020, 13, 6533. [Google Scholar] [CrossRef]
- Arbolino, R.; Boffardi, R.; Ioppolo, G. The effectiveness of European energy policy on the Italian system: Regional evidences from a hierarchical cluster analysis approach. Energy Policy 2019, 132, 47–61. [Google Scholar] [CrossRef]
- Dietzenbacher, E.; Lenzen, M.; Los, B.; Guan, D.; Lahr, M.L.; Sancho, F.; Suh, S.; Yang, C. Input-Output Analysis: The Next 25 Years. Econ. Syst. Res. 2013, 25, 369–389. [Google Scholar] [CrossRef]
- Chapman, A.J.; McLellan, B.; Tezuka, T. Residential solar PV policy: An analysis of impacts, successes and failures in the Australian case. Renew. Energy 2016, 86, 1265–1279. [Google Scholar] [CrossRef]
- Shrimali, G.; Srinivasan, S.; Goel, S.; Nelson, D. The effectiveness of federal renewable policies in India. Renew. Sustain. Energy Rev. 2017, 70, 538–550. [Google Scholar] [CrossRef]
- Schmid, G. The development of renewable energy power in India: Which policies have been effective? Energy Policy 2012, 45, 317–326. [Google Scholar] [CrossRef]
- Shrimali, G.; Trivedi, S.; Srinivasan, S.; Goel, S.; Nelson, D. Cost-effective policies for reaching India’s 2022 renewable targets. Renew. Energy 2016, 93, 255–268. [Google Scholar] [CrossRef]
- Li, S.J.; Chang, T.H.; Chang, S.L. The policy effectiveness of economic instruments for the photovoltaic and wind power development in the European Union. Renew. Energy 2017, 101, 660–666. [Google Scholar] [CrossRef]
- Hafeznia, H.; Aslani, A.; Anwar, S.; Yousefjamali, M. Analysis of the effectiveness of national renewable energy policies: A case of photovoltaic policies. Renew. Sustain. Energy Rev. 2017, 79, 669–680. [Google Scholar] [CrossRef]
- Nikolaev, A.; Konidari, P. Development and assessment of renewable energy policy scenarios by 2030 for Bulgaria. Renew. Energy 2017, 111, 792–802. [Google Scholar] [CrossRef]
- García-Álvarez, M.T.; Cabeza-García, L.; Soares, I. Assessment of energy policies to promote photovoltaic generation in the European Union. Energy 2018, 151, 864–874. [Google Scholar] [CrossRef]
- Huang, S.K.; Kuo, L.; Chou, K.L. The applicability of marginal abatement cost approach: A comprehensive review. J. Clean. Prod. 2016, 127, 59–71. [Google Scholar] [CrossRef]
- Kesicki, F.; Strachan, N. Marginal abatement cost (MAC) curves: Confronting theory and practice. Environ. Sci. Policy 2011, 14, 1195–1204. [Google Scholar] [CrossRef]
- Kesicki, F. Marginal abatement cost curves for policy making—Expert-based vs. model-derived curves. In Proceedings of the 33rd IAEE International Conference, Rio de Janeiro, Brazil, 6–9 June 2010. [Google Scholar]
- Herbst, A.; Toro, F.; Reitze, F.; Jochem, E. Introduction to Energy Systems Modelling. Statistics 2012, 148, 111–135. [Google Scholar] [CrossRef]
- Zhang, Z.; Folmer, H. Economic modelling approaches to cost estimates for the control of carbon dioxide emissions. Energy Econ. 1998, 20, 101–120. [Google Scholar] [CrossRef]
- Stoft, S.E. Economics of conserved-energy “supply” curves. Energy J. 1995, 16, 109–137. [Google Scholar] [CrossRef]
- Kesicki, F. Marginal Abatement Cost Curves: Combining Energy System Modelling and Decomposition Analysis. Environ. Model. Assess. 2013, 18, 27–37. [Google Scholar] [CrossRef]
- Kesicki, F. Intertemporal issues and marginal abatement costs in the UK transport sector. Transp. Res. Part D Transp. Environ. 2012, 17, 418–426. [Google Scholar] [CrossRef]
- Prina, M.G.; Fornaroli, F.C.; Moser, D.; Manzolini, G.; Sparber, W. Optimisation method to obtain marginal abatement cost-curve through EnergyPLAN software. Smart Energy 2021, 1, 100002. [Google Scholar] [CrossRef]
- Lund, H.; Thellufsen, J.Z.; Østergaard, P.A.; Sorknæs, P.; Skov, I.R.; Mathiesen, B.V. EnergyPLAN—Advanced analysis of smart energy systems. Smart Energy 2021, 1, 100007. [Google Scholar] [CrossRef]
- Groppi, D.; Nastasi, B.; Prina, M.G. The EPLANoptMAC model to plan the decarbonisation of the maritime transport sector of a small island. Energy 2022, 254, 124342. [Google Scholar] [CrossRef]
- Chang, M.; Paardekooper, S.; Prina, M.G.; Thellufsen, J.Z.; Lund, H.; Lapuente, P. Smart energy approaches for carbon abatement: Scenario designs for Chile’s energy transition. Smart Energy 2023, 10, 100098. [Google Scholar] [CrossRef]
- Misconel, S.; Prina, M.G.; Hobbie, H.; Möst, D.; Sparber, W. Model-based step-wise marginal CO2 abatement cost curves to determine least-cost decarbonization pathways for sector-coupled energy systems. J. Clean. Prod. 2022, 368, 133173. [Google Scholar] [CrossRef]
- Misconel, S.; Hobbie, H.; Most, D.; Prina, M.G.; Sparber, W. How to determine bottom-up model-derived marginal CO abatement cost curves with high temporal, sectoral, and techno-economic resolution? In Proceedings of the 2022 18th International Conference on the European Energy Market, Ljubljana, Slovenia, 13–15 September 2022. [CrossRef]
- Contributi Provinciali 2023 per Efficienza Energetica ed Energie Rinnovabili per Privati ed Enti senza Scopo di Lucro. Available online: https://ambiente.provincia.bz.it/pubblicazioni.asp?publ_action=4&publ_article_id=436768 (accessed on 31 July 2023).
- Filippi Oberegger, U.; Pernetti, R.; Lollini, R. Bottom-up building stock retrofit based on levelized cost of saved energy. Energy Build. 2020, 210, 109757. [Google Scholar] [CrossRef]
- Mobilità Elettrica | Mobilità | Provincia Autonoma di Bolzano—Alto Adige. Available online: https://www.provincia.bz.it/turismo-mobilita/mobilita/mobilita-sostenibile/mobilita-elettrica.asp (accessed on 31 July 2023).
- Open Parco Veicoli. Available online: http://www.opv.aci.it/WEBDMCircolante/ (accessed on 16 April 2021).
- Prina, M.G.; Cozzini, M.; Garegnani, G.; Manzolini, G.; Moser, D.; Filippi Oberegger, U.; Pernetti, R.; Vaccaro, R.; Sparber, W. Multi-objective optimization algorithm coupled to EnergyPLAN software: The EPLANopt model. Energy 2018, 149, 213–221. [Google Scholar] [CrossRef]
- Bollettino di Legislazione Tecnica. Deliberaz G.P. Bolzano 28/12/2021, n. 1136. Available online: https://www.legislazionetecnica.it/8231655/normativa-edilizia-appalti-professioni-tecniche-sicurezza-ambiente/deliberaz-gp-bolzano-28-12-2021-n-1136/efficienza-energetica-e-fonti-rinnovabili (accessed on 17 July 2023).
- Lexbrowser—A) Legge Provinciale 7 Luglio 2010, n. 91. Available online: http://lexbrowser.provinz.bz.it/doc/it/lp-2010-9/legge_provinciale_7_luglio_2010_n_9.aspx?view=1 (accessed on 17 July 2023).
- Energy Performance of Buildings Directive. Available online: https://energy.ec.europa.eu/topics/energy-efficiency/energy-efficient-buildings/energy-performance-buildings-directive_en (accessed on 17 July 2023).
- Directive (EU) 2018/2001 of the European Parliament and of the Council of 11 December 2018 on the Promotion of the Use of Energy from Renewable Sources (Recast) (Text with EEA Relevance). Available online: https://WebarchiveNationalarchivesGovUk/Eu-Exit/Https://Eur-LexEuropaEu/Legal-Content/EN/TXT/?Uri=CELEX:02018L2001-20181221 (accessed on 17 July 2023).
- Koffi, B.; Cerutti, A.K.; Duerr, M.; Iancu, A.; Kona, A.; Janssens-Maenhout, G. Covenant of Mayors for Climate and Energy: Default Emission Factors for Local Emission Inventories—Version 2017; Publications Office of the European Union: Luxembourg, 2017. [Google Scholar] [CrossRef]
- Koffi, B.; Cerutti, A.; Duerr, M.; Iancu, A.; Kona, A.; Janssens-Maenhout, G.; European Commission, Joint Research Centre (JRC). CoM Default Emission Factors for the Member States of the European Union—Version 2017. 2017. Available online: http://data.europa.eu/89h/jrc-com-ef-comw-ef-2017 (accessed on 17 July 2023).
Figure 1.
Total consumption of residential buildings.
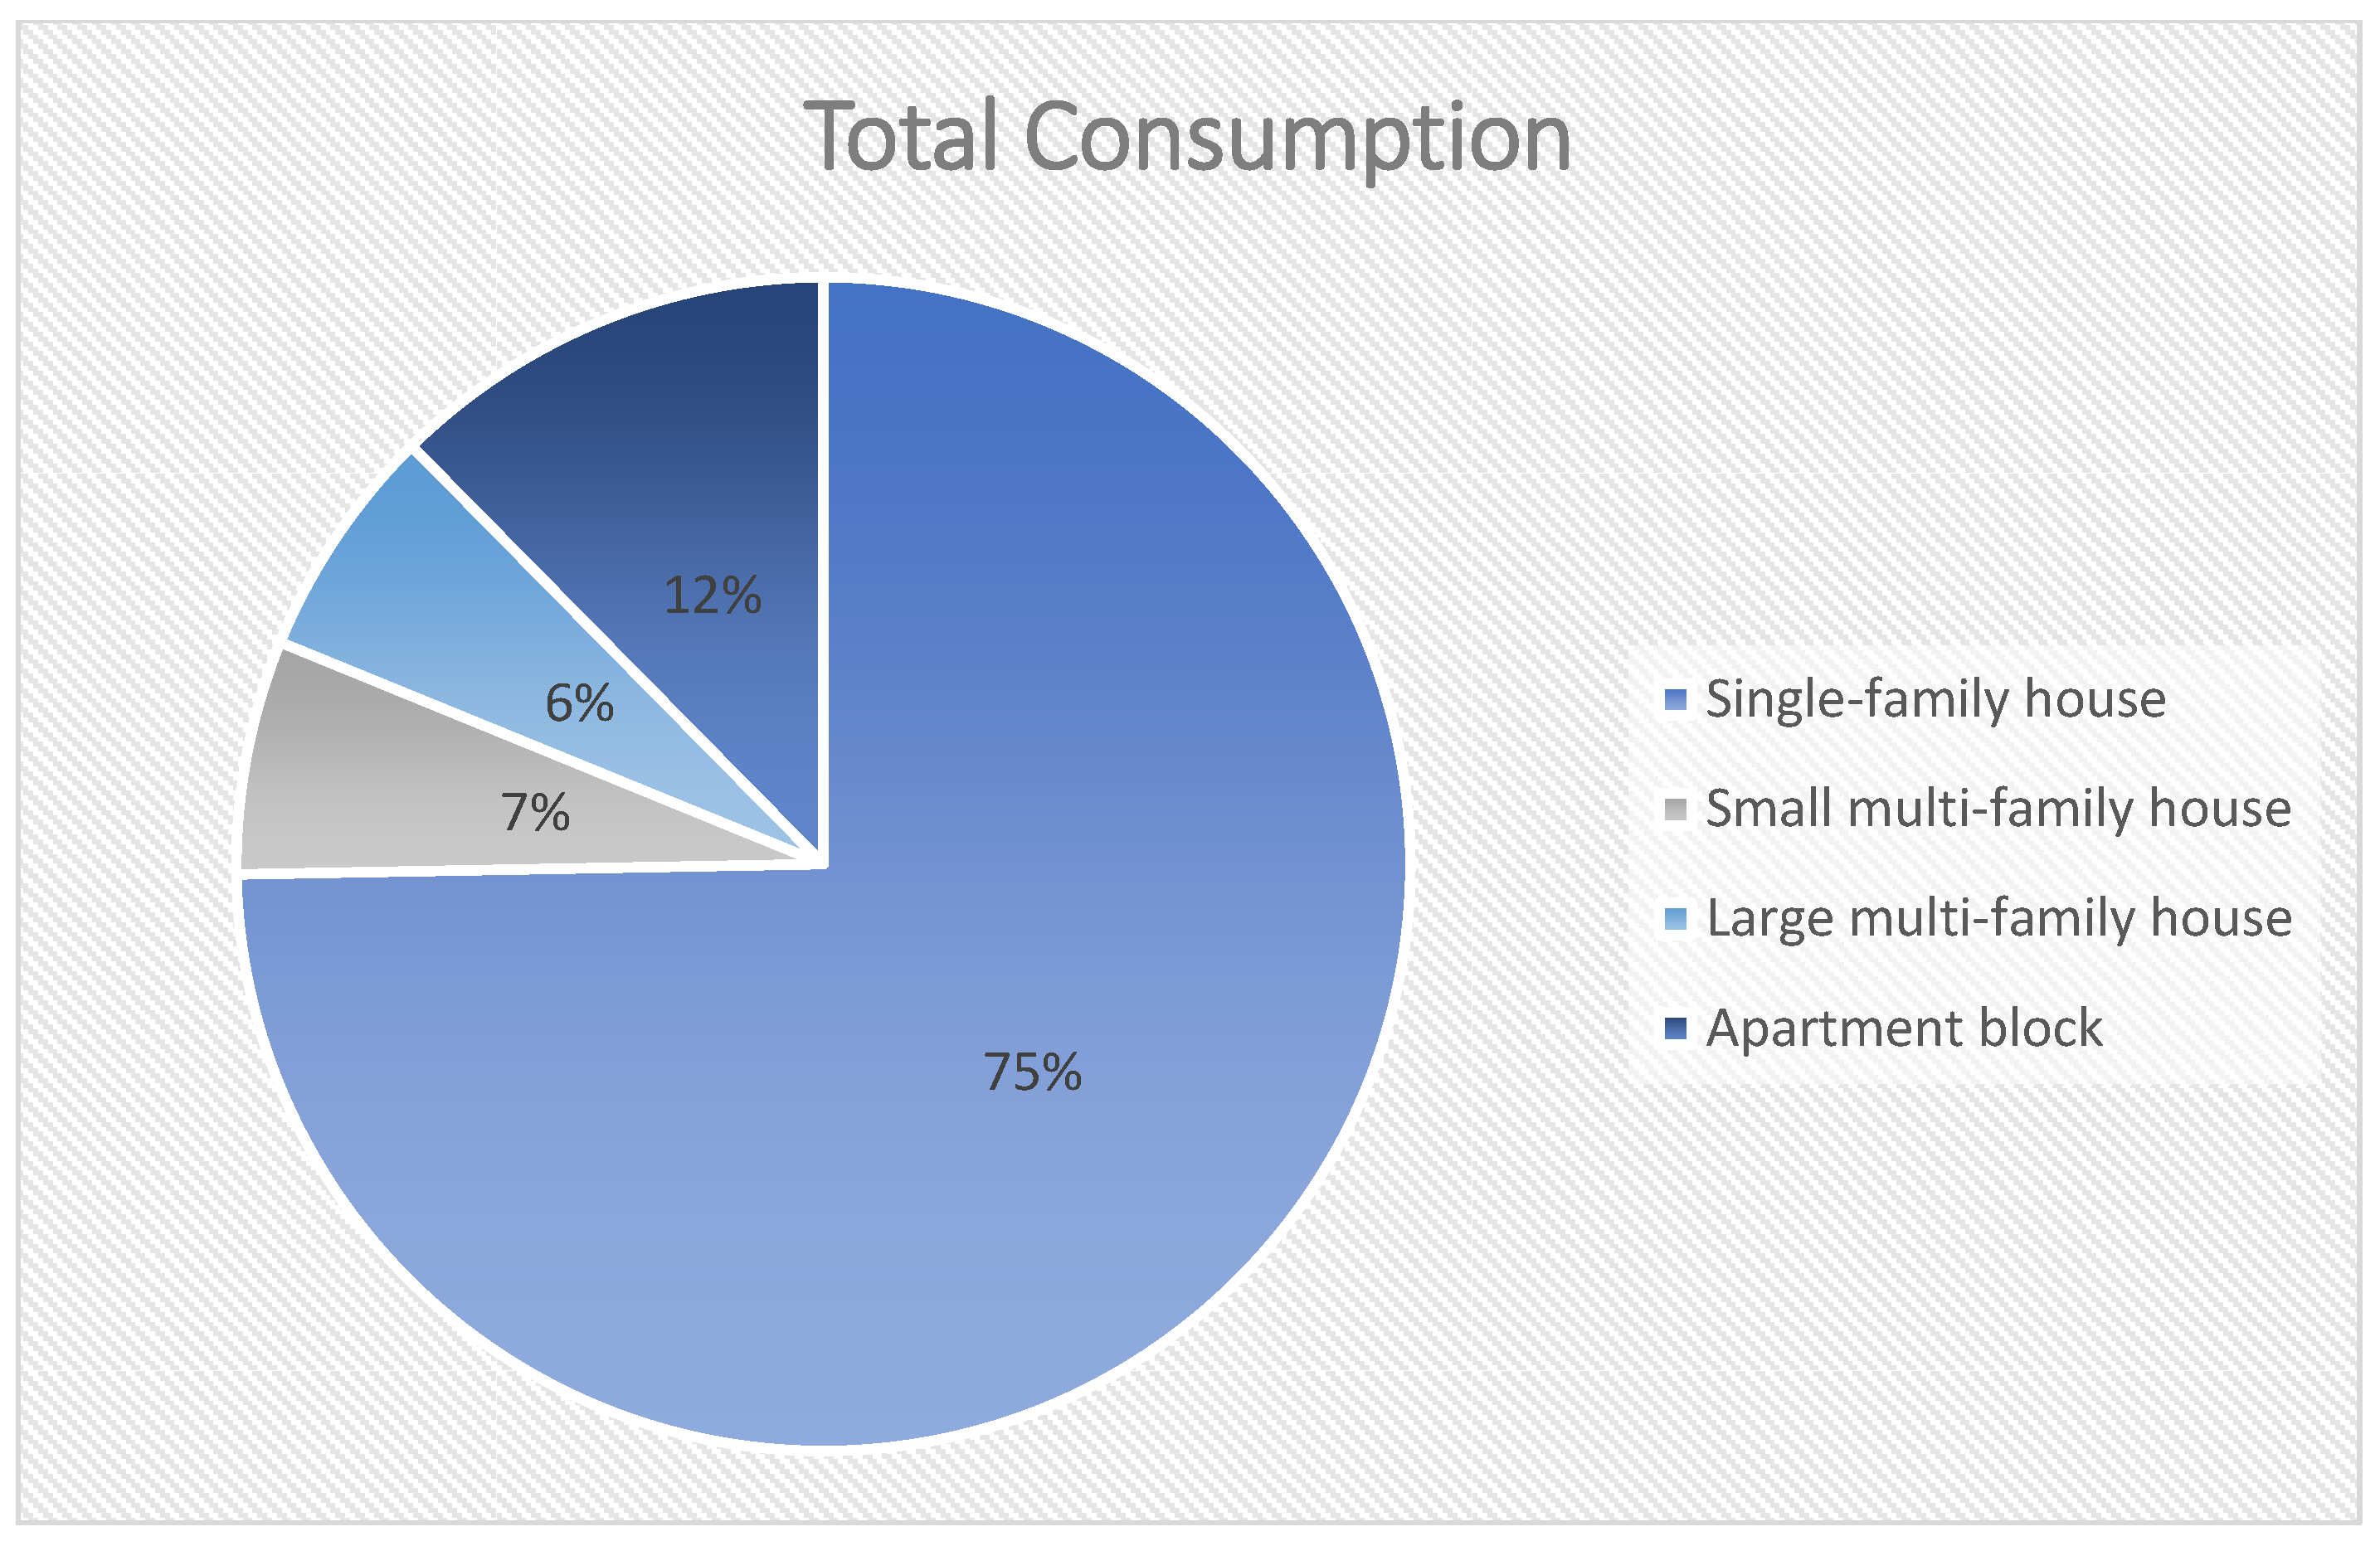
Figure 2.
MAC curve incentives for residential energy efficiency.

Figure 3.
MAC curve incentives for residential energy efficiency—focus on house types.
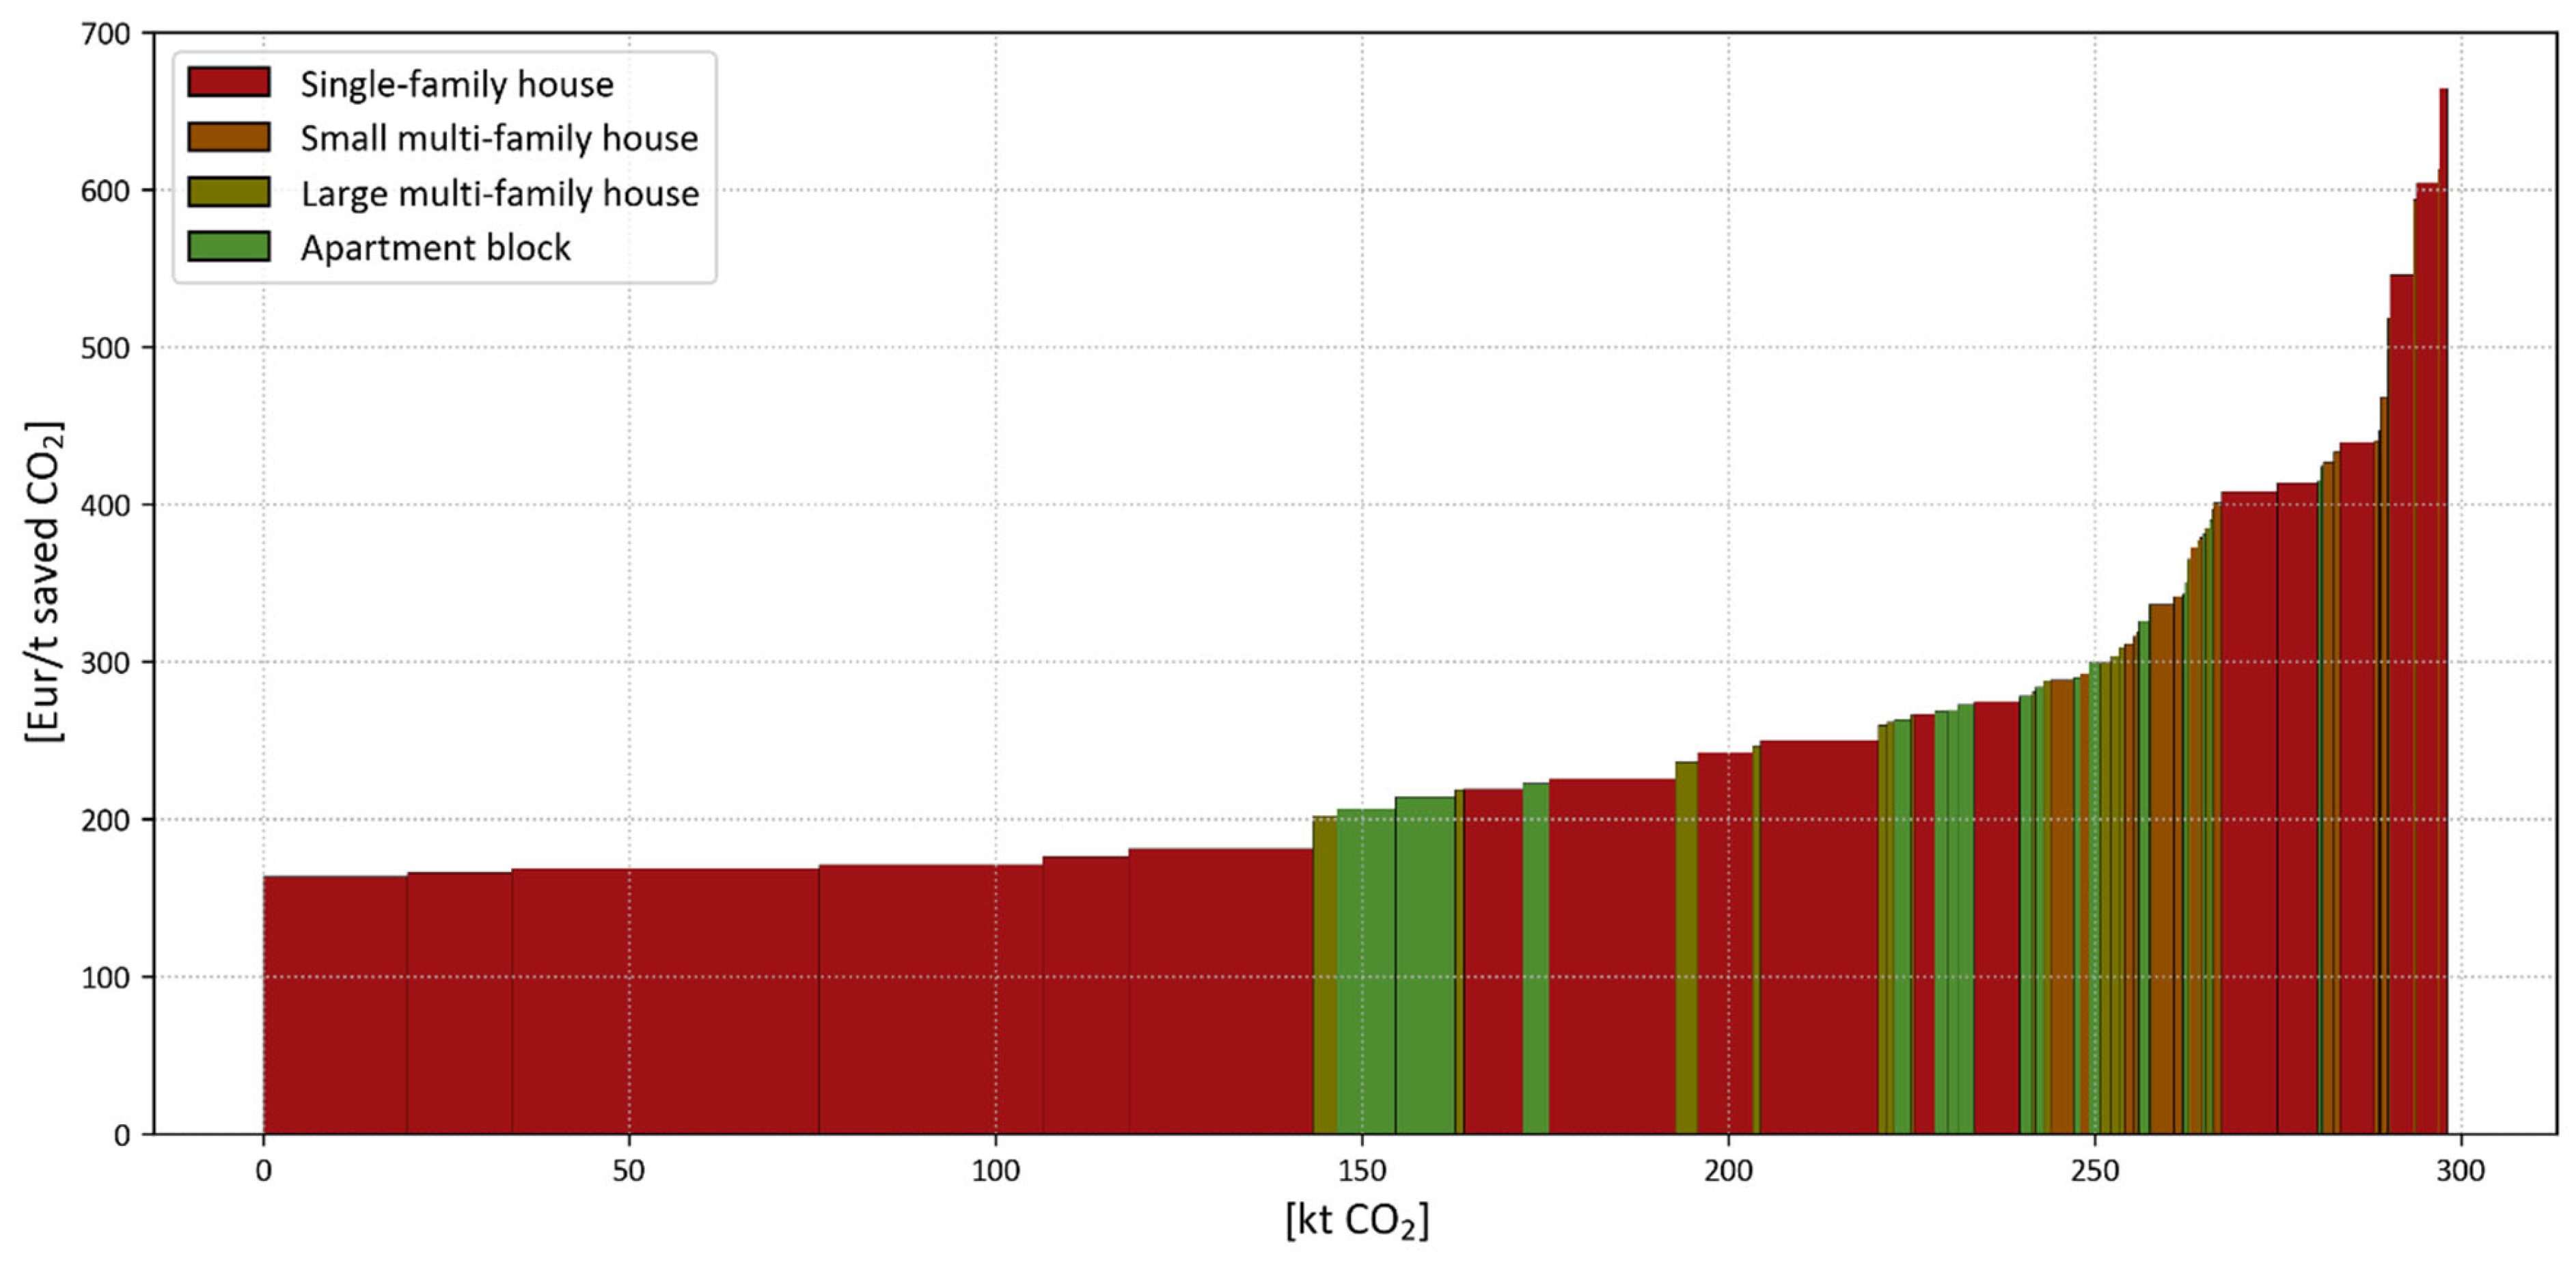
Figure 4.
MAC curve incentives for residential energy efficiency—focus on years of construction.

Figure 5.
MAC curve incentives for mobility.

Figure 6.
MAC curve incentives for the replacement of diesel and gas boilers in apartment blocks.
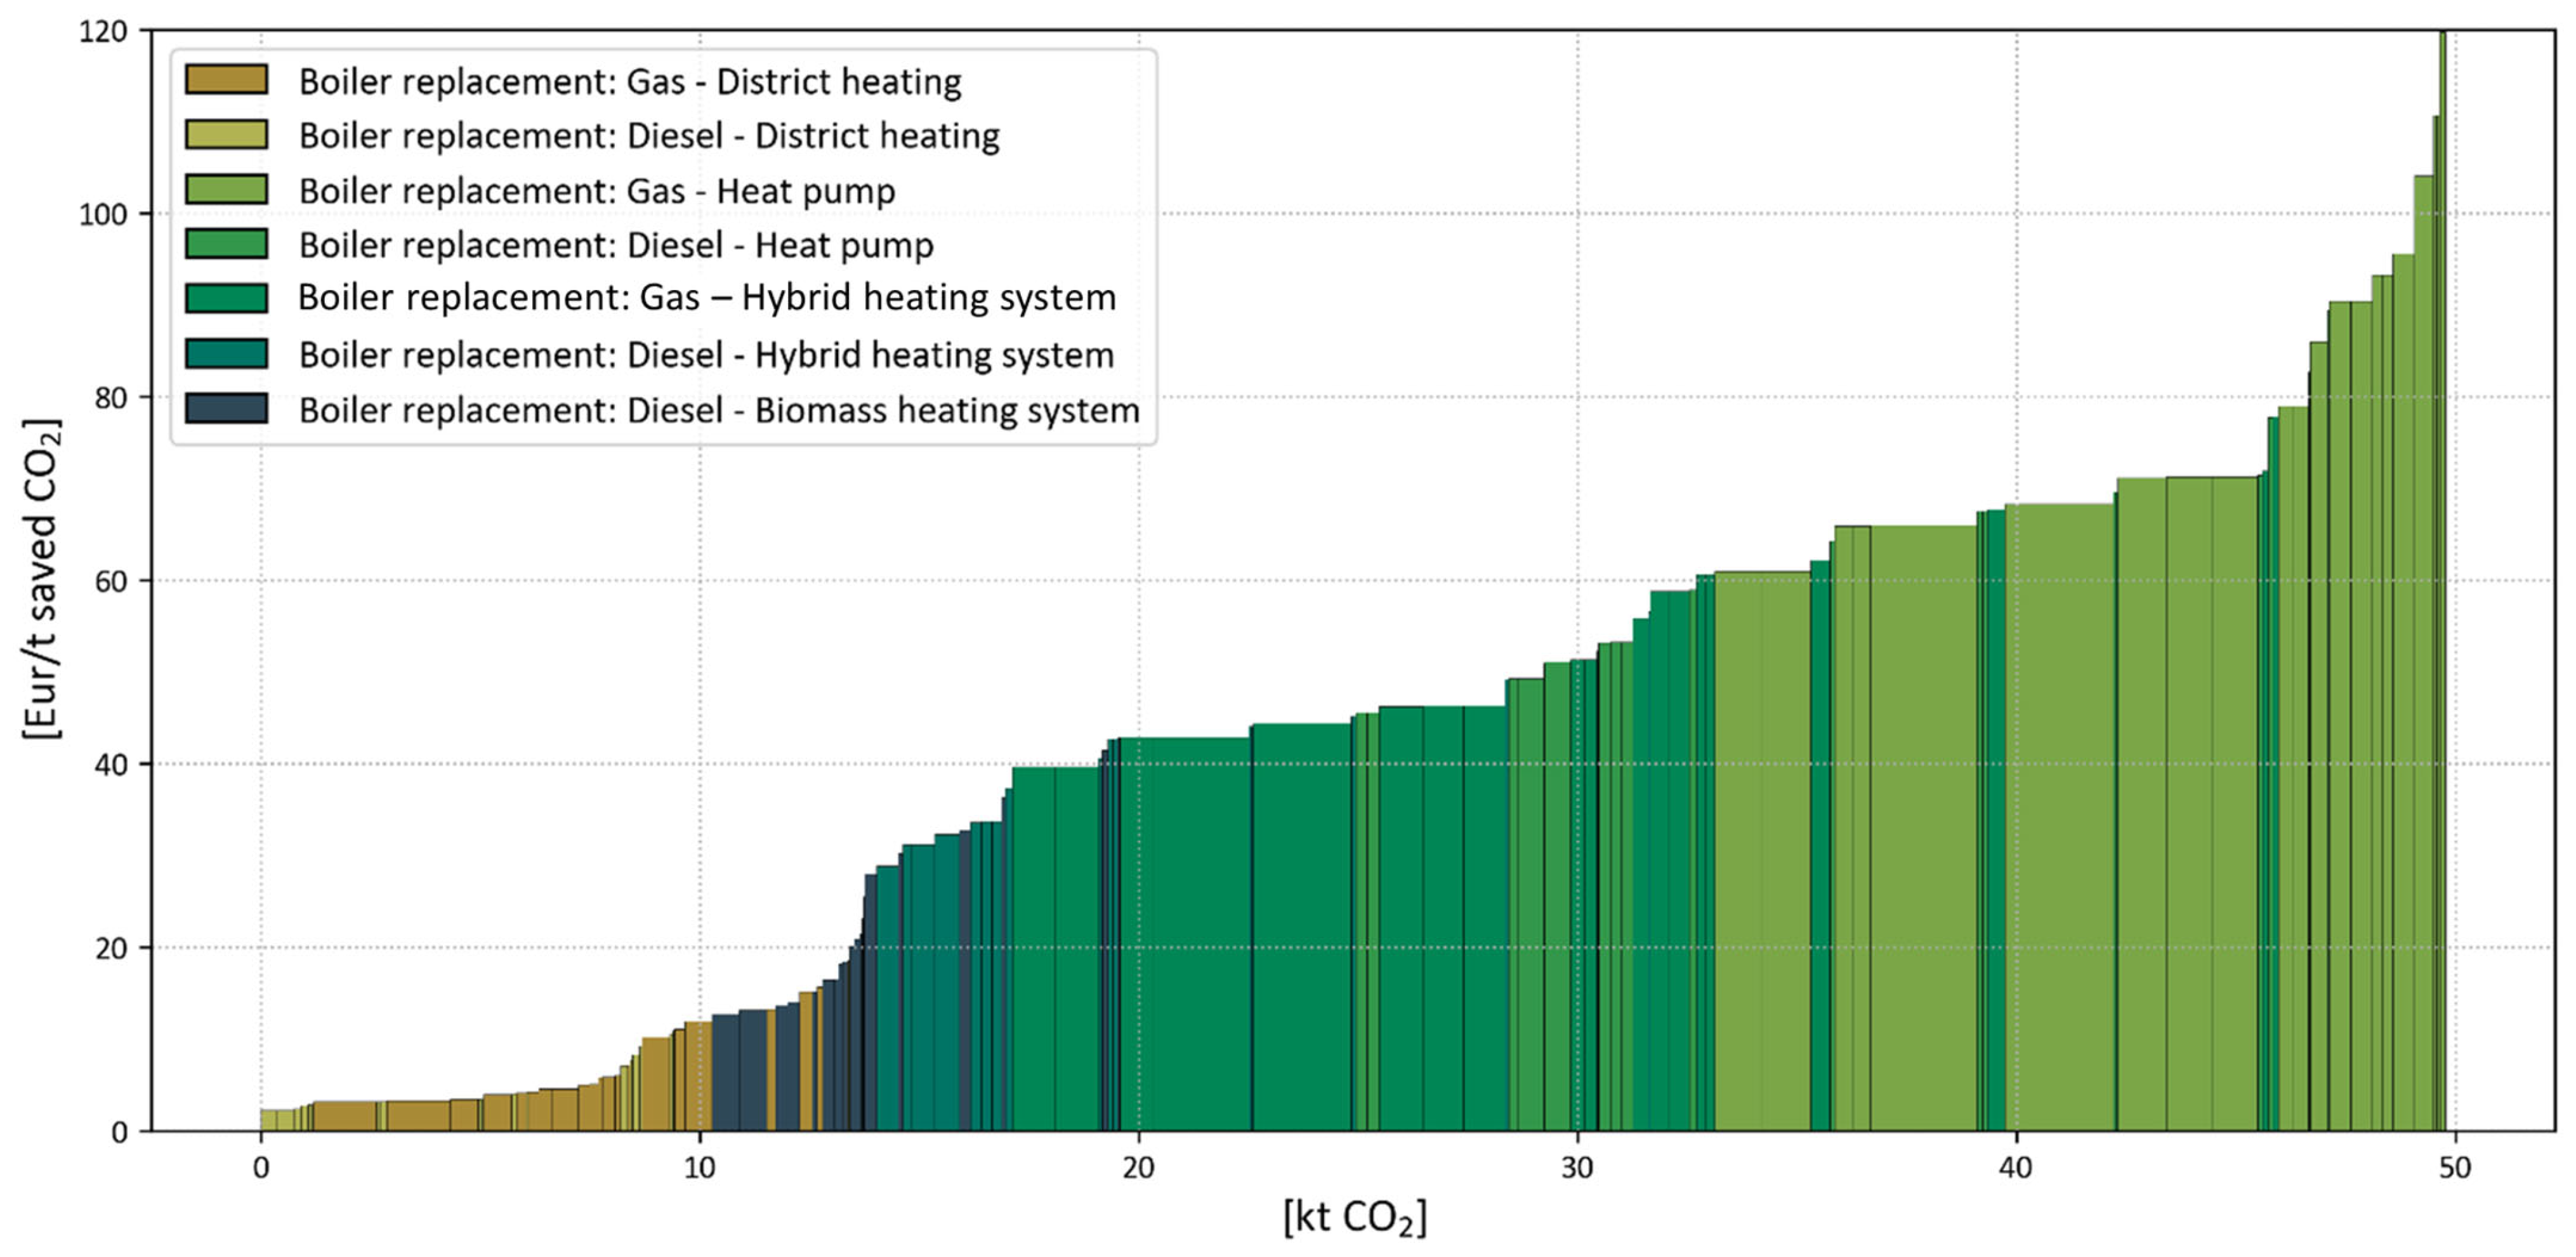
Figure 7.
MAC curve for all incentives.

Table 1.
Heated surface area [6].
Table 1.
Heated surface area [6].
| Single-Family House | Small Multi-Family House | Large Multi-Family House | Apartment Blocks | |
|---|---|---|---|---|
| <1945 | 1.96 | 0.35 | 0.35 | 0.80 |
| 1946–1969 | 2.67 | 0.32 | 0.32 | 0.76 |
| 1970–1979 | 1.72 | 0.13 | 0.13 | 0.37 |
| 1980–1989 | 1.46 | 0.13 | 0.13 | 0.17 |
| 1990–1999 | 1.52 | 0.21 | 0.21 | 0.22 |
| 2000–2010 | 0.64 | 0.10 | 0.10 | 0.21 |
| Post 2010 | 0.16 | 0.04 | 0.04 | 0.08 |
Table 2.
Consumption kWh/ [6].
Table 2.
Consumption kWh/ [6].
| Single-Family House | Small Multi-Family House | Large Multi-Family House | Apartment Blocks | |
|---|---|---|---|---|
| <1945 | 173.25 | 103.57 | 103.57 | 107.92 |
| 1946–1969 | 175.78 | 120.92 | 120.92 | 111.83 |
| 1970–1979 | 163.20 | 111.92 | 111.92 | 103.65 |
| 1980–1989 | 131.38 | 93.44 | 93.44 | 85.81 |
| 1990–1999 | 118.63 | 81.62 | 81.62 | 77.14 |
| 2000–2010 | 107.86 | 79.14 | 79.14 | 70.87 |
| Post 2010 | 92.38 | 66.66 | 66.66 | 61.61 |
Table 3.
List of incentives of the Province of Bolzano considered in the study subdivided by sector.
Table 3.
List of incentives of the Province of Bolzano considered in the study subdivided by sector.
| Considered Incentives | |
|---|---|
| Residential Energy Efficiency—insulation, window replacement | Insulation of roofs, attics, and terraces |
| Insulation of external walls, first floors, and arcades | |
| Replacement of windows and balcony doors | |
| Mobility—subsidies for electric vehicles | Full Electric or Plug-In Hybrid vehicle purchase |
| Electric vehicle charging systems: contributions to individuals | |
| Boiler Replacement—replacing old gas/diesel boilers | Replacement of diesel and gas boilers in apartment blocks |
Table 4.
List of main assumptions per incentive sector.
| Assumptions | |
|---|---|
| Residential Energy Efficiency—insulation, window replacement | Four housing types were considered: single-family homes, small multi-family homes, large multi-family homes, apartment blocks |
| Homes were categorized into seven age groups by year of construction, influencing energy savings | |
| Heated surface area, energy consumption data were estimated for each housing type and age group [35]. | |
| Mobility—subsidies for electric vehicles | Four scenarios were assessed based on switching from petrol/diesel to full electric or plug-in hybrid vehicles |
| Assumptions were made about annual vehicle kilometers travelled, vehicle lifetimes, and EV energy consumption | |
| Boiler Replacement—replacing old gas/diesel boilers | Seven boiler replacement options were evaluated, including district heating, heat pumps, hybrid systems, and biomass boilers. |
| Assumptions were made about the share of buildings with access to district heating vs. other systems |
Disclaimer/Publisher’s Note: The statements, opinions and data contained in all publications are solely those of the individual author(s) and contributor(s) and not of MDPI and/or the editor(s). MDPI and/or the editor(s) disclaim responsibility for any injury to people or property resulting from any ideas, methods, instructions or products referred to in the content. |
© 2023 by the authors. Licensee MDPI, Basel, Switzerland. This article is an open access article distributed under the terms and conditions of the Creative Commons Attribution (CC BY) license (https://creativecommons.org/licenses/by/4.0/).
Share and Cite
MDPI and ACS Style
Billi, S.; Prina, M.G.; Castagna, M.; Sparber, W. Assessing the Cost-Effectiveness of Incentives for Energy Transition Using Marginal Abatement Cost Curves. Energies 2023, 16, 7412. https://doi.org/10.3390/en16217412
AMA Style
Billi S, Prina MG, Castagna M, Sparber W. Assessing the Cost-Effectiveness of Incentives for Energy Transition Using Marginal Abatement Cost Curves. Energies. 2023; 16(21):7412. https://doi.org/10.3390/en16217412
Chicago/Turabian StyleBilli, Sofia, Matteo Giacomo Prina, Marco Castagna, and Wolfram Sparber. 2023. "Assessing the Cost-Effectiveness of Incentives for Energy Transition Using Marginal Abatement Cost Curves" Energies 16, no. 21: 7412. https://doi.org/10.3390/en16217412
Note that from the first issue of 2016, this journal uses article numbers instead of page numbers. See further details here.