


Improving the Estimation of Partial Discharge Direction Using a Four-Terminal Surface Current Sensor

1
Mitsubishi Electric Corporation, 8-1-1, Tsukaguchi-Honmachi, Amagasaki 661-8661, Japan
2
Department of Electrical and Electronics Engineering, Aichi Institute of Technology, 1247, Yachigusa, Yakusa-Cho, Toyota 470-0392, Japan
*
Author to whom correspondence should be addressed.
Energies 2023, 16(21), 7389; https://doi.org/10.3390/en16217389
Submission received: 15 June 2023
/
Revised: 25 October 2023
/
Accepted: 27 October 2023
/
Published: 1 November 2023
(This article belongs to the Special Issue Advanced Technologies in Partial Discharge Detection and Fault Diagnosis)
Abstract
:To improve the insulation diagnosis of a medium-voltage (MV) switchgear, we have developed a four-terminal surface current sensor and a method to estimate the direction of partial discharge occurrence. In this method, the accuracy of the direction estimation is improved by referring only to the direct wave, and the error due to noise can be suppressed by calculating the outputs of the four terminals. The experimental results demonstrate that the detection characteristics of the sensor concur well with the theoretical characteristics derived from the detection principle. Additionally, we conducted an experiment using the developed sensor and the new method to detect the surface current generated due to partial discharge occurring in a rectangular enclosure. The results demonstrate that the occurrence direction could be estimated even for a rectangular enclosure. Furthermore, the propagation attenuation of the surface current at the corners of the enclosure was large, exhibiting an attenuation 0.25 times for the worst case. Finally, it was confirmed that noise removal using a wavelet transform could reduce the direction estimation error of the discharge occurrence by approximately half.
1. Introduction
Advanced technologies that can diagnose equipment abnormalities from outside the enclosure must be developed to improve the efficiency of the maintenance and inspection of power equipment. Partial discharge (PD) detection, which can effectively perform insulation diagnosis, is used to detect electrical signals such as voltage and electromagnetic waves, mechanical signals such as vibration and ultrasound, and chemical signals such as discharge decomposition gas. Electrical signal detection can be achieved using various discharge factors, including those occurring in gases or solid insulating materials. Electromagnetic wave detection using an antenna installed inside the equipment is widely implemented owing to its high sensitivity in detecting even minute discharges of a few picocoulombs [1,2].
PD source localization is also identified using sonic, electromagnetic and AE sensors, which is important for maintenance planning. The identification of discharge points is also important for maintenance planning, and sonic and AE sensors are used [3,4,5]. Sonic and AE sensors are often used to locate discharges inside tanks, but there are issues with sensitivity. UHF sensors are also used and have excellent sensitivity. The discharge location is identified by the frequency characteristics of the detection signal, which varies according to the propagation characteristics of the electromagnetic waves in the tank [6]. The discharge location is also identified by combining time–frequency characteristics and machine learning [7]. The antenna must be located inside the tank.
In addition, phase-resolved PD information is also often used for PD localization. The use of various machine learning algorithms has been reported [8,9]. It is useful for identifying discharge factors and for maintenance planning. When there are several similar components, it is difficult to identify which component is which, and it is desirable to combine this with the aforementioned localization techniques.
However, for older equipment without an antenna, external diagnosis is necessary, and external antennas, surface current sensors and transient earthing voltage (TEV) sensors are used, which are installed along the tank [10,11,12]. This equipment can detect PD but cannot determine the location of the discharge.
Currently, we are developing a directional surface current sensor to further improve the diagnostic accuracy. This sensor is expected to detect the surface current generated by PD outside the equipment and estimate the arrival direction of the surface current by utilizing the directional detection intensity of the sensor. It is characterized by its superior detection sensitivity compared to conventional methods using sound sensors or AE sensors, and by the fact that a single sensor can be used to the localization.
Thus far, we have developed methods for estimating the direction of arrival of sensors and PDs in gas-insulated switchgear with cylindrical and rectangular shapes, and have experimentally verified their effectiveness [13,14]. In these validations, we have used discharge sources with high discharge intensities, making it a challenge to verify the effectiveness of these methods for the small discharges that occur in actual equipment. Furthermore, improving the signal-to-noise (S/N) ratio is necessary for small discharges.
In this study, we demonstrated the directional sensitivity of a four-terminal surface current sensor for detecting minute discharges that occur in real equipment. We also developed a method for estimating the direction of arrival of surface currents using this sensor. Additionally, we applied wavelet transform-based denoising techniques to improve the S/N ratio. This sensor is expected to be applied to medium-voltage (MV) switchgear.
2. Basic Principles and Structure of the Four-Terminal Surface Current Sensor
2.1. Basic Principles
Figure 1 depicts the basic structure of a directional surface current sensor. Coupling lines are installed parallel to the metal enclosure, and both ends are connected to the metal enclosure through specified impedances, Z1 and Z2. When the surface current generated by PD flows into the sensor, the coupling lines are induced and excited by the electromagnetic field of the surface current. An electric field is generated in the normal direction to the enclosure, producing a potential difference between Z1 and Z2 based on the distance between the coupling lines and the enclosure. Additionally, a magnetic field is generated in the direction parallel to the enclosure, producing a potential difference between Z1 and Z2 based on the cross-sectional area of the sensor. If the length, L, of the coupling lines is sufficiently small when compared to the wavelength of the surface current and Z1 = Z2 = W, currents are induced in impedances, Z1 and Z2, according to Equations (1) and (2) as follows [15]:
where E denotes the electric field strength of the incoming surface current; h denotes the distance between the upper electrode and the enclosure; W denotes the characteristic impedance between the upper electrode and the enclosure; jβ denotes the propagation constant assuming that the system is lossless; L denotes the length of the coupling line; and θ denotes the incident angle of the surface current.
Equations (1) and (2) show that the detected currents, I1 and I2, vary depending on the incident angle, θ, of the surface current, indicating that the sensor has directivity. The relationships between |I1|, |I2| and the incident angle, θ, of the surface current exhibit sine wave curves, as shown in Figure 2. For example, at θ = 0°, I1 ≠ 0 and I2 = 0, whereas at θ = −90° and 90°, I1 = 0 and I2 ≠ 0.
2.2. Sensor Structure
Figure 3a depicts the structure of the surface current sensor used in this study. The sensor was a rectangular solid (50 mm (width) × 50 mm (depth) × 40 mm (height)), and signals were acquired from the sub-miniature type A (SMA) terminals connected to the upper coupling wire and the lower metal plate. Figure 3b depicts the installation location of each terminal. The cross-sections at the vertical and horizontal axes correspond to the basic structure depicted in Figure 1, and the terminals were installed at four locations, 90° apart, when viewed from above. The surfaces of the equipment enclosures, which are the measurement targets, often contain paint, which may not conduct with the metal plate of the sensor. However, their detection characteristics are similar to those described in the previous section in accordance with the basic principles as they are in close proximity and can be considered to have the same potential. The coupling wire was thickened to increase the induction by the electric field of the surface current, and a cavity was provided to amplify the induction by increasing the cross-sectional area of the magnetic field of the surface current.
3. Partial Discharge Detection Characteristics and Arrival Direction Estimation
3.1. Test System
A test system was constructed to explore the detection characteristics of the surface current sensor by setting a PD source and the sensor on the same plane, as shown in Figure 4. The surface current sensor was placed approximately 5 m away from the PD source. The sensor output was input into an oscilloscope (bandwidth: 8 GHz, input: 4 channels, sampling: 10 GS/s) via a low-pass filter (cutoff frequency: 500 MHz) to remove noise, and the waveform was observed. The directionality of the sensor was then verified by observing the waveform while changing the installation angle, φ, of the surface current sensor in increments of 15° from −180° to 180°.
The PD source was modeled as a creepage discharge model, consisting of a high-voltage electrode with a diameter of 10 mm, an insulating resin board with a diameter of 50 mm and a thickness of 1 mm, and a grounding electrode with a diameter of 80 mm. This setup simulates surface PDs occurring on the insulating material’s surface in actual equipment. The PD source was placed under a SF6 atmosphere. A high alternating current (AC) voltage (approximately 10 kVrms), generated by a test transformer, was applied to induce the PD and surface current. The discharge was measured using a PD measurement instrument, and the value ranged from 10 pC to 1000 pC. Certain variations existed in the discharge charge, which could be a source of error in the direction estimation of the discharge generation. The methods used to rectify the effects of these variations are discussed in the later sections of the paper.
3.2. Detection Waveform and Signal Strength Calculation
Figure 5 depicts an example of the waveform detected using the sensor for an installation angle of φ = 0° and terminal 1. A signal was generated for a period of approximately a few microseconds from the time of the signal detection near the horizontal axis at 0 μs. It is considered that along with the direct wave from the discharge source, the reflected wave from the surrounding structures also arrived with a time lag, resulting in a continuous signal. Additionally, Figure 5 presents the frequency characteristics obtained via Fourier transform. The frequency components were primarily in the 500–1000 MHz band. The sensor can detect high-frequency components [16] of SF6 discharge.
3.3. Calculation of the Signal Strength
In the subsequent analysis, the peak value of the waveform immediately after the signal detection was used as the signal strength. The direction estimation accuracy can be improved by separating the direct wave from the reflected wave in the detected waveform and using the intensity of the direct wave that arrived directly from the PD source for the direction estimation. Therefore, the signal strength immediately after the detection was calculated based on the fact that the direct wave arrived before the reflected wave.
The signal detection time was calculated using the energy criterion method [17,18]. This method uses S(t) as an index and determines the time at which the minimum value is obtained using the following equations:
In Equation (4), vi represents the detected voltage, and N represents the number of samples. The first term on the right-hand side of Equation (3) represents the cumulative energy obtained by integrating the squared detected voltage up to time t. The second term represents the summed cumulative energy over the entire region. As shown in Equation (4), it was averaged over the region and denoted as δ. The difference between these terms yields S(t).
Figure 6 depicts a plot of S(t) calculated from the waveform shown in Figure 5 and the resulting signal detection time. The figure presents an enlarged view of the vicinity of the signal detection on the x-axis from Figure 5. The second term on the right-hand side of Equation (3) was larger until the arrival of the surface current; therefore, S(t) monotonically decreased. However, when the surface current arrived, the first term became larger, and S(t) increased. Consequently, the time at which S(t) changed from a monotonically decreasing to an increasing trend, that is, the time at which S(t) was at its minimum value, can be determined as the arrival time of the surface current. Figure 6 also shows S(t) calculated from the detection waveform in Figure 5, exhibiting the minimum value of S(t). The obtained signal arrival time is observed to be reasonable.
3.4. Directionality of the Sensor
Figure 7 presents the detection waveforms, v1–v4, of terminals 1–4 and the corresponding S1(t)–S4(t) values. While each terminal detects the signal at approximately the same time, the signal strength differs, with v1 > v3 ≒ v4 > v2. Because the output of each terminal can be zero when the signal arrives from a certain direction, the arrival time of the signal is determined to be the earliest point at which S(t) is at the minimum value among the minimum points obtained from each terminal. The waveform amplitude at that time was recorded for each terminal. Figure 8 depicts the signal strengths, V1–V4, for each terminal when the sensor orientation was changed. The signal strength at each terminal varied with the sensor orientation, demonstrating the directional sensitivity of the sensor. In the following sections, the arrival direction of the surface current is estimated using the sensor. The theoretical waveform, represented by the sine curve in Figure 2, generally matches the experimental data. The deviation from the theoretical curve is attributed to the variation in the discharge amount at each orientation and the increasing influence of noise in the direction where the signal strength was small.
3.5. Method for Estimating the Arrival Direction
The arrival direction of the surface current was estimated using the calculated values of the signal strength, V1 to V4. We attempted to suppress the effects of the variation in the discharge and noise and improve the estimation accuracy. The four-terminal value (iq) was calculated using V1 to V4, as shown in the following equation:
The computational values of the signal strengths, V1–V4, at each terminal were used to estimate the arrival direction of the surface current. Furthermore, a design was developed to improve the estimation accuracy while suppressing the effects of the variation in the discharge and noise. The four-terminal computational value (iq) was calculated by substituting V1–V4 into Equation (5), depending on the maximum value.
The variation in the discharge was corrected through voltage division. For example, in the case where V1 was the maximum, V2, which was the minimum and was significantly affected by noise, was compensated using the difference instead of the division. The calculated four-terminal computational value, iq, varied based on the arrival direction of the surface current. Figure 9 depicts the relationship between the arrival direction of iq and V1–V4 obtained for the example where V1 was the maximum regardless of φ. The same figure shows the results of calculating iq using the conventional method, only using voltage division. Comparing Figure 9a,b, the error is reduced in Figure 9b using the proposed method.
In addition, Figure 9 presents the theoretical values calculated based on the detection principle described in Section 2 and Equation (5). A comparison of the acquired and theoretical values confirms their consistency. Although certain uncertainty is observed in the comparison between Figure 2 and Figure 8, the effects of the discharge variation and noise were corrected through computational processing, resulting in detection characteristics of the sensor consistent with those in theory. In the range of φ = −45° to 45°, iq decreases monotonically as the angle increases, and the angle of arrival can be uniquely determined from iq.
4. Estimation of the Arrival Direction of the Surface Current for the Enclosed Rectangular Sensor
4.1. Test System
Figure 10 depicts the experimental system. A PD source sample similar to that used in Section 3 was installed inside a cubic metal enclosure with an edge length of 800 mm. An AC voltage was applied through a bushing (HV port) on the top surface of the enclosure, and the grounding electrode of the same sample was connected to the ground through a bushing (GND port) on the side surface of the enclosure. The applied voltage and the discharge were identical to those in Section 3. The surface current generated on the outer surface of the enclosure owing to PD was detected using a surface current sensor installed on the same surface. The sensor was placed at eight locations, labeled as A–H in Figure 11. The signal strength and arrival direction were measured at each location, with the sensor orientation set to φ = 0°, 90°, 180°, and 270°.
4.2. Measurement Results
Figure 12 presents the measurement results. The figure presents an unfolded view with the ceiling surface of the metal enclosure at the center. Figure 12a depicts the sensor installation locations, and Figure 12b presents the detection results.
Figure 12a depicts the direction of the detected surface current estimated at each installation position, as indicated by the arrows. The arrival direction was estimated at four different installation angles, each indicated by an arrow. At positions A, B, C, D, E, and F, the arrows point toward the HV port, whereas at position G, the arrows point toward the space between the HV and GND ports. The surface current is assumed to propagate radially from the electrical opening of the metal enclosure. This result concurs with the arrival time difference obtained from multiple sensors installed in the enclosure and is also confirmed by electromagnetic field simulations [10,19]. Therefore, the results accurately indicate the locations of the HV and GND ports. In addition, we confirmed that the arrival direction could be estimated even when the sensor was installed on the side surface of the enclosure (positions D, E, and F). Therefore, the sensor could estimate the arrival direction even when the surface current propagated through the corner of the enclosure.
The maximum signal strength of each terminal was obtained by changing the installation angle at each position. The signal strength normalized to the value of position G, where the signal strength was the highest, is indicated by circles at each installation location in Figure 12a. The maximum strength at position G is attributed to its proximity to the radiating sources of the surface current, HV port, and GND port. In addition, at positions A, B, and C on the ceiling surface, the strength was equivalent to 44–60%, and the signal strength from the GND port was small. At positions D and E, which are farther from the HV port, the strength was 5–13%, which is approximately a quarter of that of the ceiling surface. The surface current was significantly attenuated when propagating through the corner of the rectangular box. Moreover, the strengths at positions D and E were lower than that at position F, and attenuation due to the distance was confirmed.
The knife-edge diffraction loss is given by the following equation [20].
As the frequency is increased, the attenuation also increases. As the detection frequency range in Figure 5 is 500–1000 MHz, the estimated attenuation at the lower and upper limits of these frequencies is −12 and −15 dB, respectively. The measured result of −12 dB (1/4th of the voltage ratio) closely concurs with the estimated values, confirming the validity of the measurement results. However, the direction was not determined for position H. This is because the signal strength was small owing to the large distance from the opening, and the detection sensitivity was insufficient. Additional reasons include its proximity to the ground and the direction inaccuracy owing to the superposition of waves reflected on the ground.
The attenuation characteristics, considering both distance and diffraction loss, are shown in Figure 12b. Here, the horizontal axis represents the pseudo-distance, which is the harmonic mean of the distances between the sensor and the HV and GND ports. Additionally, if the path between the sensor and the ports passes through a corner of the enclosure, the diffraction loss is converted into distance attenuation and incorporated. As indicated in the figure, the signal’s attenuation characteristics due to distance and diffraction loss can be formalized.
Therefore, it can be concluded that improving the estimation accuracy requires improving the sensor sensitivity and optimizing the sensor installation position. The distance attenuation of the surface current should be considered, particularly the attenuation, because of the propagation through the corner of the rectangular box.
5. Noise Reduction Using a Wavelet Transform
The surface current sensor is affected by external electromagnetic waves, which can degrade the accuracy of the direction estimation. Therefore, noise reduction using a wavelet transform [21,22,23] was applied.
Wavelet transform is a type of time–frequency analysis involving scaling and shifting the wavelet basis function, ψ(t). Compared to short-time Fourier transform, it presents a good balance between the time and frequency resolutions. The wavelet transform of the signal, v(t), is represented by the following equations:
Here, * represents a complex conjugation. Furthermore, a and b denote the scale and shift parameters representing the scale and shift transformations, respectively. In this study, the Gabor function was used as the wavelet basis function, ψ(t).
Noise reduction was performed by applying soft thresholding with a universal threshold derived from the wavelet coefficients, X(a,b), obtained via the wavelet transform. Subsequently, the inverse wavelet transform was used to convert the result into the time waveform. Figure 13 presents a comparison of the time waveforms before and after the noise reduction, which confirms the successful removal of the noise. The arrival direction was then estimated using the time waveform after the noise reduction by calculating the signal arrival time using the method described in Section 4.1, which involved determining the peak values of the waveform, and applying the calculation method described in Section 3.4.
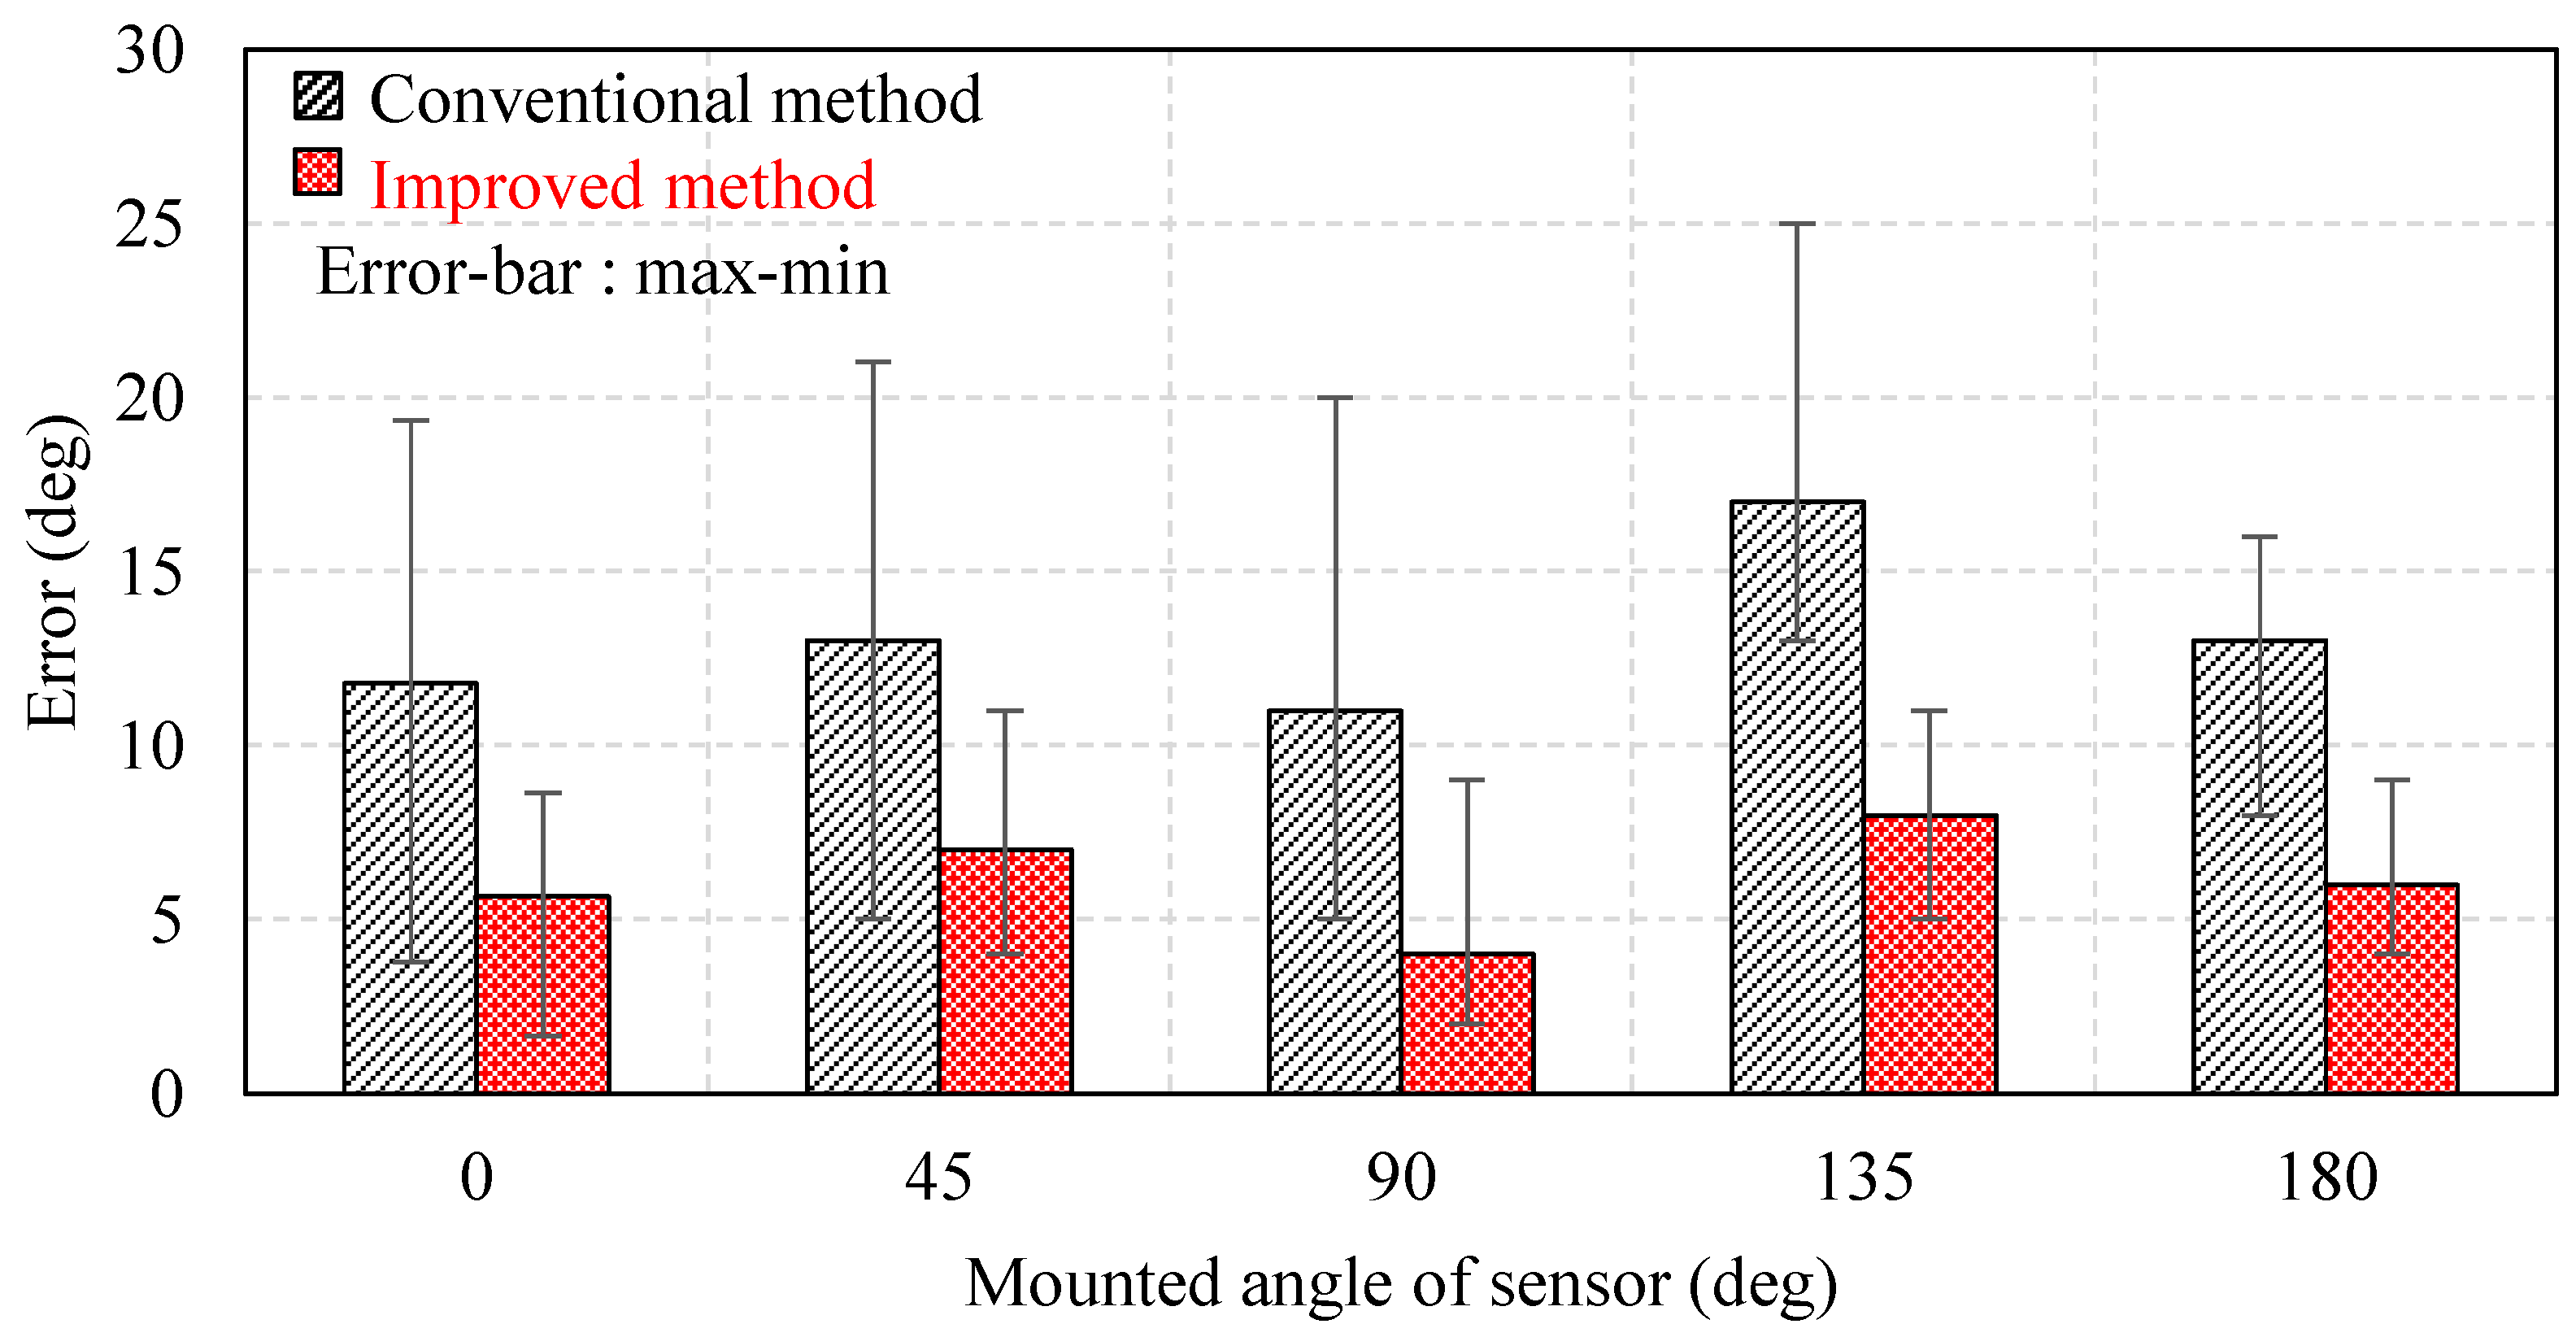
The effectiveness of the noise reduction using the wavelet transform was evaluated based on the estimation error when 100 discharges were detected at sensor installation angles of 0°, 45°, 90°, 135°, and 180°. The discharge source was a planar–vertical model, and discharges of different strengths were generated corresponding to the phase characteristics of the discharge, as shown in Figure 14. Figure 15 depicts the relationship between the estimation error and the signal strength at a sensor installation angle of 0°. Here, the signal strength represents the maximum value of V1–V4 before the noise reduction. The figure shows that the smaller the discharge strength, the larger the relative influence of noise on the measurement, and the larger the direction estimation error. Additionally, the use of wavelet transform-based denoising reduces the error. Figure 16 depicts the improvement effect at sensor installation angles of 0°, 45°, 90°, 135°, and 180°. For 100 discharges of varying strengths between 10 pC and 1000 pC, we estimated their directions using both conventional and improved methods, evaluated the estimation errors, and compared them with theoretical values. Here, the detection limit of this sensor was 50 pC. The plots indicate the arithmetic mean values, and the error bars represent the maximum and minimum values of 100 waveforms. The figure confirms that the estimation error was reduced when using the improved method for all sensor installation angles. Using the conventional method, the maximum error obtained was 25°, whereas in the improved method, it was 12°, which is approximately half of the former error. The average directional estimation accuracy of the surface current sensor was 7 degrees. This is presumed to be sufficiently accurate for practical diagnostics.
6. Conclusions
This study aimed to improve the insulation diagnosis of an MV switchgear by detecting and estimating the arrival direction of the surface current in a rectangular enclosure using a four-terminal surface current sensor. The findings of the study are presented below:
- (1)
- We confirmed the capability to estimate the direction of arrival of surface currents for minute discharges ranging from 10 pC to 1000 pC using a test system. In this system, both the discharge source and the developed four-terminal surface current sensor were installed on the same plane.
- (2)
- The methodology was also validated in a rectangular enclosure, confirming its applicability in estimating the direction of arrival of surface currents. Signal attenuation characteristics can be organized based on distance attenuation and diffraction losses due to the corners of the enclosure.
- (3)
- A wavelet transform was implemented for noise removal to suppress the influence of noise, such as external electromagnetic waves, which decrease the arrival direction estimation accuracy. Consequently, the direction estimation error of the discharge occurrence was reduced by approximately half, with a maximum of 12° for the improved method when compared to a maximum of 25° for the conventional method.
These results demonstrate the effectiveness of the four-terminal surface sensor for an MV switchgear in detecting discharges and estimating the direction of arrival. It is expected to improve the efficiency of future maintenance and inspections.
Furthermore, the surface currents were significantly attenuated at the corners of the enclosure. Therefore, the optimization of the sensor placement considering attenuation is essential for future applications.
Author Contributions
Conceptualization, Y.O. and H.M.; methodology, Y.O. and H.M.; software, Y.O.; validation, H.M.; formal analysis, Y.O.; investigation, Y.O. and H.M.; resources, H.M.; data curation, Y.O. and H.M.; writing—original draft preparation, Y.O.; writing—review and editing, Y.O. and H.M.; visualization, Y.O.; supervision, H.M.; project administration, H.M.; funding acquisition, Y.O. and H.M. All authors have read and agreed to the published version of the manuscript.
Funding
This research received no external funding.
Data Availability Statement
Not applicable.
Conflicts of Interest
The authors declare no conflict of interest.
References
- Okabe, S.; Ueta, G.; Hama, H.; Ito, T.; Hikita, M.; Okubo, H. New Aspects of UHF PD Diagnostics on Gas-insulated Systems. IEEE Trans. Dielectr. Electr. Insul. 2014, 21, 2245–2258. [Google Scholar] [CrossRef]
- Hikita, M.; Okabe, S.; Murase, H.; Okubo, H. Cross-equipment Evaluation of Partial Discharge Measurement and Diagnosis Techniques in Electric Power Apparatus for Transmission and Distribution. IEEE Trans. Dielectr. Electr. Insul. 2008, 15, 505–518. [Google Scholar] [CrossRef]
- Gao, S.; Zhang, Y.; Xie, Q.; Kan, Y.; Li, S.; Liu, D.; Lü, F. Research on Partial Discharge Source Localization Based on an Ultrasonic Array and a Step-by-Step Over-Complete Dictionary. Energies 2017, 10, 593. [Google Scholar] [CrossRef]
- Karami, H.; Aviolat, F.Q.; Azadifar, M.; Rubinstein, M.; Rachidi, F. Partial discharge localization in power transformers using acoustic time reversal. Electr. Power Syst. Res. 2022, 206, 107801. [Google Scholar]
- Wang, X.; Niu, B.; Hu, B.; Jin, H.; Wu, Z.; Wang, D. Research on Partial Discharge Source Positioning in Switchgear Based on PSO. In Proceedings of the 2021 International Conference on Electrical Materials and Power Equipment, Chongqing, China, 11–15 April 2021; pp. 1–4. [Google Scholar]
- Darwish, A.; Refaat, S.S.; Abu-Rub, H.; Toliyat, H.A. PD signal propagation in GIS: Ultra-high frequency detection-based modeling. IEEE Sens. J. 2020, 20, 9417–9426. [Google Scholar]
- Li, X.; Wang, X.; Yang, A.; Rong, M. Partial discharge source localization in GIS based on image edge detection and support vector machine. IEEE Trans. Power Deliv. 2019, 34, 1795–1802. [Google Scholar] [CrossRef]
- Lai, K.X.; Affandi, N.F.B.M.; Leck, B.H.; Fu, Y.; Ang, S.K. Localization with phase resolved partial discharge measured with high frequency current transformer. In Proceedings of the 2021 IEEE International Conference on the Properties and Applications of Dielectric Materials, Johor Bahru, Malaysia, 12–14 July 2021; pp. 77–80. [Google Scholar]
- Jahromi, A.N.; Pattabi, P.K. Identification of Defects in MV Equipment through Advanced Partial Discharge Diagnostics. In Proceedings of the 2021 IEEE Electrical Insulation Conference, Denver, CO, USA, 7–8 June 2021; pp. 210–213. [Google Scholar]
- Hikita, M. Recent Progress in Diagnosis of Electric Power Apparatus Using Non-Conventional Partial Discharge Measurements. In Proceedings of the 2016 International Conference on Condition Monitoring and Diagnosis, Xi’an, China, 25–28 September 2016; pp. 9–13. [Google Scholar]
- Zhang, C.; Dong, M.; Ren, M.; Huang, W.; Zhou, J.; Gao, X.; Albarracín, R. Partial Discharge Monitoring on Metal-Enclosed Switchgear with Distributed Non-Contact Sensors. Sensors 2018, 18, 551. [Google Scholar] [CrossRef] [PubMed]
- Putro, W.A.; Nishigouchi, K.; Khayam, U.; Kozako, M.; Hikita, M.; Urano, K.; Min, C. Sensitivity verification and determination of the best location of external UHF sensors for PD measurement in GIS. In Proceedings of the 2012 IEEE International Conference on Condition Monitoring and Diagnosis, Bali, Indonesia, 23–27 September 2012; pp. 698–701. [Google Scholar]
- Yamamoto, R.; Shimohara, Y.; Murase, H. A Study of New Directivity Improvement Method of Surface Current Sensor for PD Detection of GIS. In Proceedings of the 2015 Annual Conference of Power and Energy Society IEE of Japan, Tokyo, Japan, 24–26 March 2015. (In Japanese). [Google Scholar]
- Otake, Y.; Murase, H. Detection and Estimation of Occurrence Direction of Partial Discharge in a Rectangular Enclosure using the Four-Terminal Surface Current Sensor. IEEJ Trans. PE 2022, 142, 255–260. (In Japanese) [Google Scholar] [CrossRef]
- Nagasawa, Y.; Sato, R. A Surface Current Detector for High-Frequency Current on Metal Surface. IEICE Trans. Fundam. 1983, J66-B, 360–366. (In Japanese) [Google Scholar] [CrossRef]
- Yoshida, M.; Takahashi, T.; Hoshino, T.; Hikita, M.; Miyazaki, A.; Okubo, H. Generation of Partial Discharge Current Pulse and its Radiation/propagation Characteristics of Electromagnetic Wave in GIL. IEEJ Trans. PE 1997, 117, 1204–1209. (In Japanese) [Google Scholar] [CrossRef] [PubMed]
- Markalous, S.M.; Tenbohlen, S.; Feserm, K. Detection and Location of Partial Discharges in Power Transformers using Acoustic and Electromagnetic Signals. IEEE Trans. Dielectr. Electr. Insul. 2008, 15, 1576–1583. [Google Scholar] [CrossRef]
- Mirzaei, H.R.; Akbari, A.; Gockenbach, E.; Zanjani, M.; Miralikhani, K. A Novel Method for Ultra-high-frequency Partial Discharge Localization in Power Transformers using the Particle Swarm Optimization Algorithm. IEEE Electr. Insul. Mag. 2013, 29, 26–39. [Google Scholar] [CrossRef]
- Itose, A.; Koga, T.; Yoshizumi, H.; Kozako, M.; Hikita, M. High Precision Partial Discharge Detection Utilizing Transient Earth Voltage Signal Propagation Analysis in High Voltage Equipment. In Proceedings of the 2017 Technical Meeting on Electrical Discharges IEEE Japan, Nagasaki, Japan, 27 January 2017. [Google Scholar]
- Recommendation ITU-R P.526-13: Propagation by Diffraction; International Telecommunications Union: Geneva, Switzerland, 2013; pp. 16–19.
- Ma, X.; Zhou, C.; Kemp, I.J. Automated wavelet selection and thresholding for PD detection. IEEE Electr. Insul. Mag. 2002, 18, 37–45. [Google Scholar] [CrossRef]
- Kawada, M.; Wada, M.; Kawasaki, Z.; Matsu-ura, K.; Kawasaki, M. Time-Frequency Analysis of Partial Discharge Phenomena in SF6 gas using Wavelet Transform. IEEJ Trans. PE 1997, 117, 338–348. (In Japanese) [Google Scholar] [CrossRef] [PubMed]
- Muñoz, O.; Schurch, R.; Ardila-Rey, J.A. Electrical Tree Growth Identification by Means of Discrete Wavelet Transform (DWT) and Principal Component Analysis (PCA). IEEE Trans. Instrum. Meas. 2023, 72, 1–9. [Google Scholar] [CrossRef]
Figure 1.
Basic layout of the surface current sensor [14].
Figure 1.
Basic layout of the surface current sensor [14].
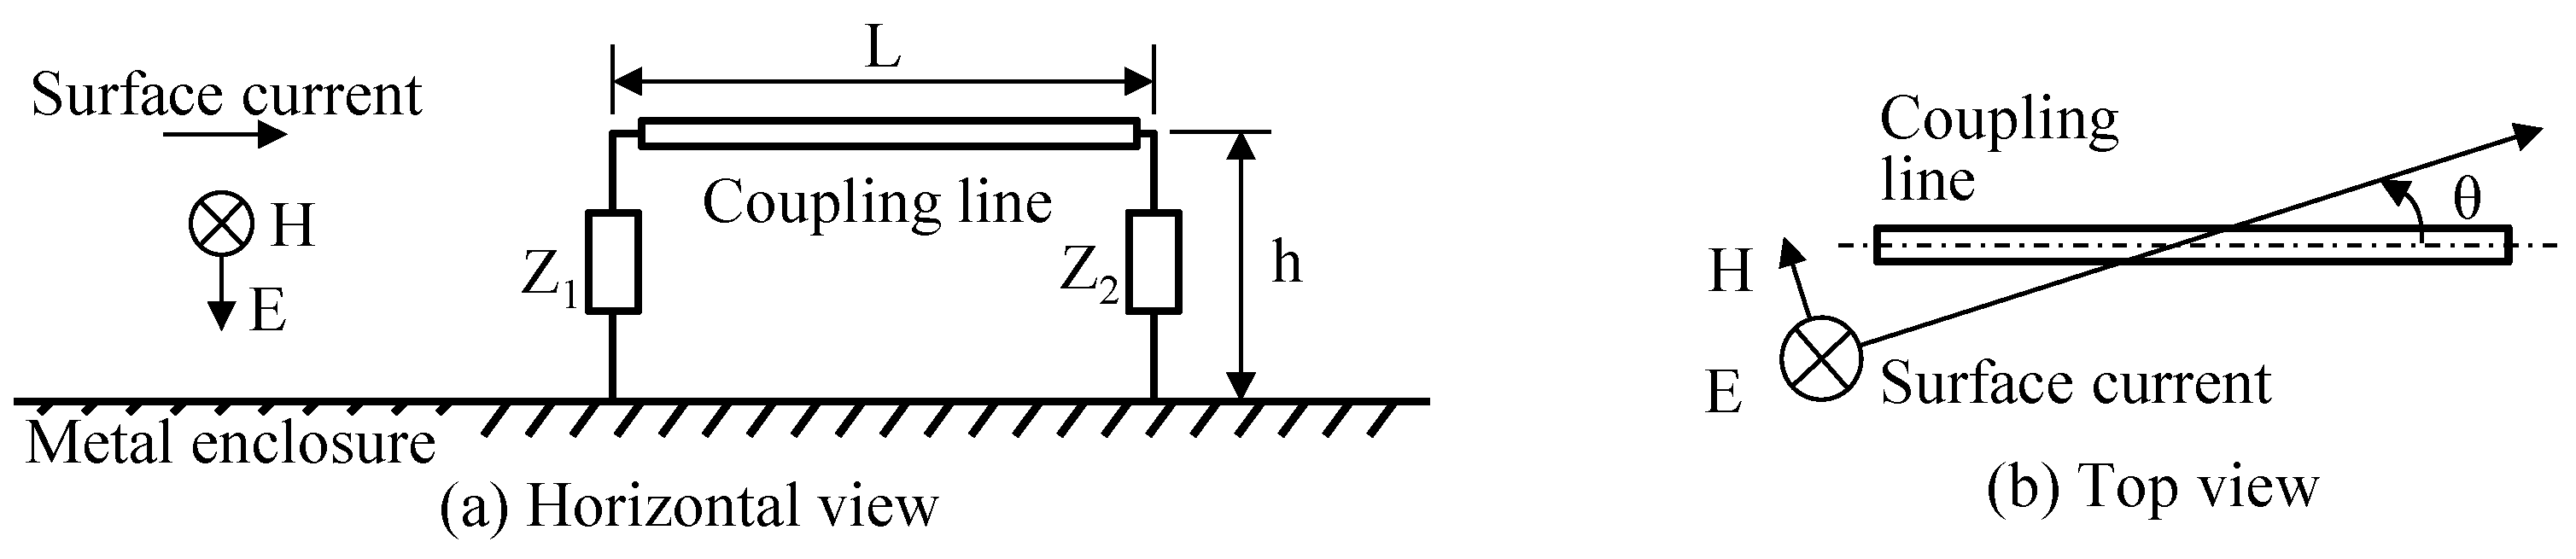
Figure 2.
Dependence of the output magnitude on the arrival angle [14].
Figure 2.
Dependence of the output magnitude on the arrival angle [14].
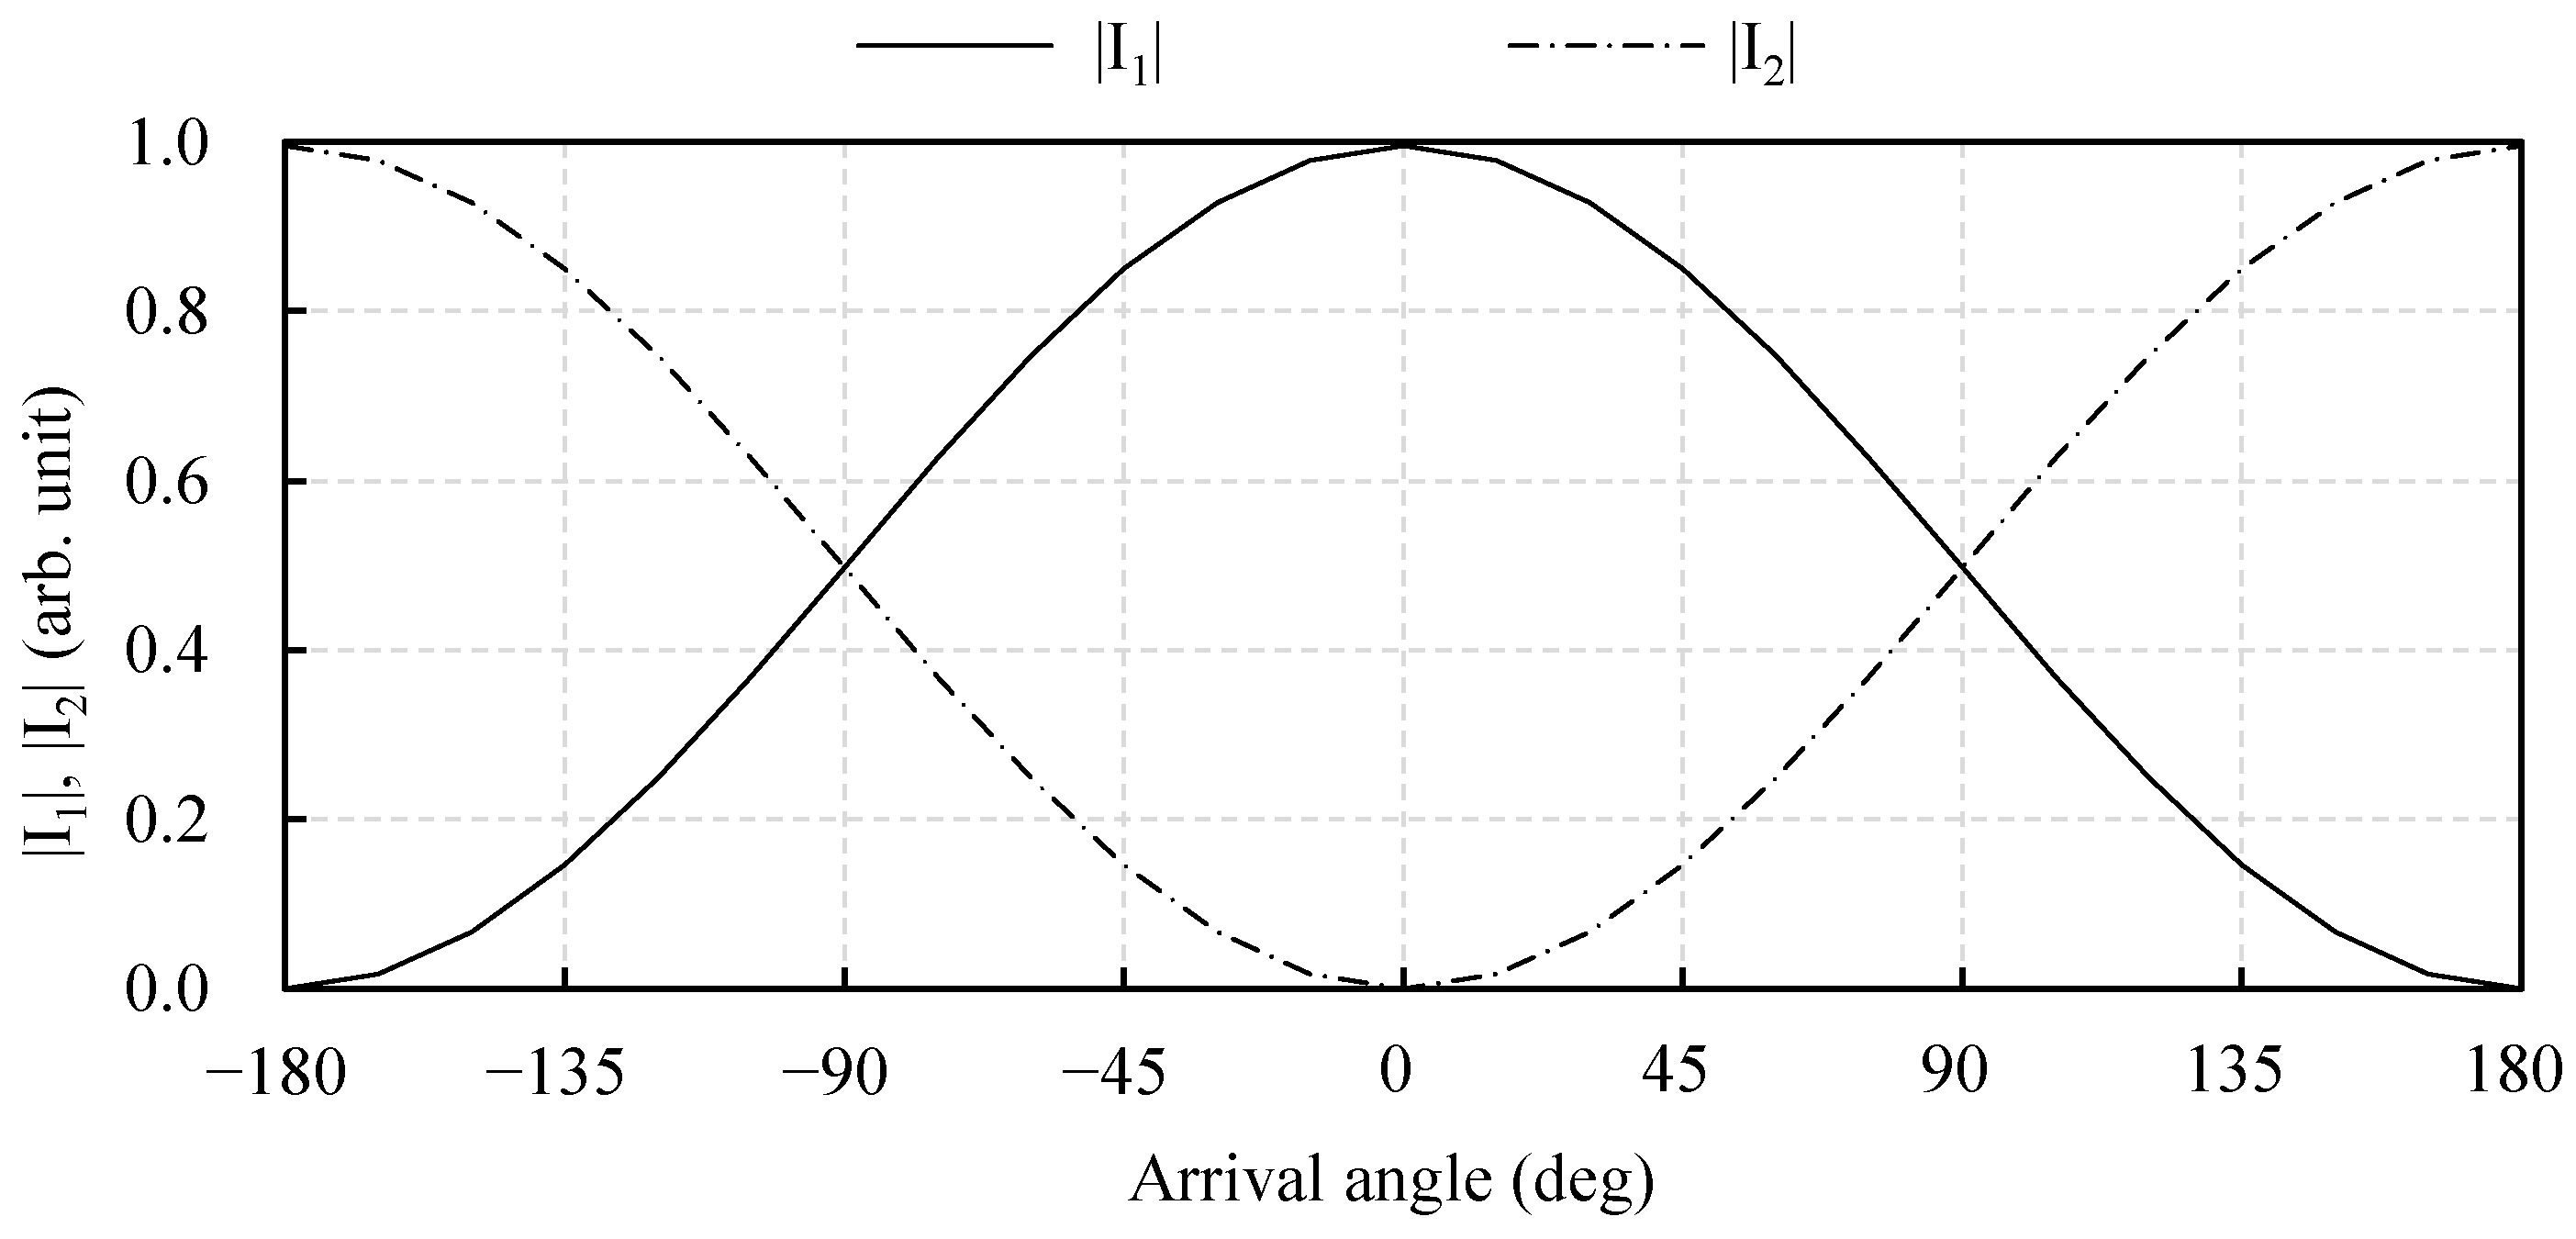
Figure 3.
Schematic of the four-terminal surface current sensor [14].
Figure 3.
Schematic of the four-terminal surface current sensor [14].
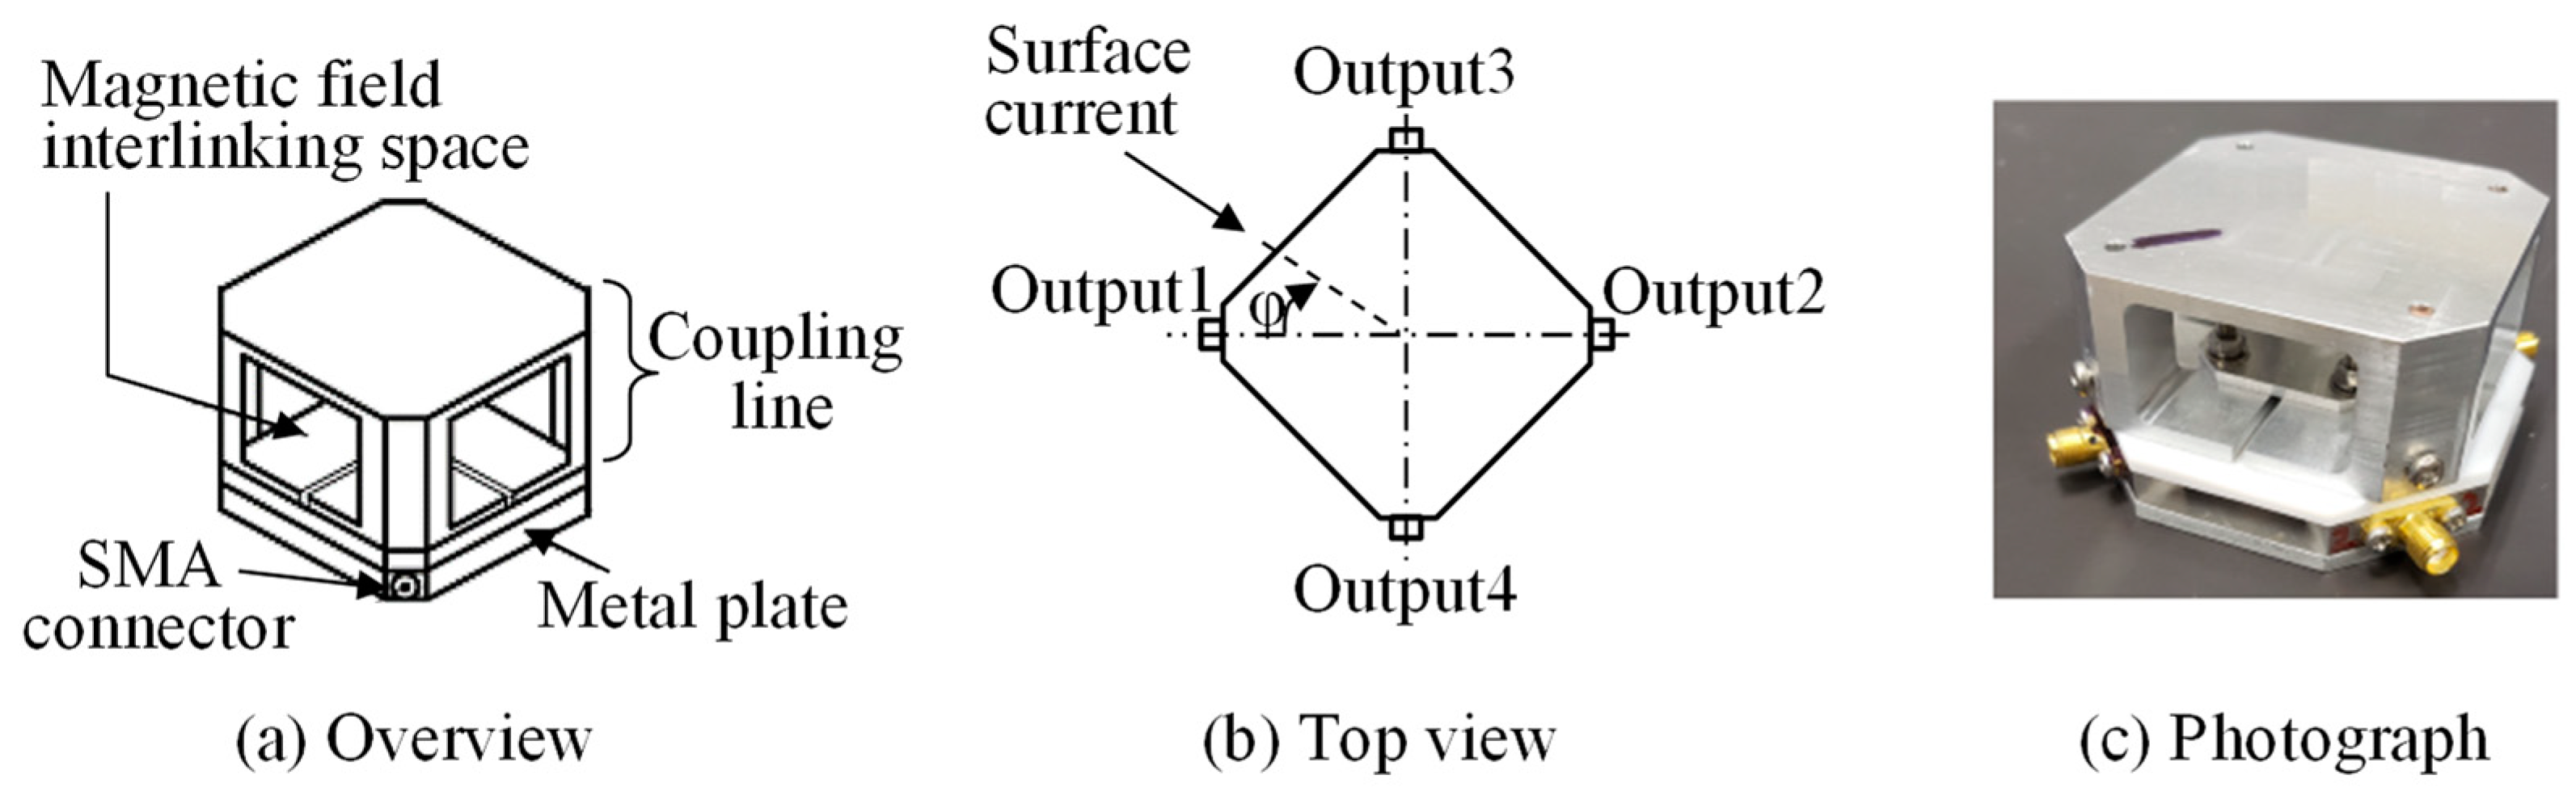
Figure 4.
Experimental setup for the evaluation of the sensor characteristics [14].
Figure 4.
Experimental setup for the evaluation of the sensor characteristics [14].

Figure 5.
Waveform of the detected signal of the surface current sensor.
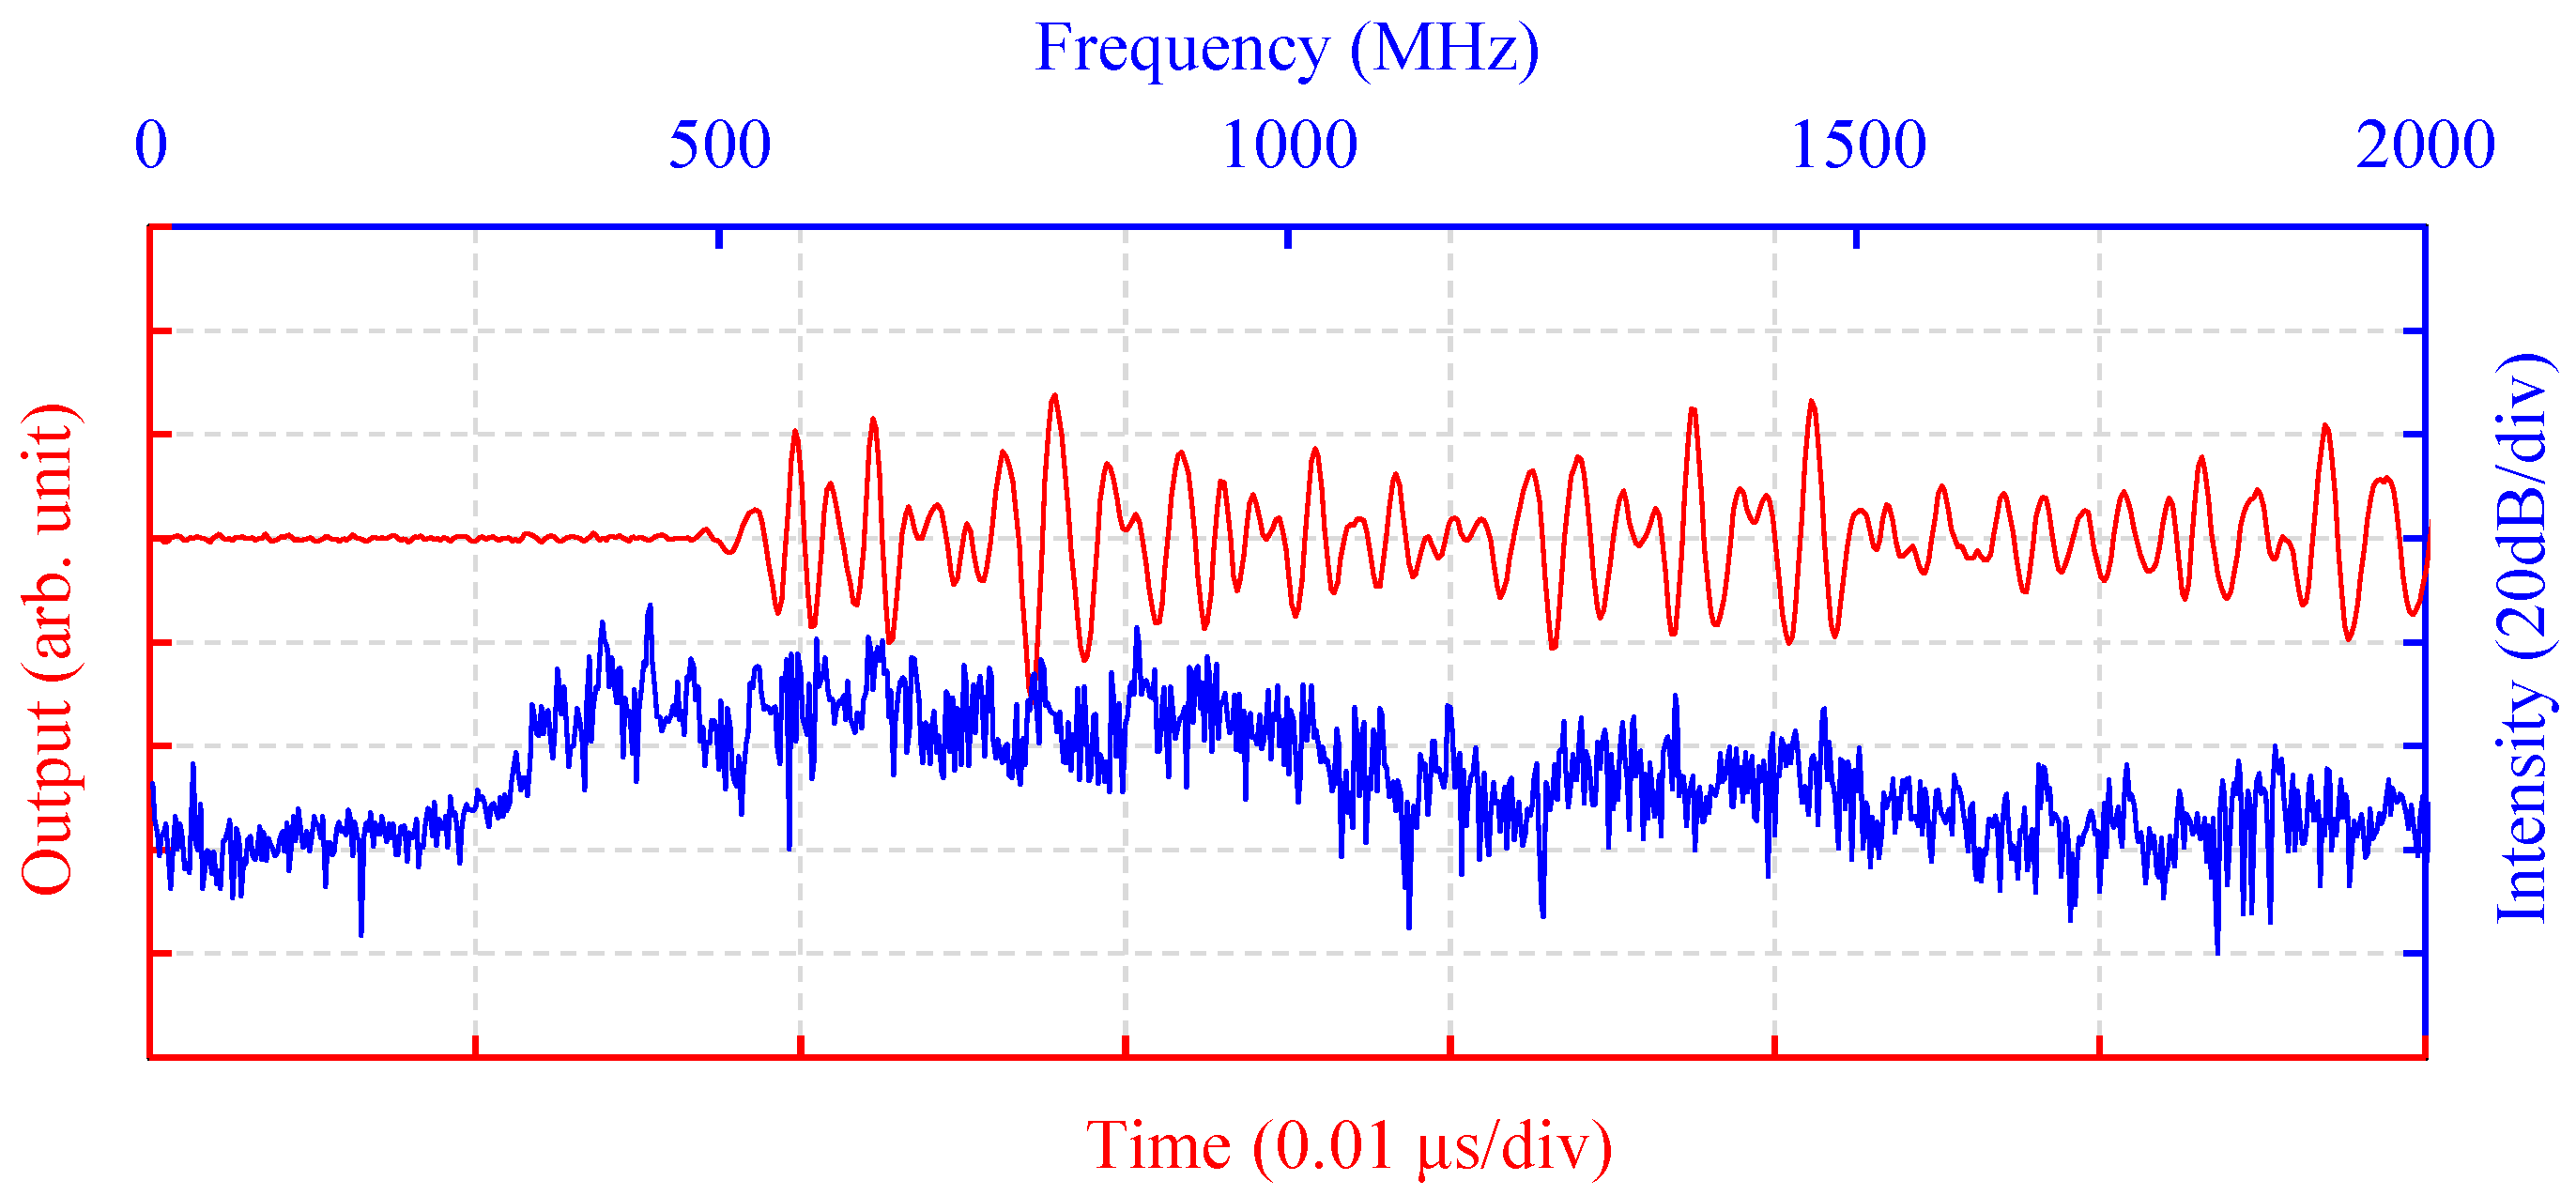
Figure 6.
Signal waveform with its partial signal energy curve.
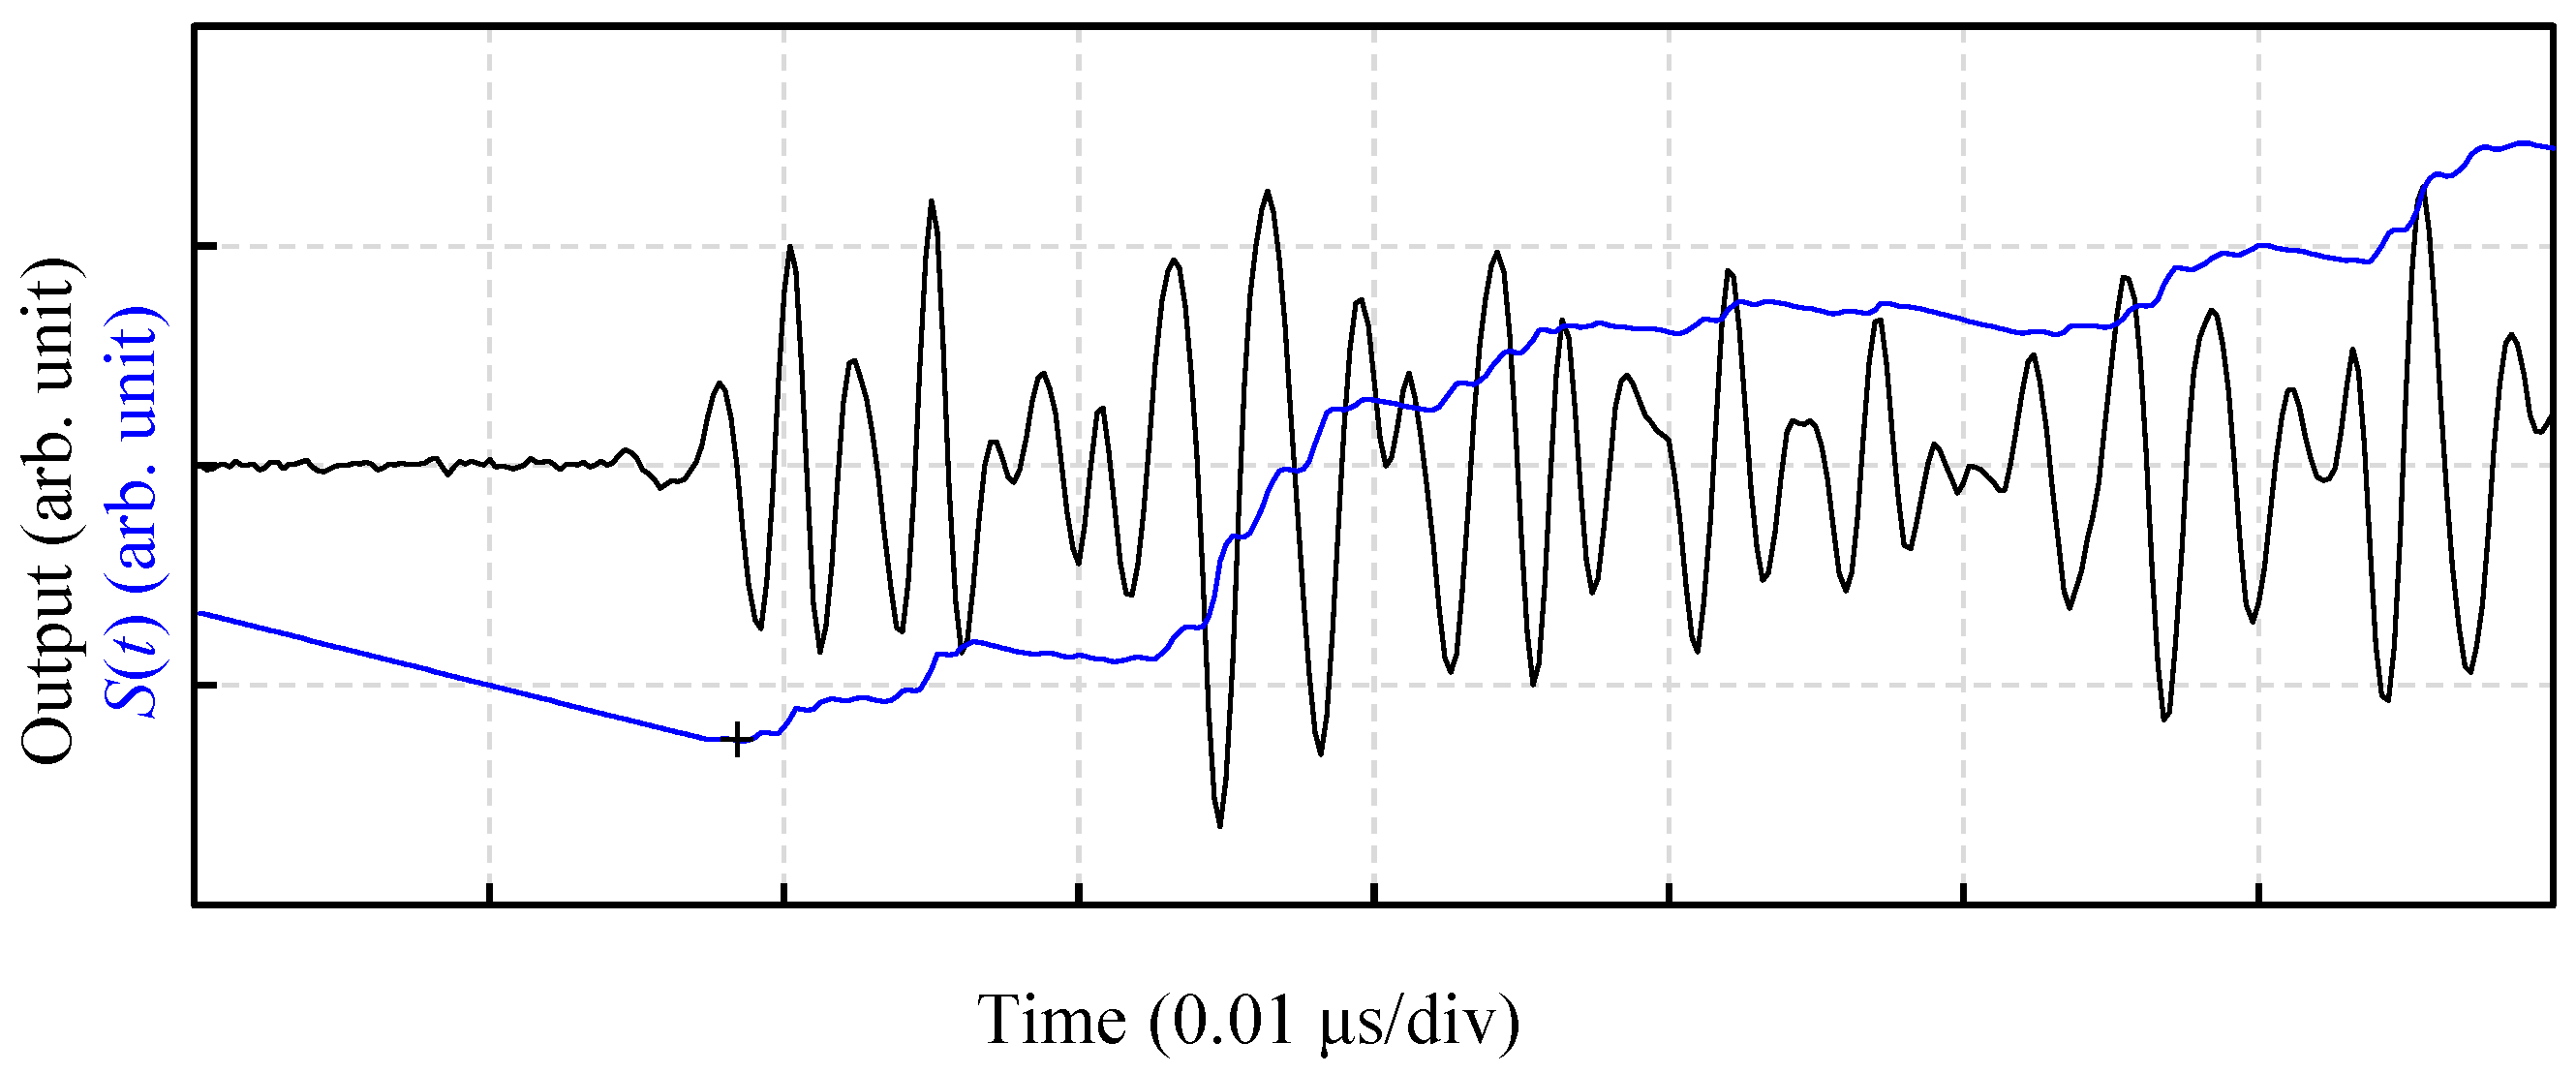
Figure 7.
Comparison of the signal waveforms of each terminal.
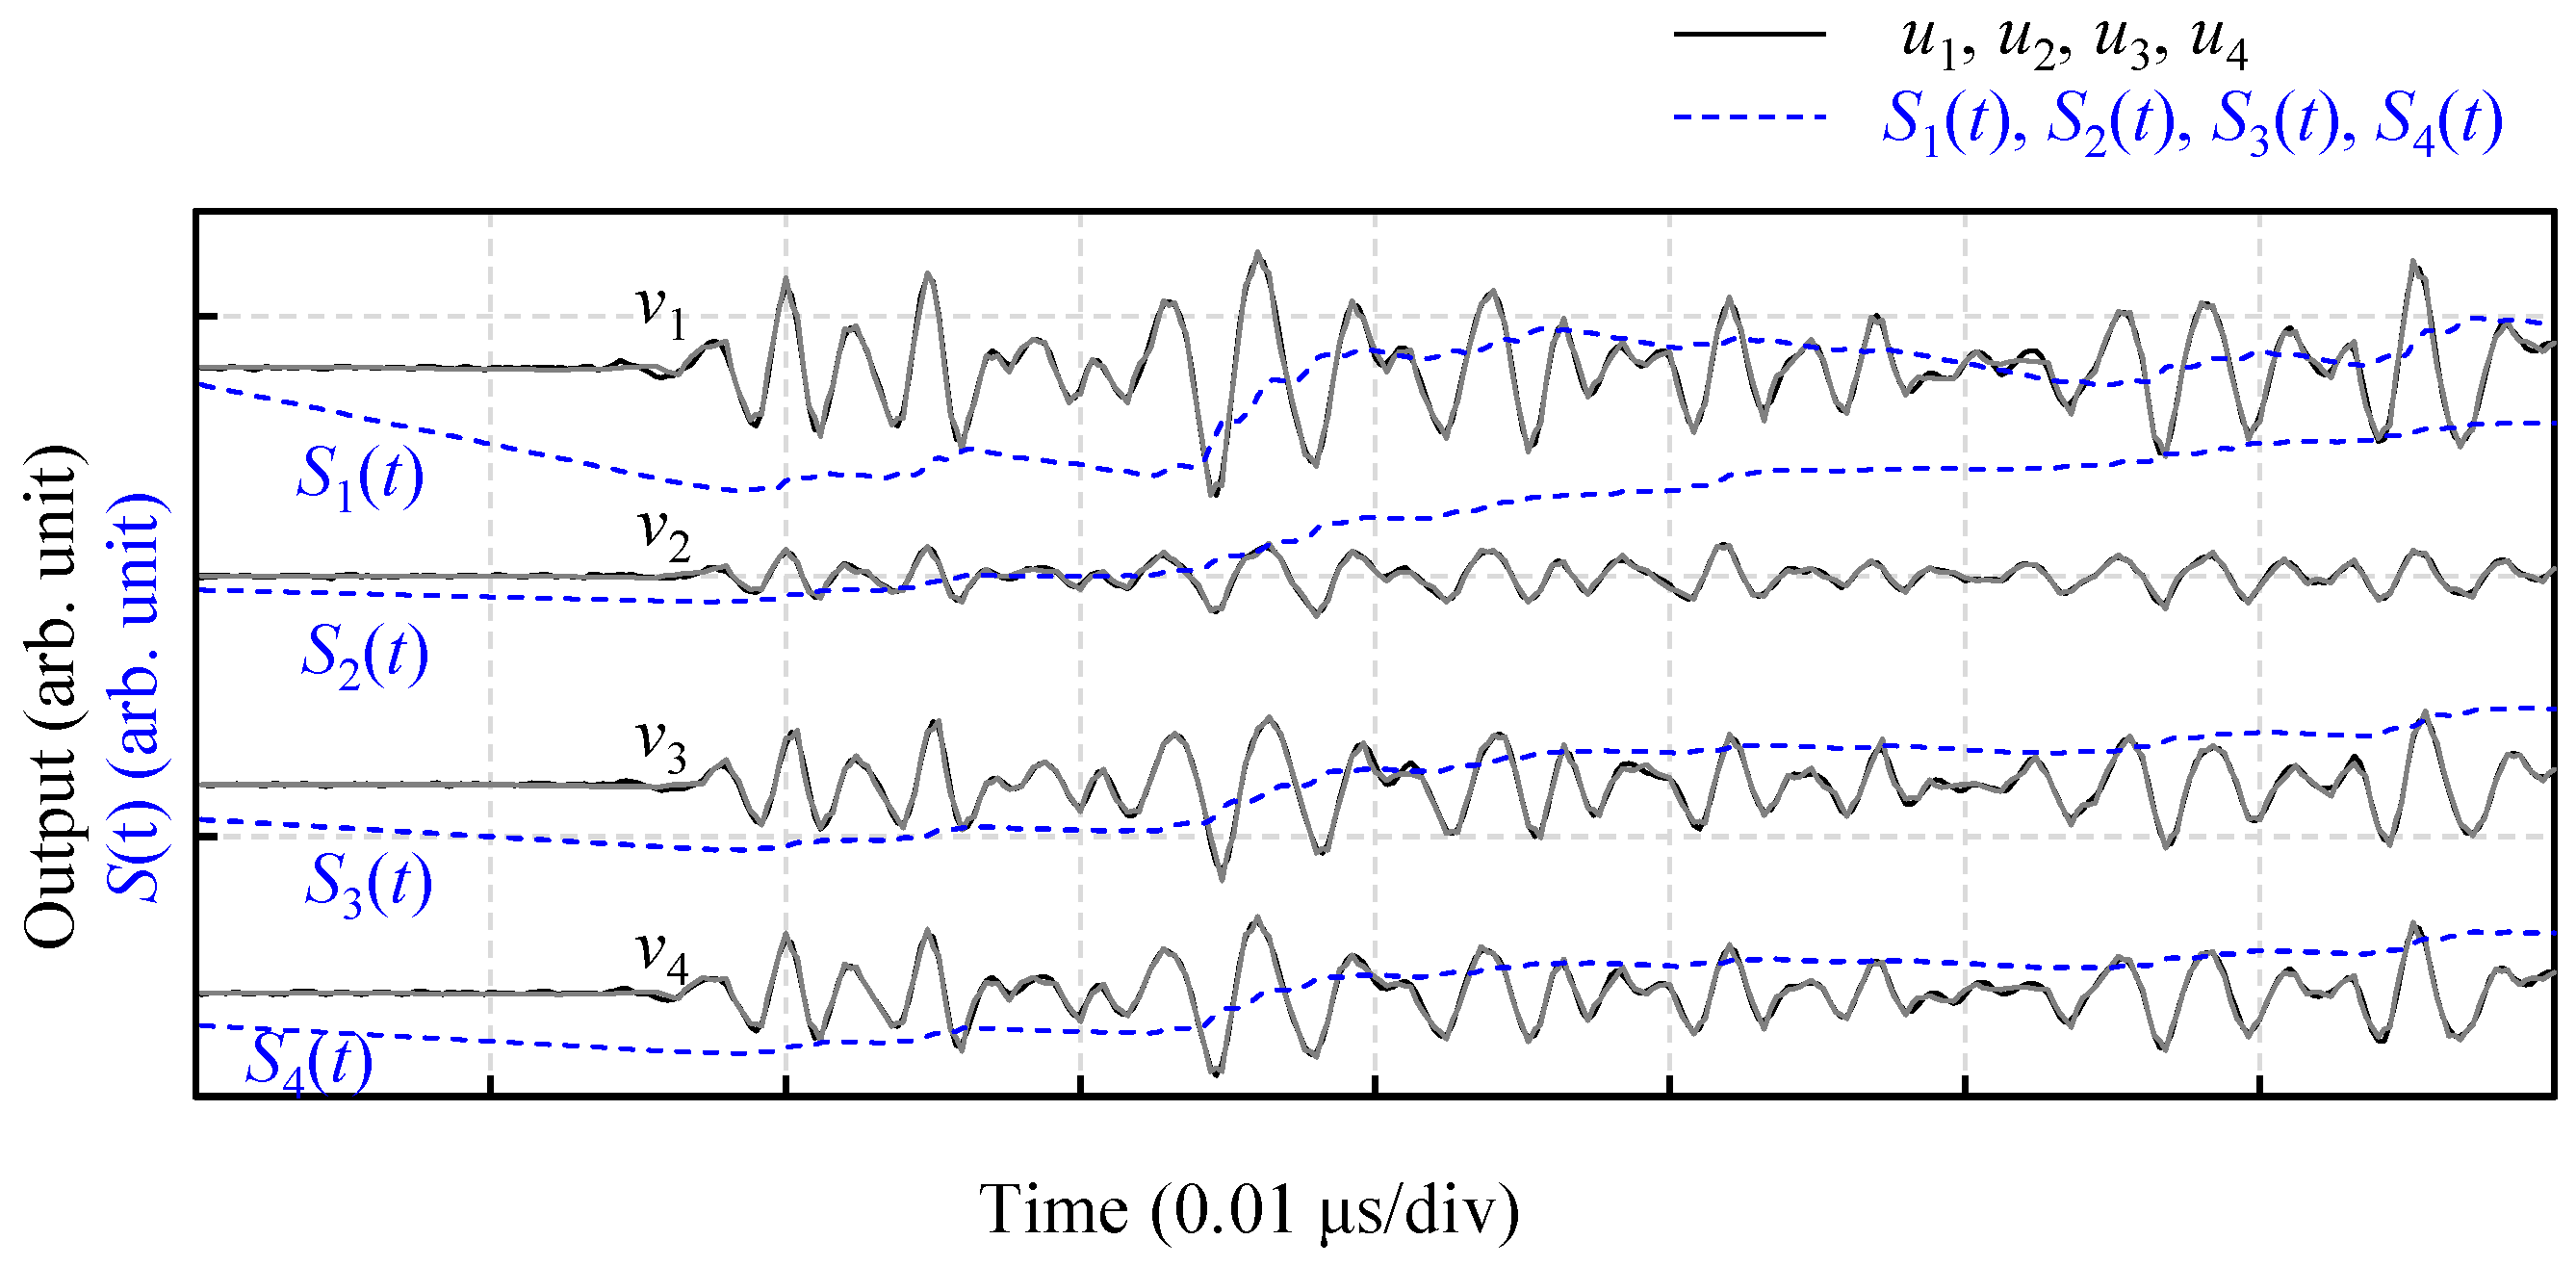
Figure 8.
Relationship between the mounting angle and output amplitude.

Figure 9.
Relationship between iq and the arrival angle of the surface current.
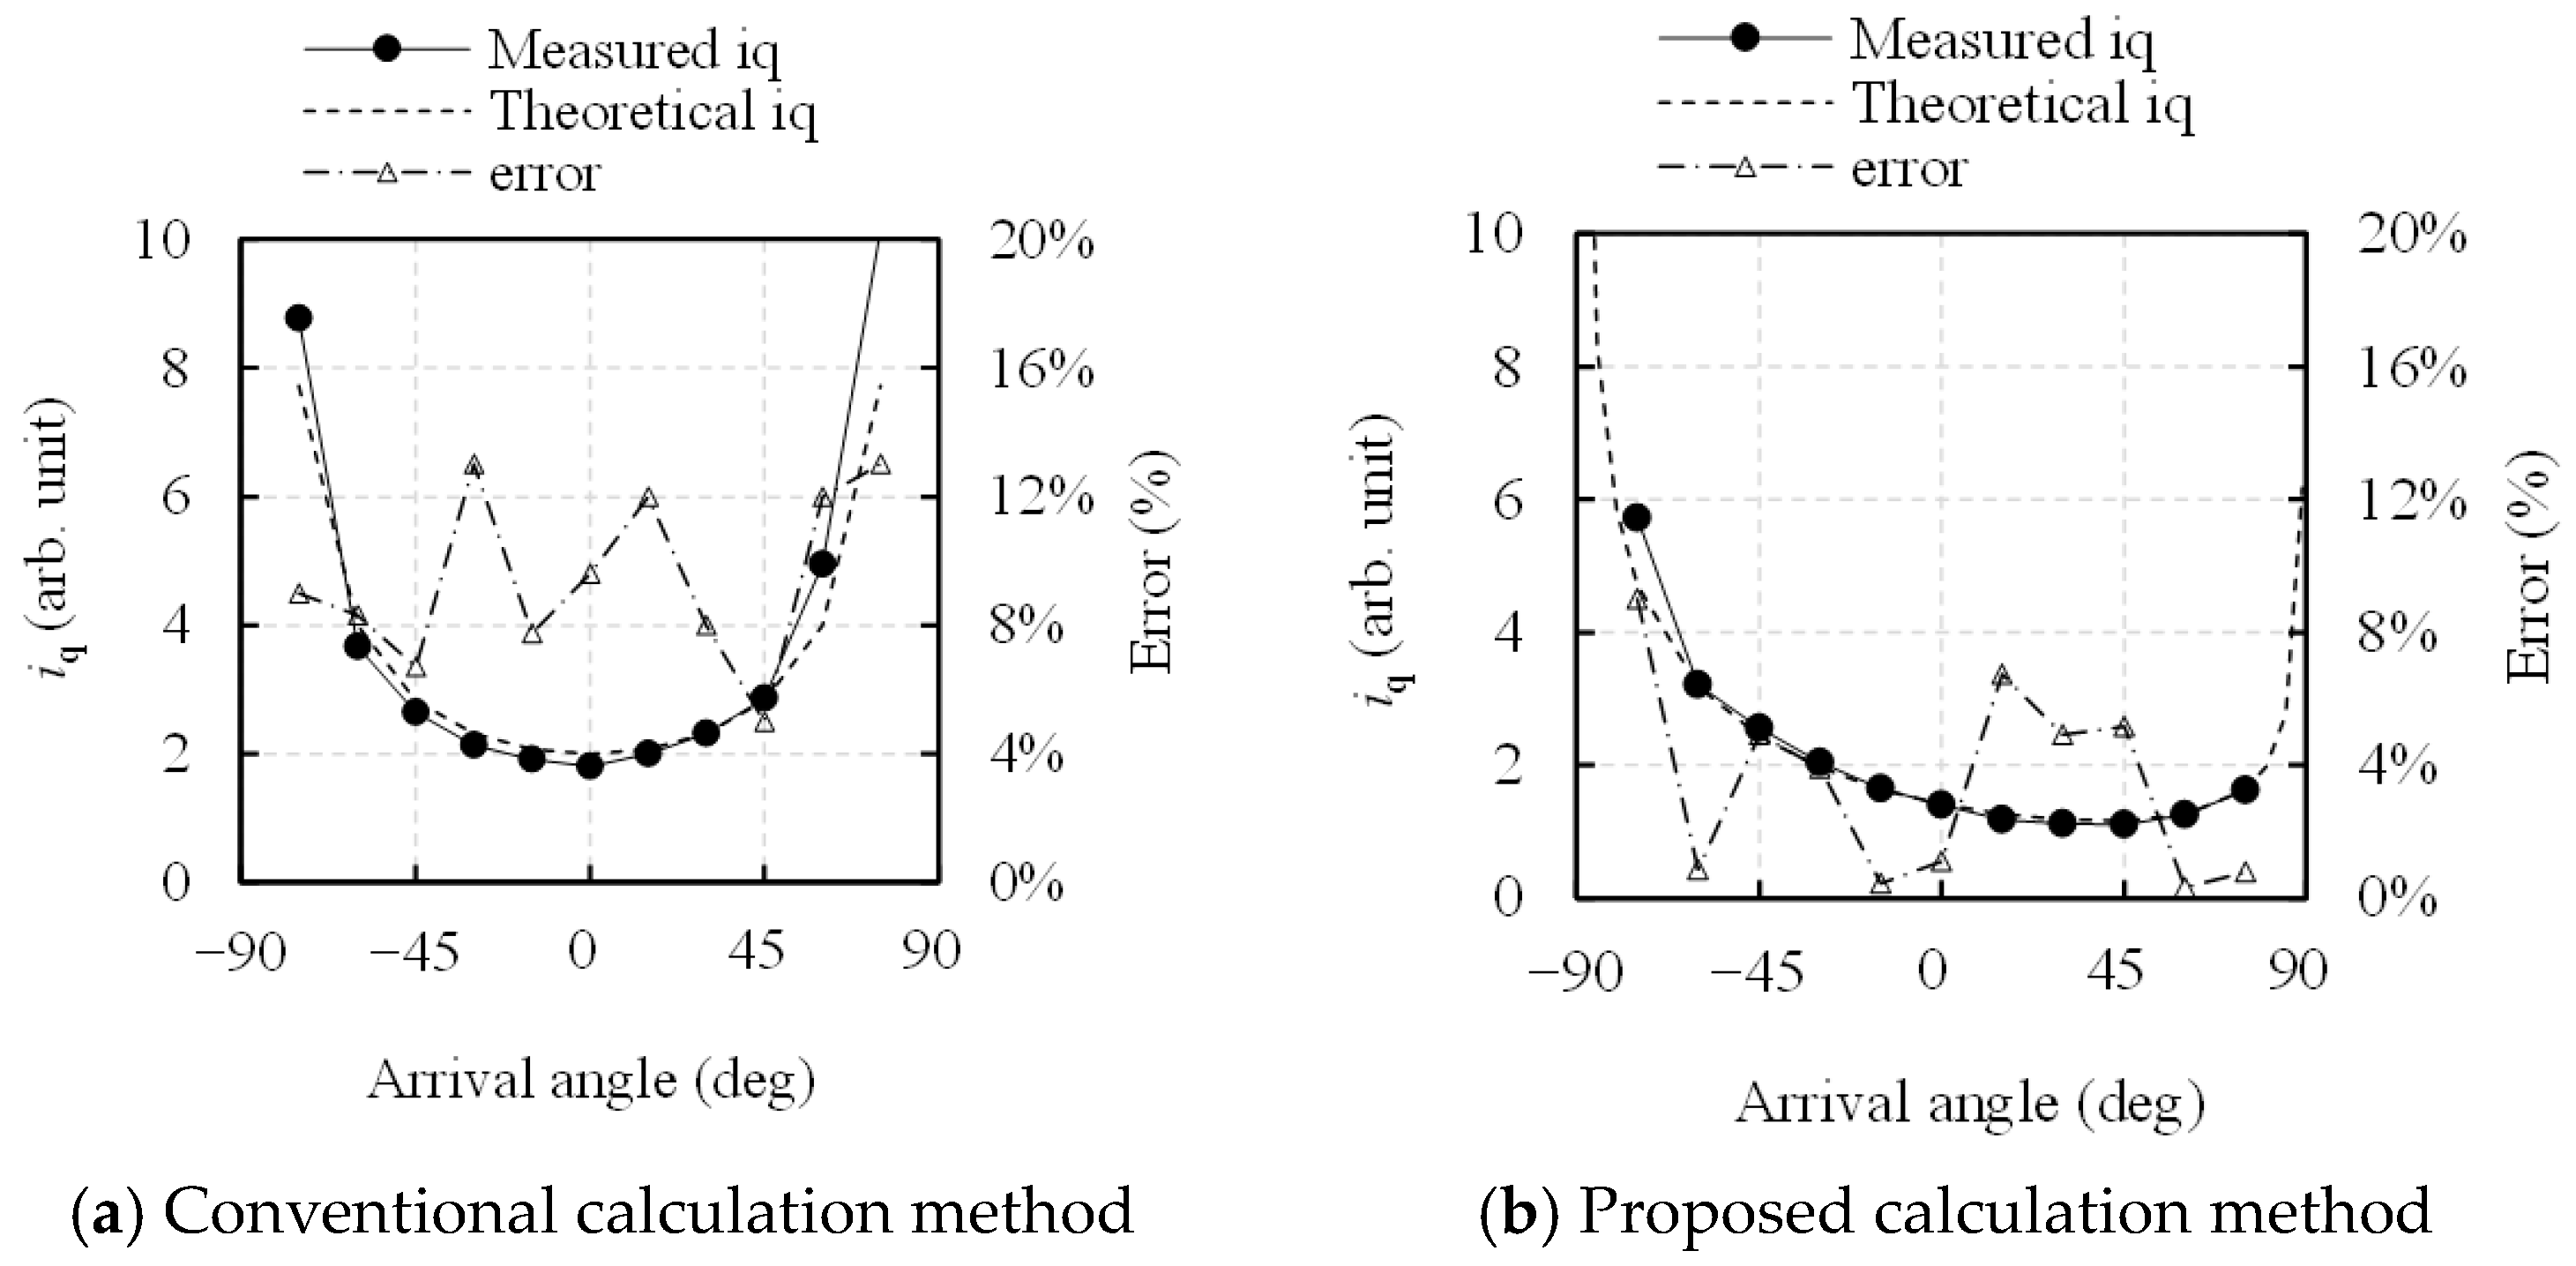
Figure 10.
Experimental setup using a rectangular enclosure [14].
Figure 10.
Experimental setup using a rectangular enclosure [14].

Figure 11.
Mounting position of the surface current sensor. The uppercase letters in the figure represent the locations of the sensors.
Figure 11.
Mounting position of the surface current sensor. The uppercase letters in the figure represent the locations of the sensors.
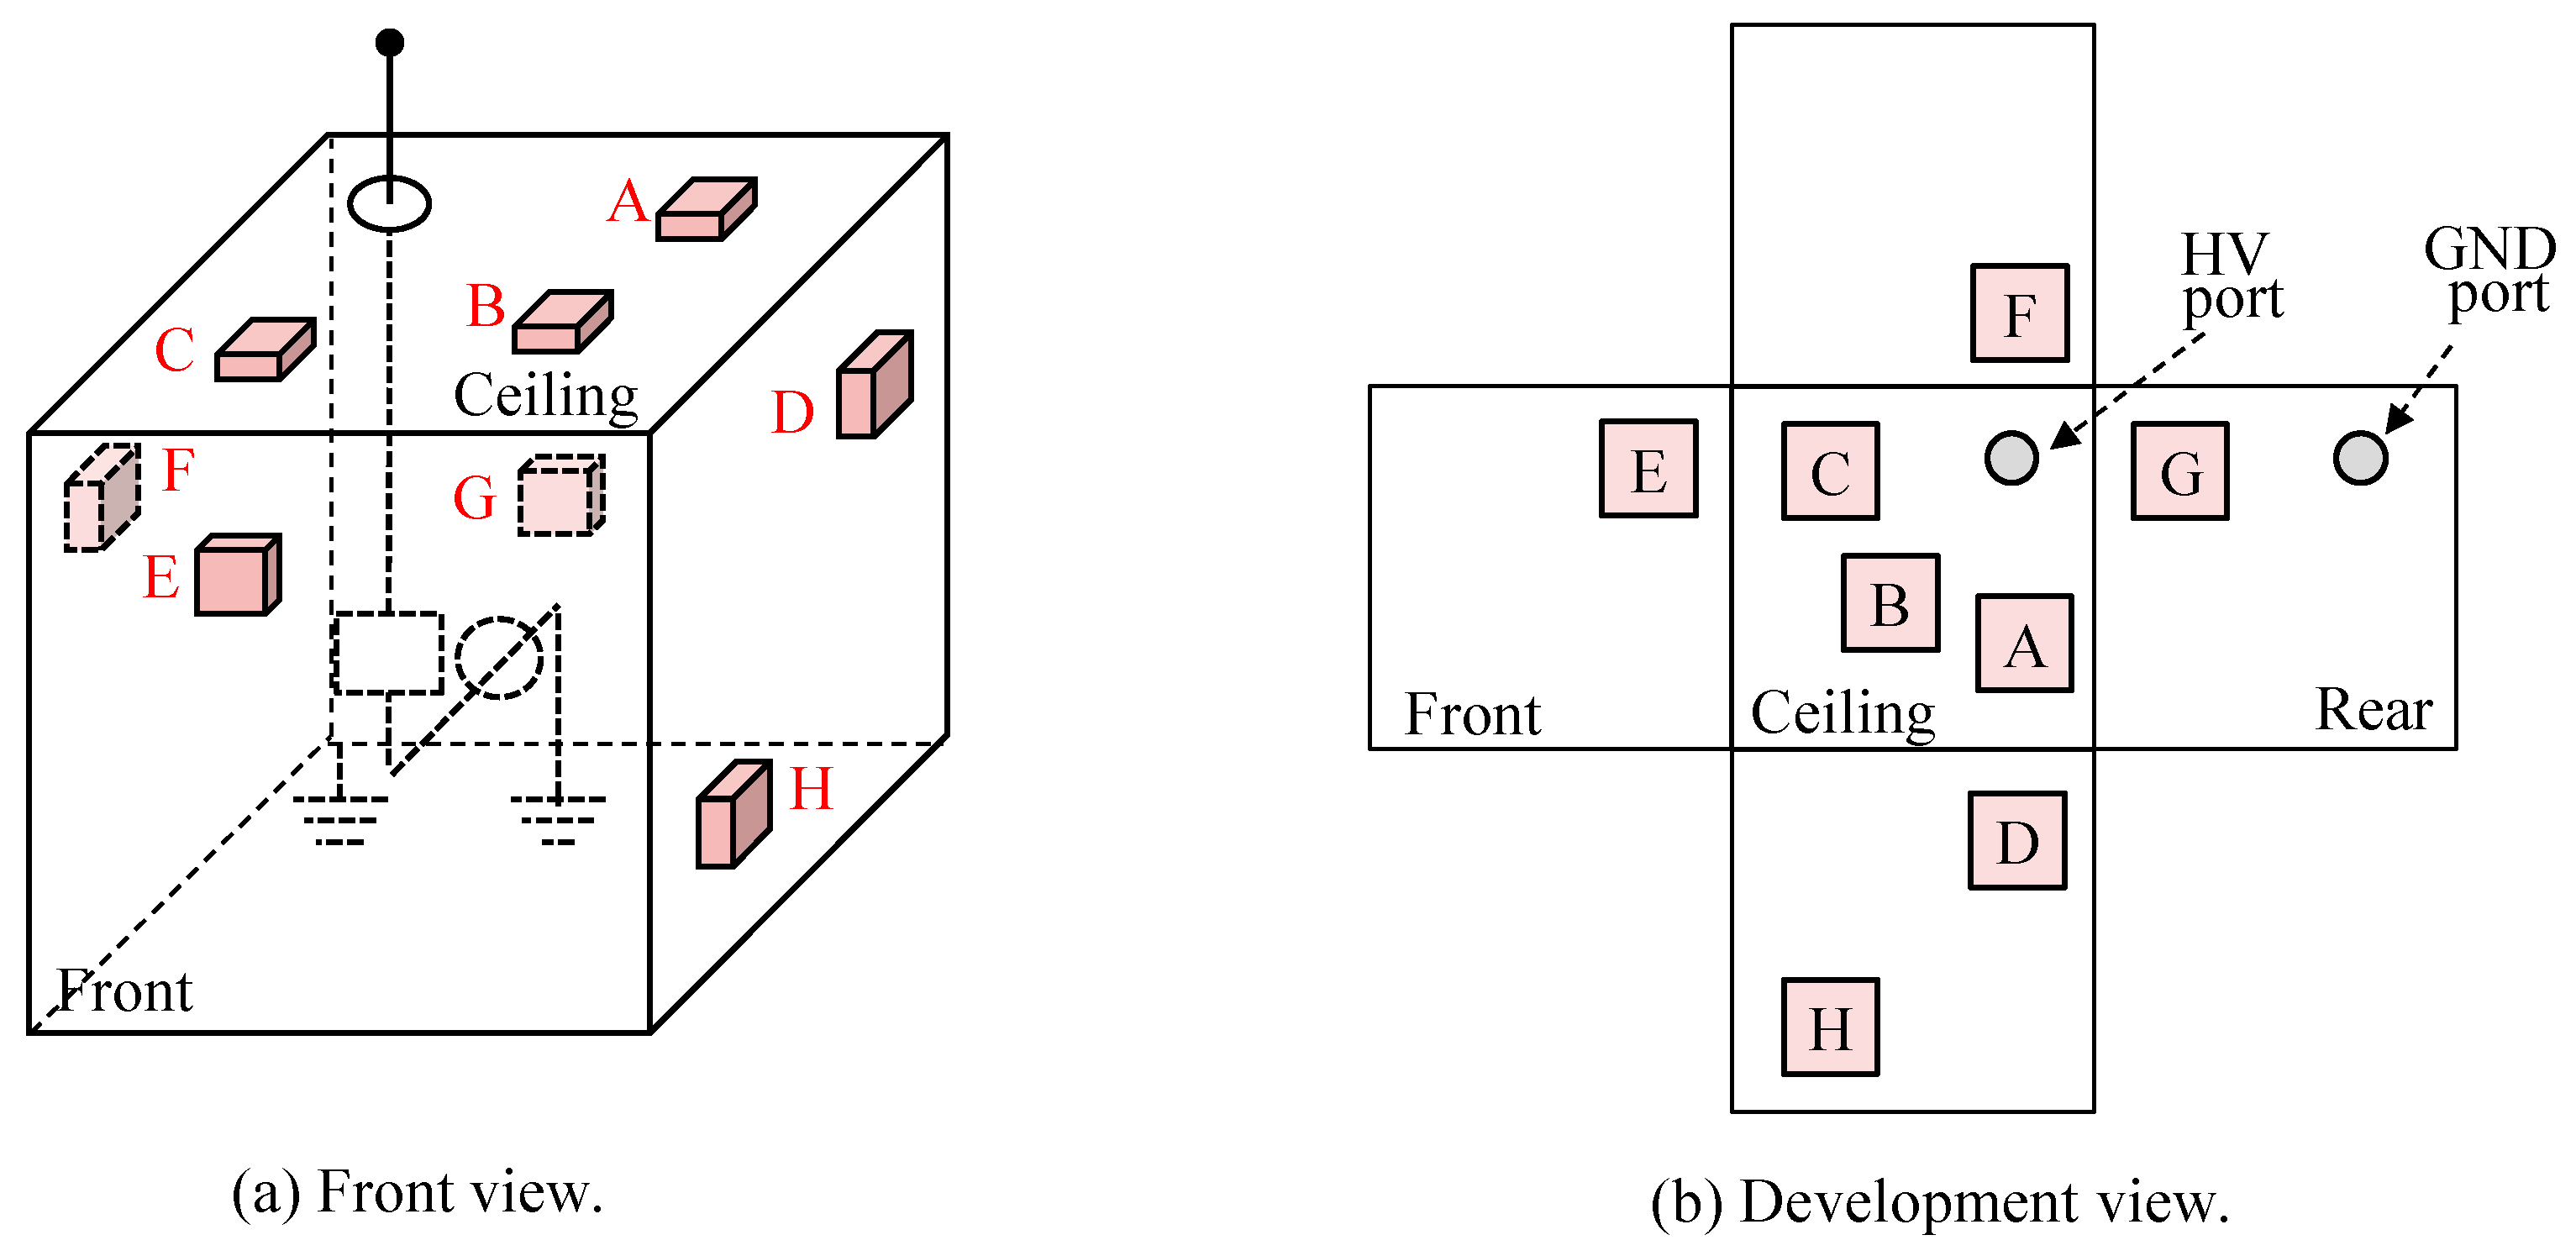
Figure 12.
Experimental results. The numbers within these circles in figure (a) represent signal strength as a percentage. They were normalized to the value at position G, where the strength was greatest. The arrows around the circle indicate the arrival directions, estimated at four sensor installation angles: 0, 90, 180, and 270 degrees.
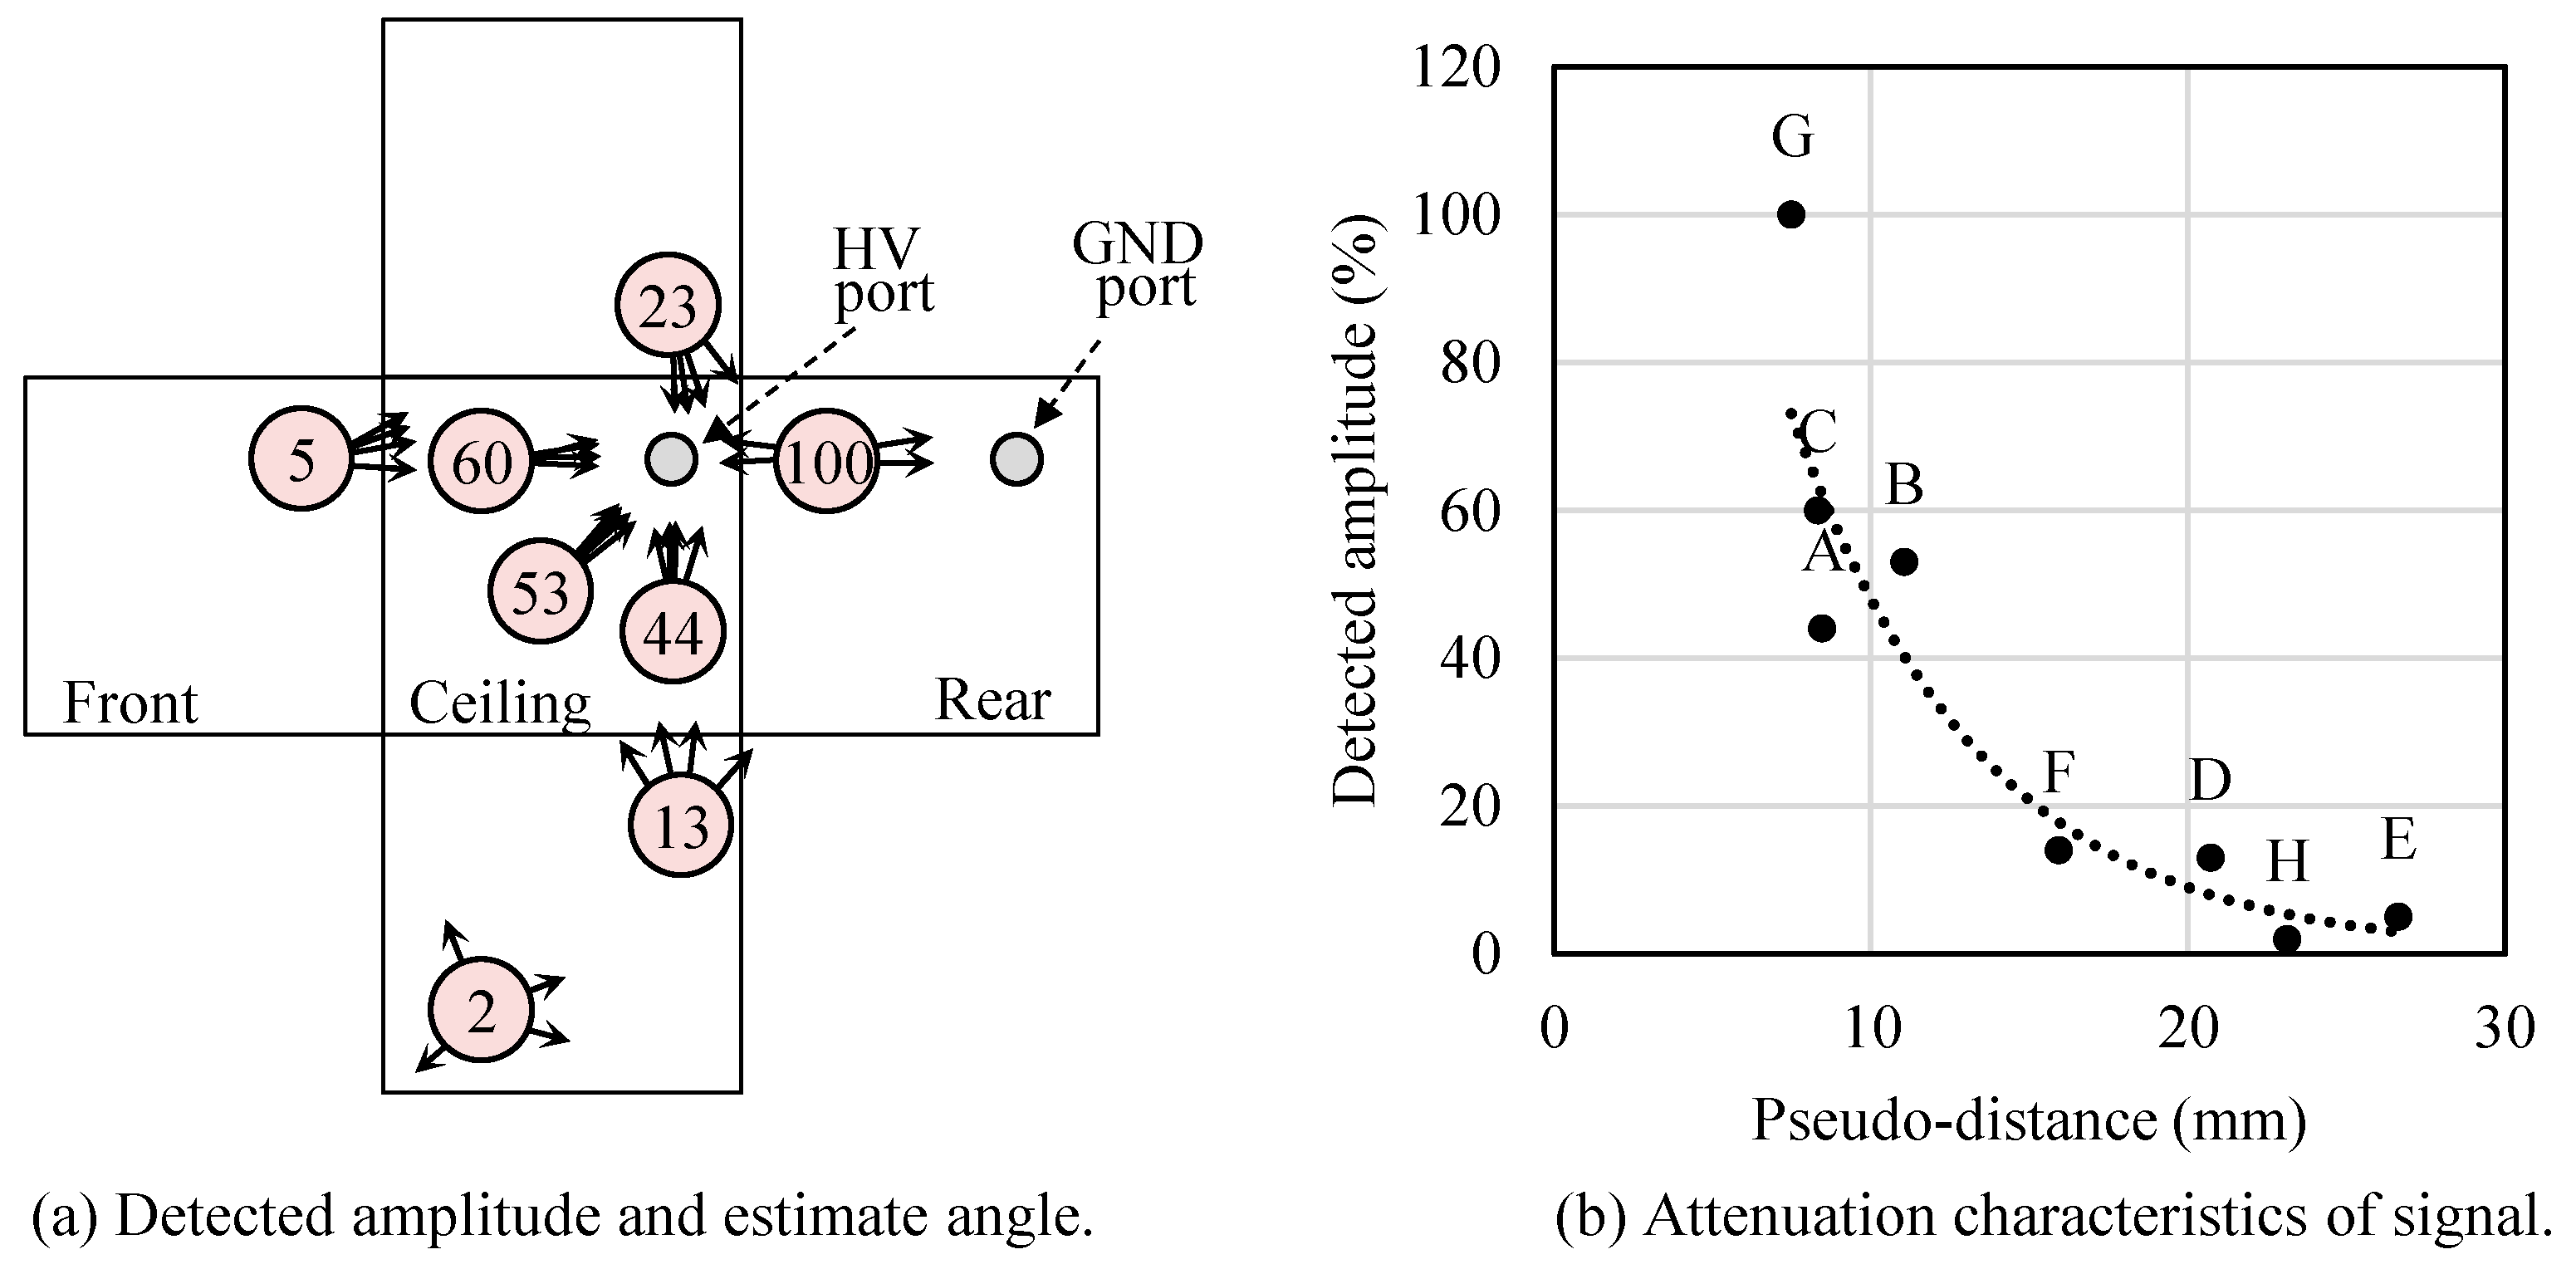
Figure 13.
Comparison of the signal waveforms before and after denoising.
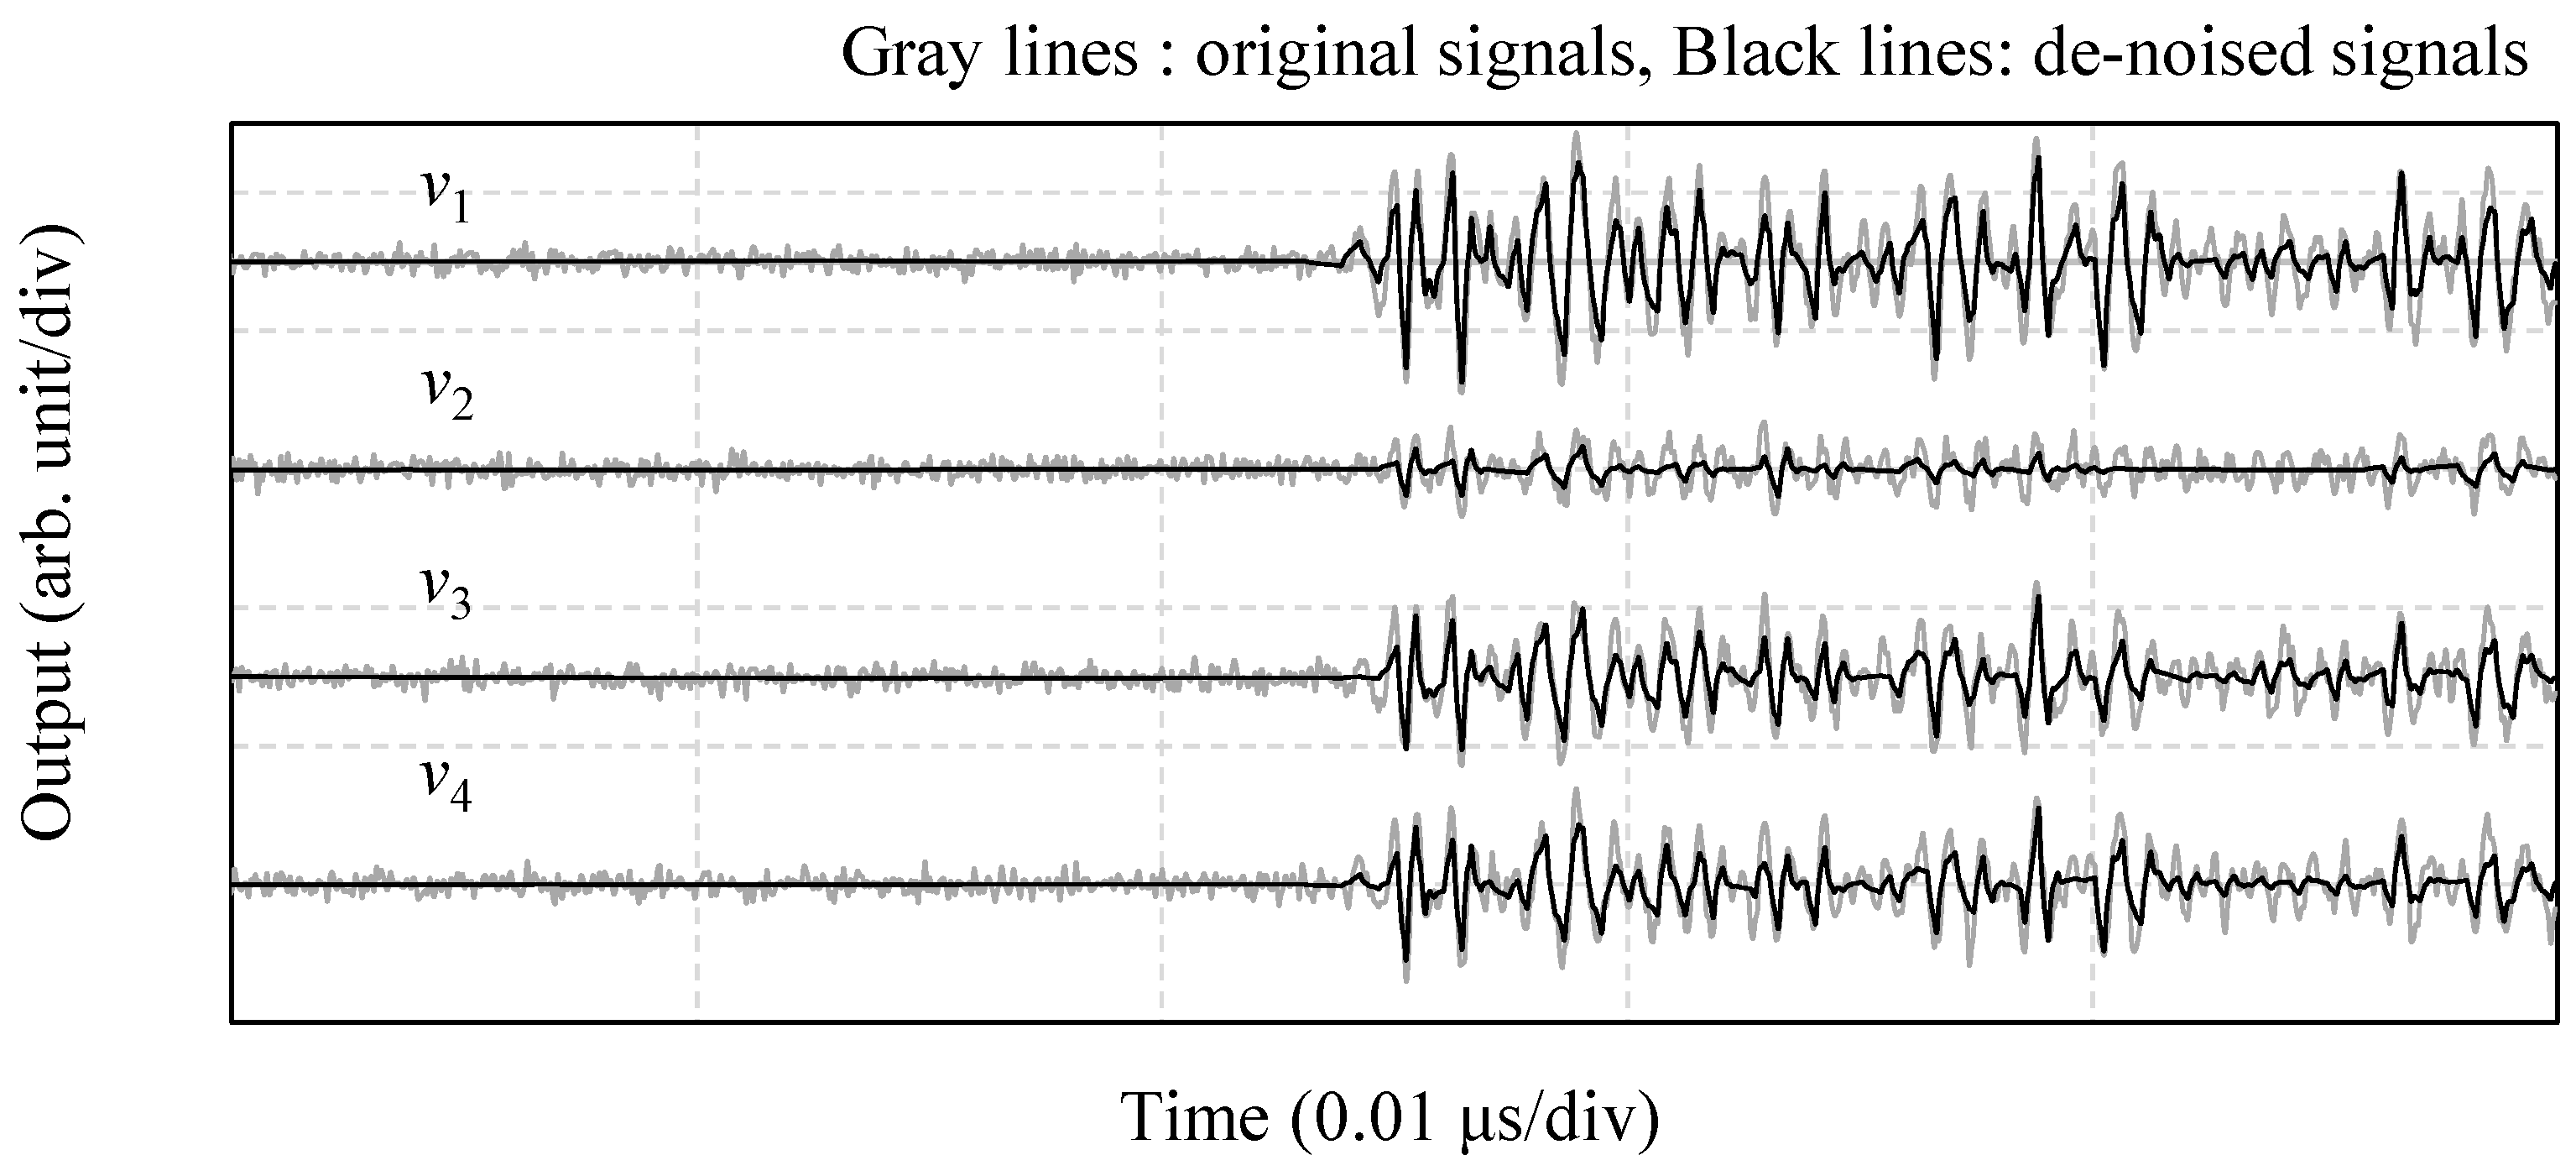
Figure 14.
Phase characteristics of the discharge.
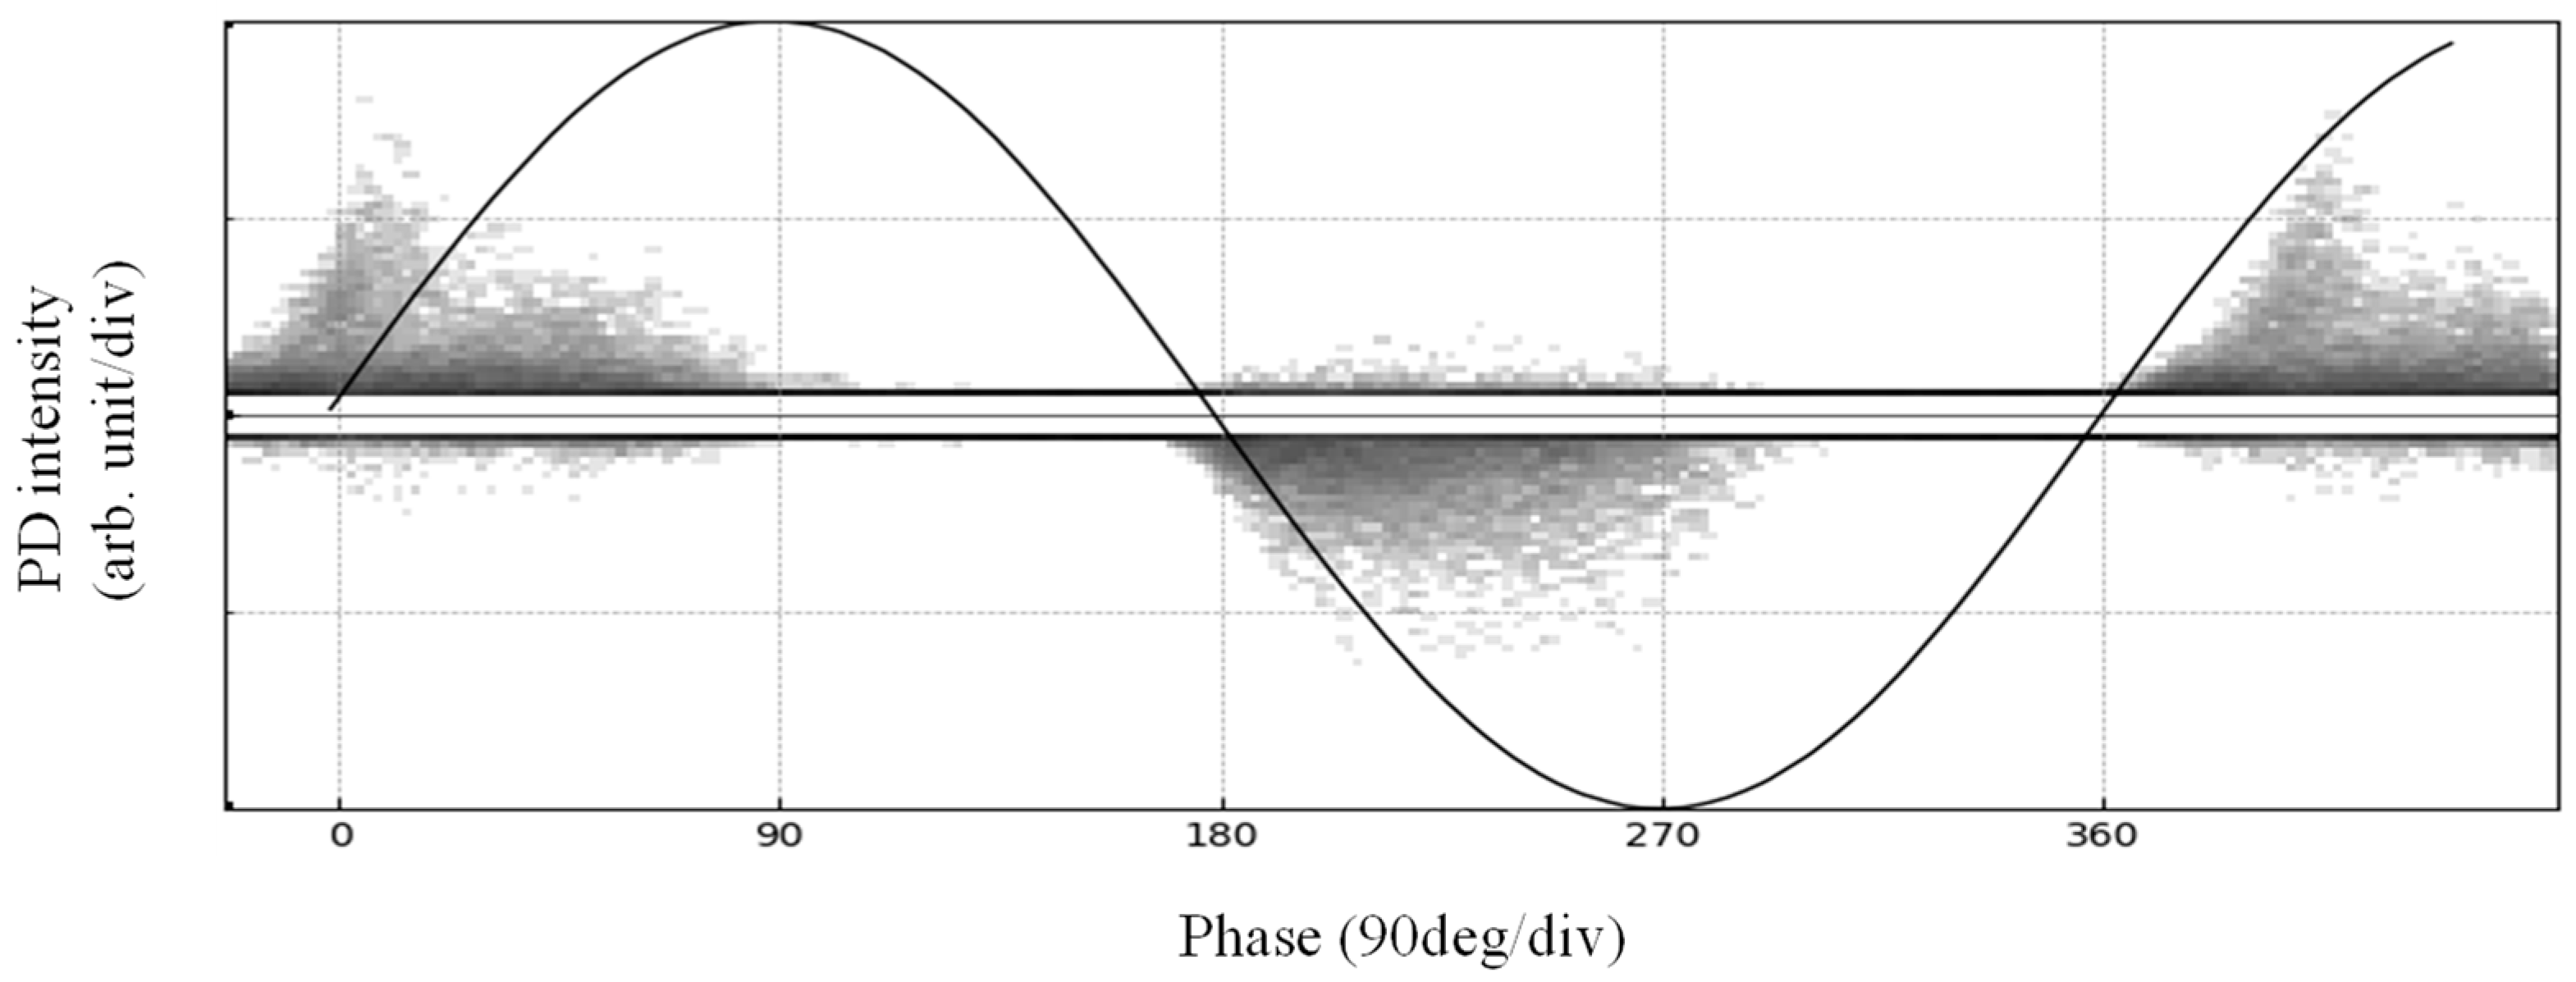
Figure 15.
Relationship between the error of the estimated angle and signal magnitude.
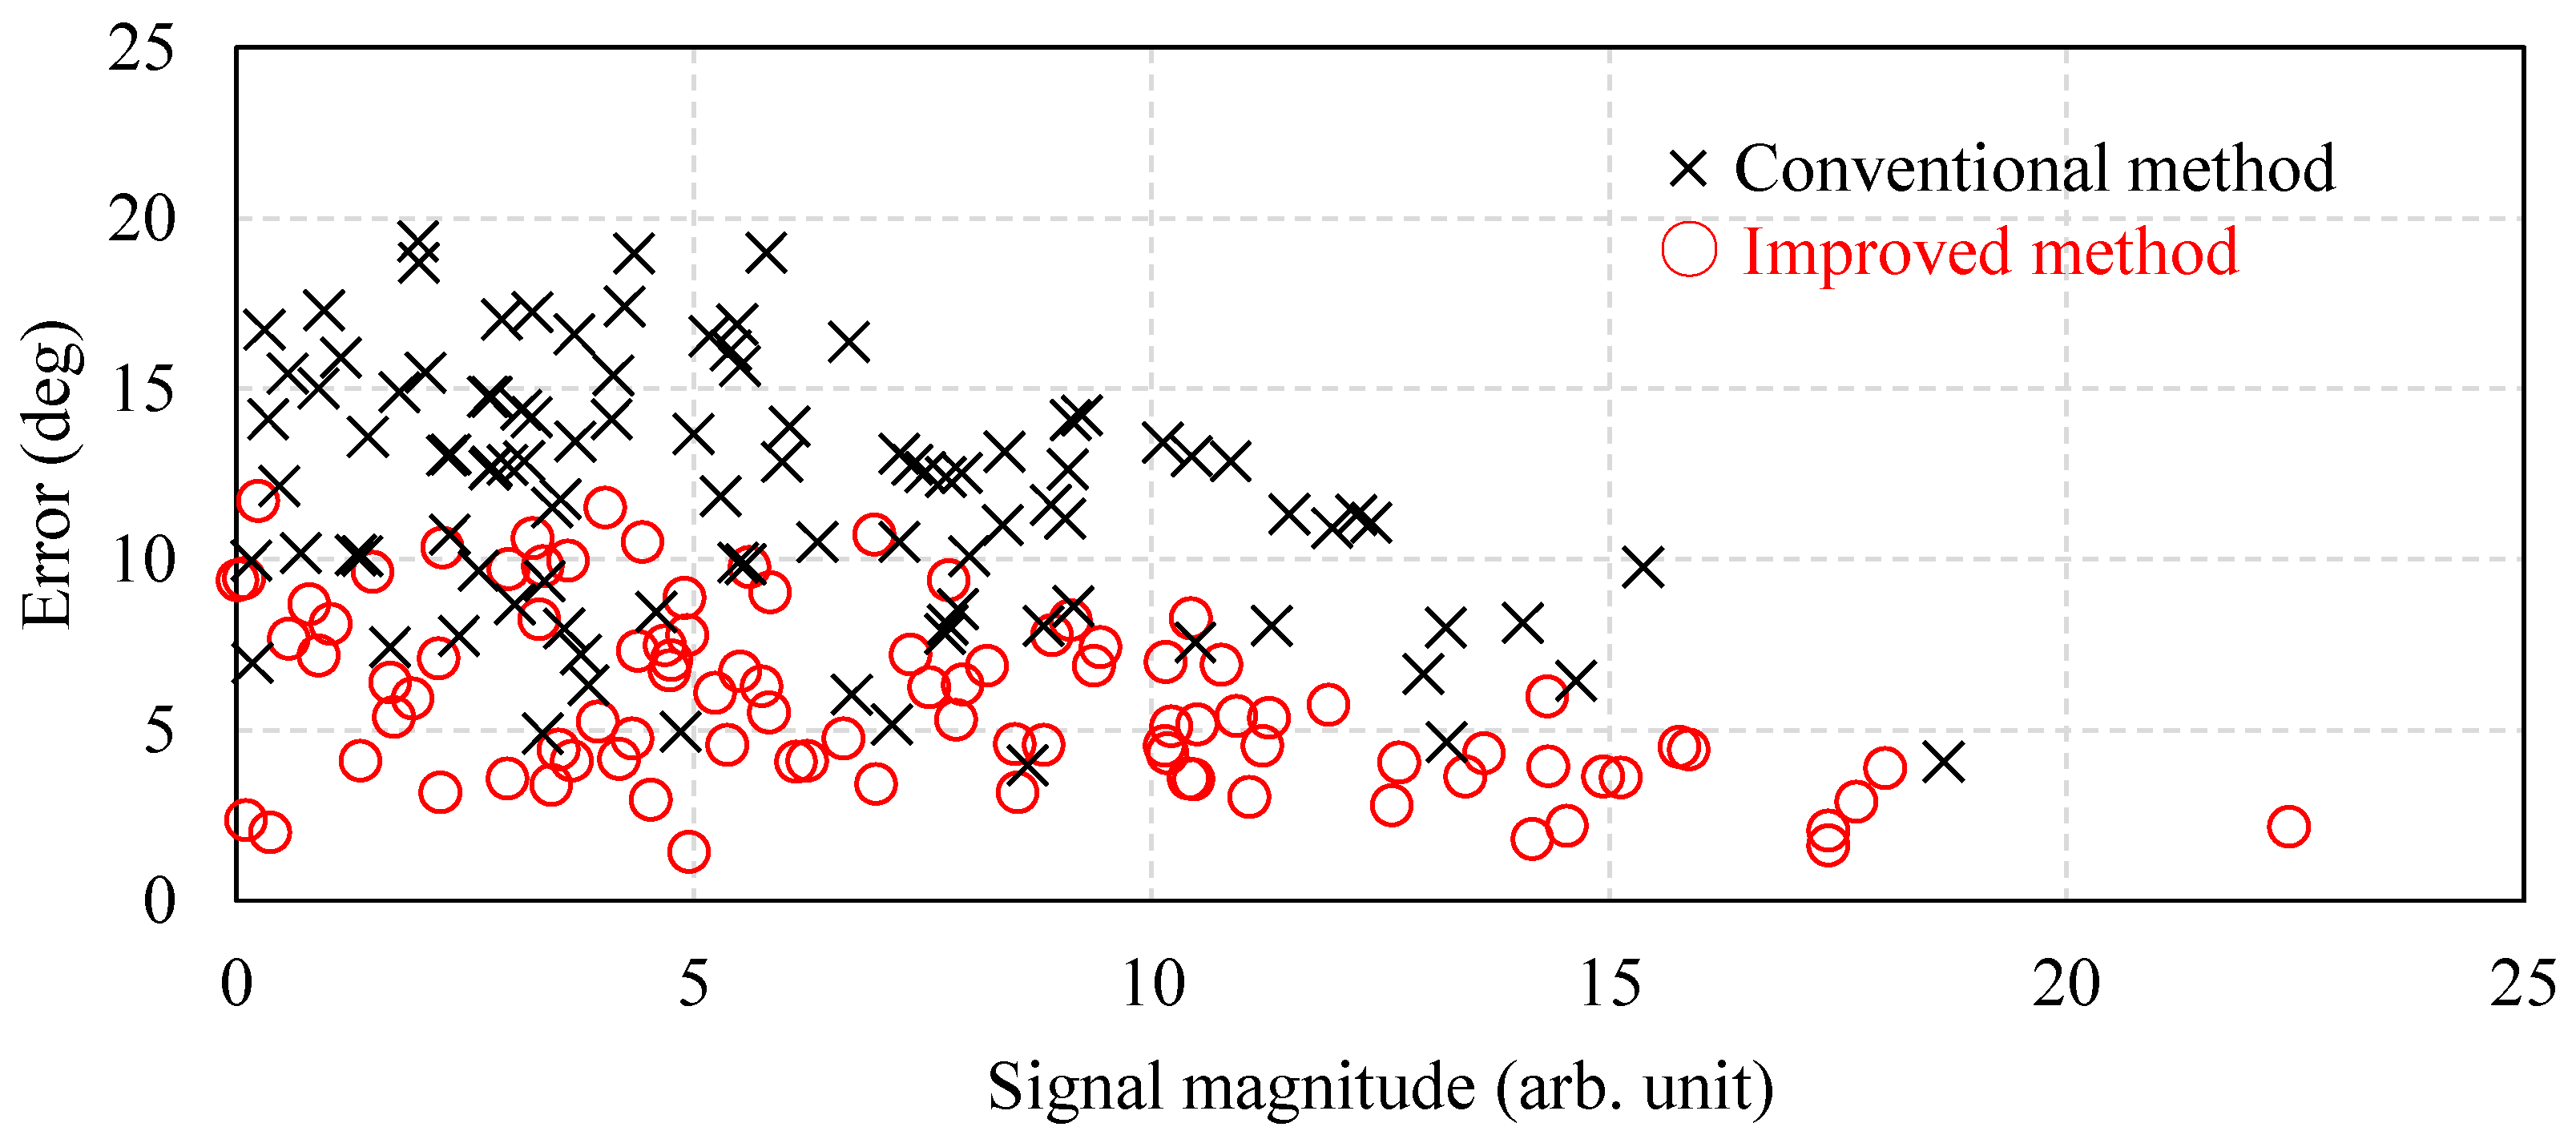
Figure 16.
Comparison of the error of the estimated angle with and without denoising.
Disclaimer/Publisher’s Note: The statements, opinions and data contained in all publications are solely those of the individual author(s) and contributor(s) and not of MDPI and/or the editor(s). MDPI and/or the editor(s) disclaim responsibility for any injury to people or property resulting from any ideas, methods, instructions or products referred to in the content. |
© 2023 by the authors. Licensee MDPI, Basel, Switzerland. This article is an open access article distributed under the terms and conditions of the Creative Commons Attribution (CC BY) license (https://creativecommons.org/licenses/by/4.0/).
Share and Cite
MDPI and ACS Style
Otake, Y.; Murase, H. Improving the Estimation of Partial Discharge Direction Using a Four-Terminal Surface Current Sensor. Energies 2023, 16, 7389. https://doi.org/10.3390/en16217389
AMA Style
Otake Y, Murase H. Improving the Estimation of Partial Discharge Direction Using a Four-Terminal Surface Current Sensor. Energies. 2023; 16(21):7389. https://doi.org/10.3390/en16217389
Chicago/Turabian StyleOtake, Yasutomo, and Hiroshi Murase. 2023. "Improving the Estimation of Partial Discharge Direction Using a Four-Terminal Surface Current Sensor" Energies 16, no. 21: 7389. https://doi.org/10.3390/en16217389
Note that from the first issue of 2016, this journal uses article numbers instead of page numbers. See further details here.