Article

Numerical Study on Heat and Mass Transfer of Evaporated Binary Zeotropic Mixtures in Porous Structure

1
Technology Center, China Tobacco Hunan Industrial Co., Ltd., Changsha 410007, China
2
School of Mechanical Engineering, Shanghai Jiao Tong University, Shanghai 200240, China
*
Author to whom correspondence should be addressed.
Energies 2023, 16(18), 6526; https://doi.org/10.3390/en16186526
Submission received: 14 August 2023 / Revised: 4 September 2023 / Accepted: 7 September 2023 / Published: 11 September 2023
(This article belongs to the Special Issue Advances in Thermal Management and Heat Transfer)

Abstract

:
This study investigates the heat and mass transfer characteristics of a binary mixture (R134a/R245fa) evaporated in a porous medium. The Eulerian model coupled with the multiphase VOF model and species transport equations is employed to establish a multi-component evaporation model. The effects of heat flux ranging from 200 kW/m2 to 500 kW/m2, porosity ranging from 0.4 to 0.6, and mass fraction ratios (R134a/R245fa) of 3:7, 5:5, and 7:3 are explored. The results indicate that an increase in heat flux contributes to an increase in the evaporation rate. For the overall evaporation rate, the evaporation rates of R134a and R245fa improve by 11.3%, 6.9%, and 16.3%, respectively, while the maximum improvement in heat transfer coefficient is only 1.4%. The maximum evaporation rate is achieved at intermediate porosity in the porous medium, and the highest heat transfer coefficient is obtained at a porosity of 0.4. With the increase in mass fraction, the evaporation rate of the corresponding species also increases, while the overall evaporation rate and heat transfer coefficient remain almost unchanged.

1. Introduction

Micro-Electro-Mechanical Systems (MEMS) have shown their extensive potential applications, such as atomization [1], wearable devices [2], electric chips [3,4], and other fields. With the development of highly integrated and miniaturized MEMS, the heat and mass issues in confined space have become increasingly prominent. Microscale flow heat transfer with phase change holds significant importance in addressing their challenges. However, the conventional flow boiling behavior in microchannels encounters severe problems such as boiling instability and local dryout [5,6]. In contrast, the fast evaporation in porous media not only reduces the boiling instability but also enhances the heat transfer performance with a high surface-to-volume ratio of a porous structure [7]. Moreover, the zeotropic mixtures exhibit a wider temperature range for heat and mass transfer compared to the pure substances and can mitigate the local intense boiling phenomena and reduce temperature gradients, resulting in a more uniform heat and mass transfer process. Hence, the thermal transport of zeotropic mixtures in porous media is currently one of the most effective approaches to achieve efficient performance for new MEMS devices with a heat and mass transfer process.
In recent decades, numerous researchers have conducted studies aiming to understand and characterize the behavior of binary mixtures heat transfer processes, including microchannel boiling [8,9], pool boiling [10,11], droplet evaporation [12,13], and capillary evaporation [14,15]. Dang et al. [16] conducted the experimental research on the flow boiling process of the pure refrigerants R134a and R245fa, as well as their binary zeotropic mixtures with varying blending ratios, in parallel and segmental microchannels. For the pure refrigerants, the heat transfer performance of R134a was found to be superior to that of R245fa. However, R134a was more prone to triggering local dryout. In most operating conditions, the heat transfer performance of binary mixtures decreases compared to that of pure refrigerants. However, for the high heat flux stage, the heat transfer performance of zeotropic mixtures demonstrates its improvement. Vajc et al. [17] performed an experiment on the pool boiling heat transfer characteristics of water–glycerol binary mixtures. They compared the variations of heat transfer coefficients for different component concentrations and found that the heat transfer coefficient decreases exponentially with the increase in glycerol mass fraction in the mixture. However, with an increase of water mass fraction, it is more likely to induce dryout. Regarding the subcooled pool boiling process, the mixtures with a higher mass fraction of glycerol demonstrate more pronounced sensitivity to the subcooling effects on their heat transfer performance. Hu et al. [18] compared the boiling heat performance of pure fluid (water), a 5% mass fraction ethanol–water solution, and a 5% mass fraction butanol–water solution. They found that, compared to the critical heat flux of water, the 5% mass fraction ethanol–water solution increases by 1.52 times, and the 5% mass fraction butanol–water solution increases by 1.91 times. They attributed the enhancement of boiling heat transfer to the Marangoni effect induced by surface tension. Canbazoglu et al. [19] experimentally investigated the enhanced solar radiation-induced evaporation process of ethanol–water mixtures in a porous medium. They comprehensively considered the effects of equilibrium vapor pressure, surface tension, dynamic viscosity, and density on the evaporation rate.
Li et al. [20] established a numerical model for the pool boiling process of a single bubble and investigated the heat transfer mechanism of an R32 + R1234yf binary mixture. In contrast to the pure refrigerants, they identified two micro-layer evaporation modes: bubble-point-controlled mode and thickness-controlled mode. Furthermore, they found that the evaporation of micro-layers can terminate due to an increase in bubble-point temperature. Yang et al. [21] developed a multiphase VOF model and an improved Lee method to investigate the non-isothermal phase-change process of NH3/H2O mixtures in a two-dimensional horizontal microchannel. They found that the approach used in the Lee model, which determines the evaporation–condensation process based on saturation temperature, is not applicable for the evaporation process of binary mixtures. Instead, the mass transfer rate should be related to the ammonia concentration gradient at the liquid–vapor interface. After modifying the Lee model accordingly, a good agreement was achieved with the experimental data. The results indicated that the heat transfer performance of NH3/H2O mixtures can exceed that of pure water under certain operating conditions.
The evaporation in porous media offers significant benefits in micro-scale thermal management systems. However, the phase change characteristics of binary zeotropic mixtures in porous media remains unclear, and the development of numerical models is not yet fully refined. Therefore, this work establishes a binary mixture multi-component evaporation model based on the VOF model coupled with the species transport model. The aim is to investigate the influence of porosity, temperature, and component concentration on the heat and mass transfer characteristics of binary zeotropic mixtures evaporated in porous media. The obtained results are expected to achieve efficient evaporation devices, as well as in the design of porous tobacco atomization structures, solar-powered evaporation power generation, and electric chip cooling, etc.

2. Governing Equation

The Eulerian model offers the distinct advantages for the complex multicomponent and multiphase flow problems, enabling the solving of mass, momentum, and energy equations for each phase. In this model, both the flow and heat transfer equations are governed by the Eulerian model. However, the multi-fluid VOF model offers a framework for coupling the VOF and Eulerian multiphase models. This integration enables the utilization of specific discretization schemes and sharp interface regimes. By addressing the shared velocity and temperature formulation, this approach overcomes certain limitations of the VOF model. The multi-fluid VOF model offers precise interface sharpening schemes (Geo-Reconstruct) for volume friction.
Continuity equation:
t α q ρ q + α q ρ q v q = p = 1 n m ˙ p q m ˙ q p + S q
where v q is defined as the velocity of phase q, α donates the volume fraction, ρ is the density of corresponding phase, m ˙ p q represents the mass transfer from phase p to phase q, while m ˙ q p represents reverse transfer from phase q to phase p, and S q represents the source term.
Momentum equation:
t α q ρ q v q + α q ρ q v q v q = α q p + τ ¯ q + α q ρ q g + p = 1 n R p q + m ˙ p q v p q m ˙ q p v q p + F q
where τ ¯ q is expressed as the stress–strain tensor of phase q. μ q and λ q are the shear and bulk viscosity for phase q, respectively. g is the acceleration of gravity. The definition of F q is the force term, including the external body force, the lift force, the wall lubrication force, etc. R p q represents the interaction force between the phases. v p q and v q p are expressed as the interphase velocity, which is related to the mass transfer process.
Energy equation:
t α q ρ q e q + v q 2 2 + α q ρ q v q h q + v q 2 2 = α q k e f f , q T q h j , q J j , q + τ ̄ e f f , v q j + p = 1 n Q p q + m ˙ p q h p q m ˙ q p h q p + p α q t + S q
where k e f f , q is the effective thermal conductivity, e q is the internal energy, T is the temperature, h p q is the interphase enthalpy, h j , q is enthalpy of species J in phase q, and J j , q is the diffusive flux of species J in phase q. S q represents the source term, and Q p q is defined as the intensity of heat exchange between two phases.
The continuum surface force (CSF) model can be adopted to obtain the surface tension force, which has a significant effect on the liquid–vapor interface. The surface tension force is expressed as follows:
F = σ κ v α 2 ρ ρ l + ρ v
The curvature of the liquid–vapor interface is calculated as:
κ v = α α
The Lee model is applied for the phase change modeling. In the evaporation and condensation process, the mass transfer process through the liquid–vapor interface is determined by the saturation temperature ( T s a t ). When the fluid temperature ( T l ) exceeds the saturation temperature, the evaporation process occurs, and mass transfer is calculated using Equation (4). Conversely, the condensation occurs when the temperature is lower than the saturation temperature.
m ˙ p q = r l α l ρ l T l T s a t T s a t
m ˙ q p = r v α v ρ v T s a t T v T s a t
where r l and r v is defined as the evaporation/condensation relaxation coefficient, which is related to the factors such as fluid, geometrical structure, grid quantity, etc. Based on the description in the literature [22], r l = r v = 100 is selected as the parameter to determine the mass transfer during the evaporation and condensation process.
This work focuses on the exploration of the heat transfer characteristics by utilizing a binary mixture (R134a/R245fa) as the working fluid. Consequently, during the investigation of phase change processes, the two components of the mixture are treated as a unified phase using the mixture rule. The Species Transport Equations are applied to govern the transport of the two components.
t ρ Y i + ρ v Y i = J i + R i + S i
where Y i represents the species, J i is expressed as the diffusion flux of species in laminar flow. R i is the net rate of production of species i by chemical reaction and S i is the rate of creation by addition from the dispersed phase, which are both equal to zero in this model. D i , m and D T , i denote the mass diffusion coefficient and the thermal diffusion coefficient of species (i), respectively.
J i = ρ D i , m Y i D T , i T T
To enhance the computational efficiency of multi-component phase change processes, the porous structure is approximated as a continuum media in the present model. By defining the porosity and solid material, the characteristics of a porous media are imparted to the continuum medium. Consequently, the effective thermal conductivity, the relative viscosity, the apparent velocity, and the other parameters need to be modified accordingly. Furthermore, to improve the accuracy, the viscous resistance factor and the inertia resistance factor are introduced as the additional corrections to accurately depict the transport behavior of fluids within the porous media. These two factors are determined by the Ergun equation, with a pore diameter of 20 μm. Based on the different porosities of 0.4, 0.5, and 0.6, the viscous resistance factors are calculated as 2.1 × 10¹², 7.5 × 10¹¹, and 2.8 × 10¹¹, while the inertia resistance factors are calculated as 1.6 × 10⁶, 7 × 10⁵, and 3.2 × 10⁵, respectively. Moreover, the relative permeability in porous media based on the Corey power law model also plays a significant role in the fluid transport. Due to the capillary forces generated at the solid–liquid interface, the influence of capillary forces becomes more pronounced as the pore size decreases. In this case, the Skjaeveland model, which considers both inflow and outflow processes, is adopted to describe the capillary pressure effect of fluids in porous media.
P c , q = P e , w α q α q r 1 α q r a w P e , n w 1 α q α p r 1 α p r a n w
where P c , q denotes the capillary pressure of phase q. The subscripts “w” and “nw” represent the wetting and the non-wetting, respectively. P e , w and P e , n w are the inlet pressure. a w and a n w are the pore index, which is closely related to the pore scale and the uniformity of distribution.

3. Numerical Model

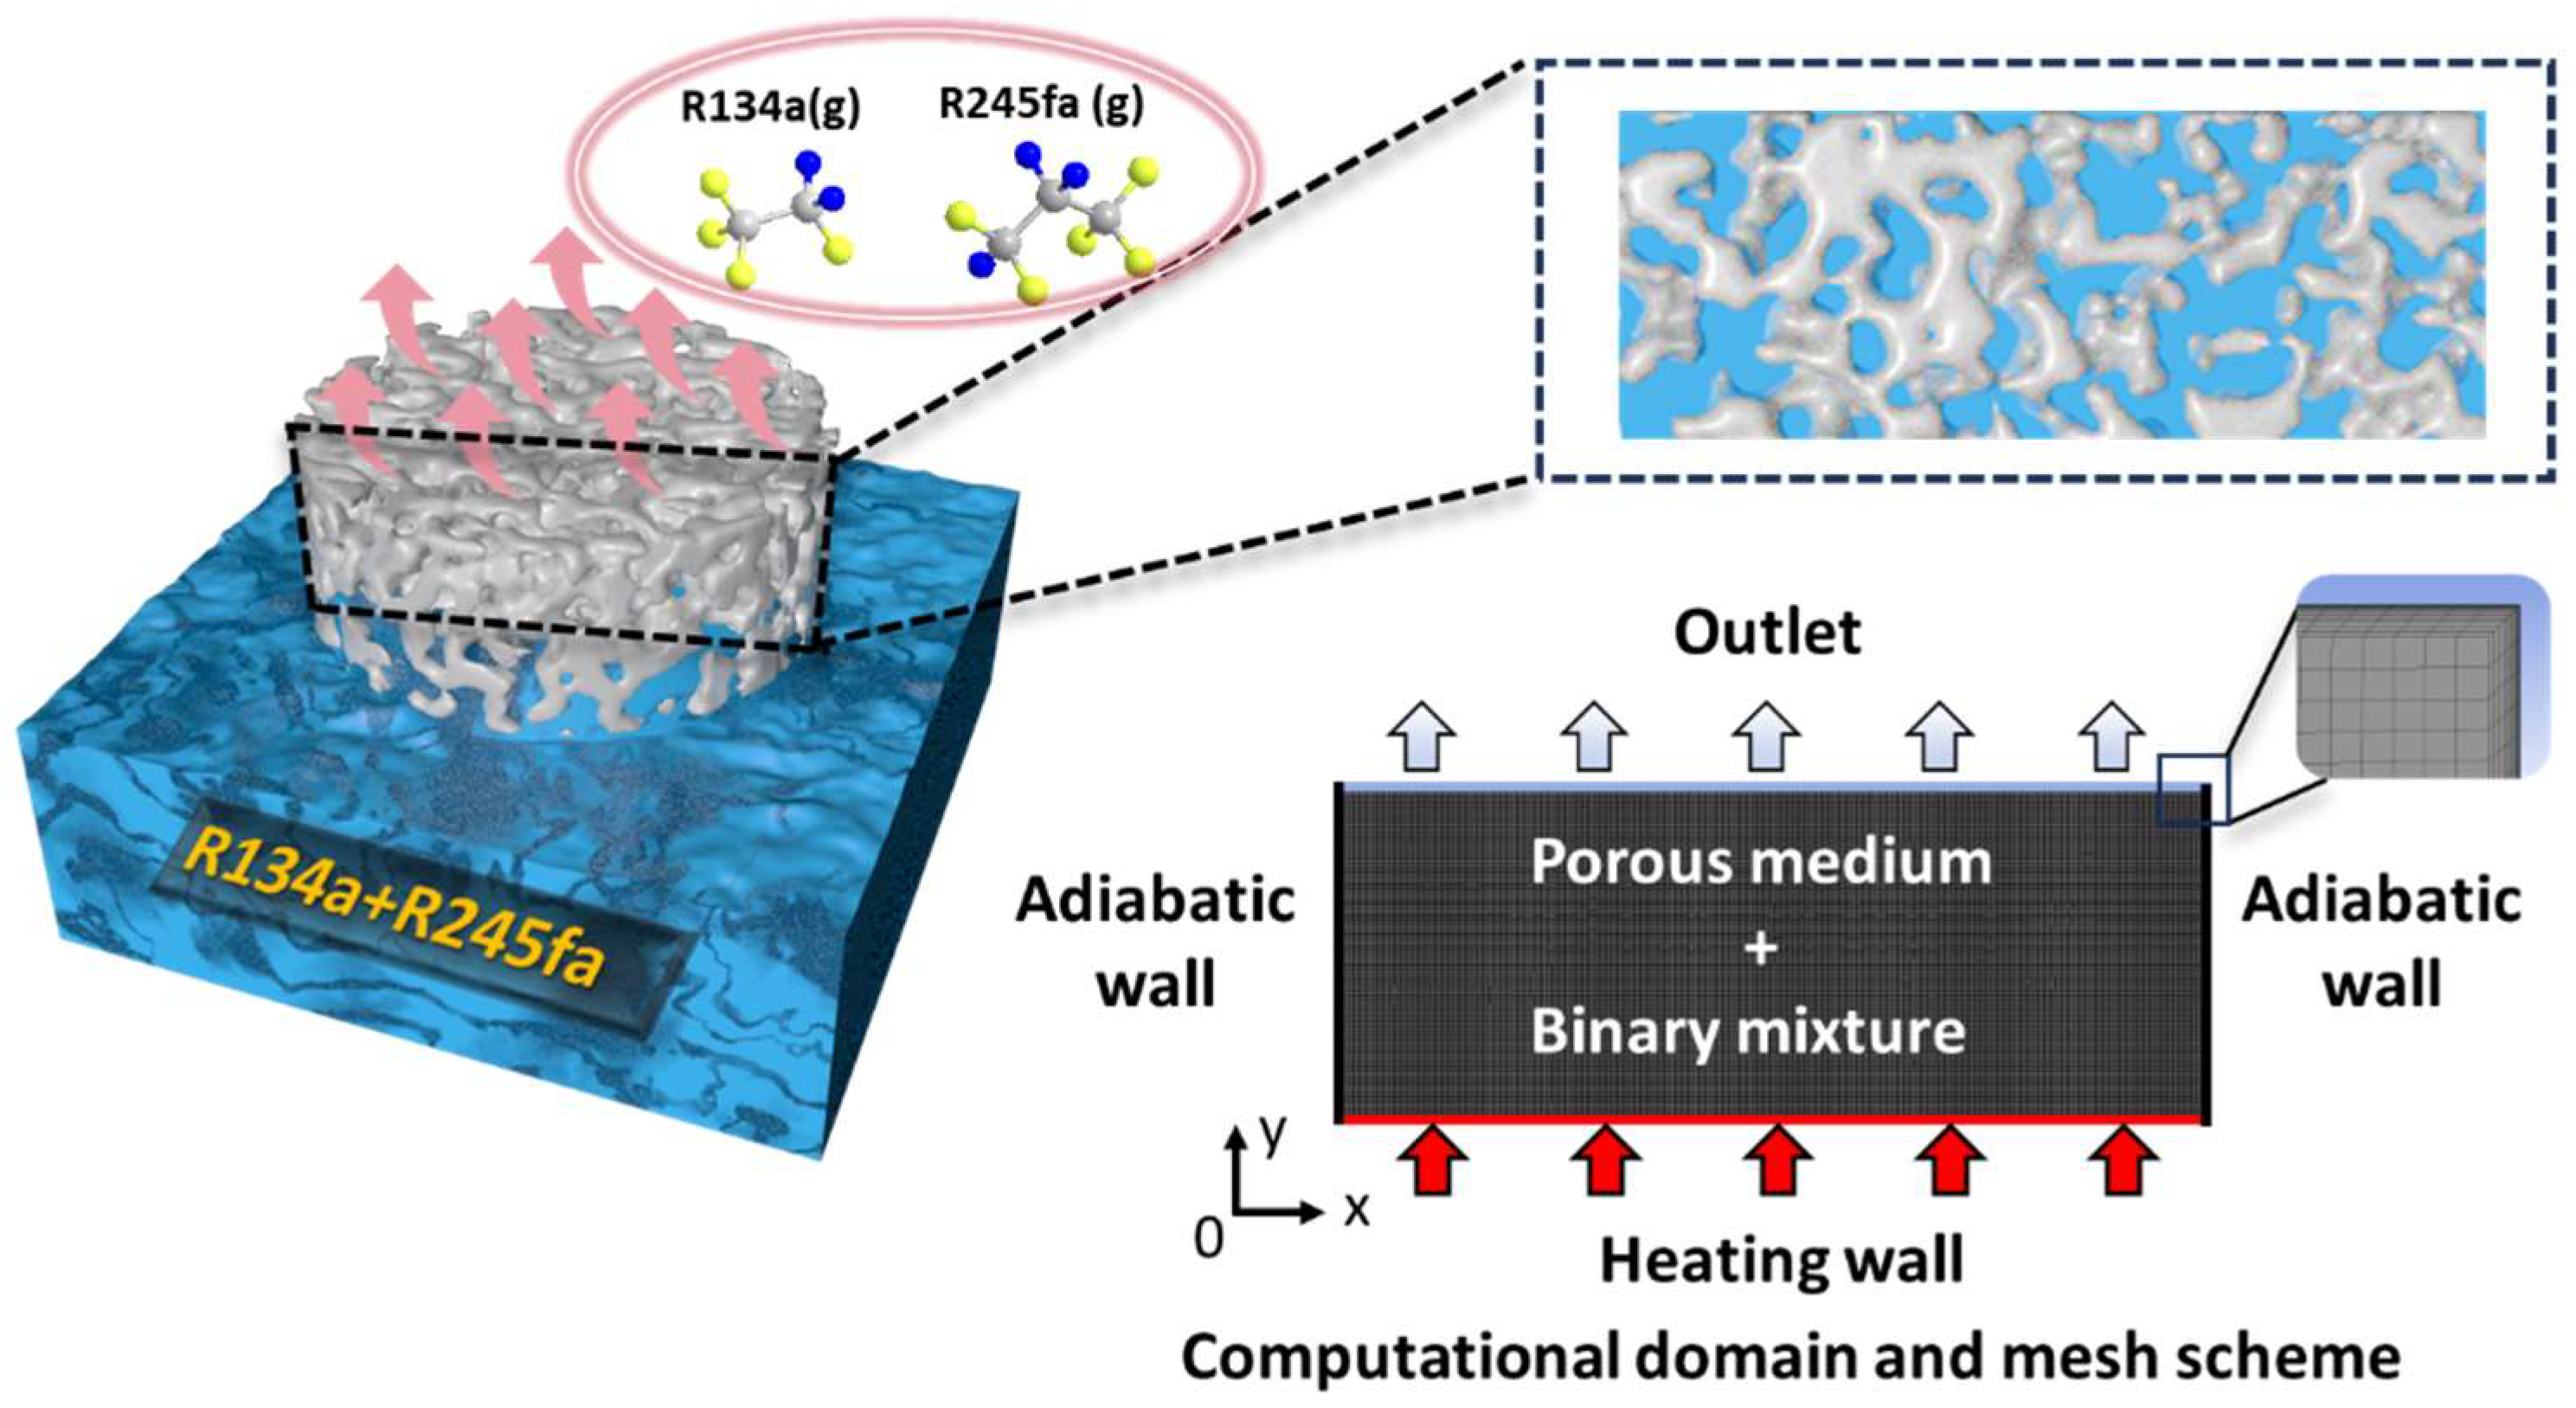
3.1. Physical Model and Mesh Scheme

Figure 1 shows the schematic diagram of porous media. To achieve the ultra-fast transport characteristics, the pore size of the porous structure is generally small. Here, a porous structure with a pore size of 20 μm is selected. After the porous evaporator core fully wicks the binary mixture solution (R134a/R245fa) from the liquid pool, the mixture solution is stored in the porous structure as the working fluid for the phase change process. According to Ref. [11], in the simulation, the evaporation temperature at the saturated state for each case is set to 26 °C. This work will focus on an isolated two-dimensional porous structure filled with the binary mixture solution (R134a/R245fa). The dimensions of the structure are 10 mm in length, 5 mm in height, and the porosity ranges from 0.4 to 0.6. The bottom wall serves as the heating surface, while the top is the outlet. The two-dimensional computational domain is divided into a structured grid using a quadrilateral grid method. The grids near the heating wall and the outlet are refined to ensure a more accurate heat and mass transfer across the liquid–vapor interface.

3.2. Boundary Conditions and Initial Conditions

According to the aforementioned governing equations, in order to calculate the local two-dimensional flow and heat transfer characteristics of the porous medium, it is necessary to set the initial conditions and boundary conditions for the governing equations. The specific initial conditions are as follows:
(1)
At the initial time, the porous medium is fully saturated with the liquid phase. The composition ratio of the solution is set to 3:7, 5:5, and 7:3 for R134a and R245fa, respectively.
(2)
The gauge pressure inside the porous medium is initially set to 0 Pa.
(3)
The initial temperature inside the porous medium is set to 296 K, resulting in a subcooling of 3 K.
(4)
The initial velocity of the computational cells inside the porous medium is set to 0 m/s.
Boundary conditions:
(1)
The outlet boundary condition is set as a pressure outlet, and the backflow temperature at the outlet is set to the saturation temperature.
(2)
The side walls are considered adiabatic ones, and the velocity is set to a no-slip boundary condition.
(3)
The heating wall is specified as a constant heat flux boundary condition, ranging from 100 kW/m2 to 500 kW/m2.

3.3. Case Setup

The present numerical model employs a pressure-based solver to perform the transient simulations of the two-component mixture evaporation process in a porous medium. The Eulerian model coupling with the multiphase VOF model is utilized for the unsteady calculations. The time step is set to an adaptive type, with a minimum time step of 10−5 s and a maximum iteration limit of 20 per time step. The simulations are conducted using an implicit scheme to reduce the dependency of the time step on the simulation stability while ensuring computational accuracy and efficiency. The sharp interface scheme is used for the liquid–vapor interface. The effects of contact angle and surface tension are taken into account in the simulations, where the surface tension is modeled using the CSF model. The interfacial heat transfer coefficient at the liquid–vapor interface is controlled by the Ranz–Marshall equation. The continuity equation and momentum equation are considered to have a convergence accuracy of 1 × 10⁻⁵, while the energy equation has a convergence accuracy of 1 × 10⁻⁶. For the numerical simulation of the evaporation process in the porous medium, the Phase-Coupled Simple algorithm, which exhibits a high convergence rate, is employed for the flow field calculations. The pressure difference is discretized using a second-order upwind scheme, and the momentum and energy equations are discretized using a first-order upwind scheme.

3.4. Grid Independence Analysis

To comprehensively consider the computational cost and accuracy, the mesh independent verification is performed for the evaporation process under the conditions of a porosity of 0.5, a heating power of 100 kW/m2, and a mass fraction percentage of (R134a/R245fa) of 5:5. Table 1 presents the data for the average temperature of the heating surface and the fluid mass inside the porous medium using four different grid numbers. The parameter e % = N i N i + 1 / N i is defined to evaluate the results of mesh sensitivity verification. Based on the results, a mesh of 80,000 is ultimately selected as the computational grid for the evaporation process in the porous medium.

3.5. Validation

To validate the reliability of the established numerical model, the pool boiling heat transfer coefficient is calculated using a binary mixture of R134a and R245fa as the working fluid. The calculated results are compared with the experimental data from Ref. [11] to demonstrate the accuracy of the present model. Figure 2 shows a comparison between the experimental data in Ref. [11] and numerical data using the present model for pool boiling heat transfer coefficients. A 50% mass fraction mixture of R134a and R245fa is used for the validation, with a heat flux range of 42 kW/m2 to 160 kW/m2. As the heat flux increases, both the experimental and numerical heat transfer coefficients exhibit an upward trend. The maximum error between the experimental and numerical heat transfer coefficients is 14.6%, indicating that present numerical model can accurately predict the heat and mass transfer of the binary mixture in the boiling phase change process. This demonstrates a strong reliability of the established numerical model.

4. Results and Discussion

The evaporation heat transfer characteristics of a binary mixture (R134a/R245fa) in a porous medium are discussed and analyzed using the numerical simulation. The evaporation process is influenced by various factors, such as heat supply and the porous medium’s structural parameters, mass fraction of the binary mixture, etc. The focus of present study is on three important factors that affect the evaporation of a binary mixture: heat flux, the porosity of the porous medium, and the mass fraction of the binary mixture.

4.1. Effect of Heat Flux on Evaporation Heat Transfer

Figure 3a,b shows the mass variation curves and the evaporation rate variation curves for the pure refrigerants R134a, R245fa, and the mixture of R134a/R245fa, respectively. These curves are discussed under the conditions of a porosity of 0.5, a mass fraction ratio of 5:5 for the binary mixture, and a heat flux of 200 kW/m2. The total evaporation rate ( m 0 ˙ ), R134a component evaporation rate ( m 1 ˙ ), and R245fa evaporation rate ( m 2 ˙ ) were determined by calculating the time derivative of the measured mass ( m i ˙ = d m i / d t ). In the numerical simulations, the mass is monitored for each component of the liquid and vapor phases within the computational domain. This strategy has also been adopted in Ref. [23]. It can be observed that it remains relatively unchanged in the mass for two pure refrigerants and the mixtures before t = 0.07 s. This indicates that during this time, the mass transfer from liquid phase to vapor phase is nearly the same as the mass transfer from vapor phase to liquid phase. However, after t = 0.07 s, the mass curve for liquid decreases rapidly, indicating the intense evaporation of the binary mixture in the porous medium. Figure 3b also confirms this result. Before t = 0.07 s, the evaporation rates for all three substances are nearly zero. However, after t = 0.07 s, the evaporation rate curves dramatically increase. During the intense evaporation process (t = 0.07–0.1 s), the total evaporation rate, R134a evaporation rate, and R245fa evaporation rate fluctuate around a constant rate, respectively. As a result, the slopes of the mass variation curves are linear. In the initial stage of intense evaporation, the evaporation rates of R134a and R245fa are similar. As the evaporation proceeds, the evaporation rate of R134a is slightly higher than that of R245fa. This is attributed to the physical properties of two refrigerants. The large surface tension and dynamic viscosity of R245fa hinder the mass transfer from liquid phase to vapor phase. In the initial stage, R134a and R245fa have a similar mass fraction and larger masses, so the difference in evaporation rates between the two is not significant, but the evaporation rate of R245fa is consistently lower than that of R134a. As the evaporation progresses, the difference in evaporation rates becomes more pronounced. After t = 0.1 s, the evaporation rate starts to fluctuate significantly, and even negative evaporation rates occur, indicating the condensation phenomena occur at the outlet. This is also the reason for the sudden increase in the mass of R245fa in the mass curve during the time ranging from 0.1 s to 0.15 s. On the other hand, the mass of R134a liquid gradually decreases, and the evaporation rate curve suggests that R134a does not undergo a noticeable condensation. The following contours will explain the reasons for this phenomenon in detail. As the evaporation continues, the liquid in the porous medium dries up, and the evaporation process within the porous medium comes to an end.
Figure 4a,c represents the phase contours at a heat flux of 200 kW/m2 and 400 kW/m2, respectively. The red region indicates the vapor phase, while the blue region represents the liquid phase. Due to the influence of the porous medium structure, the nucleation of the binary mixture does not occur within the porous medium. Instead, an irregular liquid–vapor interface is formed within the porous medium, facilitating a mass transfer between the vapor and liquid phases. The intense evaporation within the porous medium causes the liquid–vapor interface to gradually migrate from the heating surface towards the outlet. Due to the stochastic fluid permeation within the porous medium, the migration of the liquid–vapor interface is not smooth, resulting in several certain locations of interface migrating faster than others. When a local liquid–vapor interface just contacts the outlet, some vapor overflows from the gap of the interface (as shown in Figure 4a at t = 0.101 s and Figure 4c at t = 0.054 s). Due to the lower vapor density of R245fa, it is more prone to accumulation at the gaps of the liquid–vapor interface. Therefore, R245fa is more likely to undergo condensation compared to R134a. In conclusion, R245fa is more prone to condensation at the outlet. The negative evaporating rate of R245fa in the evaporation rate curve in Figure 3 better illustrates the occurrence of condensation. As the condensation takes place and the vapor blockage occurs at the outlet, the liquid–vapor interface and the gaps at the outlet are completely filled, allowing the evaporation to continue until the liquid inside the porous medium is completely dried out. Figure 4b,d represents the mass fraction contours of R134a liquid at the heat fluxes of 200 kW/m2 and 400 kW/m2, respectively. In the diagram, the black line represents the liquid–vapor interface, with the lower part indicating the vapor phase and the upper part representing the liquid phase. The red region represents the maximum mass fraction of R134a, which accounts for 50% of the total mass. It can be observed that in the liquid phase region, the mass fraction of R134a gradually decreases near the liquid–vapor interface. This is because R134a is more easily evaporated compared to R245fa. The evaporation rate curve also indicates that the evaporation rate of R134a is higher than that of R245fa.
Figure 5a represents the variation of the mass of binary mixture over time for different heat fluxes ranging from 200 kW/m2 to 500 kW/m2. As the heat flux increases, the onset of intense evaporation occurs earlier. At a heat flux of 200 kW/m2, a noticeable decrease in liquid mass is observed at t = 0.071 s, while at a heat flux of 500 kW/m2, the onset of intense evaporation is advanced to 0.021 s. Correspondingly, the end time of evaporation also advances. Interestingly, with the increase in heat flux, the overall evaporating rate, the evaporating rate of R134a, and the evaporating rate of R245fa show the improvement, as shown in Figure 5b–d. At a heat flux of 200 kW/m2, the overall evaporating rate, R134a evaporating rate, and R245fa evaporating rate are 673.7 g/s, 357.2 g/s, and 316.4 g/s, respectively. When the heat flux rises to 500 kW/m2, the corresponding evaporating rates are 749.6 g/s, 381.7 g/s, and 367.9 g/s, with enhancement ratios of 11.3%, 6.9%, and 16.3%, respectively. This indicates that the evaporating rate of R245fa is more sensitive to the changes in heat flux. Figure 6 shows the curves of the heating surface temperature and heat transfer coefficient as a function of heat flux. It is evident that with an increase in heat flux, both the heating surface temperature and heat transfer coefficient gradually increase. The maximum increase in the heat transfer coefficient is 1.4%, indicating that the heat transfer coefficient is not highly sensitive to changes in heat flux.

4.2. The Effect of Porosity on Evaporation Heat Transfer

Figure 7a represents the variation of the mass of the binary mixture over the time for different porosities ranging from 0.4 to 0.6. The discussion is based on a binary mixture with a mass fraction ratio of 5:5 and a heat flux of 400 kW/m2. It can be observed that a porous medium with a low porosity has a larger volume fraction for solid material, resulting in a smaller initial mass of liquid and a shorter overall evaporation time. Additionally, in porous media with higher porosities, preferential evaporation occurs. For example, at a porosity of 0.4, at t = 0.028 s, the intense evaporation has already begun, while the time has been advanced to 0.21 s at a porosity of 0.6. Figure 7b–d shows the variation of the overall evaporating rate, the evaporating rate of R134a, and the evaporating rate of R245fa over time for different porosities. It is observed that as the porosity increases, the evaporating rates of all three substrates initially increase and then decrease. The overall evaporating rates for porosities of 0.4, 0.5, and 0.6 are 439.9 g/s, 676.4 g/s, and 608.5 g/s, respectively. The evaporating rates of R134a are 220.1 g/s, 343.8 g/s, and 306.1 g/s, respectively. The evaporating rates of R245fa are 219.9 g/s, 332.6 g/s, and 302.4 g/s, respectively. This is because the inertial resistance coefficient and the viscous resistance coefficient in the porous medium are strongly correlated with the porosity. As the porosity increases, both the viscous resistance coefficient and the inertial resistance coefficient decrease, effectively reducing the flow resistance of liquid and vapor in the porous medium and enhancing convective heat transfer. Furthermore, a higher porosity corresponds to a larger effective heat transfer area, which benefits the increase in the evaporating rate. However, as the porosity increases, the proportion of solid material in the porous medium decreases, leading to an increase in the initial mass of liquid and a decrease in the effective thermal conductivity, which hinders the evaporation process to some extent. Taking all factors into the consideration, the maximum evaporation rate is achieved when the porosity is 0.5. As shown in Figure 8, it presents the variations of the heating surface temperature and heat transfer coefficient with porosities. With an increase in the porosity, the heating surface temperature gradually increases while the heat transfer coefficient decreases. Although the maximum evaporation rate is obtained at a porosity of 0.5, the dominating factor in the heat transfer process is the reduction in effective thermal conductivity. Considering all aspects, the porous structure with a porosity of 0.4 exhibits a higher heat transfer coefficient. This indicates that the heat transfer coefficient is strongly influenced not only by the evaporation rate but also by the structural parameters of the porous medium.
As shown in Figure 9, they depict the phase contours at porosities of 0.4 and 0.6, respectively. It is worth noting that at the lower porosities, the liquid–vapor interface within the porous medium appears more tortuous. This can be attributed to the narrower flow space and more complex flow characteristics in the porous structure with a lower porosity, which are prone to a localized evaporation. Additionally, it is observed that as the porosity increases, the diffusion layer gradually thickens. This is in contrast to the aforementioned phenomenon, where the higher porosity in the porous structure provides a broader flow space, allowing for more efficient diffusion processes. According to Equations (8) and (9), it can be observed that the mass transport in the species transport equation is strongly influenced by the diffusion coefficient, D, which is influenced by the physical properties of the species, such as viscosity. Comparatively, R134a has a larger diffusion coefficient than that of R245fa. Therefore, in Figure 9, during the evaporation process in the porous medium, there is a phenomenon of preferential diffusion, indicated by the decrease in the mass fraction of the R134a liquid phase.

4.3. The Effect of Mass Fraction on Evaporation Heat Transfer

Figure 10a shows the variation of the mass of a binary mixture with the time for different mass fractions ratios (R134a/R245fa) of 3:7, 5:5, and 7:3. Figure 10b–d represents the variation of the total evaporation rate, the R134a evaporation rate, and the R245fa evaporation rate with the time for different mass fractions. These discussions are based on a porous medium with a porosity of 0.5 and a heat flux density of 400 kW/m2. It is important to note that under different mass fractions, there is no significant change in the total mass variation or total evaporation rate. However, the evaporation rate of each component has significant effects. With an increase in the mass fraction of R134a in the mixture, the evaporation rate of R134a gradually increases from 211.4 g/s to 460.3 g/s. On the other hand, the evaporation rate of R245fa gradually decreases from 480.4 g/s to 184.4 g/s. This indicates that higher mass fractions result in faster evaporation rates for the corresponding component. Furthermore, due to the lack of significant changes in the total evaporation rate, the heating surface temperature and heat transfer coefficient remain consistent for the three different mass fractions, as shown in Figure 11.

5. Conclusions

The present study employs the Eulerian model coupled with the multiphase VOF model and species transport model to develop a multi-component evaporation model for a binary zeotropic mixture. The focus is on exploring the flow and heat transfer characteristics of binary mixtures evaporated in porous media with regard to heat flux, porosity, and mass fraction. The main conclusions can be summarized as follows:
During the initial stage of evaporation, there is no significant change in the evaporation rate. As the evaporation rate curve rapidly increases, the vigorous evaporation takes place within the porous media, with the evaporation rate fluctuating around a relatively constant value. As the liquid–vapor interface approaches the outlet, the local condensation phenomena occur. Eventually, the evaporation process ends with the dryout of liquid within the porous media.
(1)
With the increase in heat flux, the overall evaporation rate, R134a evaporation rate, and R245fa evaporation rate show certain improvements, with the increases of 11.3%, 6.9%, and 16.3%, respectively. The evaporation rate of R245fa is more sensitive to changes in heat flux. As the heat flux increases, the heat transfer coefficient slightly increases, with a maximum improvement of 1.4%.
(2)
Taking into account factors such as inertia resistance coefficient, viscosity resistance coefficient, flow space, and effective thermal conductivity, the overall evaporation rate and R134a (R245fa) evaporation rates achieve their maximum values at a porosity of 0.5 in the porous medium. Additionally, the maximum heat transfer coefficient is observed at a porosity of 0.4.
(3)
In a binary mixture, as the mass fraction of the component increases, the corresponding evaporation rate also increases. When the mass fraction ratio (R134a/R245fa) is 5:5, the evaporation rate of R134a is slightly higher than that of R245fa. However, for three different mass fractions, the overall evaporation rate and heat transfer coefficient remain nearly constant.

Author Contributions

Conceptualization, Z.L.; Methodology, B.Z., P.C., Z.W., Z.S., W.D. and P.H.; Software, P.C., B.K. and W.W.; Validation, Z.W., Z.S. and B.K.; Formal analysis, B.Z., P.C., Z.W. and Z.L.; Investigation, P.C. and Z.P.; Resources, Z.W.; Data curation, W.W. and P.H.; Writing—original draft, B.Z.; Writing—review & editing, W.D., Z.P. and Z.L.; Project administration, W.D.; Funding acquisition, Z.P. and Z.L. All authors have read and agreed to the published version of the manuscript.

Funding

This research was funded by the China Tobacco Hunan Industrial Co., LTD. 2022 Open Project (KY2022KF0001).

Data Availability Statement

The data presented in this study are available in article.

Conflicts of Interest

The authors declare no conflict of interest.

References

  1. Sharma, P.; Vazquez, I.R.; Jackson, N. Atomization of High Viscous Liquids Using a MEMS Vibrating Mesh with Integrated Microheater. J. Microelectromechanical Syst. 2023, 32, 362–370. [Google Scholar] [CrossRef]
  2. Aceti, P.; Rosso, M.; Ardito, R.; Pienazza, N.; Nastro, A.; Baù, M.; Ferrari, M.; Rouvala, M.; Ferrari, V.; Corigliano, A. Optimization of an Impact-Based Frequency up-Converted Piezoelectric Vibration Energy Harvester for Wearable Devices. Sensors 2023, 23, 1391. [Google Scholar] [CrossRef] [PubMed]
  3. Dinh, T.; Phan, H.-P.; Kashaninejad, N.; Nguyen, T.-K.; Dao, D.V.; Nguyen, N.-T. An On-Chip SiC MEMS Device with Integrated Heating, Sensing, and Microfluidic Cooling Systems. Adv. Mater. Interfaces 2018, 5, 1800764. [Google Scholar] [CrossRef]
  4. Liu, Z.; Qin, S.; Chen, X.; Chen, D.; Wang, F. PDMS-PDMS Micro Channels Filled with Phase-Change Material for Chip Cooling. Micromachines 2018, 9, 165. [Google Scholar] [CrossRef]
  5. Clark, M.D.; Weibel, J.A.; Garimella, S.V. Impact of pressure drop oscillations and parallel channel instabilities on microchannel flow boiling and critical heat flux. Int. J. Multiph. Flow 2023, 161, 104380. [Google Scholar] [CrossRef]
  6. Ren, C.; Li, W.; Ma, J.; Huang, G.; Li, C. Flow boiling in microchannels enhanced by parallel microgrooves fabricated on the bottom surfaces. Int. J. Heat Mass Transf. 2021, 166, 120756. [Google Scholar] [CrossRef]
  7. Zhang, D.; Mao, J.; Qu, J.; Lei, Q.; Li, C.; Chen, Y. Characterizing effect of particle size on flow boiling in sintered porous-microchannels. Appl. Therm. Eng. 2023, 229, 120571. [Google Scholar] [CrossRef]
  8. Azzolin, M.; Bortolin, S.; Del Col, D. Flow boiling heat transfer of a zeotropic binary mixture of new refrigerants inside a single microchannel. Int. J. Therm. Sci. 2016, 110, 83–95. [Google Scholar] [CrossRef]
  9. Xu, J.; Wang, Y.; Yang, R.; Liu, W.; Wu, H.; Ding, Y.; Li, Y. A review of boiling heat transfer characteristics in binary mixtures. Int. J. Heat Mass Transf. 2021, 164, 120570. [Google Scholar] [CrossRef]
  10. Li, J.; Lin, L.; Li, S.; Yang, Z.; Duan, Y. Experimental study on nucleate pool boiling heat transfer characteristics of R32 + R1234yf binary mixtures. Appl. Therm. Eng. 2022, 205, 118047. [Google Scholar] [CrossRef]
  11. Dang, C.; Jia, L.; Peng, Q.; Huang, Q.; Zhang, X. Experimental and analytical study on nucleate pool boiling heat transfer of R134a/R245fa zeotropic mixtures. Int. J. Heat Mass Transf. 2018, 119, 508–522. [Google Scholar] [CrossRef]
  12. Diddens, C.; Tan, H.; Lv, P.; Versluis, M.; Kuerten, J.G.M.; Zhang, X.; Lohse, D. Evaporating pure, binary and ternary droplets: Thermal effects and axial symmetry breaking. J. Fluid Mech. 2017, 823, 470–497. [Google Scholar] [CrossRef]
  13. Gurrala, P.; Katre, P.; Balusamy, S.; Banerjee, S.; Sahu, K.C. Evaporation of ethanol-water sessile droplet of different compositions at an elevated substrate temperature. Int. J. Heat Mass Transf. 2019, 145, 118770. [Google Scholar] [CrossRef]
  14. Duursma, G.; Sefiane, K.; Clarke, J. Diffusion-Evaporation Studies of Binary Mixtures in Capillary Tubes. Defect Diffus. Forum 2008, 273–276, 577–582. [Google Scholar] [CrossRef]
  15. Lv, C.; Varanakkottu, S.N.; Hardt, S. Liquid plug formation from heated binary mixtures in capillary tubes. J. Fluid Mech. 2020, 889, A15. [Google Scholar] [CrossRef]
  16. Dang, C.; Jia, L.; Peng, Q.; Yin, L.; Qi, Z. Experimental study on flow boiling heat transfer for pure and zeotropic refrigerants in multi-microchannels with segmented configurations. Int. J. Heat Mass Transf. 2018, 127, 758–768. [Google Scholar] [CrossRef]
  17. Vajc, V.; Moe, M.; Hadi, A.; Ŝulc, R.; Golobi, I. Saturated and subcooled pool boiling heat transfer in mixtures of water and glycerin. Exp. Heat Transf. 2023, 36, 283–311. [Google Scholar] [CrossRef]
  18. Hu, Y.; Chen, S.; Huang, J.; Song, M. Marangoni effect on pool boiling heat transfer enhancement of self-rewetting fluid. Int. J. Heat Mass Transf. 2018, 127, 1263–1270. [Google Scholar] [CrossRef]
  19. Canbazoglu, F.M.; Fan, B.; Vemuri, K.; Bandaru, P.R. Enhanced Solar Thermal Evaporation of Ethanol-Water Mixtures, through the Use of Porous Media. Langmuir 2018, 34, 10523–10528. [Google Scholar] [CrossRef]
  20. Li, J.; Yang, Z.; Duan, Y. Numerical simulation of single bubble growth and heat transfer of R32 + R1234yf binary mixtures during saturated pool boiling. Int. J. Therm. Sci. 2023, 191, 108380. [Google Scholar] [CrossRef]
  21. Yang, R.; Wang, Y.; Li, Y. Numerical investigations on flow boiling heat transfer of ammonia water binary solution (NH3/H2O) in a horizontal microchannel. Int. J. Heat Mass Transf. 2021, 171, 121091. [Google Scholar] [CrossRef]
  22. Lee, H.; Kharangate, C.R.; Mascarenhas, N.; Park, I.; Mudawar, I. Experimental and computational investigation of vertical downflow condensation. Int. J. Heat Mass Transf. 2015, 85, 865–879. [Google Scholar] [CrossRef]
  23. Lee, H.; Kharangate, C.R.; Mascarenhas, N.; Park, I.; Mudawar, I. Selective evaporation rate modeling of volatile binary mixture droplets. Int. J. Heat Mass Transf. 2021, 178, 121584. [Google Scholar] [CrossRef]
Figure 1. Schematic diagram of the evaporation process of a binary mixture (R134a/R245fa) in a porous medium, along with the grid partitioning of the porous calculation domain and the boundary conditions.
Energies 16 06526 g001
Figure 2. The comparison between the experimental data in Ref. [11] and numerical data using this model for the pool boiling heat transfer coefficient.
Energies 16 06526 g002
Figure 3. Variation of (a) mass and (b) evaporation rate with time for the pure refrigerants R134a, R245fa, and the mixture of R134a/R245fa.
Energies 16 06526 g003
Figure 4. Phase counter and mass fraction of R134a variation with time for different heat fluxes: (a) phase contours at a heat flux of 200 kW/m2. (b) Mass fraction contours of R134a liquid at a heat flux of 200 kW/m2. (c) Phase contours at a heat flux of 400 kW/m2. (d) Mass fraction contours of R134a liquid at a heat flux of 400 kW/m2.
Energies 16 06526 g004
Figure 5. Variation of (a) mass of binary mixture, (b) total evaporation rate, (c) R134a evaporation rate, and (d) R245fa evaporation rate with time for different heat fluxes ranging from 200 kW/m2 to 500 kW/m2.
Energies 16 06526 g005
Figure 6. Variation of temperature of heating wall and heat transfer coefficient with heat flux.
Energies 16 06526 g006
Figure 7. Variation of (a) mass of binary mixture, (b) total evaporation rate, (c) R134a evaporation rate, and (d) R245fa evaporation rate with time for different porosities ranging from 0.4 to 0.6.
Energies 16 06526 g007
Figure 8. Variation of temperature of heating wall and heat transfer coefficient with porosities.
Energies 16 06526 g008
Figure 9. Phase counter and mass fraction of R134a variation with time for different porosities: (a) phase contours at a porosity of 0.4. (b) Mass fraction contours of R134a liquid at a porosity of 0.4. (c) Phase contours at a porosity of 0.6. (d) Mass fraction contours of R134a liquid at a porosity of 0.6.
Energies 16 06526 g009
Figure 10. Variation of (a) mass of binary mixture, (b) total evaporation rate, (c) R134a evaporation rate, and (d) R245fa evaporation rate with time for different mass fractions of binary mixture (R134a/R245fa = 3:7, 5:5, and 7:3).
Energies 16 06526 g010
Figure 11. Variation of temperature of heating wall and heat transfer coefficient with mass fraction.
Energies 16 06526 g011
Table 1. The parameters of porous evaporation (average wall temperature and mass) for grid independence analysis.
No.Grid Number T a v g (K)e%m (g)e%
110,000300.2810.014%31.280.477%
220,000300.3240.007%31.430.412%
380,000300.3450.006%31.560.032%
4125,000300.328-31.55-
Disclaimer/Publisher’s Note: The statements, opinions and data contained in all publications are solely those of the individual author(s) and contributor(s) and not of MDPI and/or the editor(s). MDPI and/or the editor(s) disclaim responsibility for any injury to people or property resulting from any ideas, methods, instructions or products referred to in the content.

