
Characterization of a Wall System with Dynamic Thermal Insulation—Experimental Campaign and Numerical Simulation


1
CONSTRUCT-LFC, Department of Civil Engineering, Faculty of Engineering, University of Porto, 4200-465 Porto, Portugal
2
Department of Civil Engineering, School of Technology and Management of the Polytechnic Institute of Viseu, 3504-510 Viseu, Portugal
*
Authors to whom correspondence should be addressed.
Energies 2023, 16(17), 6402; https://doi.org/10.3390/en16176402
Submission received: 4 August 2023
/
Revised: 30 August 2023
/
Accepted: 1 September 2023
/
Published: 4 September 2023
(This article belongs to the Special Issue Smart and Innovative Solutions for Adaptive Facade Systems)
Abstract
:Dynamic thermal insulation systems (DTISs) can adapt to external environment conditions and help to reduce energy consumption and increase occupants’ thermal comfort, contributing towards the mitigation of overheating. DTISs adjust their configuration to optimize heat transfer through the façade. In this study, the performance of a DTIS was assessed through laboratory tests and numerical simulation. The DTIS is based on the ventilation of an air gap that facilitates the heat exchanges between the exterior and the interior. To extend the results of the experimental campaign, a set of scenarios was assessed based on numerical simulation. The results of the laboratory tests showed that the R-value obtained when the mechanical ventilation of the air gap is off (insulation state) is 3.89 m2.°C/W. In comparison, when it is on (conductive state), the R-value is 1.56 m2.°C/W, which corresponds to a reduction of approximately 60%. The results of the simulations showed that, when the shading system was on, the higher U-value was useful more than 50% of the time with discomfort, increasing to 75% when the shading system was off.
1. Introduction
1.1. Overheating Problem and Mitigation Measures
The building construction sector plays an essential role in energy consumption. In fact, in 2021, the use of fossil fuels in buildings accounted for approximately 8% of global energy-related and process-related CO2 emissions, with another 19% resulting from the generation of electricity and heat used in buildings, and an additional 6% resulting from the manufacture of cement, steel, and aluminum used in building construction. As a result, the building sector is responsible for about a third of the total global final energy consumed and process-related CO2 emissions [1].
With climate change, the Earth’s average temperature has increased and will continue rising if no action is taken [2]. Moreover, the increased frequency of extreme meteorological events also has important consequences. Extremely high air temperatures contribute to cardiovascular and respiratory disease deaths, particularly in older people. Despite evidence of the effect of the environment and climate on health, more political actions and investments are needed [3].
According to the six leading international datasets consolidated by the World Meteorological Organization (WMO), the last seven years (2015–2021) have been the warmest ever, and 2021, in particular, was one of the hottest. In addition, climate change is causing increasingly frequent heat waves and extreme weather events. In June and early July of 2022, record-breaking temperatures were registered in Europe, North Africa, the Middle East, and Asia. An increase in tropical nights and extremely hot days is expected in the future. These conditions will intensify in cities due to the heat island effect.
In the housing sector, the overheating phenomenon is enhanced by extreme heat events, causing thermal discomfort to users. Adequate housing conditions are acknowledged in several international documents and thermal comfort is pointed out as a key factor for the occupants’ wellbeing [4]. Thermal comfort is typically assessed by air temperature and humidity-related parameters, and several models are available in the literature to quantify it [5,6]. Concerning this topic, certain authors have discussed the most adequate model for a specific climate [7] and others their impact on the energy demand [8].
In addition to the external stimulus, overheating depends on the characteristics of the building and the behavior of the occupants [9,10]. The simplest model to assess overheating is based on a limit value for air temperature above which the building will be in discomfort. A common limit value is 25 °C. On the other hand, some adaptive models propose an operative temperature comfort range dependent on an indicator of the exterior climate [11]. In this way, these models take into account not only the possibility of occupants interacting with the building to improve their thermal sensation but also their ability to adapt depending on previous experiences, namely the outdoor environment. The mitigation measures to tackle overheating can be classified into passive and active. Active solutions employ cooling techniques through mechanical means and require energy consumption, while passive solutions use constructive techniques and properties of materials and components to reduce overheating [12,13].
According to the IEA (International Energy Agency), air-conditioning and electric fans (active means) are responsible for almost 20% of the total electricity used in buildings worldwide. Since 1990, the energy demand for space cooling has more than quadrupled at an average pace of 4% per year since 2000 [14]. In the next three decades, the use of air-conditioning is expected to increase, becoming one of the main drivers of global electricity demand [15].
Thus, in order to tackle overheating, minimize the amount of energy required for space cooling, and prepare buildings for future climate scenarios, it is crucial to value passive design strategies to optimize heat transfer towards the indoor environment, which includes adopting measures such as shading, building components with heavy thermal mass, and enabling natural ventilation or night-time cooling whenever the outdoor temperature is lower than the indoor temperature and the humidity conditions are favorable [16,17].
Green façades and roofs are also possible solutions, as they restrict heat flow to the interior environment by 70% to 90% in summer [18]. Several authors also refer to the use of special glass, such as double or triple glazing or a low-E glass coating to control solar heat gains [16,19]. Cool roofs are also pointed out as a possible passive design strategy that minimizes solar heat gains [20].
Even if passive measures to mitigate overheating are not enough to achieve comfort conditions, their use must be considered for the positive impact on reducing energy demand.
1.2. Adaptive Façades
The façade is the part of the building envelope that most conditions the heat exchange between the internal and external environments. Thus, it greatly impacts the building’s thermal behavior and is critical for guaranteeing a comfortable indoor temperature. While heat exchanges in winter must be prevented by assuming low values of the heat transfer coefficient, in summer, these exchanges may be desirable, and having high U-values can benefit thermal comfort, contributing to the mitigation of the overheating phenomenon [21].
Façades are subjected to random meteorological variations throughout the year, such as solar radiation, precipitation, wind, and extreme temperatures, which have a relevant impact on interior comfort and energy consumption [22]. Furthermore, façades must respond to different functional scenarios that may contradict one another: shade vs. artificial lighting, views vs. privacy, solar gain vs. overheating, and daylight vs. glare [23]. Therefore, several parameters must be considered and reconciled during the design stage.
These particularities have instigated the research and development of different adaptive façades (AFs) concepts. Generally, these elements are defined as multi-parameter high-performance building envelopes that can change their behavior, mechanically or chemically, in real-time, according to external climate stimulus, through materials, components, or systems, to meet occupant needs [24,25]. Thus, it is possible to satisfy and optimize several functional requirements regarding heat transfer, air and water vapor flow, rain penetration, solar radiation, noise, fire, strength, stability, and aesthetics [26].
However, assessing the performance of AFs is difficult as no standardized evaluation procedures are defined, primarily because of their complexity and singularity. In addition, the existing building energy standards and rules that are being used to assess AFs have limited relevance for these systems, leading to less reliable results. Attia et al. [25] state that it is necessary to produce specific experimental protocols, datasets, and performance-monitoring methodologies and to adapt numerical simulation tools to guarantee an accurate comparison with traditional façades. Indeed, the accurate and reliable performance evaluation of a building with an AF is the first barrier to hinder the use of these systems in the market. The second barrier is the multiple stages that adaptive façades must pass before they can be used [25].
Indeed, according to Attia et al. [25], static performance measures (e.g., U-value, g-value, etc.) cannot adequately define the performance of AFs. Testing, inspecting, and assessing the operation performance of these systems in terms of thermal comfort and energy savings is very important. The results of long-term monitoring are also crucial. However, available results are scarce, and, for these reasons, very little is known about their actual behavior. Another critical factor restraining its full implementation in the market is the lack of awareness about using or interacting with an adaptive façade, which continues to be a barrier to occupant satisfaction and comfort.
Nowadays, the increasingly strict demands for building thermal insulation are reflected in EU member regulations. It is well-proven that thermal insulation is an effective way to reduce the heating energy consumption of a building while providing indoor thermal comfort. Yet its effects on the cooling season are somewhat disputed, as, in some conditions, it can worsen the overheating phenomena. However, this issue loses its relevance if the façade can react and adjust to the prevailing environmental conditions. Thus, the concept of the dynamic thermal insulation system (DTIS) was developed as a technology that counterbalances the few disadvantages of intense thermal insulation, by allowing buildings to adapt to varying seasonal climate conditions, changing from an insulation state to a conductive state [26]. Due to their capacity to vary their thermal resistance based on the surrounding conditions, DTISs are included in the adaptable façades category, modifying the heat flux between the internal and external environments.
DTISs are divided into four categories: passive systems that only use natural power sources to operate; hybrid systems that use a simple or complex automation system to operate; active systems that depend on a constant power supply to operate and maintain their performance; and systems not specified. Most of the studies on dynamic insulation systems focus on active technologies (60%) and are simulation-based (53%) [26].
In this work, the behavior of an innovative dynamic thermal insulation system is assessed through laboratory tests and numerical simulation. For the experimental campaign, a completely new prototype of a façade incorporating a DTIS was developed based on the ventilation of an internal air gap. The measurement of the system’s thermal properties in the laboratory provided important input for generalizing its performance based on numerical simulation. The impact of the innovative DTIS on a building’s thermal comfort is evaluated, based on discomfort performance indicators, and it is also discussed the effectiveness of its functional performance.
2. Framework
2.1. Conceptual Framework
To assess the performance of an innovative dynamic thermal insulation system, this study was divided into two main tasks: (i) the experimental campaign, which provided suitable values to be used as input for the numerical simulations, considering both the conductive state and the insulation state; (ii) the numerical simulation, which included phase I, that dealt with the selection of the input parameters, and phase II, that evaluated the impact of the DTIS on thermal comfort and assessed the effectiveness of the functional performance of the wall system. The main purpose of the task was to generalize the results by considering different case study configurations. The conceptual framework of this study is shown in Figure 1.
2.2. Experimental Campaign
The new DTIS developed for this study is schematically shown in Figure 2a, which, in the insulation state, consists of a wall panel with four layers, from inside to outside: 8 cm thick of concrete panel, 10 cm thick of air gap, 10 cm thick of thermal insulation panel, and 8 cm thick of concrete panel. To guarantee the conductive state, two fans connected to the outdoor environment were included to mechanically ventilate the air gap with a maximum airflow of 52 m3/h.
The experimental tests followed the standard ISO 9869-1:2014 [27] with some adaptations, to adjust the procedure to the specificities of the wall system under study. The prototype of about 1.90 × 1.90 m2 was placed on a Hot Box apparatus (Figure 2b) that allows control of the temperature range from −50 °C to 180 °C, with an accuracy of ±0.5 °C, and a relative humidity ranging between 10% and 98%, with an accuracy of ±2%. The environmental conditions were set up to guarantee the necessary heat flow through the wall layers (exterior side with constant temperature, facing the Hot Box apparatus with a set point of 5 °C, and the interior side in free running mode). Thus, the tests were carried out always considering overheating in the interior environment.
Six T-type thermocouples, with a measuring range of −200 to 350 °C and an accuracy of ±1.0 °C or ±0.75%, were used to measure the temperatures on the two surfaces of the wall system (three thermocouples in each surface, distributed over the prototype surfaces following the standard ISO 9869-1:2014 [27]). Three heat flux sensors, installed on the interior surface, assessed the heat flux passing through the prototype. Their maximum operating temperature is 90 °C, with an accuracy of ±5%. The distribution of the heat flux sensors on the surface was similar to that of the thermocouples (Figure 2b). The ambient temperatures (interior, exterior, and air gap) were measured using PT100 probes with an accuracy of ±0.3 °C. All devices were connected to a data logger, with a data recording accuracy of 0.1%, which collected and stored the measured data every 10 min.
Two tests were then carried out, each lasting approximately seven days, one with the ventilation system of the air gap off (insulation state) and another with the ventilation system on (conductive state), as described in Table 1. For the calculation of the thermal resistance of the prototype in both states, the average values of the three locations for surface temperature and heat flux measurements were considered.
The thermal resistance (R-value) of the wall system was calculated according to Equation (1) [27],
where:
- R—thermal resistance in m.°C/W;
- Tsi—interior surface temperature, in °C;
- Tse—exterior surface temperature, in °C;
- q—density of heat flow rate, in W/m2.
2.3. Numerical Simulation
To extend the results of the experimental campaign, several scenarios were assessed based on numerical simulation, using DesignBuilder (DB) to simulate the response of a building and evaluate the impact of a DTIS on the mitigation of overheating. DB uses EnergyPlus as the solver [28]. The solution algorithm was the Conduction Transfer Function (CTF) module with two timesteps per hour. In addition to conduction, the model also includes radiative and convective heat transfer on all surfaces. As combinations of input parameters, the following possibilities were considered: a low-mass envelope and a high-mass envelope; two different U-values (in line with the results of the experimental campaign and the Portuguese thermal regulations); three Portuguese cities with different climate conditions; and the effect of the shading system (on/off). In total, 24 scenarios were considered. The schematic description of the inputs and outputs of the simulations is shown in Figure 3.
The two building models used in the simulations were the Low-Mass Basic Test Case 600 and the High-Mass Basic Test Case 900, defined in ASHRAE Standard 140-2004 [29]. The model consists of a single-zone unpartitioned building, with 8.0 m × 6.0 m × 2.7 m, and two 6.0 m2 of double-glazed windows in the south-facing wall. The infiltration rate is 0.5 h−1 and the glazed windows are composed of two glass panes of a 3.2 mm thickness with an air gap of 13 mm thickness. The detailed specifications and properties of the building elements (walls, glazed windows, floor, and roof) can be found in ASHRAE Standard 140-2004 [21].
The two U-values considered for the wall system were obtained by changing the thickness of the insulation layer, as shown in Table 2. The U-values used were 0.35 W/(m2.°C), the strictest maximum value allowed in the Portuguese regulation and representing the insulation state, and 0.60 W/(m2.°C), which represents the conductive state.
The simulations were carried out considering the climatic data of Porto, Faro, and Bragança, using the corresponding reference meteorological years provided by the Portuguese regulation for the energy efficiency of buildings, considering the climatological normals in 1971–2000 (Figure 4). Faro, located on the south coast of Portugal, presents the highest monthly average temperature values over the year. However, the maximum temperature values during spring and summer occur in Bragança, located in the northeast inland of Portugal. On average, Porto, situated on the north coast, has the mildest clime with the lowest seasonal variation.
The effect of an exterior shading system, to moderate the interior temperature, was also assessed. To model the shading system, the selected object was “blind with high reflectivity slats” and the activation trigger was an internal air temperature equal to or higher than 25 °C.
The outputs of the simulations were the hourly values of the operative temperature and the exterior and interior surface temperatures on the four exterior walls. Although the simulations were run for the entire year, only the results for July were used in this work as the objective was to assess the performance of the dynamic system in summer conditions. The adaptive model defined by EN 16798 [30] was used to analyze thermal discomfort, considering category II. Moreover, two key performance indicators were defined. I1 represents the severity of discomfort, by assessing the average difference between the uncomfortable temperature by overheating and the corresponding comfort limit temperature defined by EN 16798 [30] and is calculated using Equation (2). I2 shows the percentage of time with discomfort by overheating and is calculated by Equation (3).
where:
- N—number of hours with discomfort;
- n—number of hours simulated;
- ϴul—temperature of the upper limit of comfort (°C);
- ϴo—operative temperature (°C).
To assess the effectiveness of the operational performance of the wall system, i.e., to evaluate the periods in which a high U-value contributes to the minimization of the overheating problem, only the scenarios with the U-value of 0.35 W/(m2.°C) in the low-mass building were considered. The first week of July was selected for the data treatment.
Two additional key performance indicators were defined. I3 represents the period of time in which the system with a high U-value is useful, i.e., when the operative temperature is higher than 25 °C and the interior surface temperature is higher than the exterior one (Equation (4)). I4 reflects the number of hours with discomfort by overheating (with the operative temperature higher than 25 °C), as established by Equation (5).
where:
- n—number of hours simulated
- ϴ(sur.ext.)—exterior surface temperature (°C)
- ϴ(sur.int.)—interior surface temperature (°C)
- ϴo—operative temperature (°C)
3. Results
3.1. Experimental Campaign
Figure 5 and Figure 6 show the ambient temperatures (exterior, interior, and air gap) variation over time. Test 1 corresponds to the situation with mechanical ventilation of the air gap off (insulation state) and Test 2 with mechanical ventilation of the air gap on (conductive state).
Both Figure 5 and Figure 6 show that the exterior temperature is higher than the defined setpoint of 5 °C. This occurred because the temperature sensor was placed next to the wall and far from the climatization system of the chamber, where temperatures are assessed by the built-in probes. It is also possible to observe that temperatures inside the air gap and in the interior environment are around 7 °C and 4 °C lower when the ventilation system is on, pointing to its positive effect on tackling overheating. Indeed, the exterior air entering the air gap of the wall, with a lower temperature, cools down the exterior surface of the interior concrete panel, increasing the heat flow towards the exterior and decreasing the temperature of the indoor air.
In Figure 7, it is possible to observe the variation in the thermal resistance over time for Tests 1 and 2. The R-value obtained when the mechanical ventilation of the air gap is off (insulation state) is 3.89 m2.°C/W. In comparison, when it is on (conductive state), the R-value is 1.56 m2.°C/W, which corresponds to a reduction of approximately 60%. Although the wall configuration can still be optimized to achieve a higher reduction in the thermal resistance, the results confirm that this wall system can be used as a DTIS, as it changes its behavior from an insulation to a conductive state.
3.2. Numerical Simulation
3.2.1. Impact on Thermal Comfort
Figure 8 and Figure 9 show the variation in the operative temperature inside the low-mass (LM) and the high-mass (HM) buildings, respectively, with a U-value for the walls of 0.35 W/(m2.°C), during July and located in Porto. The results include the scenarios without and with an exterior shading device on the glazed windows and the exterior temperature is also depicted.
Overheating issues are visible in all the scenarios and the impact of shading and thermal inertia is also observable. The results highlight the shading devices’ effectiveness, as they considerably reduce the peaks of the operative temperatures during the day, as no direct solar radiation is transmitted through the glazed windows. Although the shading has more impact in the daytime, it also decreases night-time temperatures. As expected, the high-mass building presents more stable operative temperatures, with smaller daily variations, due to its higher heat-storage capacity that acts as a buffer. It must be noted that this fact benefits the indoor thermal environment during the day, but worsens it during the night, as less internal heat is released.
The impact of the shading system is also visible in Figure 10, which depicts the upper and lower limits of thermal comfort, defined in EN 16798 for category II [22], and the hourly values of the operative temperature as a function of the outdoor running mean temperature, for the LM building scenario in Porto, with walls having a U-value of 0.35 W/(m2.°C). As expected, the discomfort is higher without shading (Figure 10a), occurring 65.8% of the time. However, the value decreases to 37.7% when the shading system is used (Figure 10b).
Regarding the impact of the DTIS, Figure 11 shows the values of Indicator 1 and Indicator 2 for all simulated scenarios, separately considering the two U-values. Generically, it is possible to see that, without the use of a shading system, thermal discomfort decreases with the increase in the U-value, both in terms of severity (I1) and duration (I2). The highest reduction in I1 occurs in Porto, decreasing about 9% for the HM building, when the U-value varies from 0.35 W/(m2.°C) to 0.60 W/(m2.°C). In the former scenario, the operative temperature is, on average, 3.5 °C higher than the comfort upper limit, while in the latter, the value decreases to 3.2 °C. On the other hand, I2 presents the highest drop, around 14%, for the HM building located in Bragança. Thus, in Bragança the use of a DTIS has more impact in reducing the percentage of hours with discomfort, while in Porto it is more useful to decrease the discomfort severity. In Faro, this system has less impact, because the thermal amplitudes during the day are lower, which limits its positive effect in terms of duration.
Although Bragança has one of the highest values for discomfort severity, because temperatures during the day are very high, it presents the lowest percentage of hours with discomfort. This arises from the lowest exterior night temperatures, which improve the building’s response to overheating by enhancing the heat release through the façade. Faro is the region with the highest percentage of hours with discomfort, for both the LM or the HM building, because it presents the highest exterior temperatures during the day and night.
When an exterior shading system is applied, the previous conclusions do not apply, as, in this case, the direction of heat flux throughout the day changes (outward or inward), depending on the incident solar radiation. In fact, when the interior temperatures are lower, because of the effect of the shading system, the impact of the solar radiation increases its relevance in the heat transfer phenomena. In this scenario, the values of the performance indicators are lower than without shading, showing its effectiveness in mitigating overheating. However, that also means that the number of hours when it is useful to have a higher U-value decreases. These results confirm that a dynamic U-value will be more effective in situations of more pronounced overheating.
Another aspect that must be noted is that a DTIS implemented in the HM building has a greater impact than in the LM building because the differences between the performance indicators are higher. Although these are preliminary results, which require further and deeper studies, they are, even so, meaningful, as they clearly point out that the less dynamic behavior of an HM building can be compensated by a highly dynamic thermal insulation.
3.2.2. Functional Performance of the Wall System
Figure 12 shows, for a generic scenario, the boundary conditions required for the conductive state to be useful, i.e., the period in which it can be interesting to have a higher U-value to dissipate heat through the façade. The following boundary conditions are considered: the interior surface temperature must be higher than the exterior one, inducing an outward heat flux; and, simultaneously, the operative temperature (assumed similar to the interior surface temperature in Figure 12) must be above 25 °C. These periods are highlighted in yellow.
As heat flux through the façade varies with orientation due to incident solar radiation, the system may also have a differential performance for different orientations, as Figure 13 shows. These graphs display the difference between the interior and exterior surface temperatures for the 168 h simulation, by orientation, for a low-mass building located in Porto, when no shading device is used. When the temperature difference is positive, the heat flux is from the exterior to the interior. When it is negative, the flux is from the interior to the exterior, and, only in this case, it can be useful to have a high U-value. The higher the negative difference between the surface temperatures, the higher the heat flux, favoring the use of a high U-value.
In Figure 13, the north-oriented façade has the highest negative differences because no direct solar radiation reaches the façade, so only the effect of the ambient temperatures acts as a load for heat transfer. The north-oriented façade is, therefore, the one that would benefit the most from having a DTIS. Indeed, for the 168 h that were simulated, in 156 h, the temperature differences are negative, corresponding to 93% of the simulated time. For the east-oriented façade, this percentage decreases to 71%. The percentages for the west-oriented and south-oriented façades are 79% and 80%, respectively.
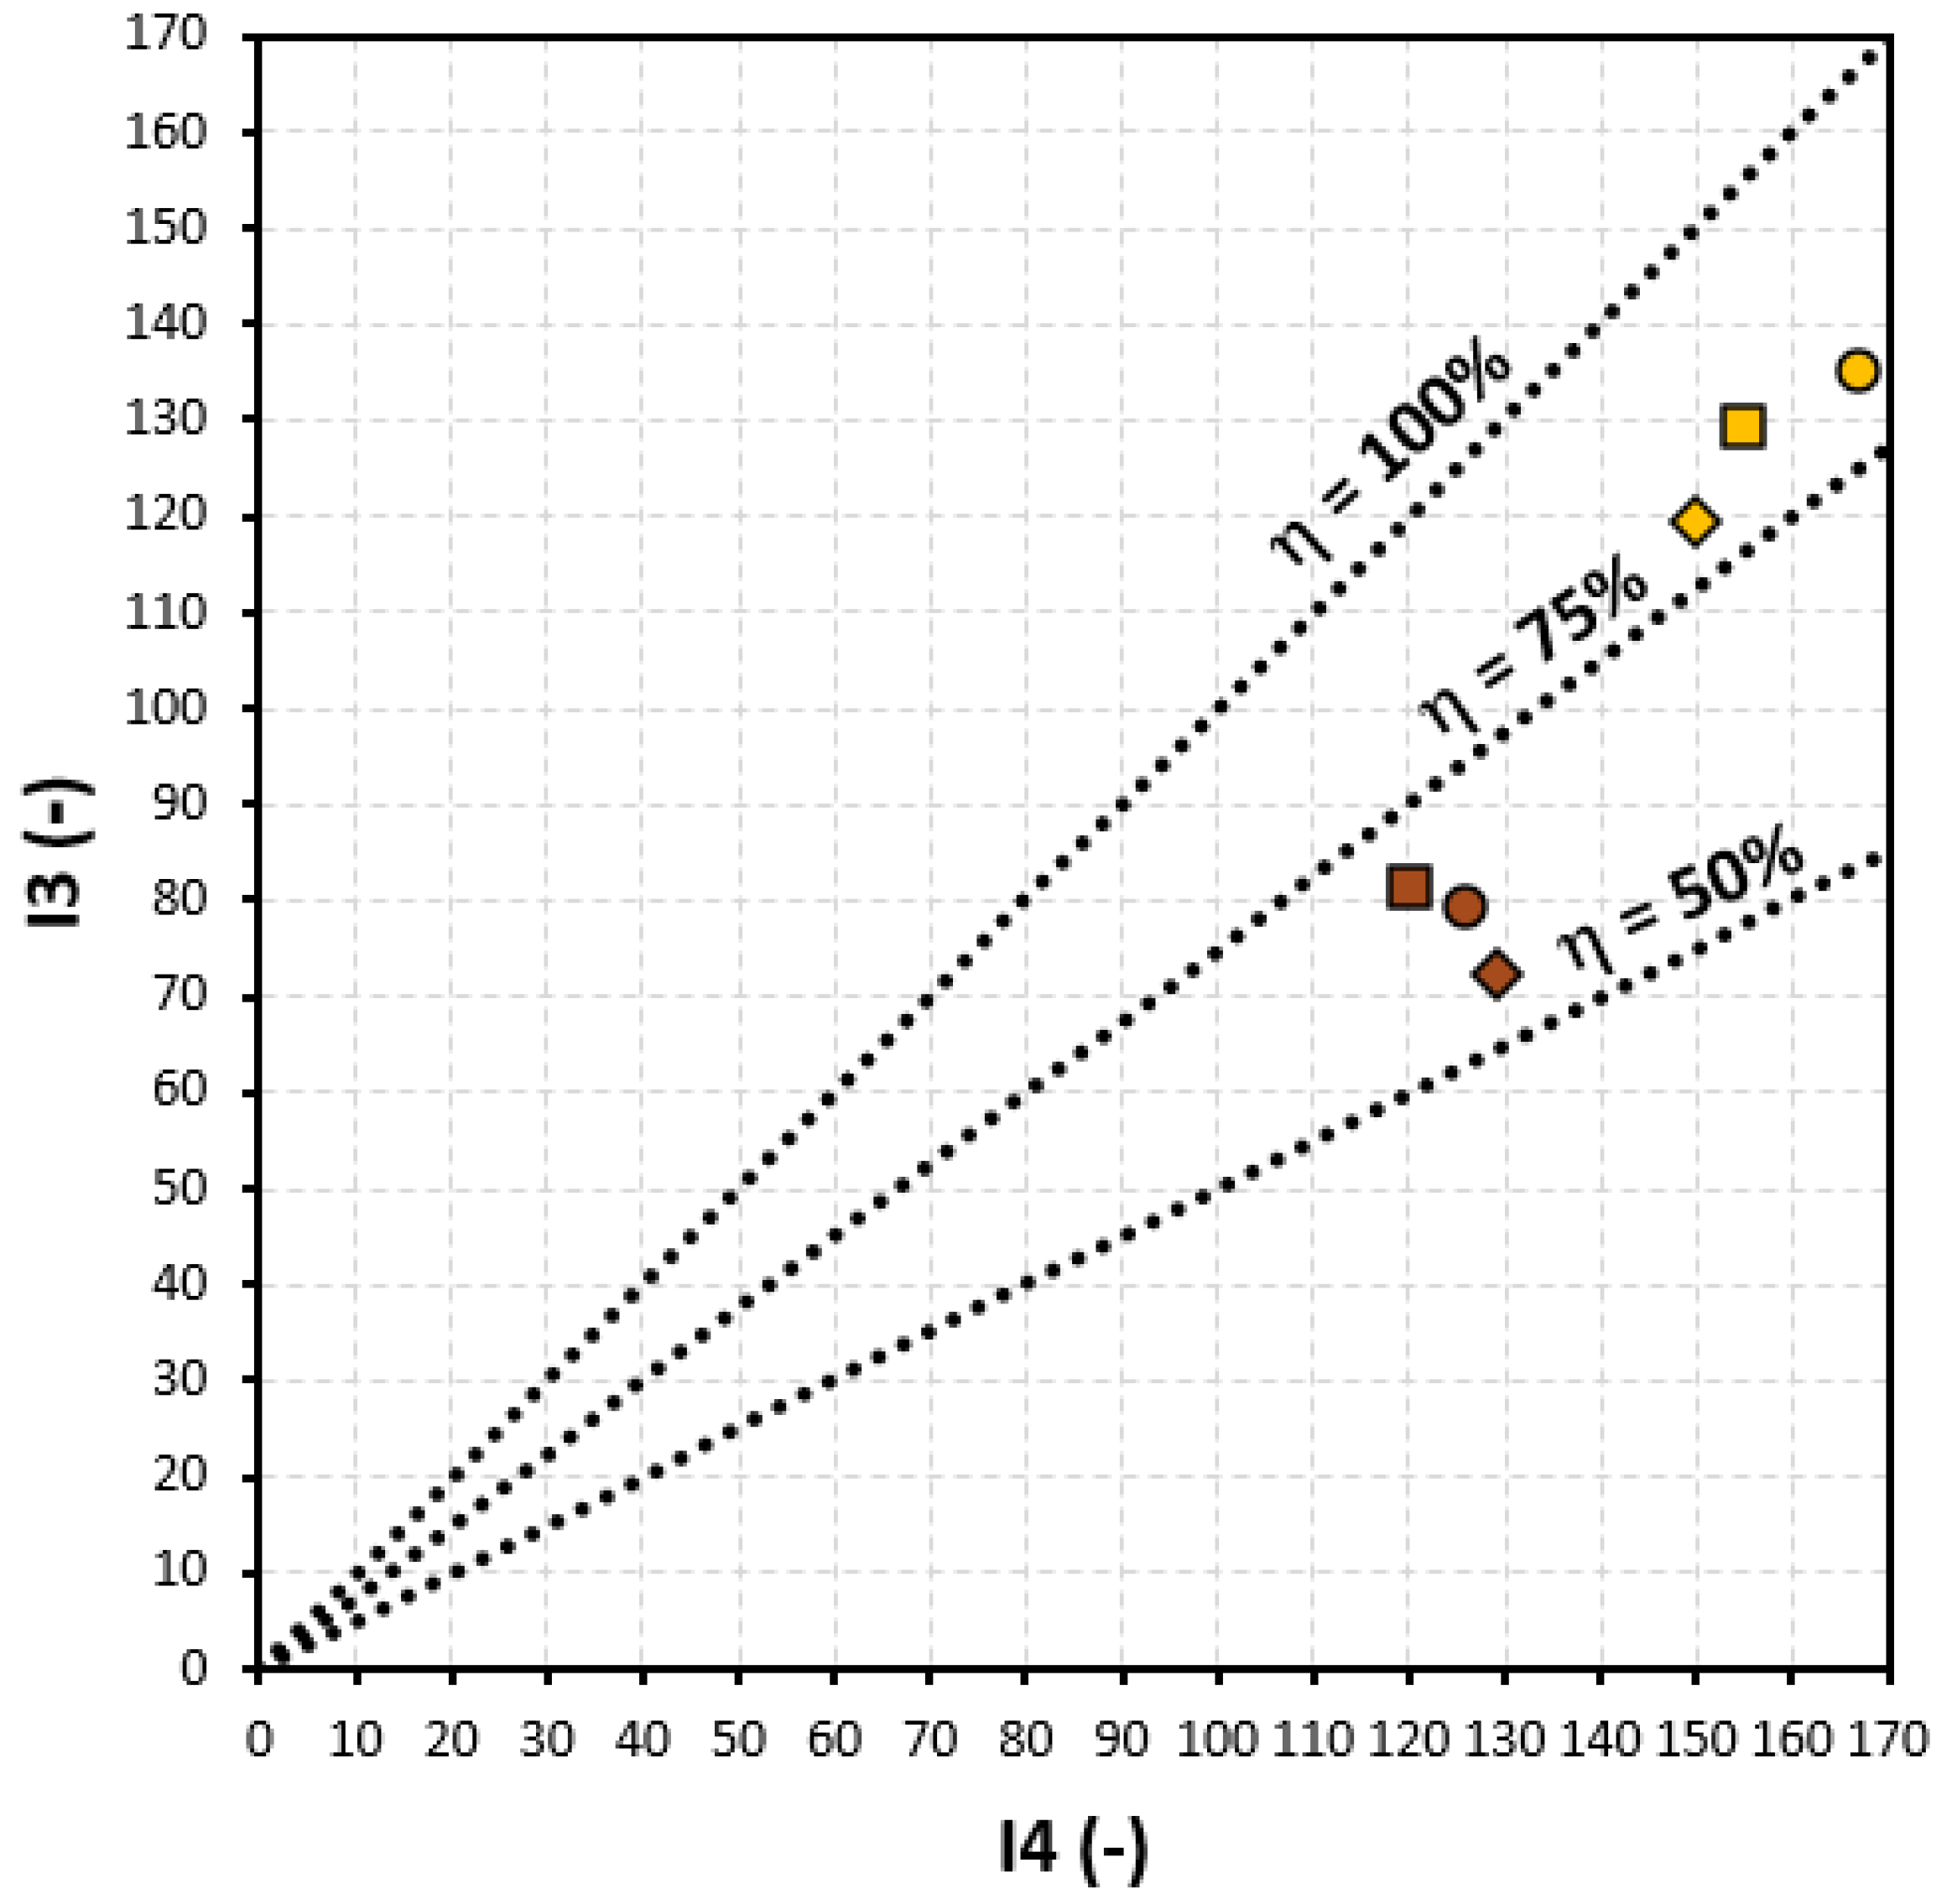
Figure 14 relates the global number of hours with discomfort by overheating (I4) with the number of hours when having a DTIS is useful (I3). When both indicators are equal, the efficiency of a DTIS is 100%; that is, the DTIS would be useful during the entire period of overheating.
The positive effect of the DTIS is observable for all the simulated scenarios. When the shading device is used, the DTIS is useful more than 50% of the time with discomfort (56% in Bragança, 63% in Porto, and 68% in Faro). In contrast, when there is no shading system, the percentage increases to more than 75% of the time (80% in Bragança, 81% in Porto, and 84% in Faro). Moreover, it is possible to state that, without shading, the outdoor climate has a lower impact on the efficiency of the DTIS, but, when indoor temperatures decrease due to the use of a shading device, different cities present different results, with Faro benefiting the most and Bragança the least. These results also show that a DTIS can be interesting even in locations with mild climates like Porto.
4. Conclusions
This study presents and discusses the performance of a dynamic thermal insulation system (DTIS). To that end, a laboratory prototype was tested considering two states, insulation and conductive, and its performance was simulated in different conditions. A methodology to assess the actual effectiveness of the functional performance of the wall system is also presented. From the results, the following conclusions can be drawn:
- The use of forced ventilation on the air gap of a multi-layer wall can be an effective solution to create a DTIS;
- The laboratory tests showed that this system can lead to a reduction of approximately 60% in the thermal resistance of the wall;
- The simulations confirmed the positive impact of lower thermal resistance in minimizing overheating. A U-value of 0.60 W/(m2.°C) was always beneficial to decrease the percentage of hours with discomfort by overheating, reaching a maximum reduction of 14%, and a maximum reduction in the severity of the discomfort of 9%, when compared with the results achieved with a U-value of 0.35 W/(m2.°C);
- The importance of thermal inertia was also verified, as the effect of the DTIS was more evident in the high-mass building when compared with the low-mass one;
- The façade orientation has an important impact on the superficial temperature, and thus the operation of the DTIS can be different in each wall;
- In the case study, even when the shading system was on, the higher U-value was useful more than 50% of the time with discomfort. This value increases to 75% when the shading system was off. Thus, one can conclude that the positive impact of the DTIS was higher in scenarios without shading;
- The DTIS can be an important element to mitigate overheating and its effect can be interesting even in mild climates.
Despite the relevant findings of this work, these results can only be considered preliminary and more tasks must be carried out in the future, namely: (i) more detailed and precise experimental tests must be performed, including the evaluation of the uncertainty of the experimental results; (ii) the combination of this wall system with other overheating mitigation measures will be assessed through numerical simulation, considering different case-study configurations and different periods of the day, seeking the functional optimization of the system, to propose actual solutions to oppose the overheating phenomenon.
Author Contributions
Conceptualization, R.M.S.F.A. and E.B.; methodology, R.M.S.F.A. and E.B.; formal analysis, R.M.S.F.A., M.T.-R. and E.B.; resources, E.B.; data curation, R.M.S.F.A. and M.T.-R.; writing—original draft preparation, M.T.-R.; writing—review and editing, R.M.S.F.A. and E.B.; supervision, R.M.S.F.A. and E.B.; project administration, E.B. All authors have read and agreed to the published version of the manuscript.
Funding
This work was financially supported by: (i) Base Funding—UIDB/04708/2020 of the CONSTRUCT—Instituto de I&D em Estruturas e Construções—funded by national funds through the FCT/MCTES (PIDDAC); and (ii) national funds through the FCT, under the special financial support “Verão com Ciência 2022”.
Data Availability Statement
Not applicable.
Conflicts of Interest
The authors declare no conflict of interest.
References
- Santamouris, M.; Vasilakopoulou, K. Present and future energy consumption of buildings: Challenges and opportunities towards decarbonization. e-Prime-Adv. Electr. Eng. Electron. Energy 2021, 1, 100002. [Google Scholar] [CrossRef]
- Nordhaus, W. Climate Change: The Ultimate Challenge for Economics. Am. Econ. Rev. 2019, 109, 1991–2014. [Google Scholar] [CrossRef]
- IEA. Energy and Air Pollution: World Energy Outlook Special Report; International Energy Agency: Paris, France, 2016. [Google Scholar]
- Ramos, N.M.M.; Almeida, R.M.S.F.; Simões, M.L.; Delgado, J.M.P.Q.; Pereira, P.F.; Curado, A.; Soares, S.; Fraga, S. Indoor hygrothermal conditions and quality of life in social housing: A comparison between two neighbourhoods. Sustain. Cities Soc. 2018, 38, 80–90. [Google Scholar] [CrossRef]
- Zhao, Q.; Lian, Z.; Lai, D. Thermal comfort models and their developments: A review. Energy Built Environ. 2021, 2, 21–33. [Google Scholar] [CrossRef]
- Almeida, R.M.S.F.; Barreira, E.; Simões, M.L.; Sousa, T.S.F. Infrared Thermography to Evaluate Thermal Comfort under Controlled Ambient Conditions. Appl. Sci. 2022, 12, 12105. [Google Scholar] [CrossRef]
- Niza, I.L.; Broday, E.E. An Analysis of Thermal Comfort Models: Which One Is Suitable Model to Assess Thermal Reality in Brazil? Energies 2022, 15, 5429. [Google Scholar] [CrossRef]
- Grassi, B.; Piana, E.A.; Lezzi, A.M.; Pilotelli, M. A Review of Recent Literature on Systems and Methods for the Control of Thermal Comfort in Buildings. Appl. Sci. 2022, 12, 5473. [Google Scholar] [CrossRef]
- Laouadi, A.; Bartko, M.; Lacasse, M.A. A new methodology of evaluation of overheating in buildings. Energy Build. 2020, 226, 110360. [Google Scholar] [CrossRef]
- Pereira, P.F.; Ramos, N.M.M.; Almeida, R.M.S.F.; Lurdes Simões, M. Methodology for detection of occupant actions in residential buildings using indoor environment monitoring systems. Build. Environ. 2018, 146, 107–118. [Google Scholar] [CrossRef]
- Carlucci, S.; Bai, L.; de Dear, R.; Yang, L. Review of adaptive thermal comfort models in built environmental regulatory documents. Build. Environ. 2018, 137, 73–89. [Google Scholar] [CrossRef]
- Marcolini, M.; Almeida, R.M.S.F.; Barreira, E. Evaluation of the Effect of Passive Cooling Techniques on Thermal Comfort Using Test Cells in the Northern Region of Brazil. Appl. Sci. 2022, 12, 1546. [Google Scholar] [CrossRef]
- Morten, W. Strategies for Mitigating the Risk of Overheating in Current and Future Climate Scenarios: Applying Lessons from Passivhaus to Contemporary Housing; Encraft Securing Your Future: New Delhi, India, 2015. [Google Scholar]
- Randazzo, T.; Cian, E.; Mistry, M.N. Air conditioning and electricity expenditure: The role of climate in temperate countries. Econ. Model. 2020, 90, 273–287. [Google Scholar] [CrossRef]
- Sherman, P.; Lin, H.; McElroy, M. Projected global demand for air conditioning associated with extreme heat and implications for electricity grids in poorer countries. Energy Build. 2022, 268, 112198. [Google Scholar] [CrossRef]
- Rana, K. Towards Passive Design Strategies for Improving Thermal Comfort Performance in a Naturally Ventilated Residence. J. Sustain. Archit. Civ. Eng. 2021, 2, 150–174. [Google Scholar] [CrossRef]
- Malça, J.; Almeida, R.M.S.F.; Mendes Silva, J.A.R. Evaluation of the Hygrothermal Conditions of a Typical Residential Building in the Azores Archipelago. Energies 2023, 16, 5075. [Google Scholar] [CrossRef]
- Marvuglia, A.; Koppelaar, R.; Rugani, B. The effect of green roofs on the reduction of mortality due to heatwaves: Results from the application of a spatial microsimulation model to four European cities. Ecol. Model. 2020, 438, 109351. [Google Scholar] [CrossRef]
- Imessad, K.; Derradji, L.; Messaoudene, N.A.; Mokhtari, F.; Chenak, A.; Kharchi, R. Impact of passive cooling techniques on energy demand for residential buildings in a Mediterranean climate. Renew. Energy 2014, 71, 589–597. [Google Scholar] [CrossRef]
- Romeo, C.; Zinzi, M. Impact of a cool roof application on the energy and comfort performance in an existing non-residential building. A Sicilian case study. Energy Build. 2013, 67, 647–657. [Google Scholar] [CrossRef]
- Chvatal, K.; Corvacho, H. The impact of increasing the building envelope insulation upon the risk of overheating in summer and an increased energy consumption. J. Build. Perform. Simul. 2009, 2, 267–282. [Google Scholar] [CrossRef]
- Aelenei, D.; Aelenei, L.; Vieira, C. Adaptive Façade: Concept, Applications, Research Questions. Energy Procedia 2016, 91, 269–275. [Google Scholar] [CrossRef]
- Tabadkani, A.; Roetzel, A.; Xian Li, H.; Tsangrassoulis, A. A review of automatic control strategies based on simulations for adaptive façades. Build. Environ. 2020, 125, 106801. [Google Scholar] [CrossRef]
- Attia, S.; Favoino, F.; Loonen, R.; Petrovski, A.; Monge-Barrio, A. Adaptive Façades System Assessment: An initial review. In Proceedings of the10th Conference on Advanced Building Skins, Bern, Switzerland, 3–4 November 2015. [Google Scholar]
- Attia, S.; Bilir, S.; Safy, T.; Struck, C.; Loonen, R.; Goia, F. Current trends and future challenges in the performance assessment of adaptive façade systems. Energy Build. 2018, 179, 165–182. [Google Scholar] [CrossRef]
- Karanafti, A.; Theodosiou, T.; Tsikaloudaki, K. Assessment of buildings’ dynamic thermal insulation technologies—A review. Appl. Energy 2022, 326, 119985. [Google Scholar] [CrossRef]
- ISO 9869-1:2014; Thermal Insulation—Building Elements—In Situ Measurement of Thermal Resistance and Thermal Transmittance. ISO: Geneva, Switzerland, 2014.
- DOE. EnergyPlus Engineering Reference: The Encyclopedic Reference to EnergyPlus Calculations; U.S. Department of Energy: Washington, DC, USA, 2014. [Google Scholar]
- ANSI/ASHRAE Standard 140–2017; Standard Method of Test for the Evaluation of Building Energy Analysis Computer Programs. American Society of Heating, Refrigerating, and Air-Conditioning Engineers: Atlanta, GA, USA, 2017.
- EN 16798-2; Guideline for Using Indoor Environmental Input Parameters for the Design and Assessment of Energy Performance of Buildings. CEN: Bruxelles, Brussels, 2014.
Figure 1.
Conceptual framework.
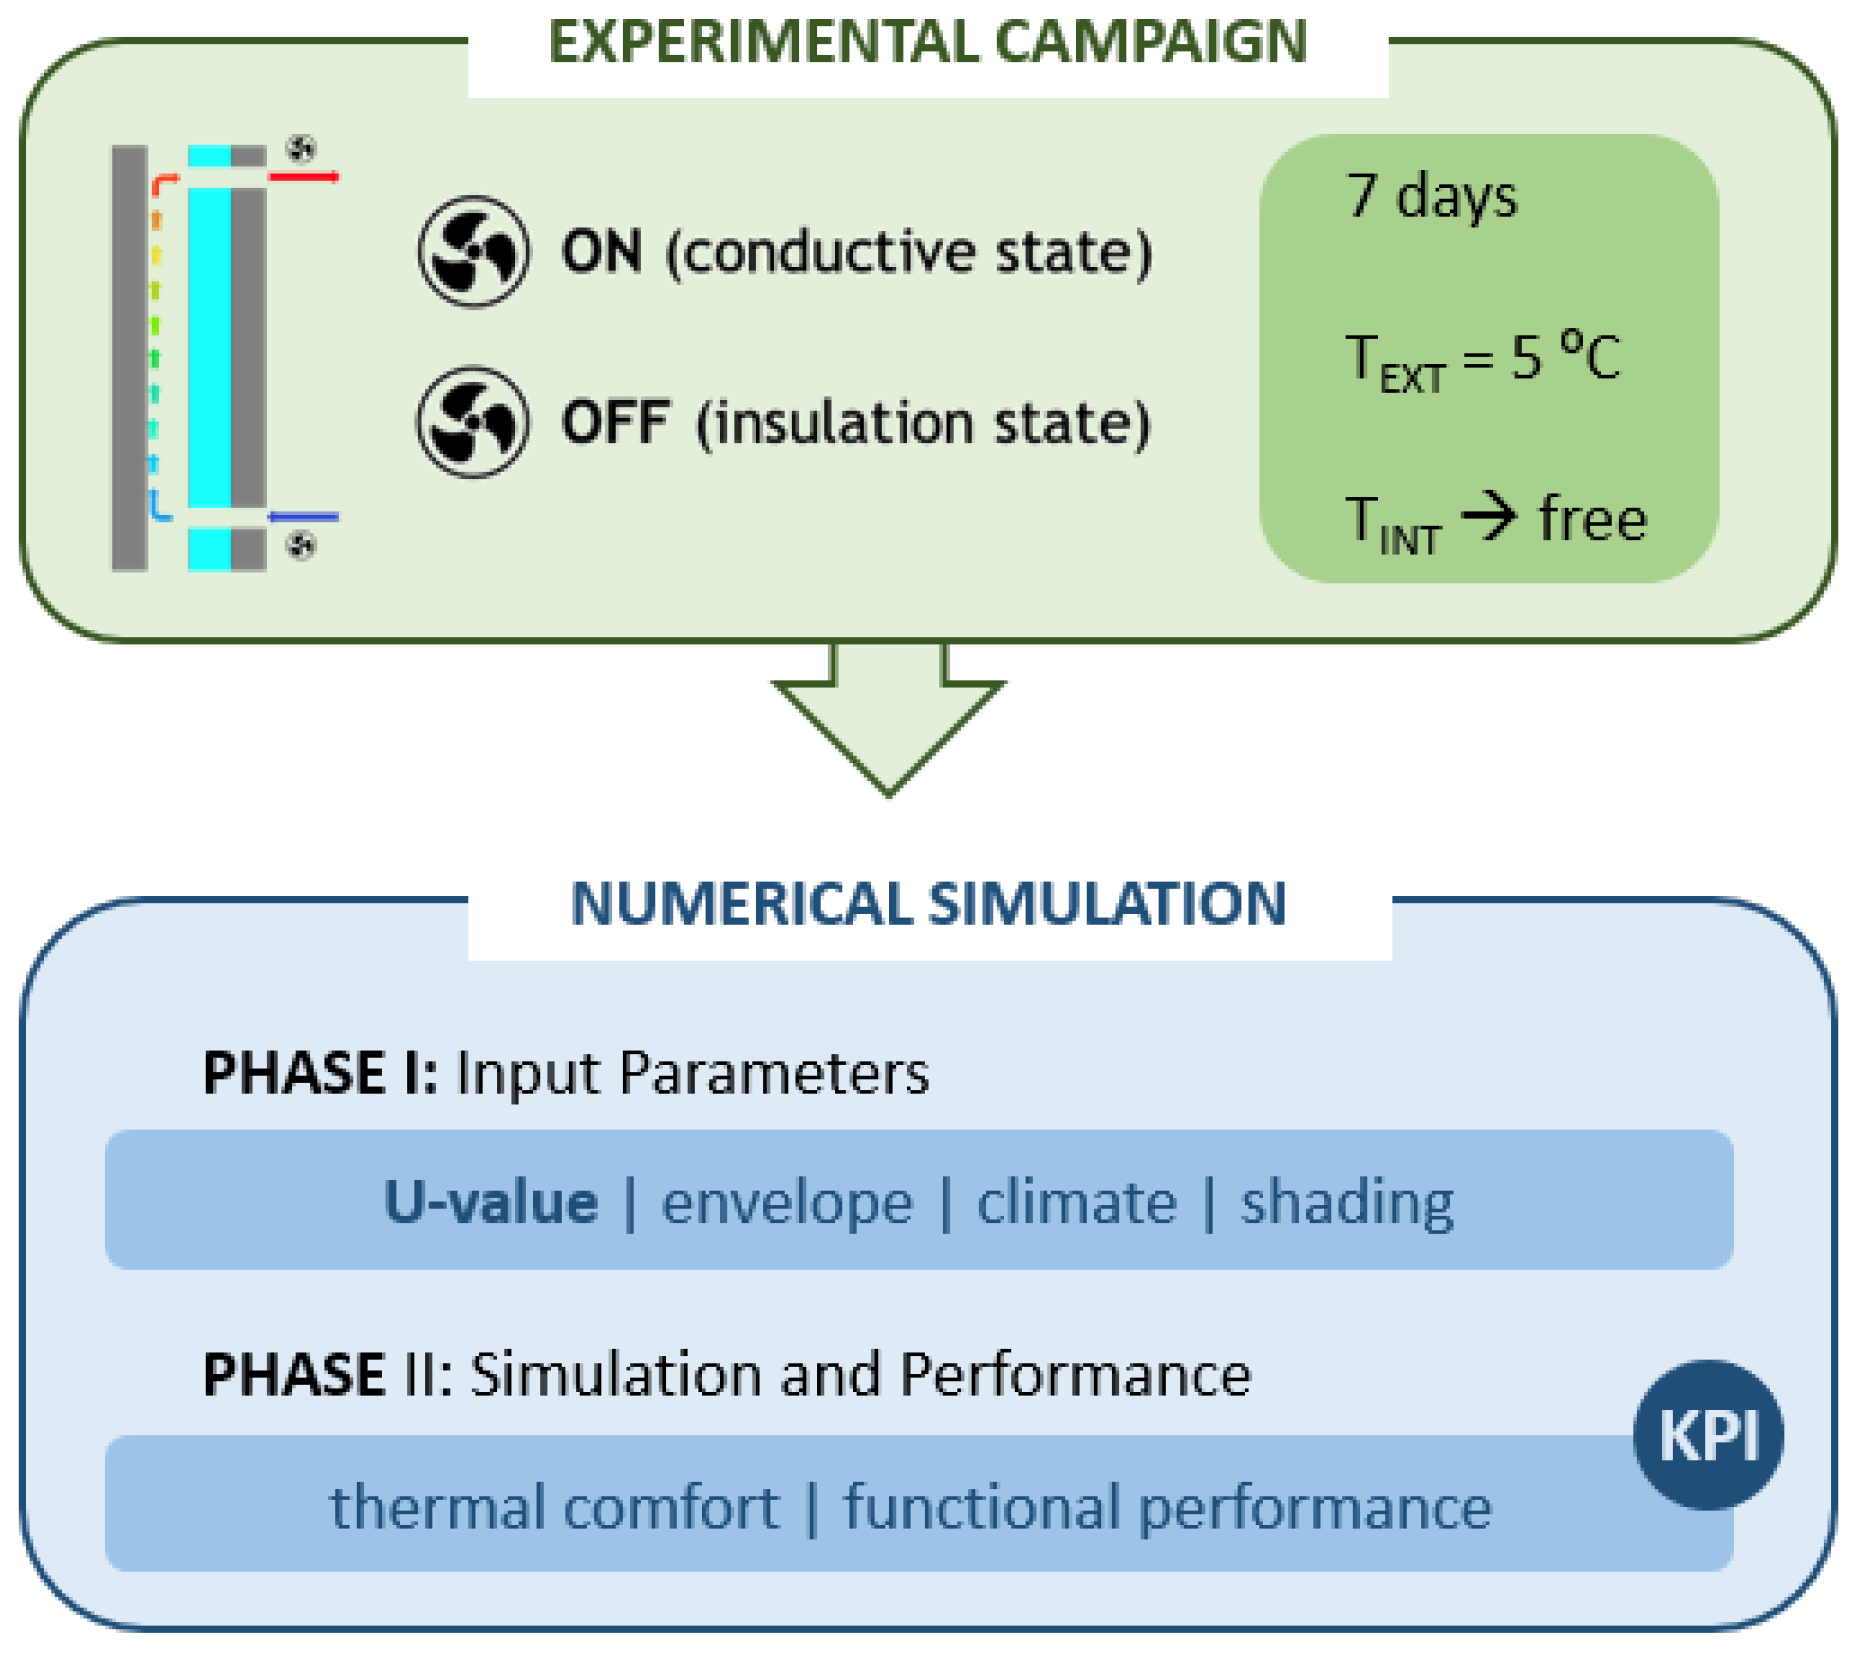
Figure 2.
Dynamic wall system developed for this work: (a) Schematic representation; (b) Experimental setup.
Figure 2.
Dynamic wall system developed for this work: (a) Schematic representation; (b) Experimental setup.

Figure 3.
Overview of the numerical simulation workflow m2.

Figure 4.
Monthly mean and maximum air temperatures in Porto, Faro, and Bragança.
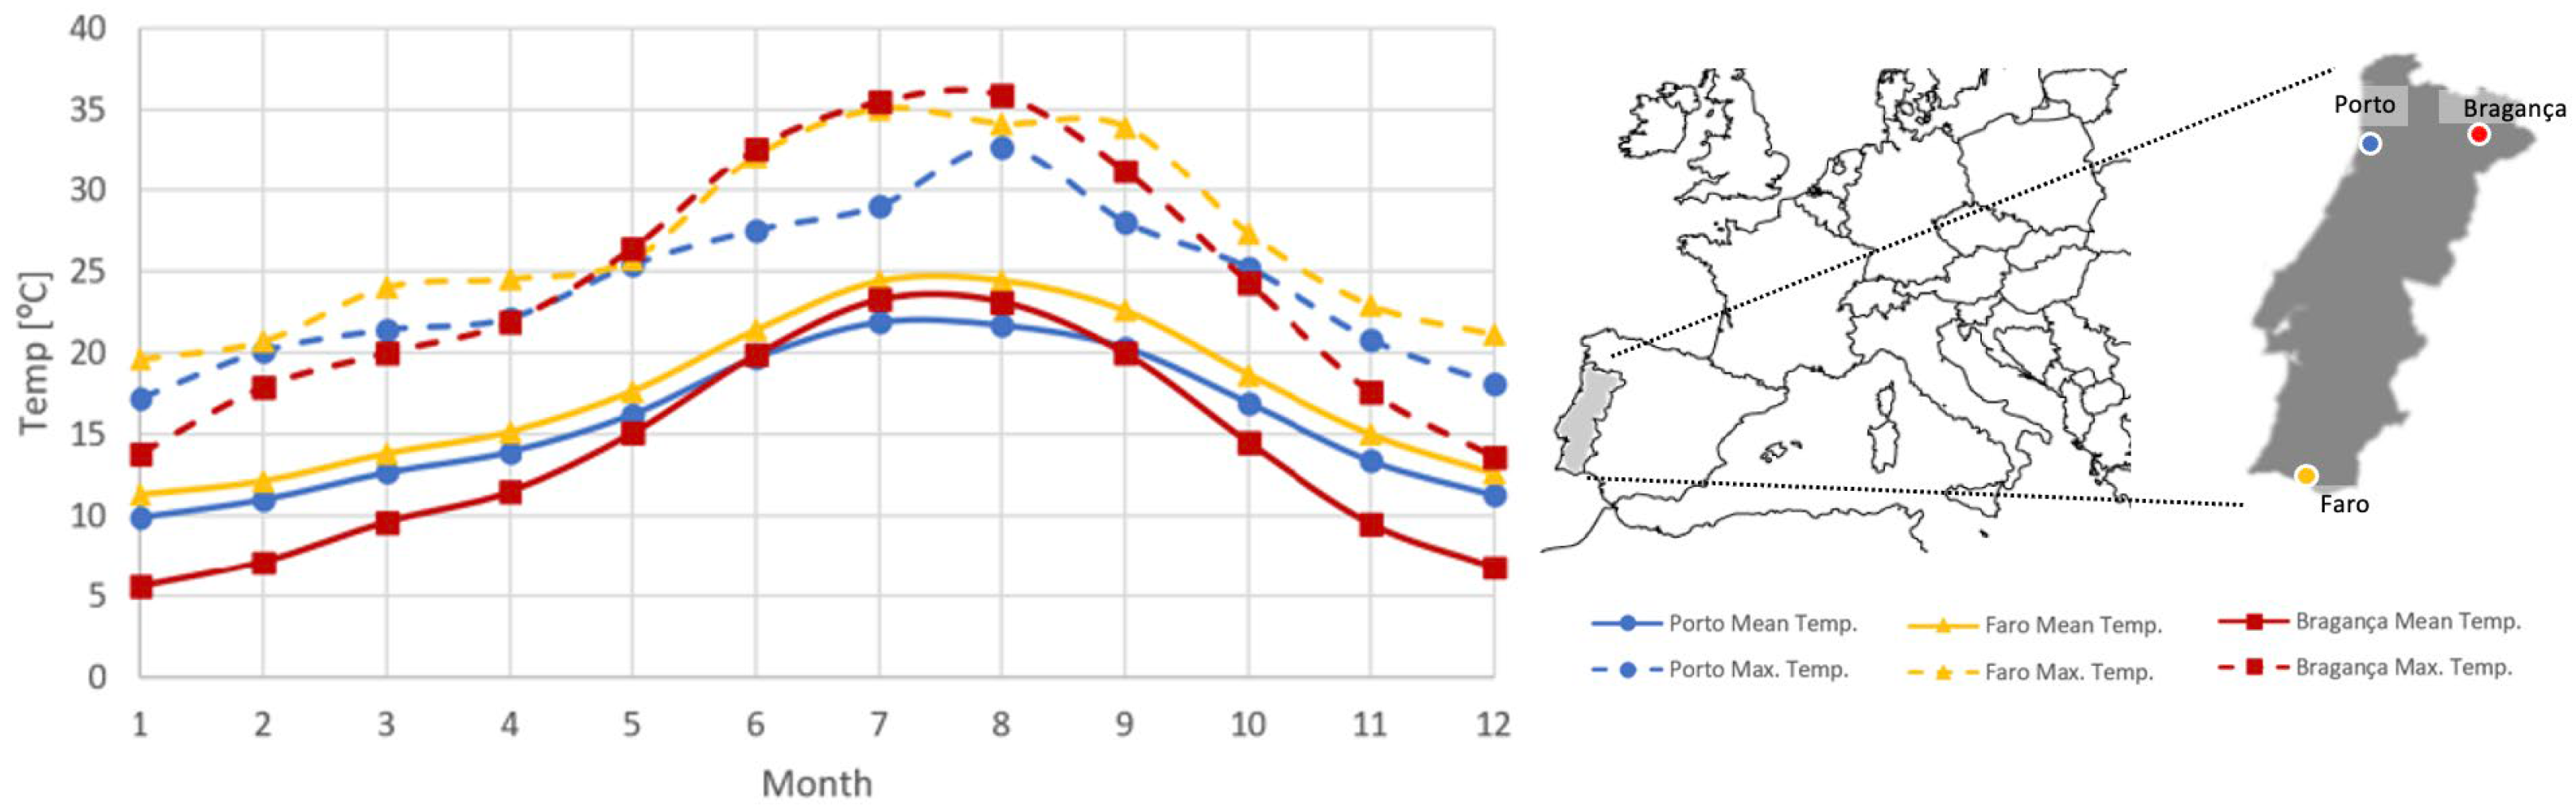
Figure 5.
Ambient temperatures (exterior, interior, and air gap) over time for Test 1, with mechanical ventilation of the air gap off (insulation state).
Figure 5.
Ambient temperatures (exterior, interior, and air gap) over time for Test 1, with mechanical ventilation of the air gap off (insulation state).

Figure 6.
Ambient temperatures (exterior, interior, and air gap) over time for Test 2, with mechanical ventilation of the air gap on (conductive state).
Figure 6.
Ambient temperatures (exterior, interior, and air gap) over time for Test 2, with mechanical ventilation of the air gap on (conductive state).
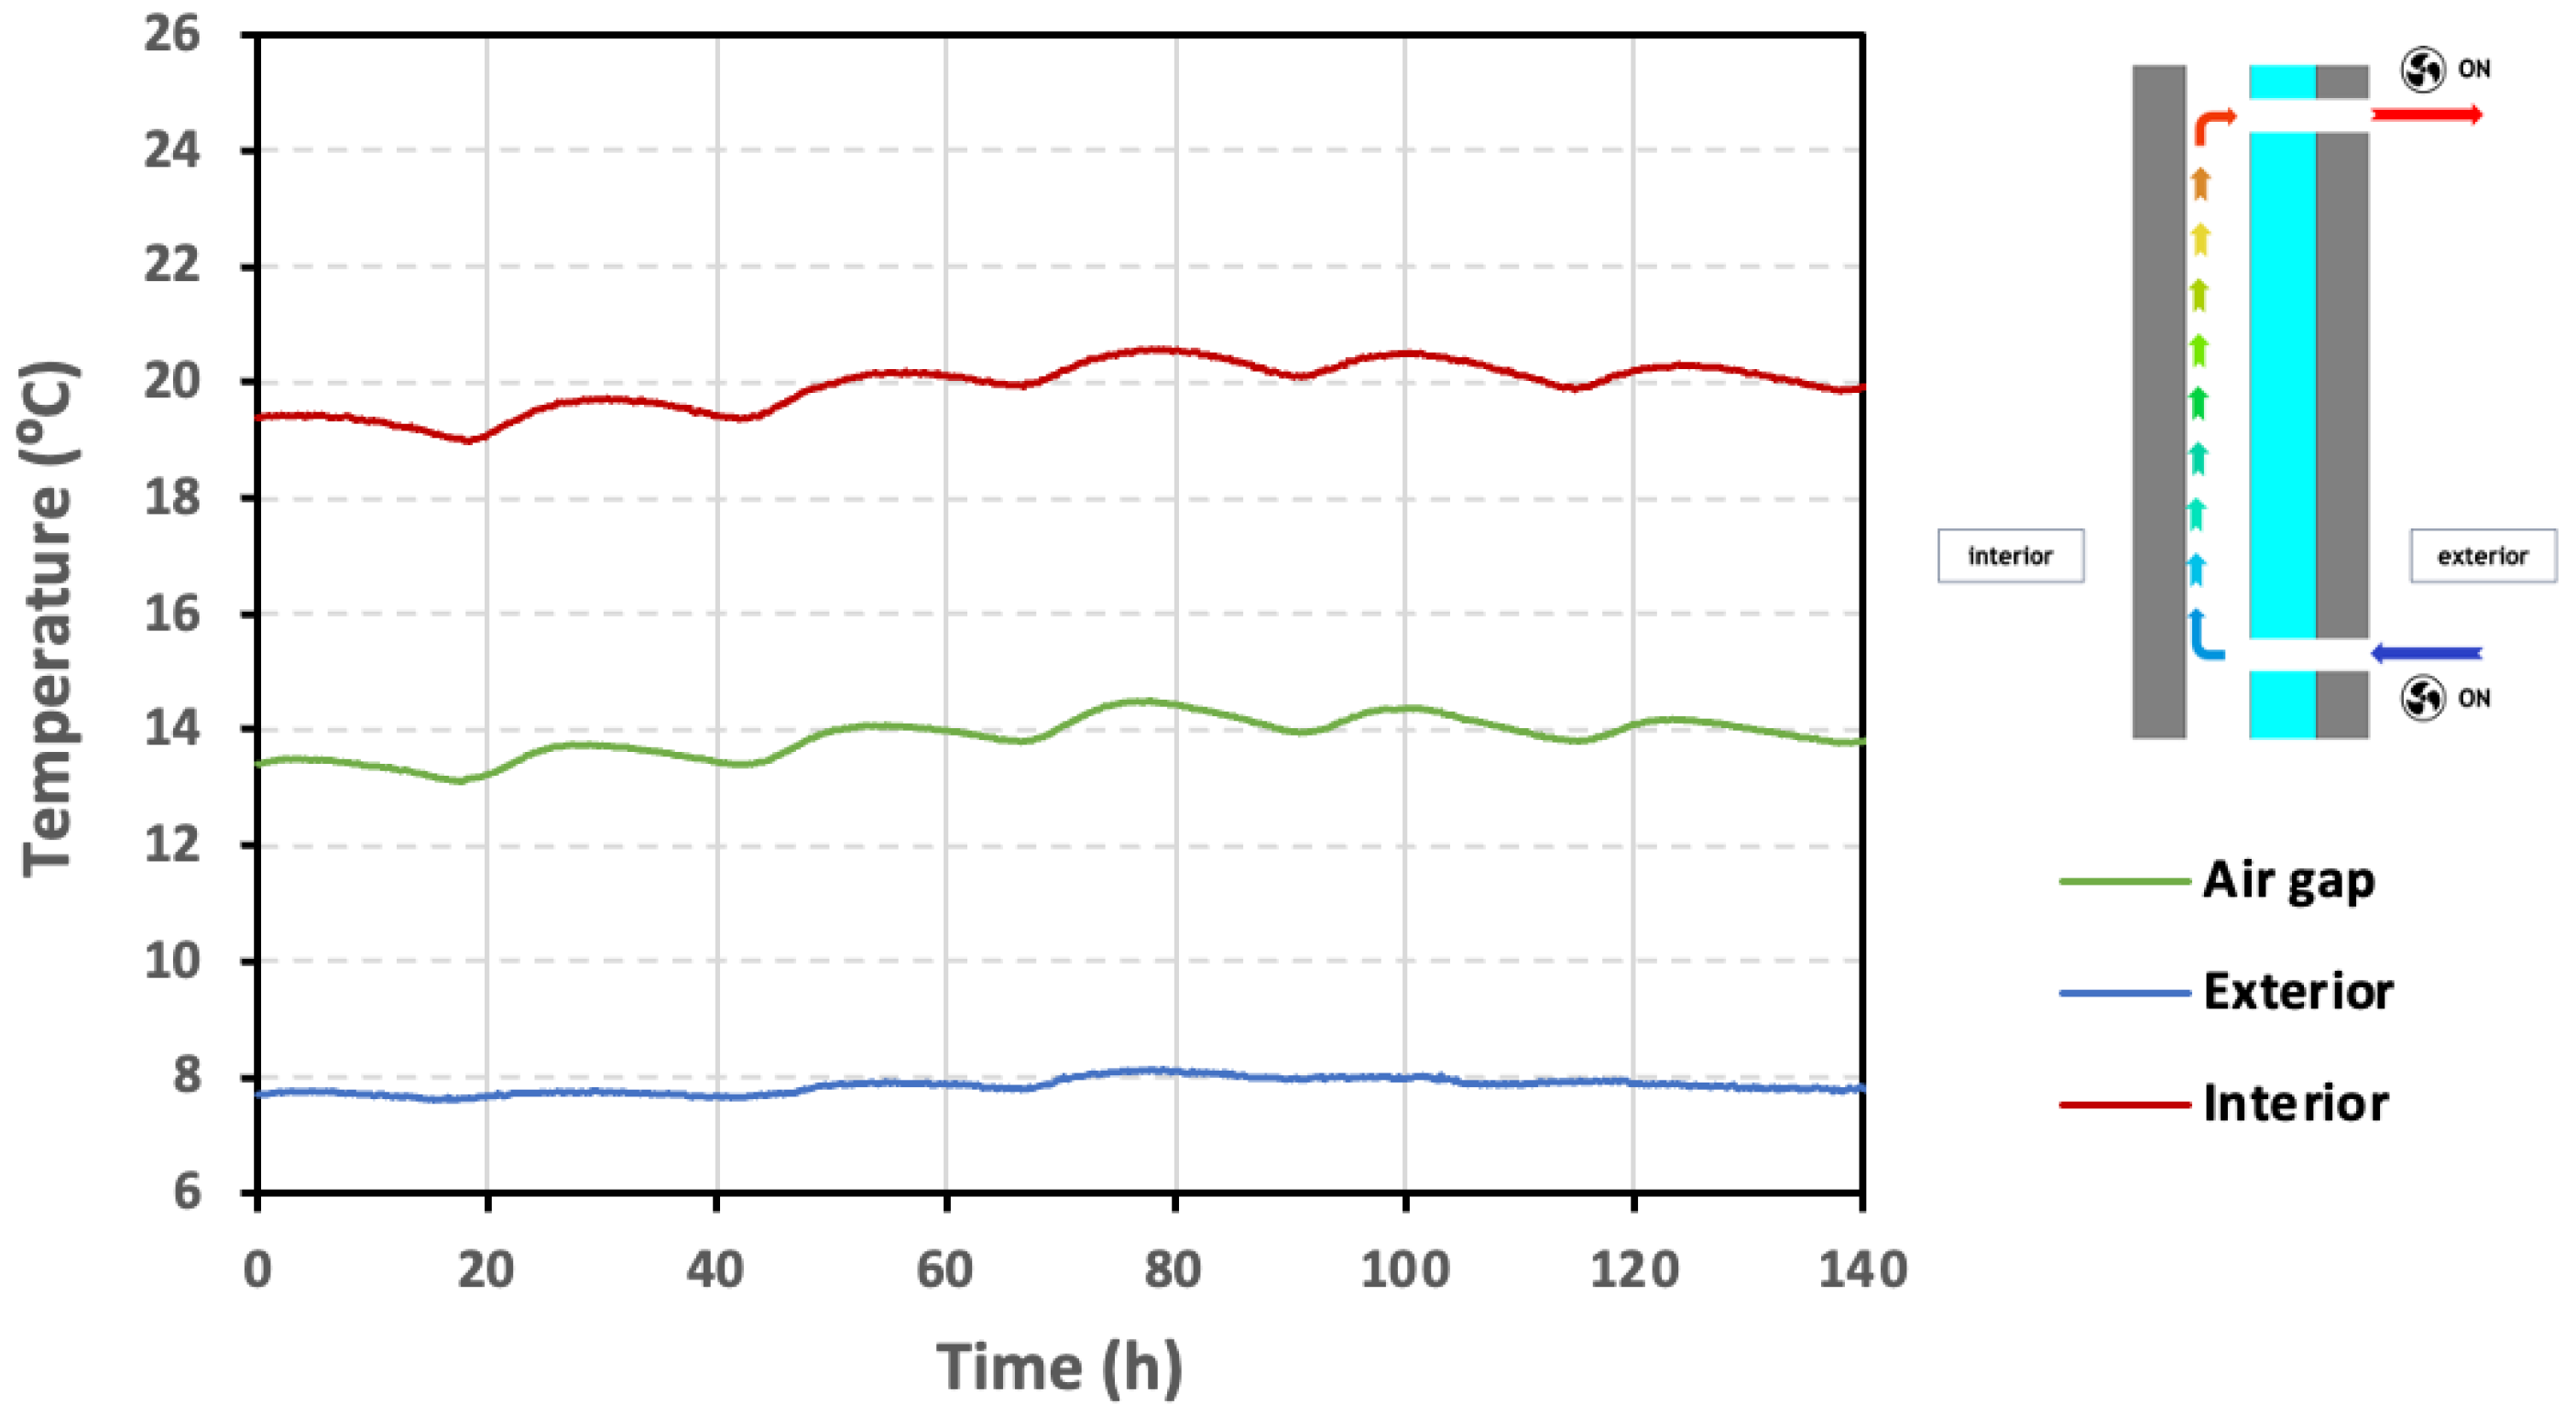
Figure 7.
Thermal resistance of the wall system over time for Test 1 (insulation state), with mechanical ventilation of the air gap off, and for Test 2 (conductive state), with mechanical ventilation of the air gap on.
Figure 7.
Thermal resistance of the wall system over time for Test 1 (insulation state), with mechanical ventilation of the air gap off, and for Test 2 (conductive state), with mechanical ventilation of the air gap on.

Figure 8.
Temperatures in July, for the LM building with the walls U-value of 0.35 W/(m2.°C), located in Porto.
Figure 8.
Temperatures in July, for the LM building with the walls U-value of 0.35 W/(m2.°C), located in Porto.
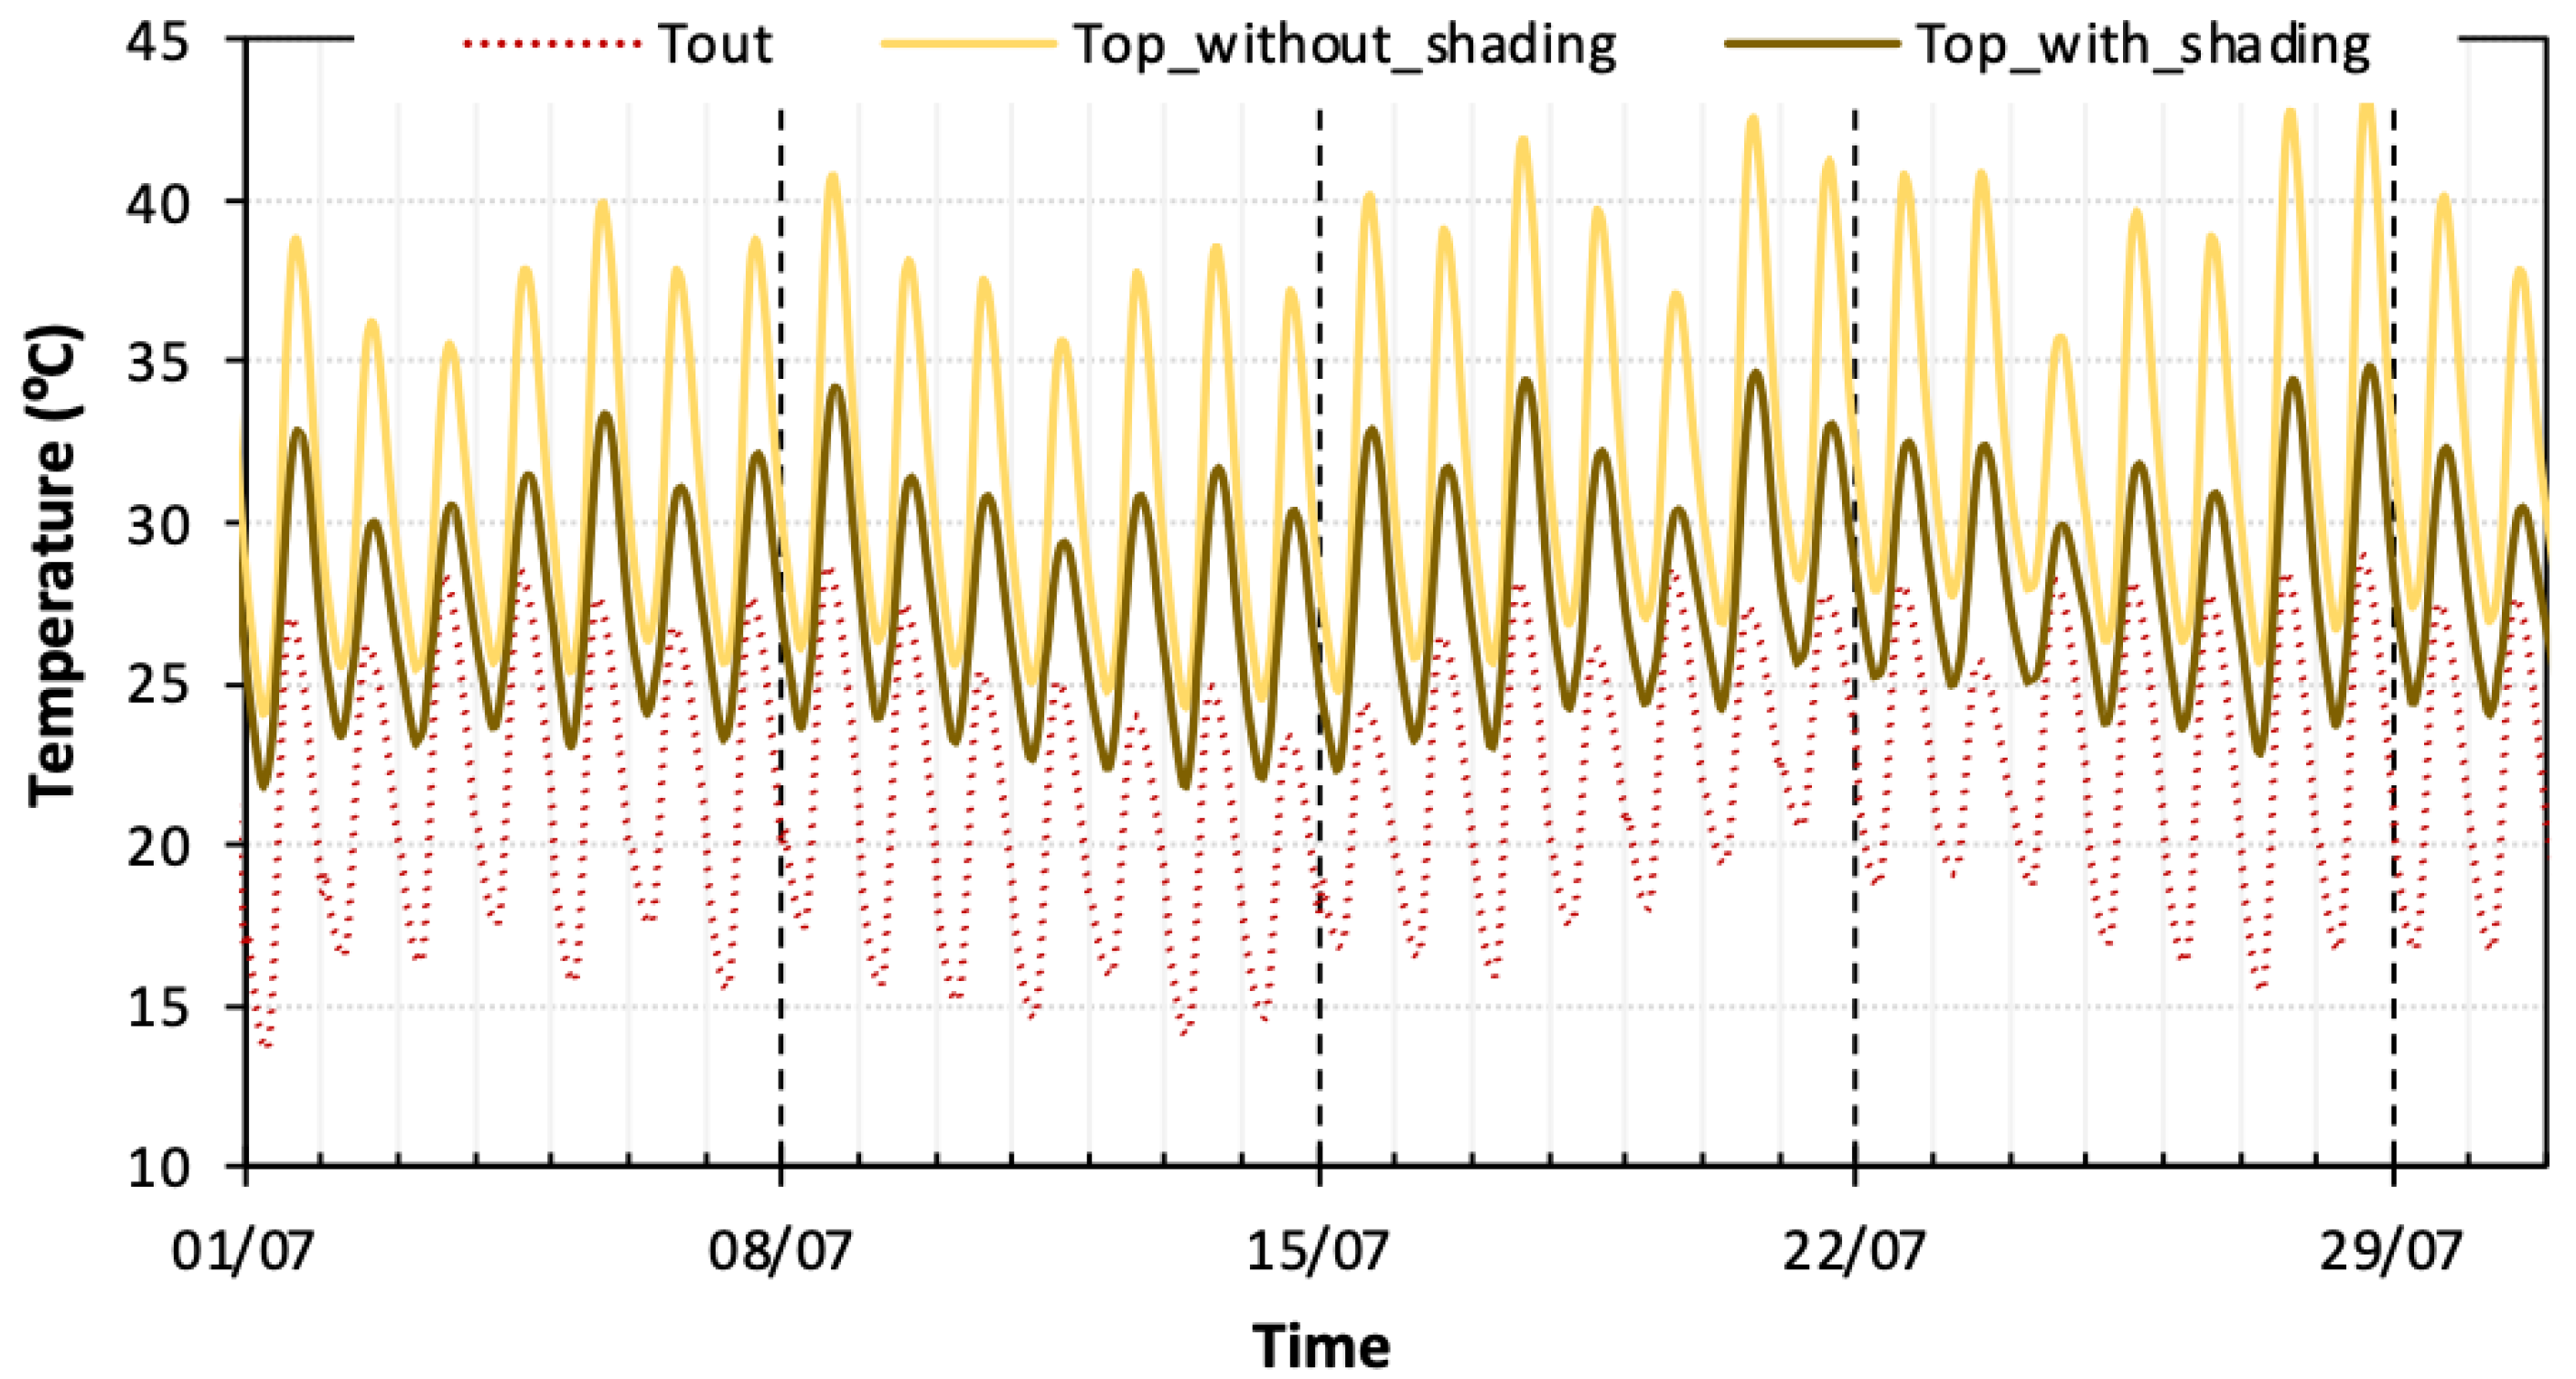
Figure 9.
Temperatures in July, for the HM building with the walls U-value of 0.35 W/(m2.°C), located in Porto.
Figure 9.
Temperatures in July, for the HM building with the walls U-value of 0.35 W/(m2.°C), located in Porto.
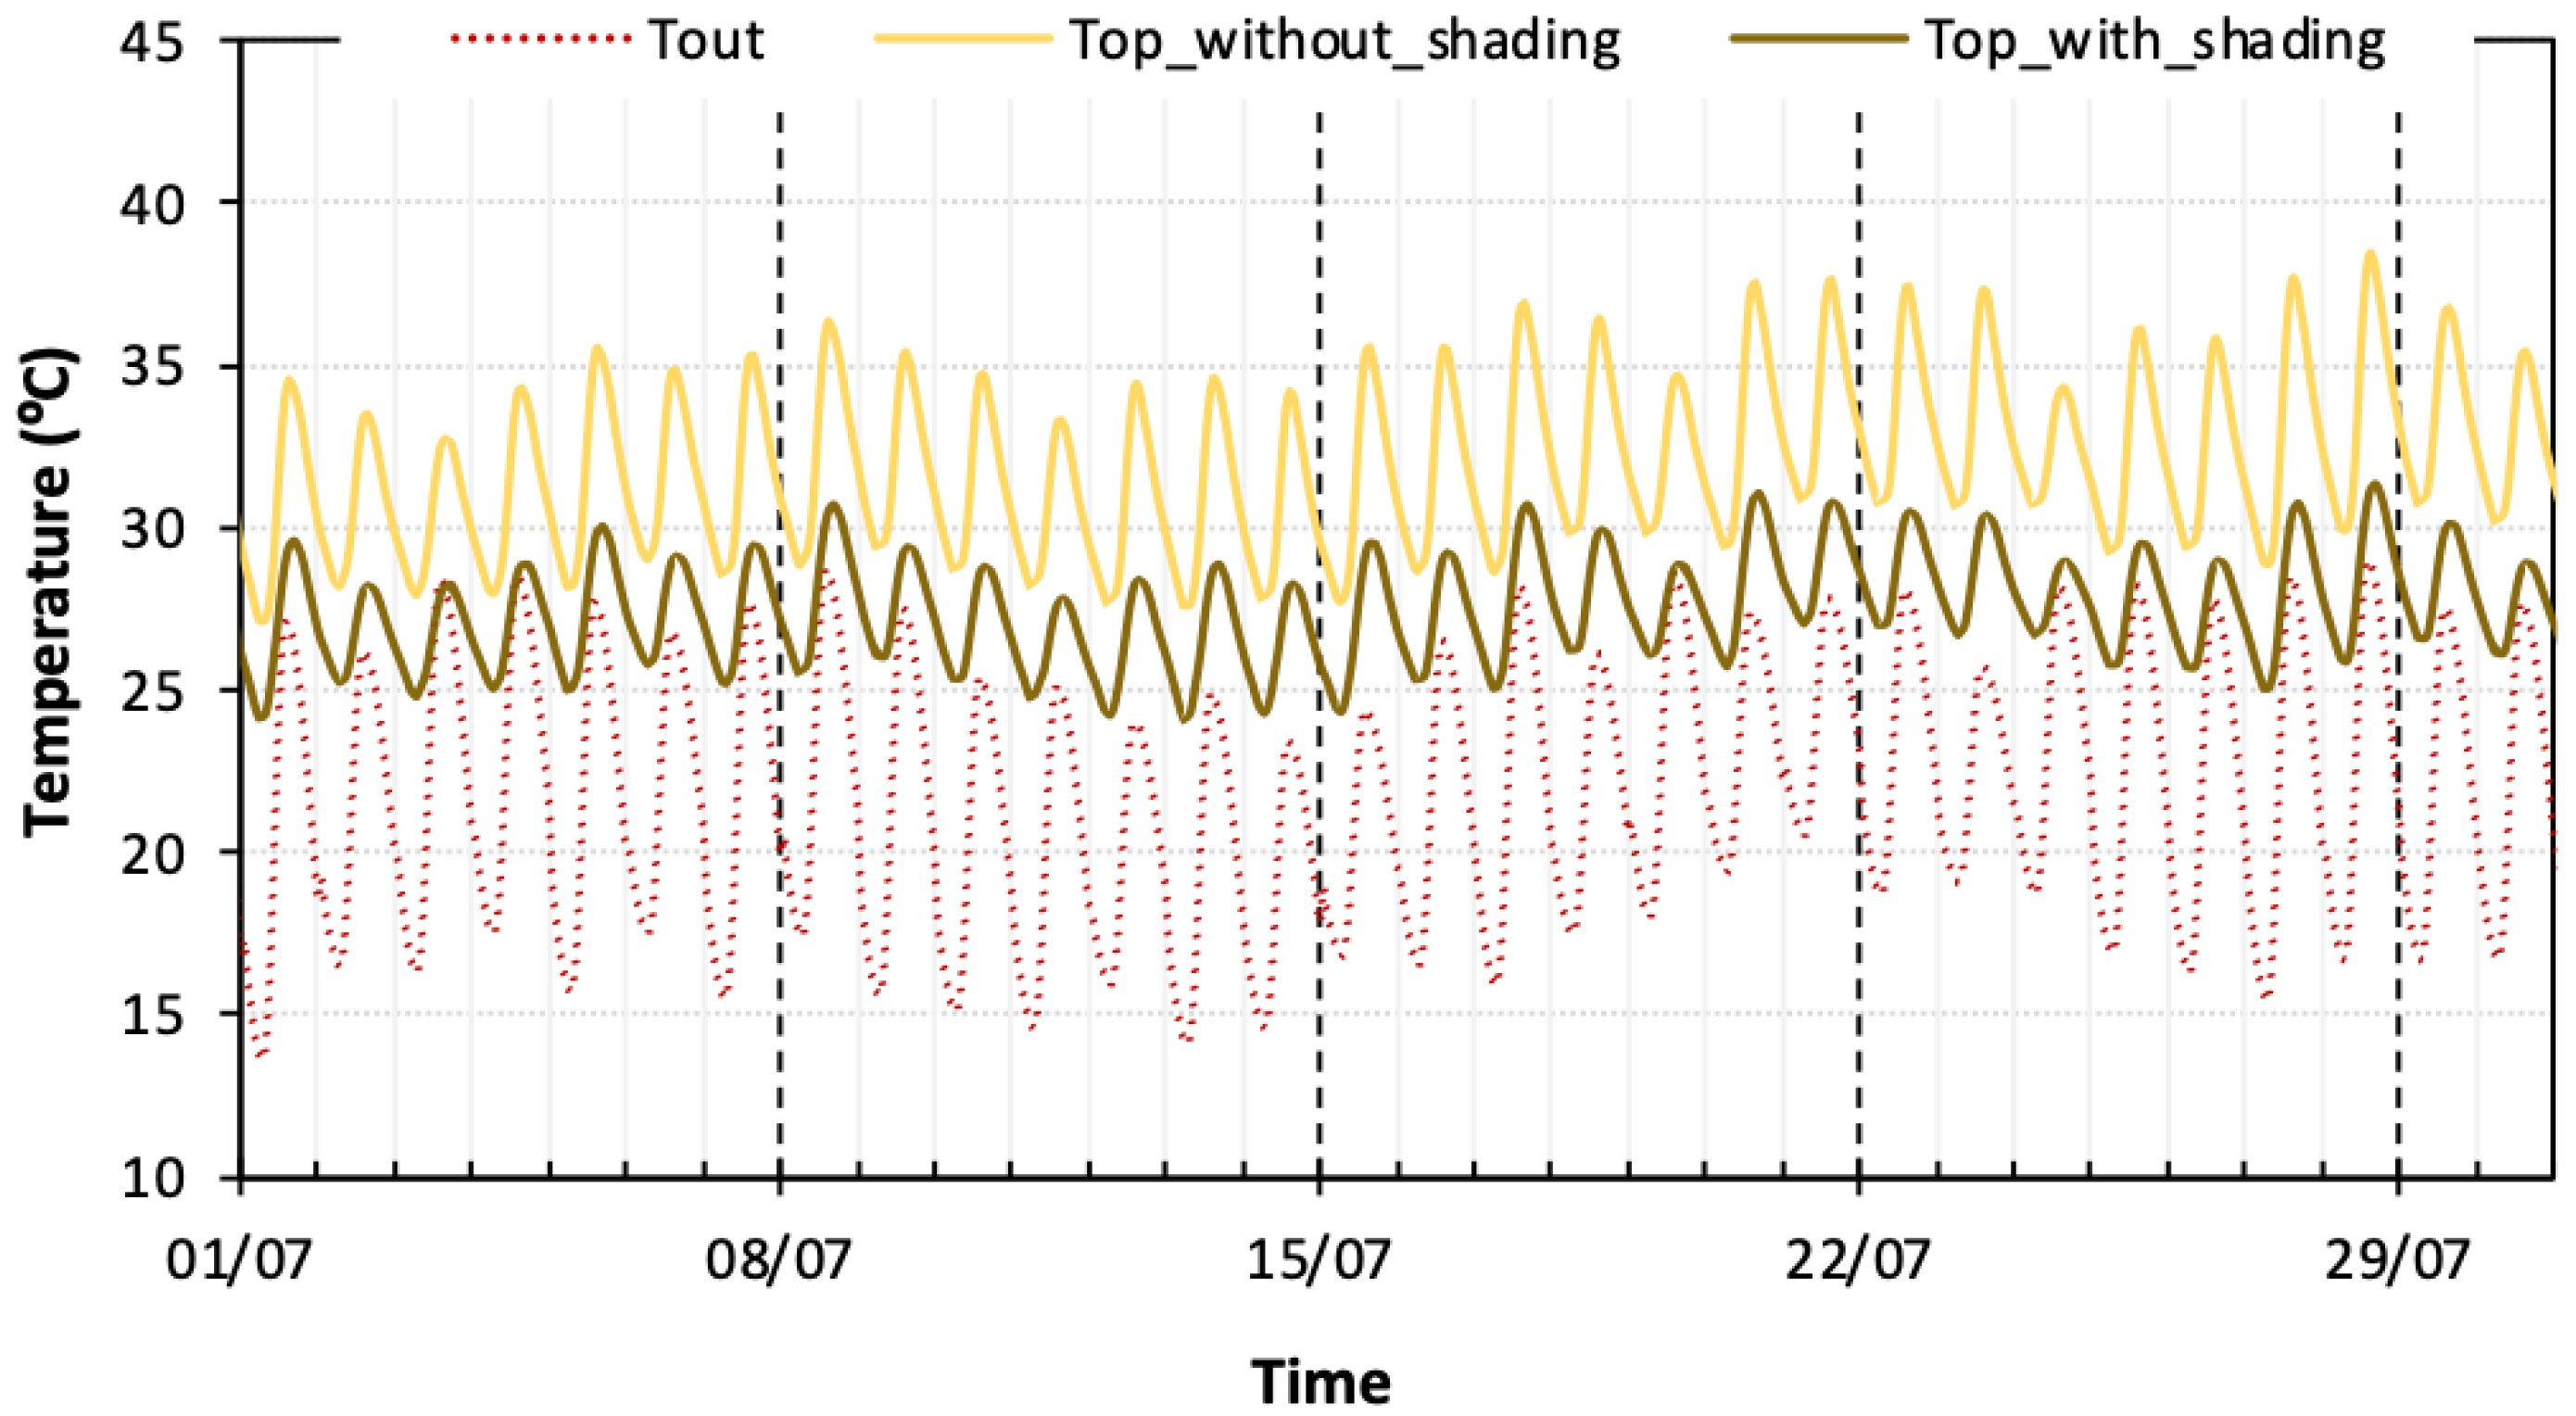
Figure 10.
Thermal comfort evaluation in July, for the LM building with a wall U-value of 0.35 W/(m2.°C), located in Porto: (a) without shading; (b) with shading.
Figure 10.
Thermal comfort evaluation in July, for the LM building with a wall U-value of 0.35 W/(m2.°C), located in Porto: (a) without shading; (b) with shading.

Figure 11.
Indicator 1 and Indicator 2, for all simulated scenarios, in July: low-mass (LM) and high-mass (HM) buildings, located in Porto, Faro, and Bragança, without and with shading.
Figure 11.
Indicator 1 and Indicator 2, for all simulated scenarios, in July: low-mass (LM) and high-mass (HM) buildings, located in Porto, Faro, and Bragança, without and with shading.
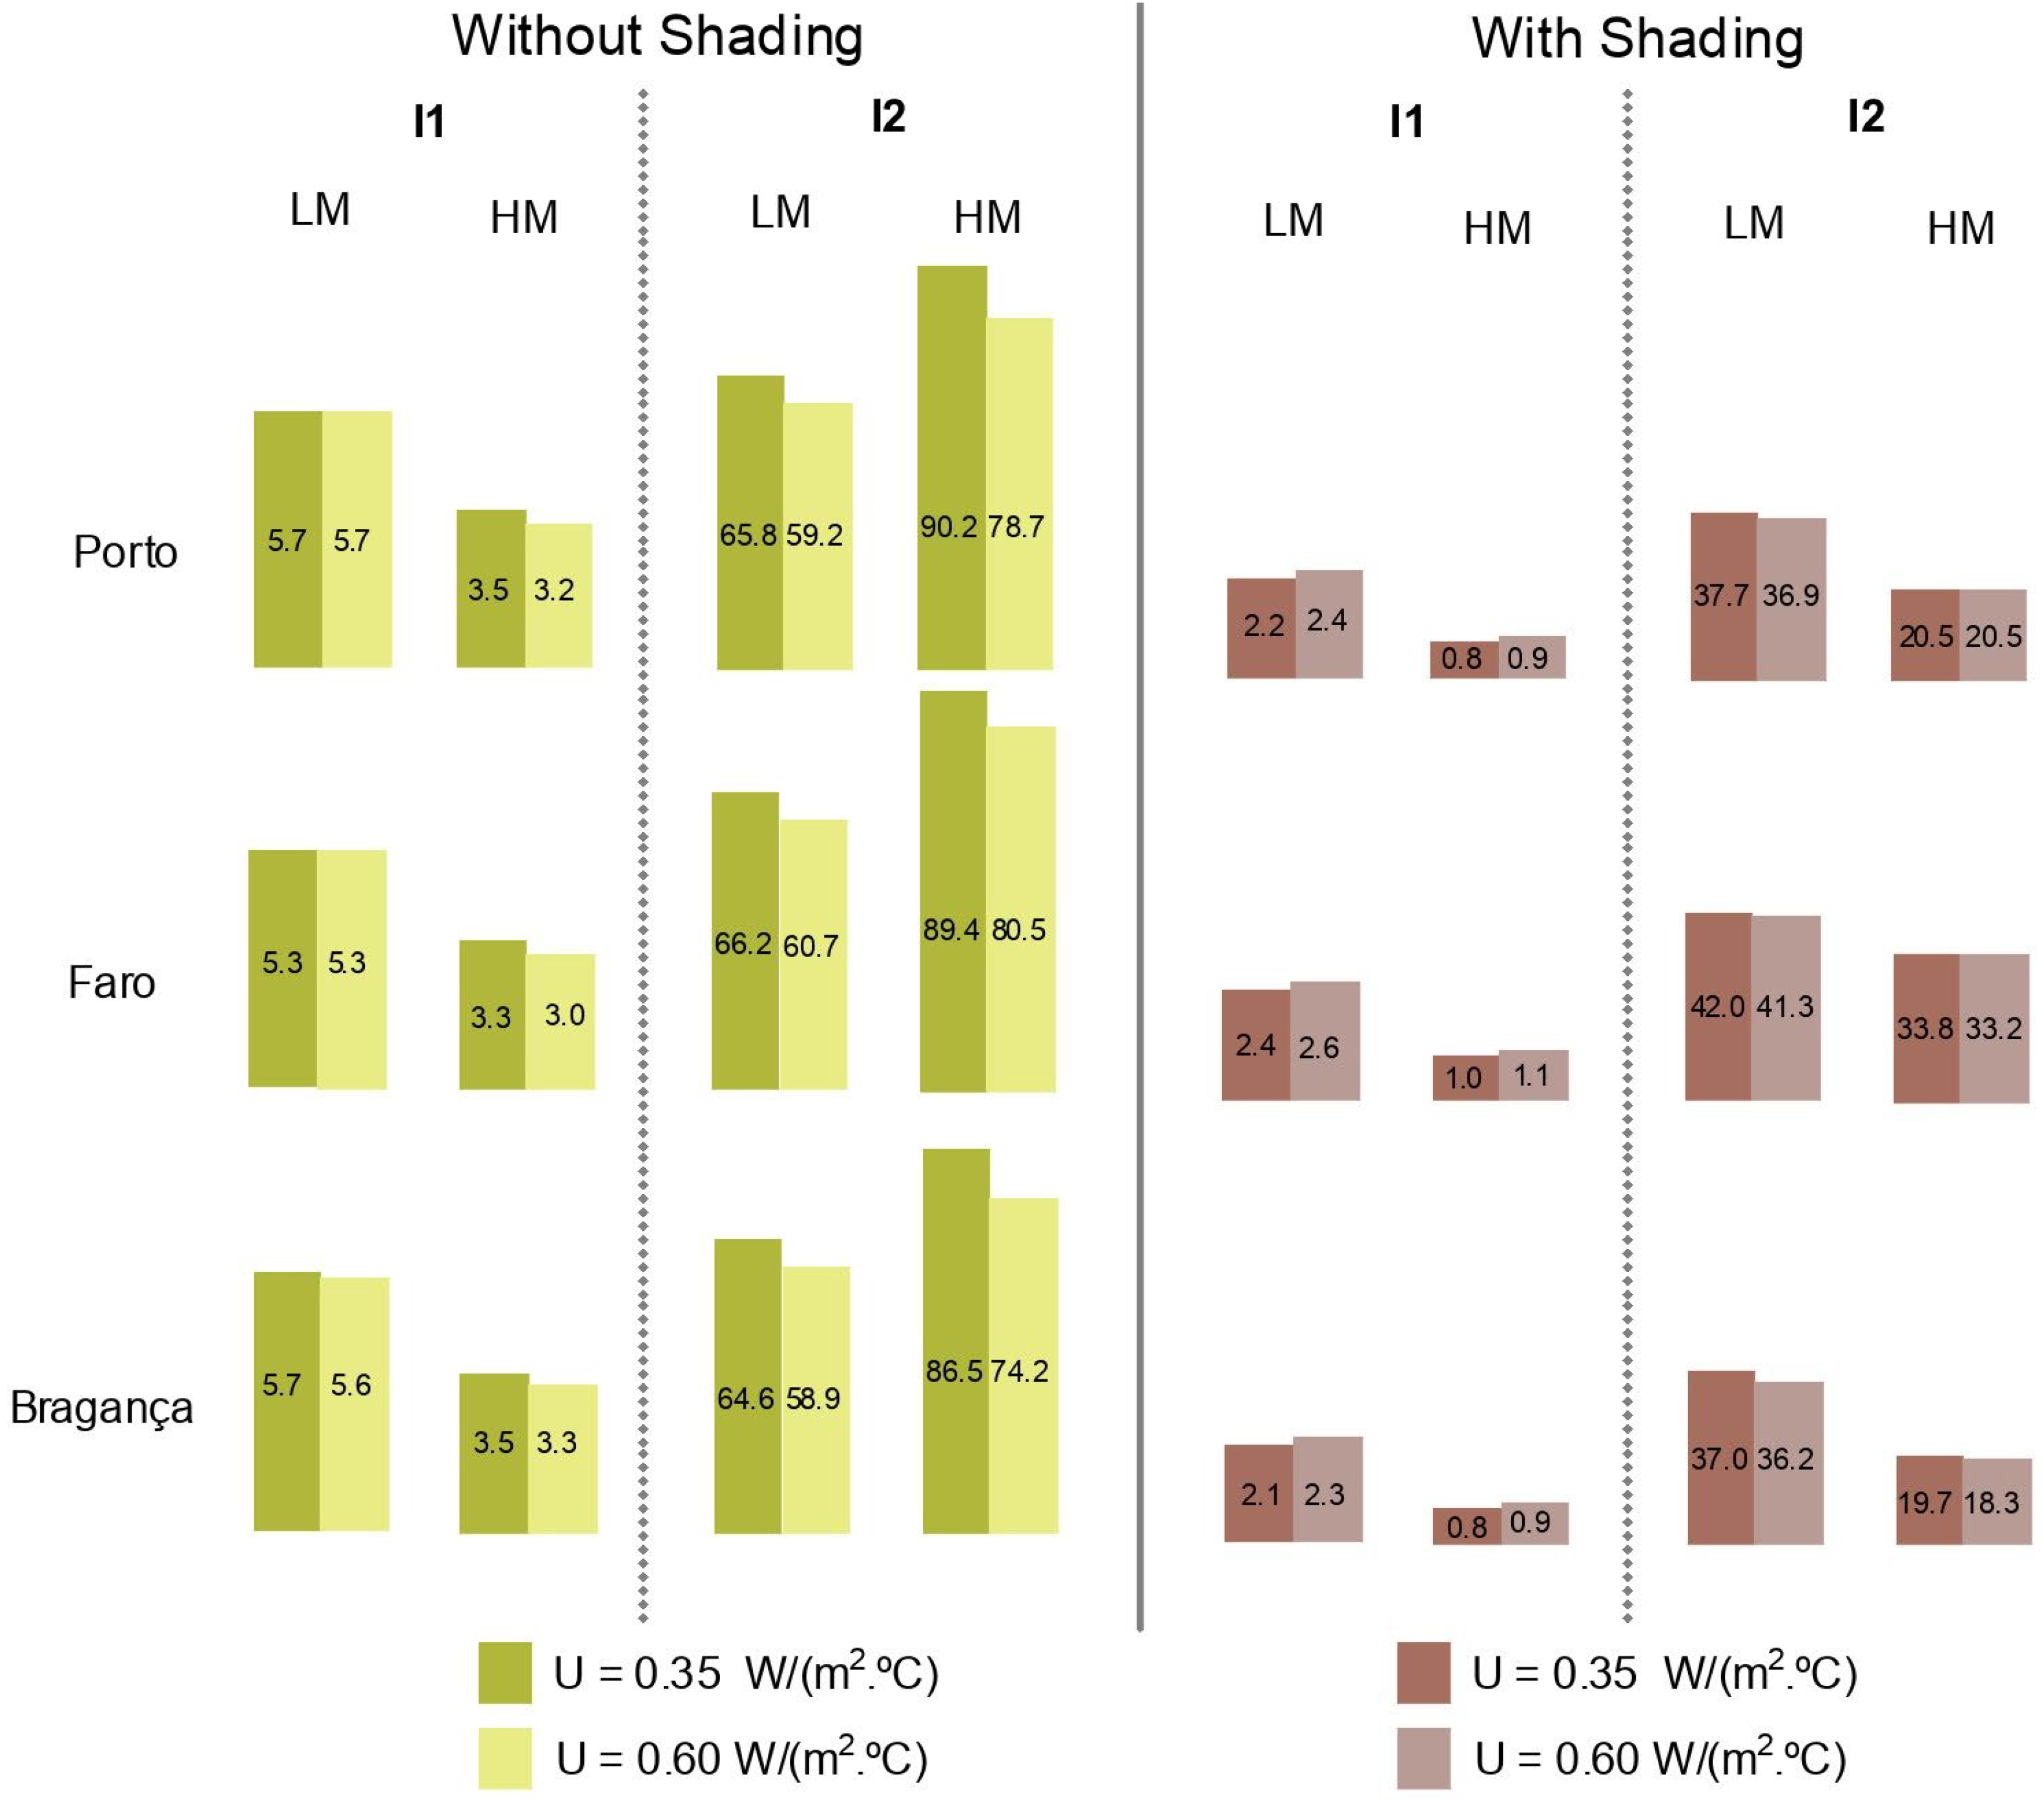
Figure 12.
Boundary conditions established to define the period when it is relevant to have a higher U-value.
Figure 12.
Boundary conditions established to define the period when it is relevant to have a higher U-value.

Figure 13.
Difference between external and internal superficial temperatures, by orientation, for an LM building located in Porto, when no shading device is used.
Figure 13.
Difference between external and internal superficial temperatures, by orientation, for an LM building located in Porto, when no shading device is used.

Figure 14.
Global number of hours with discomfort by overheating (I4) versus number of hours when having a DTIS is useful (I3), for Porto, Faro, and Bragança, with and without shading.
Figure 14.
Global number of hours with discomfort by overheating (I4) versus number of hours when having a DTIS is useful (I3), for Porto, Faro, and Bragança, with and without shading.

Table 1.
Experimental testing plan.
| Test | Duration | Exterior Temperature | Interior Temperature | Ventilation System |
|---|---|---|---|---|
| 1 | 7 days | 5 °C | Free running | OFF |
| 2 | 7 days | 5 °C | Free running | ON |
Table 2.
Thickness of the insulation layer to guarantee the target U-values (insulation and conductive states).
Table 2.
Thickness of the insulation layer to guarantee the target U-values (insulation and conductive states).
| Target U-Value [W/(m2.°C)] | 0.35 | 0.60 |
|---|---|---|
| Fiberglass quilt thickness for the low-mass building [m] | 0.103 | 0.055 |
| Fiberglass quilt thickness for the high-mass building [m] | 0.098 | 0.050 |
Disclaimer/Publisher’s Note: The statements, opinions and data contained in all publications are solely those of the individual author(s) and contributor(s) and not of MDPI and/or the editor(s). MDPI and/or the editor(s) disclaim responsibility for any injury to people or property resulting from any ideas, methods, instructions or products referred to in the content. |
© 2023 by the authors. Licensee MDPI, Basel, Switzerland. This article is an open access article distributed under the terms and conditions of the Creative Commons Attribution (CC BY) license (https://creativecommons.org/licenses/by/4.0/).
Share and Cite
MDPI and ACS Style
Almeida, R.M.S.F.; Teles-Ribeiro, M.; Barreira, E. Characterization of a Wall System with Dynamic Thermal Insulation—Experimental Campaign and Numerical Simulation. Energies 2023, 16, 6402. https://doi.org/10.3390/en16176402
AMA Style
Almeida RMSF, Teles-Ribeiro M, Barreira E. Characterization of a Wall System with Dynamic Thermal Insulation—Experimental Campaign and Numerical Simulation. Energies. 2023; 16(17):6402. https://doi.org/10.3390/en16176402
Chicago/Turabian StyleAlmeida, Ricardo M. S. F., Maria Teles-Ribeiro, and Eva Barreira. 2023. "Characterization of a Wall System with Dynamic Thermal Insulation—Experimental Campaign and Numerical Simulation" Energies 16, no. 17: 6402. https://doi.org/10.3390/en16176402
Note that from the first issue of 2016, this journal uses article numbers instead of page numbers. See further details here.