Article

Numerical Tracking of Natural Gas Migration in Underground Gas Storage with Multilayered Sandstone and Fault-Bearing Caprocks

1
State Key Laboratory of Geomechanics and Geotechnical Engineering, Institute of Rock and Soil Mechanics, Chinese Academy of Sciences, Wuhan 430071, China
2
University of Chinese Academy of Sciences, Beijing 100049, China
3
Key Laboratory of Underground Storage of Oil and Gas Engineer of China National Petroleum Corporation, Langfang 065007, China
4
Liaohe Oilfield of China National Petroleum Corporation, Panjin 124010, China
*
Author to whom correspondence should be addressed.
Energies 2023, 16(13), 4936; https://doi.org/10.3390/en16134936
Submission received: 15 May 2023 / Revised: 8 June 2023 / Accepted: 9 June 2023 / Published: 25 June 2023
(This article belongs to the Section B2: Clean Energy)

Abstract

:
The structure of caprocks is often greatly altered by different scales of faults or fissures in long-term geological tectonic evolution, and the sealing performance may be deteriorated. In this paper, a simplified geological model characterized as multilayered sandstone and fault-bearing caprocks extracted from the Shuang 6 underground gas storage located in the Liaohe oilfield was established. Different fault geometry (e.g., fault length, fault dip angle, and fault type) and seepage attributes (porosity and permeability) were considered to illustrate their impacts on natural gas migration during the cyclic high rate of injection and production of natural gas. The results showed that the seepage anisotropy and the natural gas front are strongly affected by the formation properties and, especially, are hindered by the low permeability sandstone layers. The difference in the lateral migration distance of natural gas in different layers can reach 110 m at the end of the injection period, with an annual injection volume of 108 m3. The migration of natural gas along the fault zone is mainly controlled by the permeability of faults, followed by fault scale, fault dip angle, and fault type. The sealing failure of caprocks in the fault zone does not occur based on the simulated gas migration distribution, showing that a very limited amount of natural gas migrates into the caprocks.

1. Introduction

Clean and low-carbon energy systems are the common consensus of the international community in the 21st century [1]. Natural gas is a kind of clean energy [2,3,4,5]. To ensure the security of the domestic natural gas supply of importing countries, underground gas storage (UGS) has gradually become the world’s most important method of natural gas storage and peak regulation [6,7,8,9]. By the end of 2022, the peak regulation capacity of underground gas storage in China had reached 16.4 billion m3, accounting for 62% of the domestic natural gas storage capacity [10,11].
There has been a series of serious accidents (e.g., Aliso Canyon, Castaic Hills & Honor Rancho, Playa del Rey) in underground gas storage engineering worldwide [12,13] caused by the sealing failure of caprock, fault and wellbore [14,15], which makes a a very difficult repairment and huge economic losses [12,16]. Except for the gas loss caused by leakage, the chemical reaction or biochemical reaction also cause the huge comsumption of gas or sealing deterioration of caprocks [17]. For example, the UGS constructed from the H2S-bearing formation affects the safety and efficiency of gas storage, due to the reaction of microorganisms [18]. Even if there is no H2S in a formation, the existence of H2 reacts with sulfur-containing minerals, producing H2S, and the H2 will be greatly consumed in a short time [19].
Underground gas storage in depleted hydrocarbon reservoirs is regarded as the most important type of storage in the world. Before UGS is rebuilt, the caprock is inevitably affected by faults in the long-term tectonic evolution process [7,20]. The faults or fractures in the caprocks are the weak zones of gas sealing. When faults cutting the caprocks are relatively young, the permeability of the fault zone is usually large, and the fault zone becomes the main migration pathway for fluids [12,21]. With an increase in pore pressure in the caprock, due to continuous gas accumulation, the overpressure strengthens the opening and slipping of faults, which diminishes the sealing performance of the caprocks [22,23].
The depletion development stage of natural gas reservoirs leads to further fractures in the caprocks [24,25]. The existence of natural faults has an obvious negative effect on the sealing performance of natural gas storage during the cyclic high-rate natural gas injection–production process [26,27]. Many simulators, including TOUGH, Petrasim, COMSOL, Geocrack2D, and FEFLOW, can be applied to simulate complicated fluid flow in porous media or fractured reservoirs [28,29,30]. Shipton et al. [31] using the field detection of a carbon dioxide reservoir, confirmed that carbon dioxide migrated upward through a low permeability fault. Antonio et al. [32] discussed the influence of the thickness of the caprock and the reservoir on leakage during a consideration of faults. Kang et al. [33] simulated the leakage process of CO2 along a fault during offshore carbon sequestration and studied the effects of different CO2 injection rates. Allisar et al. [34] studied the influence of fault permeability and fault structure on fluid injection and found that the high permeability area near a fault will form a pipeline-like system along the fault zone, strengthening the fluid migration. Sun et al. [35] found that faults not only affected the migration of oil and gas, but also affected the distribution of oil and gas. Aoyagi et al. [36] analyzed the process of CO2 leakage along a fault in seabed storage and the results showed that the permeability of the fault had a great influence on CO2 leakage. Ren et al. [37] conducted numerical simulations to study the impacts of the heterogeneous formations on the CO2 migration and distribution in the saline aquifers.
In this paper, the configuration and physical characteristics of fault-bearing caprocks, including the initial permeability of the fault zone and the fault structure (the fault length, fault dip angle, fault type, and contact relationship of the fault with the sedimentary formations), were considered to study natural gas migration in UGSs during cyclic high-rate injection and production processes. The simplified model from the Shuang6 UGS located in the Liaohe oilfield was used in the simulation studies, which did not consider the role of hydro-mechanical coupling and rocks were defined as the ideal elastic masses. The impacts of faults on the sealing performance of UGSs were indirectly studied by analyzing gas migration via numerical simulation.

2. Sealing Mechanism of Fault-Bearing Caprocks

Caprocks play the role of good sealing mediums for natural gas. They are often characterized by small pores, low permeability, and high capillary pressure. However, due to the strong tectonic movement over the long term of geological history, caprocks are often damaged by different scales of faults or fractures. Most caprocks (e.g., salt rocks, mudstones) have good plastic characteristics [38], making most small cracks close under high-stress conditions, and the sealing performance of caprocks is not negatively affected by small cracks. However, when caprocks are cut by large faults that promote the migration of natural gas, the sealing integrity of caprocks is greatly deteriorated [12]. In the process of the underground storage of natural gas, the geological storage of CO2, and other types of underground fluid injection and production, the periodic fluid injection and production in a reservoir lead to fluctuation in formation pressure, causing stress disturbance near the fault zone, triggering fault slippage or the deterioration of preexisting faults, and the fault opening, strengthening fluid migration along the fault zones [39]. The opening degree of a fault is constantly changing due to the alternating variation of gas injection and production. When a fault does not completely cut through the caprocks, the sealing failure of caprocks will not occur, due to the strong capillary seals in unfractured parts at the top of the caprocks (Figure 1).

3. Mathematical Models

For underground gas storage in depleted gas reservoirs, there is still a small amount of bound water and pore water in the reservoir after the depletion of the gas reservoir. Therefore, the mass conservation equation of the two-phase fluid (gas–water) system can be written as follows [41]:
M k t = · F k + q k
where M is the mass accumulation (kg/m3), F is the mass flux (kg/m2s), q is the source/sink term (kg/m3s), t is the time(s), is the divergence, and superscript k denotes the components (CH4 and water).
For CH4 in fluid, the governing equation of the mass conservation is as follows:
t ϕ X g c S g ρ g = q g c X g c ρ g ( k k r g μ g ( P g ρ g g ) ) + q g c
where S is the saturation (-), X is the mass fraction (-), ρ is the density (kg/m3), ϕ is the porosity (-), k is the permeability (m2), krg is the relative gas permeability (-), krl is the relative liquid permeability (-), and P is the pore pressure (Pa). For the superscripts, c stands for CH4; for the subscripts, g is the gas phase and l is the liquid phase.
In the above equation, the relative permeability reflects the seepage characteristics of gas and water. The hydrophilicity or hydrophobicity of the rocks, their geometric shape, the size and uniformity of the rock pores, and the temperature may affect the relative permeability curve. The commonly used two-phase (gas–water) relative permeability models include the Corey model proposed by Brooks and Corey [42] and the VG model proposed by Van [43] in 1980. The van Genuchten (VG) model is as follows [44]:
k r l = S * ( 1 ( 1 S * 1 / λ ) λ ) 2 ; S l < S l r
S * = S l S l r / 1 S l r
k r l = 1 ; S l S l r
k r g = 1 k r l ; S g r = 0
k r g = ( 1 S ) 2 ( 1 ( S ) 2 ) ; S g r > 0
where λ is the fitting parameter that is related to pore distribution, S l r is the residual liquid saturation, S g r is the residual gas saturation, and S l is the liquid saturation.
Figure 2 shows the relative permeability curves of gas and water of sandstone obtained from experiments [45] and a calculation based on the VG model. When the water saturation is less than the irreducible water saturation, the water is distributed at the edges, corners, and narrow throats on the surface of the rock skeleton particles, and gas exists in the large connecting pores [45]. For high-porosity and high-permeability rocks, the two-phase co-infiltration zone has a wide range, and the irreducible water saturation is low. For poor-pore-connectivity and small-pore-throat rocks, the range of the two-phase co-infiltration area is narrow. The sandstone reservoir in the Shuang6 UGS has high porosity (0.05–0.25) and permeability (40–250 mD), low irreducible water saturation, and a wide range of the two-phase (gas–water) seepage zone. Therefore, the VG model can be used to describe the gas–water relative permeability of the sandstone reservoir.

4. Numerical Model Setup

To track the gas migration in the UGS and study the effect of faults on the sealing performance of UGSs during the gas injection and production process, the Shuang6 UGS was selected as the research site. The Shuang6 UGS is located in the Liaohe oilfield in northeast China. The depleted natural gas reservoir with the gas cap and oil ring is used to store the natural gas [46]. Since the operation of Shuang6 UGS in April 2014, 10 rounds of gas injection and seven rounds of gas production have been completed. The annual gas injection is approximately 3 billion m3 [47].
The target layer of natural gas production is the Xinglongtai oil layer, it belongs to the first and second members of the Shahejie Formation [46]. The Xinglongtai oil layer is composed of three oil groups divided into 18 small layers (Table 1). The upper group (I) is mainly composed of green-grey, dark-grey mudstone, calcareous shale dolomite, light-grey sandstone, and gravel sandstone, characterized by thin layers and poor lateral continuity. The middle group (II) is characterized by dark-grey mudstone interbedded with sandstone and glutenite. The bottom group (III) is the main gas-bearing layer.
The Shuang6 UGS region is composed of the Shuang6 fault block and the Shuang67 fault block. These two fault blocks are divided by the Shuang62 fault. The northern boundary of the Shuang6 fault block is controlled by the Shuang30–26 fault and the southern boundary of the Shuang67 fault block is controlled by the Shuang607 fault (Figure 3). The structural interpretation diagram shows that the extensional normal fault is developing and the fault displacement is in the range of 50–100 m [46].

4.1. Simplified Geological Model

A simplified geological model was established based on the geological characteristics of the Shuang6 UGS region. It had a scale of 500 m in the X and Y directions, and the depth of the model was in the range of 2020 m to 2791.2 m from top to bottom (Figure 4a). The thickness and top-to-bottom burial depth of each small layer were adopted, as shown in Table 1. The thickness of the regional caprock was 300 m, and the total thickness of the 18 sublayers (from I-1 to III5-10) of the underlying sandstone reservoirs was 471.2 m. Figure 4b shows a fractured geological model with a fault width of 10 m and a fault dip angle of 60°, but there is no fault movement. Figure 4c shows the fault-bearing geological model with a fault dip angle of 60°, and the width of the fractured zone is 10 m.

4.2. Formation Properties, Initial and Boundary Conditions

Table 1 summarizes the density, porosity, and permeability of different layers in the basic model. The permeability of the sandstone reservoir ranged from 48 mD to 233.8 mD. The initial pore pressure of the caprock was set as the hydrostatic pressure, and the initial pore pressure of the sandstone reservoirs from I-1 to III5-10 was 5 MPa, due to the depletion development of the UGS. The initial gas saturation in all layers was set at 0.1 after depletion development. The reservoir temperature in Shuang6 block is 88–90 °C (Shi 2015) [46]. Isothermal conditions were adopted in this simulation., and the initial temperature was set at 90 °C. The single block size was 5 m in the X and Y direction, respectively. and each sublayer in the Z direction was different. From top to bottom, the grid size of each sublayer in the Z direction was 15 m, 11.13 m, 11.05 m, 9.3 m, 14 m, 7.98 m, 11 m, 7.87 m, 11 m, 10.35 m, 8.75 m, 11 m, 7.53 m, and 7.53 m, respectively.

4.3. Different Conditions in Sensitivity Case Studies

The EWASG module in the Petrasim simulator was used in the simulations. The lateral boundary in the basic model was set as the open boundary, allowing heat and mass exchange with the external parts of the model [41]. It was assumed that the permeability anisotropy in the X, Y, and Z directions of sandstone and mudstone was not considered. The fault zone was not established in the basic model. In cases 1~3, the effect of strike length of the fault zone on gas migration was comparatively studied. A comparative analysis of case 3 and case 4 showed the influence of physical properties of the fault zone. The comparative study of cases 5~7 clarified the influence of high-permeability faults with different lengths on natural gas migration. Compared with case 1, case 8 and case 9 were used to clarify the influence of the dip angle of the low permeability fault on gas migration and sealing evaluation. By comparing the results of case 2, case 10, and case 11, the influence of the dip angle of the high-permeability fault on gas migration and sealing could be clearly understood. Case 12 and case 13 were used to study the impact of gas migration on sealing performance under the influence of a fault zone that had an initial fault displacement and different permeability. In case 14, the complex configuration of the fault may have had a large impact on the spatial distribution of the injected gas during the gas injection and production process. A comparative analysis of case 15 and the base case clarified the influence of boundary conditions (i.e., an open lateral boundary vs. a closed lateral boundary). Different scales of permeability of the fault zones (0.001 mD, 10 mD, and 1000 mD) were assumed to represent the closed, semi-open, and open faults, respectively. The physical properties and the geometric parameters of the fault zones in different simulation scenarios were adopted, as shown in Table 2.
According to the operation conditions of the UGS, natural gas is injected into the target layers for seven months of each year, with an injection rate of 4 kg/s. Then, gas injection is stopped for one month, followed by natural gas production with a production rate of 5.7 kg/s for four months. The numerical simulation of multiple cycles of natural gas injection-production was carried out. The injection point was in the III3-6 formation, which was the vertical distance from the lower end of the fault and was 75.6 m.

5. Results and Discussion

5.1. Natural Gas Migration in the UGS without Considering Faults

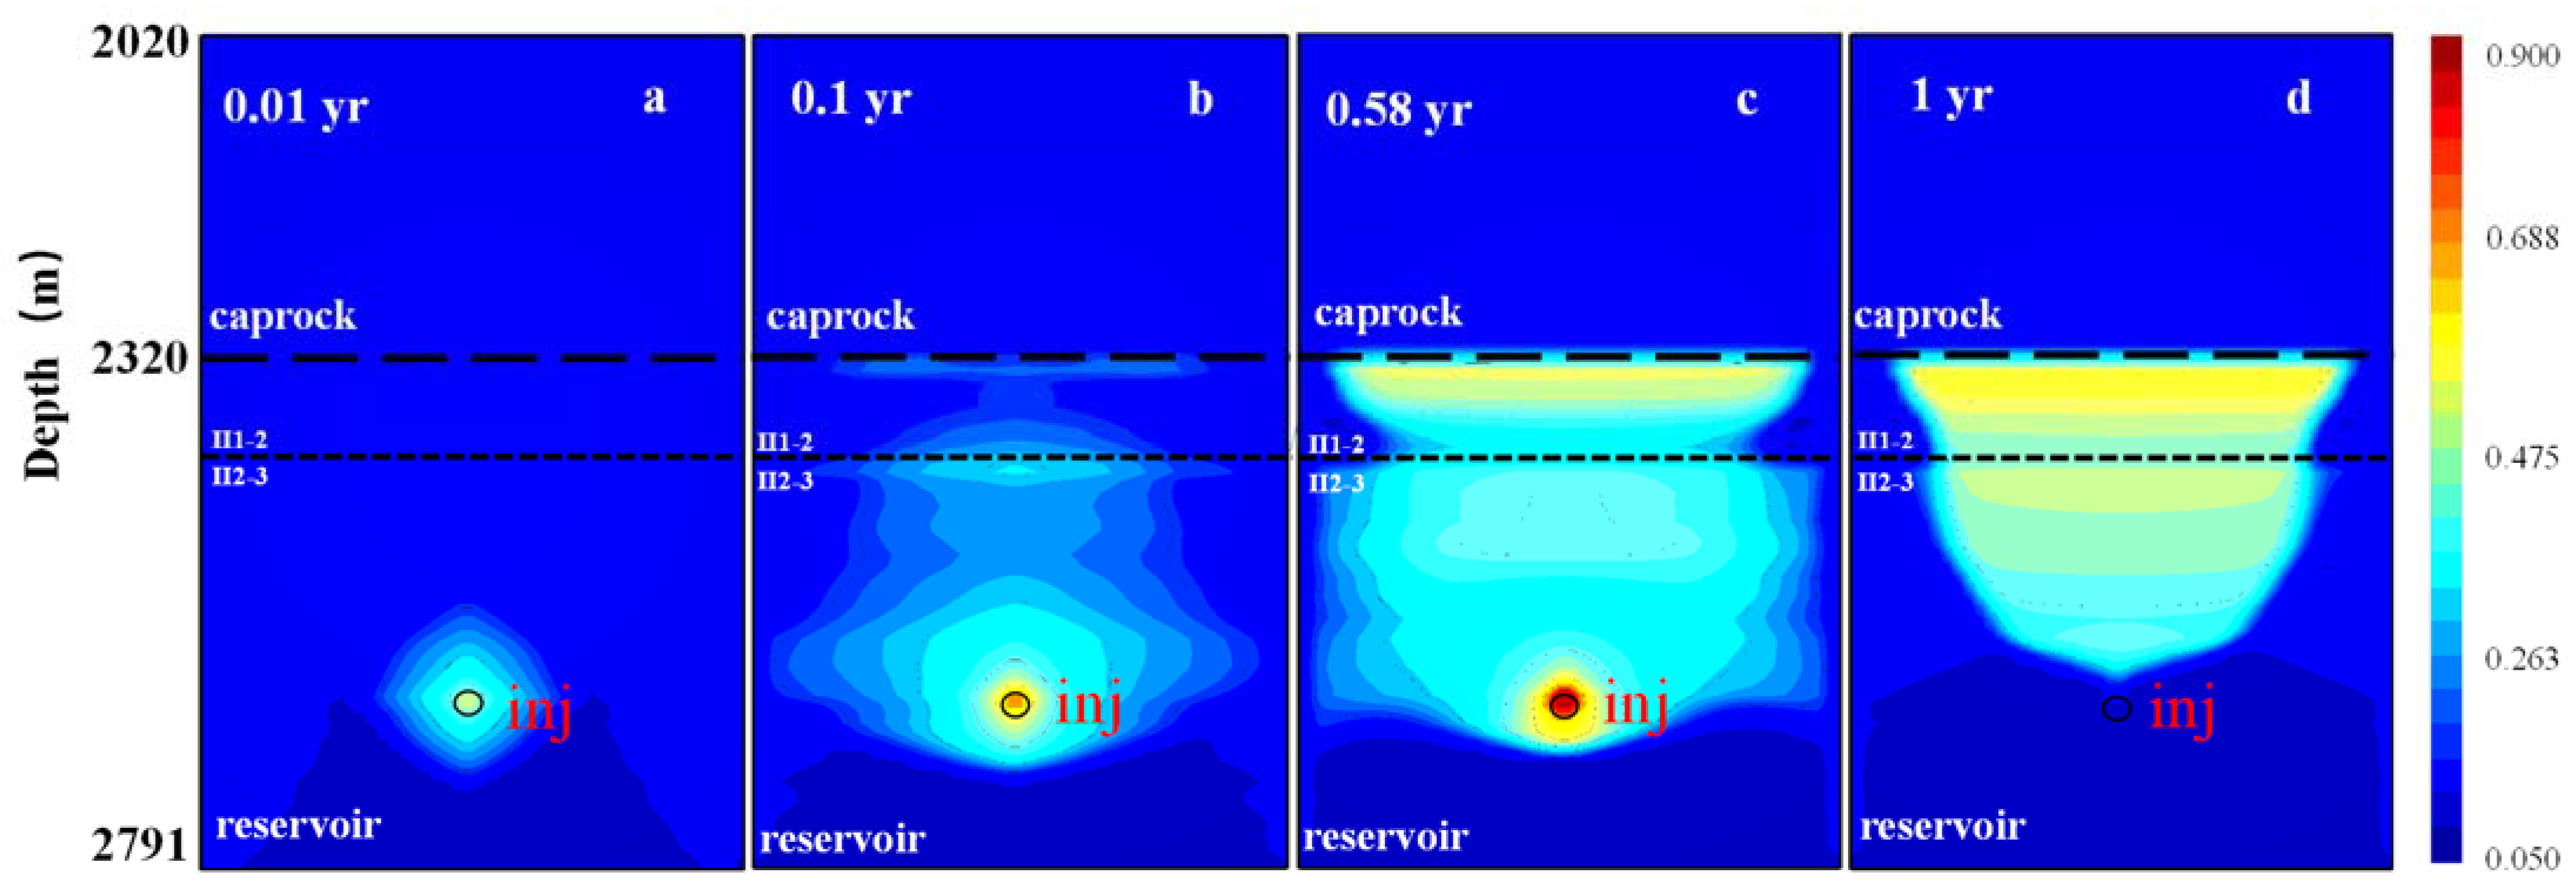
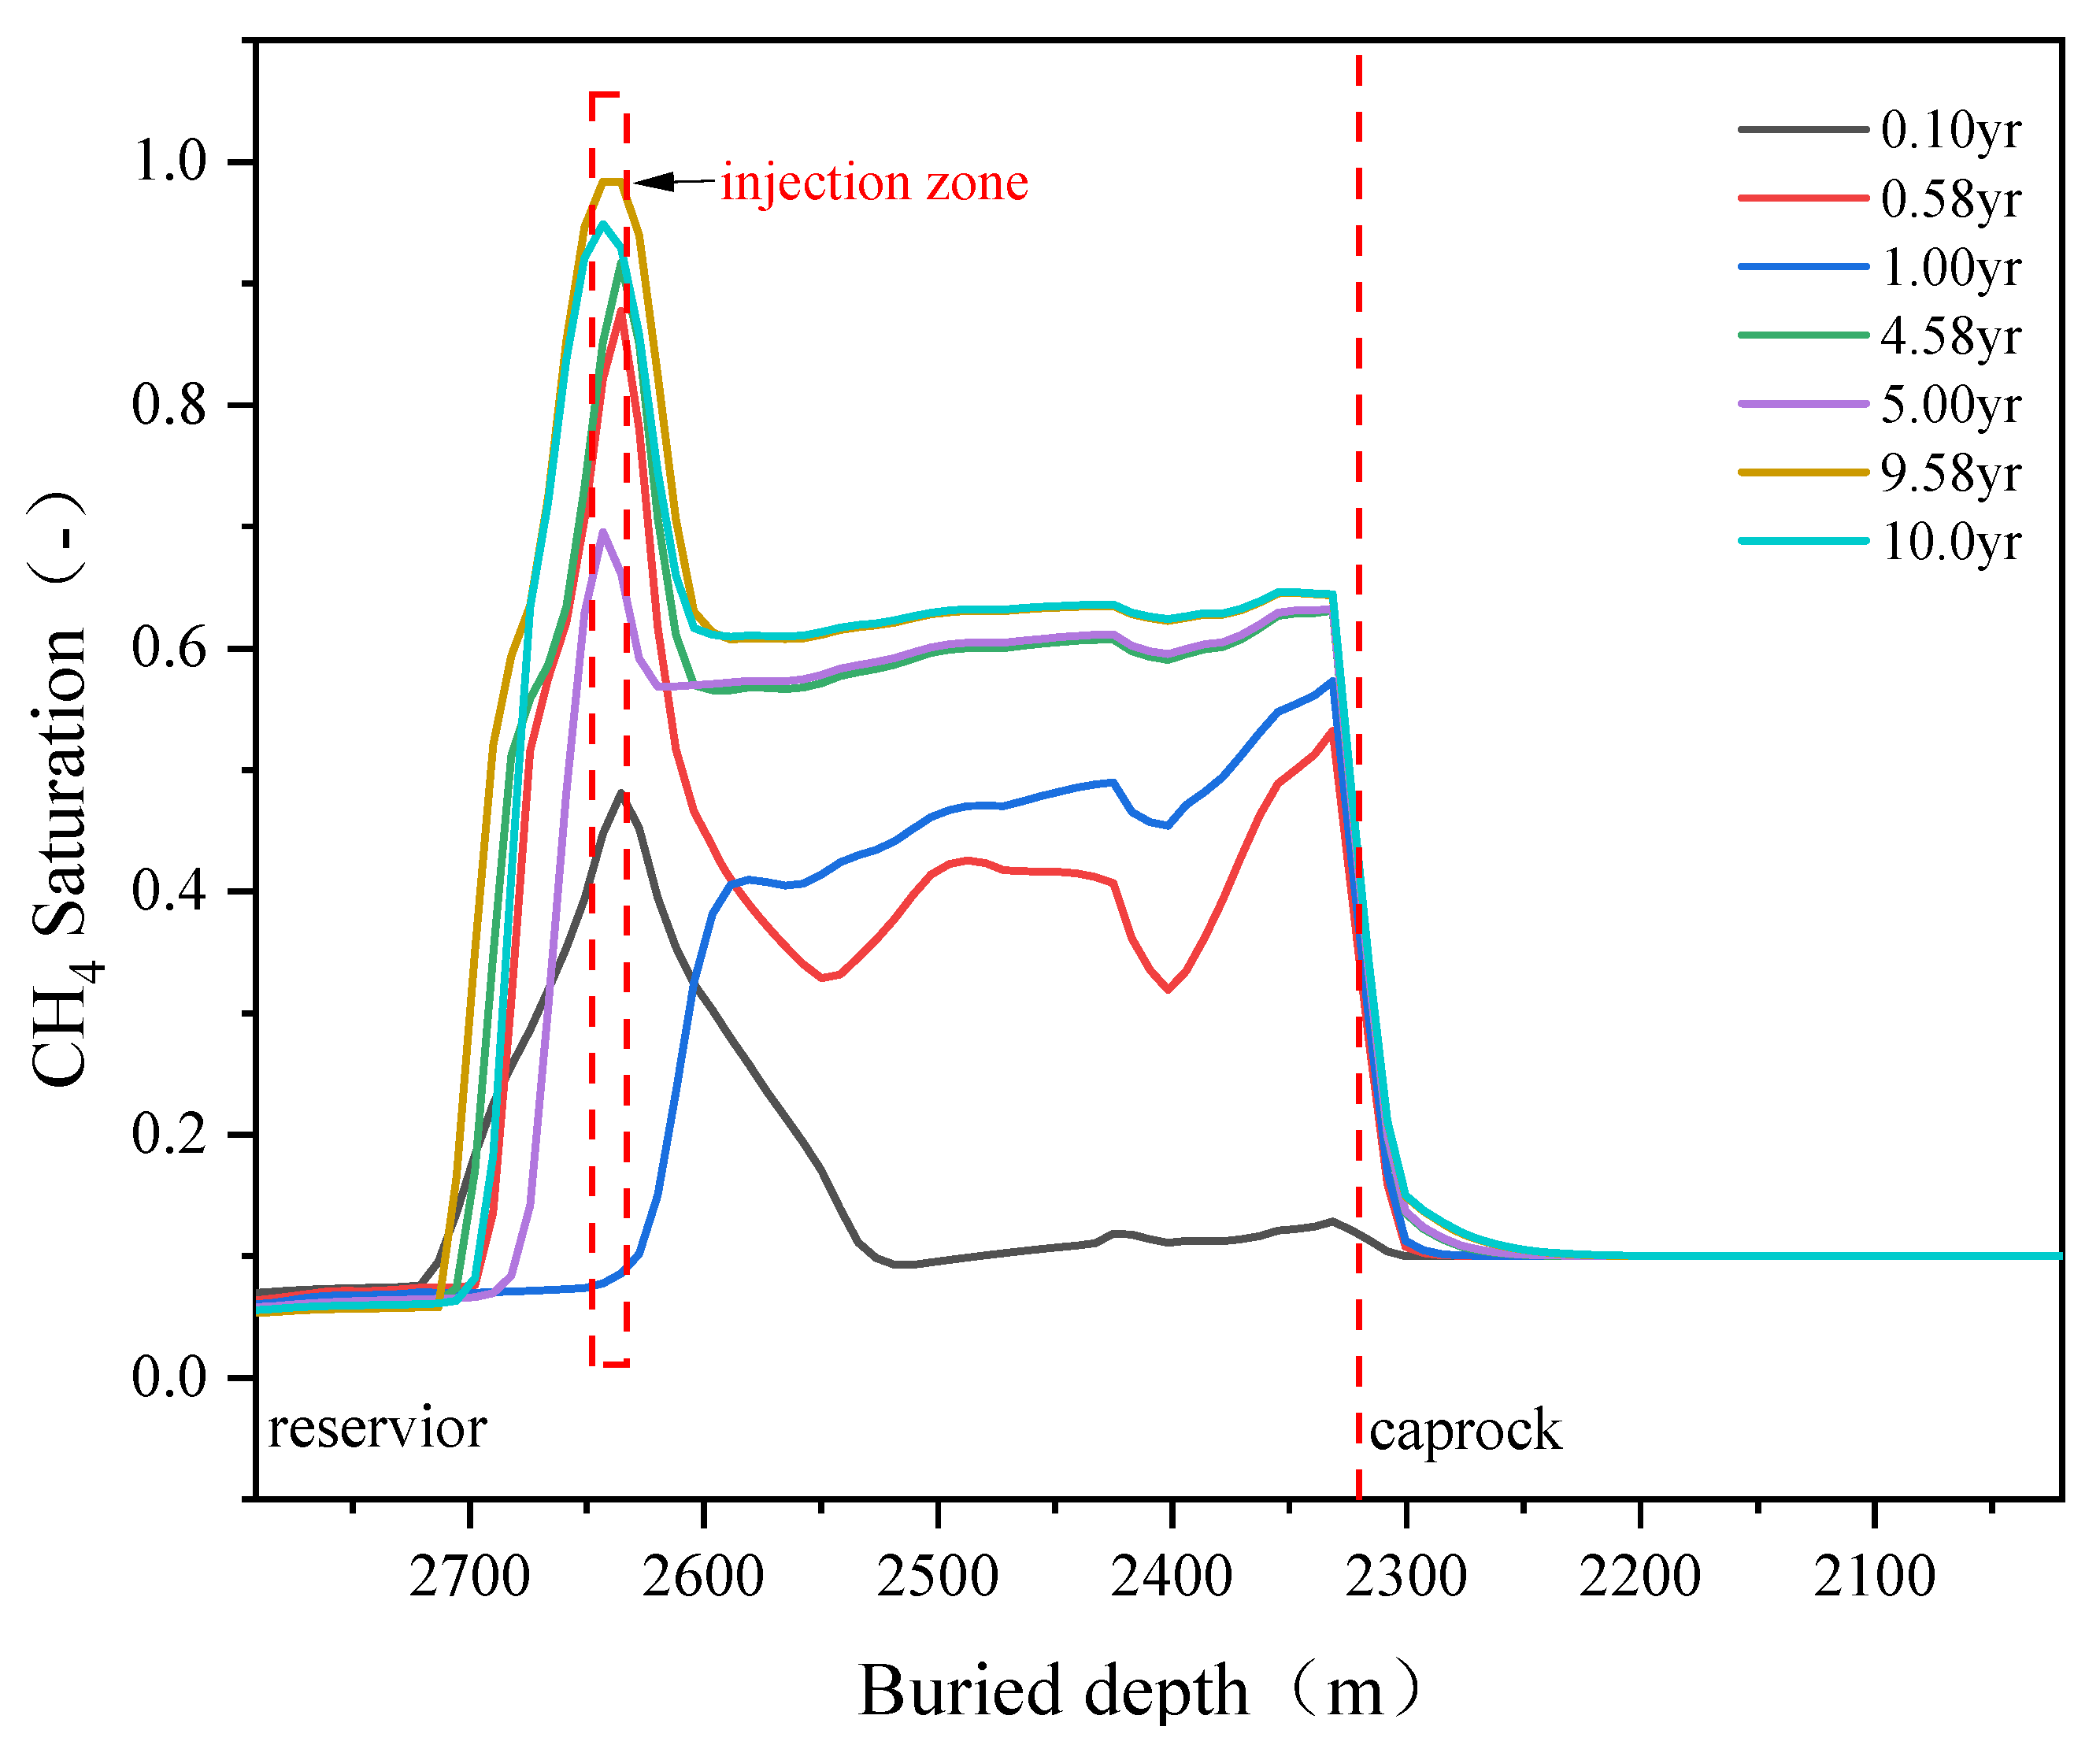
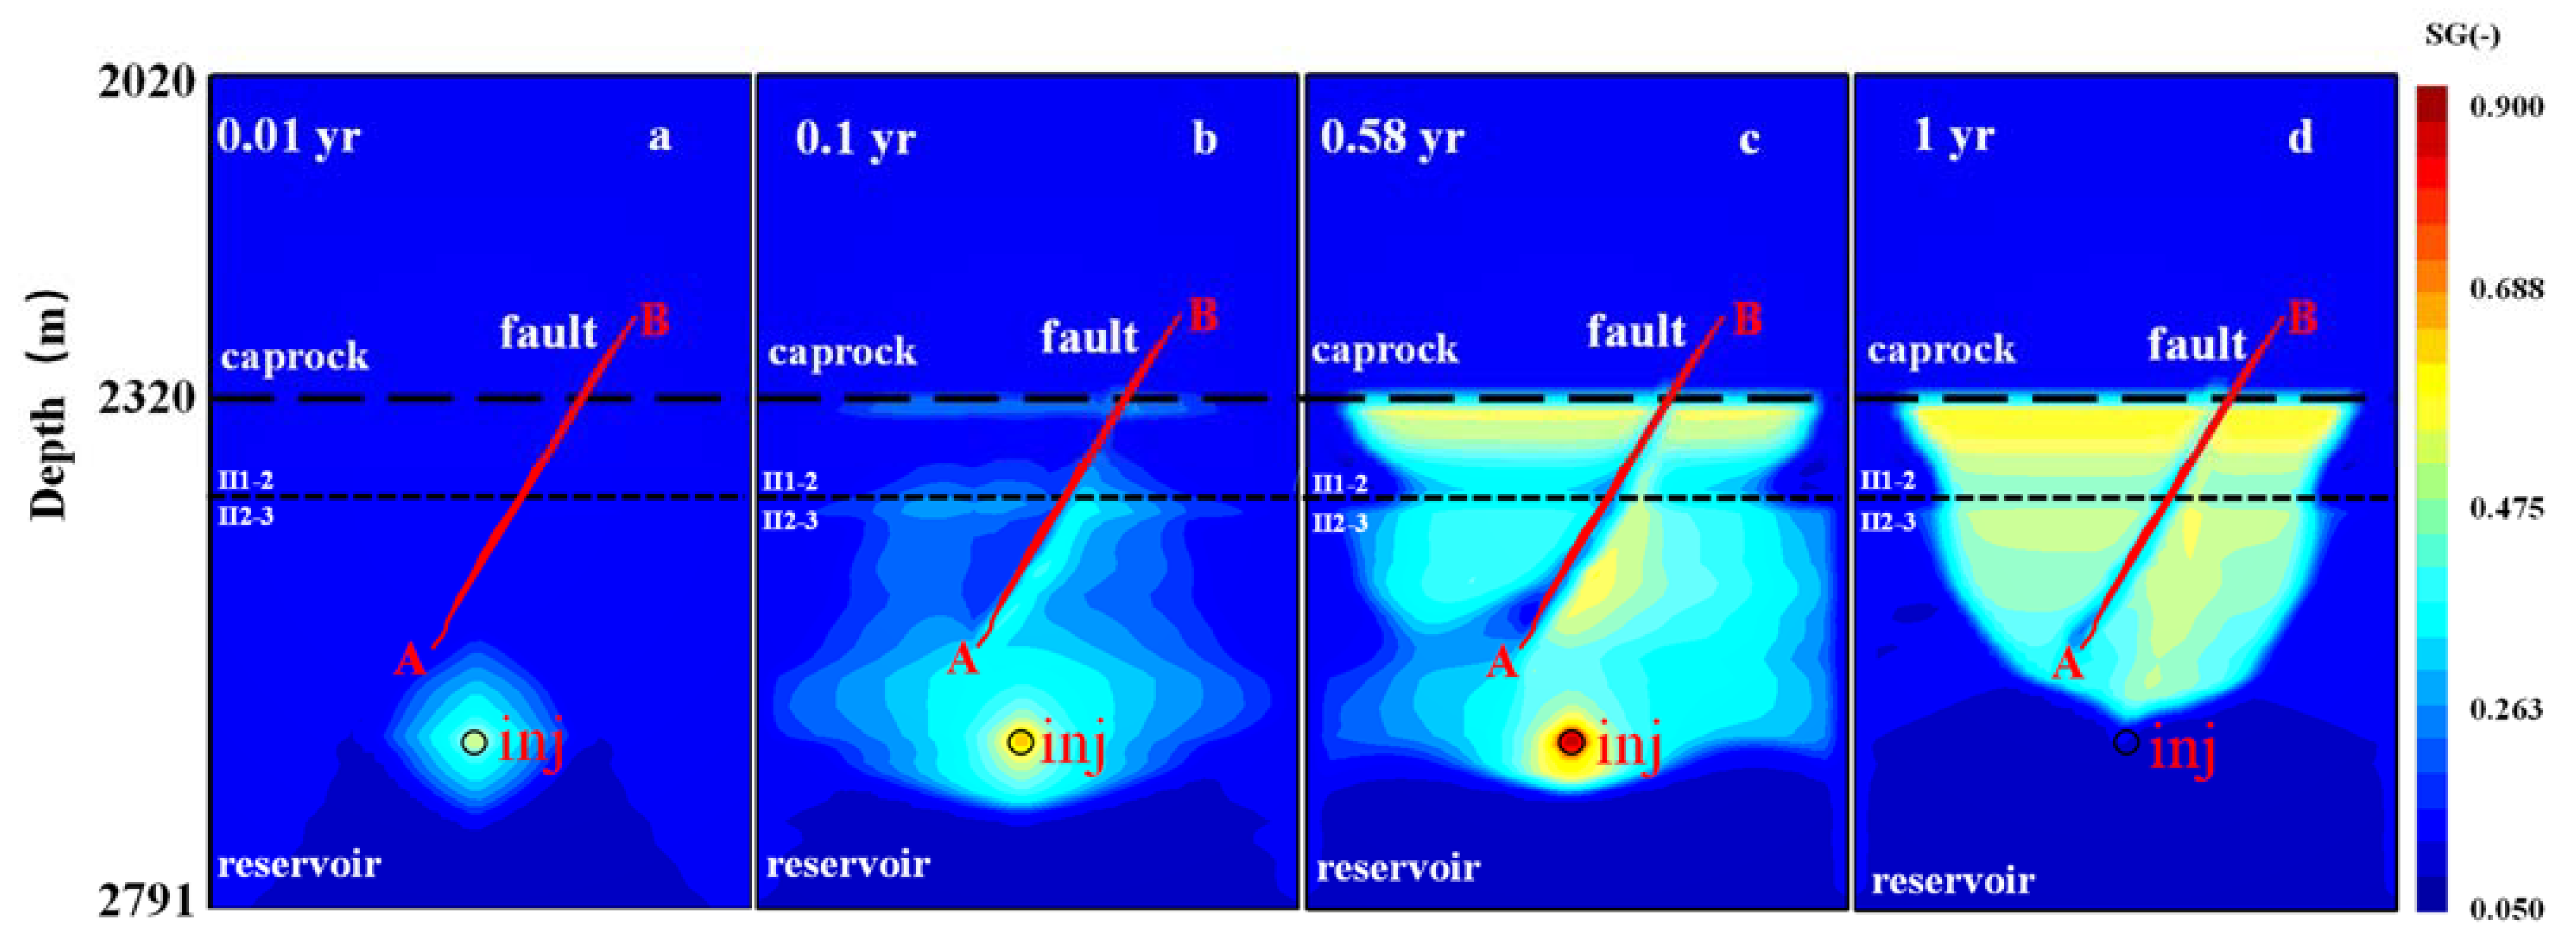
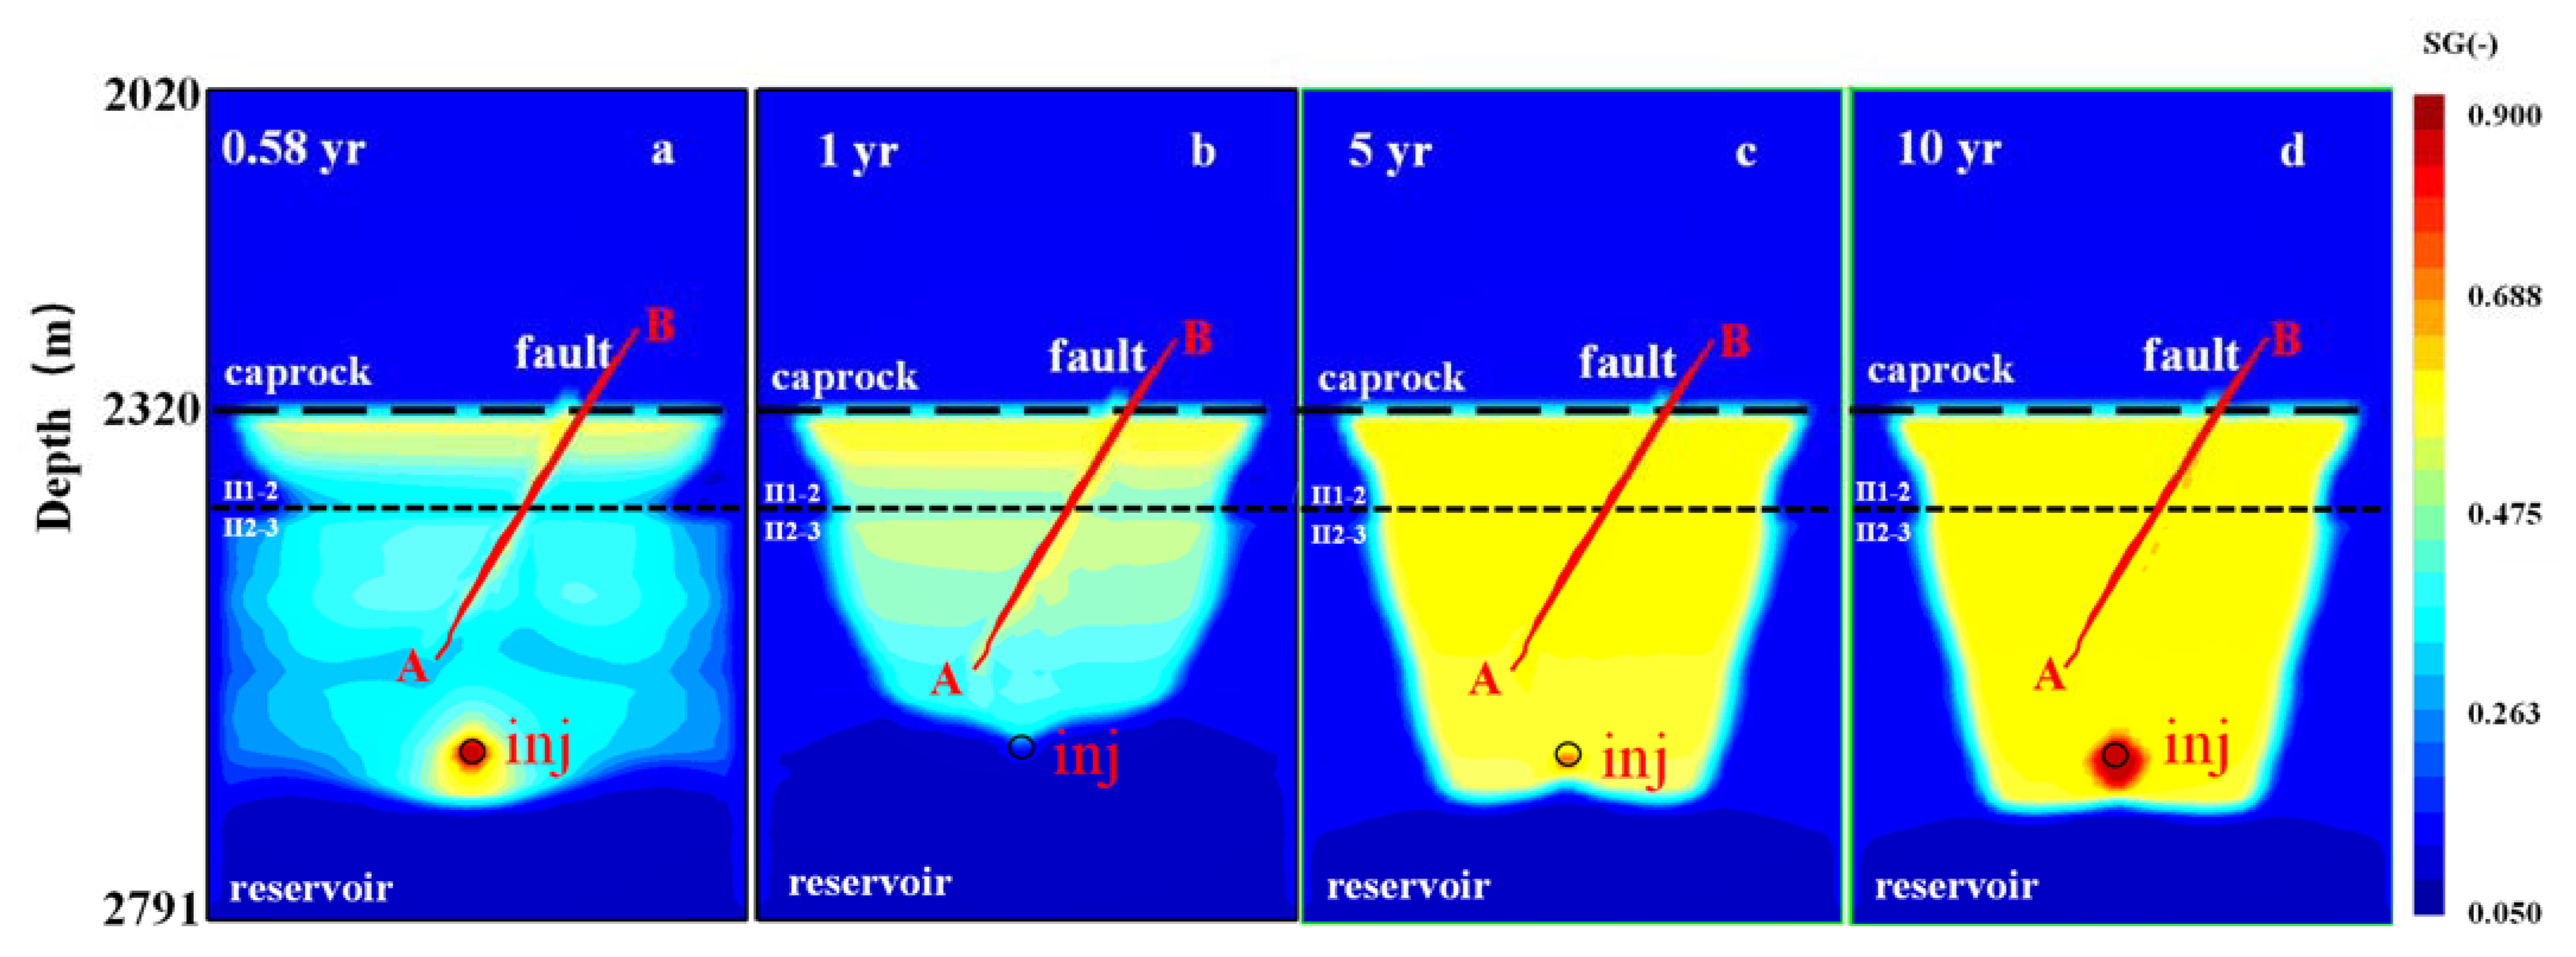
5.1.1. Spatial Distribution of Natural Gas during the Gas Injection and Production Process

Figure 5 shows the CH4 evolution with time during one cycle of natural gas injection and production using the lateral open boundary condition. Figure 5a shows that CH4 was mainly distributed around the injection zone at the beginning of the injection. With the development of time, the CH4 migrated upwards, due to buoyancy. The CH4 migrated laterally, driven by the pore-pressure gradient. The relatively low-permeability layer in the reservoir inhibited the vertical migration of gas to a certain extent. The porosity and permeability of II1-2 ere relatively low; they were located above the relatively high-permeability layer of II2-3. Simulation results showed that the lateral migration of CH4 in the II1-2 layer was obviously inhibited. Above the II1-2 layer, the plume type of CH4 occurred until the bottom of the ultralow-permeability caprock at the end of the CH4 injection; this was consistent with previous research results [49,50,51]. At the end of the first gas injection, the maximum lateral migration distance in the gas reservoir was 245 m, which was located in layers III3-6. The lateral migration distance in layer I-1 under the caprock was 235 m, while the minimum lateral migration distance was 135 m in II1-2 after CH4 injection. During the CH4 production process, the saturation of CH4 near the injection zone dropped sharply. The spatial distribution of CH4 at the end of the first cycle of gas production was adopted, as shown in Figure 5d. Figure 6 shows that the gas saturation at the bottom of the caprock increased with the increasing injection–production cycle, the upwards migration distance along the caprock increased, and the gas saturation reached 0.35 at the end of the tenth injection–production cycle.

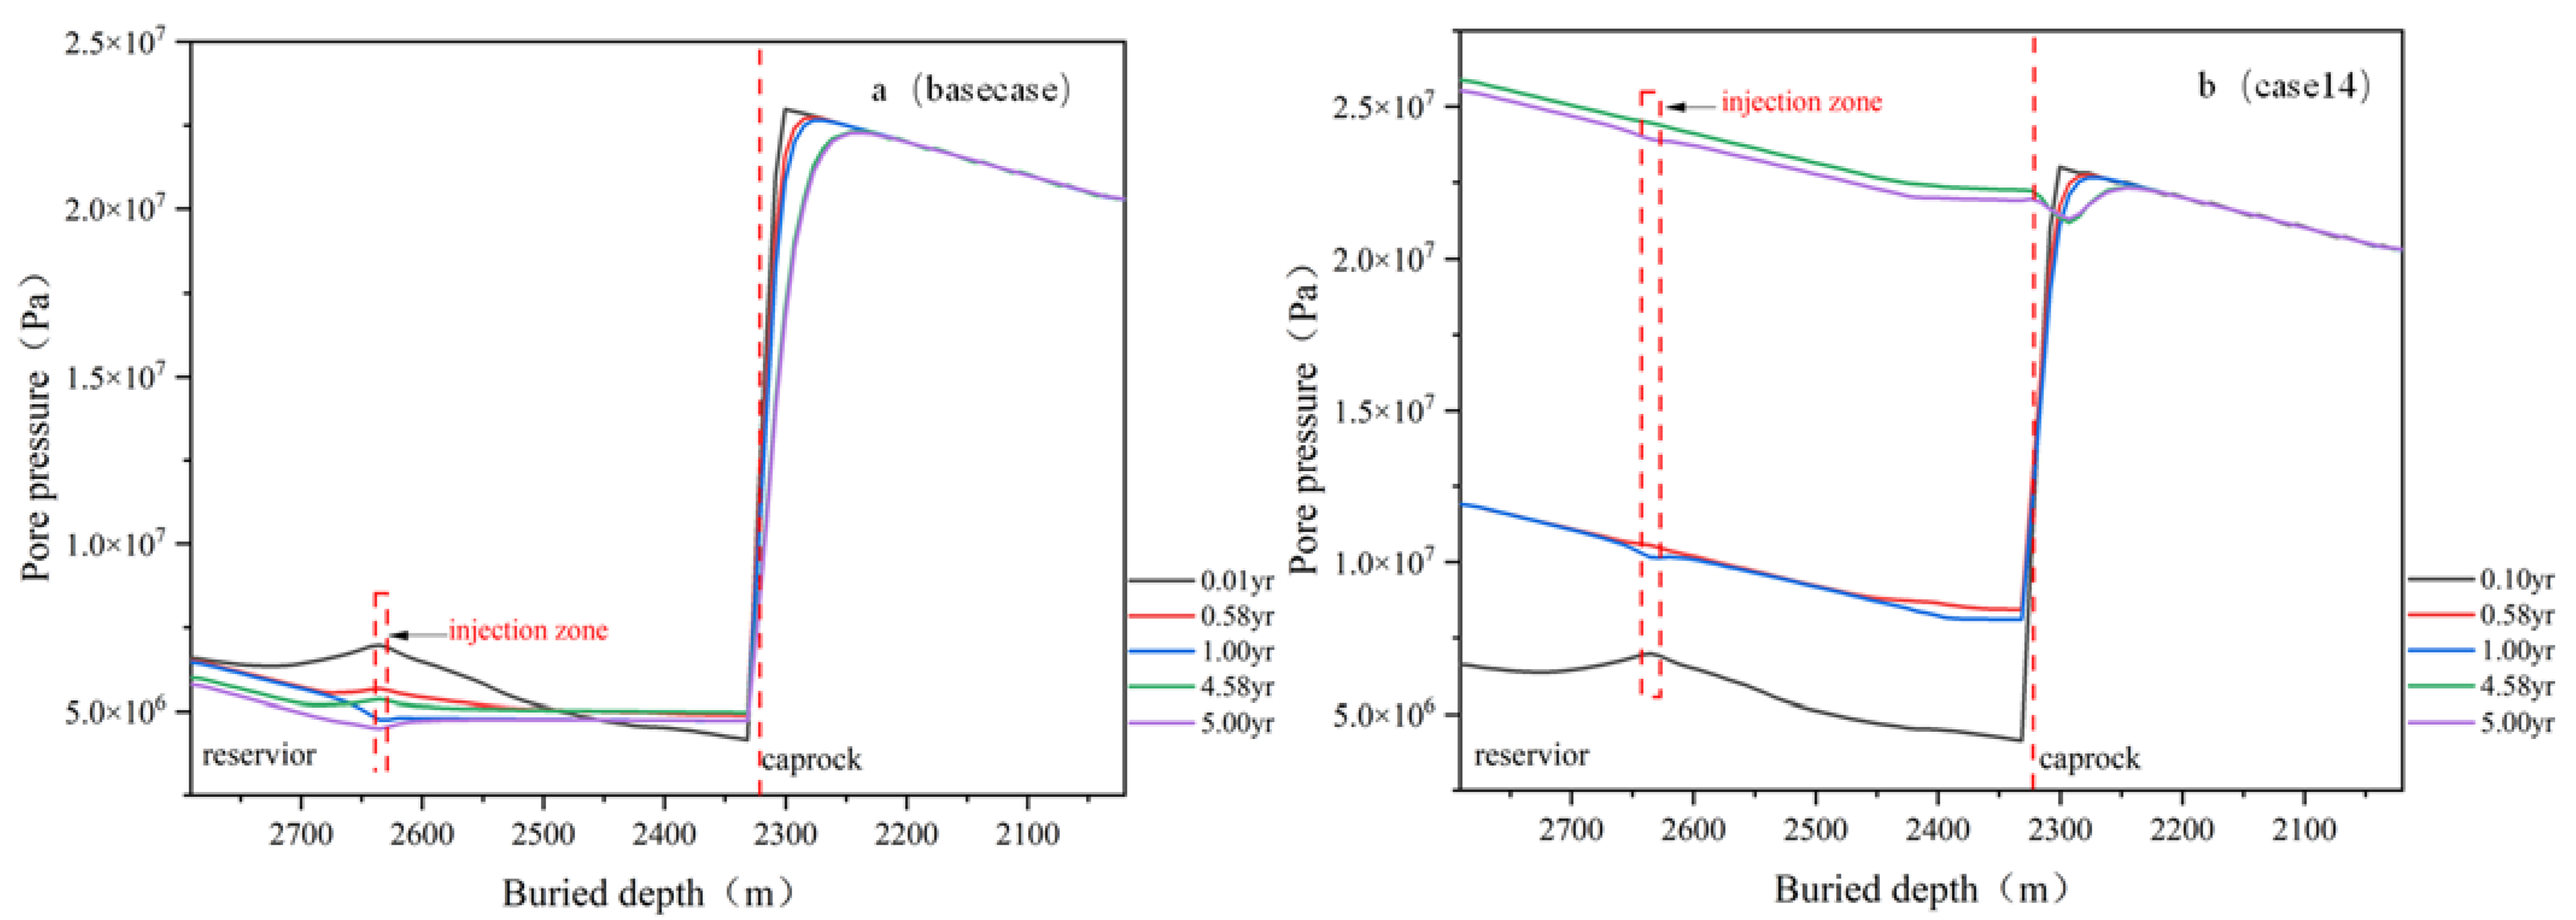
5.1.2. Pore Pressure Dissipation during the Gas Injection and Production Process

The initial pore pressure of each layer in the reservoir was assigned as 5 MPa, which was the depletion pressure of reservoirs. As shown in Figure 7, the pore pressure near the injection zone changed dramatically, more greatly affecting the range with increasing injection time. The mass and energy can exchange at the open boundary. With continuous injection of fluid, the energy exchange between the reservoir and the surrounding strata took place slowly [52,53]. The formation pressure gradually returned to its initial state. As shown in Figure 8, the pore pressure at the bottom of the caprock decreased and the upward migration distance of gas increased with the continuous injection. Affected by the closed boundary in case14, the pore pressure in the reservoir increased sharply after gas injection. The pore pressure in the reservoir was greater than at the bottom of the caprock after five cycles of gas production. The variation trend of pore pressure at the bottom of caprock in the closed boundary case was different from that of the base case, showing a trend of first decreasing and then increasing.

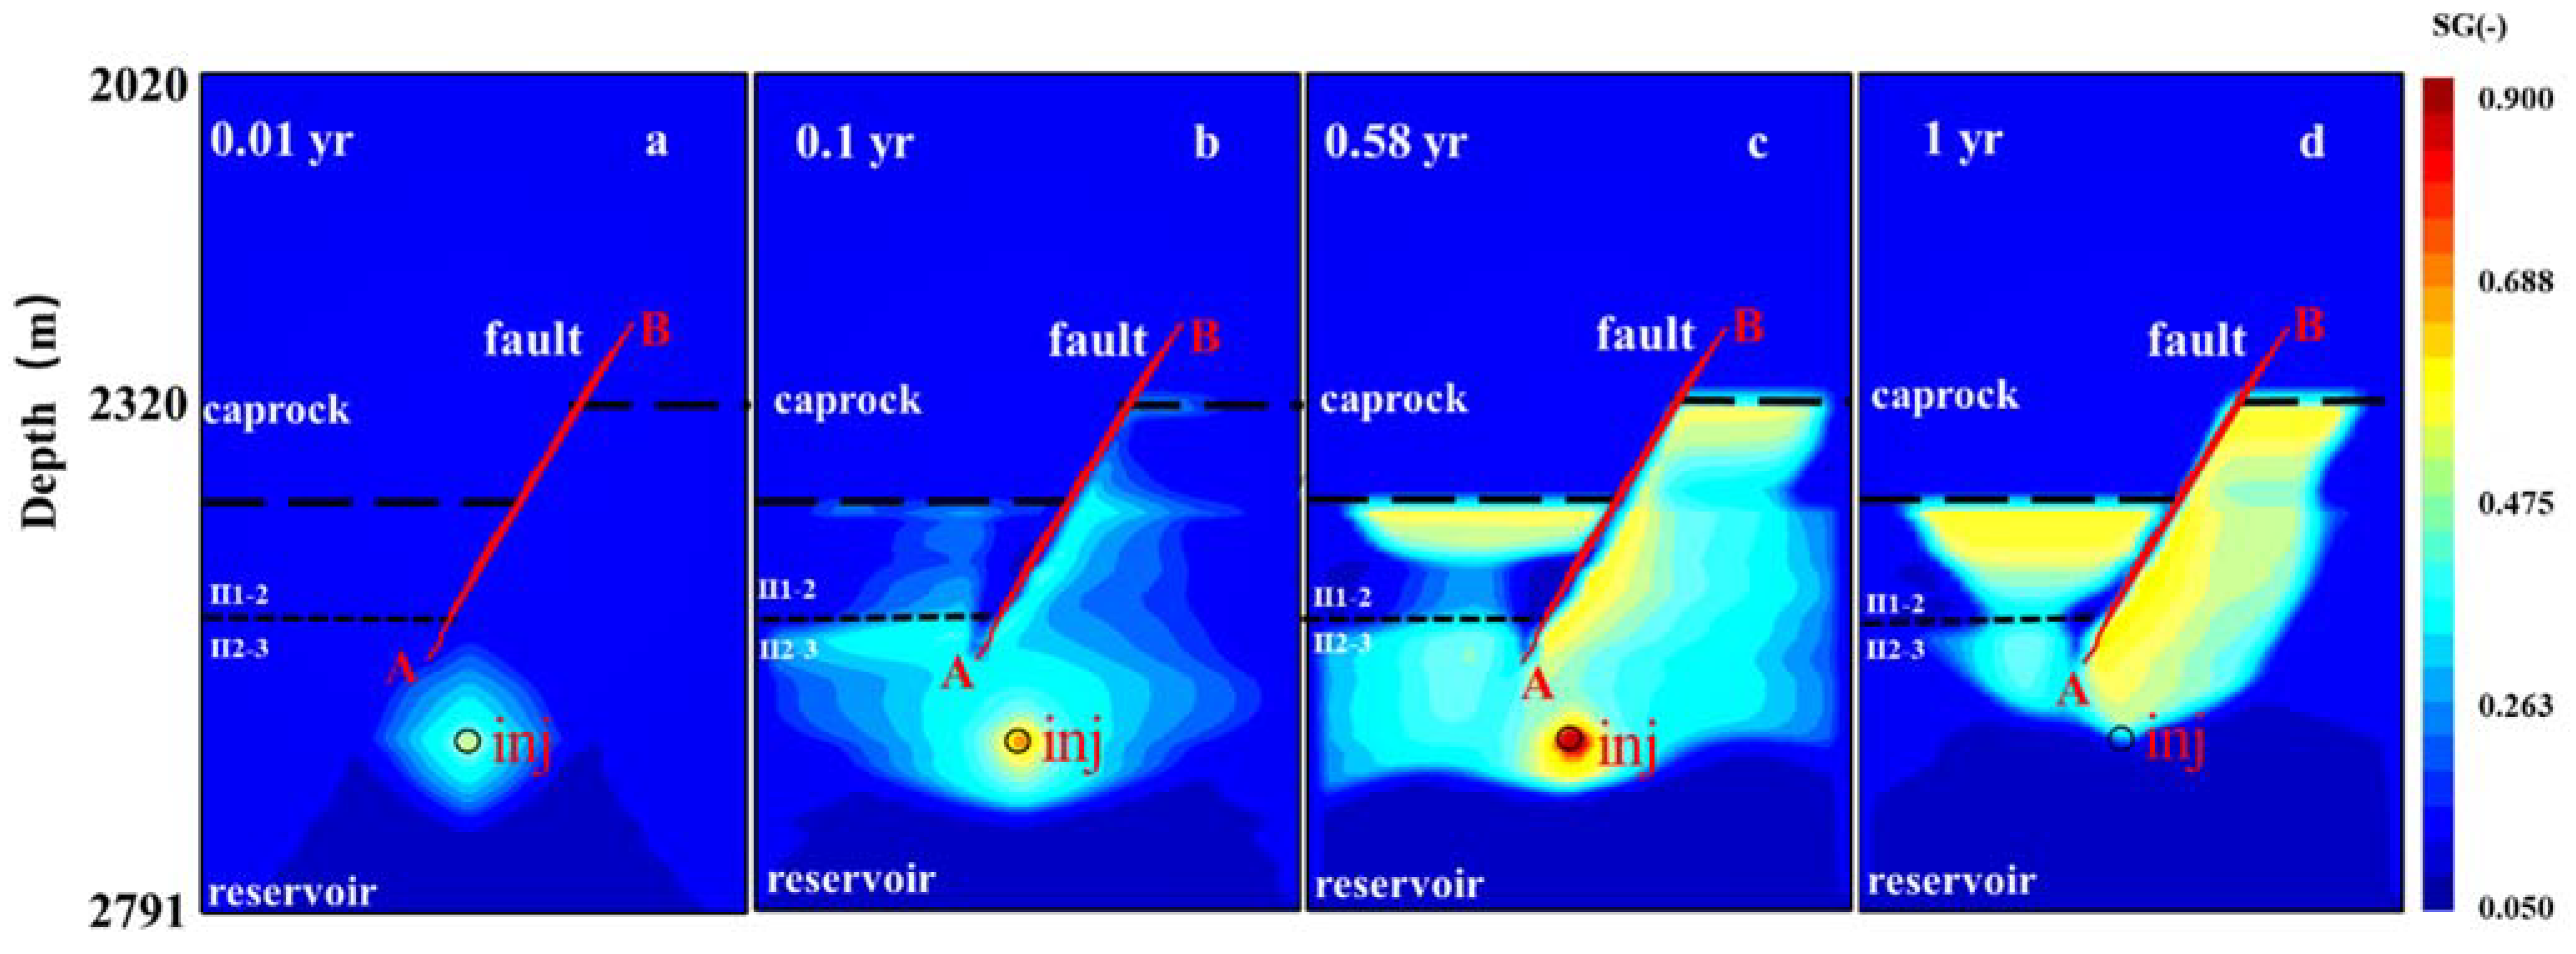
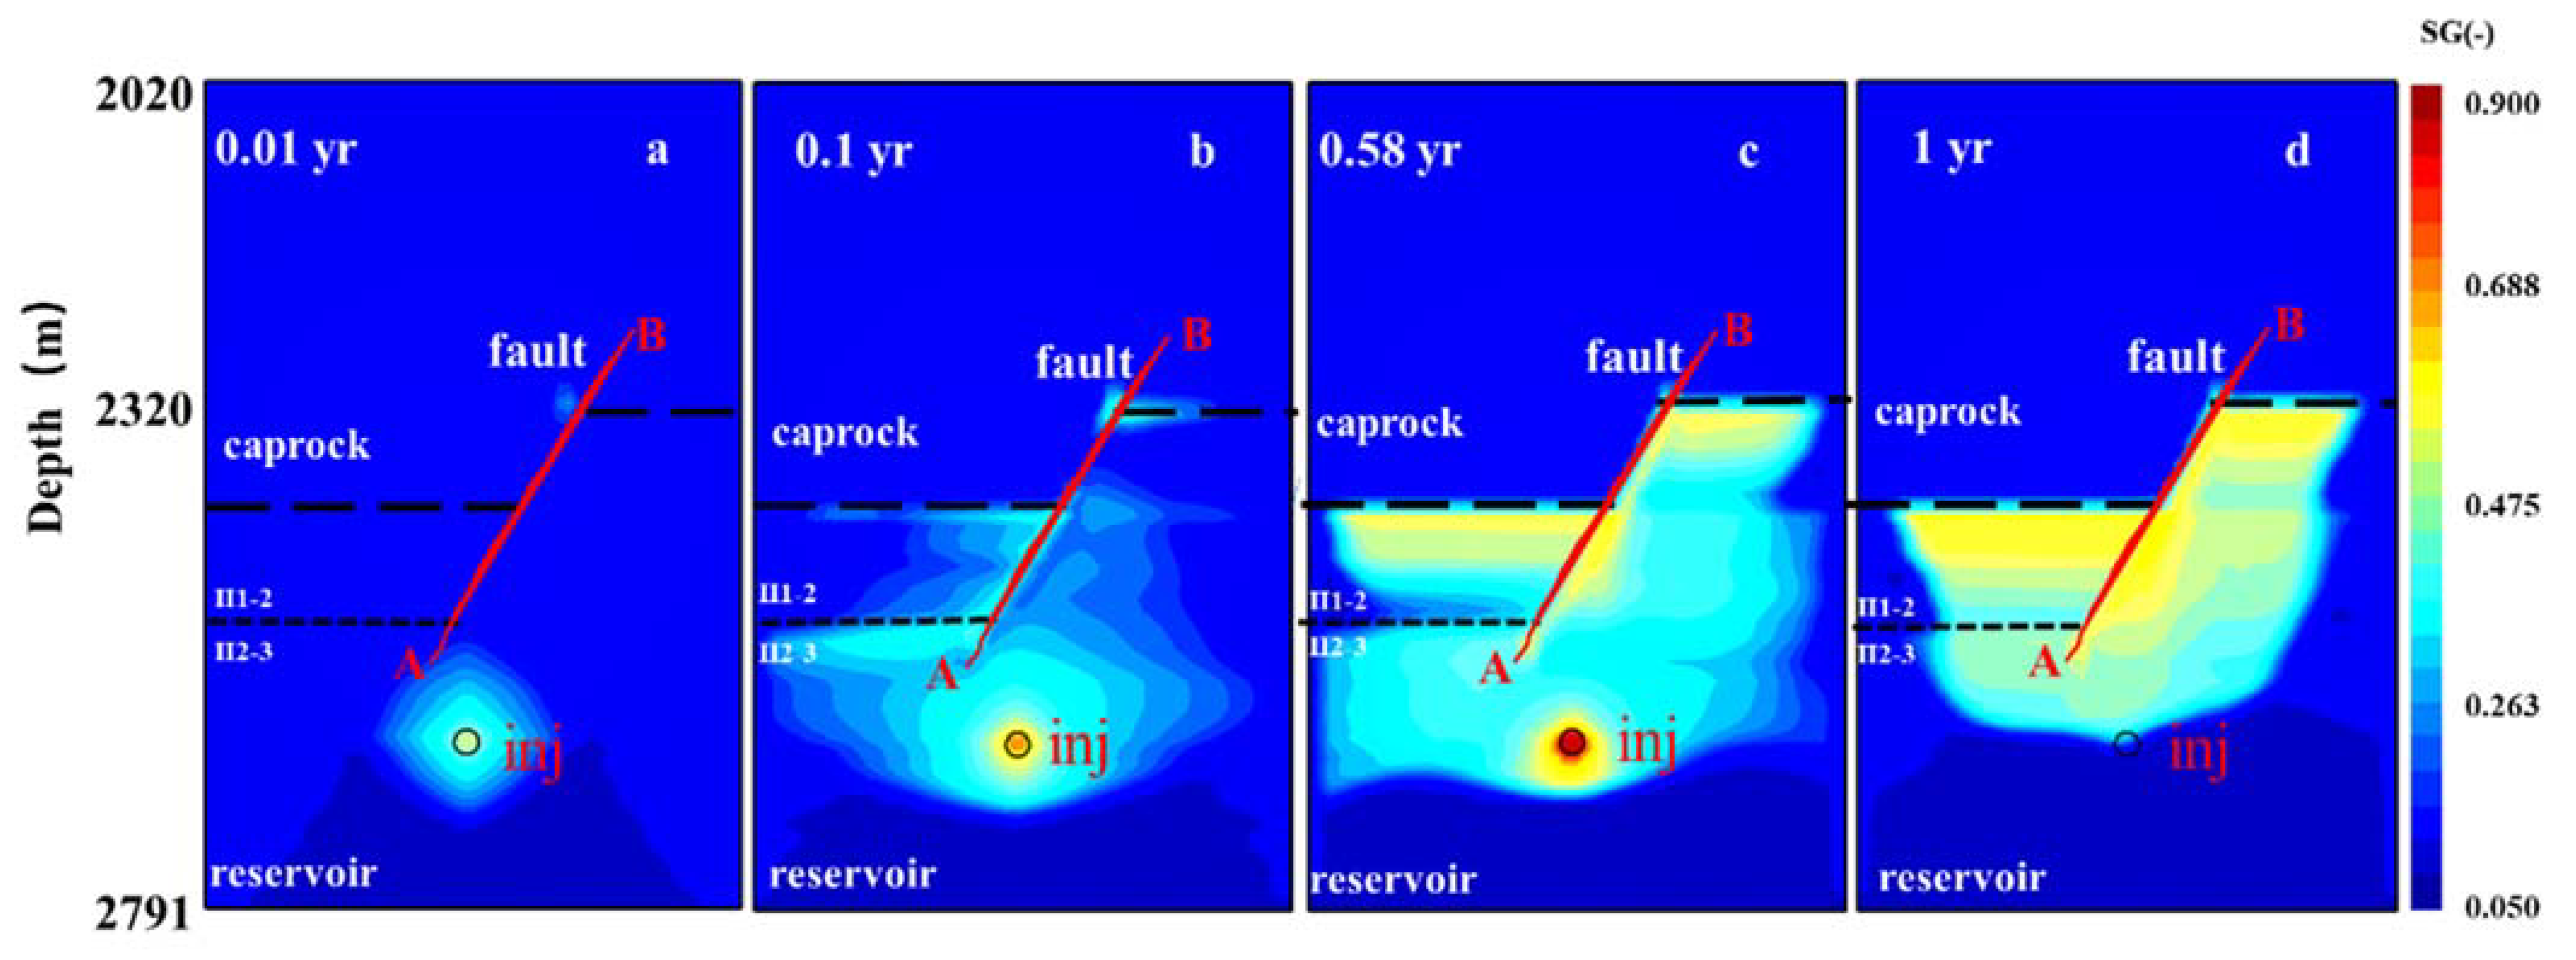
5.2. Migration of Natural Gas in UGSs with Internal Faults

5.2.1. Influence of Initial Permeability of Fault Zone

The low-permeability fault in the UGS may inhibit the upwards migration of natural gas located below the fault zone and destroyed the lateral continuity of migration in the reservoir. Compared with the hanging wall, the migration zone of natural gas in the footwall was wider. A high concentration zone of natural gas as located in the footwall parallel to the fault strike direction. Less gas migrated upwards in the hanging wall after lateral migration below the fractured zone (Figure 9). With the increase in the injection–production cycles, the gas saturation of the hanging wall increased, and more gas entered the hanging wall of the fault zone or passed through the fault. Due to the obstruction of low-permeability faults, the gas saturation was lowest along the fault zone (Figure 9c,d).
When the faults were semi-open and the permeability of the fault zone (k = 10 mD) was lower than the surrounding reservoirs. The lateral sealing ability of the fault was weakened greatly. The gas accumulation on the hanging wall of the fault was greatly increasing at the end of the gas injection. At that time, the horizontal migration distance of natural gas in hanging wall reservoir Ⅰ-1 was the farthest (i.e., 300 m). At the end of gas production, the gas distribution profile was gyro-shaped. Compared with the base case without faults, the gas distribution was obviously affected by the strike and scale of fault zones (Figure 10).
When the faults were opening, the permeability of the fault zone (K = 1 D) was much higher than that of the surrounding reservoirs. The fault zone became the preferential migration channel and the migration speed of natural gas in the hanging wall of the fault accelerated. At the end of the gas injection, low-concentration gas distribution appeared at the tip of the lower fault, and high-concentration CH4 gas appeared along the fault zone (Figure 11).
Figure 12 was generated by extracting pore pressure and gas saturation at different times along the bottom of caprocks at the depth of 2315 m. The gas saturation of the fault in case 3 was 0.23 (Figure 12c), but the gas saturation at the same depth in case 7 was 0.23 at 0.01 year and reached 0.43 after 10 cycles of injection–production (Figure 12a). This showed that the high-permeability fault became the dominant channel for gas migration. The pore pressure at the bottom of the caprock decreased with the injection–production cycles. The pore pressure at the bottom of the caprock without a fault decreased by approximately 6 MPa compared with the initial pressure at the end of the tenth cycle of gas injection–production. In case 7, the gas saturation near the fault in the lower wall was lower than that near the fault in the upper wall. From 0.01 year to the end of 10 injection–production cycles, the gas saturation difference between the two points increased from 0 to 0.1. The reason for this phenomenon was that the gas tended to preferentially migrate upwards along the fault. Combined with the results, this showed that the existence of faults had no effect on the sealing performance of caprocks in other areas. As shown in Figure 12, the pore pressure at the low permeability fault in case 3 was 0.3 MPa higher than that at other positions at the same depth after ten cycles of gas injection–production. The gas saturation in the fault zone was also lower than that at other positions. Therefore, even if there was a fault in the formation, when its permeability was low, the negative effect on the sealing performance could be ignored for a period of time [54].

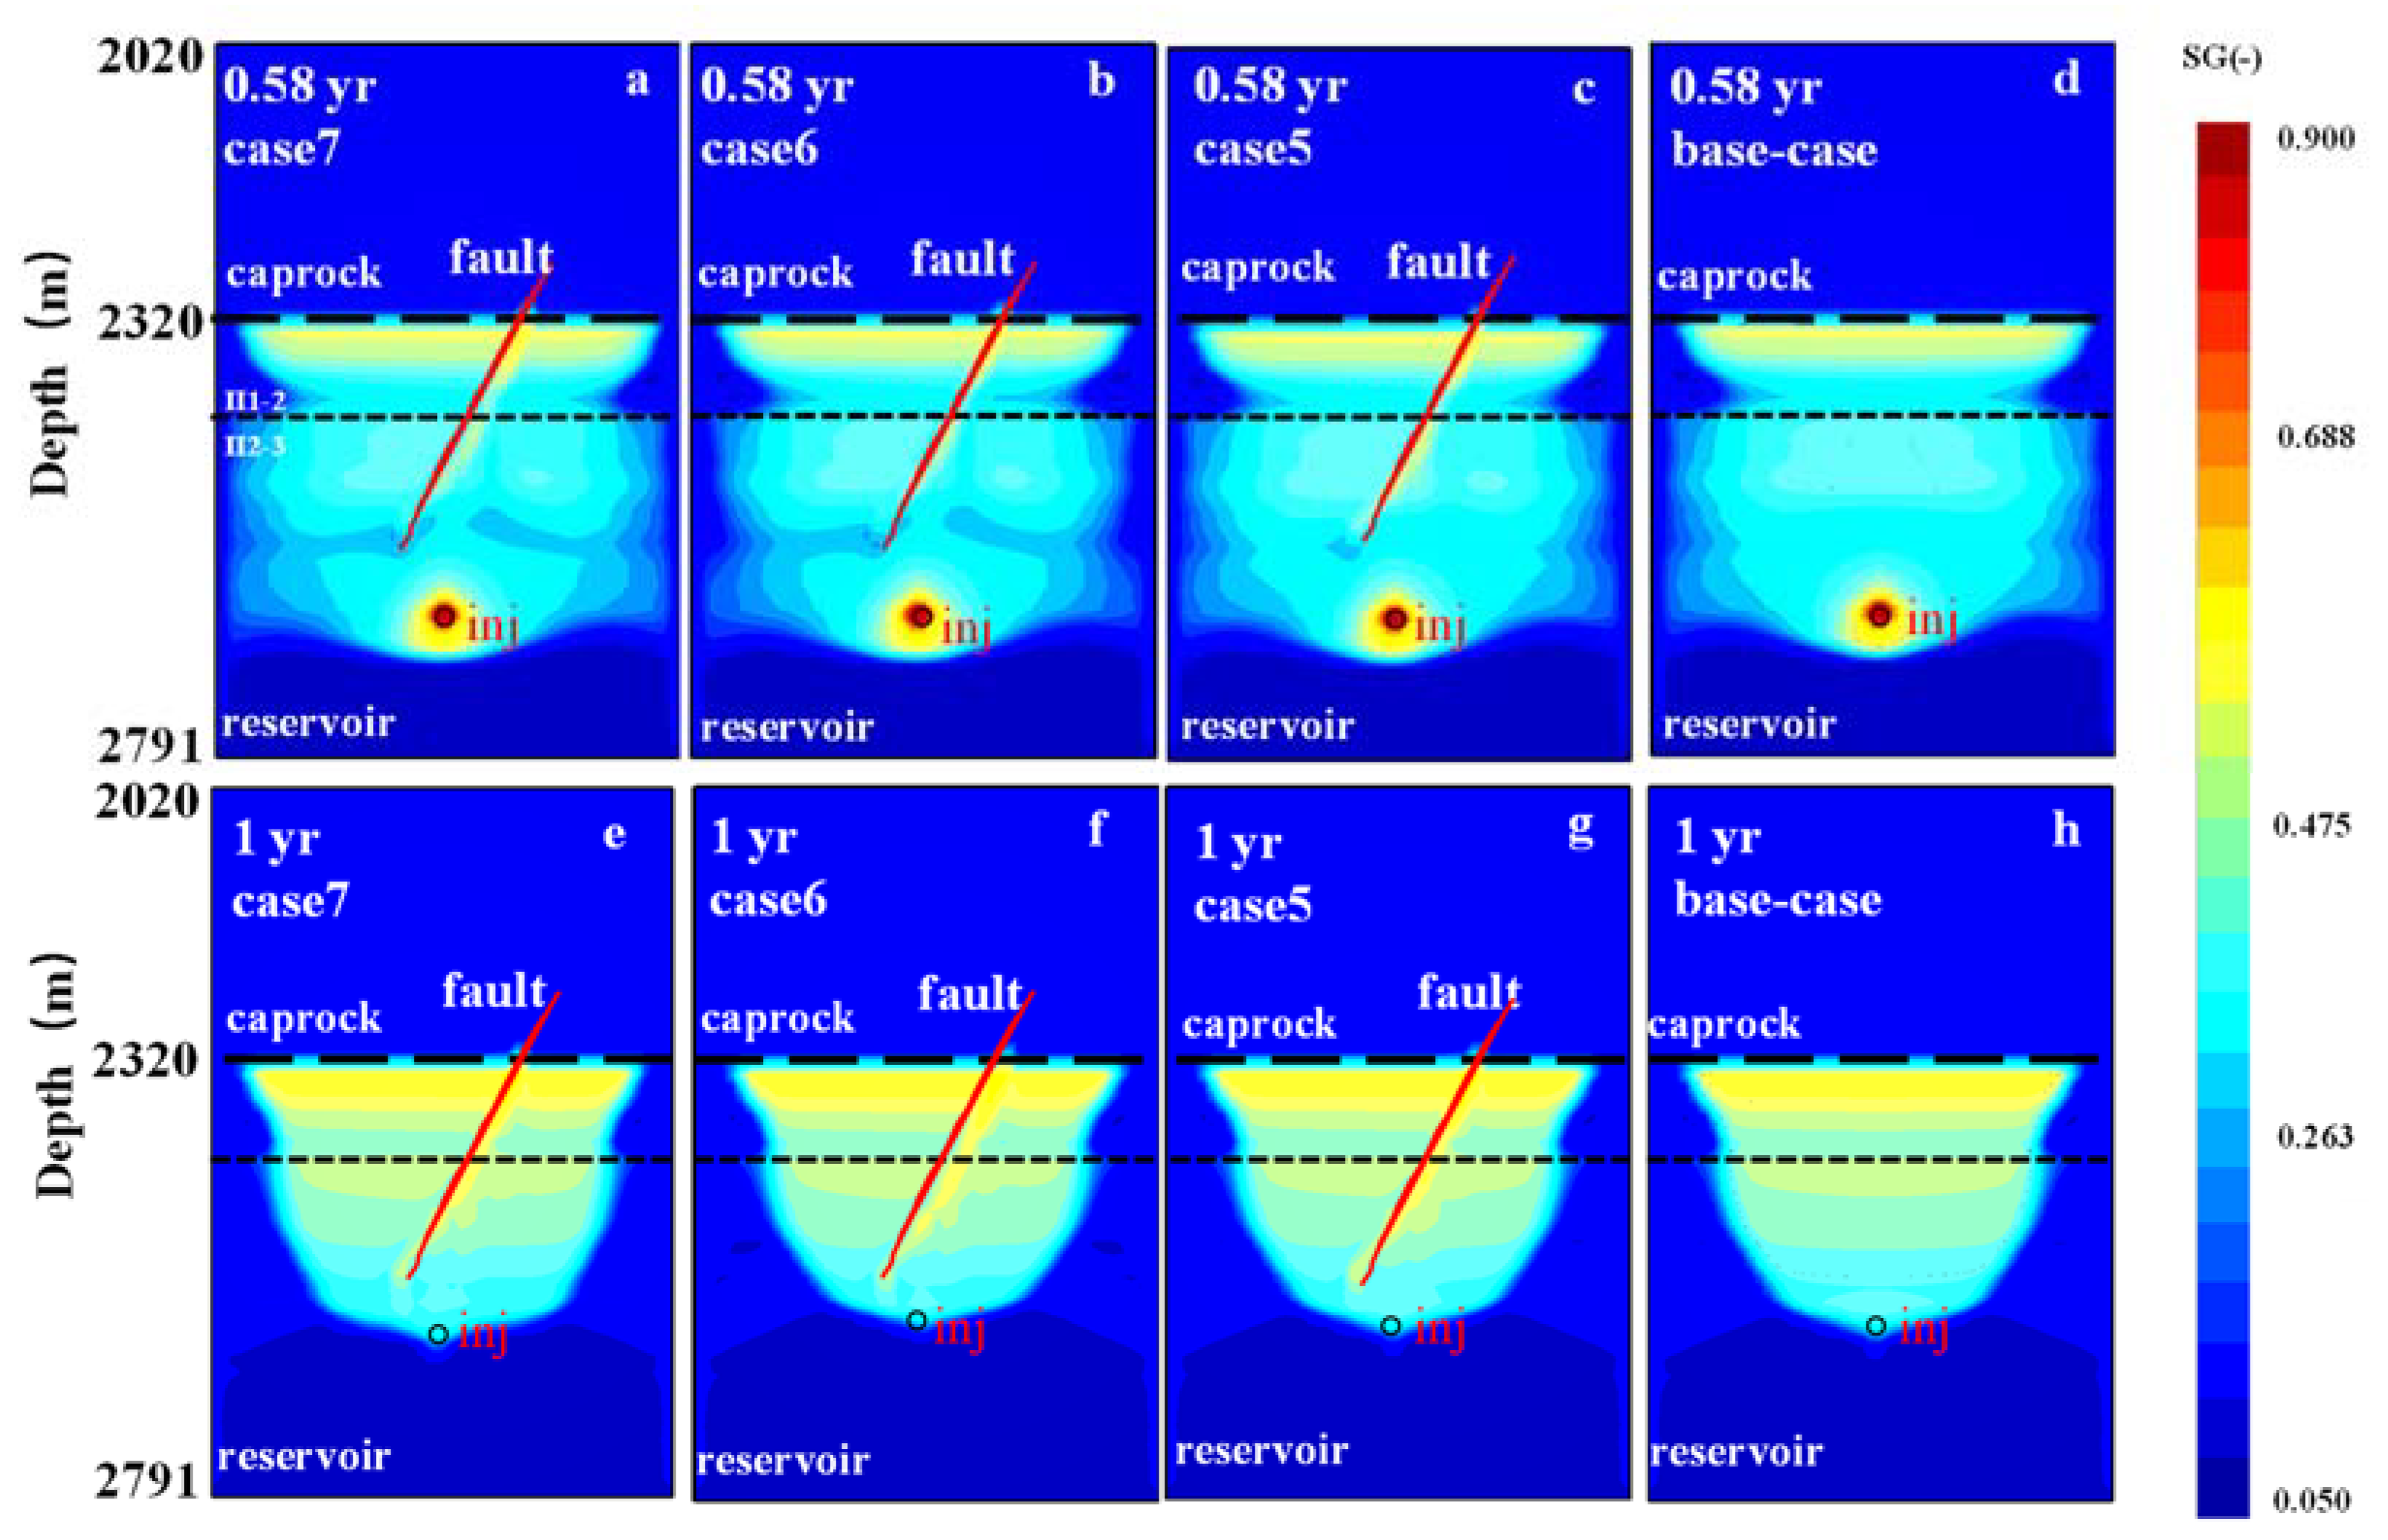
5.2.2. Influence of Fault Scale

The simulation results of low-permeability faults with three different fault scales in case 1~case 3 were compared and analyzed. The gas saturation distribution at the top of the reservoir at the depth of 2325 m under different scales of faults is shown in Figure 13. As shown in Figure 13, when the fault scale was 500 m, 250 m, and 10 m, the gas saturation started to decrease from 0.4 at lateral distances of the upper wall from the faults of 200 m, 220 m, and 246 m, respectively. When the scale of the footwall fault was 500 m or 250 m, the gas saturation began to decrease at a lateral distance of 120 m from the fault edge. When the scale of the fault was 10 m, the gas saturation reached 0.4 within 90 m of the footwall, and it began to decrease beyond 90 m. It can be concluded that the larger the scale of the low permeability fault, the stronger the hindrance to gas lateral migration. Figure 13 shows that the gas saturation in the fault zones of case 3 and case 2 was lower than 0.2, while the gas saturation in case 1 was above 0.25. This also showed that the larger the fault scale, the worse vertical migration of gas.
The simulation results of three kinds of high permeability faults with different fault scales were compared in cases 5–7. Figure 13 shows that in terms of horizontal migration, the gas migration distance between the upper and lower walls of three schemes was almost the same, and the gas saturation decreased when the upper wall was 246 m away from the fault edge and the lower wall was 90 m away from the fault. As shown in Figure 14, when the fault scale was 500 m (case 7), the gas saturation of the reservoir below the fault zone was the lowest, and the larger the fault scale, the stronger the vertical migration ability of the gas.

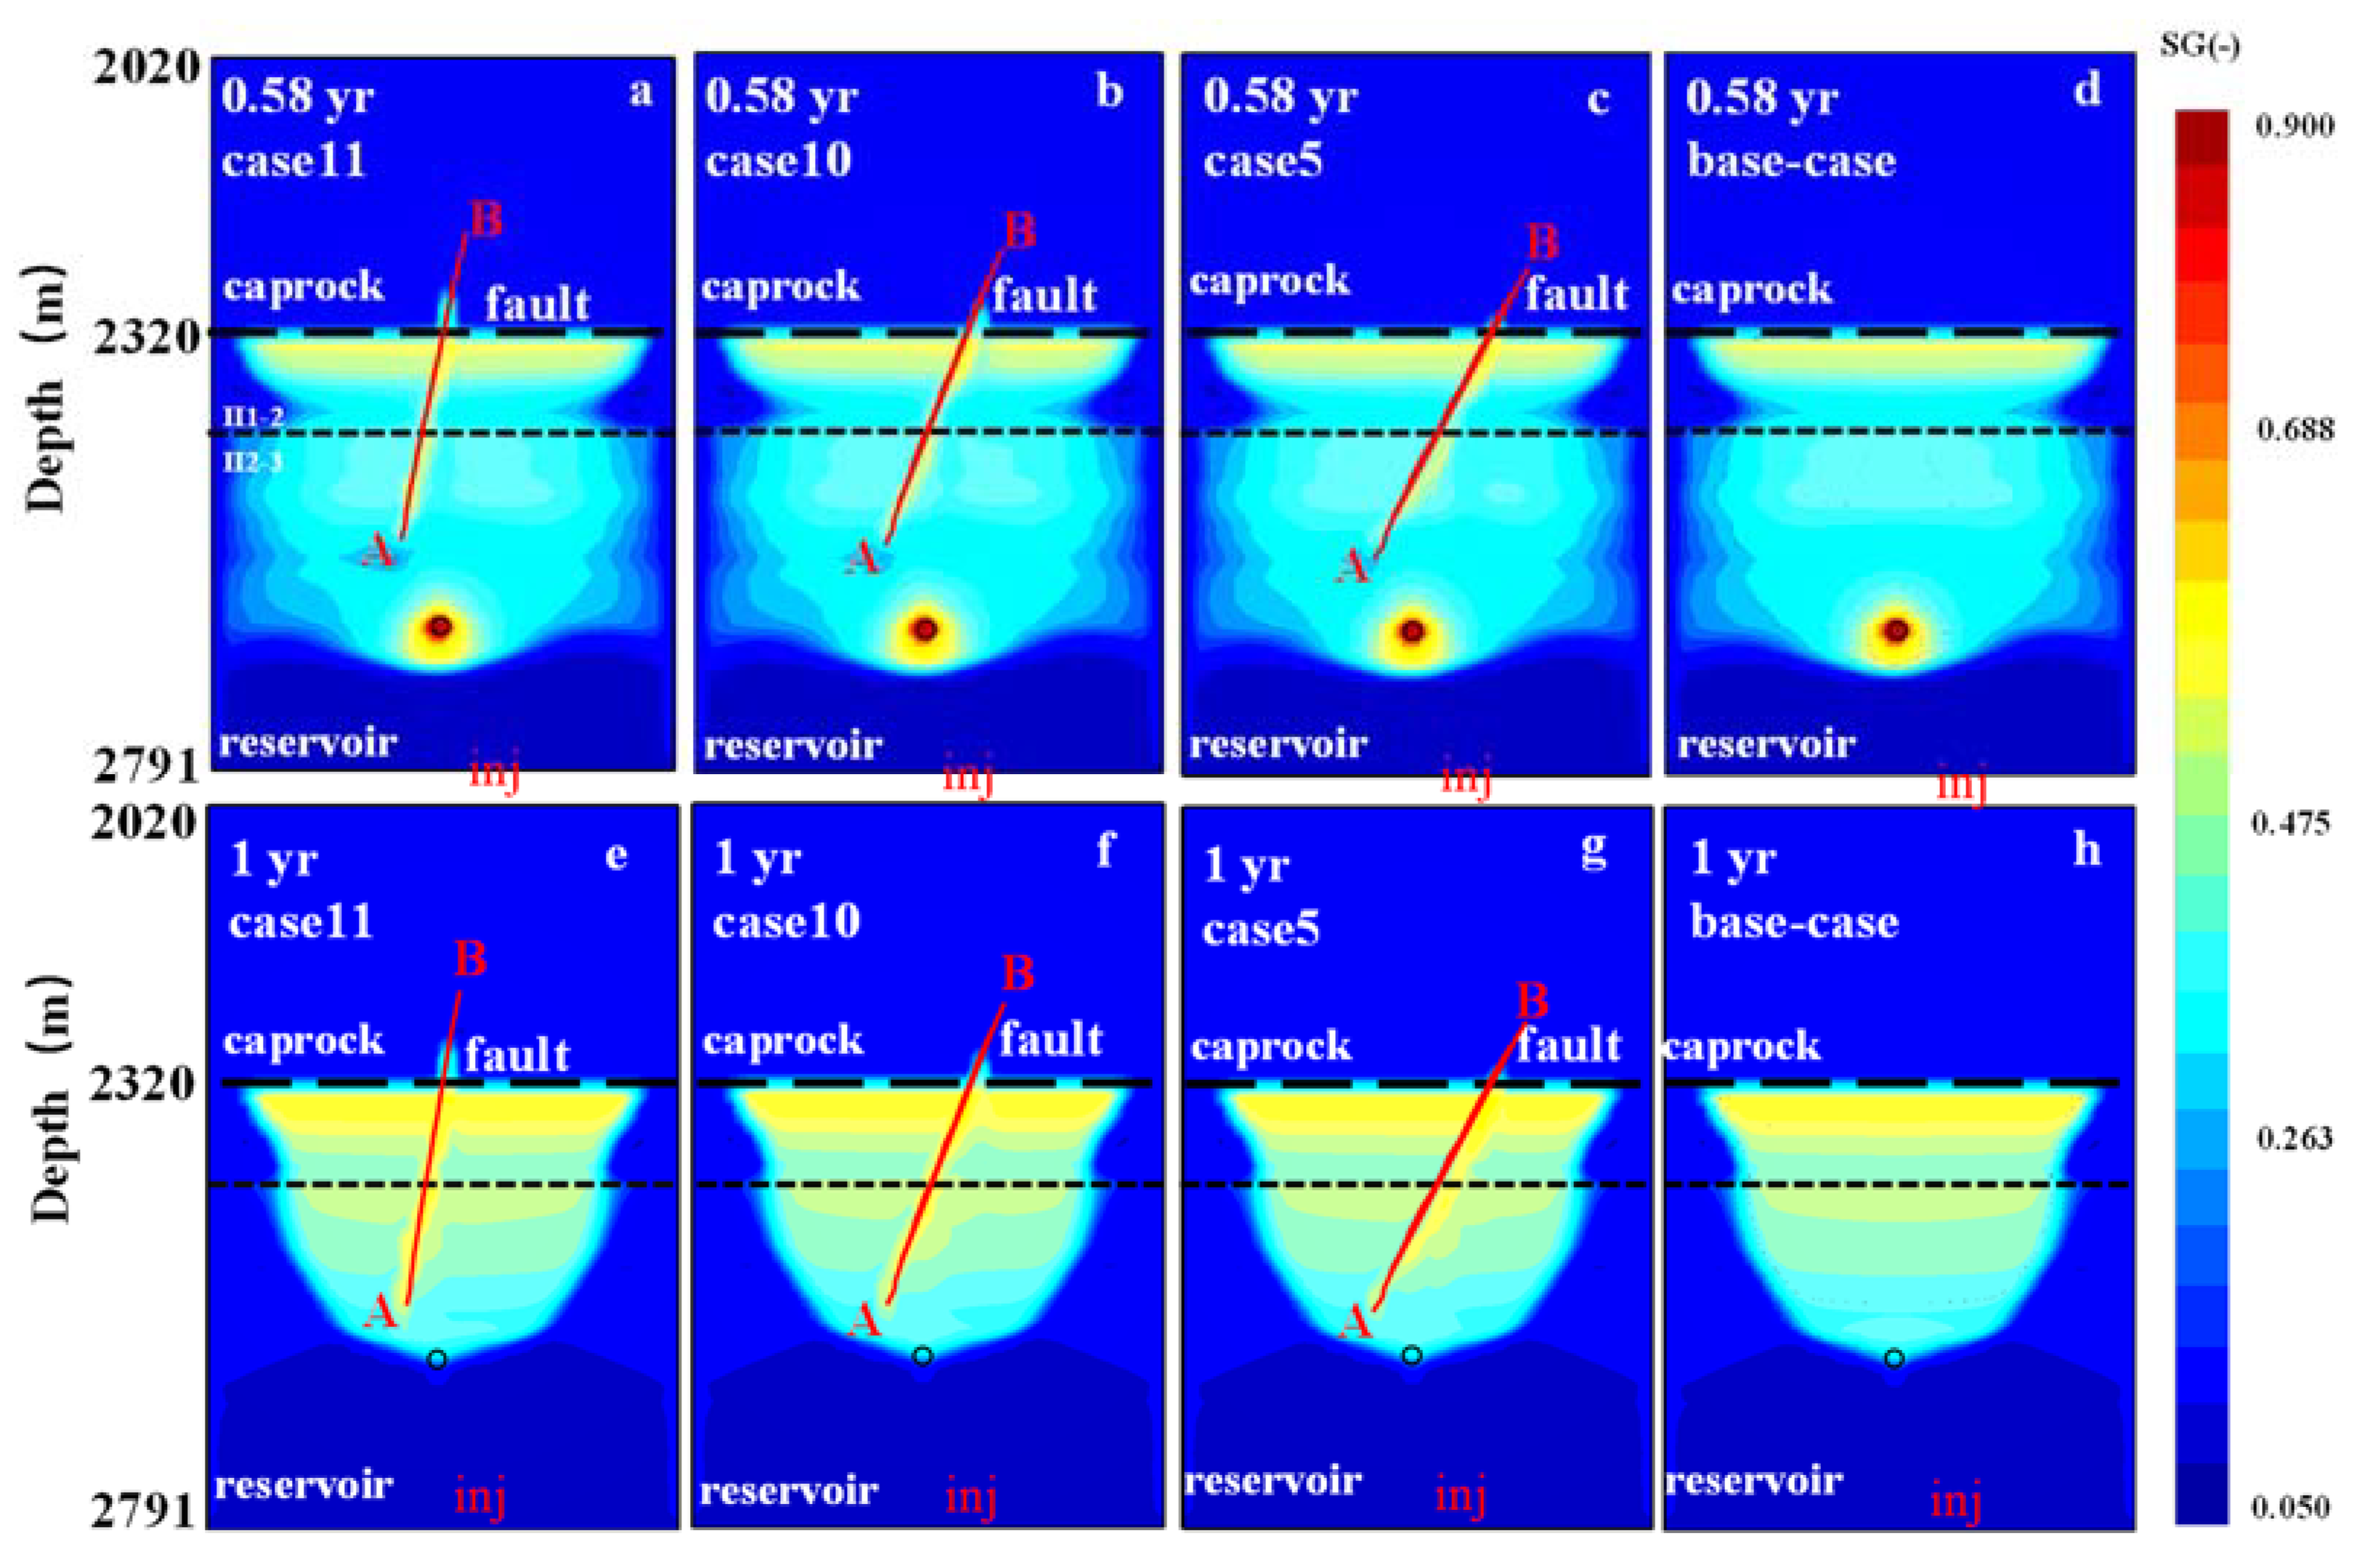
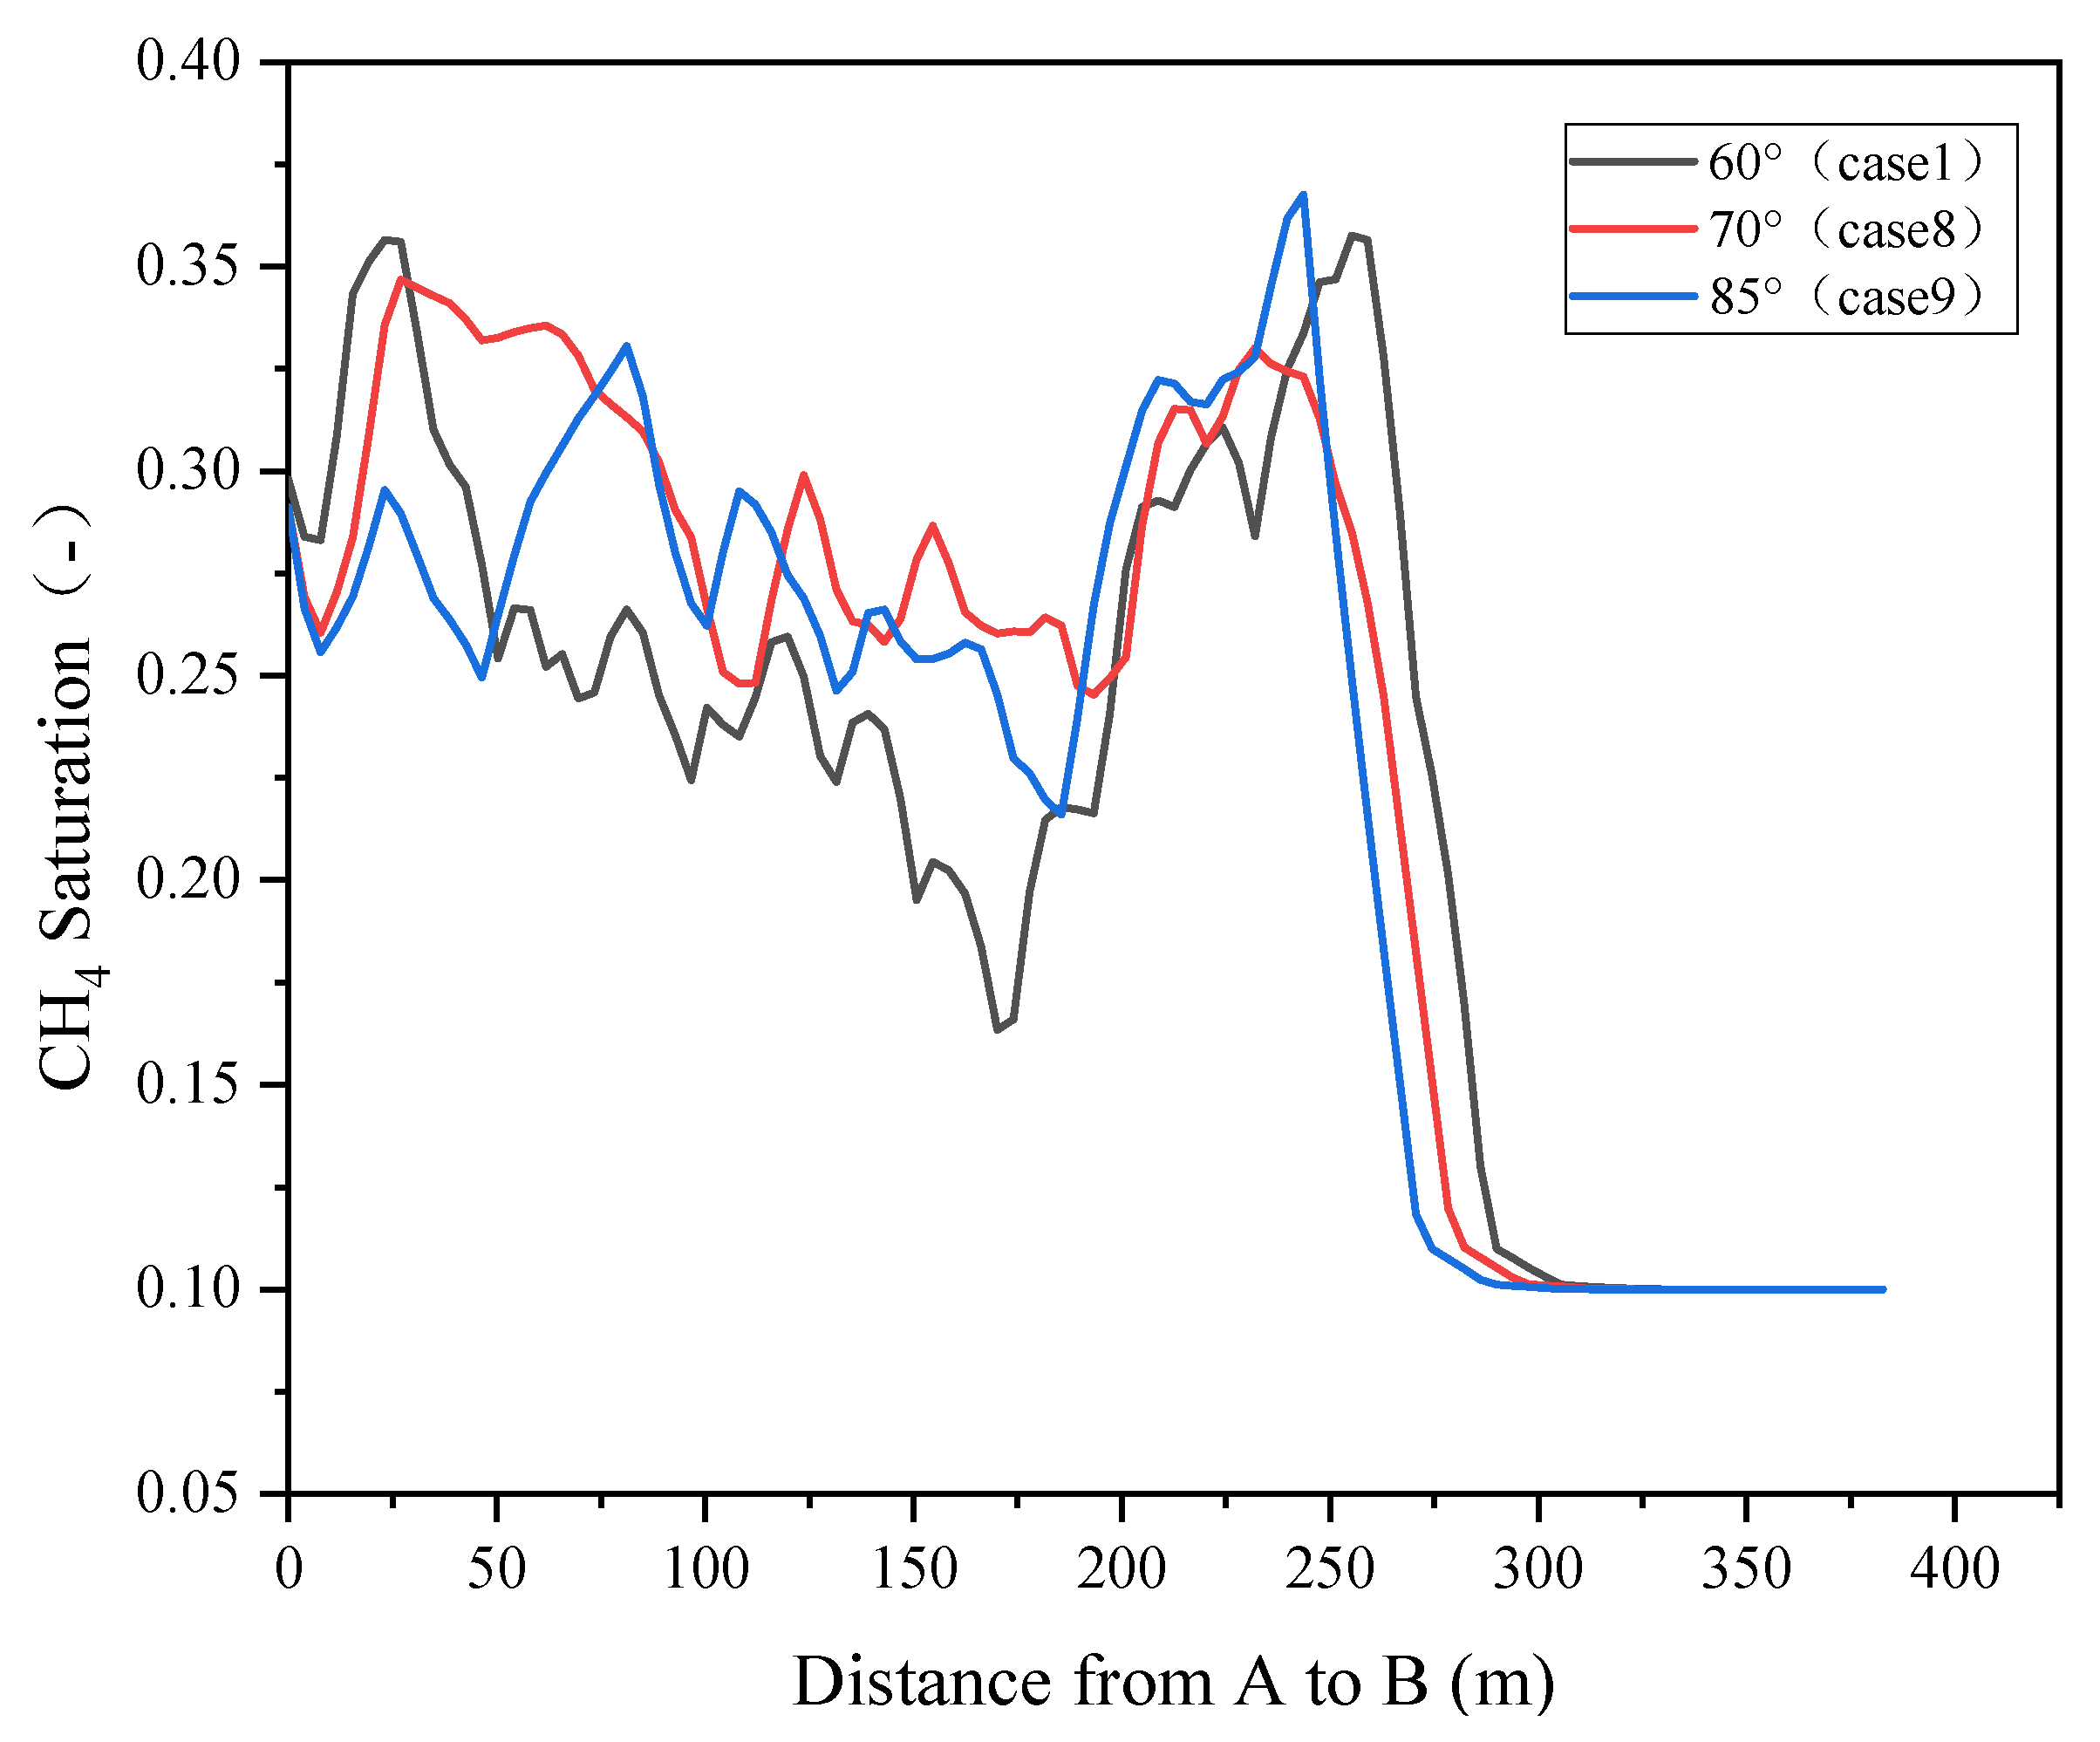
5.2.3. Influence of Fault Dip Angle

The impacts of three open faults with different dip angles (60°, 70, and 85°) on the gas migration were compared in Figure 15. When the dip angle of the fault was 85°, the gas migrated from the bottom of the caprock upwards along the fault for approximately 20 m. When the dip angle was 60°, the migration distance was approximately 5 m. The larger the dip angle, the farther the gas migrated upwards along the fault, and the vertical migration capacity of the fault was enhanced. Complex flow existed at the tip of the fault with a large dip angle. With a larger dip angle of the fault, the gas in the pores near the tip of the fault migrated to the fault zone. The results were the same as those of previous studies [55].
Comparing with different cases characterized as three fault dip angles, it was found that the gas distribution had no obvious relationship with the change in the fault dip angle. As shown in Figure 16, the gas saturation along the same fault profile was uneven distributed, which was mainly controlled by the seepage characteristics of the surrounding rocks.

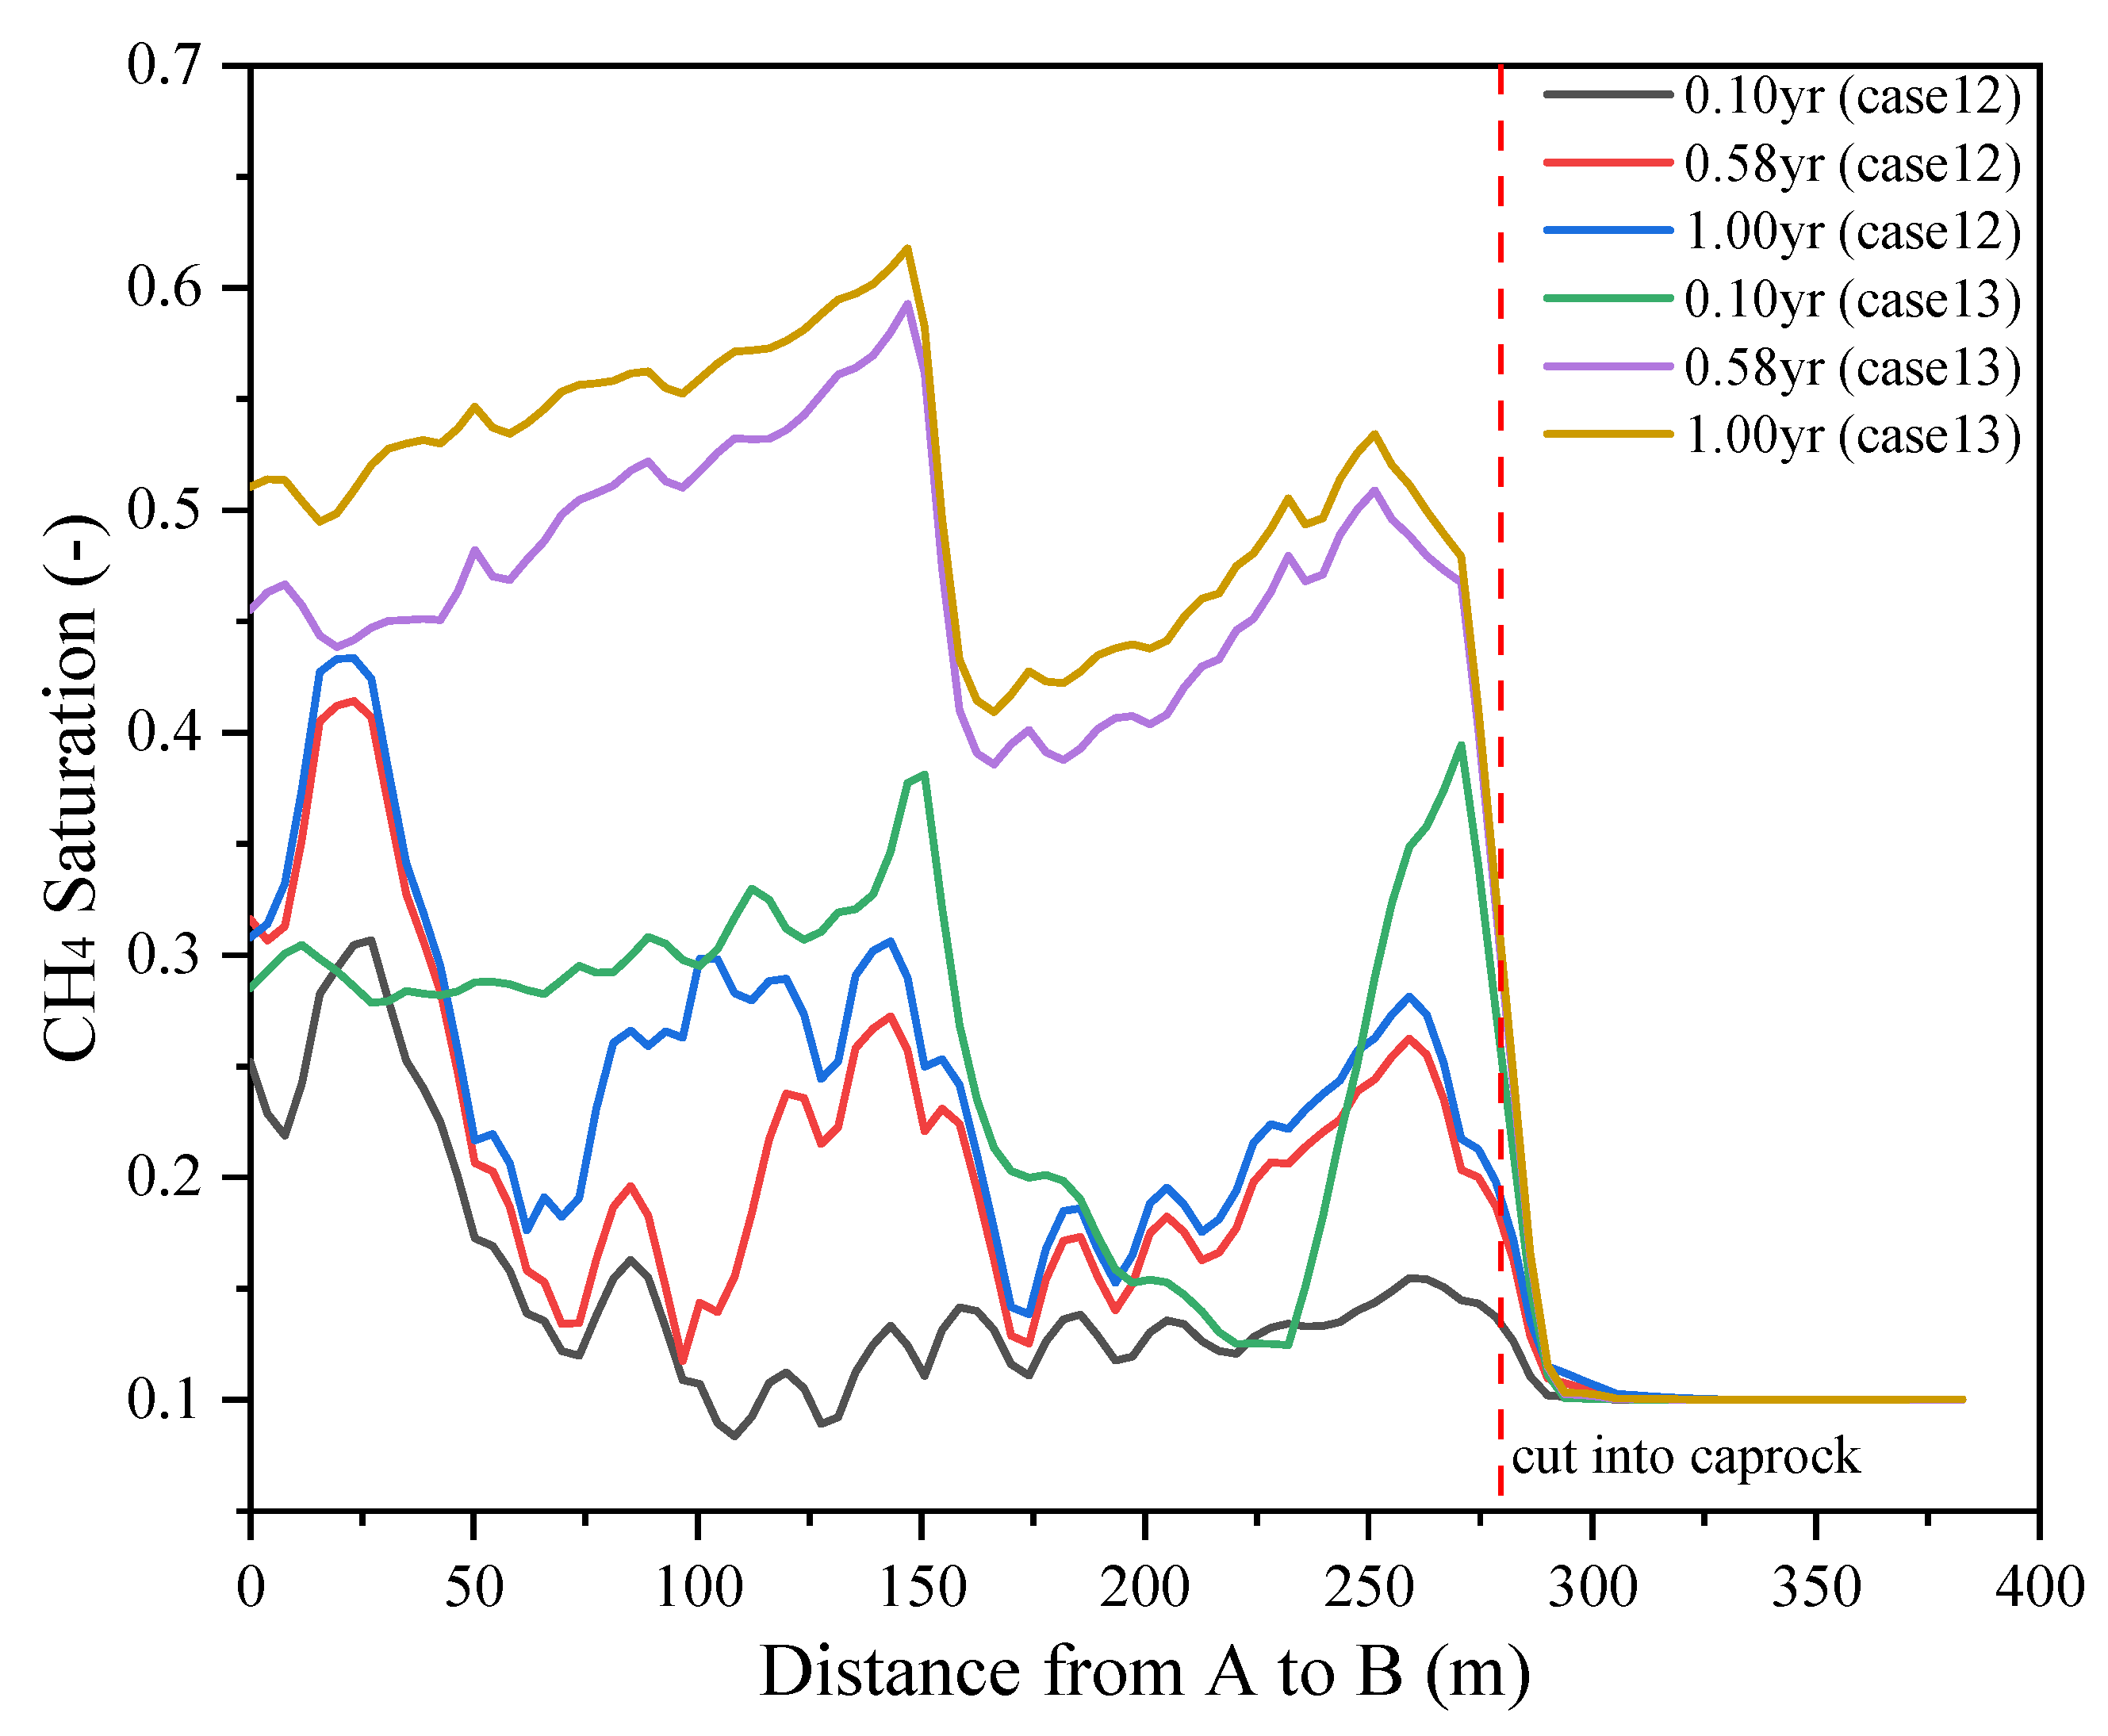
5.2.4. Influence of Fault Type

Compared with the fault zone without fault displacement, the normal fault with displacement resulted in the lateral discontinuity of the formation. The downward movement of the hanging wall along the fault caused the overlying argillaceous caprock laterally contact with the reservoir layers from I-1 to II1-2, forming a good lateral sealing of natural gas. When the initial sealing performance of the fault zone was good (i.e., the porosity and permeability were very low), with the continuous injection of CH4, the footwall reservoir of the fault zone was the preferential gas migration channel. The gas bearing zone in the upper wall presents a basin-like shape, and the gas concentration in the upper part of the reservoir (i.e., I-1 layer) was the highest (Figure 17). As shown in Figure 18, when the gas in the low-permeability fault migrated to the areas with different permeabilities of surrounding rocks on both sides of the fault, the gas saturation in the fault zone did not obviously decrease.
The high-permeability normal fault zone became the dominant channel for gas migration, and the gas migrated along the fault zone to the bottom of the direct caprocks in the hanging wall and the footwall strata. Especially for the footwall strata of the fault, the gas did not migrate vertically and uniformly along the reservoir in the early stage of gas injection. Compared with the low permeability fault, the lateral migration zone in the reservoir at the hanging wall side of the fault was larger at the end of gas injection. Flow around the relatively low-permeability zone in the reservoir occurred, and the gas migrated to the overlying relatively high-permeability reservoir along the high-permeability fault directly (Figure 19). As shown in Figure 18, when gas migrated upwards along the high-permeability fault to surrounding rocks on both sides of the fault, the gas saturation in the fault zone decreased due to the low permeability of surrounding rocks at the hanging wall. The fault displacement affected the vertical migration ability along high-permeability faults, but it had no obvious effect on the vertical migration ability of low-permeability faults. Even though the fault extended into the caprocks, the natural gas did not enter into the caprock along the fault. This implies that the degradation of the sealing performance of the caprocks did not occur.
The numerical simulations are significant for systematically understanding the influence of different properties of faults (e.g., the fault scale, the fault dip angle, and the fault type) on gas migration in a multilayered sandstone reservoir and the sealing performance of the caprock cutting by the faults. They are used to track the natural gas migration by comparing with the situation in the multilayered reservoir–caprock system. It should be noted that there are some assumptions and simplifications in the numerical simulations. No permeability or porosity updates were considered, meaning that the porosity and permeability of a specific element were constant. The stress effect was not considered in the simulations. In the three-dimensional flow simulations, two phases (i.e., water and gas) were used, while the oil phase was not studied. All these are gradually implemented in the updated three-phase, multifield, fractured numerical models.

6. Conclusions

Some major faults penetrating into the caprocks may cause deterioration of sealing performance of underground gas storage engineering. In this paper, the EWASG module in Petrasim was used to track the natural gas migration during the injection and production of CH4 under the impacts of complicated fault systems, including porosity, permeability, dip angle, and scale of faults. Some main conclusions are as follows:
  • Reservoir pressure is strongly disturbed during the cyclic high rate injection and production of natural gas in underground gas storage engineering, especially at the periphery of wells. Formation anisotropy leads to an obvious difference in the gas front in different layers, due to lateral and vertical migration of natural gas, which is strongly constrained by relatively low permeability layers.
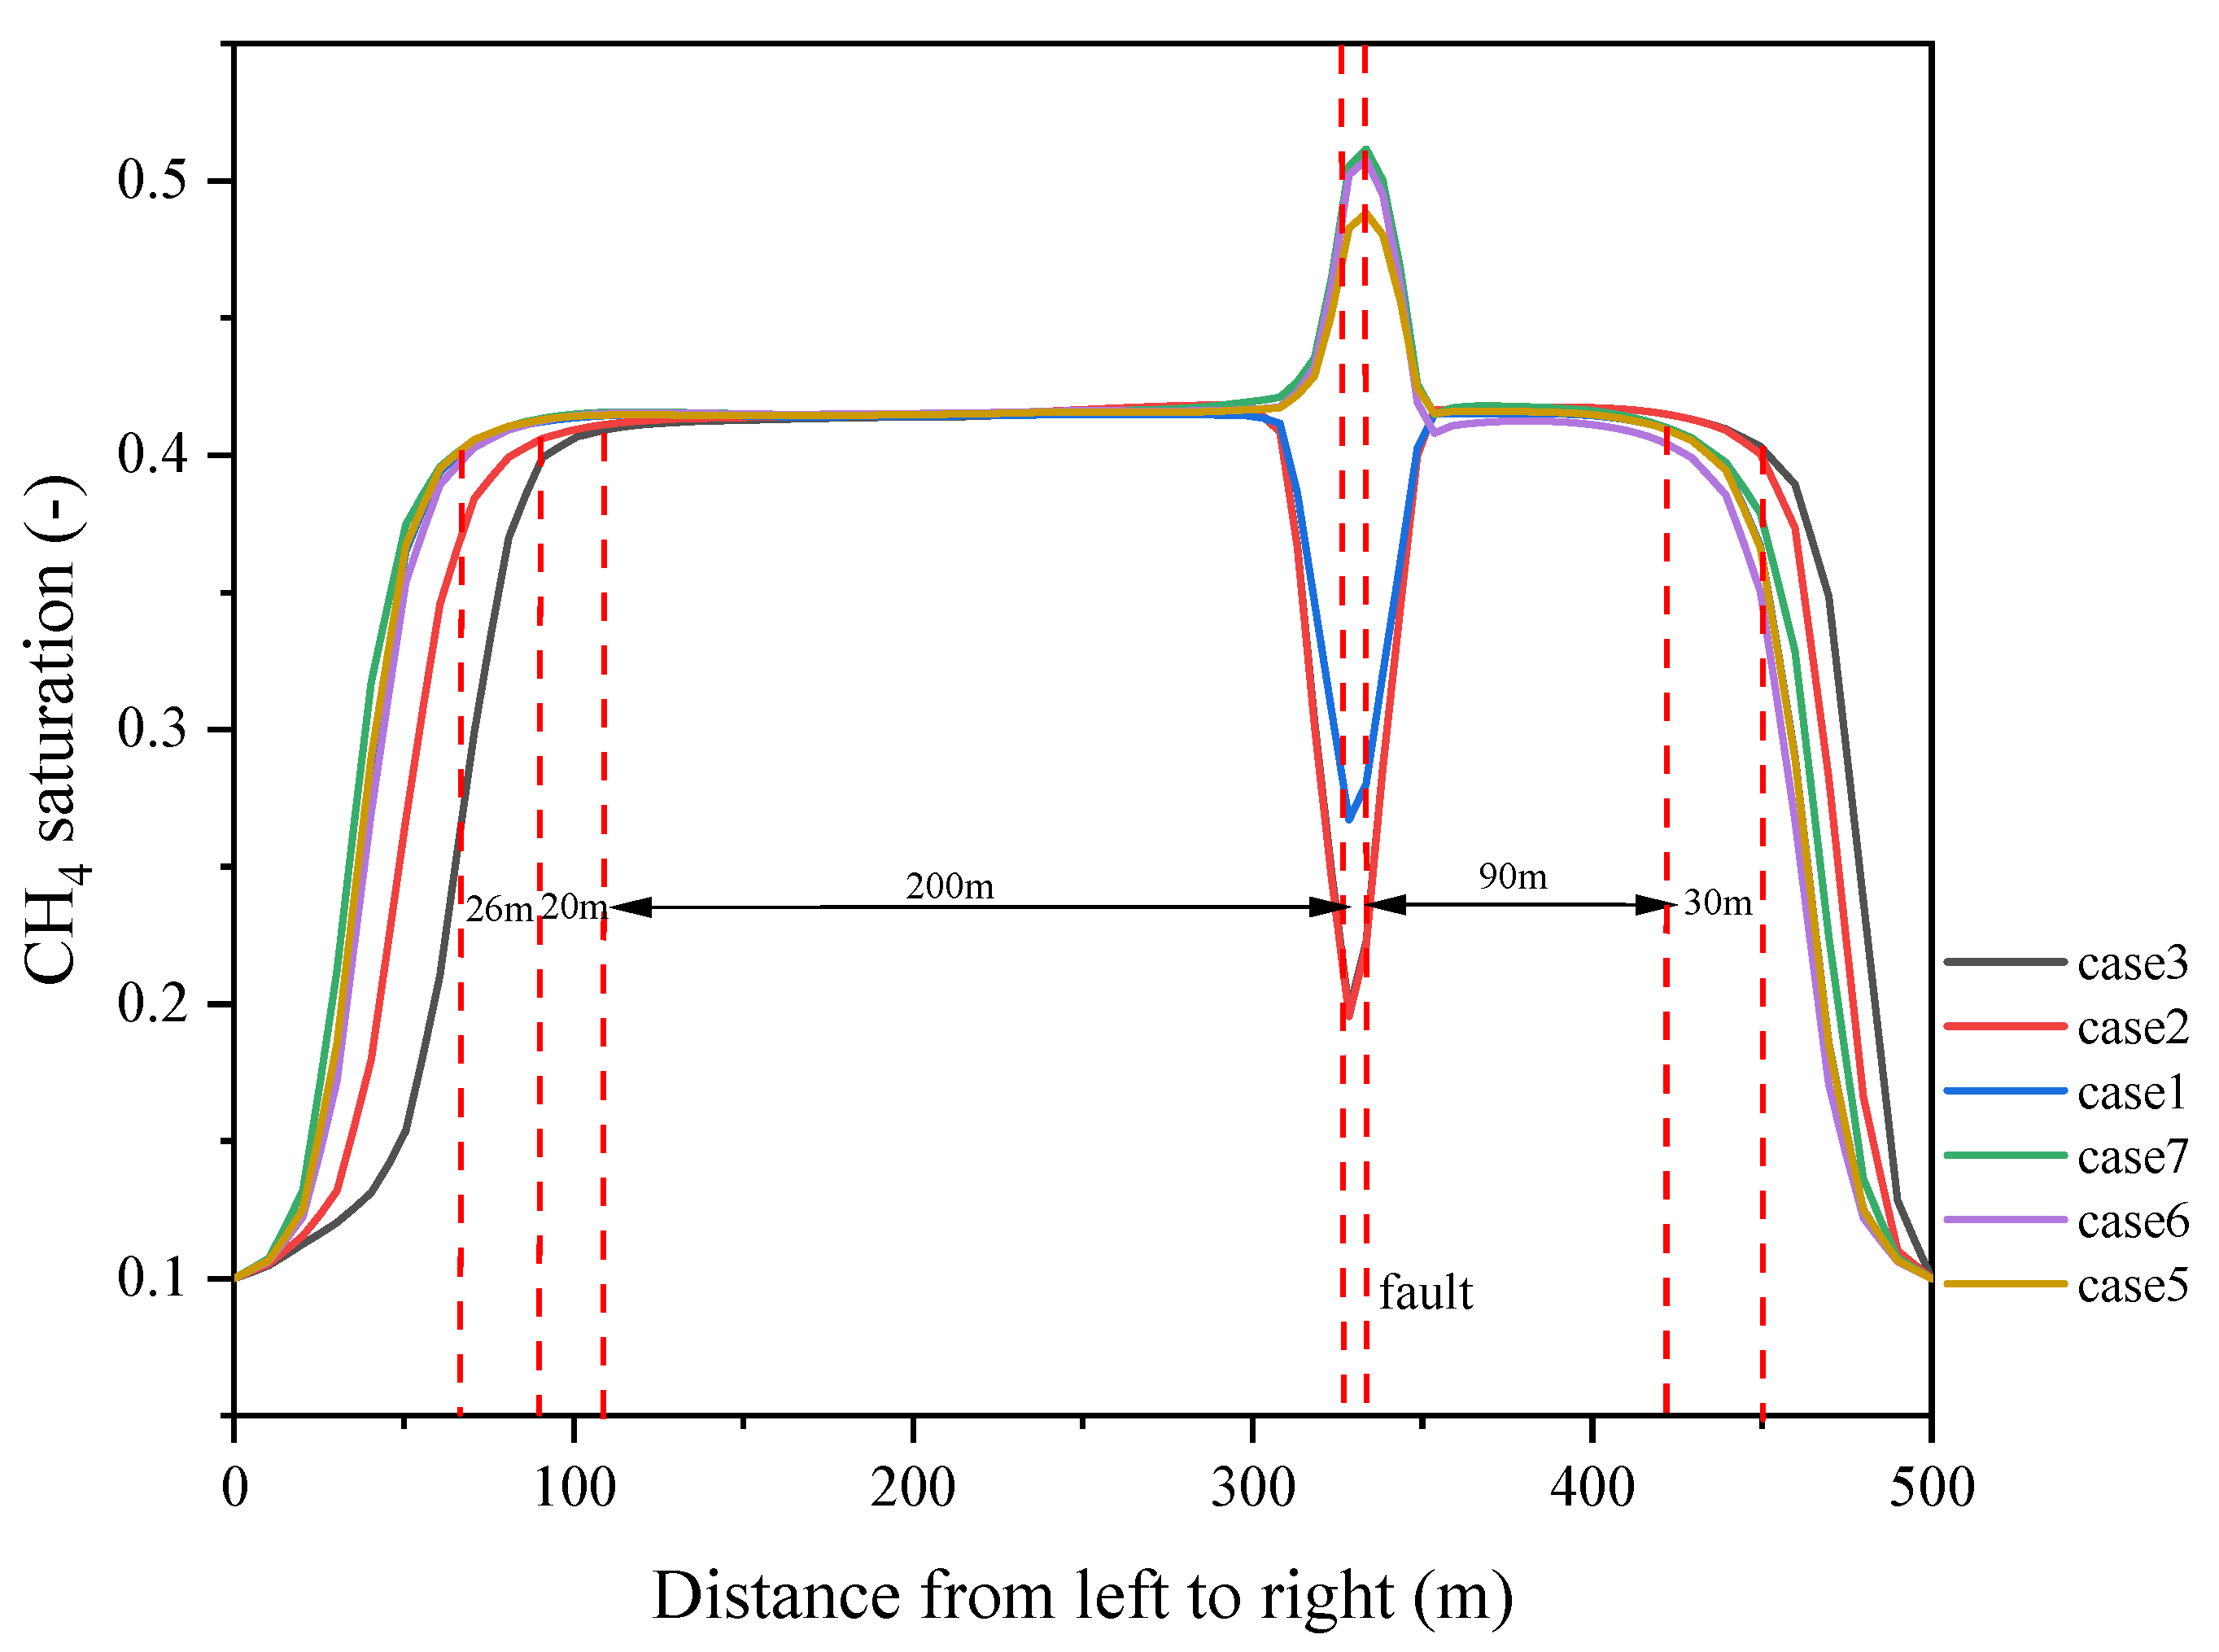
  • Fault permeability is the most important factor controlling natural gas migration along the fault zone, causing the high concentration of natural gas distributed along the fault strike direction in the high permeability fault zone. Limited natural gas entering into the caprocks through the fault partially penetrating into the upper caprocks, which does not obviously deteriorate the sealing performance of the caprocks.
  • Based on the gas saturation at the top of the fault zone in the caprocks (Y = 0 m, Z = −2320 m), when the dip angle of the fault with high permeability is in the range of 60° to 85°, the gas saturation varies from 0.4 to 0.55 at the end of injection of the first cycle. When the fault length is in the range of 10 m to 500 m and the dip angle of fault is 60°, the gas saturation varies from 0.45 to 0.5. The gas saturation does not change obviously when the normal fault with displacement is considered. This illustrates that fault permeability plays the most important role in controlling the gas breakthrough in caprocks affected by fault zones, followed by the fault dip angle, the fault length, etc.

Author Contributions

S.B.: Data curation, Numerical investigation, Writing—Original Draft. H.L.: Conceptualization, Methodology, Simulation schematic design, Writing—Reviewing and Editing. H.M.: Data Validation. X.S.: Data curation. X.Q.: Project administration. M.L.: Supervision. Z.M.: Basic geological data collection. Y.S.: Guidance of Petrasim simulator. X.W.: Data collection. All authors have read and agreed to the published version of the manuscript.

Funding

This research was funded by the CAS Pioneer Hundred Talents Program (Y826031C01) and the National Natural Science Foundation (U22A20166).

Data Availability Statement

Not applicable.

Conflicts of Interest

The authors declare that they have no known competing financial interests or personal relationships that could have appeared to influence the work reported in this paper.

References

  1. Zhou, P.; Lv, Y.; Wen, W. The Low-Carbon Transition of Energy Systems: A Bibliometric Review from an Engineering Management Perspective. Engineering 2023. [Google Scholar] [CrossRef]
  2. Wang, X.; Economides, M.J. Purposefully built underground natural gas storage. J. Nat. Gas Sci. Eng. 2012, 9, 130–137. [Google Scholar] [CrossRef]
  3. Demirel, N.C.; Demirel, T.; Deveci, M.; Vardar, G. Location selection for underground natural gas storage using Choquet integral. J. Nat. Gas Sci. Eng. 2017, 45, 368–379. [Google Scholar] [CrossRef]
  4. Mohanty, U.S.; Ali, M.; Azhar, M.R.; Al-Yaseri, A.; Keshavarz, A.; Iglauer, S. Current advances in syngas (CO + H2) production through bi-reforming of methane using various catalysts: A review. Int. J. Hydrogen Energy 2021, 46, 32809–32845. [Google Scholar] [CrossRef]
  5. Wei, X.; Shi, X.; Hu, W.; Ban, S.; Li, Y.; Ma, H.; Li, P.; Yang, C. Dynamic tightness evaluation of salt cavern energy storage. J. Energy Storage 2023, 57, 106313. [Google Scholar] [CrossRef]
  6. Zhang, G.; Li, B.; Zheng, D.; Ding, G.; Wei, H.; Qian, P.; Li, C. Challenges to and proposals for underground gas storage (UGS) business in China. Nat. Gas Ind. B 2017, 4, 231–237. [Google Scholar] [CrossRef]
  7. Zhang, N.; Shi, X.; Zhang, Y.; Shan, P. Tightness analysis of underground natural gas and oil storage caverns with limit pillar widths in bedded rock salt. IEEE Access 2020, 8, 12130–12145. [Google Scholar] [CrossRef]
  8. Wang, T.; Li, J.; Jing, G.; Zhang, Q.; Yang, C.; Daemen, J.J.K. Determination of the maximum allowable gas pressure for an underground gas storage salt cavern—A case study of Jintan, China. J. Rock Mech. Geotech. Eng. 2019, 11, 251–262. [Google Scholar] [CrossRef]
  9. Iglauer, S.; Akhondzadeh, H.; Abid, H.; Paluszny, A.; Keshavarz, A.; Ali, M.; Giwelli, A.; Esteban, L.; Sarout, J.; Lebedev, M. Hydrogen Flooding of a Coal Core: Effect on Coal Swelling. Geophys. Res. Lett. 2022, 49, e2021GL096873. [Google Scholar] [CrossRef]
  10. Li, J. Development status and prospect of underground gas storage in China. Oil Gas Storage Transp. 2022, 41, 780–786. (In Chinese) [Google Scholar]
  11. Zhang, J.; Tan, Y.; Zhang, T.; Yu, K.; Wang, X.; Zhao, Q. Natural gas market and underground gas storage development in China. J. Energy Storage 2020, 29, 101338. [Google Scholar] [CrossRef]
  12. Zheng, Y.; Sun, J.; Qiu, X.; Lai, X.; Liu, J.; Guo, Z.; Wei, H.; Min, Z. Connotation and evaluation technique of geological integrity of UGSs in oil-gas fields. Nat. Gas Ind. 2020, 40, 94–103. [Google Scholar] [CrossRef]
  13. Wei, G.; Zheng, Y.; Qiu, X.; Sun, J.; Shi, L.; Lai, X. Geological theory and application of underground gas storage in China. Acta Pet. Sin. 2019, 40, 1519. [Google Scholar]
  14. Fu, X.F.; Yan, L.Y.; Meng, L.D.; Liu, X.B. Deformation Mechanism and Vertical Sealing Capacity of Fault in the Mudstone Caprock. J. Earth Sci. 2019, 30, 367–375. [Google Scholar] [CrossRef]
  15. Evans, D.J. A review of underground fuel storage events and putting risk into perspective with other areas of the energy supply chain. In Underground Gas Storage: Worldwide Experiences and Future Development in the UK and Europe; Special Publications; Evans, D.J., Chadwick, R.A., Eds.; The Geological Society: London, UK, 2009; Volume 313, pp. 173–216. [Google Scholar]
  16. Ingram, G.M.; Urai, J.L. Top-Seal Leakage through Faults and Fractures: The Role of Mudrock Properties; Special Publications; Geological Society: London, UK, 1999; Volume 158, pp. 125–135. [Google Scholar]
  17. Liu, B.; Fu, X.F.; Li, Z. Impacts of CO2-brine-rock interaction on sealing efficiency of sand caprock: A case study of Shihezi formation in Ordos basin. Adv. Geo-Energy Res. 2018, 2, 380–392. [Google Scholar] [CrossRef]
  18. Zhao, J.; Xie, J.; Sun, G.; Song, Y.; Zhao, W. Operation risk and technical countermeasures of underground gas storage containing hydrogen sulfide in North China. Oil Gasfield Surf. Eng. 2020, 39, 56–63. (In Chinese) [Google Scholar]
  19. Muhammed, N.S.; Haq, M.B.; Al Shehri, D.A.; Al-Ahmed, A.; Rahman, M.M.; Zaman, E.; Iglauer, S. Hydrogen storage in depleted gas reservoirs: A comprehensive review. Fuel 2023, 337, 127032. [Google Scholar] [CrossRef]
  20. Fleury, M.; Pironon, J.; Le Nindre, Y.M.; Bildstein, O.; Berne, P.; Lagneau, V.; Vidal, O. Evaluating sealing efficiency of caprocks for CO2 storage: An overviewof the Geocarbone Integrity program and results. Energy Procedia 2011, 4, 5227–5234. [Google Scholar] [CrossRef] [Green Version]
  21. Zhang, S.; Yan, Y.; Sheng, Z.; Yan, X. Uncertainty failure risk quantitative assessments for underground gas storage near-wellbore area. J. Energy Storage 2021, 36, 102393. [Google Scholar] [CrossRef]
  22. Wang, Z.; Li, W.; Liu, J.; Guo, J.; Zhang, Y. A review on state-of-the-art of underground gas storage and causes of typical accidents. Hazard Control. Tunn. Undergr. Eng. 2019, 1, 49–58. [Google Scholar]
  23. Bruno, M.S.; Dewolf, G.; Foh, S. Geomechanical Analysis and Decision Analysis for Delta Pressure Operations in Gas Storage Reservoirs; Proc. AGA Operations Conf.: Denver, CO, USA, 2000; pp. 7–9. [Google Scholar]
  24. Tesei, T.; Collettini, C.; Viti, C.; Barchi, M.R. Fault architecture and deformation mechanisms in exhumed analogues of seismogenic carbonate-bearing thrusts. J. Struct. Geol. 2013, 55, 167–181. [Google Scholar] [CrossRef]
  25. Kirkham, C.; Cartwright, J.; Bertoni, C.; Van Rensbergen, P. The genesis of a giant mud canopy by catastrophic failure of a thick evaporite sealing layer. Geology 2020, 48, 787–791. [Google Scholar] [CrossRef]
  26. Bock, H.; Dehandschutter, B.; Martin, C.D.; Mazurek, M.; De Haller, A.; Skoczylas, F.; Davy, C. Self-Sealing of Fractures in Argillaceous Formations in the Context of Geological Disposal of Radioactive Waste; OECD: Paris, France; NEA: Philadelphia, PA, USA, 2010. [Google Scholar]
  27. Jolley, S.J.; Dijk, H.; Lamens, J.H.; Fisher, Q.J.; Manzocchi, T.; Eikmans, H.; Huang, Y. Faulting and fault sealing in production simulation models: Brent Province, northern North Sea. Pet. Geosci. 2007, 13, 321–340. [Google Scholar] [CrossRef] [Green Version]
  28. Liu, H.; Zhu, Z.; Patrick, W.; Liu, J.; Lei, H.; Zhang, L. Pore-scale numerical simulation of supercritical CO2 migration in porous and fractured media saturated with water. Adv. Geo-Energy Res. 2020, 4, 419–434. [Google Scholar] [CrossRef]
  29. Liu, H.; Hou, Z.; Were, P.; Gou, Y.; Sun, X. Numerical investigation of the formation displacement and caprock integrity in the Ordos Basin (China) during CO2 injection operation. J. Pet. Sci. Eng. 2016, 147, 168–180. [Google Scholar] [CrossRef]
  30. Liu, H.; Shi, Y.; Fang, Z.; Liu, J.; Zhang, L.; Tong, R. Seepage characteristics of thermally and chemically treated Mesozoic granite from geothermal region of Liaodong Peninsula. Environ. Earth Sci. 2021, 80, 599. [Google Scholar] [CrossRef]
  31. Shipton, Z.K.; Evans, J.P.; Kirschner, D.; Kolesar, P.T.; Williams, A.P.; Heath, J. Analysis of CO2 Leakage through ‘Low-Permeability’ Faults from Natural Reservoirs in the Colorado Plateau, East-Central Utah; Special Publications; Geological Society: London, UK, 2004; Volume 233, pp. 43–58. [Google Scholar]
  32. Pio Rinaldi, A.; Rutqvist, J.; Jeanne, P.; Cappa, F.; Guglielmi, Y. Induced seismicity and CO2 leakage through fault zones during large-scale underground injection in a multilayered sedimentary system. Gen. Assem. Conf. Abstr. 2014, 16, 3164. [Google Scholar]
  33. Kang, K.; Huh, C.; Kang, S.-G. A numerical study on the CO2 leakage through the fault during offshore carbon sequestration. J. Korean Soc. Mar. Environ. Energy 2015, 18, 94–101. [Google Scholar] [CrossRef]
  34. Yehya, A.; Yang, Z.; Rice, J.R. Effect of fault architecture and permeability evolution on response to fluid injection. J. Geophys. Res. Solid Earth 2018, 123, 9982–9997. [Google Scholar] [CrossRef] [Green Version]
  35. Sun, Z.; Yang, R.; Geng, F.; Wang, L.; Wang, L.; Guo, J. Analyzing the Formation and Evolution of Strike-Slip Faults and Their Controlling Effects on Hydrocarbon Migration and Charging: A Case Study of Tahe Area, Tarim Basin. Energies 2023, 16, 2370. [Google Scholar] [CrossRef]
  36. Aoyagi, R.; Kitamura, O.; Itaoka, K.; Igawa, S.; Suzuki, S. Study on role of simulation of possible leakage from geological CO2 storage in sub-seabed for environmental impact assessment. Energy Procedia 2011, 4, 3881–3888. [Google Scholar] [CrossRef] [Green Version]
  37. Ren, J.; Wang, Y.; Feng, D.; Gong, J.K. CO2 migration and distribution in multiscale-heterogeneous deep saline aquifers. Adv. Geo-Energy Res. 2021, 5, 333–346. [Google Scholar] [CrossRef]
  38. Lyu, X.; Yun, L.; Xu, J.; Liu, H.; Yu, X.; Peng, P.; Ouyang, M.; Luo, Y. Sealing capacity evolution of gypsum salt caprocks under multi-cycle alternating stress during operations of underground gas storage. J. Pet. Sci. Eng. 2023, 220, 111244. [Google Scholar] [CrossRef]
  39. Cappa, F.; Guglielmi, Y.; Barros, L.D. Transient evolution of permeability and friction in a slowly slipping fault activated by fluid pressurization. Nat. Commun. 2022, 13, 3039. [Google Scholar] [CrossRef]
  40. Yang, J. Numerical Simulation of Geologic Body Stress Field in Gas Storage Traps. Master’s Thesis, The Northeast Petroleum University, Daqing, China, 2022. (In Chinese). [Google Scholar]
  41. Liu, H.; Hou, Z.; Were, P.; Gou, Y.; Sun, X. Simulation of CO2 plume movement in multilayered saline formations through multilayer injection technology in the Ordos Basin, China. Environ. Earth Sci. 2014, 71, 4447–4462. [Google Scholar] [CrossRef]
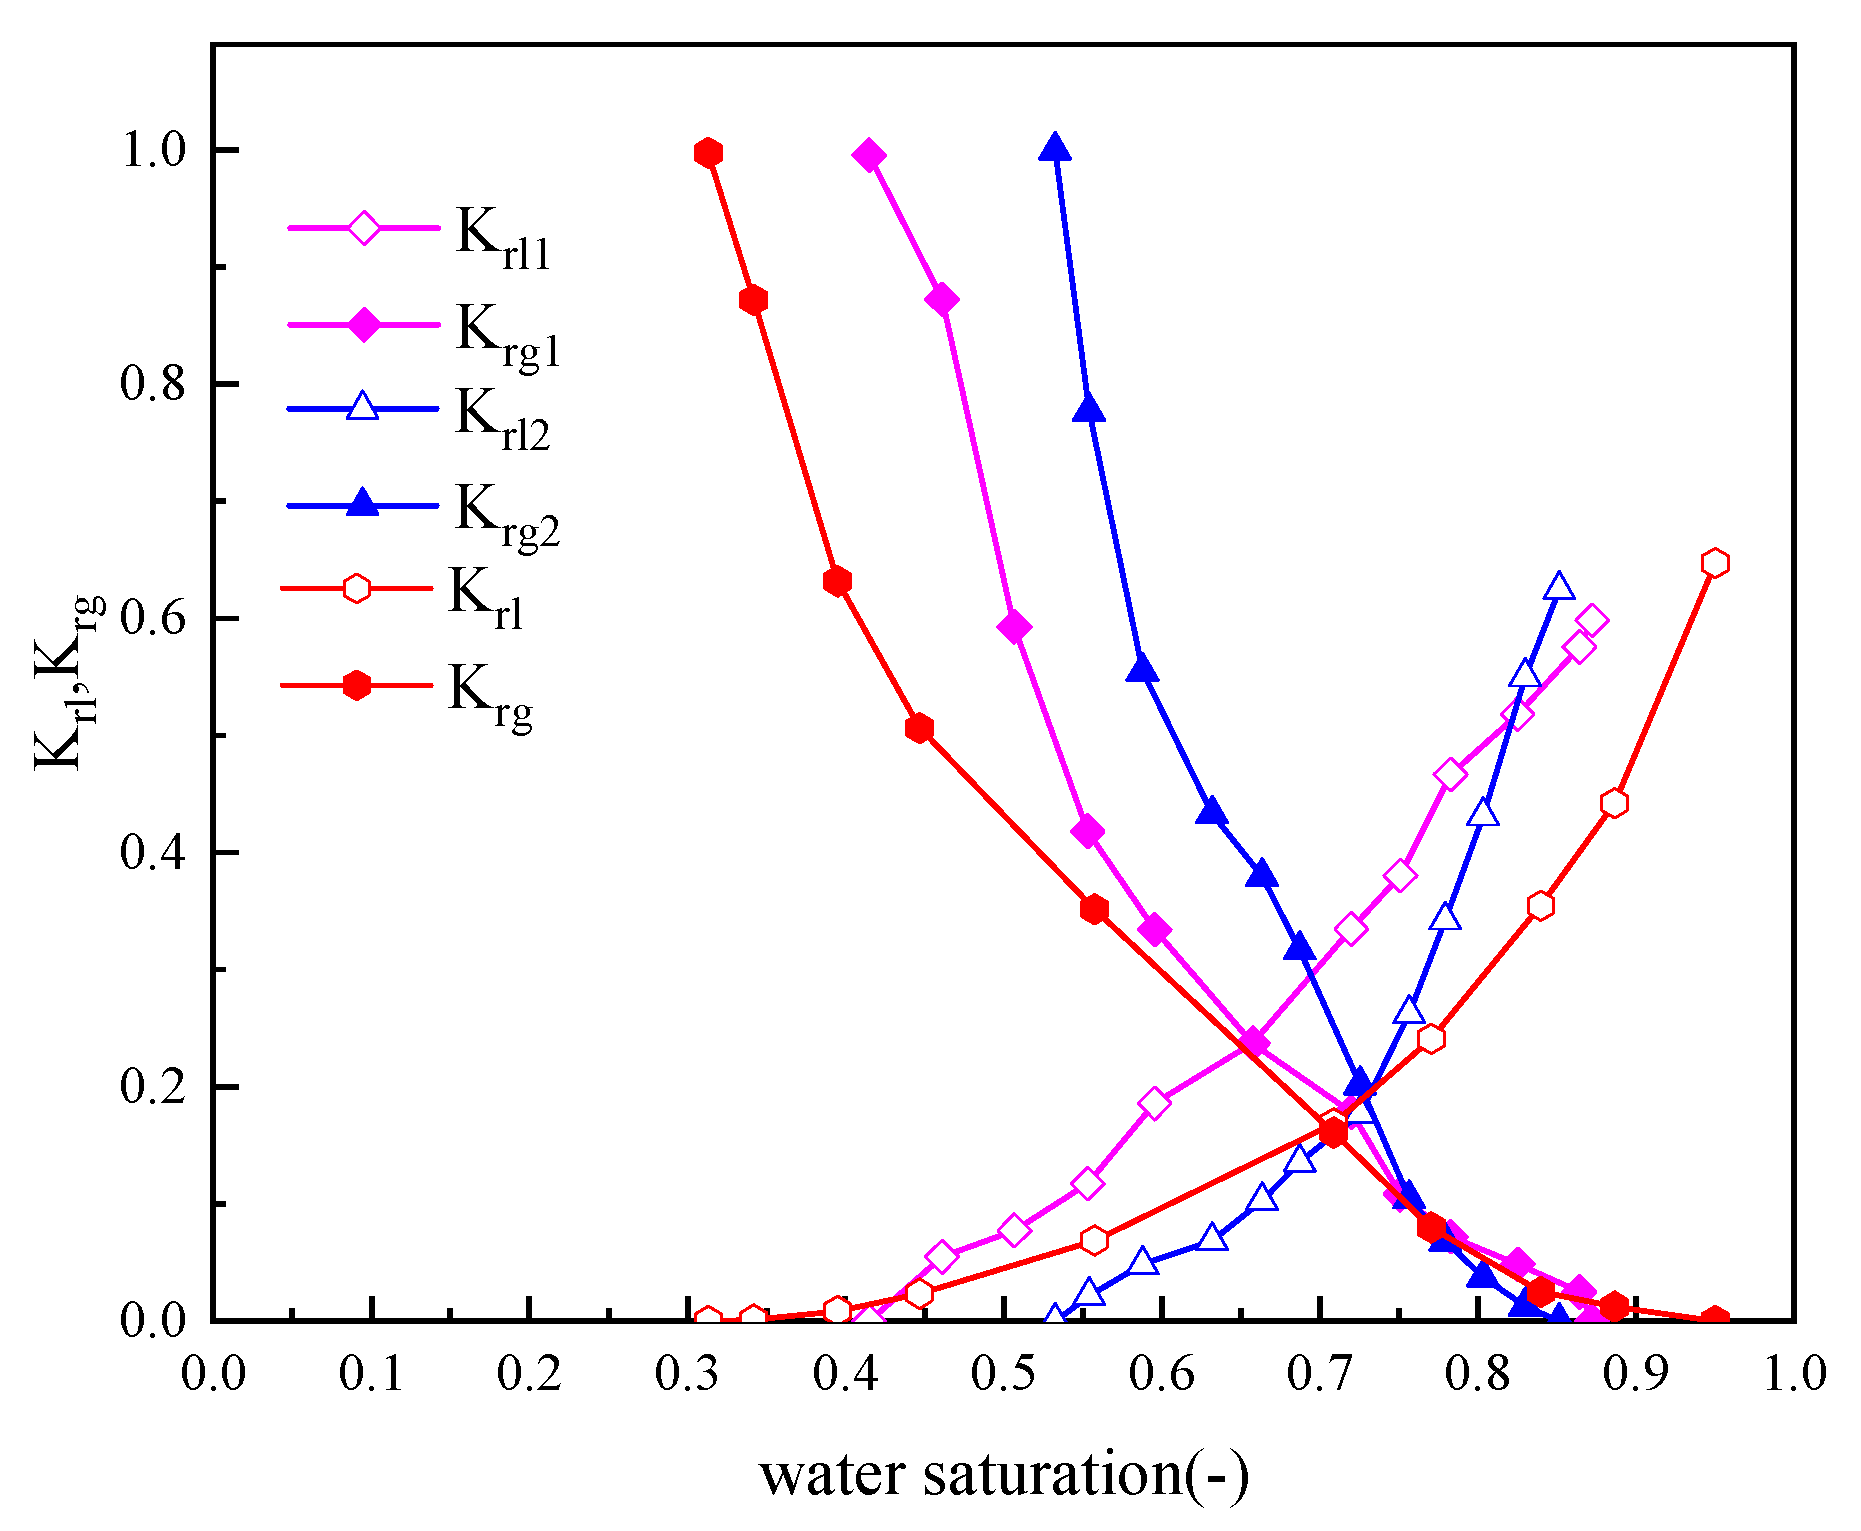
  42. Corey, A.T. The interrelation between gas and oil relative permeabilities. Prod. Mon. 1954, 38–41. [Google Scholar]
  43. Van Genuchten, M.T. A closed-form equation for predicting the hydraulic conductivity of unsaturated soils. Soil Sci. Soc. Am. J. 1980, 44, 892–898. [Google Scholar] [CrossRef] [Green Version]
  44. Bu, F. Study on the Influence of Small Faults in Reservoir on the Spatial Distribution and Storage of CO2. Master’s Thesis, Jilin University, Changchun, China, 2015. [Google Scholar]
  45. Li, Y.; Xiao, F.; Xu, W.; Wang, J. Performance evaluation on water-producing gas wells based on gas & water relative permeability curves: A case study of tight sandstone gas reservoirs in the Sulige gas field, Ordos Basin. Nat. Gas Ind. B 2016, 3, 52–58. (In Chinese) [Google Scholar]
  46. Shi, F. Influence of Minor Faults within the Reservoir on CO2 Spatial Distribution and Storage. Master’s Thesis, Jilin University, Changchun, China, 2015. (In Chinese). [Google Scholar]
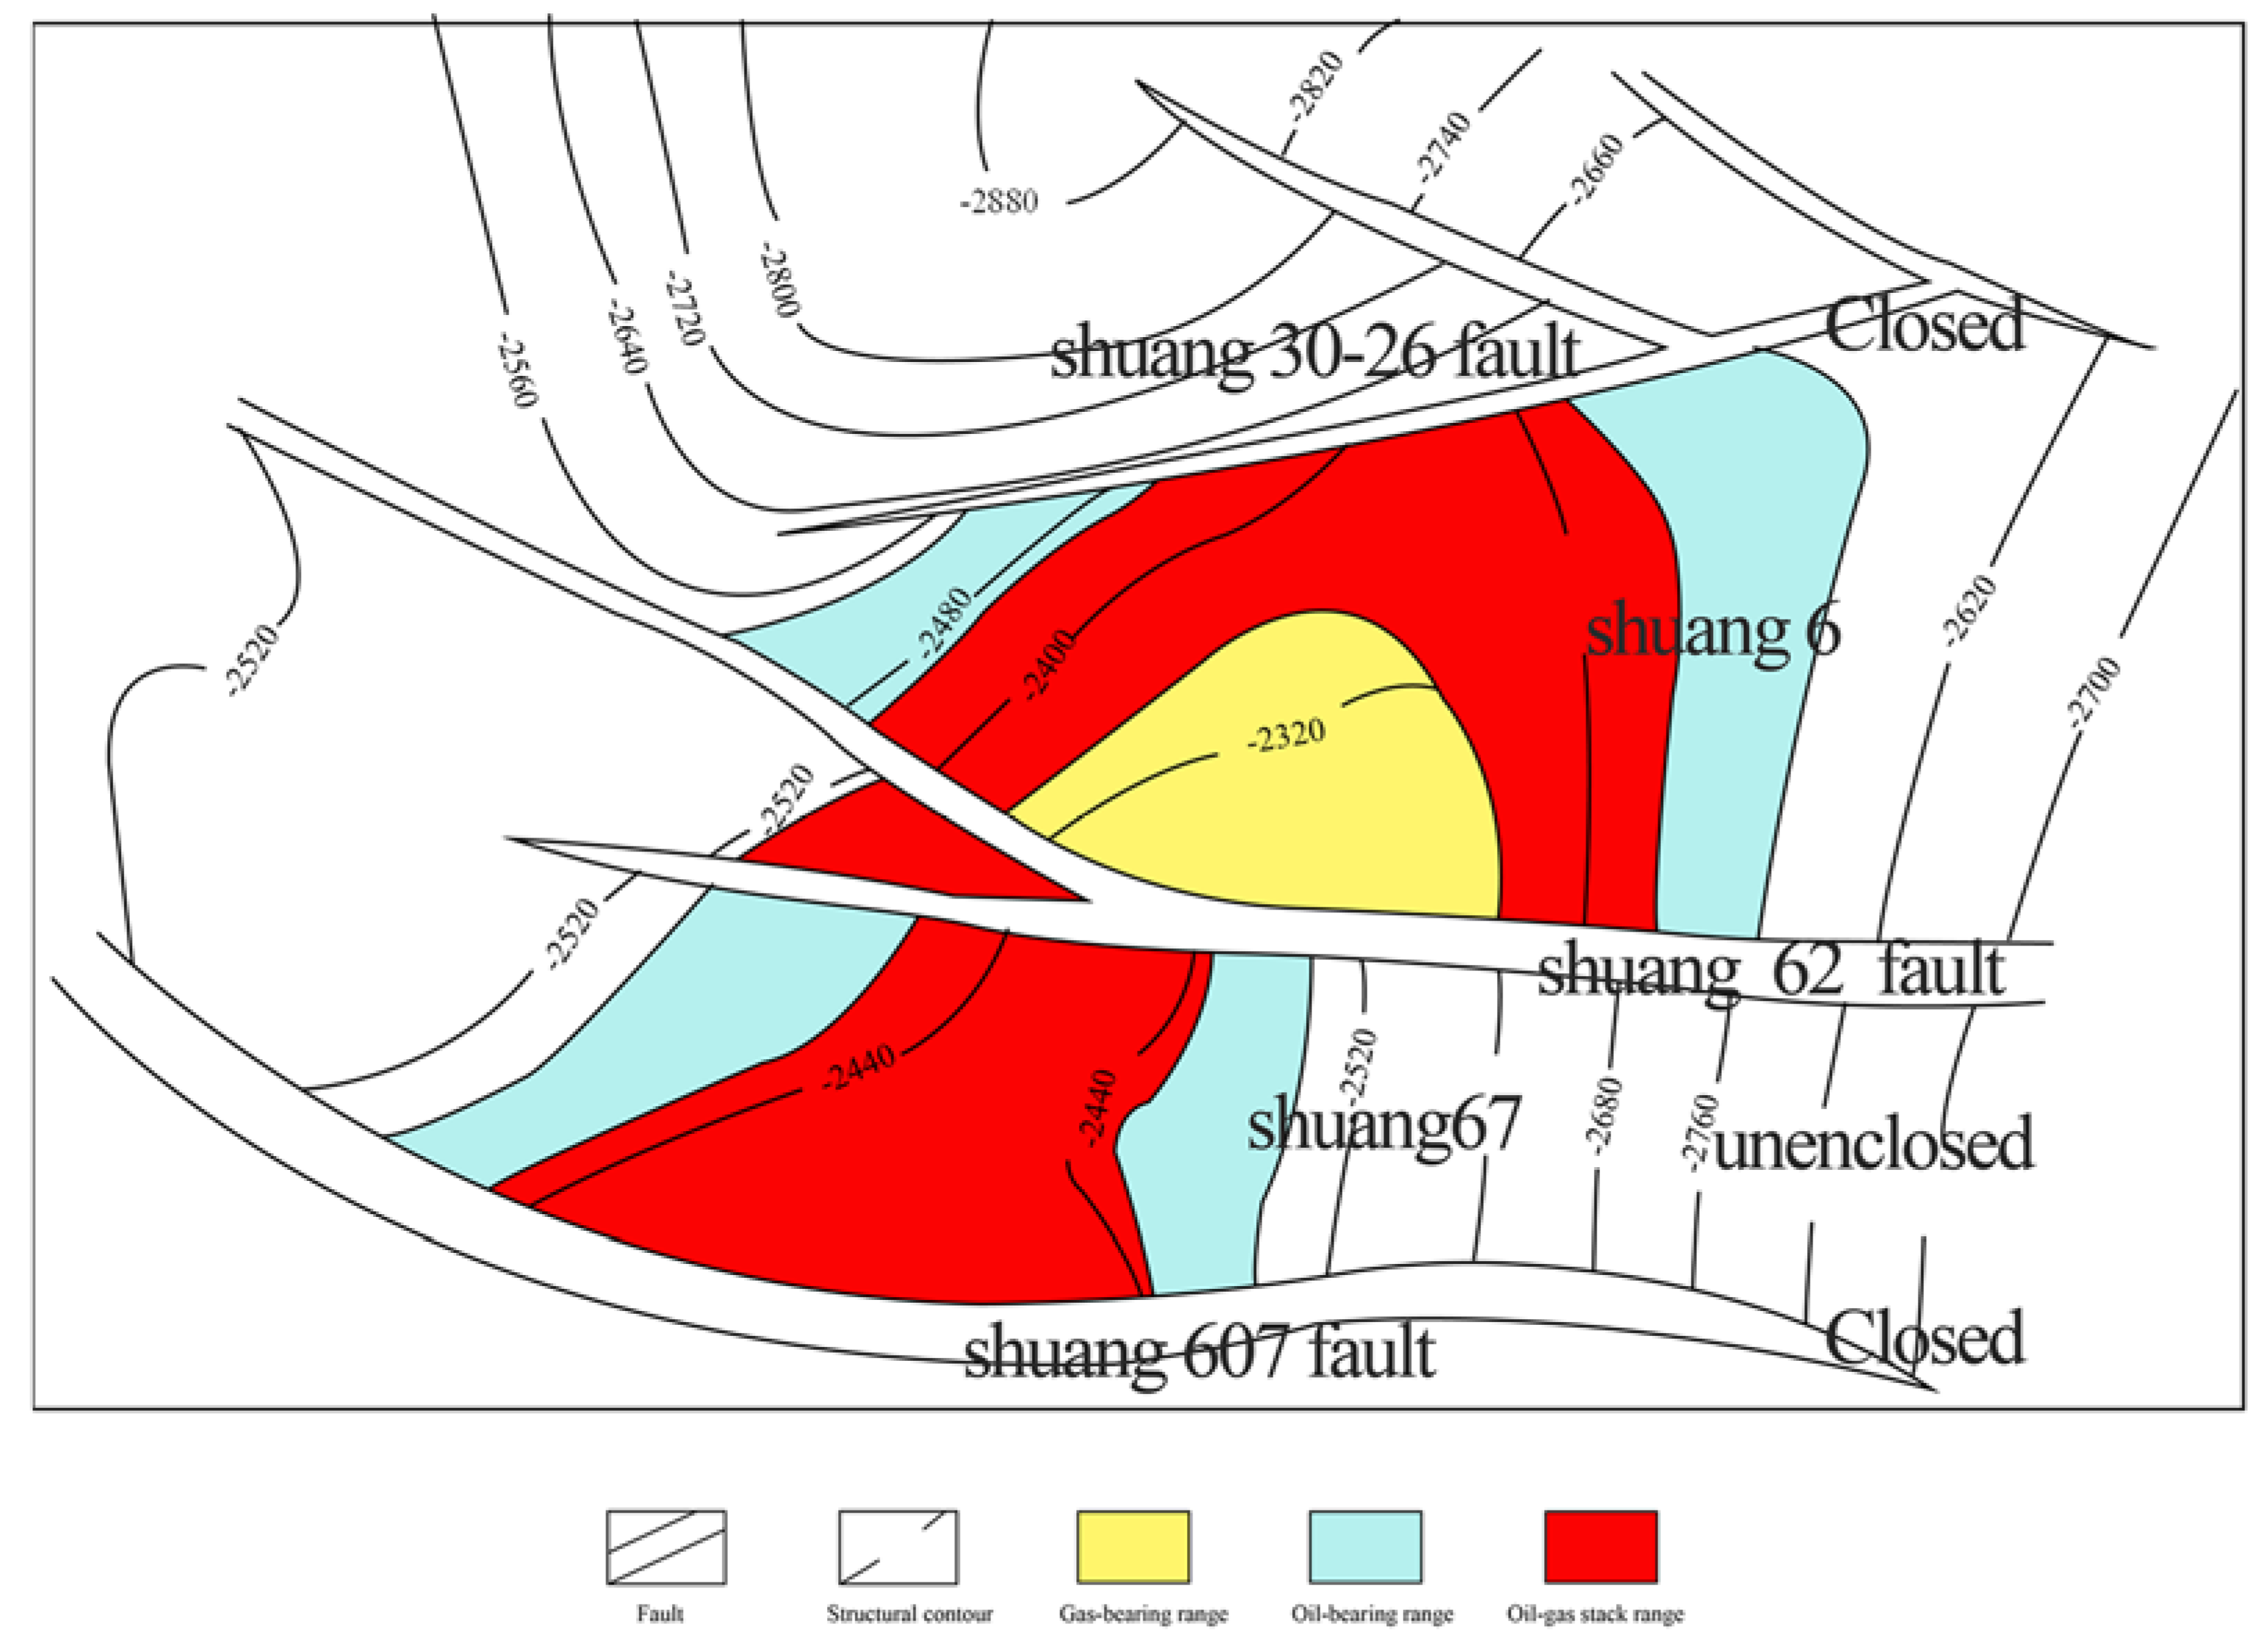
  47. Li, J.; Meng, L.; Fu, X.; Jin, Y.; Jiang, M.; Liu, C. Analysis of efficient operation conditions of the Shuang 6 gas storage in Shuangtaizi Oilfield, LiaoHe Basin, China. Arab. J. Geosci. 2022, 15, 1486. [Google Scholar] [CrossRef]
  48. Han, H. Study on Numerical Simulation of Shuang6 Block in Shuangtaizi Oilfield. China Pet. Chem. Stand. Qual. 2013, 33, 142–143. (In Chinese) [Google Scholar]
  49. Solomon, S. Criteria for Intermediate Storage of Carbon Dioxide in Geological Formations; The Bellona Foundation: Oslo, Norway, 2006; pp. 1–6. [Google Scholar]
  50. Watson, M.N.; Gibson-Poole, C.M. Reservoir Selection for Optimised Geological Injection and Storage of Carbon Dioxide: A Combined Geochemical and Stratigraphic Perspective; Conference Reservoir Selection for Optimised Geological Injection and Storage of Carbon Dioxide; National Energy Technology Laboratory, US Department of Energy: Alexandria, Egypt, 2005; pp. 2–5. [Google Scholar]
  51. Flett, M.; Gurton, R.; Taggart, I. Heterogeneous saline formations: Long-term benefits for geo-sequestration of greenhouse gases. In Greenhouse Gas Control Technologies 7; Elsevier Science Ltd.: Amsterdam, The Netherlands, 2005; pp. 501–509. [Google Scholar]
  52. Birkholzer, J.T.; Zhou, Q.; Tsang, C.F. Large-scale impact of CO2 storage in deep saline aquifers: A sensitivity study on pressure response in stratified systems. Int. J. Greenh. Gas Control 2009, 3, 181–194. [Google Scholar] [CrossRef] [Green Version]
  53. Yang, W.; Xu, Y.; Zhang, K. Investigation of CO2 storage capacity in open saline aquifers with numerical models. Procedia Eng. 2012, 31, 886–892. [Google Scholar]
  54. Lu, C.; Sun, Y.; Buscheck, T.A.; Hao, Y.; White, J.A.; Chiaramonte, L. Uncertainty quantification of CO2 leakage through a fault with multiphase and nonisothermal effects. Greenh. Gases Sci. Technol. 2012, 2, 445–459. [Google Scholar] [CrossRef]
  55. Hu, Y.J.; Wang, Y.; Ren, J. Analysis of factors affecting the leakage of CO2 along the fault zone in deep saline aquifers. China Sci. 2016, 13, 1437–1444. (In Chinese) [Google Scholar]
Figure 1. Schematic diagram of sealing failure of fault in underground gas storage (modified after [40]).
Energies 16 04936 g001
Figure 2. Relative permeability curve of the gas–water phase (data source [45]. Krl1 and Krg1 are the relative permeability curves of high-permeability sandstone, Krl2, and Krg2 are the relative permeability curves of low-permeability sandstone (K < 0.5 mD), and Krl and Krg are the relative permeability curves based on the VG model.
Energies 16 04936 g002
Figure 3. Simplified structural map of the Shuang6 underground gas storage region [48].
Energies 16 04936 g003
Figure 4. Geometrical model based on the stratigraphic characteristics of the Shuang6 UGS: (a) basic model without faults; (b) basic model without considering the fault displacement (dip angle is 60°); (c) basic model considering the fault displacement and the fault dip angle of 60°.
Energies 16 04936 g004
Figure 5. Spatial migration of CH4 saturation with injection–production time, considering the open lateral boundary condition (base case): (a) 0.01 year; (b) 0.1 year; (c) 0.58 year- injection for 7 months; (d) 1.0 year-after 4 months of gas production in the first cycle.
Energies 16 04936 g005
Figure 6. The variation of gas saturation distribution in the vertical profile passing through the injection point with time (base case).
Energies 16 04936 g006
Figure 7. Variation in the pore-pressure distribution of the reservoir and caprock with time considering the open lateral boundary condition (base case): (a) 0.01 year -injection for 3.7 days; (b) 0.58 year injection for 7 months; (c) 1.0 year after one cycle of injection–production; (d) 5 years after five cycles of injection–production.
Energies 16 04936 g007
Figure 8. Comparison of pore-pressure distribution in the vertical profile cutting through the injection point, considering two different lateral boundary conditions during the first cycle of gas injection and production (0.58 year, 4.58 year represent the end of injection in one cycle and 5 cycles, 1.0 year and 5 years represent the end of production in one cycle and 5 cycles).
Energies 16 04936 g008
Figure 9. Influence of closed faults on the distribution of CH4 gas saturation during gas injection and production (case 3): (a) 0.58 year -injection for 7 months; (b) 1.0 year -after 4 months of gas production; (c) 5 years -after five cycles of injection-production; (d) 10 years -after ten cycles of injection-production.
Energies 16 04936 g009
Figure 10. Influence of semi-open fault on the distribution of CH4 gas saturation during gas injection and production (case 4): (a) 0.01 year -injection for 3.7 days; (b) 0.1 year -injection for 37 days; (c) 0.58 year -injection for 7 months; (d) 1 year -after 4 months of gas production.
Energies 16 04936 g010
Figure 11. Influence of a high-permeability fault on the distribution of CH4 saturation during gas injection and production (case 7): (a) 0.58 year—injection for 7 months; (b) 1.0 year—after 4 months of gas production; (c) 5 years—after five cycles of injection-production; (d) 10 years—after ten cycles of injection–production.
Energies 16 04936 g011
Figure 12. Variation diagram of gas saturation (a,c) and pore pressure (b,d) at the bottom of the caprock at the depth of 2315 m with time: 0.58 year—after one gas injection; 1.0 year—after one injection–production cycle; 4.58 years—after five gas injections; 5 years—after five injection-production cycles; 9.58 years—after ten cycles of gas injections; 10 years—after ten cycles of injection–production).
Energies 16 04936 g012
Figure 13. Gas saturation distribution at the top of reservoirs at the depth of 2325 m with different fault scales (0.58 years- at the end of injection in the first cycle).
Energies 16 04936 g013
Figure 14. Comparison of the influence of different scale faults with high permeability on the CH4 saturation distribution at the end of the first injection and production. (ad) after 0.58 year of CH4 injection in case 7, case 6, case 5 and base case, respectively; (eh) at the end of CH4 production in the first cycle for case 7, case 6, case 5 and base case, respectively.
Energies 16 04936 g014
Figure 15. Comparison of the influence of high-permeability faults with different dip angles on the CH4 saturation distribution during injection and production process (ad) after 0.58 year of CH4 injection in case 11, case 10, case 5 and base case, respectively; (eh) at the end of CH4 production in the first cycle for case 11, case 10, case 5 and base case, respectively.
Energies 16 04936 g015
Figure 16. Gas saturation after 0.58 year of injection along the fault profile AB in Figure 17 considering different dip angles of the closed fault (Cases 1, 8, and 9).
Energies 16 04936 g016
Figure 17. Influence of the high-permeability normal fault with displacement on the spatial distribution of CH4 (case 12) (a) 0.01 year—after injection for 3.7 days; (b) 0.1 year—after injection for 37 days; (c) 0.58 year—after injection for 7 months; (d) 1 year—at the end of production in the first cycle.
Energies 16 04936 g017
Figure 18. Gas saturation distribution along the fault profile AB in Figure 17 in two cases (i.e., case 12 and case 13).
Energies 16 04936 g018
Figure 19. Influence of the high-permeability normal fault zone on the spatial distribution of CH4 saturation during one cycle of gas injection and production process (case 13): (a) 0.01 year -after injection for 4 days; (b) 0.1 year -after injection for 37 days; (c) 0.58 year -after injection for 7 months; (d) 1 year -at the end of production in the first cycle.
Energies 16 04936 g019
Table 1. The main parameters of formations in simplified geological model (data source [46]).
Small Layer
Name
Formation Thickness (m)Buried Bottom Depth (m)Density
(kg/m3)
Porosity (-)Permeability
(mD)
Caprock300232024000.10.001
I-133.42353.420500.264.5
I-222.12375.520000.25124.5
II1-127.92403.420500.274.8
II1-2142417.420500.250.9
II2-3162433.420000.25166
II2-4222455.420000.25191.7
II3-523.6247920000.25200.7
II3-633251220000.25233.8
III1-120.52532.520000.25185.8
III1-216.82549.320000.25179
III2-3222571.320000.25150.8
III2-422.62593.920000.25172.5
III3-522.1261620000.25171.8
III3-623.22639.220000.25153.8
III4-7352674.220000.25113.9
III4-836.72710.920000.25101.4
III5-938.92749.820500.271.7
III5-1041.42791.220500.248
Table 2. Geometric parameters of different cases.
ScenarioPorosity (-)Permeability (mD)Fault Geometry (Dip Angle, Strike Length, Width)Boundary Type
Basecase-No faultOpen
Case10.050.00160°, 10 m, 10 mOpen
Case20.050.00160°, 250 m, 10 mOpen
Case30.050.00160°, 500 m, 10 mOpen
Case40.21060°, 500 m, 10 mOpen
Case50.5100060°, 10 m, 10 mOpen
Case60.5100060°, 250 m, 10 mOpen
Case70.5100060°, 500 m, 10 mOpen
Case80.050.00170°, 10 m, 10 mOpen
Case90.050.00185°, 10 m, 10 mOpen
Case100.5100070°, 10 m, 10 mOpen
Case110.5100085°, 10 m, 10 mOpen
Case120.5100060°, 500 m, 10 m (normal fault)Open
Case130.050.00160°, 500 m, 10 m (normal fault)Open
Case14----No faultClosed
Disclaimer/Publisher’s Note: The statements, opinions and data contained in all publications are solely those of the individual author(s) and contributor(s) and not of MDPI and/or the editor(s). MDPI and/or the editor(s) disclaim responsibility for any injury to people or property resulting from any ideas, methods, instructions or products referred to in the content.

