

Transport Phenomena in a Banded Solid Oxide Fuel Cell Stack—Part 2: Numerical Analysis

Department of Fundamental Research in Energy Engineering, AGH University of Krakow, 30-059 Krakow, Poland
*
Author to whom correspondence should be addressed.
Energies 2023, 16(11), 4512; https://doi.org/10.3390/en16114512
Submission received: 30 April 2023
/
Revised: 27 May 2023
/
Accepted: 30 May 2023
/
Published: 3 June 2023
(This article belongs to the Special Issue Current Advances in Fuel Cell Technology)
Abstract
:Solid oxide fuel cells are recognized as a promising energy conversion technology. Crucial to the field is the opportunity to reduce the costs of prototyping methodology. Due to the difficulty of conducting direct measurements inside the electrodes and fuel cell’s channels, numerical modeling remains the primary tool for improving the understanding and analyzing a fuel cell operation. Here, a computational fluid dynamic simulation of a banded solid oxide fuel cell’s stack, applied to enhance the geometrical design, is shown. A mathematical model, which includes momentum, heat, mass, and charge transport phenomena, was developed and used for the numerical simulation. The model was validated against the experimental study and confirmed its accuracy. The gas flow rate influence on the performance was investigated in details. Various arrangements of fuel and air channels were simulated and analyzed, including extending the system into a short stack. The proposed design modifications led to an increase in the volumetric power density of the stack compared to the existing prototype design. The proposed mathematical and numerical models were shown to be useful for testing further design modifications to the stack, including performance analysis, by changing the operating parameters of the system or applying new materials.
1. Introduction
The use of hydrogen in energy systems is one of the promising and ecologically friendly ways to develop the energy and transport industry. In order to efficiently convert the chemical energy of hydrogen directly into electrical energy, fuel cells are often utilized. Solid oxide fuel cells (SOFCs) are one of the most efficient fuel cells, with a low manufacturing price compared to other types of fuel cells and a wide range of systems power scale, recognized as the most advanced power generation systems, characterized by the highest thermal efficiency [1]. The prototyping of SOFCs is a highly complex process that involves high costs and time consumption. To reduce these factors, numerical modeling is often used.
Numerical modeling of solid oxide fuel cells is being recognized as a highly complex but helpful tool in order to better understand the operation and phenomena occurring inside the stack. Many different tools are used for the numerical modeling of SOFCs, while the commercial computational fluid dynamics (CFD) package, ANSYS, Inc., Fluent, is one of the most popular and widely used [2]. Two- and three-dimensional numerical modeling of SOFCs is often applied to simulate single-cell operation. For example, Pianko-Oprych et al. used ANSYS, Inc., Fluent to simulate and analyze the performance of the proposed design of a single planar SOFC fueled with hydrogen [3] and syngas [4]. Moździerz et al. used an in-house multiscale model to investigate the static behavior of a single SOFC [5]. A dynamic simulation was conducted by Chalusiak et al. using MATHWORKS, Inc., MATLAB code to analyze fuel depletion phenomena in the cell [6]. CFD simulations of the entire stack were also conducted. The three-dimensional (3D) SOFC stack simulation was successfully performed by Wei et al. [7], using numerical modeling to study a novel stack arrangement and verify the new shape of the flow channel. The model allows observing the stack’s thermal stresses and conducting transport phenomena verification. A comparison with the results found in the literature was presented to verify the results of the study. Another interesting approach to numerical modeling of the SOFC stack was demonstrated by Dong et al. [8]. A stack consisting of five anode-supported cells was modeled to inspect the flow uniformity and transport processes inside the stack. The research was also focused on temperature distribution and electron transport. The results were compared with the experimental study to demonstrate the accuracy of the numerical model. The influence of system size and stack design was examined by Pirasaci [9]. The research included verification of the model by comparing it with the results found in the literature. The ANSYS Fluent code was used to simulate the behavior of different design options and to study the influence of implemented modifications on the stack’s performance. Babaie Rizvandi et al. developed a multiscale model of SOFC stack degradation to predict the long-term behavior of the stack [10]. Numerical analysis was utilized as a help in the design of the stack with novel interconnector solution by Fu et al. [11]. Zheng et al. proposed a coupled CFD and mechanical mathematical model to analyze thermal stresses occurring in a planar SOFC stack [12]. Multiscale modeling was used by Miao et al. to analyze debinding of a monolithic SOFC stack [13]. Numerical methods were also utilized to investigate segmented-in-series (SIS) SOFC stacks. Recently, Fan et al. studied behavior of a tubular SIS stack of 20 cells using two-dimensional simulations prepared using the COMSOL, Inc., COMSOL package [14].
Solid oxide fuel cells could also be operated using alternative fuels such as hydrocarbons, ammonia, and carbon monoxide. Due to the high-temperature operation, the resistance to impurities in the fuel is elevated [15]. To better understand processes during operation with alternative fuels, numerical simulation is also widely used [4,6].
This paper discusses the impact of channel geometry on the transport phenomena within the proposed design, the so-called banded solid oxide fuel cell stack. The CFD-based numerical model developed considers momentum, heat, mass, electron, and ion transport phenomena. In Part 1 of this article, the mathematical and numerical models were validated by comparing the calculation results with the data from the experimental investigation. This study focuses on possible improvements in geometry and stack arrangement.
2. Geometry Description
The SOFC stack studied is a patented design [16]; its prototype was successfully built and tested, and it is described in detail in Part 1 of this paper. For further development of the stack, a numerical modeling methodology is used. To prepare a 3D numerical model, a computational domain must be created. Using Autodesk, Inc., Autodesk Inventor Professional, v.2020 software, a stack computer-aided design (CAD) model was created. The stack model, shown in Figure 1, is composed of six pairs of 12 mm × 12 mm × 0.1 mm electrodes, banded on a single 105 mm × 30 mm × 0.3 mm electrolyte support. The electrolyte support provides high strength and durability of the stack while maintaining a low production cost [17]. In this paper, the electrolyte of 0.1 mm of thickness is also investigated. The electrodes are divided into two parts, contributing catalyst and diffusion layers, as needed for numerical simulation. Current collectors are modeled as nonporous solid bodies with side contact with electrodes to simplify the geometry. Between the electrolyte and the current collectors, electric insulators were applied. Figure 1 presents the stack assembly and, to better visualize the model, an exploded view with descriptions was provided.
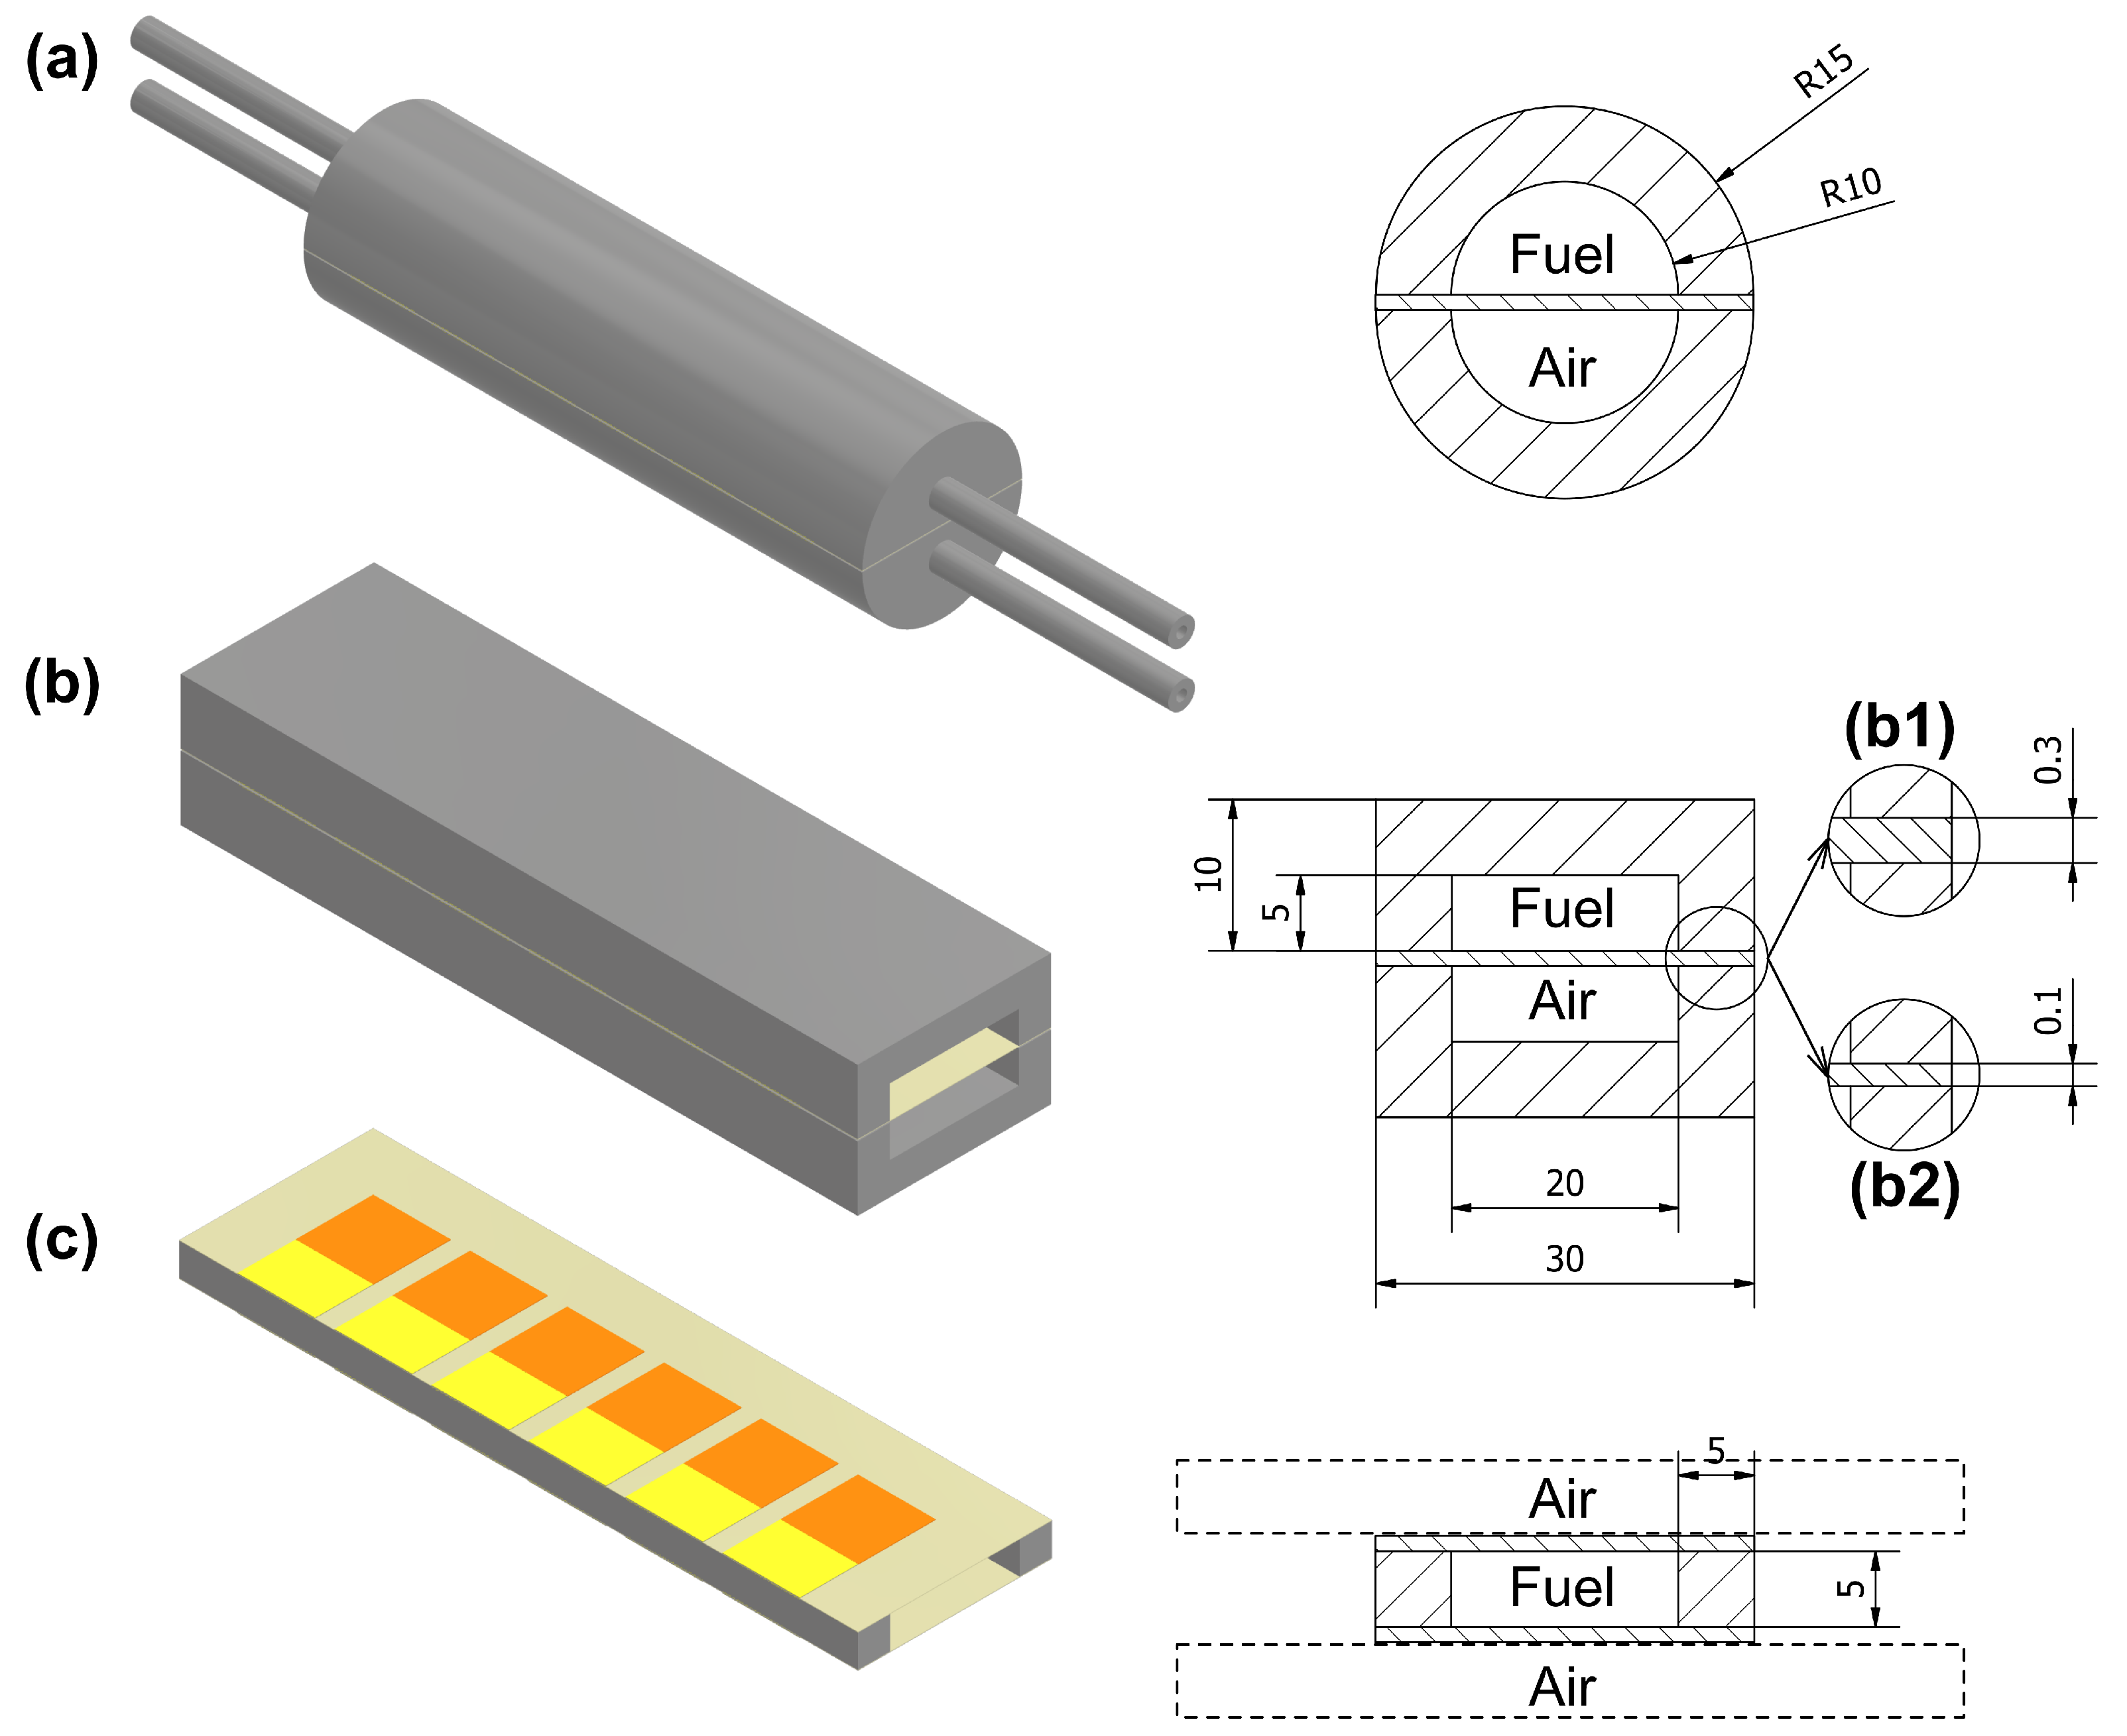
The initial prototype design of the stack includes two ceramic covers that contribute to the gas supply elements. Different shapes of cover and stack arrangements were proposed, as shown in Figure 2, together with their schematic cross-sections. The cross-sections demonstrate the arrangement of the stacks and covers that determine the gases’ paths. The design cases are as follows:
- (a)
- The electrolyte-supported design with 0.3 mm of electrolyte thickness. The stack is enclosed by two half-tubular covers, which make the fuel and air channels (initial prototype).
- (b)
- Electrolyte-supported stack is enclosed by rectangular covers. This solution reduces the stack volume and simultaneously increases the volumetric power density; this proposal has two subdesigns:
- (b1)
- supported on 0.3 mm electrolyte;
- (b2)
- supported on 0.1 mm electrolyte.
- (c)
- Extension of the system to multiple stacks. By combining two stacks, in which anodes are targeted face-to-face, a fuel channel is created, while cathodes facing the outer sides could be supplied with air without a separate channel, using, for example, a fan or placing the stack in a moving vehicle. This case consists of two stacks supported on a 0.1 mm electrolyte. This design allows reduction of the volume of the stack even more and, theoretically, double the power (because of the doubled number of cells).
Figure 2.
Stack configuration options with schematic cross-sections. Stack supported on 0.3 mm of electrolyte thickness closed in half-tubular covers, marked as (a). Stack with rectangular covers marked as (b), prepared in two versions: 0.3 mm of electrolyte thickness, marked as (b1), and 0.1 mm of electrolyte thickness, marked as (b2). Multistack composition with 0.1 mm of electrolyte thickness, marked as (c).
3. Mathematical Model
The mathematical model describes transport phenomena inside the stack with a set of partial differential equations. To simplify the model and focus on the demanded areas of physics, a few assumptions were contributed: steady-state operation and the incompressible and Newtonian description of fluids. Since Reynolds number does not exceed 200 in all performed simulations, fluid flow is considered as laminar. The energy dissipation and gravitation are ignored.
A steady-state mass conservation equation is used to describe the mass transport in fluid and porous areas, written as follows:
where () represents the source term of mass, as a result of reactants consumed and produced in electrodes through the electrochemical reactions in SOFC. In other than porous anodes and cathodes areas, and (-), which is the porosity rate. In the fluid areas, an equation that describes the conservation of momentum is solved as follows:
where () is the source term that describes the viscous and inertial pressure drop.
In porous and fluid areas, the species conservation equation describes the components of the gas mixture, given as follows:
where () represents the source and sink terms of species rates, written as follows:
The electrons and ions transport potential equations are given as:
where j (), the volumetric transfer current density, for the electrons transport on the anode side and on the cathode side , and for the ions transport and . The volumetric transfer current density j is described by the Butler–Volmer equation, written for the anode and the cathode side as follows:
The local surface overpotential () for the anode and cathode side is given in the following form:
where () represents the open-circuit voltage (OCV).
The heat transport in solid zones is described as the steady-state energy equation, written in the following form:
where () is the total heat source. The heat source in the catalyst layers of electrodes and the electrolyte is calculated as follows:
In fluid zones, the steady-state energy equation is given in the following form:
The boundary conditions for transport equations are listed in Table 1.
In this paper, the mathematical model is described in a shortened form to focus on the most important equations. The full description is provided in Part 1 of this work, where, in addition, all of the computational parameters used are presented in detail.
4. Numerical Analysis
After the mathematical model was formulated, a series of 3D numerical simulations were performed using the finite-volume method. For the finite-volume method, a computational mesh is required. To build the mesh of each of the designs described in Section 2, the 3D models were modified to include elements that represent the paths of the gases. To reduce the number of mesh elements, the ceramic covers were virtually removed and replaced with the proper thermal boundary conditions, representing the behavior of the furnace that maintains a constant temperature (Dirichlet boundary conditions). Each mesh was created as a compromise between quality and the number of elements, which determines the resolution, accuracy, and computational time. The difference in scale between the electrodes/electrolyte and gas channels is significant. A smooth transition of element size was utilized to properly model the fluxes between both domains. Each of the meshes was built using hexahedral elements. The size of the basic cubical mesh element is 1 mm × 1 mm × 1 mm. In the electrochemically active area, the elements are flattened to 0.01 mm, to retain a minimum of three layers per element. In Figure 3, a computational mesh of the multistack design (see Figure 2c) is illustrated, including the detailed view, which shows the inflation of elements’ thickness in the area of contact of solid and fluid zones. Other designs’ computational meshes are consistent with the illustrated one. Boundary conditions applied in this section are presented in Table 1.
4.1. Gas Flow Rates Influence Study
This subsection presents a numerical analysis of gas flow rates’ influence on the performance of the initial design (design (a) in Figure 2). As shown in Part 1 of this article, the model has proved its validity for two different temperatures ( and ) and three gas flow rates (, , and ; , , and ; , , and ) by comparing model results to the experimental study. As the model proved its accuracy, it is assumed to simulate the SOFC behavior for other operating parameters relatively close to the ones used in the validation. The previous study, presented in Part 1 of this paper, showed the lack of oxygen and hydrogen as the performance limiting factor. To clarify the model validation and present the performance difference for different gas flow rates, Figure 4 is presented. In the upper left graph, a comparison of the electric characteristics of the model and experimental study is shown to present the model validation. The operational parameters are , , and . The upper right graph in Figure 4 presents the performance comparison of two modeled cases for with different gas flow rates; solid lines represent and , while dashed lines represent and . At the bottom, a comparison of potential (power) distribution along the stack cells is shown, with an appropriate indication, also located at the electric characteristics comparison for both gas flow rates, to visualize the analyzed points. The graph marked “(a)” shows the decreasing trend in potential values along the stack, which indicates the lack of fuel and air as the performance-limiting factor. To study the performance, while the feed of gases is in surplus, the hydrogen gas flow rate was increased ten times, and the air gas flow rate was increased twenty times. As shown in the upper right graph in Figure 4, the increase in gas flow rates caused the distinct performance change and, as shown in the graph marked “(b)”, a uniform potential distribution along the stack. The power increased from at the current of for the “(a)” case, up to at for the ”(b)” case, which gives a % performance increase. To better visualize the influence of gases adjustment, the investigation is extended to the numerical analysis, as below. All further figure marks “(a)” and “(b)”, shown in this subsection, are consistent with “(a)” and “(b)” marked in Figure 4. The investigation in this subsection studies the design marked as “(a)” in Figure 2, which was also studied experimentally. The full experimental study was presented in Part 1 of this article.
The distribution of the hydrogen mass fraction is shown in Figure 5 to confirm the influence of hydrogen on performance and provide a clear visualization of hydrogen behavior along the stack. The distribution is located 5 m above anodes’ surfaces, viewed from the side of the anode. Flow direction is from left to right. The values were fitted to the local range. Two different color sets are proposed to make the value range more visible. The distribution shows a lack of hydrogen in case “(a)” and a surplus in case “(b)”, which confirms the potential distribution difference shown in Figure 4.
To analogously study the fraction of oxygen mass, the distribution located 5 m above the cathodes’ surfaces is shown in Figure 6. The view is from the cathode side. Flow direction, again, is from left to right. Values are adjusted to the local range. Oxygen remains similar to hydrogen; in the “(a)” case, the oxygen mass fraction declines even earlier than hydrogen on the anode side; in the “(b)” case, the surplus of oxygen is exhibited. This behavior of oxygen utilization has a decent influence on performance and potential distribution along the stack, which is visible in Figure 4.
To prove the preservation of the electrochemical reaction of hydrogen and oxygen and study the ventilation inside the stack, the distribution of the water vapor mass fraction on the anode side is investigated. In Figure 7, the distribution is shown in the plane located 5 m above the anode surface. The flow direction is consistent with the x-axis. Values are determined by the local range. The “(a)” case distribution shows large steam fraction values in most of the stack area. Despite the steam being produced in higher amounts in the “(b)” case, the mass fraction of steam is lower, which indicates a higher velocity to insufflate the channel. Both cases can suggest providing better steam drainage in future prototype designs.
To investigate the velocity dispersing from the inlet tubes to the flow channels and the resultant supply of gases to the electrodes, the distribution of both discussed cases “(a)” and “(b)”, shown in Figure 8, is provided. Since hydrogen supply and steam ventilation are dependent on the velocity distribution on the anode side, velocity investigation is crucial. The distribution is visualized in the symmetry plane of the flow channels, and the x-axis determines the flow direction. Maximum values are specified for each case to make the distribution more accurate. The maximum global values in much smaller inlet tubes reach much higher values than in the area of interest—air and fuel channels. To make changes of lower velocity values in the area of wider channels more visible, fixing the range is required. In this case, the maximum represents a greater or equal value of velocity. The distribution exhibits poor velocity dispersing in the electrodes’ area, and the eddy is observed in the “(b)” case. The analysis of a velocity distribution has shown low-velocity values in the electrode area compared to the values in the height of the inlet and outlet tubes. Large velocity differences within the height of the channels indicate that the flow is concentrated in the area between the inlet and outlet rather than spreading over the entire channels. These phenomena cause a limitation in the fuel and air supply as a result of insufflation mainly between the inlet and outlet tubes.
The temperature distribution inside the stack is strictly dependent on the electric load and flow rates. To inspect such an influence, the temperature distribution, located in the flow channel symmetry plane, is shown in Figure 9. Flow direction is determined by the x-axis (from left to right). Values are presented in the global range, so the minimum and maximum values represent the extremes for the whole domain for both cases together. Despite the lower current flux in the “(a)” case, the stack temperature is higher than in the “(b)” case, where the temperature is effectively decreased by a higher flow rate, especially at the cathode side. The temperature difference shown in “(c)” of Figure 9 points to a major difference in the flow channel area on the cathode side and a minor difference on the anode side, but overall, the increase in flow rates caused a decrease in the stack temperature, which has a positive influence on mechanical issues by potentially decreasing thermal stress in the stack. As shown, due to cooling down by higher flow rates, stack temperature is more uniform, and hotspots in the areas of electrodes are partially eliminated. The air channel outlet area also shows the difference; due to the insufflation of hot air, the heat is collected and directed into the outlet.
4.2. Geometric Improvements Study
To make a comparison of each investigated design, the boundary conditions, electrochemical, material, and operating parameters were the same in all numerical cases (see Table 1). To simulate the behavior of the furnace interior and substitute the ceramic covers, as discussed above, constant temperature and zero species flux boundary conditions were established at the outer surfaces of fluid domains. No current leakage was allowed on the outer walls of the solid parts, except for the current collectors’ taps. At the current collectors’ taps, on the anodic side, a zero potential is assumed, whereas on the cathodic side, a current flux is given. The constant current load simulates the series connection of the stack to multiply the electric potential value. The boundary conditions for constant velocity, temperature, and gas mixture composition were given at the inlets of the flow channels. Constant atmospheric pressure and furnace temperature were applied to the channels’ outlets. The boundary conditions applied for all cases are presented in Table 1. Pressure–velocity coupling was performed using the SIMPLE scheme with the Rhie–Chow distance-based flux type. For spatial discretization of the convection terms, the first-order upwind scheme was used. The choice of such a scheme was dictated by numerical stability. The Green–Gauss node-based method was used to calculate the gradient, and the pressure was computed using the second-order scheme.
To make a comparison of each design shown in Figure 2, a series of simulations was performed. Each design studied in this section consists of the same SOFC stack supported on a 105 × 30 electrolyte. To obtain a current–power characteristic, an electric load of constant current was applied to the current collectors of the cathodes with a value ranging from zero to the maximal (unknown) value, at which the power of the stack drops to zero. Four different plots are shown in Figure 10. For reference, the marks (a), (b1), (b2), and (c) are consistent with the geometries shown in Figure 2. The upper left graph of Figure 10 illustrates the current–voltage and current–power characteristics of cases (a) and (b1), for the comparison of half-tubular covers and rectangular ones, with the electrolyte of 0.3 mm of thickness. The difference between the (a) and (b1) cases is almost unrecognizable. Flattening the channels by changing the shape to rectangular resulted in a power drop from (a) to (b1). The graph on the upper right compares the characteristics of the initial case (a) and the design with a rectangular shape of covers with a reduced electrolyte thickness (0.1 mm) (b2). As expected, reducing the thickness of the electrolyte resulted in a performance increase because of the reduced losses associated with ionic conductivity. The power of the (b2) case reaches . The lower left graph compares the performance of the initial case (a) and the multistack design (b), which consists of 12 cells. The multistack design (c) is the most powerful arrangement option. The power reaches the value of , but the power density is slightly lower than in the case (b2). Furthermore, in the (c) case, a concentration loss is visible in the characteristics, which could mean insufficient hydrogen supply due to the doubling of the cell number, which could be a reason for the drop in power density. Moreover, it is worth underlining that the multistack design (c) volume is still reduced compared to the initial design (a), so the volumetric power density, which considers the whole system volume, would increase. To better illustrate the performance comparison of the four cases (a), (b1), (b2), and (c), a bar plot of the maximal power density, located in the lower right part of Figure 10, is presented.
The comparison of the temperature distribution, shown in Figure 11, is presented to analyze the possibilities to improve heat transfer. Design marks (a), (b1), (b2), and (c) are consistent with the geometries shown in Figure 2. The initial design (a), as well as designs (b1) and (b2), is arranged in co-flow, with a flow direction from left to right. The multistack design cross-flow is shown in Figure 3. The distributions illustrated in Figure 11 are located on the channels’ symmetry planes. Each distribution was presented for the maximum power point, determined during the study of the electric characteristics (see Figure 10). The temperature distribution does not change significantly between (a) and (b1). For both cases, the maximum power retains the same current value. After implementing a thinner electrolyte (b2), the increase in current allowed the maximum power to increase. Due to the higher load, there is a significant temperature increase. The analysis of the multistack design reveals a significant temperature increase in the fuel channel between two sets of anodes, which is caused by heat generation. From the outside, the constant temperature boundary condition cools the neighboring areas. The distribution analysis suggests that a multistack prototype could remain at operating temperature with heating lower than the remaining designs.
The hydrogen distribution is presented in Figure 12 to inspect the hydrogen consumption in the anodes. The distribution is shown in the channels’ symmetry planes. Design marks (a), (b1), (b2), and (c) are consistent with the geometries shown in Figure 2. In the (a), (b1), and (b2) cases, fuel channels are located at the top. Case (c) has a fuel channel enclosed by two stacks and is located in the middle of the geometry. Fuel flows along the x-axis in all cases. Each case was presented for its maximum power point in the power–voltage characteristics (Figure 10). The operating parameters for each case were the same and are shown in Table 1. Cases (a) and (b1) present similar hydrogen usage, because the generated power is almost the same. Case (b2), with a higher power output, due to a thinner electrolyte and a lower ionic resistance, presents a higher hydrogen usage throughout the channel, compared to (b1). In case (c), which consists of two stacks and 12 electrodes (instead of 6, as in reference design (a)), it is clearly visible that the amount of hydrogen is insufficient. This confirms the high concentration loss, visible in Figure 10 in the high-current region.
A study of the oxygen distribution on the cathode side was conducted; this was consistent with the analysis of the hydrogen mass fraction. Results are shown in Figure 13. The airflow in cases (a), (b1), and (b2) is along the x-axis. The geometry of case (c) is a cross-flow configuration, so the airflow direction is determined by the opposite of the z-axis (see Figure 3). Due to the different direction of airflow in the air channels of case (c), the oxygen mass fraction distribution presents an entirely different behavior, as in the other cases (a), (b1), and (b2).
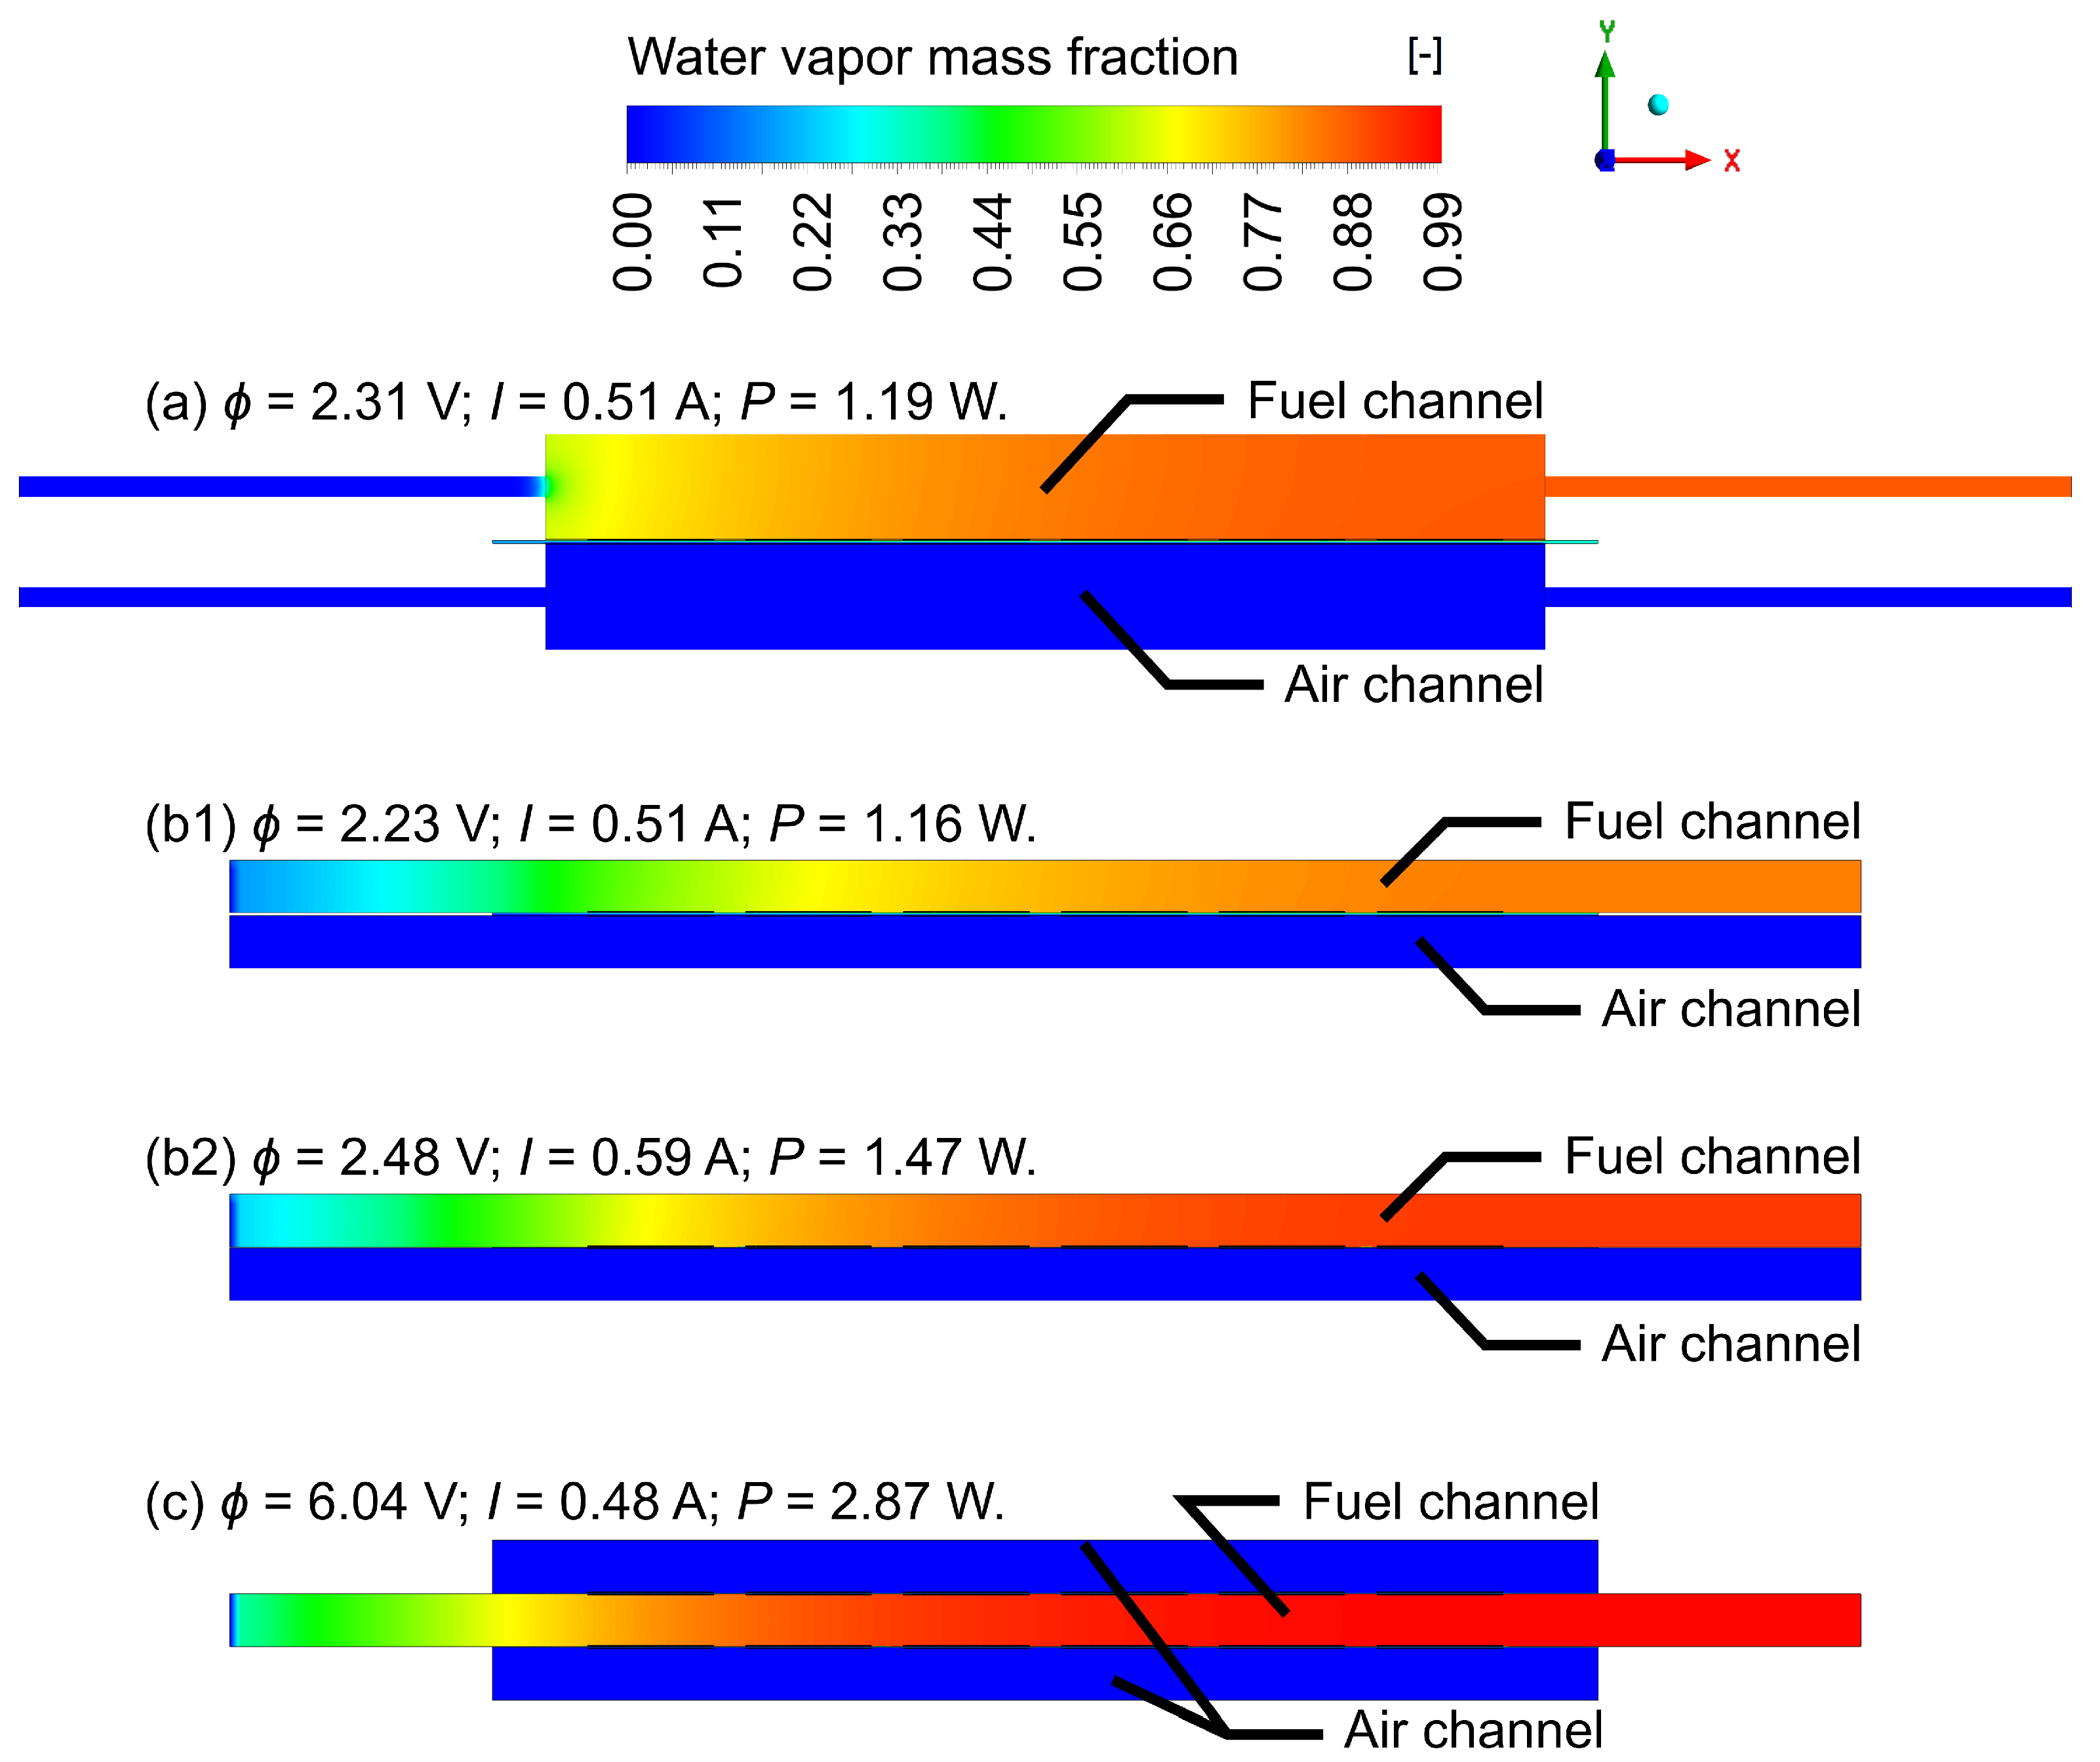
To study the production of water vapor due to the electrochemical reaction, a distribution similar to the distributions of the hydrogen and oxygen mass fractions is shown in Figure 14. The consumption of oxygen and hydrogen should produce water vapor in the fuel channels, which is clearly visible in the water vapor mass fraction distribution presented and confirms the proper operation of the model. As the hydrogen and oxygen mass fractions decrease along the stacks, steam fills the fuel channel.
5. Conclusions
This paper provided a detailed analysis of the banded SOFC stack. The influence of gas flow rates on the performance was provided and studied in detail for the geometry of the prototype. Moreover, four different geometries in total were designed to analyze the influence of the stack system configuration on performance and help choose the enhanced design possibilities. In addition, different electrolyte thicknesses were modeled. The computational mesh of each design was established to provide a domain for finite-volume computation. As presented, the meshes were formed to provide a high resolution of the solution while maintaining a low computation time. The details of meshing and mathematical modeling are presented in Part 1 of this work.
The main goal of this research was to inspect the performance changes. To compare the results, the current–voltage and current–power characteristics were studied. Each design has different characteristics. Firstly, the influence of gas flow rates was tested on the initial design, as the prototype was built. The study showed the increase in power of %, from power of at the current of for gas flow rates as tested experimentally, up to at for increased gas flow rates. In the second part of this paper, the geometric modifications were studied. To present clear geometrical parameters’ influence on performance, all boundary conditions were preserved in all cases. The whole process of modification, from the initial single stack with half-tubular covers design to the final multistack design, resulted in a power increase of %, from up to , while preserving a comparable volume of the system. The multistack design proved to be the right method of extending the stack design into a more extensive system. An arrangement of joining two stacks to one fuel channel, established partially by the stacks themselves, in terms of extending the system size, can double the system power without increasing the volume. Furthermore, the realization of the air supply as a side fan could simplify the initial design. The temperature distribution analysis revealed another advantage of multistacking. The neighboring stacks heat each other, which, on the prototype scale, could allow for minimizing furnace input. Commercially, it could enforce cooling the system by fitting the gas flow rates. The hydrogen mass fractions distribution study showed that flattening of the channels does not negatively affect performance. However, to preserve a more uniform hydrogen distribution along the stack, hydrogen could be mixed with nitrogen to increase electrode penetration and supply fuel to all cells in a more efficient way while the amount of hydrogen is maintained at the same level. This could also provide a better purge of steam in the fuel channel. Oxygen mass fraction distributions revealed an advantage of the cross-flow organization in order to receive more uniform oxygen distribution along the stack. This could also lead to changes applied to the hydrogen supply system for the multistack design to provide hydrogen across the stack, similar to the air supply system. In conclusion, the multistack design forms the most proper way of extending the stack into multiple ones and is perceived as the best design of all presented in this paper. Although the power density of the multistack design was not the highest, this study showed that the utilization of fed gases was total, so the increase in gases supply should yield in even more performance increase due to both stacks heating each other up, which equals reducing ionic resistance of the electrolyte in comparison with single-stack designs presented in this paper.
In the future, the developed simulation can be used to analyze electrolyte and electrodes geometry and current collectors arrangement, allowing the construction of new, improved stack versions. Moreover, after contributing a new method of extending the single-stack system into a multistack, an analysis of the extended-scale fuel supply system in terms of fluid mechanics can be conducted. The model can also be used to analyze the influence of material improvement by conducting material and electrochemical parametric studies.
Author Contributions
Conceptualization: K.K.Ś., M.M., G.B. and J.S.S.; data curation: K.K.Ś.; formal analysis: K.K.Ś. and M.M.; funding acquisition: J.S.S.; investigation: K.K.Ś.; methodology: K.K.Ś., M.M. and G.B.; project administration: J.S.S.; resources: G.B. and J.S.S.; software: K.K.Ś.; supervision: M.M., G.B. and J.S.S.; validation: K.K.Ś.; visualization: K.K.Ś.; writing—original draft preparation: K.K.Ś., M.M. and G.B.; writing—review and editing: M.M., G.B. and J.S.S. All authors have read and agreed to the published version of the manuscript.
Funding
The present research was supported by the Polish National Agency for Academic Exchange (NAWA), within the Strategic Partnerships Programme, Project No. BPI/PST/2021/1/00023. The numerical results were obtained by computational power financially supported by AGH University of Krakow (Grant AGH No. 16.16.210.476).
Data Availability Statement
Data available on request from the authors.
Acknowledgments
This research made use of the computational power provided by the PL-Grid Infrastructure.
Conflicts of Interest
The authors declare the following competing interests: M.M., G.B., and J.S.S. are employees of AGH University of Science and Technology, which has applied for a Polish patent “High-Temperature Solid Oxide Fuel Cell Stack”, Int. Cl. H01M 8/2432 (2016.01) H01M 8/2475 (2016.01) [16]. The Institute currently holds the patent, with G.B. listed as an inventor. K.K.Ś. is a Ph.D. student at the institution mentioned above.
Nomenclature
| Faraday constant | (9.65 × 10⁴ ) | |
| h | specific enthalpy | () |
| enthalpy change | () | |
| I | current | () |
| anode equilibrium exchange current | () | |
| cathode equilibrium exchange current | () | |
| i | current density flux | () |
| j | volumetric transfer current density | () |
| diffusion flux | () | |
| k | thermal conductivity | () |
| M | molar mass | () |
| p | static pressure | () |
| P | power | () |
| power density | () | |
| volumetric flux of species | () | |
| universal gas constant | ( ) | |
| source/sink term of momentum | () | |
| source/sink term of heat | () | |
| source/sink term of species rates | () | |
| source/sink term of mass | () | |
| T | temperature | () |
| velocity vector | () | |
| local species concentration | (kmol ) | |
| species mass fraction | (-) | |
| Greek letters | ||
| transfer coefficient | (-) | |
| concentration dependence | (-) | |
| porosity rate | (-) | |
| triple phase boundary length density | () | |
| double phase boundary length density | () | |
| local surface overpotential | () | |
| density | () | |
| conductivity | () | |
| stress tensor | () | |
| electric potential | () | |
| Sub- and superscripts | ||
| anodic | ||
| anode | ||
| cathodic | ||
| cathode | ||
| density | ||
| double phase boundary | ||
| effective value | ||
| electronic | ||
| equilibrium | ||
| i | reaction component | |
| ionic | ||
| reaction | ||
| reference value | ||
| solid | ||
| triple phase boundary | ||
| Abbreviations | ||
| 3D | three-dimensional | |
| CAD | computer-aided design | |
| CFD | computational fluid dynamics | |
| OCV | open circuit voltage | |
| SOFC | solid oxide fuel cell | |
References
- Buchaniec, S.; Sciazko, A.; Mozdzierz, M.; Brus, G. A Novel Approach to the Optimization of a Solid Oxide Fuel Cell Anode Using Evolutionary Alghorithms. IEEE Access 2019, 7, 34361–34372. [Google Scholar] [CrossRef]
- Ghorbani, B.; Vijayaraghavan, K. A review study on software-based modeling of hydrogen-fueled solid oxide fuel cells. Int. J. Hydrogen Energy 2019, 44, 13700–13727. [Google Scholar] [CrossRef]
- Pianko-Oprych, P.; Zinko, T. Simulation of the steady-state behaviour of a new design of a single planar Solid Oxide Fuel Cell. Pol. J. Chem. Technol. 2016, 1, 64–71. [Google Scholar] [CrossRef] [Green Version]
- Pianko-Oprych, P.; Zinko, T. Computational fluid dynamics calculation of a planar solid oxide fuel cell design running on syngas. Chem. Process Eng. 2017, 38, 513–521. [Google Scholar] [CrossRef] [Green Version]
- Mozdzierz, M.; Berent, K.; Kimijima, S.; Szmyd, J.S.; Brus, G. A Multiscale Approach to the Numerical Simulation of the Solid Oxide Fuel Cell. Catalysts 2019, 9, 253. [Google Scholar] [CrossRef] [Green Version]
- Chalusiak, M.; Wrobel, M.; Mozdzierz, M.; Berent, K.; Szmyd, J.S.; Kimijima, S.; Brus, G. A numerical analysis of unsteady transport phenomena in a Direct Internal Reforming Solid Oxide Fuel Cell. Int. J. Heat Mass Transf. 2019, 131, 1032–1051. [Google Scholar] [CrossRef]
- Wei, S.S.; Wang, T.H.; Wu, J.S. Numerical modeling of interconnect flow channel design and thermal stress analysis of a planar anode-supported solid oxide fuel cell stack. Energy 2014, 69, 553–561. [Google Scholar] [CrossRef]
- Dong, S.-K.; Jung, W.-N.; Rashid, K.; Kashimoto, A. Design and numerical analysis of a planar anode-supported SOFC stack. Renew. Energy 2016, 94, 637–650. [Google Scholar] [CrossRef]
- Pirasaci, T. Non-uniform, multi-stack solid oxide fuel cell (SOFC) system design for small system size and high efficiency. J. Power Sources 2019, 426, 135–142. [Google Scholar] [CrossRef]
- Babaie Rizvandi, O.; Miao, X.-Y.; Frandsen, H.L. Multiscale modeling of degradation of full solid oxide fuel cell stacks. Int. J. Hydrogen Energy 2021, 46, 27709–27730. [Google Scholar] [CrossRef]
- Fu, Q.; Li, Z.; Wei, W.; Liu, F.; Xu, X.; Liu, Z. Performance enhancement of a beam and slot interconnector for anode-supported SOFC stack. Energy Convers. Manag. 2021, 241, 114277. [Google Scholar] [CrossRef]
- Zheng, J.; Xiao, L.; Wu, M.; Lang, S.; Zhang, Z.; Chen, M.; Yuan, J. Numerical Analysis of Thermal Stress for a Stack of Planar Solid Oxide Fuel Cells. Energies 2022, 15, 343. [Google Scholar] [CrossRef]
- Miao, X.-Y.; Pirou, S.; Frandsen, H.L. Mitigating distortions during debinding of a monolithic solid oxide fuel cell stack using a multiscale, multiphysics model. J. Eur. Ceram. Soc. 2023, 43, 1992–2001. [Google Scholar] [CrossRef]
- Fan, J.; Shi, J.; Zhang, R.; Wang, Y.; Shi, Y. Numerical study of a 20-cell tubular segmented-in-series solid oxide fuel cell. J. Power Sources 2023, 556, 232449. [Google Scholar] [CrossRef]
- Prokop, T.A.; Berent, K.; Iwai, H.; Szmyd, J.S. A Three-Dimensional Numerical Assessment of Heterogeneity Impact on a Solid Oxide Fuel Cell’s Anode Performance. Catalysts 2018, 8, 503. [Google Scholar] [CrossRef] [Green Version]
- Brus, G. High-Temperature Solid Oxide Fuel Cell Stack. Polish Patent PL 234427, 28 February 2020. [Google Scholar]
- Mukerjee, S.; Leah, R.; Selby, M.; Stevenson, G.; Brandon, N.P. Chapter 9—Life and Reliability of Solid Oxide Fuel Cell-Based Products: A Review. In Solid Oxide Fuel Cell Lifetime and Reliability; Brandon, N.P., Ruiz-Trejo, E., Boldrin, P., Eds.; Academic Press: Cambridge, MA, USA, 2017; pp. 173–191. [Google Scholar] [CrossRef]
Figure 1.
Investigated SOFC stack design with an exploded view.

Figure 3.
Visualization of the computational mesh of multistack design with detailed view.

Figure 4.
Top left: Characteristics of current–voltage (current–power) comparison of the model results and experimental study. Top right: Characteristics of current–voltage (current–power), obtained from the model. Two cases represent different gas flow rates at the operating temperature of . The circle marks indicate the maximum power points. Bottom: Potential (power) distribution of individual cells in the stack of two circles marked as (a,b). Cells are numbered according to the flow direction.
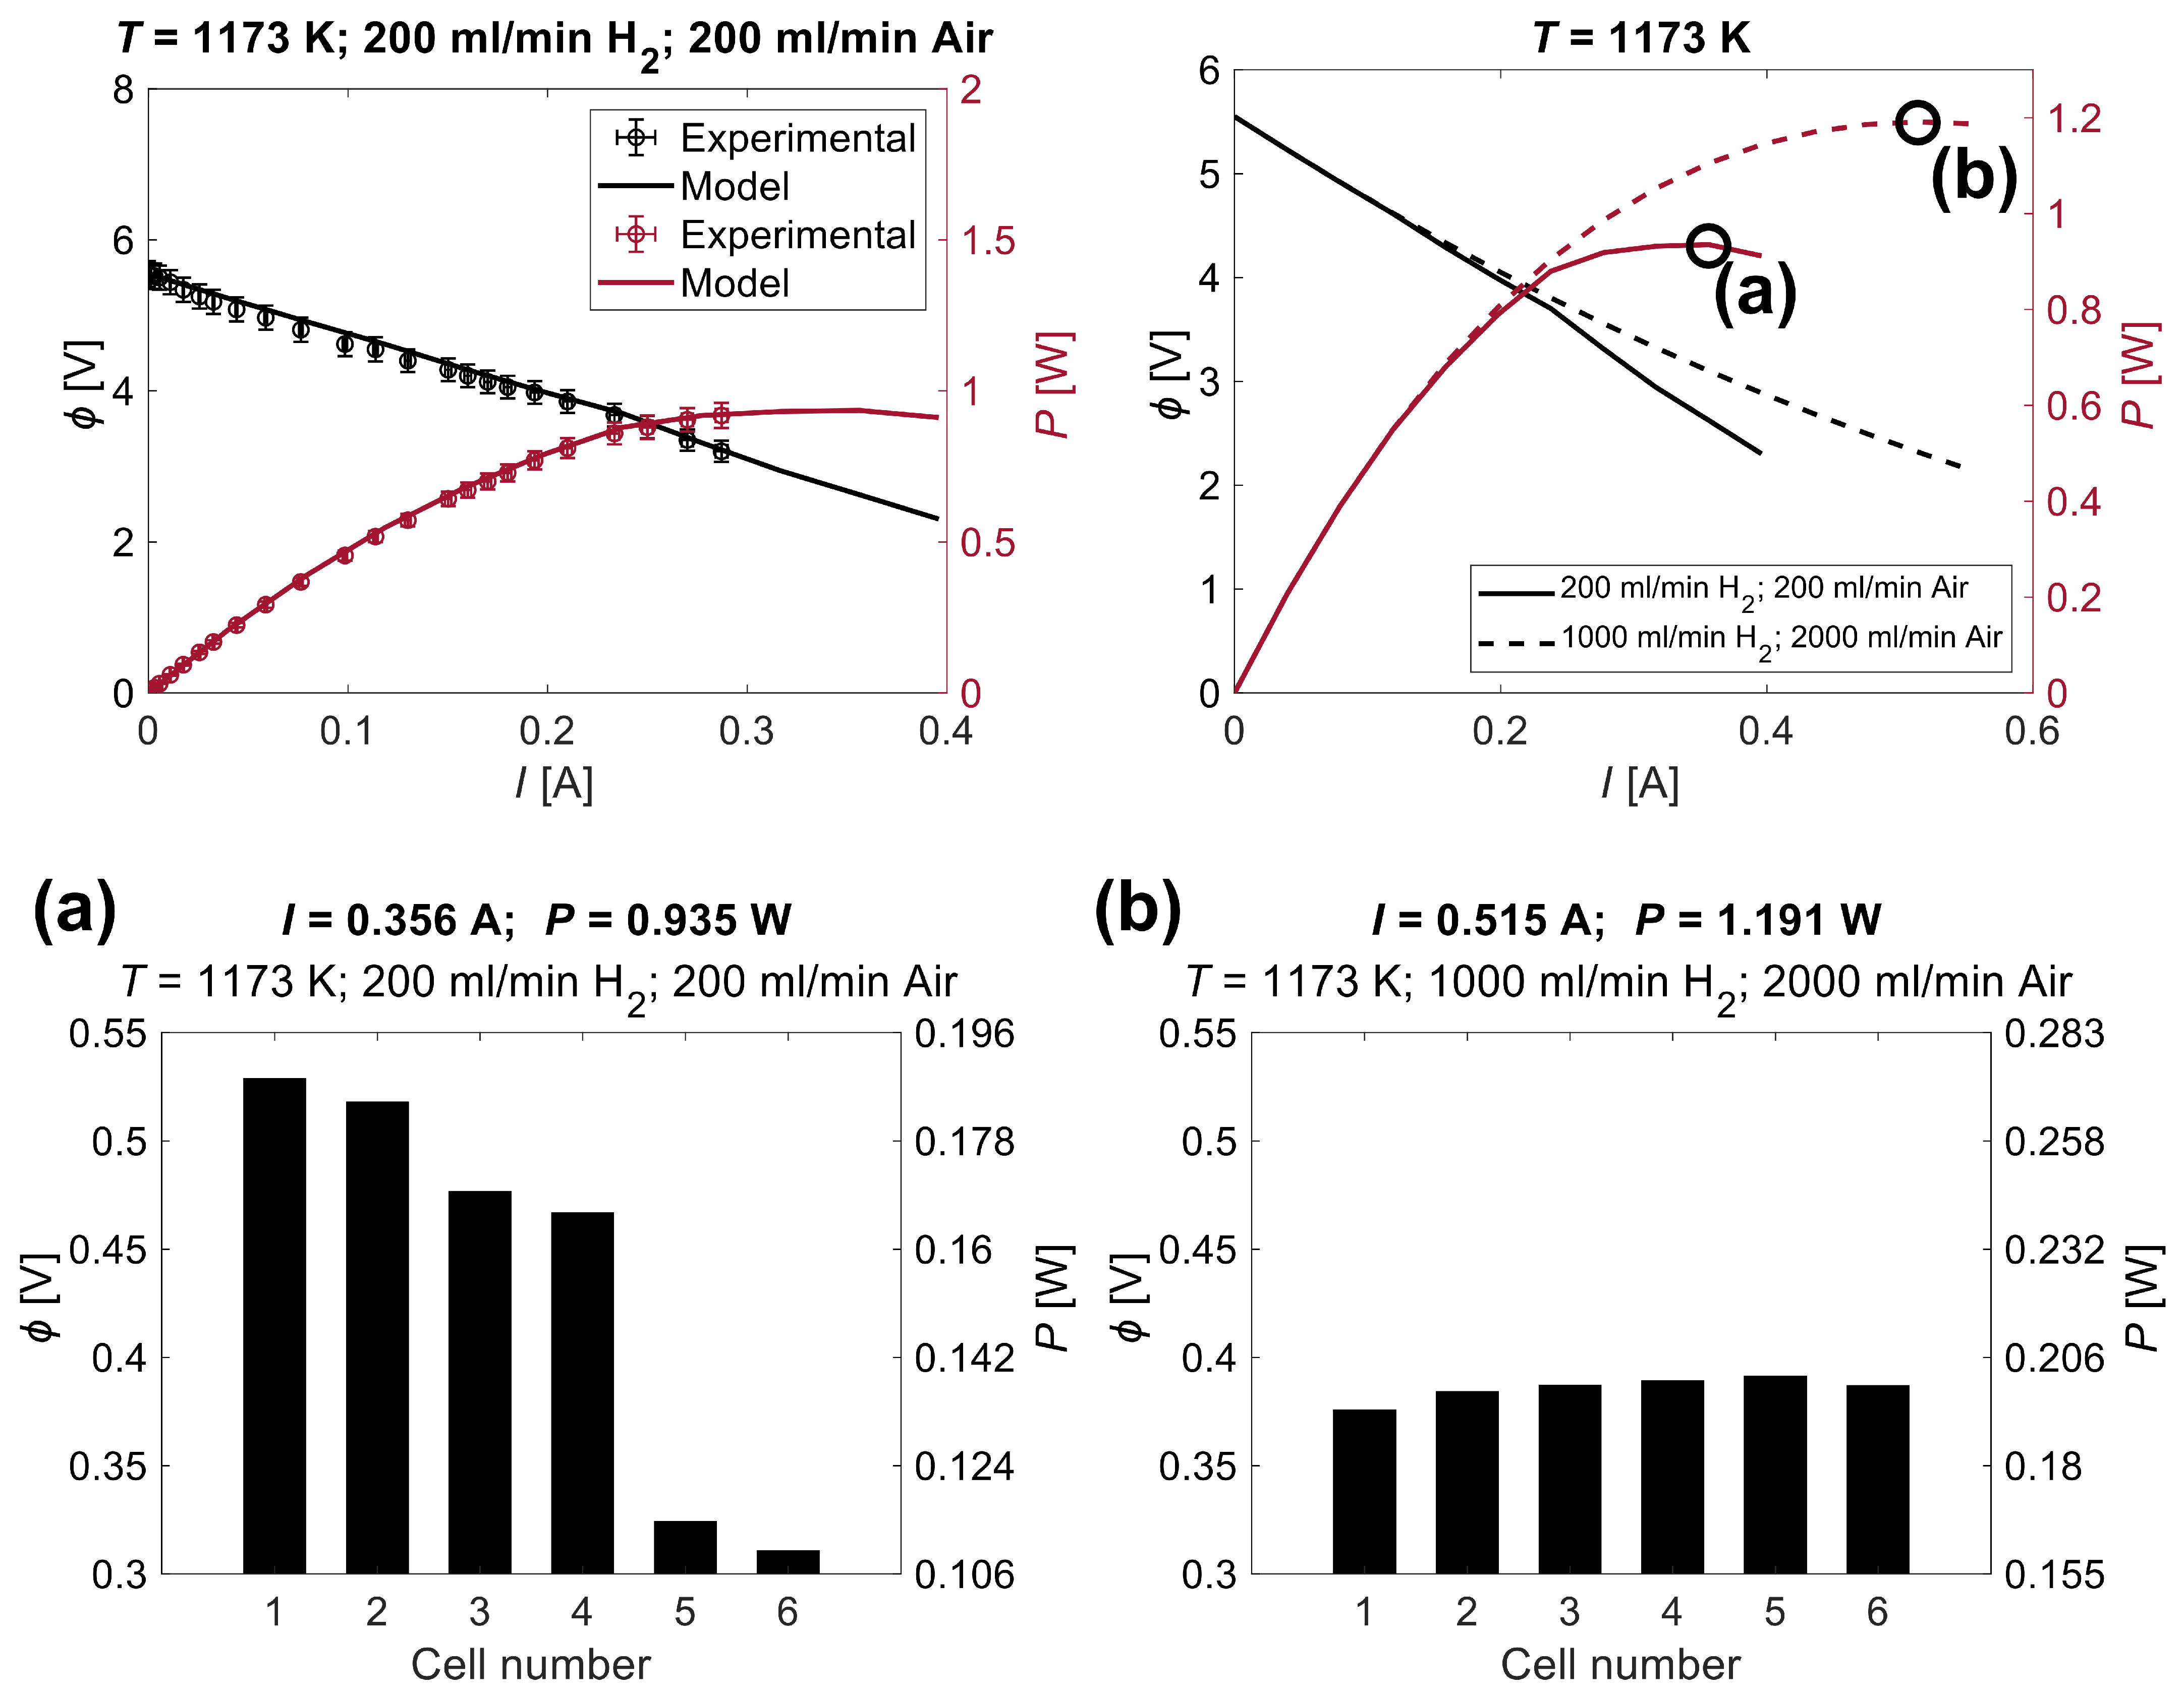
Figure 5.
Hydrogen mass fraction distribution in the plane located 5 above the anode surface. Local range of values. (a) mL/min; mL/min; ; ; , (b) mL/min; mL/min; ; ; .
Figure 5.
Hydrogen mass fraction distribution in the plane located 5 above the anode surface. Local range of values. (a) mL/min; mL/min; ; ; , (b) mL/min; mL/min; ; ; .
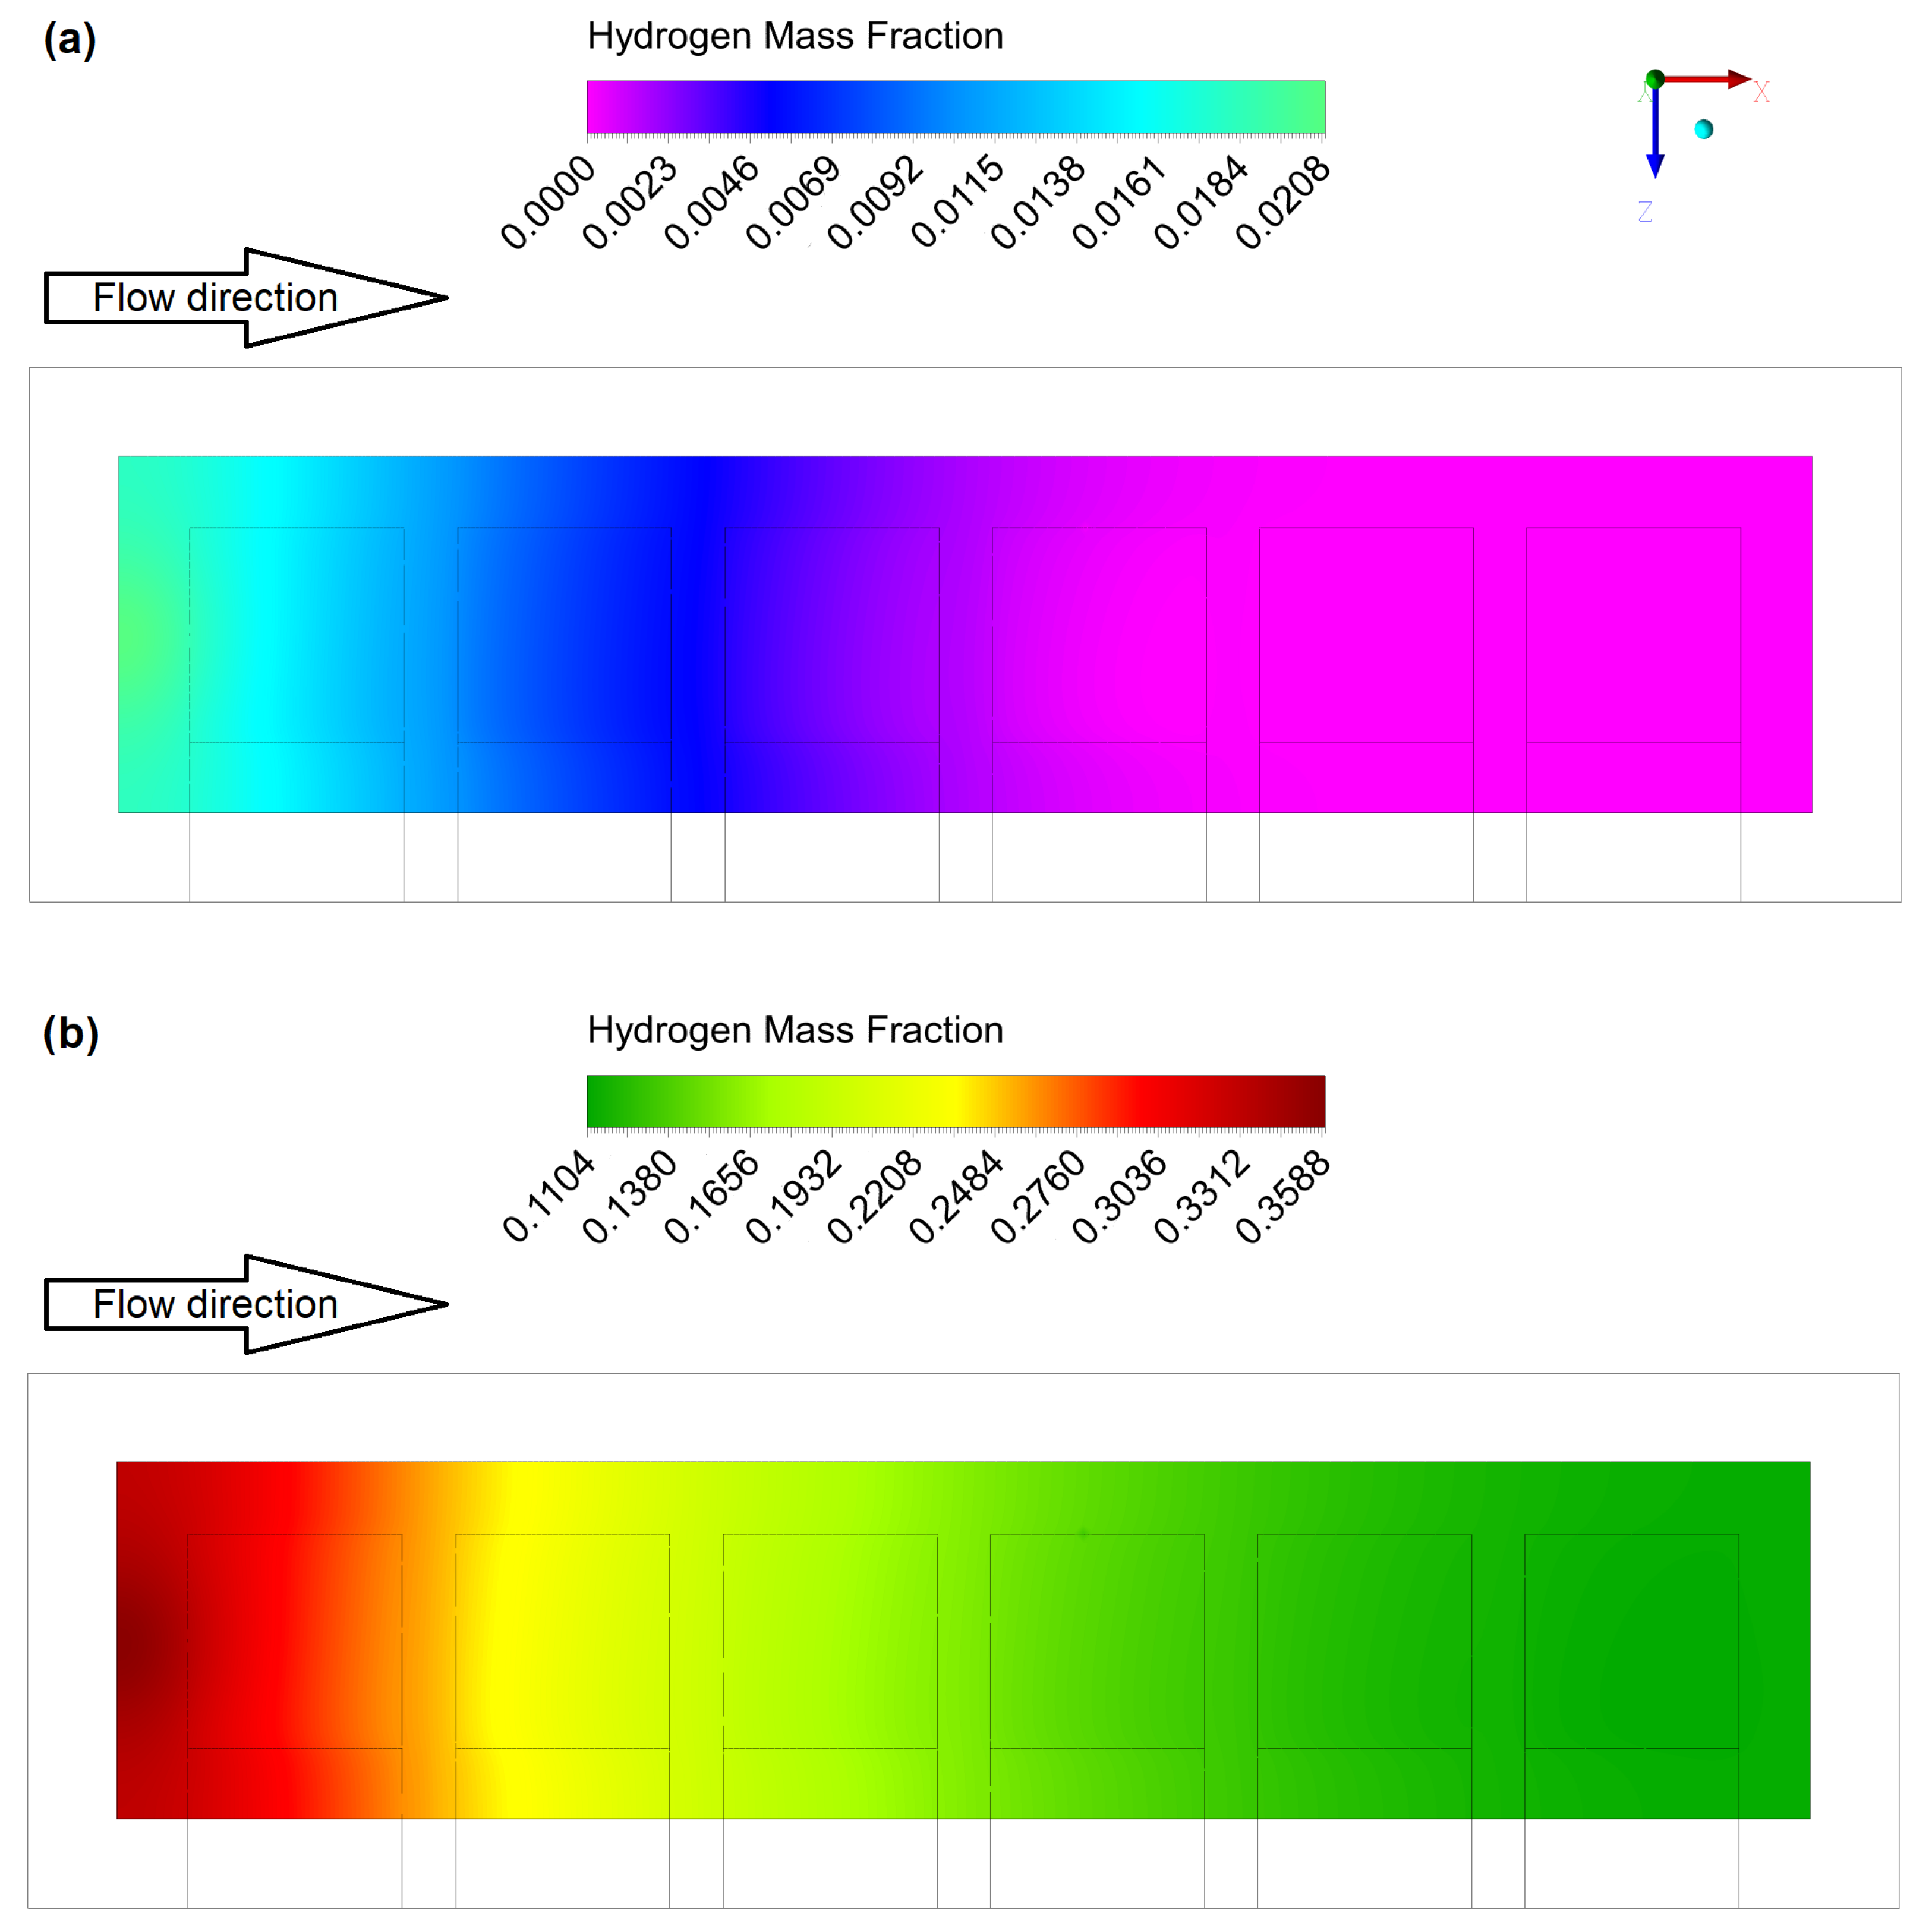
Figure 6.
Distribution of the oxygen mass fraction in the plane located 5 m above the cathode surface. Local range of values. (a) mL/min; mL/min; ; ; , (b) mL/min; mL/min; ; ; .
Figure 6.
Distribution of the oxygen mass fraction in the plane located 5 m above the cathode surface. Local range of values. (a) mL/min; mL/min; ; ; , (b) mL/min; mL/min; ; ; .
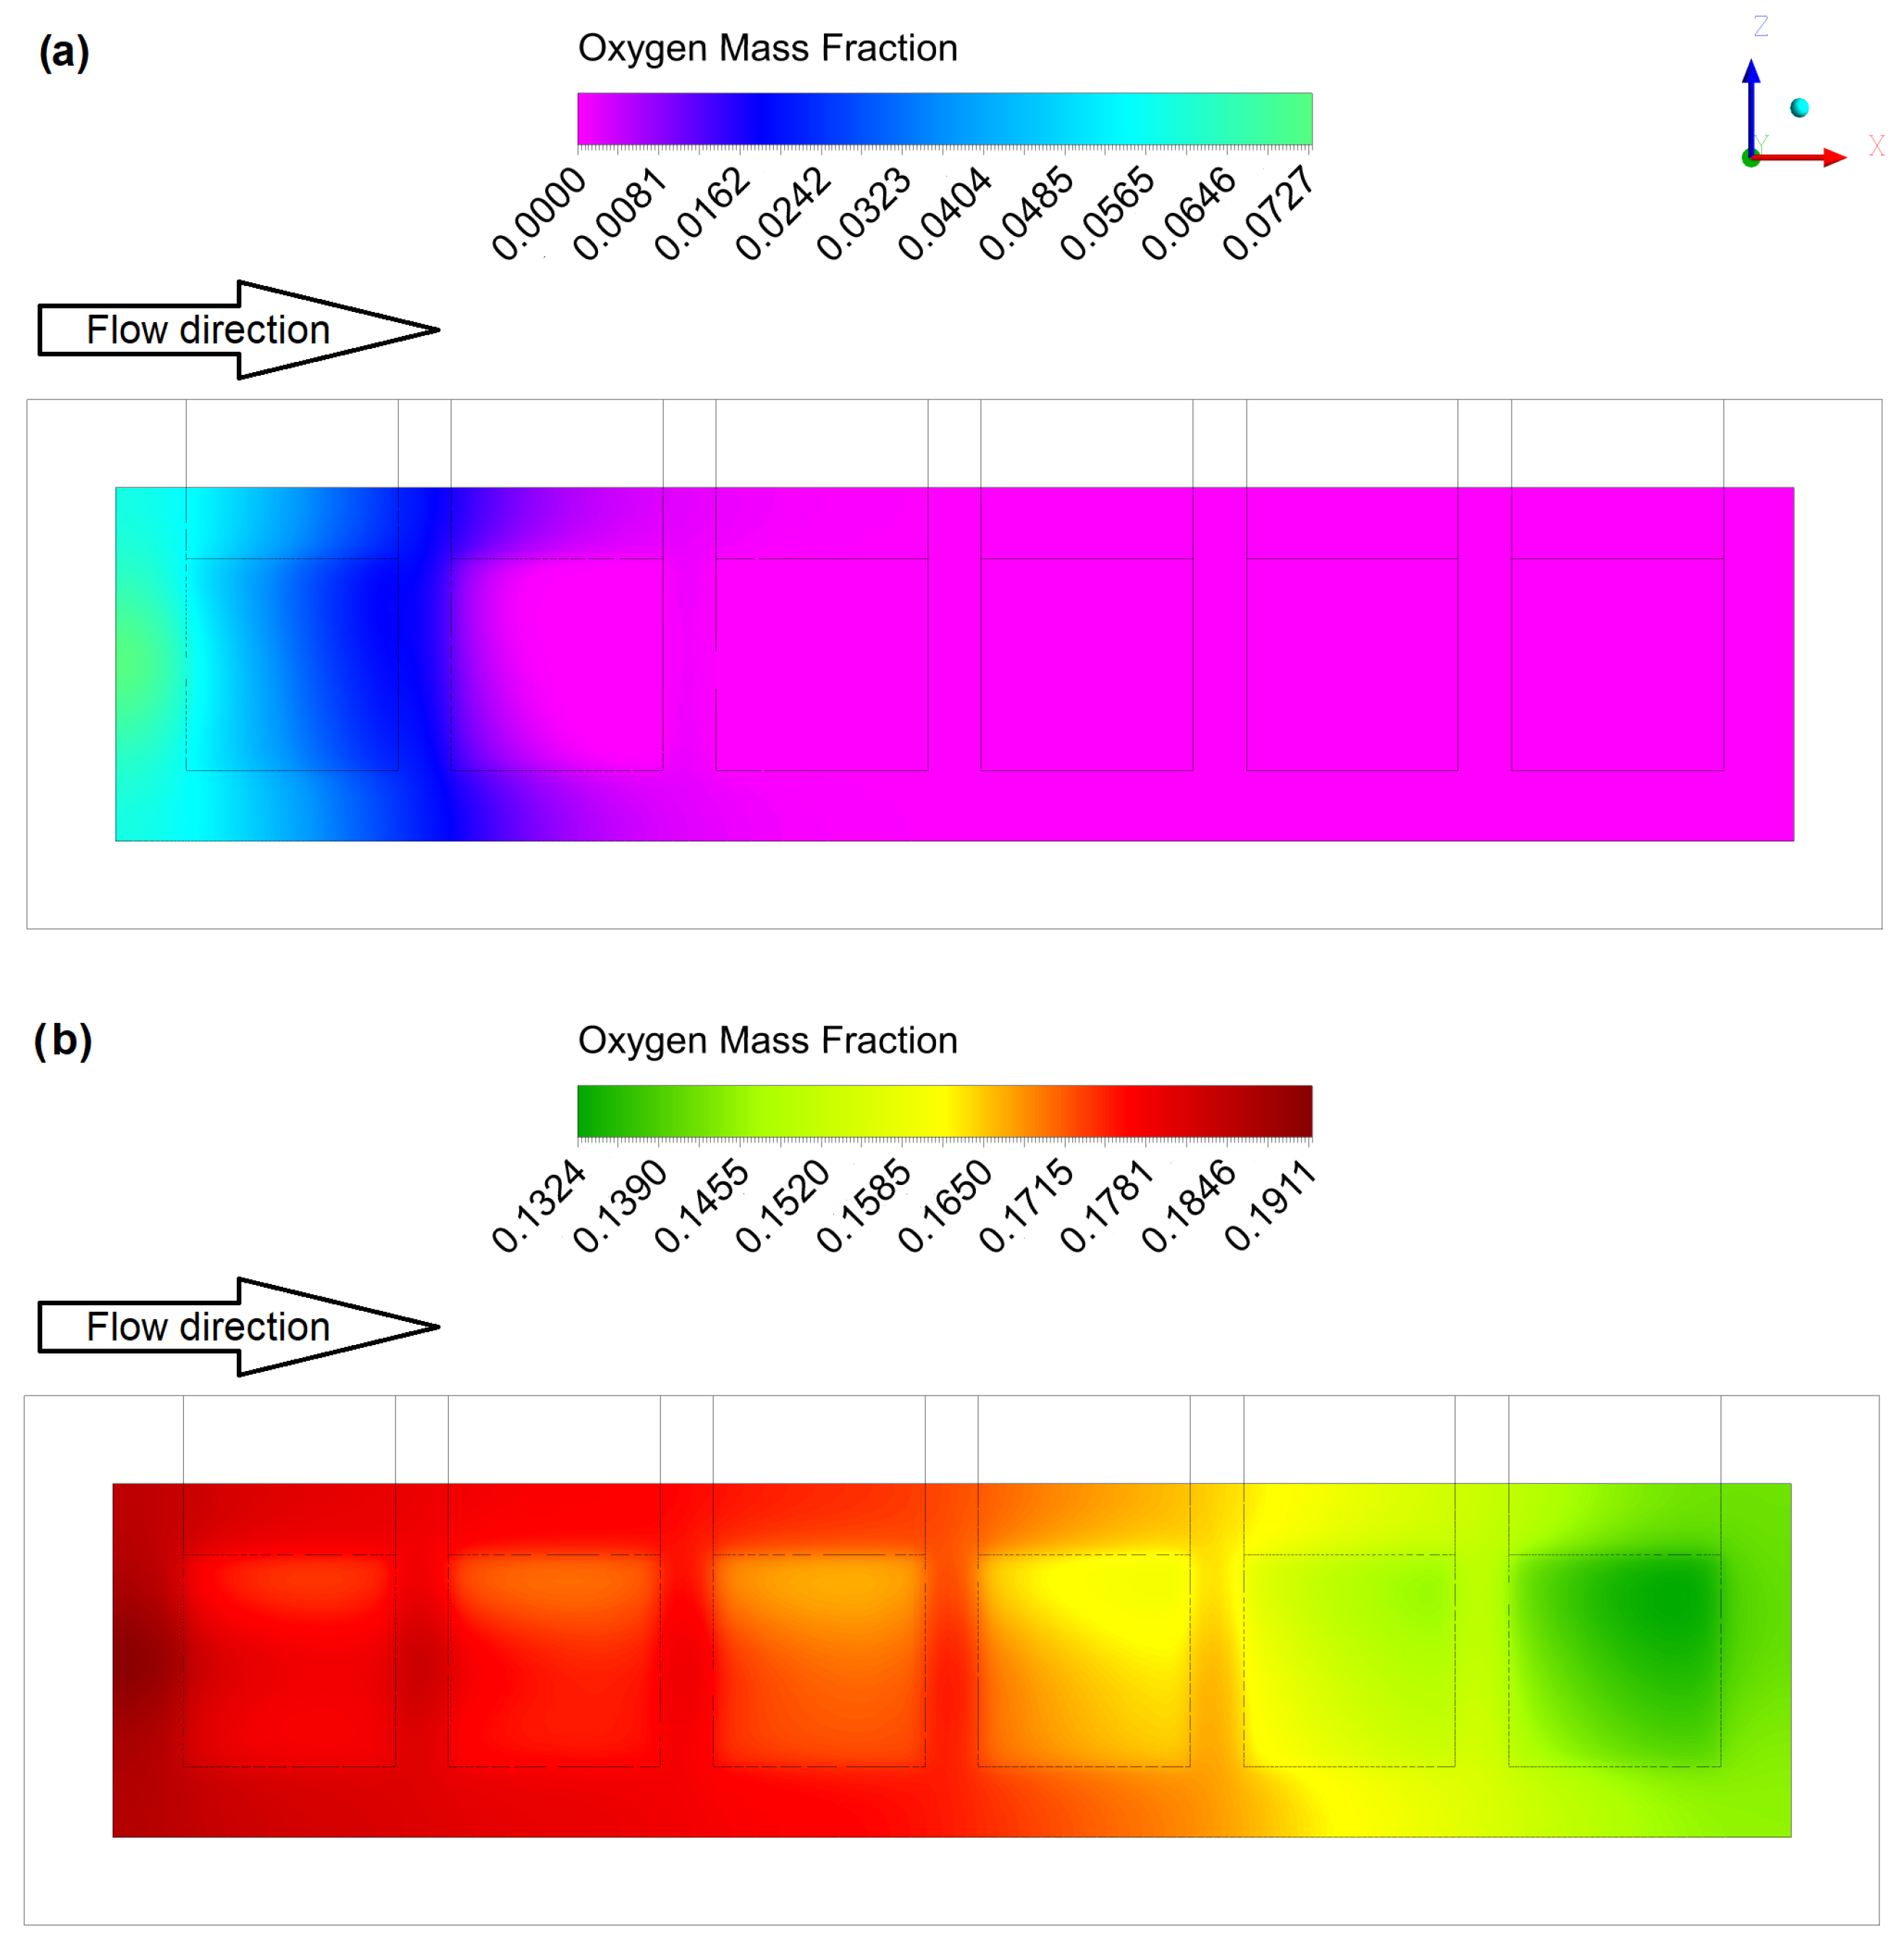
Figure 7.
Distribution of the water vapor mass fraction in a plane located 5 above the anode surface. Local range of values. (a) mL/min; mL/min; ; ; , (b) mL/min; mL/min; ; ; .
Figure 7.
Distribution of the water vapor mass fraction in a plane located 5 above the anode surface. Local range of values. (a) mL/min; mL/min; ; ; , (b) mL/min; mL/min; ; ; .

Figure 8.
Velocity distribution located in the flow channel symmetry plane. Fixed values range. (a) mL/min; mL/min; ; ; , (b) mL/min; mL/min; ; ; .
Figure 8.
Velocity distribution located in the flow channel symmetry plane. Fixed values range. (a) mL/min; mL/min; ; ; , (b) mL/min; mL/min; ; ; .

Figure 9.
Temperature distribution located in the flow channel symmetry plane. (a) mL/min; mL/min; ; ; , (b) mL/min; mL/min; ; ; . (c) Difference between (a,b) distribution.
Figure 9.
Temperature distribution located in the flow channel symmetry plane. (a) mL/min; mL/min; ; ; , (b) mL/min; mL/min; ; ; . (c) Difference between (a,b) distribution.
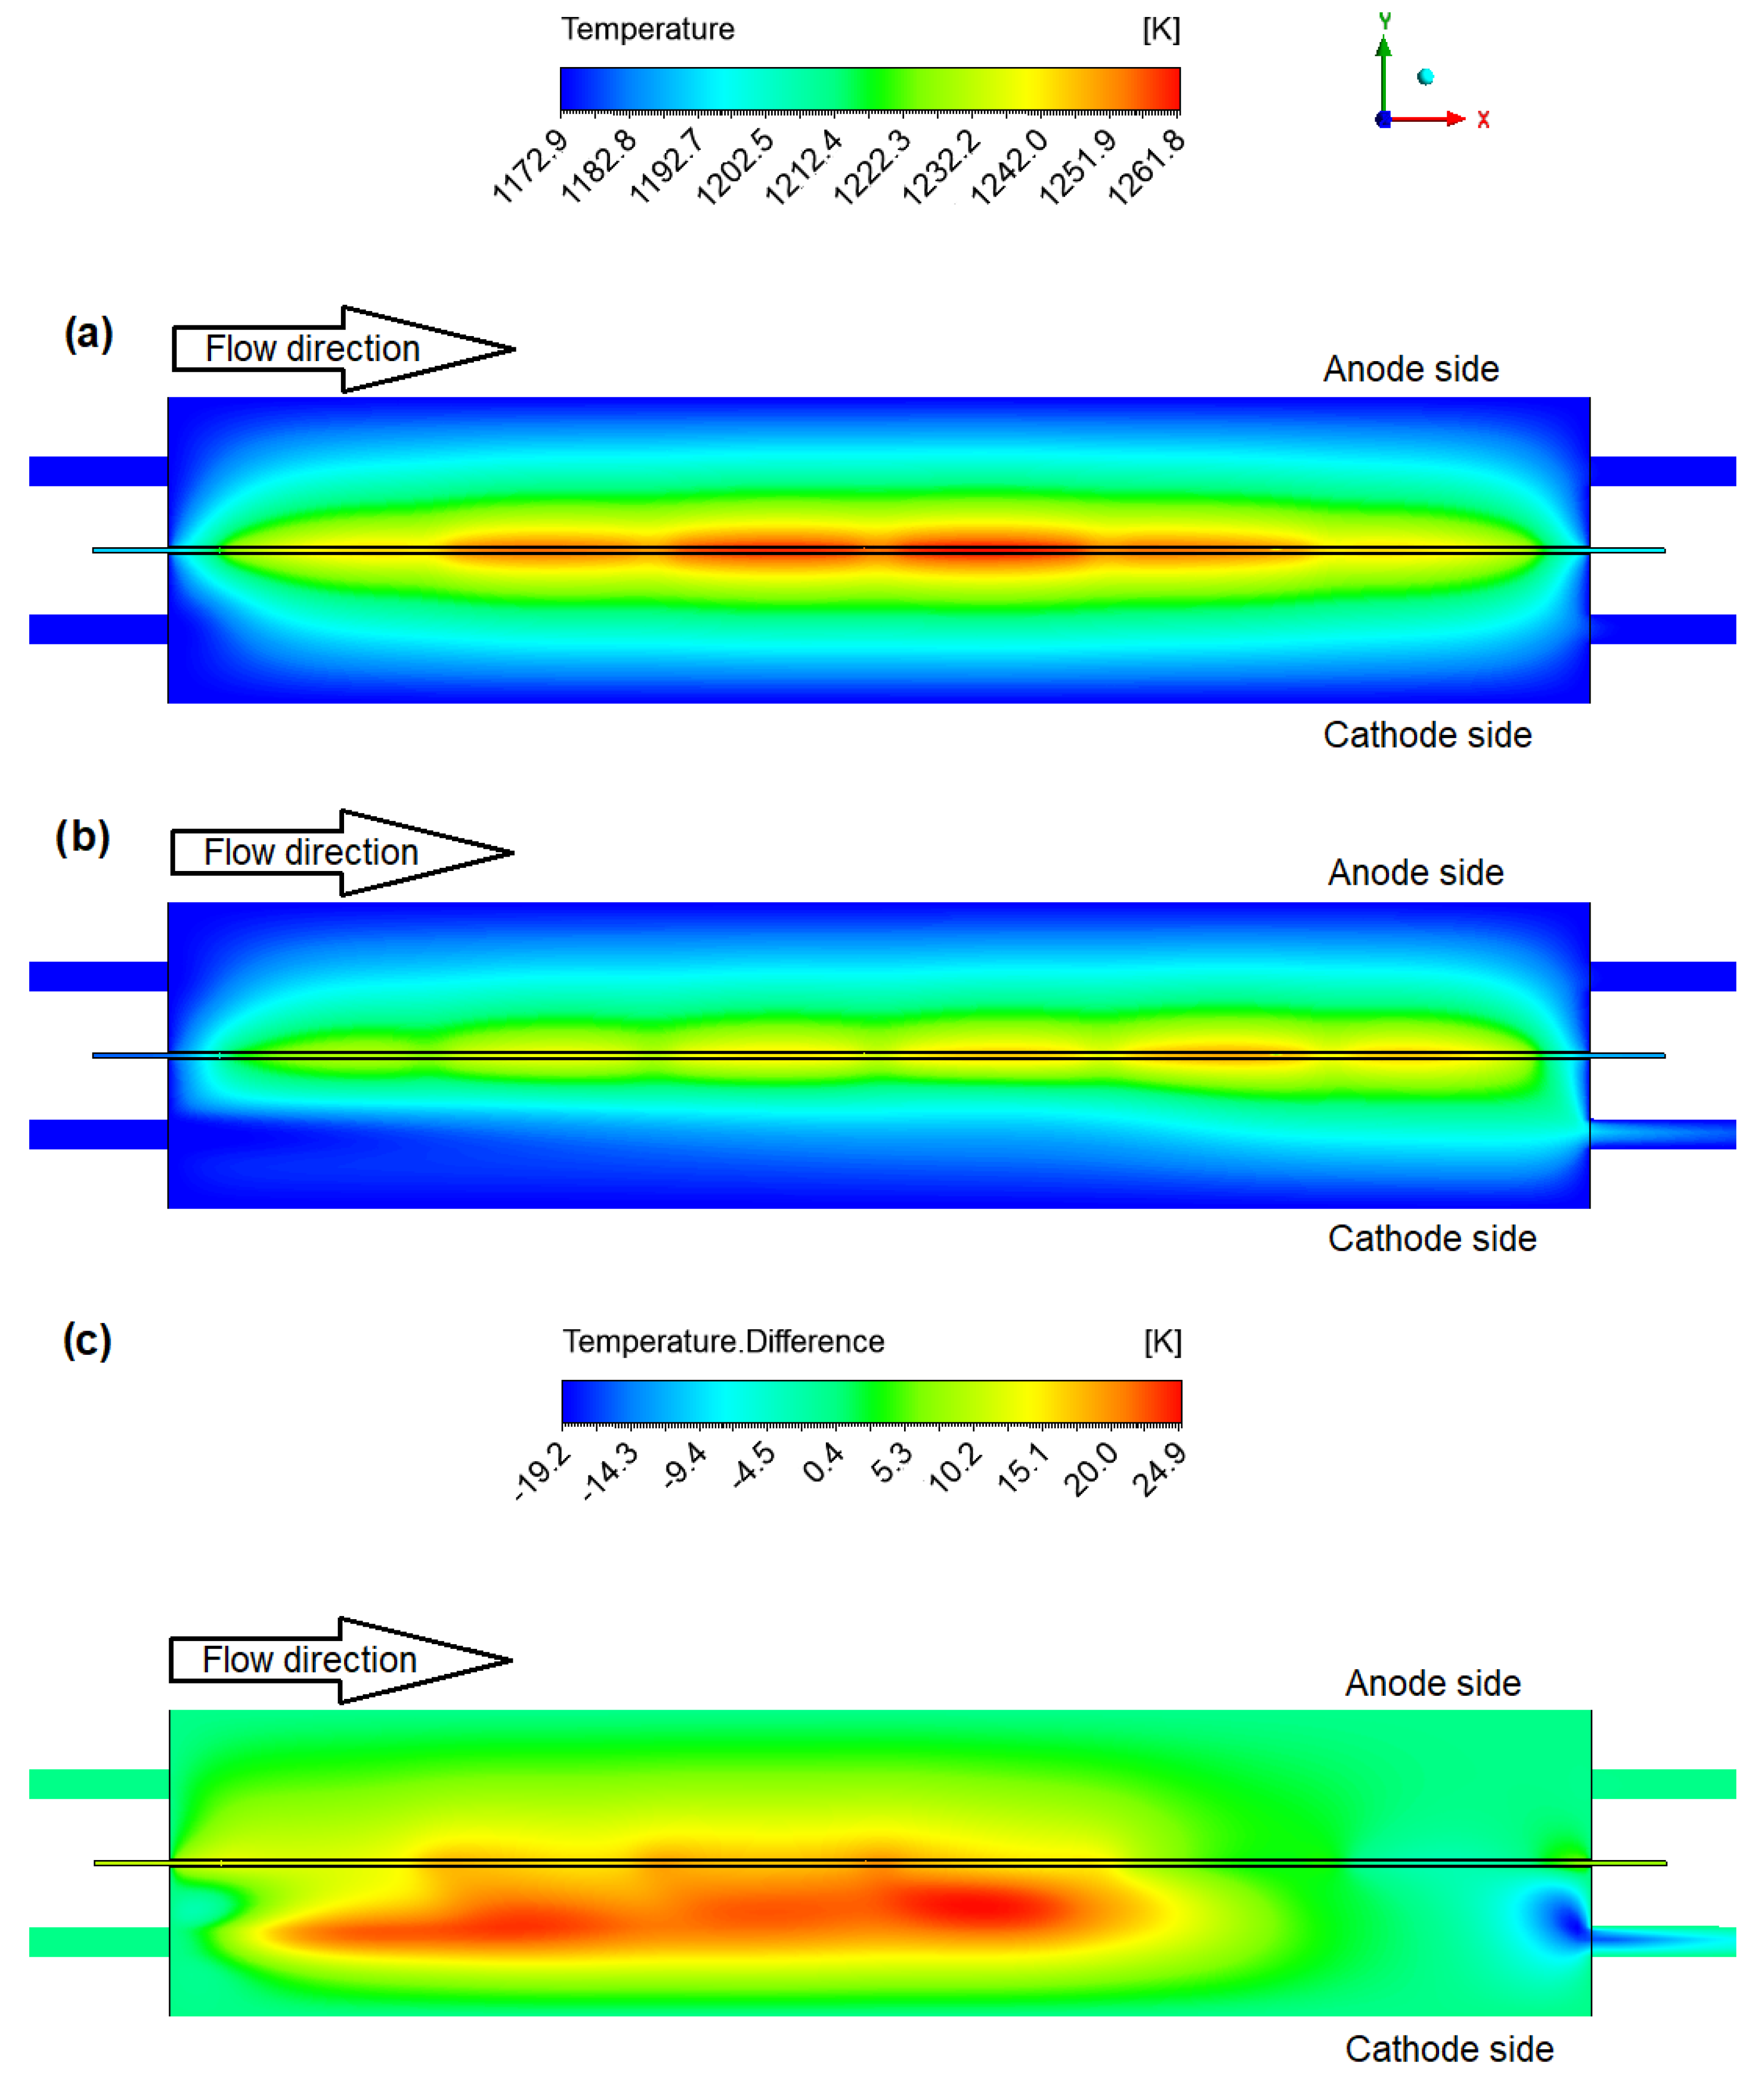
Figure 10.
Comparison of current–voltage and current–power characteristics of four different designs, with a bar plot illustrating the power density peak of each. Design marks (a, b1, b2, c) are consistent with geometries shown in Figure 2.
Figure 10.
Comparison of current–voltage and current–power characteristics of four different designs, with a bar plot illustrating the power density peak of each. Design marks (a, b1, b2, c) are consistent with geometries shown in Figure 2.

Figure 11.
The temperature distribution comparison of peak power point of each inspected geometry. Design marks (a), (b1), (b2), and (c) are consistent with geometries shown in Figure 2. The cases (a), (b1), and (b2) are co-flow formed, and flow direction determines the x-axis. The (c) case cross-flow is shown in Figure 3. Distribution is located along the channels’ symmetry plane.
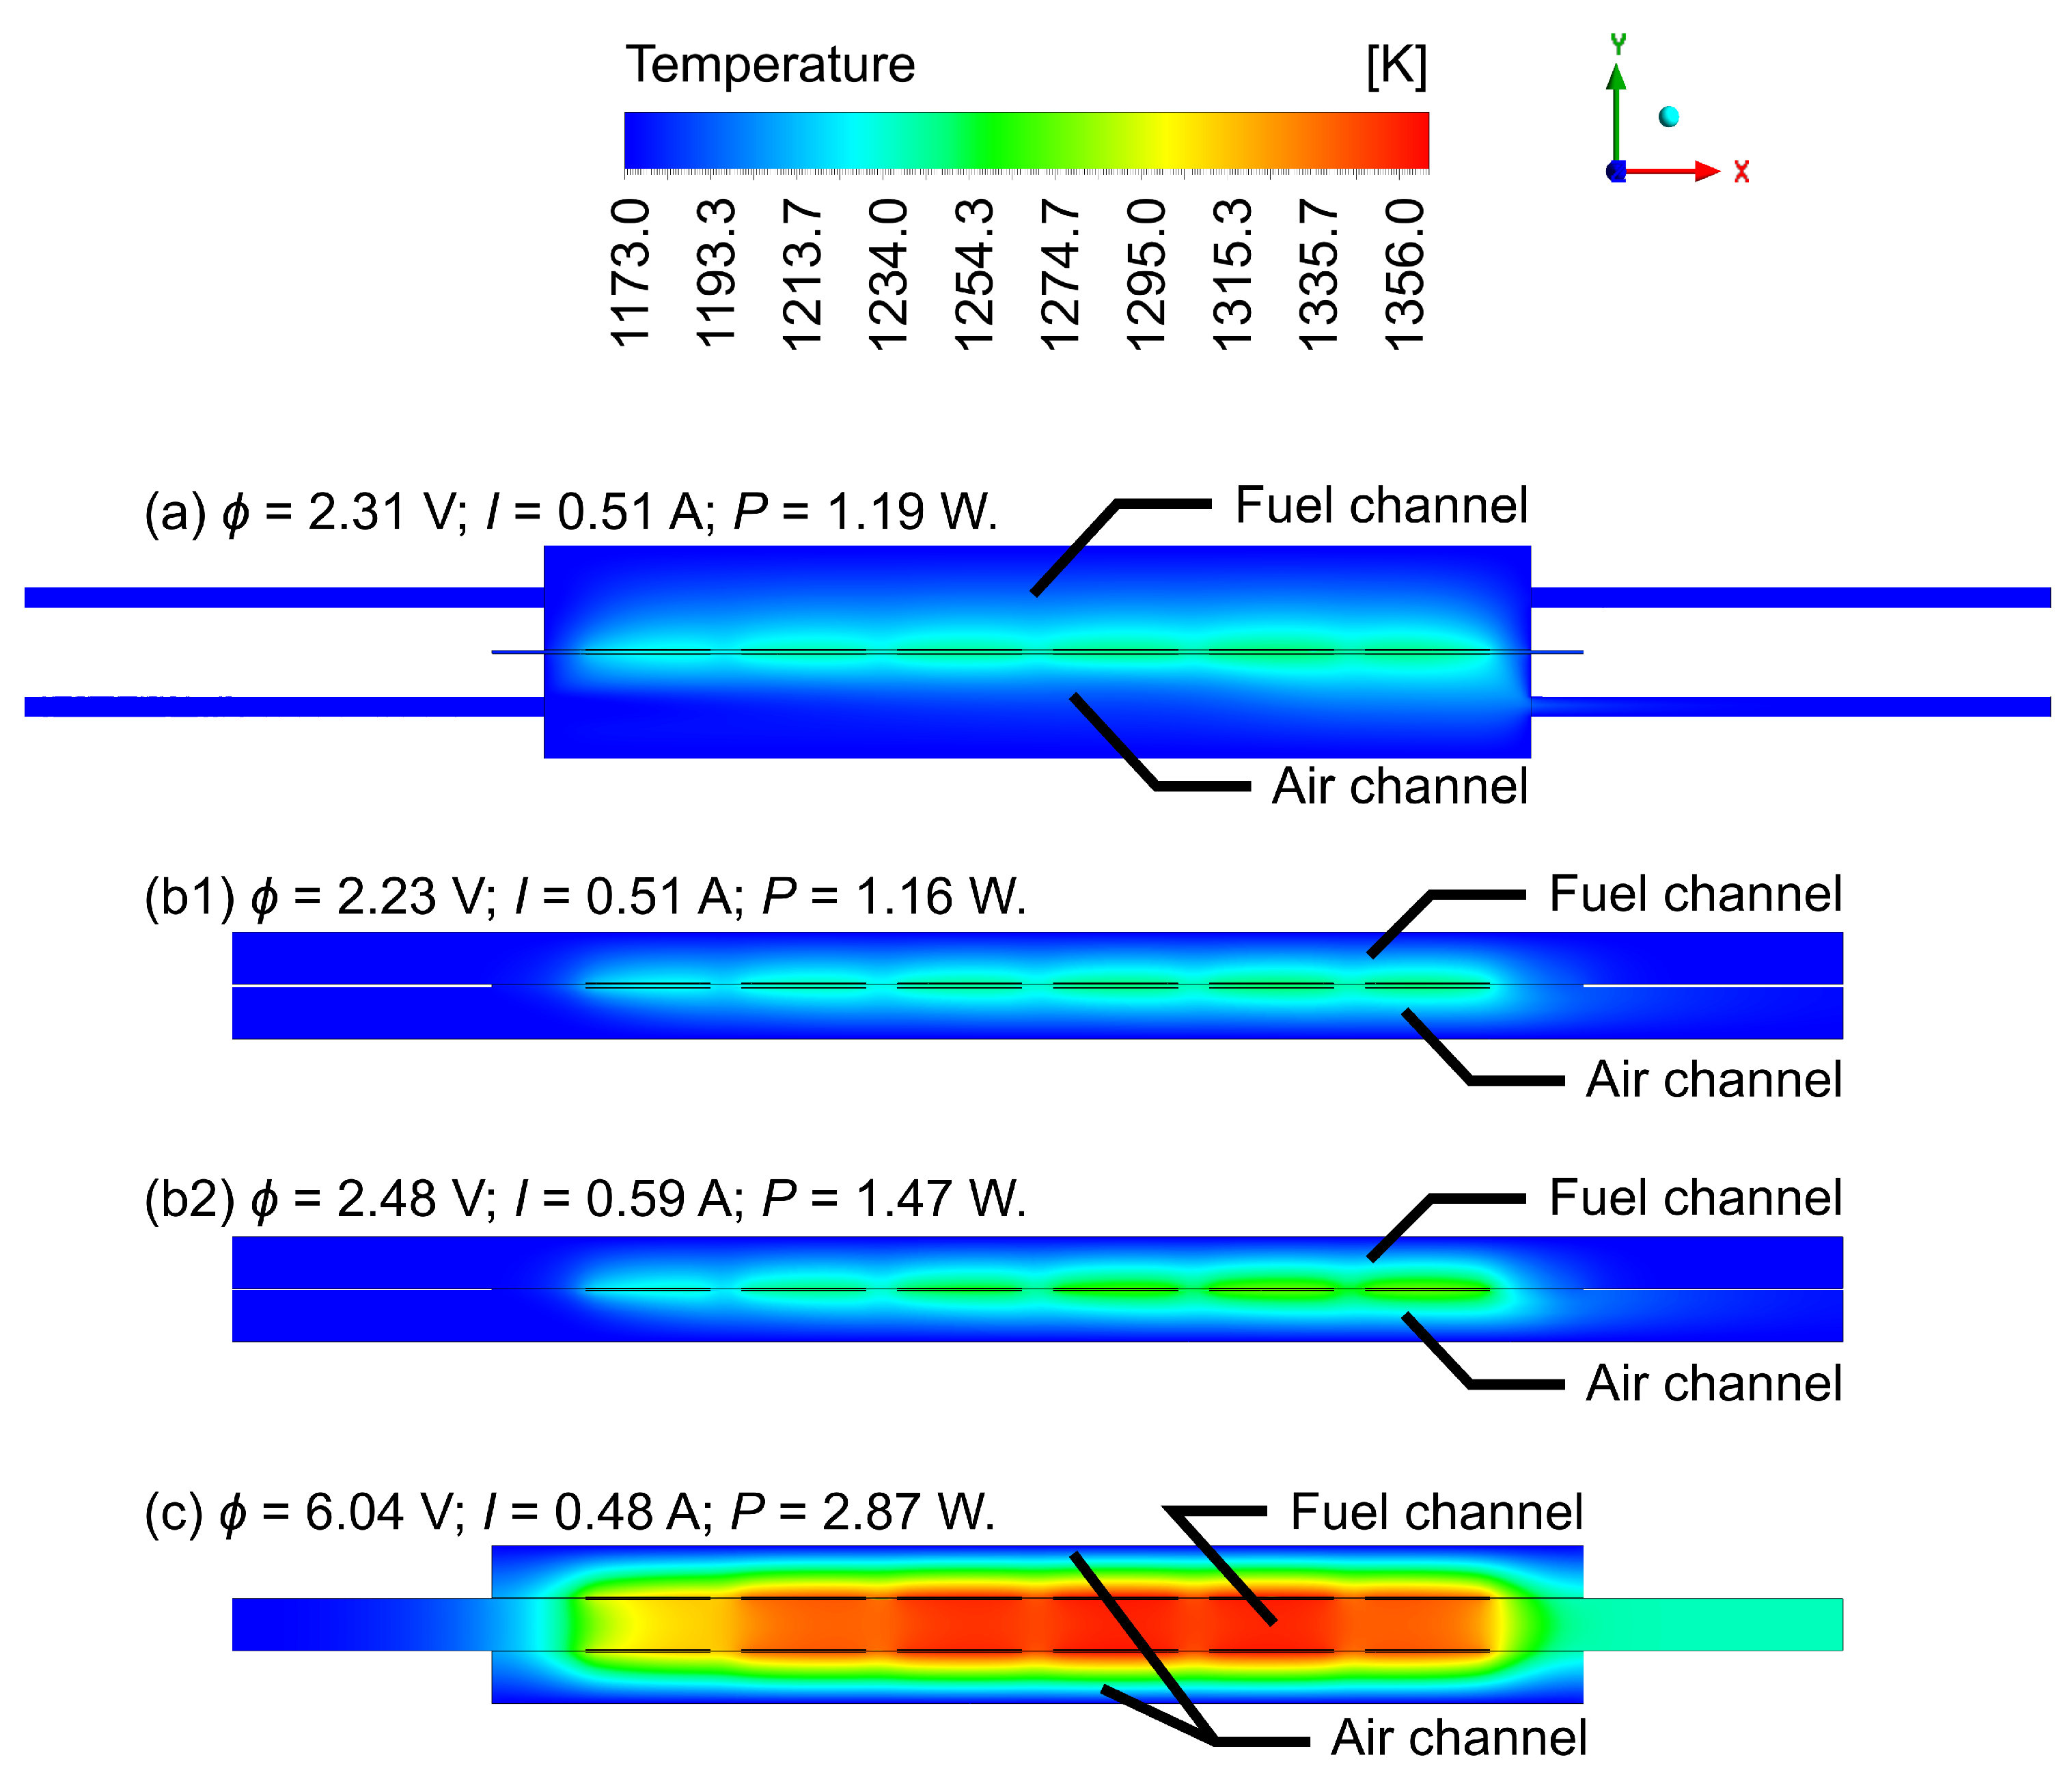
Figure 12.
The hydrogen mass fraction distribution comparison of peak power point of each inspected geometry. Design marks (a, b1, b2, c) are consistent with geometries shown in Figure 2. The cases (a, b1, b2) are co-flow formed, and flow direction determines the x-axis. The (c) case cross-flow is shown in Figure 3. Distribution is located along the channels’ symmetry plane.
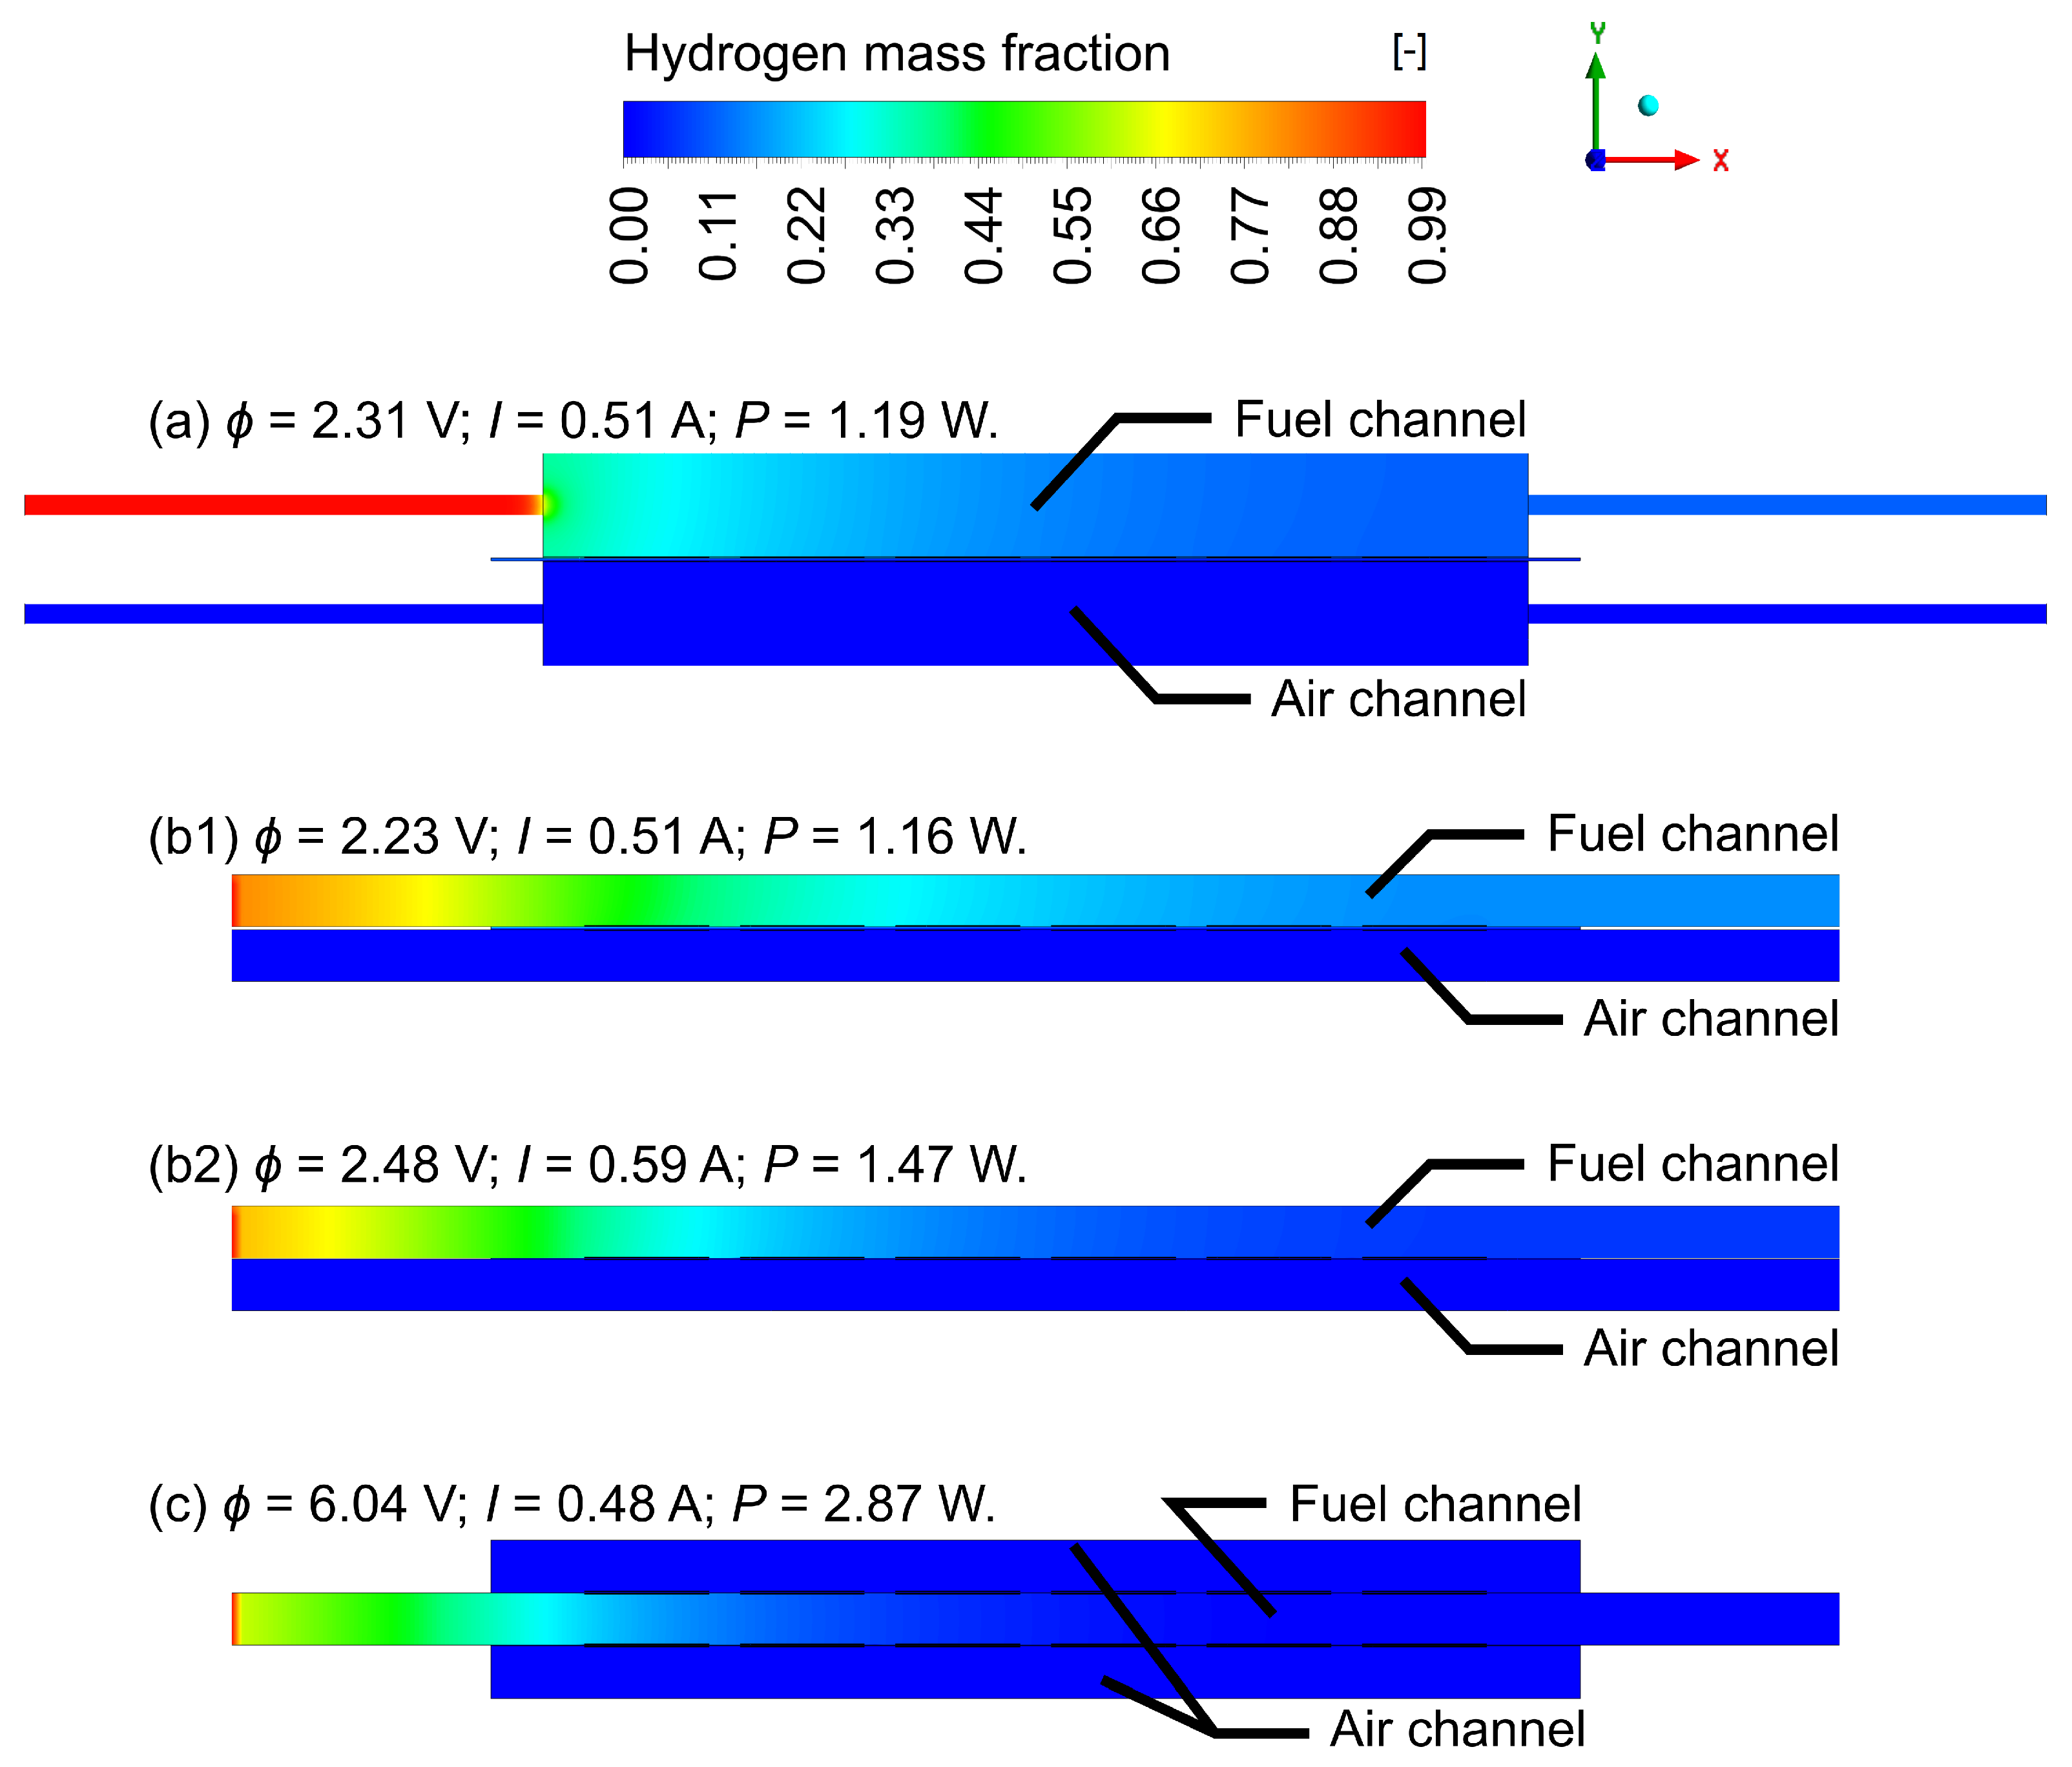
Figure 13.
The oxygen mass fraction distribution comparison of peak power point of each inspected geometry. Design marks (a, b1, b2, c) are consistent with geometries shown in Figure 2. The cases (a, b1, b2) are co-flow formed, and flow direction determines the x-axis. The (c) case cross-flow is shown in Figure 3. Distribution is located along the channels’ symmetry plane.
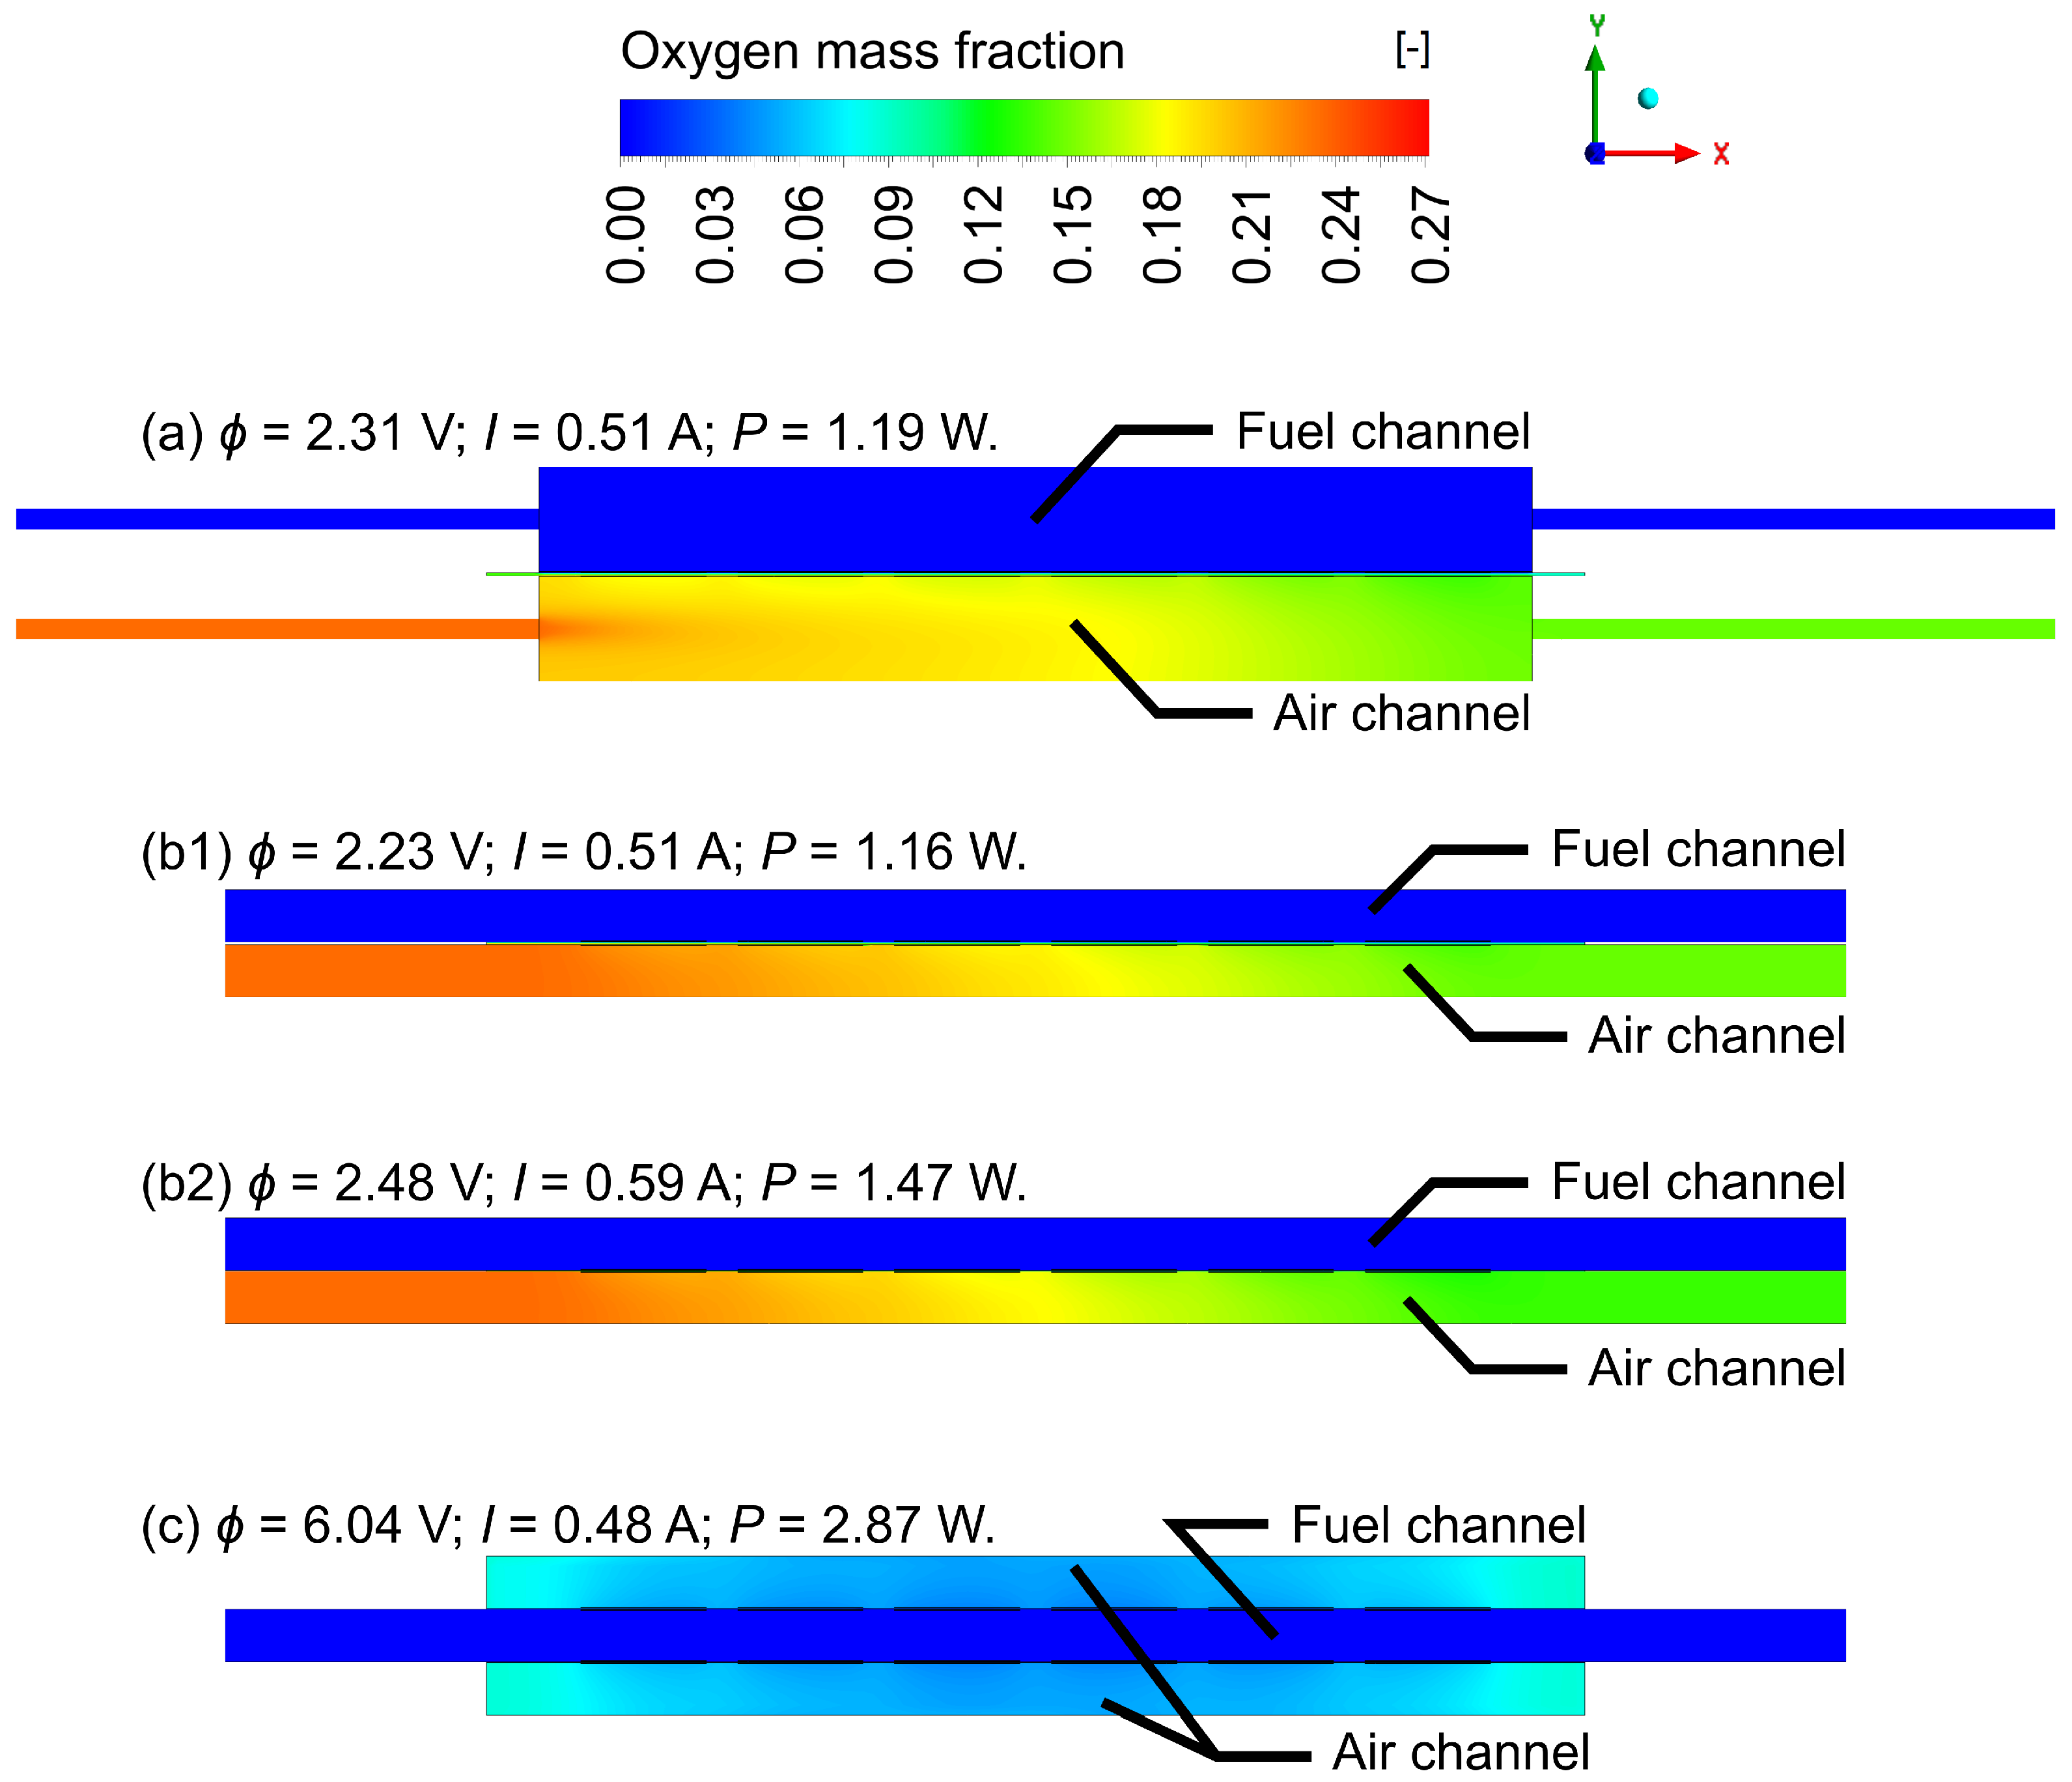
Figure 14.
The water vapor mass fraction distribution comparison of peak power point of each inspected geometry. Design marks (a, b1, b2, c) are consistent with geometries shown in Figure 2. The cases (a, b1, b2) are co-flow formed, and flow direction determines the x-axis. The (c) case cross-flow is shown in Figure 3. Distribution is located along the channels’ symmetry plane.

Table 1.
Boundary conditions applied for all cases studied in this section, with the distinction between cases studied in Section 4.1 and Section 4.2.
Table 1.
Boundary conditions applied for all cases studied in this section, with the distinction between cases studied in Section 4.1 and Section 4.2.
| Parameter | Description | Value |
|---|---|---|
| Applied: Section 4.1 for case “(a)” | ||
| Air inlet flow rate | constant value | 0.2 |
| Fuel (hydrogen) inlet flow rate | constant value | 0.2 |
| Applied: Section 4.1 for case “(b)” and all cases in Section 4.2 | ||
| Air inlet flow rate | constant value | 2 |
| Fuel (hydrogen) inlet flow rate | constant value | 1 |
| Applied: all cases | ||
| Inlets temperature | constant value | 1173 |
| Outer walls temperature | constant value | 1173 |
| Outer walls gas leakage | constant value | 0 |
| Air outlet temperature | constant value | 1173 |
| Fuel outlet temperature | constant value | 1173 |
| Air outlet pressure | constant value | 1 atm |
| Fuel outlet pressure | constant value | 1 atm |
| Anode current collectors external contact | constant potential value | 0 |
| Cathode current collectors external contact | constant current value | range 0–0.63 (case dependent) |
| Solid bodies outer walls current leakage | constant value | 0 |
Disclaimer/Publisher’s Note: The statements, opinions and data contained in all publications are solely those of the individual author(s) and contributor(s) and not of MDPI and/or the editor(s). MDPI and/or the editor(s) disclaim responsibility for any injury to people or property resulting from any ideas, methods, instructions or products referred to in the content. |
© 2023 by the authors. Licensee MDPI, Basel, Switzerland. This article is an open access article distributed under the terms and conditions of the Creative Commons Attribution (CC BY) license (https://creativecommons.org/licenses/by/4.0/).
Share and Cite
MDPI and ACS Style
Śreniawski, K.K.; Moździerz, M.; Brus, G.; Szmyd, J.S. Transport Phenomena in a Banded Solid Oxide Fuel Cell Stack—Part 2: Numerical Analysis. Energies 2023, 16, 4512. https://doi.org/10.3390/en16114512
AMA Style
Śreniawski KK, Moździerz M, Brus G, Szmyd JS. Transport Phenomena in a Banded Solid Oxide Fuel Cell Stack—Part 2: Numerical Analysis. Energies. 2023; 16(11):4512. https://doi.org/10.3390/en16114512
Chicago/Turabian StyleŚreniawski, Karol K., Marcin Moździerz, Grzegorz Brus, and Janusz S. Szmyd. 2023. "Transport Phenomena in a Banded Solid Oxide Fuel Cell Stack—Part 2: Numerical Analysis" Energies 16, no. 11: 4512. https://doi.org/10.3390/en16114512
Note that from the first issue of 2016, this journal uses article numbers instead of page numbers. See further details here.