Review

Lessons Learned from Positive Energy District (PED) Projects: Cataloguing and Analysing Technology Solutions in Different Geographical Areas in Europe

1
Department of Civil Engineering and Architecture, University of Catania, 95100 Catania, Italy
2
VTT Technical Research Centre of Finland Ltd., P.O. Box 1000, FI-02044 Espoo, Finland
*
Author to whom correspondence should be addressed.
Energies 2023, 16(1), 356; https://doi.org/10.3390/en16010356
Submission received: 15 November 2022 / Revised: 18 December 2022 / Accepted: 22 December 2022 / Published: 28 December 2022

Abstract

:
A Positive Energy District (PED) is a portion of urban area with defined boundaries that can produce energy in excess of its own consumption. The aim of this study is to analyse design variations among the six projects (12 case studies) of PED belonging to the European Smart Cities and Communities programme. Thus, it will be possible to identify the reasons behind the energy choices related to generation, storage and distribution that appear in the different geographical areas. To achieve this, different data were collected by consulting official documents and creating questionnaires that were communicated with the project representatives. Thus, the result of this study is a catalogue of the energy system solutions adopted in the studied PEDs with a critical analysis of the different motivations behind them in order to outline general trends in the geographical areas with similar characteristics. In conclusion, this study defined which technological choices are the most common in territories with similar profiles and how divergent those with different profiles are. Furthermore, applied to a large catalogue of PED, the methodology identified would make it possible to create different operating models for different territorial types and urban settlements.

1. Introduction

In recent decades, climate change and the resulting climate crisis, caused mainly by carbon dioxide emissions, have led states to implement plans, agreements and mitigation methods to counter the consequences of this crisis [1,2,3,4,5]. One of the methods of counteracting these consequences is the commitment made by states through the 2015 Paris Agreement (during COP 21) to achieve a transition towards carbon neutrality [6,7,8,9,10,11].
The term ‘towards carbon neutrality’ refers to the commitment to undertake a profound and systematic change in our urban, industrial, infrastructural and energy realities in order to reach a state of net-zero carbon dioxide emissions within a short period of time [11,12,13,14,15].
In largely anthropised territories, such as Europe, it was necessary to think about readjustment and modification of existing urban areas [16,17,18,19]. For this reason, research organisations have sprung up to promote punctual retrofits and modifications initially at the building scale, with the development of projects such as nearly-Zero Energy Buildings (n-ZEB) [20], Net-Zero Energy Buildings (NZEB) [21], Zero Energy Buildings (ZEB) [21] and Positive Energy Buildings (PEB) [22]. Then, development moved to the district scale with the Retrofitted Energy District (RED) [23,24], the Net-Zero Energy District (NZED) [25], and up to the most innovative solution currently being implemented, the Positive Energy District (PED) [26,27].
The PED is developed as an evolution of the Positive Energy Buildings (PEB) and Neighbourhood (PEN) [28] themes and is part of the green conversion of urban areas [24].
A PED is an urban area with defined boundaries that generates more energy from renewable sources in a year than it consumes [23,24]. There are different types of PEDs (autonomous, dynamic and virtual) which, while maintaining common principles, have different operating characteristics [23]. Actually, each of these typologies has a different level of dialogue with the energy network outside their borders [23].
As the state of the art of district-scale energy communities, the concept is still under development. Given its derivation from previous concepts, there was no linear development of the concept, but a parallel study of many projects funded by EU grants or municipalities [29].
Actually, to facilitate the development of these realities and their related technologies, the European Union has promoted various research programmes. The idea is to promote different solutions that implement research and innovation concepts that accelerate this transition period [30,31,32,33,34,35,36,37,38,39]. These programmes include the JPI Urban Europe programme, the SCC1-H2020 programme [40], Annex83 (IEA-EBC PED analysis and investigation group) [27] and many independent projects. Therefore, different solutions and different PED prototypes were developed. However, application and design methodologies are still being developed and, to date, the authors of this study are aware of the existence of archetypal models for different geographical/climatic areas or urban contexts. In order to contribute to the development of this area of investigation, this study aims to create an initial catalogue of technological and design solutions with a small sample of comparable case studies. Specifically, it intends to analyse the design variations between the PEDs, as they are in different geographical areas and provide a methodology to expand the model catalogue in the future. To achieve this, it was decided to use as a sample for analysis the experiences of PED present in the EU Smart Cities and Communities SCC1-H2020 programme [41].
The programme Smart Cities and Communities SCC1-H2020, referred to in this study, is ascribed to this contest of stimulating research into the modification of urban centres in the direction of a move Towards Carbon Neutrality [42,43,44]. This programme was created with the aim of proposing innovative development solutions and urban models that are best suited to the needs of today’s current reality. Although not all the projects within it are related to PEDs, (as the main focus is on smart cities), there are six projects with this definition. Of these, many case studies (within these six projects) also share membership of the JPI Urban Europe programme. This is the reason why SCC1-H2020 programme was selected. Projects that did not have a declared PED membership were discarded in order to make the data easily comparable. Furthermore, in the projects analysed, a distinction was made between projects that were implemented or are in the process of being implemented (lighthouse cities) that serve as a model for other urban centres interested in this type of transition and that replicate the experience proposed by the lighthouse cities (fellow cities). This study took into account only the lighthouse cities of the PED programmes within SCC1-H2020, as projects are customisable on them, many are in the implementation phase and consequently have more data available.
To sum up, among the programmes that have addressed the PED topic, SCC1-H2020 was selected and only the six projects defined as PEDs were selected. Having selected only the lighthouse cities of the six projects, 12 case studies (two per project) were identified. Each of them had a variable number of districts within it, so in the end, 25 different district were analysed, thus providing a sufficiently large catalogue to study the results and obtain representative models to refer to [41].
Thus, this study presents a novelty in this field as it opens up a whole strand of research on the characterisation of PEDs under varying climatic, geographic and urban layout conditions.

2. Literature Review

As already mentioned in the previous chapter, PEDs are part of the larger process of changing territories to enable progressive decarbonisation and counter the climate crisis and its consequences. An updated and newly created form, PEDs derive from antecedent types of energy communities such as PEB and PEN [24]. The concept of a PED has recently gained ground as the most energy-efficient and effective district-scale area if properly planned [45]. A PED is an urban area with defined boundaries that generates more energy (electricity, heat and cooling) within their borders from renewable sources in a year than it consumes [46].
The PED concept is mainly located in Europe, as the European Community has financed many projects and programmes to follow the development of this concept. These include the Strategic Energy Technology Information System (SETIS-SET Plan) [47] and the Cooperation in Science and Technology (COST Action/CA19126) [48], which cooperate with various programmes to ensure the development of the DPE concept and foster networking among researchers working in this field. In addition to the SET Plan and COST Action, there is the ANNEX83 building and community energy technology collaboration programme [27]. Among the objectives of these plans is to promote the development of at least 100 PEDs on European soil by 2025 (in which the JPI Urban Europe and SCC1-H2020 programmes fit in).
For the successful operation of PED, various aspects such as technological, environmental, economic, social and spatial must be taken into account [49]. In addition, besides the correct energy balance, other objectives are also considered during the planning of these districts. These are not mandatory for the proper functioning of PEDs, but pursuing them brings long-term improvements to the district [49]. It is precisely the non-compulsory nature of these objectives that has led to projects pursuing one or more objectives with different compositions. These objectives include zero emissions, energy efficient, carbon free and many others [49].
For the proper functioning of PEDs, the technologies required include all those capable of generating or storing electricity or heat from renewable energy sources. This can be done by integrating them at the building scale, at the district scale or even by decentralising their production and storage of electricity outside the district boundaries [50]. In addition to these technologies, there are also those related to modifying the transport infrastructure using E-mobility [50]. However, an electrification of transport expands the demand for electricity accordingly [51]. Therefore, the main sources of energy demand, which the PED will have to provide for, will be buildings within the district boundaries and e-mobility [26]. The choice of which technologies to use, and whether to centralise them within the district boundaries or relocate them, depends on various factors, such as climate, availability of infrastructure, the type of district in which the intervention is to take place, any historical, cultural or landscape constraints, the urban fabric, the presence of previous programmes or interventions involving the city or region, the spatial conformation and the availability of various energy supplies [46]. According to the set of choices and to the autonomy or connection with the rest of the territory and infrastructures, three different models of PED are mentioned: autonomous, dynamic and virtual PED [23]. A PED is defined as a portion of an urban area that has defined boundaries where its own energy production from renewable energy sources is higher than its own energy demand on an annual basis. In the following figures, electricity and heat generation and storage solutions are identified as ‘solutions’. Whereas, e-mobility has been included as ‘demand’ (along with buildings), due to its energy-consuming nature.
Figure 1 presents an autonomous or self-sufficient PED: in this type of PED, energy export is foreseen. However, no type of import from an external energy grid or district heating/gas network takes place [23], which is the reason why the connection to the electricity grid is absent from the picture (to conceptualise the complete autonomy of the district).
Figure 2 presents a dynamic PED. In this type of PED, both energy import and export are foreseen, communicating with external energy grids or district heating/gas networks and other PEDs [23].
Figure 3 presents a virtual PED: In this type of PED, the energy generation and storage is within its physical boundary and beyond [23].
From a technological point of view, for the production of electricity, solar, wind, hydro, geothermal and biomass technologies can be used (the latter two are very often used for the direct production of heat). For the production and distribution of heat and cooling, the most frequent technologies are the district heating network (DHN), waste heat, bio-combined heat and power (Bio-CHP), heat [ump (both district and building integrated) and those using hydrogen fuel. The storage of heat and electricity (both feasible at district scale and building-integrated, only the electrical storage can be developed outside the district borders) and E-Mobility for both public and private vehicles [52,53,54] must be added to these technologies.
During the design and implementation phases of PEDs, analyses and tests are required to prove the effectiveness and efficiency of the identified solutions [55]. For this reason, many simulations are carried out. These simulations can be energy, mobility, indoor and/or outdoor comfort simulations. Different simulation tools can be used [55]. Due to the great contribution that simulations make to the correct development of PEDs, various projects soon started to implement Digital Twins [55]. Digital Twins refers to the creation of a digital model, in this case a recreation of the district on which it is to operate, with the intention of monitoring, modelling and optimising a complex, multidisciplinary system based on a real-time large dataset [55,56,57]. The use of this method would make it possible to create a better, more liveable environment for the population and better manageable. However, for the proper functioning of the Digital Twins, different tools and the joint use of machine and artificial intelligence are required [55].
Additionally, due to a fragmentary and parallel development and the recent development of this type of energy community, the development of this concept often changes as the project varies, since there are no guidelines to follow for their design. This leads to different models and different combinations of technology and intentions that often differ even in similar contexts. This study is framed precisely in this context, trying to begin to define models of functioning in different climatic and geographical contexts.

3. Materials and Methods

This study was designed to define similarities and dissonances in design and technology choices in PEDs located in different contexts. In order to carry out the research, a step study was carried out, as shown in Figure 4. First, a literature review study on PEDs, Towards-PED, Energy Communities and renewable energy sources with all the related technologies (generation, storage, distribution and mobility) was carried out. This step, preliminary and preparatory for the subsequent steps, is necessary to develop sufficient knowledge of the topic to support further decisions and analyses. At the same time, a sample of case studies on which to carry out the analysis was selected. First, the Smart Cities and Communities SCC1-H2020 Programme was selected both for its relevance to the theme of urban transformation and for the focus of some projects on the theme of energy communities. Among the various projects, a selection was made, choosing only those that defined themselves as PEDs. In fact, the focus of the SCC1-H2020 programme is smart cities and not specifically PEDs, so only a few projects fit into the criteria selected. Six projects were identified with a varying number of case studies divided between lighthouse and fellow cities. The lighthouse cities of the PEDs participating in SCC1-H2020 were chosen to be analysed, as they are the most representative case studies of the projects. Each of these cities (12 in total) had several districts, so 25 different districts were catalogued.
Once the research preparation phase was completed, the first results were obtained. Using the knowledge obtained from studying the literature review, it was possible to create a summary diagram of the main technological choices in different typologies of PEDs. This step is important as this diagram will serve as a basis for the analysis of the next steps. The next step was the data collection. Starting from literature review and the experience gained from the authors’ participation in Annex83, a questionnaire was created to provide a full description of the technological operation of various types of PEDs. Data were collected on the following: the scale of intervention, the number of districts for lighthouse cities, the area involved in metres square, type of settlement, spatial features, information on the population involved in the project and settled in general in the city and the territory, information on energy generation system, storage, mobility and renewable energy sources. The questionnaire was filled in either by using the literature review sources as references and by submitting it to the project l representatives and conducting interviews with them to validate the information already identified in order to collect data on the capacity of the single technologies used and to understand the difference between the design and monitoring phases. This step is important as made it possible to understand the functioning of the individual districts.
The last step concerns the production of results and their analysis. Starting from the data collected from the questionnaires, the information was reorganised to create a catalogue of the technological choices and objectives pursued by the various case studies. Finally, the same data were reformulated graphically, based on the summary diagram created in the second step. The end result is three diagrams representing the technological choices in different climatic contexts. Following this method, therefore, made a critical analysis of the different approaches in the design of PEDs possible and made it possible to draw a preliminary trend on the development of different models under varying geographical and urban conditions.

Materials

The Smart Cities and Communities SCC1-H2020 Programme, linked to the Paris Agreement of 2015 from COP 21 (which among other objectives aims to limit global warming to well below two, preferably to one point five degrees Celsius, compared to pre-industrial levels), was developed to promote the development and transition to Smart Cities (involving aspects of urban planning, energy, facilities, social, economic and market) across Europe [10,11]. The aim of this programme is to propose models of development and modification of cities as an alternative to the current urban area model [29]. With the idea of promoting the development of Smart Cities, the issue of PEDs was not always addressed by the programmes involved, while wishing to analyse in this study the data obtained from lighthouse cities with declared ambitions towards the implementation of PEDs, only the latter will be taken into account [41]. Figure 5 shows the geographical location of the PEDs that are part of the SCC1-H2020 [4].
A total of six declared PED programmes (Sparcs, RESPONSE, Atelier, MAKING-CITYMAKING-CITY, +CityxChange and POCITYF) were identified within which each contains two case studies selected to be lighthouse cities [41,46]. The distribution of lighthouse cities per country is as follows: three lighthouse cities are located in Finland, one in Norway, one in Ireland, three in The Netherlands, one in Germany, one in France, one in Spain and one in Portugal.
Each city has a variable number of districts within it (from one to six). Therefore, 12 case studies with a total of 25 districts as lighthouse districts were identified. Each district differs in its location and design choices. Table 1 shows the distribution of the lighthouse cities in each project.
General data on climatic, spatial, urban, infrastructural and renewable energy characteristics were collected and compared with the information obtained from the individual districts through bibliographic sources and by submitting specially created questionnaires to representatives of the individual projects, and the results were grouped under the Lighthouse Cities to which they belonged. The information obtained was then organised according to the climate category of the Köppen Climate Classification to which they pertained [105,106,107]. This systemisation of information according to the climatic class is due to the different requirements that urban centres face as a result of their climatic situation. Four climate classes were identified: Dfb—warm summer humid continental climate, Dfc—subarctic climate, Cfb—temperate oceanic climate and Csa—hot summer Mediterranean climate. Due to the few case studies analysed and the similarities between Dfb and Dfc, it was decided to take into account the macroclasses: continental climate, oceanic climate and Mediterranean climate [105,106,107]. Figure 6 shows the Köppen climate classification map and the class of the cities examined.
Each city has made different technological, social and spatial planning choices according to its characteristics, needs and implemented policies. Espoo (the only case study without a defined historical centre) chose one in an existing area, and one in a new built-up area, such as lighthouse districts, with the aim of turning them into mobility, social and economic nerve centres of the city [108,109]. Turku developed a student village (thus paying particular attention to social and economic aspects) in a partially built-up area [110]. Oulu has placed the district in a partially built-up area [85]. Trondheim’s is near the city centre in a very important city snood [84,92]. Amsterdam has decided to place several districts across the city [71,97]. Bilbao (the only one that chose to implement an autonomous PED) has designed its district within an island inside the city [71]. Alkmaar chose to implement two prototypes, one in an almost totally built-up area close to the historic centre, the other in a peripheral expansion area [97]. Leipzig placed its district in a densely built-up area outside the historic centre in an expansion area [62,108]. Dijon has placed its district in a wide, partially built-up area away from the city centre [65]. Limerick has chosen as its PED its city centre and a peripheral area [86]. Groningen’s, on the other hand, is in an almost totally built-up area, making a distinction between Groningen south and Groningen north [85]. Evora has chosen to implement three different districts in three totally different contexts: the city centre, an industrial area in a city expansion zone and a neighbouring village that we could define as the inner-city area of Evora [97].

4. Results

Starting from the literature review, the data provided by the JPI Urban Europe catalogue and the experience gained within Annex83, one of the first results of this study was the creation of a model summarising the functioning of the three PED models from a technological point of view. This model was useful both to get a general picture of how PEDs work, but also to have a catalogue of the technologies used and usable in the different areas (production, storage, distribution and mobility) and their scope of application. Figure 7 shows the diagram of the main technological choices of a PED in the three variants: autonomous, dynamic and virtual. The model was created by taking into account the functioning of the three types of PEDs and maintaining the distinction between energy supply and energy demand. For energy supply, the production and storage of electricity and heat in a virtual, district and building-integrated manner was considered. There is also a connection to the electric grid and the district heating network. For energy demand, buildings within the district and mobility were considered.
Once the functioning of the various models had been described and the technology catalogue created, the next step was to create a questionnaire (Appendix A). This was created on the basis of the lessons learnt during the creation of the summary diagram and the literature study. The aim was to be able to describe in as much detail as possible the needs and technological choices identified as solutions by the individual districts. Once completed, 12 questionnaires (one for each case study) were filled in both using the literature review and by conducting interviews with the project representatives.
Starting from these premises, the choices made by the individual cities were analysed and grouped into technical choices and objectives pursued so that the overall picture of their design choices and objectives could be compared. In addition, the cities were grouped by climate class (based on the Köppen climate classification), so as to be more evident as to the presence (or absence) of a leitmotif in the choices as the climate changes. Figure 8 shows the results obtained from the collection of these data.
Please refer to the “Discussion” section for a detailed analysis of this figure. To better analyse the technological choices and understand which ones were the most recurrent, the data obtained were reorganised and a diagram was created to show the order of preference of the various technologies. Referring to Figure 9, the number of technology selections in the case studies, with reference to the total number of 12, selections are as follows: solar 12, wind 1, hydrogen 1, geothermal 8, bioenergy 6, waste heat 7, electrical storage 8, heat storage 7, e-mobility 11, heat pumps 8, district heating network 10, combined heat and power 4 and hydroelectrical 0. Thus, this table made it clear which technologies are the most used and at the same time which are the least used or even discarded.
Having collected all the necessary data, it was then possible to take the summary diagram of the main technological choices (Figure 5) in order to create three different models describing the different climate zones identified. It would be logical to conclude with a scheme summarising the main technological choices made by districts in different parts of Europe. Following the cataloguing and systemisation of the case studies examined, three schemes were derived from the identified climate macro-classes that describe the main technological choices in different climates, as it is one of the factors that most influences energy needs and renewable energy source availability.
Starting from the diagram of the main technological choices, Figure 10 shows the summary diagram of the most frequently used technological choices in Continental climates. A dynamic PED model was selected. For heat production, waste heat, bio-combined heat and power (only at the district scale), the district heating network and heat pumps (also in building integrated form) were selected. For electricity production, bioenergy (which will be used to provide electricity for heat production) and photovoltaic panels (both at the district scale and integrated in buildings) were selected. These other solutions are planned: electricity and heat storage (at the district scale and integrated in buildings) and E-mobility.
Figure 11 shows the summary diagram of the most frequently used technological choices in continental climates. A dynamic PED model was selected. For heat production, the district heating network, heat pumps (at district scale and in building integrated form) and geothermal energy were selected. For electricity production, photovoltaic panels (at the district scale) were selected. These other solutions are planned: electricity and heat storage (at the district scale), E-mobility.
Figure 12 shows the summary diagram of the most frequently used technological choices in Mediterranean climates. A dynamic PED model was selected. For heat production, heat pumps were inserted only at the scale of the building. For electricity production photovoltaic panels (both at the district scale and integrated in buildings) were selected. These other solutions are planned: electricity (at the district scale) and E-mobility. There is no district heating network.
These models, therefore, make it clear, even graphically, what the similarities and differences in technological solutions are in geographical areas with different climatic requirements.

5. Discussion

Project choices were influenced by geographical, political and economic reasons. An example of this is the city of Espoo, which (in addition to the Smart Otaniemi programme) joined the Sparcs programme following the city’s adhesion to the Covenant of Mayors and chose to buy renewable certified electricity [108]. It means that the city buys electricity from renewable sources (in this case mainly wind), as they are not implemented or implementable in inhabited areas. This is why Espoo is referred to as a virtual PED [108]. Leipzig, which has a history as an energy metropolis, decided to use solar thermal, as it already had a programme to implement this technology in the city [112]. This is a similar situation to Alkmaar, which integrated hydrogen technologies, as the city and region had previous development programmes [65]. The opposite choice is made by Groningen, which despite having a programme for the development of hydrogen technologies decided not to integrate them into the design of the PEDs.
An example of design choices made on the basis of particular geographical conditions is Bilbao, which, having chosen to develop its districts within the Zorrotzaurre Island, has opted for the development of autonomous PEDs [26].
From a geographical analysis of the lighthouse cities, these are mainly located in northern and central Europe. This distribution may be due to the fact that northern cities are better prepared (in optimisation, optimised planning process, design process, digitisations of city infrastructure and co-creation project) for the realisation of such projects. In addition, many municipalities in these areas already have sustainable energy planning offices, which are able to implement this type of project by connecting the various actors (technology producers, energy utilities and building developers) in the area. Another factor that would influence this distribution could be the greater number of start-ups and companies that already exist in the area and can guarantee a rapid design and realisation of the installations and companies that are able to guarantee the maintenance of the infrastructure over time.
Most of the districts opted for a dynamic PED, thus influencing the model forms used. Espoo, Amsterdam and Leipzig adopted a virtual PED, while Bilbao (having developed its district on an island) was the only one to design an autonomous PED. All the case studies analysed chose to use solar technologies, both at the district scale and integrated in buildings. Other frequent choices were E-mobility, heat pumps and the district heating network. The least used technologies are wind energy, hydrogen and hydroelectrical. In general, common and shared technological choices were observed. Deviations from the canonical choices were noted when the city examined already had development programmes for different technologies: for instance, Leipzig (Sparcs) chose to use solar thermal, because the city had a solar thermal implementation plan with a state subsidy, and Alkmaar (POCITYF) chose to use hydrogen fuel cell and hydrogen from biogas, because both the city and the region have a hydrogen programme [65,112].
Thus, when analysing the data from this study, it appears that there are significant differences between northern and southern Europe, both in terms of the distribution of case studies, that is decreasing moving from north to south, and in terms of the choices and objectives set. Moreover, it appears that solar energy generation mismatch also influences the choices on the type of the PED settlement system, as in cold climates, in order to overcome this problem and reach the thresholds necessary for the proper functioning of a PED, the virtual PED typology of settlement is more common in northern Europe [108,113]. This could be one of the reasons why there are more virtual solutions as the climate gets colder. However, this option can be effective, as the ultimate intention is to promote and foster a transition to renewable energy sources. Therefore, buying green electricity, instead of producing it independently, is a valid option for the functioning of the districts. When analysing all the examined case studies, it appears that there is no coordinated plan to manage the development of PEDs, but they are designed individually, adapting to the needs of the individual district being examined. However, to ensure their development on a large scale, in our opinion, it is necessary to promote the development of high-level planning and the creation of a prototype.

Critical Reflection on Technological Choices

As shown graphically in Figure 5 (and consequently in Figure 10, Figure 11 and Figure 12) a first distinction must be made between electricity and heat when discussing the technologies required for PEDs, and then a second, more detailed distinction must be made with technologies related to production, storage, distribution (of heat and/or cooling) and E-mobility. Taking into account, at first, only technologies for the production, storage and distribution of heat (and cooling), it can be said that these solutions are found more in the north than in the south of Europe. Heat pumps are preferred, either district or on a building level. This technology, in most cases, uses geothermal energy, especially if it is on a district scale. Other very frequent technologies are district heating networks, present in all cases surveyed except Evora. This could be due to the fact that, in Southern Europe, not all areas have developed infrastructural systems for heat distribution as a result of their lesser need for heat given their geographical and climatic location, and specifically, in Evora, where either gas by means of cylinders or heat pumps are used in most cases [114,115,116,117,118,119,120]. A very common technology for obtaining heat is waste heat, probably due to the wide availability industries and machinery that, as a result, produce heat [113,114,115]. In fact, many case studies study, apply or use it at district scale, such as Espoo, Leipzig, Alkmaar and Dijon. Less common, but still used technologies are combined heat and power (CHP), used by the case studies of Dijon, Espoo and Leipzig [119,120,121]. Finally, in the presence of active policies or programmes, previously uncommon technologies for PED were used in other realities, such as hydrogen fuel cell in Alkmaar and solar thermal in Leipzig [99,108]. For hydrogen this is probably because hydrogen was not convenient for the energy market at the time the study was conducted [122,123,124,125]. With the energy crisis and gas issues, the situation could change. If the focus on hydrogen, with the consequent implementation of the technologies necessary for its production and storage, increases and the price of equipment decreases, it could be a viable solution to replace gas, otherwise not. As far as solar thermal is concerned, however, this could be because, for many cities, this solution is not economically feasible or due to the absence in or near the cities themselves of companies that would easily allow installation and maintenance [126]. This would suggest that in order to implement this technology, it would first be necessary to promote the large-scale development of companies capable of guaranteeing this service.
With regard to the production of electricity from renewable energy sources, the most widely used is solar photovoltaic (PV), both on a district scale or integrated into the building, with Leipzig being the only exception that uses this source outside the district boundaries [108].
Although solar energy gives many gaps in its production, especially in the Nordic countries (not only at night but also in winter), this was the most adopted solution [127,128,129,130]. The reason for this trend could be either because this technology is the cheapest for energy production, or the easiest to install both in the ground and integrated in buildings and different companies are widely present to guarantee long-term maintenance [131]. Therefore, for economic and feasibility reasons, it makes sense to select this technology in all urban and climatic conditions.
Despite being the most convenient source of renewable energy, wind energy was the least selected. This may be due to the difficulty of installation in urban contexts, landscape deterrents, social resistance that this form of energy production encounters and for the high cost of their installation and maintenance [132,133]. In addition to largely altering the appearance of the land on which they are installed, wind turbines emit noise and vibrations, so society does not tend to accept the installation of these technologies near built-up areas [132,133]. From the experience of Espoo (Finland), however, the adoption of virtual wind energy was a satisfactory choice [113]. This city, however, was one of the few to have chosen the virtual form precisely in order to be able to integrate wind energy into its districts [108]. This would suggest that the use of virtual PEDs would offer more opportunities as it would develop technologies in the region and not only in the punctual area of the district.
Regarding energy storage systems, this is divided into electricity and heat storage and can be installed either on a district scale or by integrating them into buildings, while only electricity can also be stored virtually [134,135]. These technologies are highly expensive but reliable, so that more district-scale and less building-integrated solutions were developed [134,135]. In fact, for electricity, all the case studies adopted district-scale solutions, with Turku, Groningen and Oulu also having building-integrated solutions. With regard to the technological solutions adopted for heat storage, Leipzig, Turku, Dijon, Alkmaar, Groningen, Trondheim and Oulu use district-scale heat storage technologies. While Espoo has a pilot project on how the thermal energy capacity of the building and its structures can be used in a similar way as a heating storage. Of these, Alkmaar, Amsterdam and one of the Groningen districts use the aquifer thermal energy storage.
All the districts surveyed have a mobility plan, which implies the siting of electric vehicles in public transport and encouraging the choice and use of private electric vehicles through the installation of charging stations throughout the districts [53]. Alkmaar and Turku use vehicle to grid.
Regarding the results obtained through the creation of summary diagrams of the main technological choices in different climatic context (Figure 10, Figure 11 and Figure 12), it was a challenge to succeed in creating models that are representative of all the examined climatic realities due to the disproportionate distribution of the case studies in the European continent. On the one hand, the case studies in continental or oceanic climates are sufficient to outline a general trend in the technological choices and solutions adopted. On the other hand, in the Mediterranean climate, the only case study present made it possible to create a model that represents a reality in a that climate, but it is not sufficient to outline a common trend, as it is descriptive of that specific district. This disproportion is probably attributable to the problems presented in the previous chapter (the absence of realities capable of enabling the simple creation and maintenance of infrastructures, the absence of administrative agencies designed to foster environmental protection, etc.).
If the trend present in this study were to be confirmed in other districts, in the Mediterranean area, the main focus would be on electricity and almost none on heating. Whereas in the continental climate, although district heating networks are widely used, there is still a great deal of focus on building-integrated heating. It would, therefore, be desirable, in our judgement, to consider promoting the development and large-scale installation of this type of heat distribution, both to ensure greater safety for the population and to protect environmental aspects (less wasteful use of materials). In addition to the increased development of district heating networks, it would seem that the promotion and development of new solutions such as seasonal energy storage, hydrogen and district heating and cooling networks would be of great help in the development of PEDs throughout Europe.
Furthermore, in addition to the already existing electrification of transport with e-mobility, there would seem to be a process of electrification in heat generation that would lead to an increase in the demand for electricity. This trend can be seen through the extensive use of heat generation with heat pumps focused on electricity. In our opinion, this increase in demand for electricity could be met by a large-scale increase in wind energy due to its high performance. Another alternative could be the use of small nuclear reactors, assuming that it is not up to us to discuss the nature of nuclear power and whether it belongs to sustainable technologies. The energy resulting from nuclear power could also be a viable solution for powering DHN.
It appears that gas would be totally replaced by heat production due to its polluting particles, unless CO2 could be captured out of it. However, the remaining particulate matter, a consequence of gas combustion, would remain a problem to be solved in order not to disuse this energy source.
Finally, it would also be necessary from a technological point of view to develop high-level planning to ensure optimum energy efficiency.

6. Conclusions

This study collected, catalogued and analysed the data from 25 PEDs of 12 different case studies from the European Smart Cities and Communities SCC1-H2020 projects. The districts are distributed in different parts of the European continent, with case studies located in different proportions in northern, central and southern Europe. The data collected from these case studies through literature research and questionnaires submitted by interviewing project leaders were organised and critically analysed in order to create summary models of the technologies used under different conditions. As a result, information on the objectives and technological choices was systematised, making it possible to outline the trend of PED development in those areas. Specifically, this study arrived at the following considerations:
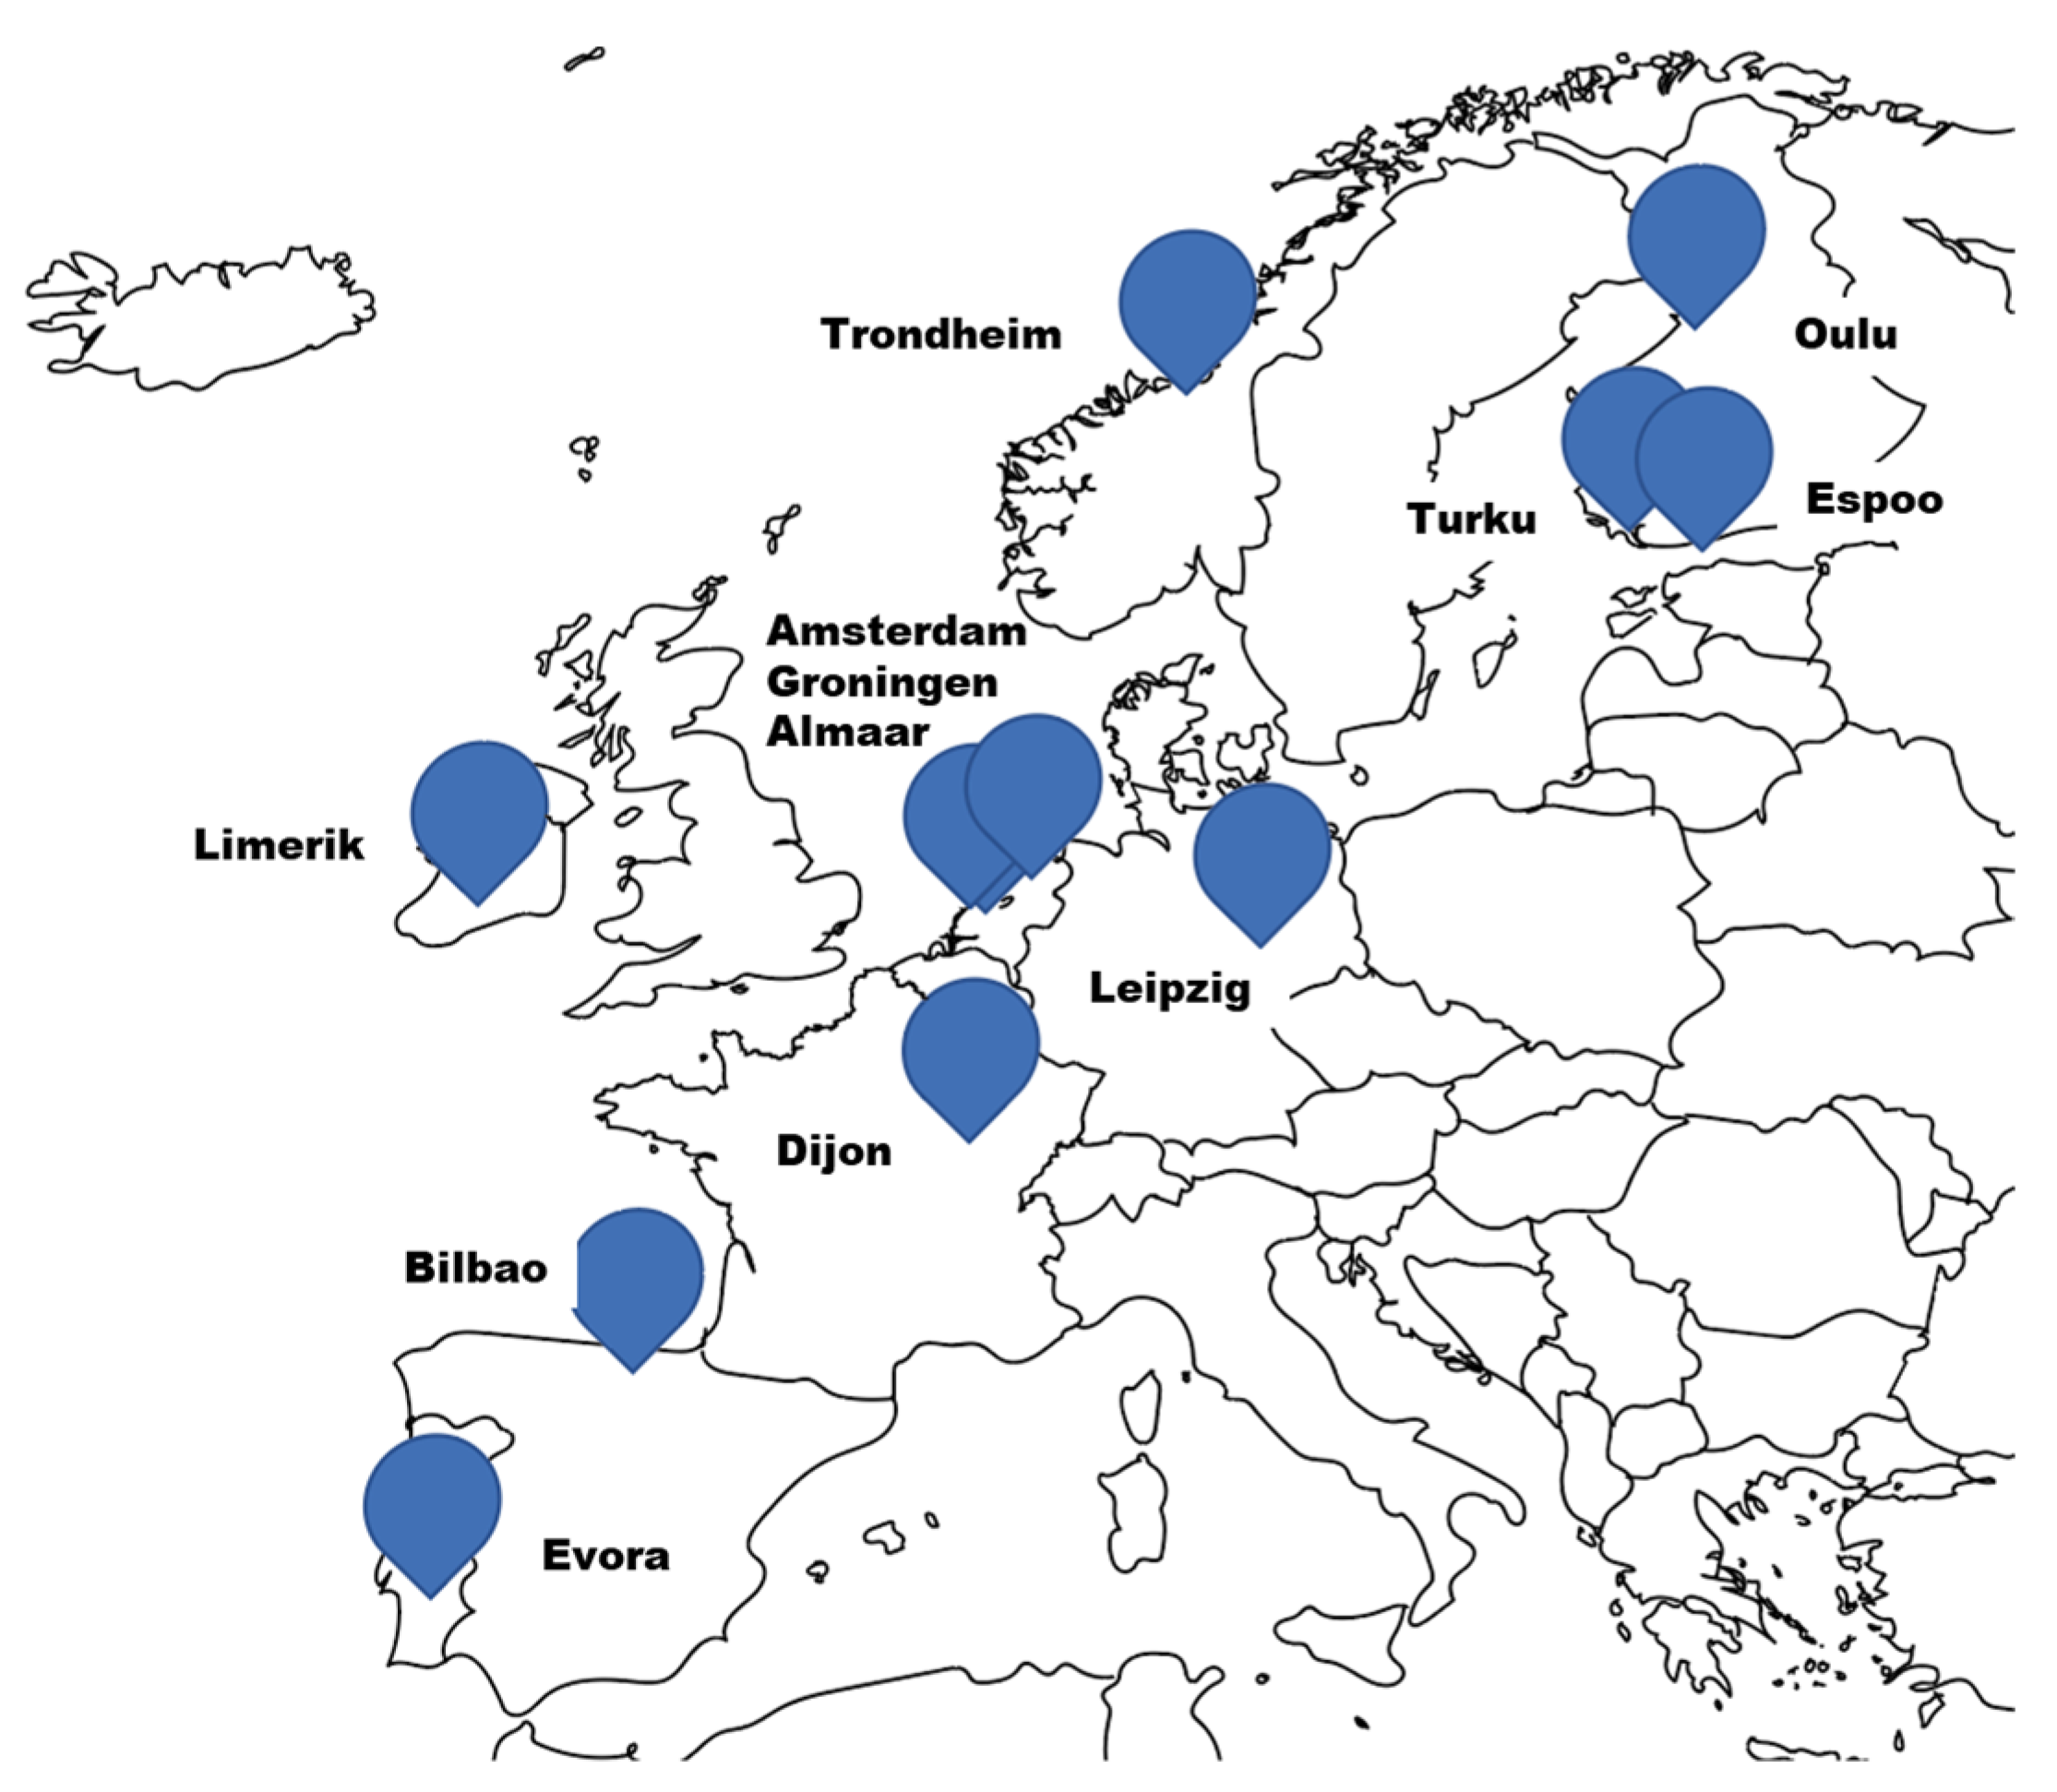
  • A general trend in the establishment of PEDs in Northern and Central Europe was noted, to the disadvantage of the south, which could be due to a potentially lower institutional and start-up presence in the south;
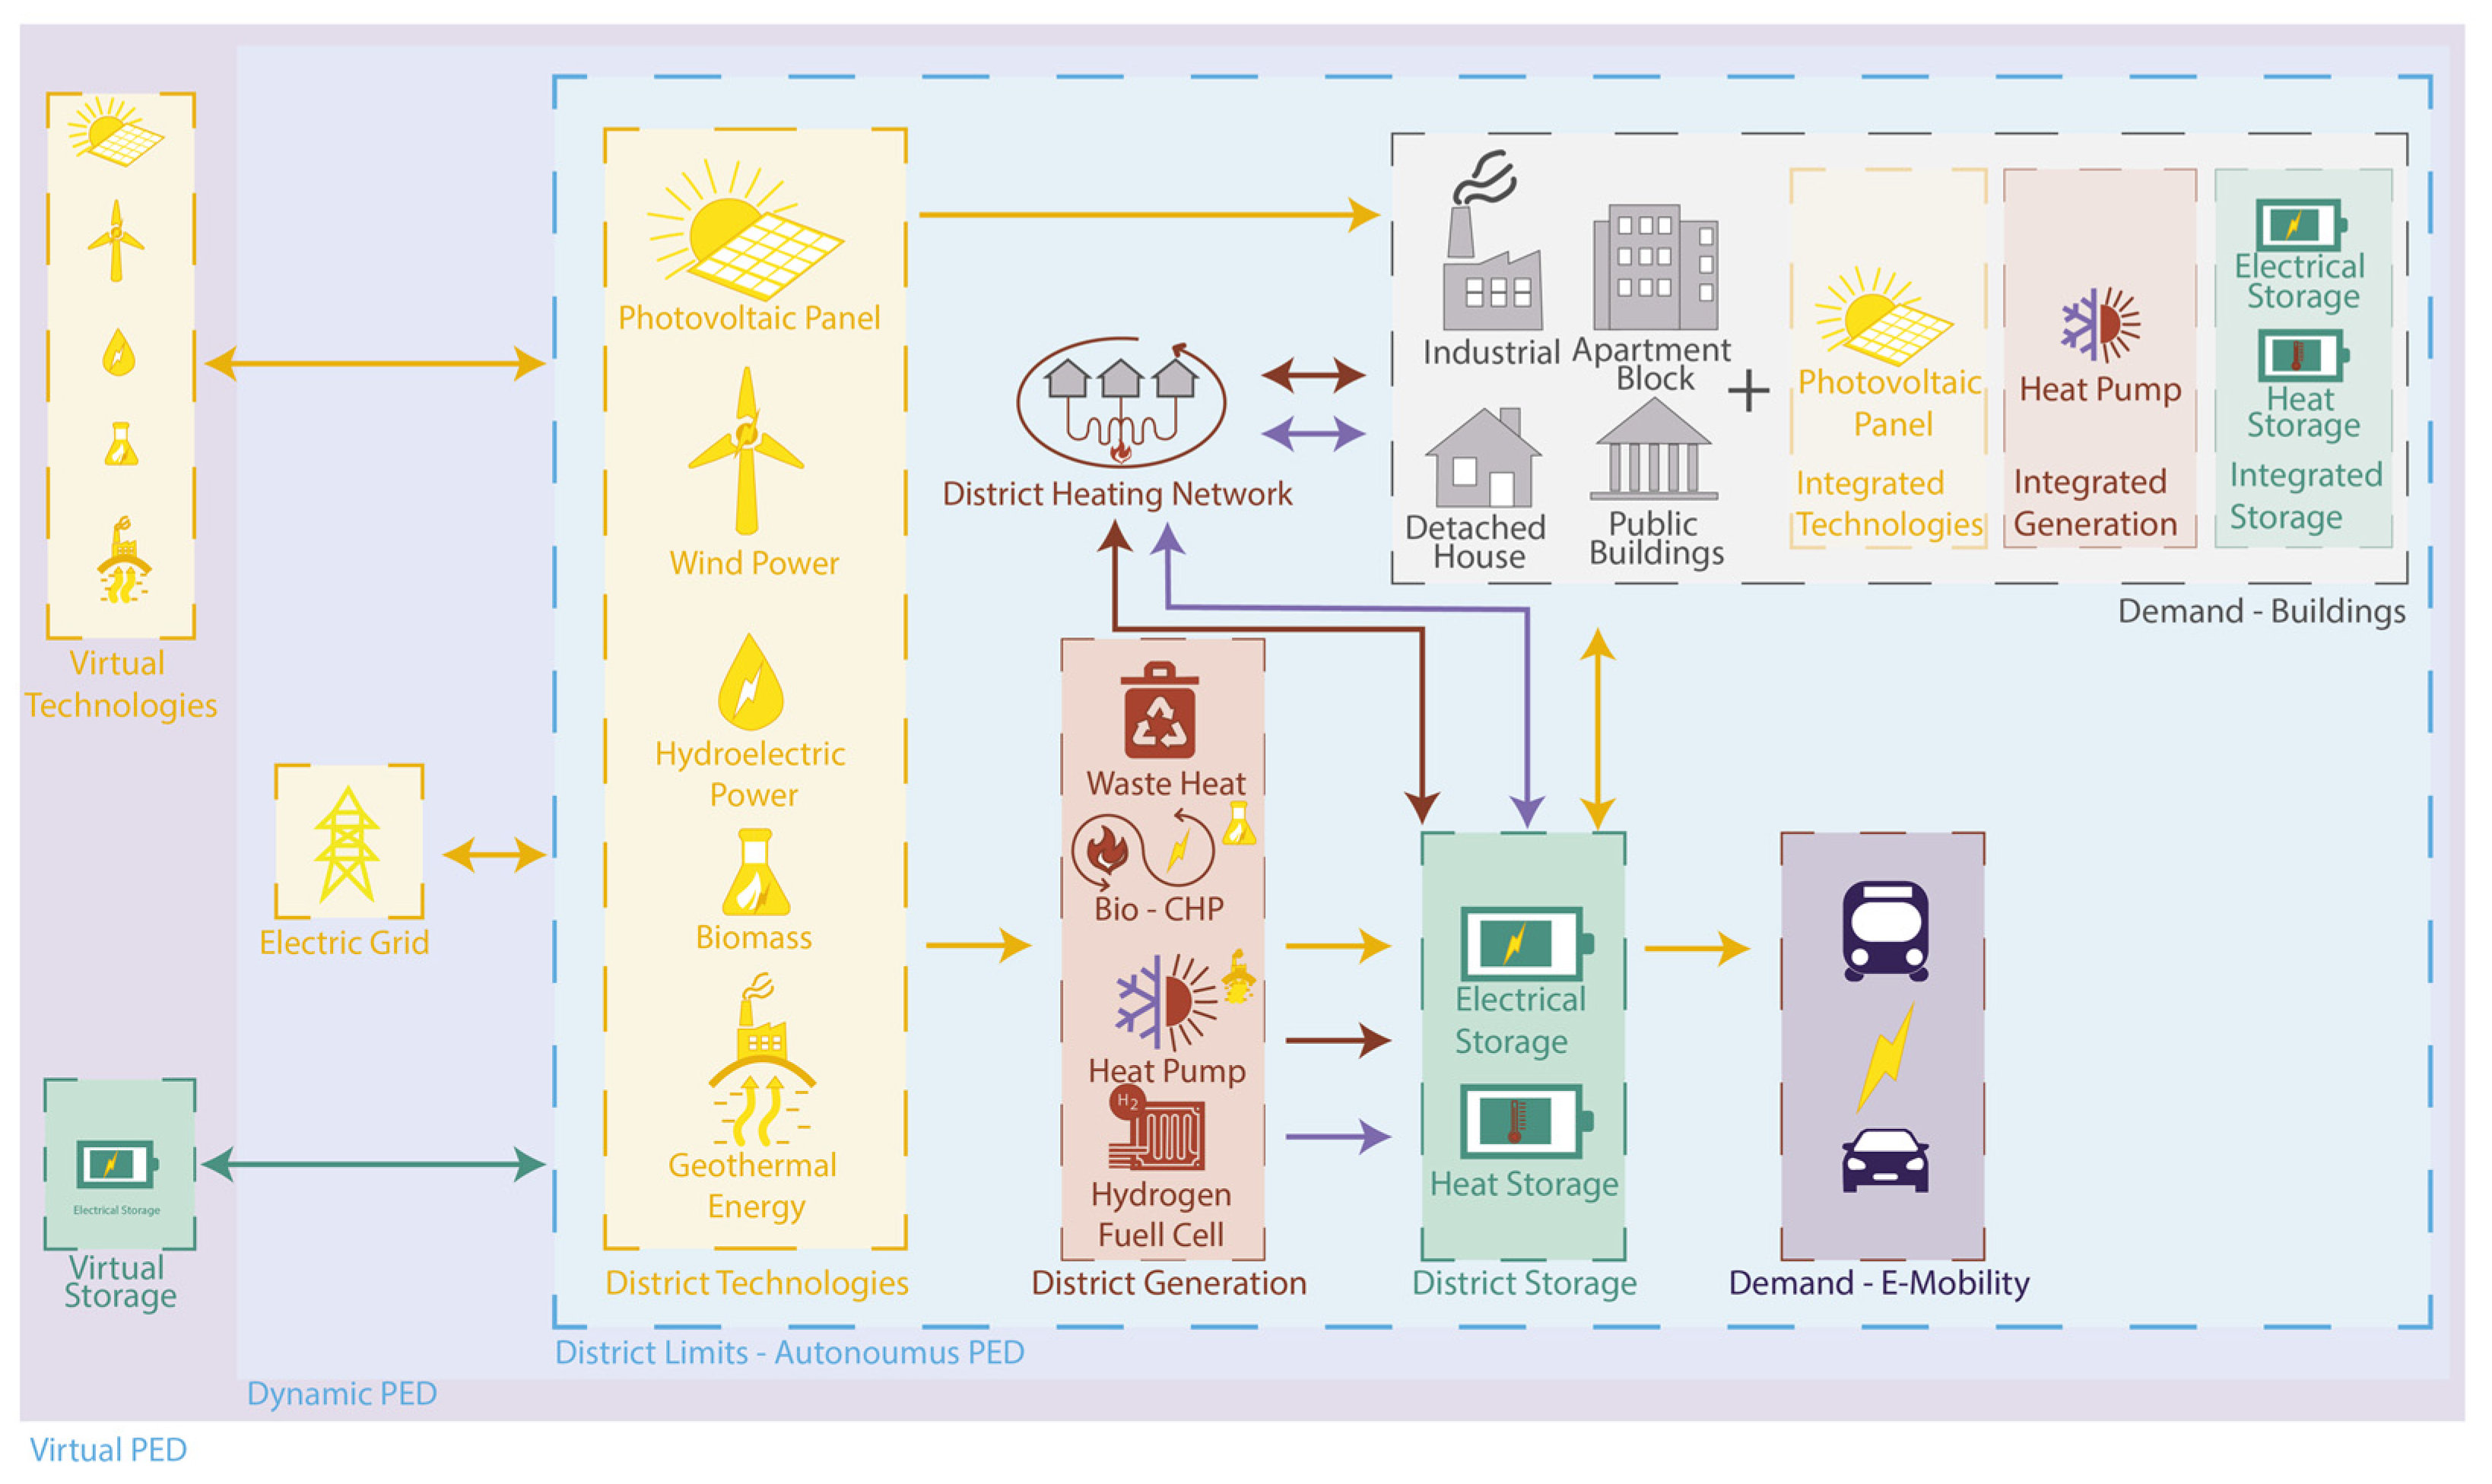
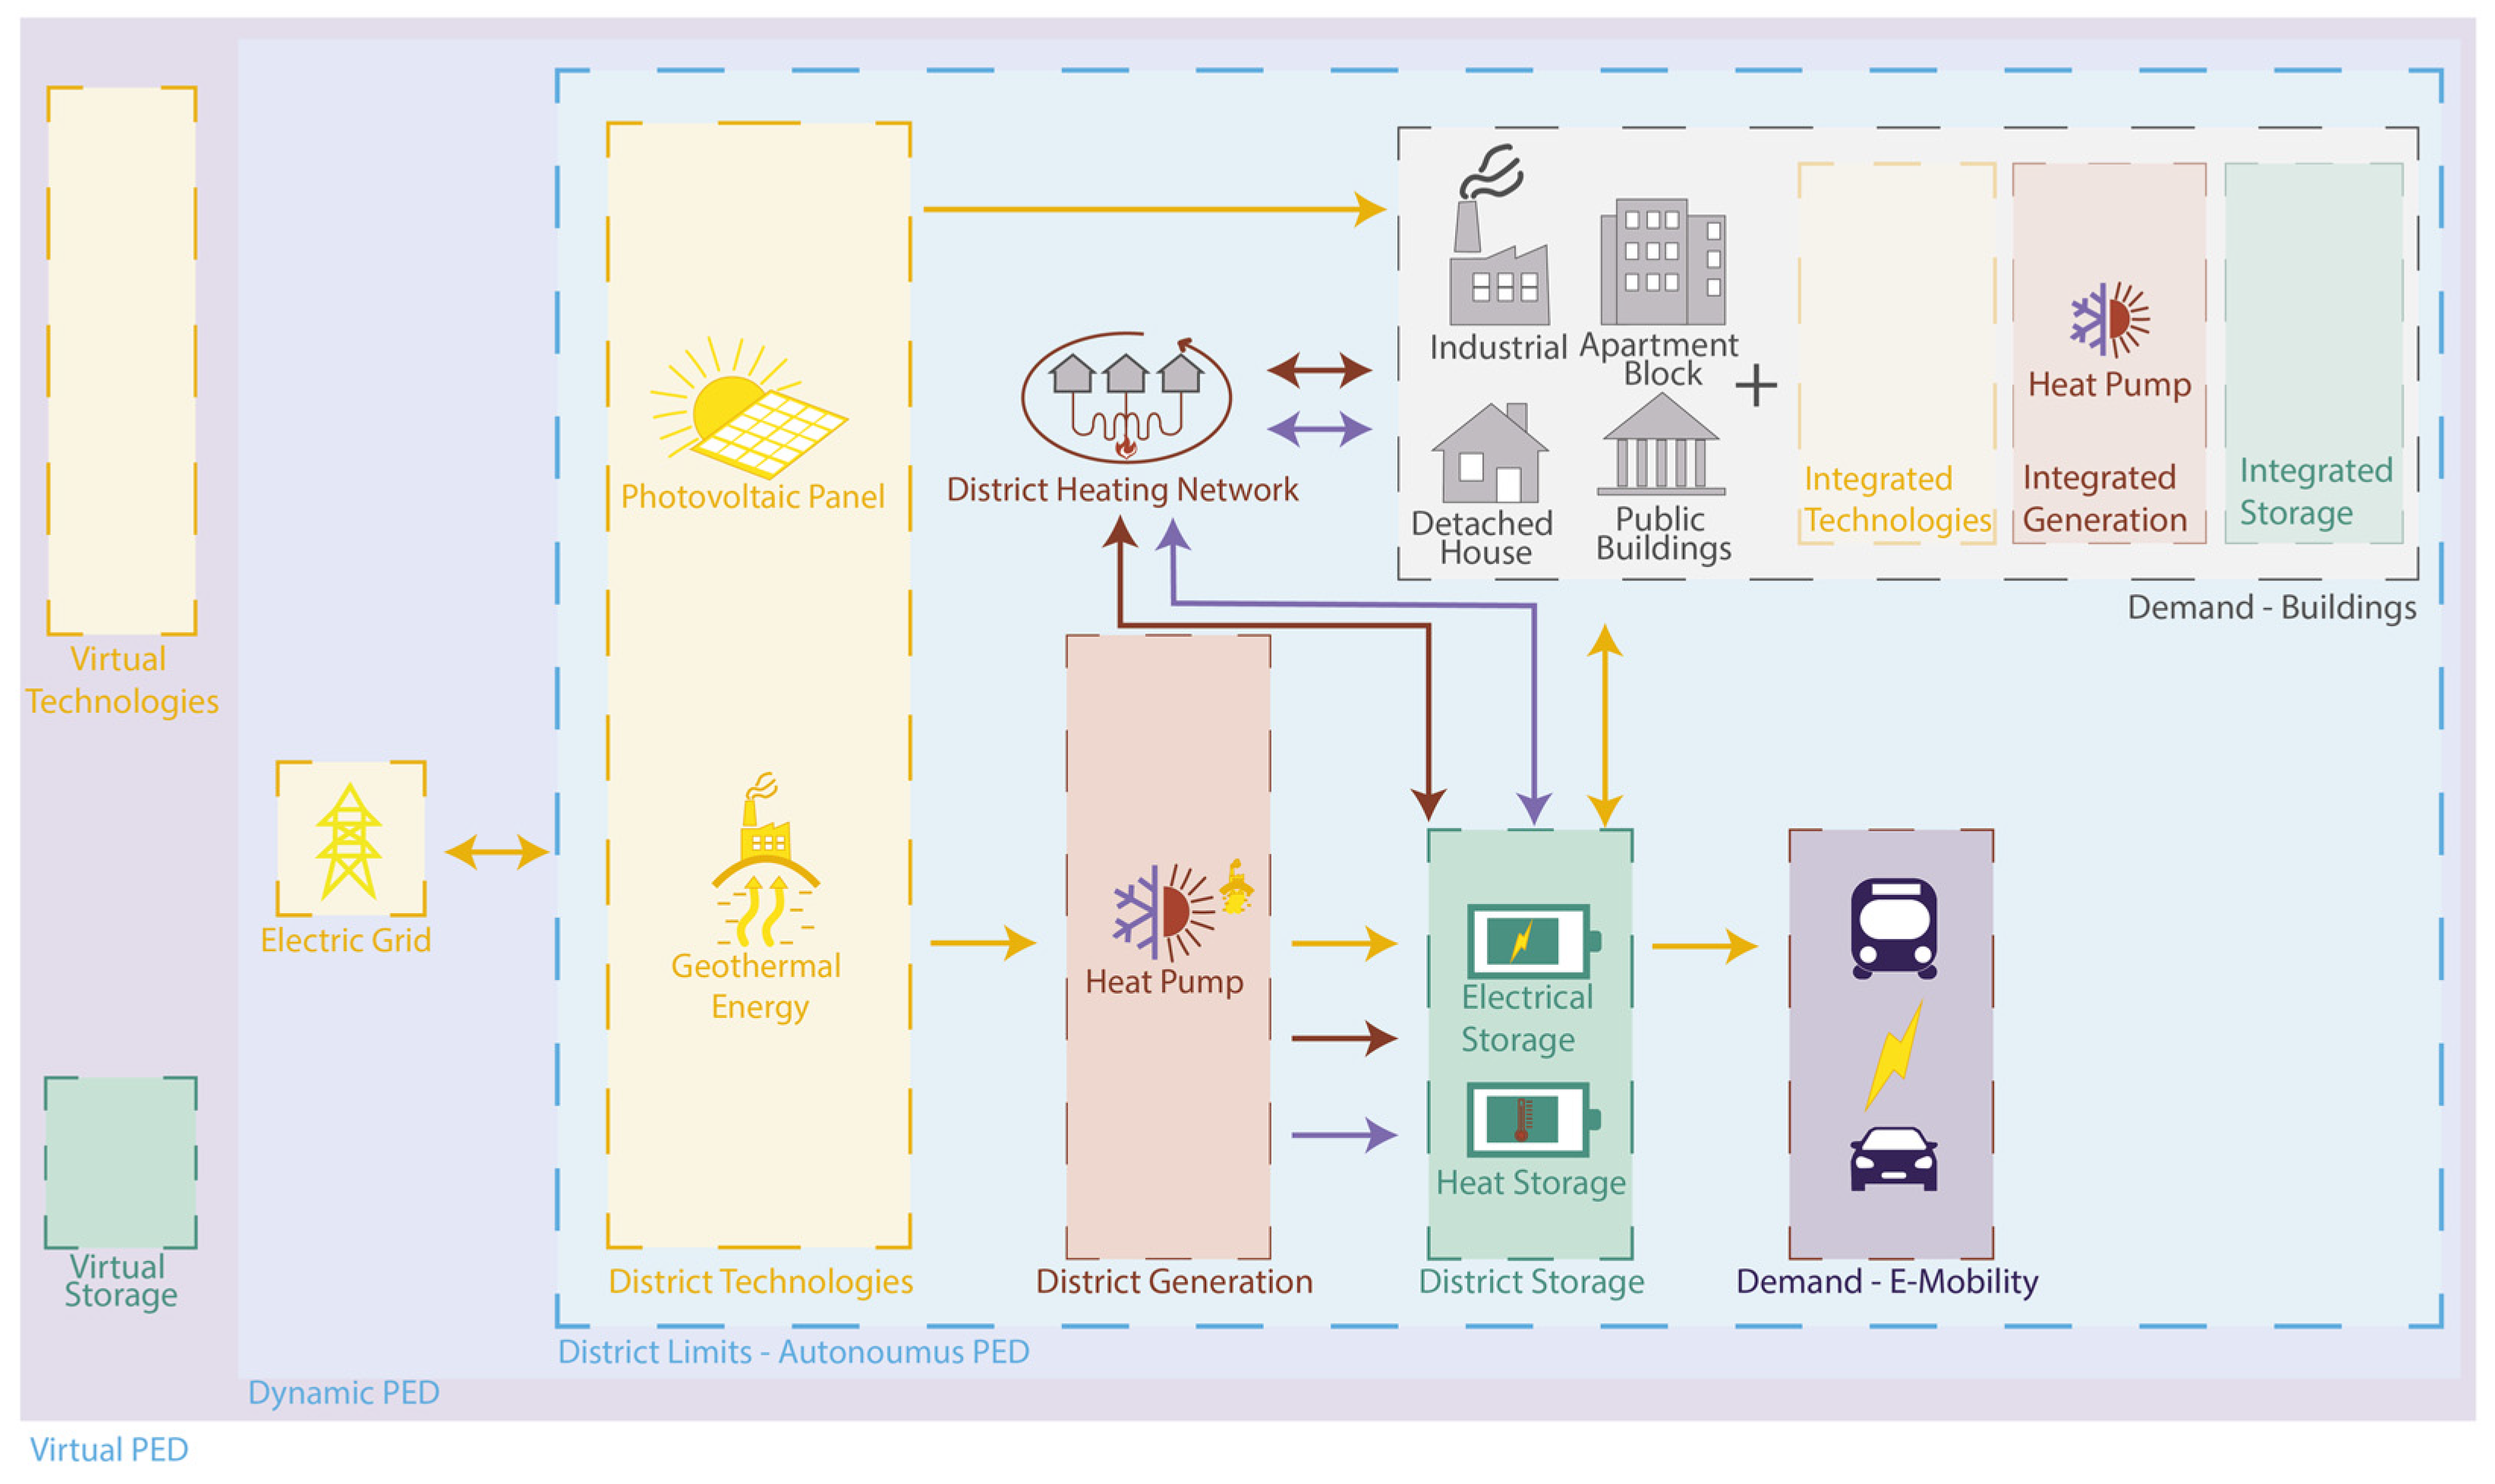
  • The most frequently used type of PED is the dynamic PED, which would seem to be the most effective and adaptable form of PED for current urban conditions. However, the virtual PED could offer more effective solutions especially in Northern Europe to counter the energy mismatch;
  • Recurring choices were noted in the selection of technologies for the proper functioning of PEDs, declined from time to time in different ways to suit the needs of the area. When technological choices differed, the reason was the presence of previous regional or city programmes that aimed at promoting the development and use of a specific technology. Some examples are the choices made by Alkmaar, with the use of hydrogen fuel cell, and Leipzig, with solar thermal;
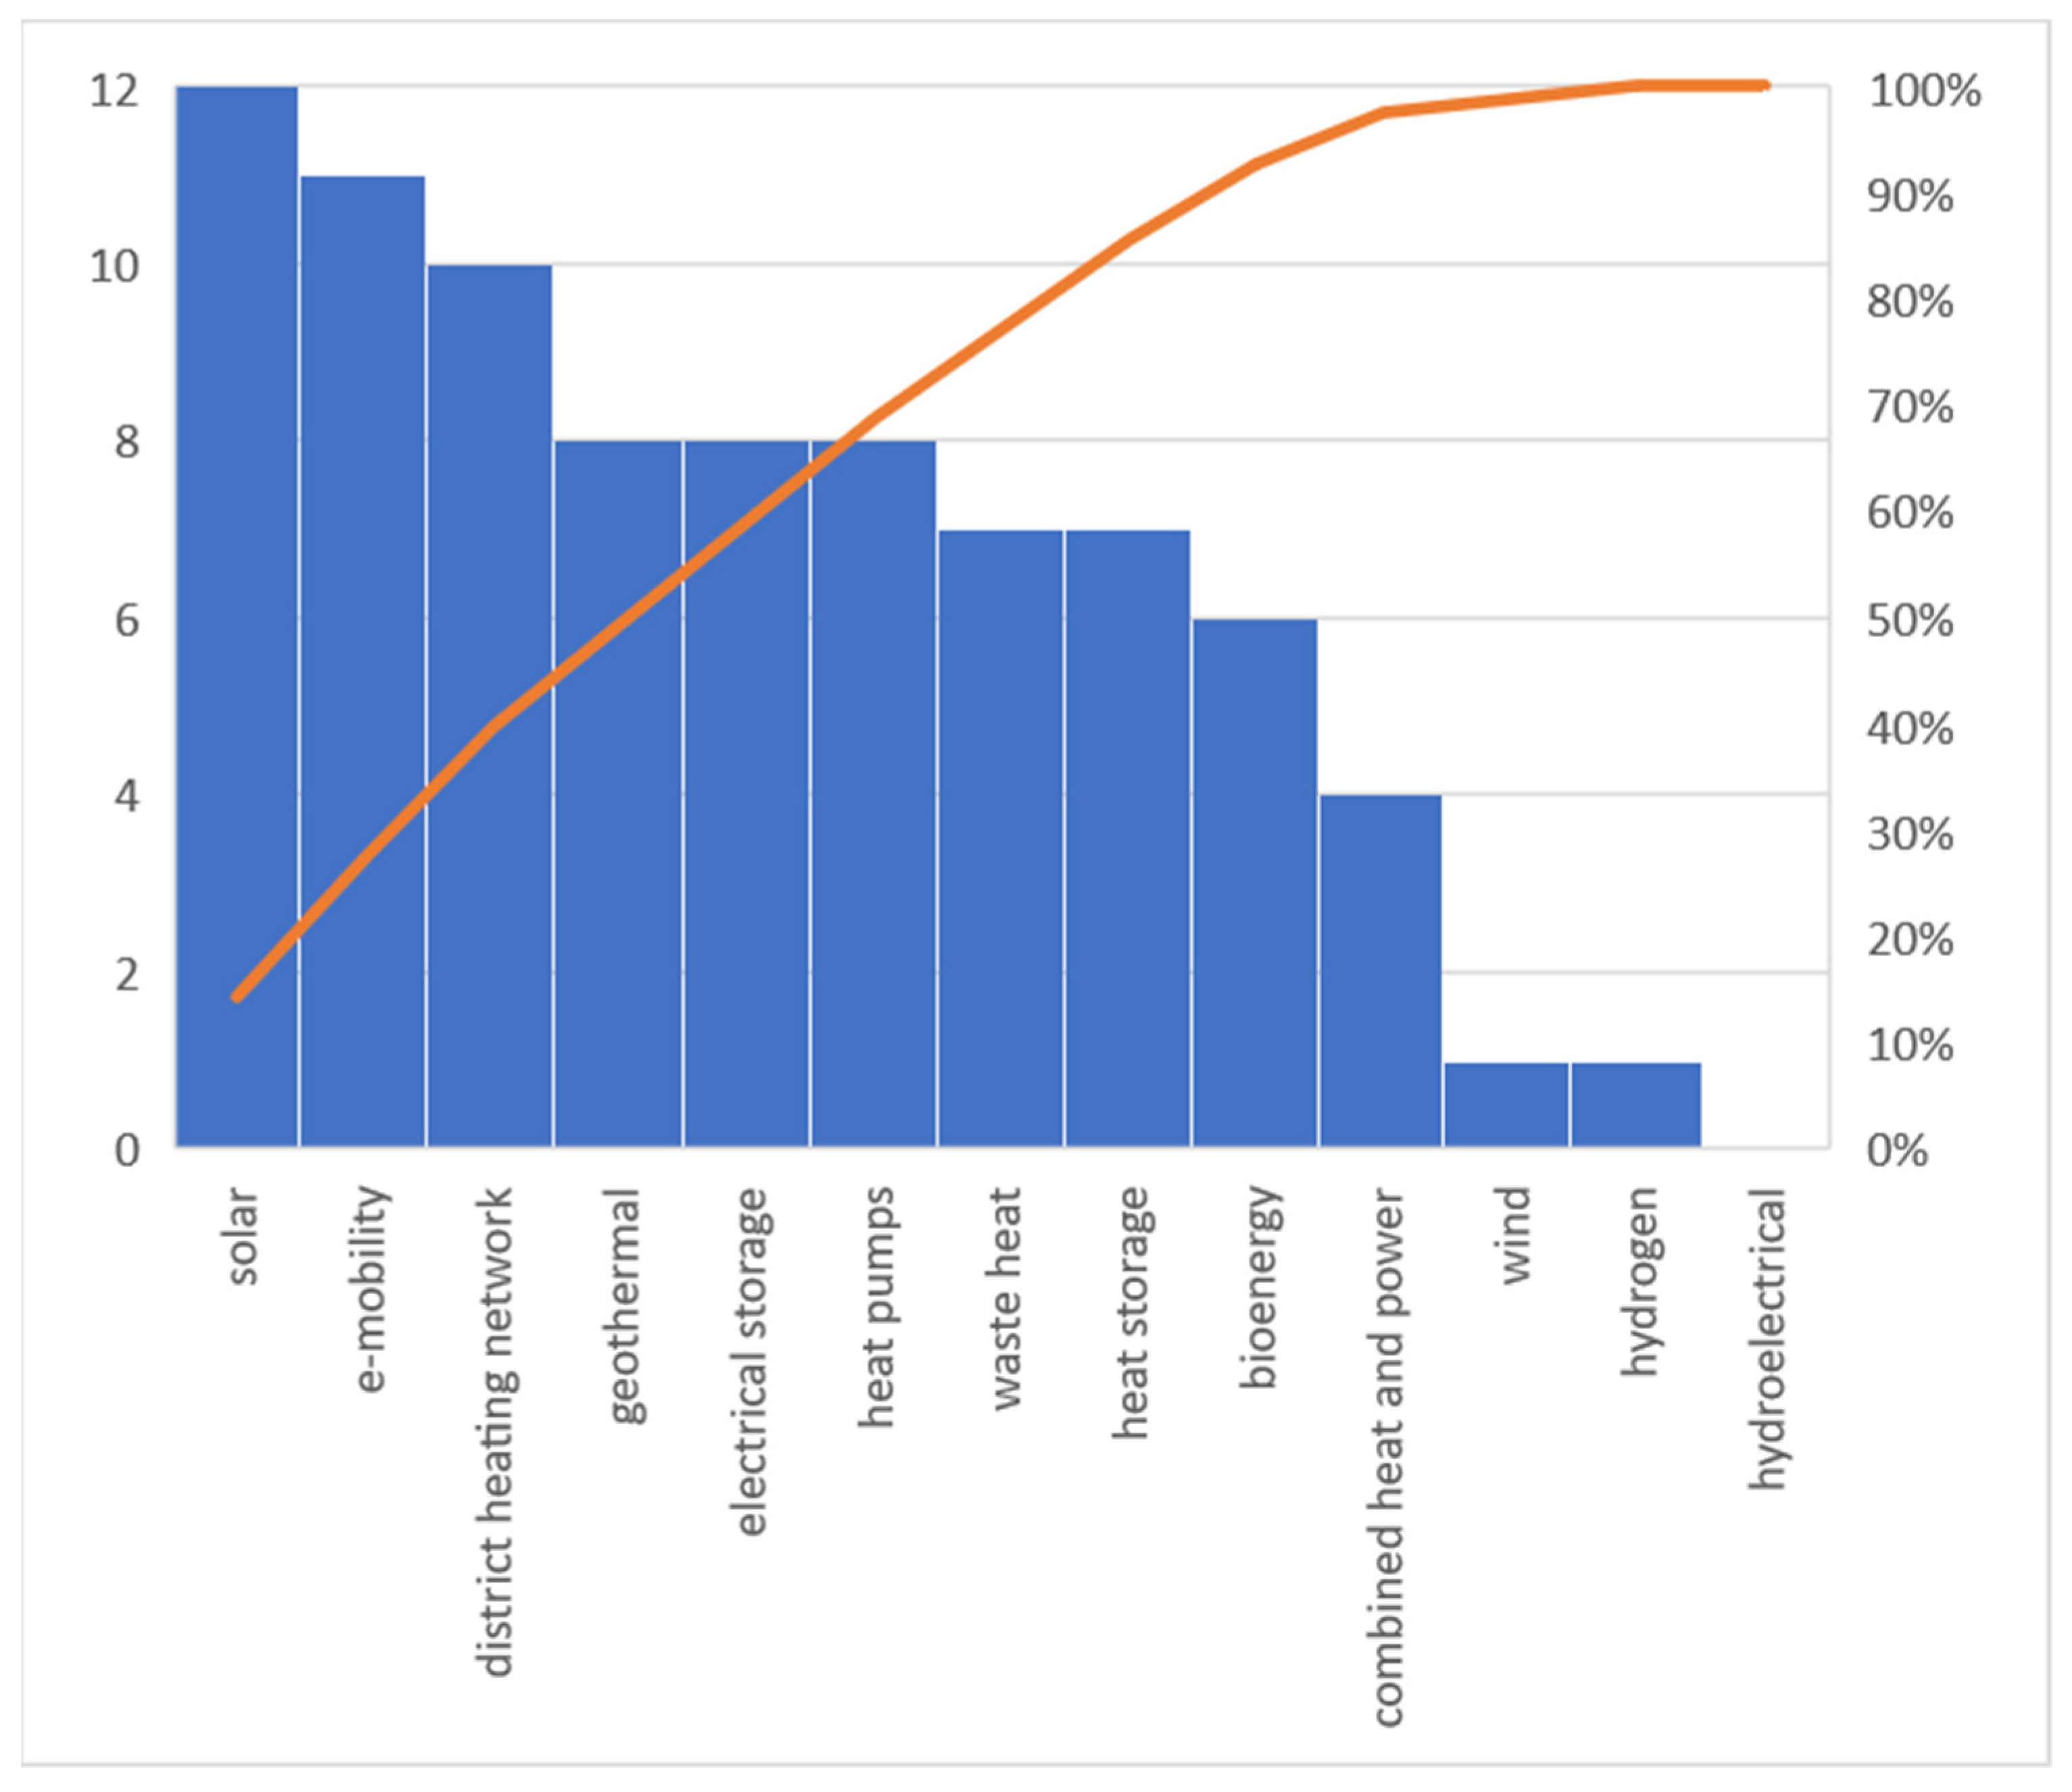
  • Among the most widely used technologies is solar PV energy technologies, which could be due to its lower price, ease of installation and the large presence of companies capable of guaranteeing proper maintenance. In addition, the district heating network is also more common, which could be due to the high effectiveness and efficiency of this technology and their greater safety. Moreover, E-mobility has a large presence;
  • Despite being one of the most energy-efficient renewable energy sources, wind energy was found to have lower use. Actually, only the Espoo case study (Sparcs) has adopted it in a virtual way, as it is among the green certified electricity solutions. The reasons behind its low use could be the difficulty of installation in the urban context, the high cost of installation and maintenance, landscape deterrents and social resistance;
  • A progressive focus on solutions related to the production, storage and distribution of heat was noted in the progression towards Northern Europe, probably due to the geographical and climatic typical needs of those territories;
  • There was an acceleration in the electrification process of PEDs regarding e-mobility and heat generation technologies (especially large heat pumps in district networks). One of the possible solutions to this increased demand for electricity could, in our opinion, be found in a greater exploitation of wind energy sources and through the utilisation of electricity produced by nuclear reactors on a regional or national scale;
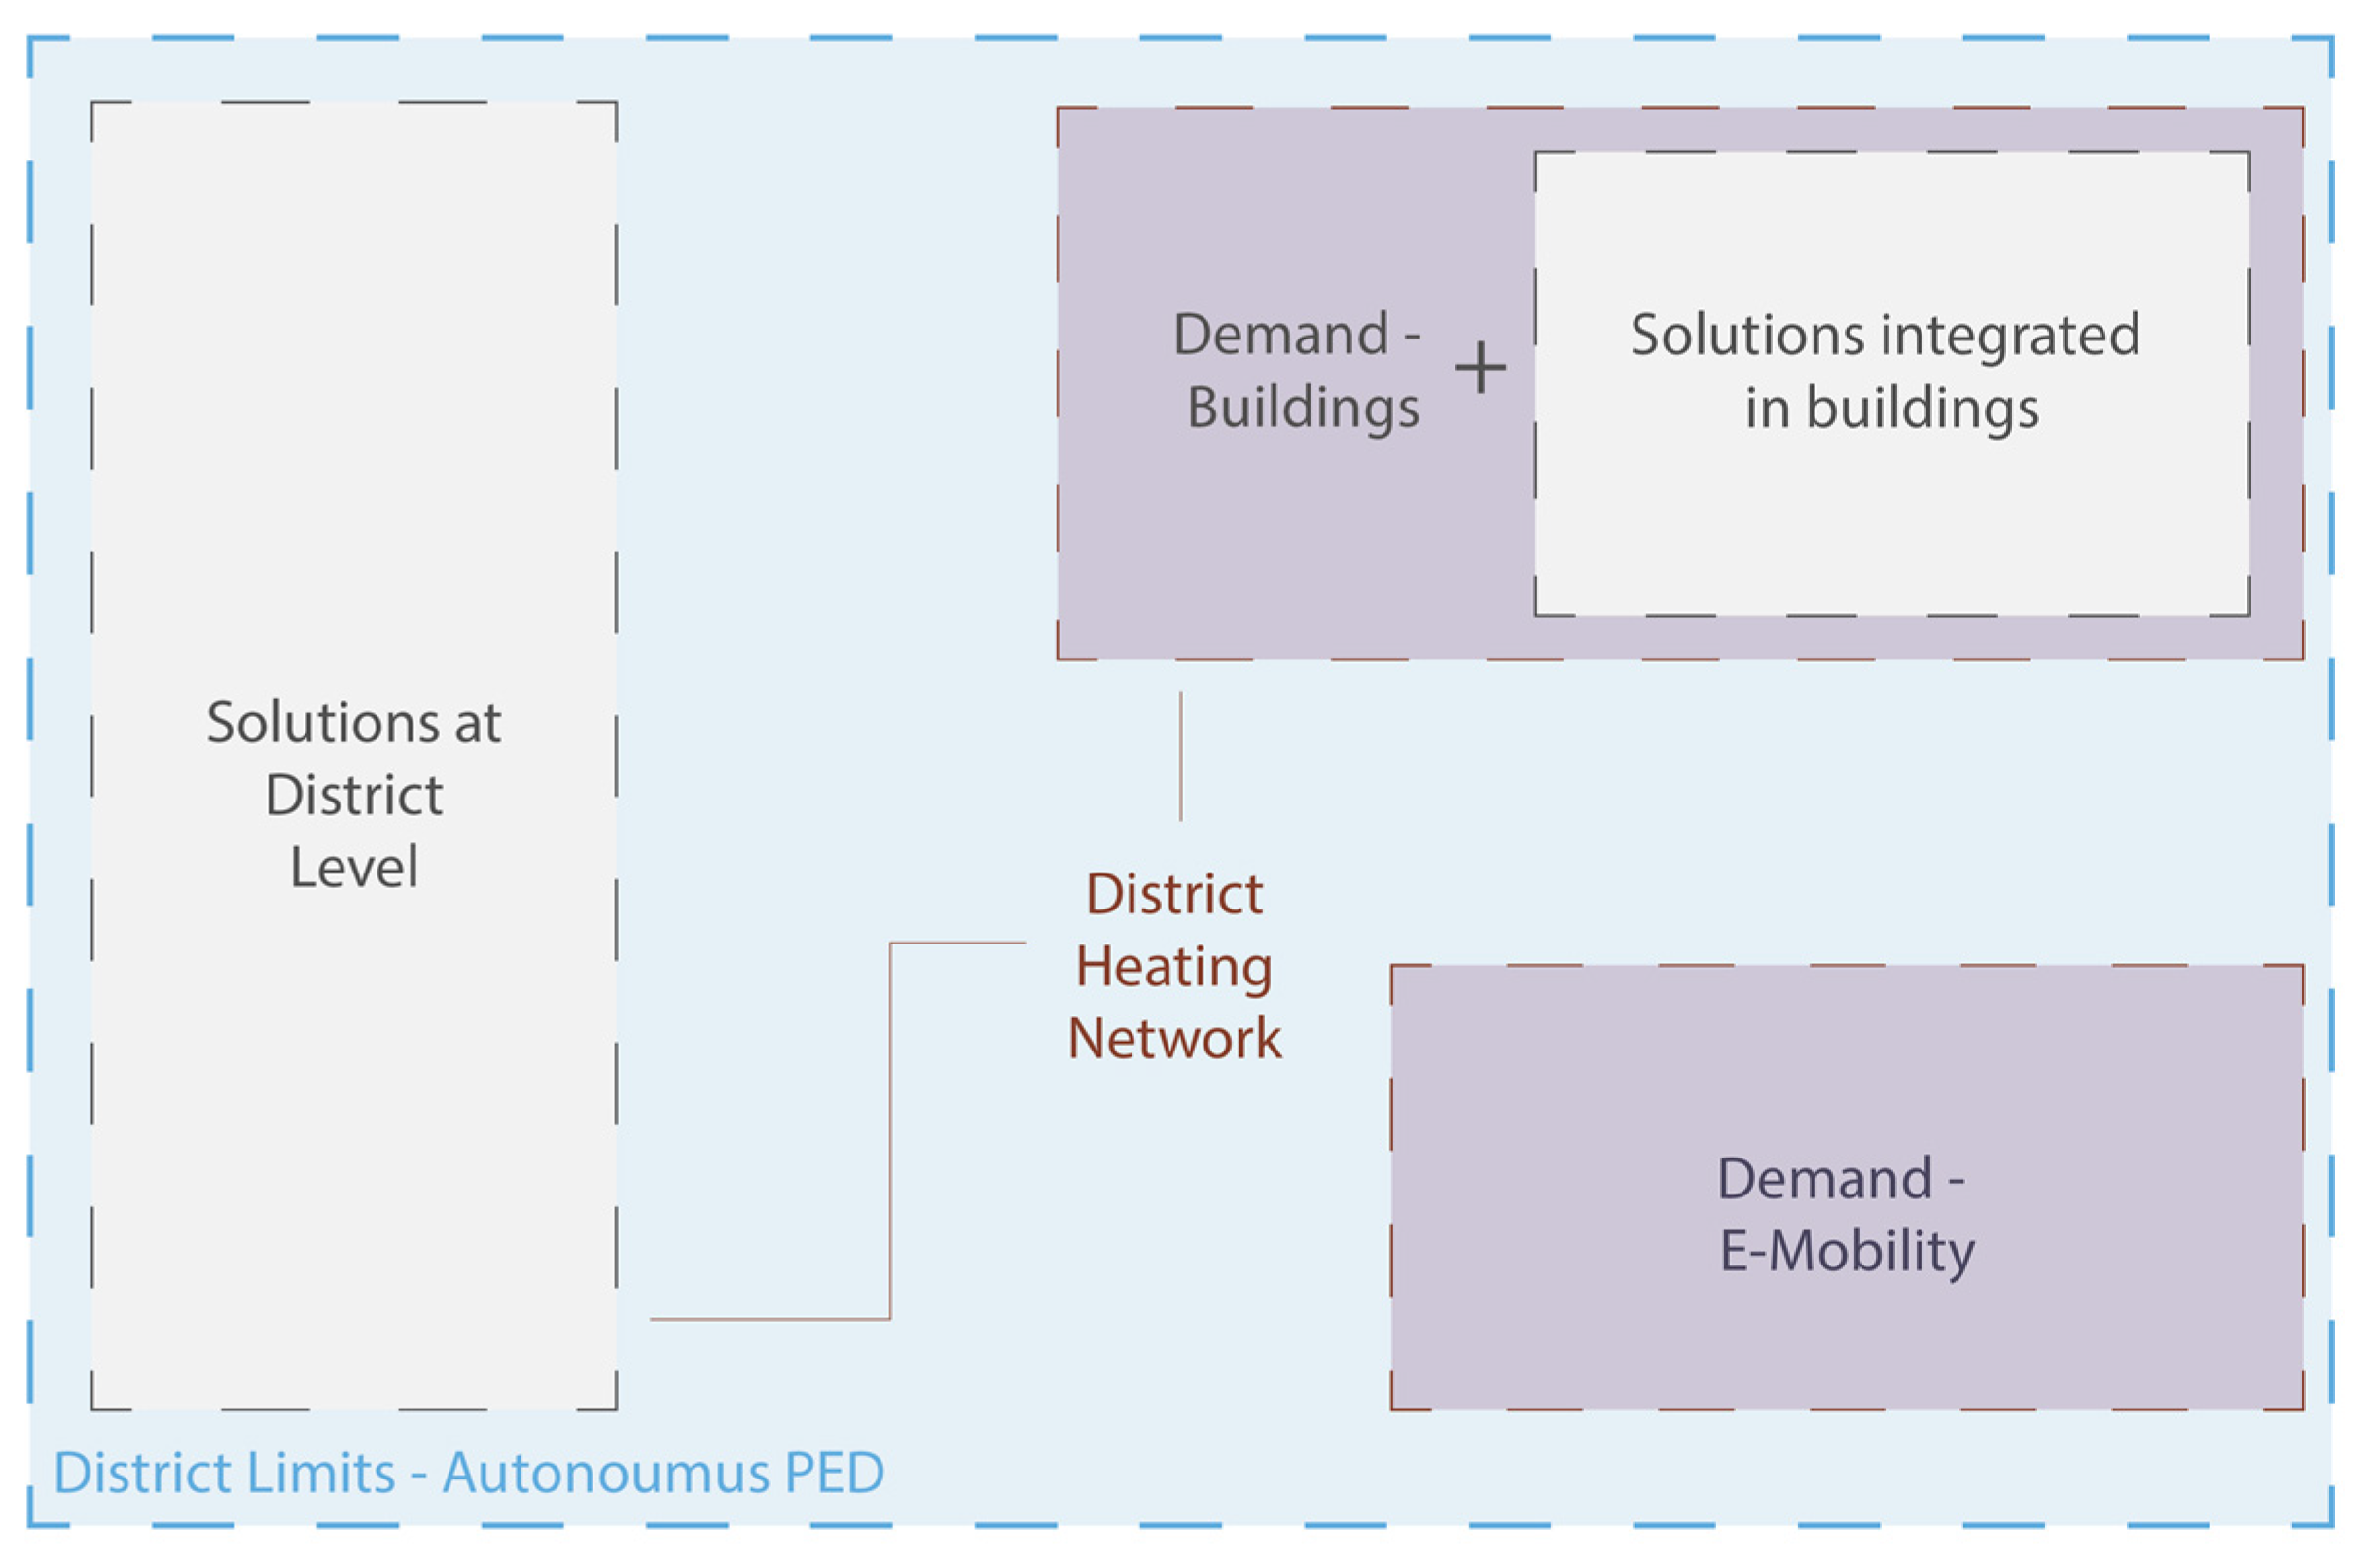
  • Technological solutions at the district scale were often preferred to building-integrated solutions, this is probably due to higher efficiency with larger units, better control and management and distribution of energy in the territory. However, one disadvantage is the higher energy losses associated with long distribution lines;
  • In order to promote the development of PED on a large scale, it would be desirable to develop a high level of planning that considers the entire territory and systematises the development of PED on a regional scale. This way, a network of PEDs and greater efficiency could be achieved. For this reason, a good solution, in our opinion, could be the use of the new territorial acupuncture methodology.
The delimitation of the study, as far as it was possible to carry out an initial analysis and note the variations in different geographical areas, was the challenge to obtain all the necessary data and to create summary diagrams of all the climatic realities analysed. This is probably due to the fact that the sample of case studies analysed at this stage is limited (there were no other PEDs within the European Smart Cities and Communities SCC1-H2020 project). Indeed, the small number of case studies provides a partial view of the proposed diagrams. For this reason, it would be interesting in the future to extend the range of case studies examined and repeat the analyses carried out in this study to see whether the conclusions reached are confirmed. Another future development of this study would be to apply it to an adequate number of case studies in order to define archetypal forms descriptive of different climatic conditions and/or different urban fabrics.

Author Contributions

Conceptualisation, F.L., F.R., A.H. and H.u.R.; methodology, F.L., F.R., A.H. and H.u.R.; formal analysis, F.L., F.R., A.H. and H.u.R.; investigation, F.L., F.R., A.H. and H.u.R.; resources, F.L., H.u.R., F.R. and A.H.; data curation, F.L., F.R., A.H. and H.u.R.; writing—original draft preparation, F.L.; writing—review and editing, F.L., F.R., A.H., H.u.R., F.C.N., F.N. and V.C.; visualisation, F.L., F.R., A.H. and H.u.R.; supervision, F.R., A.H., H.u.R., F.C.N., F.N. and V.C.; funding acquisition, F.R. and F.N. All authors have read and agreed to the published version of the manuscript.

Funding

This research was funded by the Sparcs project (grant number 864242) and the University of Catania. The Sparcs project has received funding from the European Union’s Horizon 2020 research and innovation programme under Grant Agreement No. 864242. The sole responsibility for the content of this publication lies with the authors. It does not necessarily reflect the opinion of the European Communities. The European Commission is not responsible for any use that may be made of the information contained therein. The funding bodies had no such involvement in preparing the manuscript, methods and results, etc., and this manuscript reflects only the authors’ views and does not necessarily reflect their opinion. The financing bodies cannot be held responsible for any use that may be made of the information contained herein.

Institutional Review Board Statement

Not applicable.

Informed Consent Statement

Not applicable.

Data Availability Statement

The data presented in this study are available on request from the corresponding author.

Acknowledgments

The authors would like to acknowledge Mari Hukkalainen, Zarrin Fatima and Krzysztof Klobut (Sparcs), Beril Alpagut (MAKING-CITYMAKING-CITY), Mikko Virtanen (RESPONSE), Jùlia Oliveira Pereira (POCITYF), and the IEA Energy in Buildings and Communities (EBC) Annex 83 PEDs, for cooperation. The funding bodies had no such involvement in preparing the manuscript, methods and results, etc., and this manuscript reflects only the authors’ views and does not necessarily reflect the opinion of the European Commission. Neither the EU nor any of its institutions or agencies can be held responsible for any use that may be made of the information contained herein.

Conflicts of Interest

The authors declare no conflict of interest. The funders had no role in the design of the study; in the collection, analyses, or interpretation of data; in the writing of the manuscript, or in the decision to publish the results.

Appendix A

In this appendix, a copy of the questionnaire created in this study and submitted to the representatives of the projects is proposed. The questionnaire consists of eight pages and five parts.
Figure A1. Copy of the first page of the questionnaire produced to conduct this study.
Energies 16 00356 g0a1
Figure A2. Copy of the second page of the questionnaire produced to conduct this study.
Energies 16 00356 g0a2
Figure A3. Copy of the third page of the questionnaire produced to conduct this study.
Energies 16 00356 g0a3
Figure A4. Copy of the fourth page of the questionnaire produced to conduct this study.
Energies 16 00356 g0a4
Figure A5. Copy of the fifth page of the questionnaire produced to conduct this study.
Energies 16 00356 g0a5

References

  1. Godfray, H.C.J.; Beddington, J.R.; Crute, I.R.; Haddad, L.; Lawrence, D.; Muir, J.F.; Pretty, J.; Robinson, S.; Thomas, S.M.; Toulmin, C. Food Security: The Challenge of Feeding 9 Billion People. Science 2010, 327, 812–818. [Google Scholar] [CrossRef] [PubMed] [Green Version]
  2. Walther, G.-R.; Post, E.; Convey, P.; Menzel, A.; Parmesan, C.; Beebee, T.J.C.; Fromentin, J.-M.; Hoegh-Guldberg, O.; Bairlein, F. Ecological responses to recent climate change. Nature 2002, 416, 389–395. [Google Scholar] [CrossRef] [PubMed]
  3. Rayner, N.A.; Parker, D.E.; Horton, E.B.; Folland, C.K.; Alexander, L.V.; Rowell, D.P.; Kent, E.C.; Kaplan, A. Global analyses of sea surface temperature, sea ice, and night marine air temperature since the late nineteenth century. J. Geophys. Res. 2003, 108, 4407. [Google Scholar] [CrossRef] [Green Version]
  4. Parmesan, C.; Yohe, G. A globally coherent fingerprint of climate change impacts across natural systems. Nature 2003, 421, 37–42. [Google Scholar] [CrossRef]
  5. Foley, J.A.; DeFries, R.; Asner, G.P.; Barford, C.; Bonan, G.; Carpenter, S.R.; Chapin, F.S.; Coe, M.T.; Daily, G.C.; Gibbs, H.K.; et al. Global consequences of land use. Science 2005, 309, 570–574. [Google Scholar] [CrossRef] [Green Version]
  6. United Nations. Paris Agreement—Status of Ratification. In Proceedings of the 21st Paris Climate Change Conference, Paris, France, 30 November–11 December 2015. [Google Scholar]
  7. Mitchell, D.; Allen, M.R.; Hall, J.W.; Muller, B.; Rajamani, L.; Le Quéré, C. The myriad challenges of the Paris Agreement. Philos. Trans. R. Soc. A Math. Phys. Eng. Sci. 2018, 376, 20180066. [Google Scholar] [CrossRef]
  8. United Nations. What Is the Paris Agreement? United Nations Climate Change; UNFCCC: Rio de Janeiro, Brazil; New York, NY, USA, 2015. [Google Scholar]
  9. United Nations. Adoption of the Paris Agreement. In Proceedings of the 2015 United Nations Climate Change Conference, Paris, France, 30 November–12 December 2015; p. 21932. [Google Scholar]
  10. United Nations. Summary of the Paris Agreement; United Nations Framework Convention on Climate Change: Rio de Janeiro, Brazil; New York, NY, USA, 2015. [Google Scholar]
  11. United Nations. Paris Agreement COP21. In Proceedings of the 2015 United Nations Climate Change Conference, Paris, France, 30 November–12 December 2015. [Google Scholar]
  12. Zhao, X.; Ma, X.; Chen, B.; Shang, Y.; Song, M. Challenges toward carbon neutrality in China: Strategies and countermeasures. Resour. Conserv. Recycl. 2022, 176, 105959. [Google Scholar] [CrossRef]
  13. Zou, C.; Xue, H.; Xiong, B.; Zhang, G.; Pan, S.; Jia, C.; Wang, Y.; Ma, F.; Sun, Q.; Guan, C.; et al. Connotation, innovation and vision of “carbon neutrality”. Nat. Gas Ind. B 2021, 8, 523–537. [Google Scholar] [CrossRef]
  14. Wang, F.; Harindintwali, J.D.; Yuan, Z.; Wang, M.; Li, S.; Yin, Z.; Huang, L.; Fu, Y.; Li, L.; Chang, S.X.; et al. Technologies and perspectives for achieving carbon neutrality. Innovation 2021, 2, 100180. [Google Scholar] [CrossRef]
  15. Pulselli, R.M.; Broersma, S.; Martin, C.L.; Keeffe, G.; Bastianoni, S.; van den Dobbelsteen, A. Future city visions. The energy transition towards carbon-neutrality: Lessons learned from the case of Roeselare, Belgium. Renew. Sustain. Energy Rev. 2021, 137, 110612. [Google Scholar] [CrossRef]
  16. Bonoli, A.; Zanni, S.; Serrano-Bernardo, F. Sustainability in Building and Construction within the Framework of Circular Cities and European New Green Deal. The Contribution of Concrete Recycling. Sustainability 2021, 13, 2139. [Google Scholar] [CrossRef]
  17. Špaček, R.; Legény, J.; Gregor, P. Challenge and response at all levels in sustainable architecture education. World Trans. Eng. Technol. Educ. 2020, 18, 18–23. [Google Scholar]
  18. Wolf, S.; Teitge, J.; Mielke, J.; Schütze, F.; Jaeger, C. The European Green Deal—More Than Climate Neutrality. Intereconomics 2021, 56, 99–107. [Google Scholar] [CrossRef]
  19. Salvia, M.; Reckien, D.; Pietrapertosa, F.; Eckersley, P.; Spyridaki, N.-A.; Krook-Riekkola, A.; Olazabal, M.; De Gregorio Hurtado, S.; Simoes, S.G.; Geneletti, D.; et al. Will climate mitigation ambitions lead to carbon neutrality? An analysis of the local-level plans of 327 cities in the EU. Renew. Sustain. Energy Rev. 2021, 135, 110253. [Google Scholar] [CrossRef]
  20. Magrini, A.; Lentini, G.; Cuman, S.; Bodrato, A.; Marenco, L. From nearly zero energy buildings (NZEB) to positive energy buildings (PEB): The next challenge—The most recent European trends with some notes on the energy analysis of a forerunner PEB example. Dev. Built Environ. 2020, 3, 100019. [Google Scholar] [CrossRef]
  21. Kolokotsa, D.; Rovas, D.; Kosmatopoulos, E.; Kalaitzakis, K. A roadmap towards intelligent net zero- and positive-energy buildings. Sol. Energy 2011, 85, 3067–3084. [Google Scholar] [CrossRef]
  22. Ala-Juusela, M.; Rehman, H.U.; Hukkalainen, M.; Reda, F. Positive Energy Building Definition with the Framework, Elements and Challenges of the Concept. Energies 2021, 14, 6260. [Google Scholar] [CrossRef]
  23. Lindholm, O.; Rehman, H.U.; Reda, F. Positioning Positive Energy Districts in European Cities. Buildings 2021, 11, 19. [Google Scholar] [CrossRef]
  24. Marotta, I.; Guarino, F.; Longo, S.; Cellura, M. Environmental Sustainability Approaches and Positive Energy Districts: A Literature Review. Sustainability 2021, 13, 13063. [Google Scholar] [CrossRef]
  25. Becchio, C.; Bottero, M.C.; Corgnati, S.P.; Dell’Anna, F. Decision making for sustainable urban energy planning: An integrated evaluation framework of alternative solutions for a NZED (Net Zero-Energy District) in Turin. Land Use Policy 2018, 78, 803–817. [Google Scholar] [CrossRef]
  26. Vandevyvere, H.; Ahlers, D.; Alpagut, B.; Cerna, V.; Cimini, V.; Haxhija, S.; Hukkalainen, M.; Kuzmic, M.; Livik, K.; Padilla, M.; et al. Positive Energy Districts Solution Booklet; European Union: Brussels, Belgium, 2020. [Google Scholar]
  27. Hedman, Å.; Rehman, H.U.; Gabaldón, A.; Bisello, A.; Albert-Seifried, V.; Zhang, X.; Guarino, F.; Grynning, S.; Eicker, U.; Neumann, H.-M.; et al. IEA EBC Annex83 positive energy districts. Buildings 2021, 11, 130. [Google Scholar] [CrossRef]
  28. Ala-Juusela, M.; Crosbie, T.; Hukkalainen, M. Defining and operationalising the concept of an energy positive neighbourhood. Energy Convers. Manag. 2016, 125, 133–140. [Google Scholar] [CrossRef] [Green Version]
  29. Zhang, X.; Penaka, S.R.; Giriraj, S.; Sánchez, M.N.; Civiero, P.; Vandevyvere, H. Characterizing Positive Energy District (PED) through a Preliminary Review of 60 Existing Projects in Europe. Buildings 2021, 11, 318. [Google Scholar] [CrossRef]
  30. Lorenzoni, I.; Pidgeon, N.F. Public Views on Climate Change: European and USA Perspectives. Clim. Chang. 2006, 77, 73–95. [Google Scholar] [CrossRef]
  31. Stoate, C.; Báldi, A.; Beja, P.; Boatman, N.; Herzon, I.; van Doorn, A.; de Snoo, G.; Rakosy, L.; Ramwell, C. Ecological impacts of early 21st century agricultural change in Europe—A review. J. Environ. Manag. 2009, 91, 22–46. [Google Scholar] [CrossRef] [PubMed]
  32. Olesen, J.E.; Bindi, M. Consequences of climate change for European agricultural productivity, land use and policy. Eur. J. Agron. 2002, 16, 239–262. [Google Scholar] [CrossRef]
  33. Davis, S.J.; Caldeira, K. Consumption-based accounting of CO2 emissions. Proc. Natl. Acad. Sci. USA 2010, 107, 5687–5692. [Google Scholar] [CrossRef] [Green Version]
  34. Lindner, M.; Maroschek, M.; Netherer, S.; Kremer, A.; Barbati, A.; Garcia-Gonzalo, J.; Seidl, R.; Delzon, S.; Corona, P.; Kolström, M.; et al. Climate change impacts, adaptive capacity, and vulnerability of European forest ecosystems. For. Ecol. Manag. 2010, 259, 698–709. [Google Scholar] [CrossRef]
  35. Wawrzyniak, D. CO2 Emissions in the Visegrad Group Countries and the European Union Climate Policy. Comp. Econ. Res. Central East. Eur. 2020, 23, 73–91. [Google Scholar] [CrossRef]
  36. Billson, M.; Pourkashanian, M. The Evolution of European CCS Policy. Energy Procedia 2017, 114, 5659–5662. [Google Scholar] [CrossRef]
  37. Montanarella, L.; Panagos, P. The relevance of sustainable soil management within the European Green Deal. Land Use Policy 2021, 100, 104950. [Google Scholar] [CrossRef]
  38. Claeys, G.; Tagliapietra, S.; Zachmann, G. How to Make the European Green Deal Work; Bruegel: Brussels, Belgium, 2019. [Google Scholar]
  39. Boeri, A.; Longo, D.; Palma, M. Climate-neutral limate-neutral and smart cities: A European polices’ overview. WIT Trans. Ecol. Environ. 2021, 253, 3–14. [Google Scholar] [CrossRef]
  40. Bossi, S.; Gollner, C.; Theierling, S. Towards 100 Positive Energy Districts in Europe: Preliminary Data Analysis of 61 European Cases. Energies 2020, 13, 6083. [Google Scholar] [CrossRef]
  41. Bartholmes, J. Smart Cities and Communities SCC1-2020; European Commission: Brussels, Belgium, 2020. [Google Scholar]
  42. Bilotta, S.; Nesi, P.; Paoli, I. Real-time System for Short- and Long-Term Prediction of Vehicle Flow. In Proceedings of the 2020 IEEE International Conference on Smart Data Services, SMDS, Virtual, 18–24 October 2020; pp. 97–104. [Google Scholar] [CrossRef]
  43. Haarstad, H.; Wathne, M.W. Are smart city projects catalyzing urban energy sustainability? Energy Policy 2019, 129, 918–925. [Google Scholar] [CrossRef]
  44. Calzada, I. Replicating Smart Cities: The City-to-City Learning Programme in the Replicate EC-H2020-SCC Project. Smart Cities 2020, 3, 978–1003. [Google Scholar] [CrossRef]
  45. Gouveia, J.P.; Seixas, J.; Palma, P.; Duarte, H.; Luz, H.; Cavadini, G.B. Positive Energy District: A Model for Historic Districts to Address Energy Poverty. Front. Sustain. Cities 2021, 3, 648473. [Google Scholar] [CrossRef]
  46. Maestosi, P.C. Smart Cities and Positive Energy Districts: Urban Perspectives in 2020. Energies 2021, 14, 2351. [Google Scholar] [CrossRef]
  47. Soriano, F.H.; Mulatero, F. EU Research and Innovation (R&I) in renewable energies: The role of the Strategic Energy Technology Plan (SET-Plan). Energy Policy 2011, 39, 3582–3590. [Google Scholar] [CrossRef]
  48. Turci, G.; Alpagut, B.; Civiero, P.; Kuzmic, M.; Pagliula, S.; Massa, G.; Albert-Seifried, V.; Seco, O.; Soutullo, S. A Comprehensive PED-Database for Mapping and Comparing Positive Energy Districts Experiences at European Level. Sustainability 2021, 14, 427. [Google Scholar] [CrossRef]
  49. Derkenbaeva, E.; Vega, S.H.; Hofstede, G.J.; van Leeuwen, E. Positive energy districts: Mainstreaming energy transition in urban areas. Renew. Sustain. Energy Rev. 2022, 153, 111782. [Google Scholar] [CrossRef]
  50. Krangsås, S.G.; Steemers, K.; Konstantinou, T.; Soutullo, S.; Liu, M.; Giancola, E.; Prebreza, B.; Ashrafian, T.; Murauskaitė, L.; Maas, N. Positive Energy Districts: Identifying Challenges and Interdependencies. Sustainability 2021, 13, 10551. [Google Scholar] [CrossRef]
  51. Castillo-Calzadilla, T.; Alonso-Vicario, A.; Borges, C.E.; Martin, C. E-Mobility in Positive Energy Districts. Buildings 2022, 12, 264. [Google Scholar] [CrossRef]
  52. Moreno, A.G.; Vélez, F.; Alpagut, B.; Hernández, P.; Montalvillo, C.S. How to Achieve Positive Energy Districts for Sustainable Cities: A Proposed Calculation Methodology. Sustainability 2021, 13, 710. [Google Scholar] [CrossRef]
  53. Frolova, M.; Centeri, C.; Benediktsson, K.; Hunziker, M.; Kabai, R.; Scognamiglio, A.; Martinopoulos, G.; Sismani, G.; Brito, P.; Muñoz-Cerón, E.; et al. Effects of renewable energy on landscape in Europe: Comparison of hydro, wind, solar, bio-, geothermal and infrastructure energy landscapes. Hung. Geogr. Bull. 2019, 68, 317–339. [Google Scholar] [CrossRef] [Green Version]
  54. Miskolczi, M.; Földes, D.; Munkácsy, A.; Jászberényi, M. Urban mobility scenarios until the 2030s. Sustain. Cities Soc. 2021, 72, 103029. [Google Scholar] [CrossRef]
  55. Zhang, X.; Shen, J.; Saini, P.K.; Lovati, M.; Han, M.; Huang, P.; Huang, Z. Digital Twin for Accelerating Sustainability in Positive Energy District: A Review of Simulation Tools and Applications. Front. Sustain. Cities 2021, 3, 663269. [Google Scholar] [CrossRef]
  56. Shahat, E.; Hyun, C.; Yeom, C. City Digital Twin Potentials: A Review and Research Agenda. Sustainability 2021, 13, 3386. [Google Scholar] [CrossRef]
  57. Jones, D.; Snider, C.; Nassehi, A.; Yon, J.; Hicks, B. Characterising the Digital Twin: A systematic literature review. CIRP J. Manuf. Sci. Technol. 2020, 29, 36–52. [Google Scholar] [CrossRef]
  58. Ranta, M.; Hajduk, P.; Tartia, J.; Santala, S.; Tukia, T.; Juhmen, J.; Boldt, D.; Häsä, S.; Töyräs, J.; Ekelund, E.; et al. D3.5 EV Mobility Integration and Its Impacts in Espoo. 2022. Available online: https://www.sparcs.info/about/deliverables/d305-ev-mobility-integration-and-its-impacts-espoo (accessed on 18 December 2022).
  59. Klobut, K.; Piira, K.; Abdurafikov, R.; Laitinen, A.; Juslin, A.; Juhmen, J.; Saari, M.; Soinio, T.; Laakso, S.; Tukia, T.; et al. D3.4 Interoperability of Holistic Energy Systems in Espoo. 2022. Available online: https://www.sparcs.info/about/deliverables/d304-interoperability-holistic-energy-systems-espoo (accessed on 18 December 2022).
  60. Fatima, Z. D3.6 Optimizing People Flow and User Experience for Energy Positive Districts. 2022. Available online: https://www.sparcs.info/about/deliverables/d306-optimizing-people-flow-and-user-experience-energy-positive-districts (accessed on 17 December 2022).
  61. Wanne, E.; Tartia, J.; Juslin, A.; Mäkinen, J.; Hukkalainen, M.; Fatima, Z.; Klobut, K.; Piira, K.; Ranta, M.; Hajduk, p.; et al. D3.3 Implemented Demonstrations of Solutions for Energy Positive Blocks in Espoo. 2022. Available online: https://www.sparcs.info/about/deliverables/d303-implemented-demonstrations-solutions-energy-positive-blocks-espoo (accessed on 28 November 2022).
  62. Lei, L. D4.2 Midterm Report on the Implemented Solutions for Energy Positive Blocks in Leipzig. Pfd. 2021. Available online: https://www.sparcs.info/about/deliverables/d402-midterm-report-implemented-solutions-energy-positive-blocks-leipzig (accessed on 18 December 2022).
  63. Riedel, N.; Müller, I.; Albrecht, S.; Jelinek, E.; Kühne, J.M.; Schutt, T.; Vöhl, A.; Kondziella, H.; Baumet, S.; Bolognesi, P.; et al. D4.3 Implemented Demonstrations of Solutions for Energy Positive Blocks in Leipzig. 2022, pp. 1–125. Available online: https://www.sparcs.info/about/deliverables/d403-implemented-demonstrations-solutions-energy-positive-blocks-leipzig (accessed on 18 December 2022).
  64. City of Leipzig. D4.01 Detailed Plan of the Leipzig Smart City Lighthouse Demonstrations. 2020. Available online: https://www.sparcs.info/about/deliverables/d401-detailed-plan-leipzig-smart-city-lighthouse-demonstrations (accessed on 28 November 2022).
  65. Martinopoulos, G.; Nikolopoulos, N.; Tsompanidou, E.; Matsoukas, S.; Angelakoglou, K.; Paraskevi Gkiourka, K.K. D 4.6 Planning and Management of Open Innovation Challenges in Dijon and Turku—V1. 2022. Available online: https://h2020response.eu/wp-content/uploads/2022/05/D4.6-Planning-and-management-of-Open-Innovation-Challenges-in-Dijon-Turku-%E2%80%93-V1.pdf/ (accessed on 14 December 2022).
  66. Lanna, M.; Py, E. Response Data Governance and CIP Operational Framework. 2022. Available online: https://h2020response.eu/wp-content/uploads/2022/05/D3.2-RESPONSE-Data-Governance-and-CIP-Operational-Framework.pdf (accessed on 15 December 2022).
  67. Rouchette, H. D1.1 Elicitation of Citizens and Stakeholder Requirements, Risk Perception and User Acceptance Determinants. 2021. Available online: https://h2020response.eu/wp-content/uploads/2022/05/D1.1-Elicitation-of-citizens-and-stakeholder-requirements-risk-perception-and-user-acceptance-determinants.pdf (accessed on 28 November 2022).
  68. Evens, C. D1.5 Master City Plans for TA#3 Sustainable Energy Storage. 2021. Available online: https://h2020response.eu/wp-content/uploads/2022/05/D1.5-Master-City-Plans-for-TA3-Sustainable-Energy-Storage.pdf (accessed on 28 November 2022).
  69. Shemeikka, J. D1.3 Master City Plans for TA#1 Positive Energy Building Systems. 2021. Available online: https://h2020response.eu/wp-content/uploads/2022/05/D1.3-Master-City-Plans-for-TA1-Positive-Energy-Building-Systems.pdf (accessed on 13 December 2022).
  70. Néstor Rodrfguez Pérez, R.C.A. D1.2 Assessment of Smart Cities Regulatory and Legal Environment—V1. 2021. Available online: https://h2020response.eu/wp-content/uploads/2022/05/D1.2-Assessment-of-Smart-Cities-Regulatory-and-Legal-Environment-V1.pdf (accessed on 13 November 2022).
  71. Kallenbach, M. Matthijs Janssen Paul Roßteutscher Thomas van de Voort, ir Determining Critical Factors in the Atelier Positive Energy District Pilot in Buiksloterham Mark van Wees. 2021. Available online: https://smartcity-atelier.eu/app/uploads/ATELIER-Critical_learning_factors-report.pdf (accessed on 28 November 2022).
  72. García, C.; Urrutia, K.; Muñoz, I.; López, A.; Vallejo, E.; Rodríguez, C.; Verspeek, F.; Nathalia, K.; Andonegui, C.; Molinete, B. Deliverable 2.3: Common Methodological Framework for Vision Development. 2021. Available online: https://smartcity-atelier.eu/outcomes/deliverables/d2-3/ (accessed on 13 December 2022).
  73. DEUSTO, Version, D.; Level, D. Deliverable 1.7: Open Access Research Data Atelier. 2020. Available online: https://smartcity-atelier.eu/outcomes/deliverables/d1-7/ (accessed on 28 November 2022).
  74. Van Doornink, M. Amsterdam Climate Office New Amsterdam Climate; City of Amsterdam: Amsterdam, The Netherlands, 2016; pp. 1–6. Available online: https://smartcity-atelier.eu/app/uploads/RoadmapAmsterdam-Climate-Neutral-2050-full-version-ENG.Pdf (accessed on 17 December 2022).
  75. Remmele, B. Dissemination & Communication Strategy Plan; Atelier: Amsterdam, The Netherlands, 2020; pp. 1–50. Available online: https://smartcity-atelier.eu/outcomes/deliverables/d10-8/ (accessed on 23 November 2022).
  76. University of Deusto, Amsterdam University of Applied Science, Paul Scherrer Institute, Atelier Monitoring and Evaluation Framework deliverable 9.1: Repository of Definitions of Terms, Key Characteristics Archetypes, and a Set of KPIs WP9, Task 9.1. Repository of Definitions of Terms, Key Characteristics Archetypes, and a Set of KPIs. 2020. Available online: https://smartcity-atelier.eu/outcomes/deliverables/d9-1/ (accessed on 15 November 2022).
  77. Waag Deu Auas D7.1: Citizen and Stakeholder Engagement Plans. 2021. 2021. Available online: https://smartcity-atelier.eu/outcomes/deliverables/d7-1/ (accessed on 23 November 2022).
  78. DEUSTO. Deliverable 1.3: Data Management Plan. 2021. 2020. Available online: https://smartcity-atelier.eu/outcomes/deliverables/d1-3/ (accessed on 15 November 2022).
  79. Rev, T. Deliverable 3.1: The PED Innovation Atelier Organisation Document. 2021, pp. 1–55. Available online: https://smartcity-atelier.eu/outcomes/deliverables/d3-1/ (accessed on 15 November 2022).
  80. Remmele, B. The ATELIER Project. Citizen-Driven Positive Energy Districts in Amsterdam, Bilbao and beyond Smart City, Smart Mobility, Horizon 2020, Lighthouse Cities. 2020, pp. 50–52. Available online: https://smartcity-atelier.eu/news/international-strategies-article-introducing-atelier/ (accessed on 28 November 2022).
  81. Arrizabalaga, E.; García-Gusano, D.; Hermoso, N.; Muñoz, I.; Fernandez, N.; Alpagut, B.; Olivadese, R.; Dourlens, S.; Action, I. D1.3-Tools for Modelling Energy Demand, Supply Side, Simulation of Scenarios and Estimation of Impacts WP1, Task 1.3 November 2020 [M24].pdf; 2020; pp. 1–147. Available online: https://makingcity.eu/wp-content/uploads/2021/12/MakingCity_D1_3_Tools_for_modelling_Final.pdf (accessed on 27 November 2022).
  82. De Torre, C.; Rodriguez, C.; Vasallo, A. Making City. D1.2—City Diagnosis: Analysis of Existing City Plans. 2020, pp. 1–395. Available online: https://makingcity.eu/wp-content/uploads/2020/09/MakingCity_D1_2_City_Diagnosis_analysis_of_existing_city_plans_Final_V1-2.pdf (accessed on 27 November 2022).
  83. Rankinen, J.-A.; Lakkala, S.; Haapasalo, H.; Hirvonen-Kantola, S. Stakeholder management in PED projects: Challenges and management model. Int. J. Sustain. Energy Plan. Manag. 2022, 34, 91–106. [Google Scholar] [CrossRef]
  84. Schouten, C.; Brezet, H. The Urban Financial Metabolism Model: Quantifying the Societal Impact of Residential Energy Poverty in Groningen, the Netherlands. 2020. Available online: https://makingcity.eu/wp-content/uploads/2021/02/Schouten_395366_Research-Project-Report-edition-for-MAKING-CITY-website.pdf (accessed on 28 November 2022).
  85. Montalvillo, C.S.; Fredy, J.; Jaramillo, V.; Cartif, F.; Belver, A.V.; Rankinen, J.A.; Lakkala, S.; Haapasalo, H.; Hirvonen-Kantola, S.; Name, F.; et al. VI Congreso Edificios Energía Casi Nula Proyecto Making-City: Tres Distritos De Energía Positiva En Dos Ciudades Faro (Goningen Y Oulu). Int. J. Sustain. Energy Plan. Manag. 2020, 34, 1–147. [Google Scholar]
  86. Kerrigan, R.; Purshouse, N.; De Donatis, L.; Neu, O. D4.1: Limerick DST (Integrated Modelling and Decision Support Tool) Including Training Manuals/Videos +CityxChange Project Title Positive City Exchange. 2020. Available online: https://cityxchange.eu/knowledge-base/d4-1-limerick-dst-integrated-modelling-and-decision-support-tool-including-training-manuals-videos/ (accessed on 13 December 2022).
  87. Package, C.W.; Lccc, J.T.; Ul, H.F.; Lccc, R.W.; Lccc, T.C. D4.8: Limerick Citizen Observatory. 2022. Available online: https://cityxchange.eu/knowledge-base/d4-8-limerick-citizen-observatory/ (accessed on 14 December 2022).
  88. Walsh, G.; Fitzgerald, H.; Lyes, M.; Mee, A. +CityxChange D4.10: Limerick Innovation Lab Solutions Catalogue 2. 2022, pp. 1–60. Available online: https://cityxchange.eu/knowledge-base/d4-10-limerick-innovation-lab-solutions-catalogue-2/ (accessed on 22 December 2022).
  89. Sørum, A.B.; Ove Berthelsen, B.; Skoglund, T.R.; Bratseth, E.A.; Nørbech, T.; Lauvland, M.; Jensen, T.; Riedesel, K.; Gulbrandsøy, E.; Ahlers, D.; et al. D5.13: +Trondheim eMaaS Demonstration. Available online: https://cityxchange.eu/knowledge-base/d5-13-trondheim-emaas-demonstration/ (accessed on 28 November 2022).
  90. Introduction to Cityxchange. Pptx. Available online: https://view.officeapps.live.com/op/view.aspx?src=https%3A%2F%2Fcityxchange.eu%2Fwp-content%2Fuploads%2F2019%2F10%2FIntroduction_CxC-3.pptx&wdOrigin=BROWSELINK (accessed on 28 November 2022).
  91. Antolic, M.; Wright, S. D4.4: Limerick DPEB Implementation Guide 1. 2021. Available online: https://cityxchange.eu/knowledge-base/d4-4-limerick-dpeb-implementation-guide-1/ (accessed on 13 December 2022).
  92. Purshouse, N.; De Donatis, L.; Neu, O.; Kerrigan, R.; Berthelsen, B.O. D5.2: +Trondheim DST Including Training Manuals/Videos +CityxChange Project Title Positive City Exchange. 2021. Available online: https://cityxchange.eu/knowledge-base/d5-2-trondheim-dst-including-training-manuals-videos/ (accessed on 28 November 2022).
  93. Urban, S.; Package, C.W. D5.7: + Trondheim 2050 Bold City Vision and Guidelines. 2022. Available online: https://cityxchange.eu/knowledge-base/d5-7-trondheim-2050-bold-city-vision-and-guidelines-vision-for-sustainable-urban-transition/ (accessed on 22 December 2022).
  94. Grabinsky, C.; Riedesel, K.; Haugslett, A. D5.10: Trondheim Innovation Lab Solutions Catalogue (+ Trondheim Implementation of Innovation Playground). 2021. Available online: https://cityxchange.eu/knowledge-base/d5-10-trondheim-innovation-lab-solutions-catalogue/ (accessed on 13 December 2022).
  95. Package, C.W.; Tk, K.R.; Grabinsky, C.M.; Rk, M.M.; Mansilla, W.A.; Ntnu, D.A. D5.8: + Trondheim Citizen Observatory. 2021. Available online: https://cityxchange.eu/knowledge-base/d5-8-trondheim-citizen-observatory/ (accessed on 17 November 2022).
  96. Walsh, G.; Mee, A. D4.3: Limerick Innovation Lab Catalogue 1. 2020. Available online: https://cityxchange.eu/knowledge-base/d4-3-limerick-innovation-lab-solutions-catalogue-1/ (accessed on 28 November 2022).
  97. Gonçalo, J. Project Management Roadmap Technical References Project Acronym Pocityf Project Title a Positive Energy City Transformation Framework. 2021. Available online: https://pocityf.eu/wp-content/uploads/2022/06/POCITYF-864400_D11.2_Project-Management-Roadmap-version-2.pdf (accessed on 26 October 2022).
  98. Gonçalo, J. D11.4 Quality Assessment, Risk Assessment and Contingency Plans. 2020. Available online: https://pocityf.eu/wp-content/uploads/2022/06/POCITYF-864400_D11.4_Quality-Assessment-Risk-Assessment-and-Contingency-Plans.pdf (accessed on 28 November 2022).
  99. Serra, L.; Leitão, D.; Michi, C.; Schmid, E.; Bilo, N. Pocityf, D9.1; Pocityf Clustering Action Plan. Pocityf. 2020. Available online: https://pocityf.eu/wp-content/uploads/2020/09/POCITYF-864400_D9.1_Clustering-Action-Plan.pdf (accessed on 28 October 2022).
  100. Kort, J.; Klösters, M.; de Koning, N. Becoming Sustainable Together with Residents. Participation and Communication Manual for Housing Corporations. Pocityf and Tno. 2022. Available online: https://pocityf.eu/news/becoming-sustainable-together-with-residents-participation-and-communication-manual-for-housing-corporations/ (accessed on 28 November 2022).
  101. Michi, C.; Material, M.D. D10.5 Multi Dissemination Material Version 2. Pocityf. 2020. Available online: https://pocityf.eu/wp-content/uploads/2020/09/POCITYF-864400_D10.5_Multi-Dissemination-material-version-2.pdf/ (accessed on 13 December 2022).
  102. Gonçalves, L.; Patrício, L.; Teixeira, J.; Bănică, B.; POCITYF, D. 4.1: Engagement, C. Pocityf Citizen Engagement Plan. Pocityf. 2020. Available online: https://pocityf.eu/wp-content/uploads/2022/06/POCITYF-864400_D4.1_POCITYF-Citizen-Engagement-Plan.pdf (accessed on 25 October 2022).
  103. Prokscha, S. D11.8 The Data Management Plan. In Practical Guide to Clinical Data Management, 3rd ed.; CRC Press: Boca Raton, FL, USA, 2020; pp. 25–30. [Google Scholar] [CrossRef]
  104. Kourtzanidis, K.; Angelakoglou, K.; Giourka, P.; Tsarchopoulos, P.; Nikolopoulos, N.; Ioannidis, D.; Kantorovitch, J.; Formiga, J.; Verbeek, K.; de Vries, M.; et al. Technical and Innovation Management Plans. Pocityf. 2020. Available online: https://pocityf.eu/wp-content/uploads/2022/06/POCITYF-864400_D11.7_Technical-and-Innovation-Management-Plans.pdf (accessed on 28 November 2022).
  105. Kottek, M.; Grieser, J.; Beck, C.; Rudolf, B.; Rubel, F. World map of the Köppen-Geiger climate classification updated. Meteorol. Z. 2006, 15, 259–263. [Google Scholar] [CrossRef] [PubMed]
  106. Beck, H.E.; Zimmermann, N.E.; McVicar, T.R.; Vergopolan, N.; Berg, A.; Wood, E.F. Present and future Köppen-Geiger climate classification maps at 1-km resolution. Sci. Data 2018, 5, 180214. [Google Scholar] [CrossRef] [PubMed] [Green Version]
  107. Chen, D.; Chen, H.W. Using the Köppen classification to quantify climate variation and change: An example for 1901–2010. Environ. Dev. 2013, 6, 69–79. [Google Scholar] [CrossRef]
  108. Fatima, Z.; Pollmer, U.; Santala, S.-S.; Kontu, K.; Ticklen, M. Citizens and Positive Energy Districts: Are Espoo and Leipzig Ready for PEDs? Buildings 2021, 11, 102. [Google Scholar] [CrossRef]
  109. Hukkalainen, M.; Fatima, Z.; Klobut, K.; Piira, K.; Ranta, M.; Hajduk, P.; Vainio-Kaila, T.; Wanne, E.; Tartia, J.; Bartel, A.; et al. D3.2 Midterm Report on the Implemented Demonstrations of Solutions for Energy Positive Blocks in Espoo. 2021. Available online: https://www.sparcs.info/about/deliverables/d302-midterm-report-implemented-demonstrations-solutions-energy-positive-blocks (accessed on 13 December 2022).
  110. Martinopoulos, G.; Nikolopoulo, N.; Angelakoglou, K.; Giourka, P. RESPONSE D2.1 KPI Framework. 2021. Available online: https://h2020response.eu/wp-content/uploads/2022/05/D2.1-RESPONSE-KPI-Framework.pdf (accessed on 13 December 2022).
  111. Technical University of Denmark; Global Wind Atlas. Global Wind Atlas 30. 2021. Available online: https://globalwindatlas.info/en (accessed on 14 November 2022).
  112. Hukkalainen, M.; Zarrin, F.; Klobut, K.; Lindholm, O.; Ranta, M.; Vainio-Kaila, T.; Wanne, E.; Tartia, J.; Horn, H.; Kontu, K.; et al. D3.1 Detailed Plan of the Espoo Smart City Lighthouse Demonstrations; Sparcs: Espoo, Finland, 2020. [Google Scholar]
  113. Li, H.; Svendsen, S. District Heating Network Design and Configuration Optimization with Genetic Algorithm. J. Sustain. Dev. Energy Water Environ. Syst. 2013, 1, 291–303. [Google Scholar] [CrossRef]
  114. Krug, R.; Mehrmann, V.; Schmidt, M. Nonlinear optimization of district heating networks. Optim. Eng. 2021, 22, 783–819. [Google Scholar] [CrossRef]
  115. Delangle, A.; Lambert, R.S.C.; Shah, N.; Acha, S.; Markides, C.N. Modelling and optimising the marginal expansion of an existing district heating network. Energy 2017, 140, 209–223. [Google Scholar] [CrossRef]
  116. Zhang, S.; Gu, W.; Qiu, H.; Yao, S.; Pan, G.; Chen, X. State estimation models of district heating networks for integrated energy system considering incomplete measurements. Appl. Energy 2021, 282, 116105. [Google Scholar] [CrossRef]
  117. Sartor, K.; Thomas, D.; Dewallef, P. A comparative study for simulating heat transport in large district heating networks. Int. J. Heat Technol. 2018, 36, 301–308. [Google Scholar] [CrossRef]
  118. Forman, C.; Muritala, I.K.; Pardemann, R.; Meyer, B. Estimating the global waste heat potential. Renew. Sustain. Energy Rev. 2016, 57, 1568–1579. [Google Scholar] [CrossRef]
  119. Wahlroos, M.; Pärssinen, M.; Rinne, S.; Syri, S.; Manner, J. Future views on waste heat utilization—Case of data centers in Northern Europe. Renew. Sustain. Energy Rev. 2018, 82, 1749–1764. [Google Scholar] [CrossRef]
  120. Papapetrou, M.; Kosmadakis, G.; Cipollina, A.; La Commare, U.; Micale, G. Industrial waste heat: Estimation of the technically available resource in the EU per industrial sector, temperature level and country. Appl. Therm. Eng. 2018, 138, 207–216. [Google Scholar] [CrossRef]
  121. Chien, F.; Kamran, H.W.; Albashar, G.; Iqbal, W. Dynamic planning, conversion, and management strategy of different renewable energy sources: A Sustainable Solution for Severe Energy Crises in Emerging Economies. Int. J. Hydrogen Energy 2021, 46, 7745–7758. [Google Scholar] [CrossRef]
  122. Haseli, Y. Maximum conversion efficiency of hydrogen fuel cells. Int. J. Hydrogen Energy 2018, 43, 9015–9021. [Google Scholar] [CrossRef]
  123. Manoharan, Y.; Hosseini, S.E.; Butler, B.; Alzhahrani, H.; Senior, B.T.F.; Ashuri, T.; Krohn, J. Hydrogen Fuel Cell Vehicles; Current Status and Future Prospect. Appl. Sci. 2019, 9, 2296. [Google Scholar] [CrossRef] [Green Version]
  124. Khan, U.; Yamamoto, T.; Sato, H. An insight into potential early adopters of hydrogen fuel-cell vehicles in Japan. Int. J. Hydrogen Energy 2021, 46, 10589–10607. [Google Scholar] [CrossRef]
  125. Ardente, F.; Beccali, G.; Cellura, M.; Brano, V.L. Life cycle assessment of a solar thermal collector. Renew. Energy 2005, 30, 1031–1054. [Google Scholar] [CrossRef]
  126. Hirst, L.C.; Ekins-Daukes, N.J. Fundamental losses in solar cells. Prog. Photovolt. Res. Appl. 2010, 19, 286–293. [Google Scholar] [CrossRef]
  127. van der Ende, B.M.; Aarts, L.; Meijerink, A. Lanthanide ions as spectral converters for solar cells. Phys. Chem. Chem. Phys. 2009, 11, 11081–11095. [Google Scholar] [CrossRef]
  128. Huang, X.; Han, S.; Huang, W.; Liu, X. Enhancing solar cell efficiency: The search for luminescent materials as spectral converters. Chem. Soc. Rev. 2012, 42, 173–201. [Google Scholar] [CrossRef]
  129. Jurasz, J.; Canales, F.A.; Kies, A.; Guezgouz, M.; Beluco, A. A review on the complementarity of renewable energy sources: Concept, metrics, application and future research directions. Sol. Energy 2020, 195, 703–724. [Google Scholar] [CrossRef]
  130. Liu, X.; Wang, Y.; Xie, F.; Yang, X.; Han, L. Improving the Performance of Inverted Formamidinium Tin Iodide Perovskite Solar Cells by Reducing the Energy-Level Mismatch. ACS Energy Lett. 2018, 3, 1116–1121. [Google Scholar] [CrossRef]
  131. Westerlund, M. Social Acceptance of Wind Energy in Urban Landscapes. Technol. Innov. Manag. Rev. 2020, 10, 49–62. [Google Scholar] [CrossRef]
  132. Leiren, M.D.; Aakre, S.; Linnerud, K.; Julsrud, T.E.; Di Nucci, M.-R.; Krug, M. Community Acceptance of Wind Energy Developments: Experience from Wind Energy Scarce Regions in Europe. Sustainability 2020, 12, 1754. [Google Scholar] [CrossRef] [Green Version]
  133. Chen, H.; Cong, T.N.; Yang, W.; Tan, C.; Li, Y.; Ding, Y. Progress in electrical energy storage system: A critical review. Prog. Nat. Sci. 2009, 19, 291–312. [Google Scholar] [CrossRef]
  134. AL Shaqsi, A.Z.; Sopian, K.; Al-Hinai, A. Review of energy storage services, applications, limitations, and benefits. Energy Rep. 2020, 6, 288–306. [Google Scholar] [CrossRef]
  135. Olabi, A.G.; Onumaegbu, C.; Wilberforce, T.; Ramadan, M.; Abdelkareem, M.A.; Alami, A.H.A. Critical review of energy storage systems. Energy 2021, 214, 118987. [Google Scholar] [CrossRef]
Figure 1. Autonomous PED.
Energies 16 00356 g001
Figure 2. Dynamic PED.
Energies 16 00356 g002
Figure 3. Virtual PED.
Energies 16 00356 g003
Figure 4. Implemented method in this study.
Energies 16 00356 g004
Figure 5. Geographical location of the analysed PEDs.
Energies 16 00356 g005
Figure 6. Köppen climate classification map and the class of the examined cities [105,106,107].
Energies 16 00356 g006
Figure 7. Summary diagram of the main technological choices in different typologies of PED.
Energies 16 00356 g007
Figure 8. Data collection and systemisation of information of the analysed case studies. “●” means that the technological solution was carried out, “-” means that the technology was not selected. Wind speed information was obtained with the Global Wind Atlas developed by the Technical University of Denmark [111].
Energies 16 00356 g008
Figure 9. Number of technology selections with reference to the total number of case studies.
Energies 16 00356 g009
Figure 10. Summary diagrams of the most frequently used technological choices in continental climate Dfb/Dfc.
Energies 16 00356 g010
Figure 11. Summary diagrams of the most frequently used technological choices in oceanic climate Cfb.
Energies 16 00356 g011
Figure 12. Summary diagrams of the most frequently used technological choices in Mediterranean climate Csa.
Energies 16 00356 g012
Table 1. Case studies examined.
Project NameCityWebsiteReferences
Sparcs Espoo (FI)ESPOO | Sparcs[58,59,60,61]
SparcsLeipzig (DE)LEIPZIG | Sparcs[62,63,64]
RESPONSETurku (FI)Lighthouse Cities—RESPONSE (h2020RESPONSE.eu)[65,66,67,68,69,70]
RESPONSEDijon (FR)Lighthouse Cities—RESPONSE (h2020RESPONSE.eu)[65,66,67,68,69,70]
AtelierAmsterdam (NL)General Information—ATELIER (smartcity-atelier.eu)[71,72,73,74,75,76,77,78,79,80]
AtelierBilbao (ES)Bilbao—ATELIER (smartcity-atelier.eu)[72,73,75,76,77,78,79,80]
MAKING-CITYMAKING-CITYGroningen (NL)GRONINGEN–MAKING-CITY[81,82,83,84,85]
MAKING-CITYMAKING-CITYOulu (FI)OULU–MAKING-CITY[81,82,83,84,85]
+CityxChangeLimerik (IR)Our Cities—+CityxChange[86,87,88,89,90,91]
+CityxChangeTrondheim (NO)Our Cities—+CityxChange[89,90,92,93,94,95,96]
POCITYFEvora (PT)Évora—POCITYF—POCITYF[97,98,99,100,101,102,103,104]
POCITYFAlkmaar (NO)Alkmaar—POCITYF—–POCITYF[97,98,99,100,101,102,103,104]
Disclaimer/Publisher’s Note: The statements, opinions and data contained in all publications are solely those of the individual author(s) and contributor(s) and not of MDPI and/or the editor(s). MDPI and/or the editor(s) disclaim responsibility for any injury to people or property resulting from any ideas, methods, instructions or products referred to in the content.

