
Optimization of Oil Productivity from the Ultra−Depth Strike−Slip Fault−Controlled Carbonate Reservoirs in Northwestern China

1
PetroChina Tarim Oilfield Company, Korla 841000, China
2
School of Geoscience and Technology, Southwest Petroleum University, Chengdu 610500, China
*
Authors to whom correspondence should be addressed.
Energies 2022, 15(9), 3472; https://doi.org/10.3390/en15093472
Submission received: 11 February 2022
/
Revised: 23 April 2022
/
Accepted: 28 April 2022
/
Published: 9 May 2022
(This article belongs to the Special Issue The Optimization of Well Testing Operations for Oil and Gas Field)
Abstract
:The largest ultra−deep (>7000 m) strike−slip fault−controlled oilfield was found in the tight Ordovician carbonates in the Tarim Basin. Because oil production wells in the Fuman Oilfield generally have bottom water, a reasonable production design is of significant importance for extending the water−free oil recovery period and improving oil recovery. However, there is no economical and effective quantitative method to determine a reasonable production capacity and a corresponding reasonable work system for stable−production wells in fault−controlled fractured carbonate reservoirs. In this contribution, we integrated the dynamic and static data of different types of wells in the Fuman Oilfield. It was found that there is a positive relationship between well−controlled dynamic reserves and reasonable productivity, and the productivity corresponding to the upper limit of the reserve can be defined as reasonable productivity. Further, we proposed a correlation equation between well−controlled dynamic reserves and reasonable productivity that shows the reasonable productivity of a stable well from the well−controlled dynamic reserve, which was obtained by combining the well productivity test and analogous well productivity test methods. The relationship between the reasonable productivity per unit nozzle and the rational productivity was obtained according to the determined matching relationship between the reasonable productivity of the stable−production well and the nozzle. The application results show that it can not only quickly determine the reasonable production capacity of stable−production wells but also deepen the understanding of the quantitative characteristics of the production capacity of the Fuman Oilfield. It also provides insight in the rational production allocation of new wells and optimize the development design, which supports the 1500 × 104 bbl/year oil production from the ultra−deep fractured carbonate reservoirs along the strike−slip fault zones in the Tarim Basin.
1. Introduction
With the exploitation of ultra−deep (>6000 m) reservoirs, high permeable structures play a significant role in hydrocarbon accumulation and exploitation [1,2]. Strike−slip faults are widely developed on the Earth’s crust [3,4,5], but they have such complicated effects on oil and gas accumulation that far fewer hydrocarbon resources have been discovered in intracratonic basins [6,7]. Recently, a large strike−slip fault−controlled petroleum system was found in the central area of the Tarim Basin [8,9] (Figure 1). Two billion tons of geological oil equivalent reserves have been found in the Ordovician carbonates, which becomes a key exploitation domain in the Tarim Basin [9,10]. Because of the significant burial depth (>7000 m) of the tight Ordovician carbonate rocks and the poor resolution of the seismic data in the region, it is difficult to image the complex strike−slip fault system and the fractured reservoirs, which have a complicated triple−porosity assemblage of fractures, pores, and vug−caves and strong heterogeneity in the deep fault damage zones [11,12,13].
Generally, ultra−deep fault−controlling oil accumulations are thought to be no economical exploitation potential by conventional exploitation methods, which hampers reservoir description and production optimization in the carbonate rocks [12]. Considering the strong reservoir heterogeneity that led to the significantly varied production among different wells, how to determine the reasonable production allocation of the production wells is one of the key factors for economic development. At present, the research methods of reasonable productivity mainly include numerical simulation, systematic well testing, and statistical and analogy methods [14,15,16,17,18,19]. For fault−controlled fracture−cave reservoirs characterized by coexisting pipe flow and seepage fluids [20], the numerical simulation method based on the continuum theory is difficult to be applied to the research and determination of single−well productivity [21]. Statistical methods need too many data to established a unified expression to show the essential factors that affect the productivity of a single well. The analogy method has a relatively large error for the development characteristics of the intensely heterogeneous reservoirs among wells. The systematic well testing method has high accuracy, but only a few key wells had field experiment because of the limitation of dynamic monitoring funds, and most wells cannot rely on this method to obtain reasonable productivity, especially the new wells to be deployed in the development scenario [9,12].
For this contribution, we used the compiled dynamic and static data of different types of wells from the past 3 years and distinguished the essential factors affecting the reasonable productivity of a single well for the well−controlled dynamic reserves. Furthermore, we proposed a mathematical relationship between reasonable productivity and well−controlled dynamic reserves. Finally, we had applications to take advantage of the optimization of oil productivity that is more suitable for old well production and new well deployment.
2. Geological Background
The Tarim Basin covers an area of 56 × 104 km2 and is an intracratonic basin with multi−cycle tectonic–sedimentary evolution in northwestern China [22]. The Cryogenian–Quaternary sedimentary strata are well−developed and are composed of five tectonic layers, including the Pre−Cryogenian basement, the rift succession of the Cryogenian–Ediacaran, the intracratonic marine carbonate platform of the Cambrian–Ordovician and the siliciclastics of the Silurian−Cretaceous, and the terrestrial siliciclastics of the Cenozoic foreland basin [23]. The Tarim Basin has undergone more than 10 stages of tectonic movements and developed multi−stage, multi−type, and diverse faults [22,23]. The strike−slip fault−controlled ultra−deep petroleum system covers an area of 9 × 10⁴ km2 in the central Tarim Basin (Figure 1). More than 70 large strike−slip fault zones have been identified from seismic data, with lengths of 30–80 km in general, and the major fault FI1 is up to 290 km in length. Fault FI1 divides the strike−slip fault system into two belts from west to east. From south to north, the strike−slip fault system is divided into three domains. The strike−slip faults mainly occurred in the Cambrian–Ordovician carbonates with transpressional faults but have been inherited by transtensional faults upward to the overlying strata [8,9,10,23,24,25]. The oil and gas resources have mainly been discovered in the Ordovician fracture−cave reservoirs, which feature complicated reservoir and fluid distribution and production [26,27,28,29,30].
The Fuman Oilfield is located in the northern area of the strike−slip fault system in the Tarim Basin (Figure 1). Studies have shown that the strike−slip fault system has complex and diverse geometric characteristics [8,9,10,13,23]. The fault system formed through different regional deformation events in the Mid–Late Caledonian, Late Caledonian–Early Hercynian, Late Hercynian, and Yanshan–Early Himalayan [8,23,25]. The fault−controlled fracture−cave carbonate reservoirs developed in the Upper Ordovician limestones along the strike−slip fault zones. The reservoir is dominated by dissolution pores, caves, and fractures, and localized large−scale caves are the main targets for oil production [9,13,30,31]. The large fracture−cave reservoirs, which have complicated triple porosity and heterogeneity, are distributed in strip shapes along the fault damage zones on the plane and are plate−shaped in the vertical section, showing “bead−shape” seismic reflection in the seismic section [26,31]. The oil–water relationship of this kind of reservoir is very complicated, with generally no uniform oil–water interface or locally sealed water, but many fault zones have active strong bottom water (including the water immediately underlying the oil pool and deep water connected by the fracture network) [9,30,31]. The development practice of the Fuman Oilfield shows that ~30% of wells could be stable oil production wells and provide more than 80% of the total oil production. An increase in the waterless oil production period of stable−production wells is important for sustainable and efficient oil development. It is an important task for reservoir management to adopt a reasonable production capacity for stable−production wells. In addition, the conventional reservoir engineering methods are not favorable for the oil production design of the complex fluid flow from the fault−controlled fractured carbonate reservoirs [32].
3. Influence of Productivity Rationality on Development Effect of Different Types of Wells
There are 84 oil wells with cumulative oil production greater than 1 × 10⁴ t in the Fuman Oilfield. According to their production characteristics, they are divided into three categories: stable production, slow−decline production, and rapid decline production. Different types of wells present distinct production characteristics [9] (Figure 2). Stable−production wells show a long self−injection time, strong bottom water and natural energy, and stable oil pressure and production before the water cut in test production. After the water cut, the water production increases quickly, and the oil pressure and production decrease rapidly. Slow−decline wells have a short self−injection time with some bottom water and ordinary natural energy, and the oil pressure and production decline during test production. Rapid decline wells have a short self−injection time with much bottom water, insufficient natural energy, and a rapid decline in oil pressure and production in test production.
In order to analyze the influence of productivity rationality on the development effect of different types of wells, we first used numerical simulation to study the mechanism and clarify the overall macroscopic fluid flow laws. Then, we proposed a similar theoretical model in which the basic parameters were set according to the data of the wells that have been put into production. Wells were designed for production, one set without bottom water and the other set wells with strong bottom water. A simulation study was carried out on the production wells under two conditions with different productivity settings. The simulation results (Figure 3) showed that for fast decline and slow−decline wells, the rationality of production capacity affected the production decline rate and the self−injection period. That is, the larger the production capacity, the faster the production capacity decline rate. By contrast, there is smaller the production capacity and slower production decline rate during the longer the self−injection period.
For stable−production wells, the rationality of production capacity can control the bottom water breakthrough time and thus affect the stable production period and development effect. The higher the production capacity, the earlier the bottom water breakthrough time, and the faster the rise in water content. By contrast, there is shorter stable production period and worse development effect in the low production capacity wells (Figure 4). This is consistent with actual production, such as that of well Y801−H6 (Figure 5). In the early stage, the production capacity was continuously increased and showed stable production. However, excessive production capacity amplification also accelerated the water breakthrough time. After 572 days of production, water breakthrough occurred, and the water cut increased rapidly. The production capacity reduced from 2448 bbl/d to 410 bbl/d before the water breakthrough, with a decrease ration of 83%. The cliff−like decline in production was up to 60 × 104 bbl per year.
Therefore, the production capacity has a significant impact on the development effect of stable−production wells. While a small production capacity design led to an unreasonable release of production capacity, a large production capacity design led to an excessive release of production capacity that resulted in an acceleration of the water breakthrough time and a shortening of the water−free oil production period. These seriously constrain the development effect in the Fuman Oilfield, which is assumed to be a low economical oilfield in the deep subsurface.
4. Relationship between Reasonable Productivity and Well Control Dynamic Reserves
4.1. Relationship between Single Well Productivity and Well Control Dynamic Reserves
Together with the static and dynamic reservoir data, we performed an evaluation of the dynamic reserves of all production wells in the Fuman Oilfield. It showed that the types of production wells were closely related to the size of the dynamic reserves [9]. The dynamic reserves of quick−decline wells are less than 367 × 104 bbl, and those of slow−decline wells are (386–660) × 104 bbl; the dynamic reserves of stable−production wells are more than 660 × 104 bbl (Figure 6). The average dynamic reserves of different types of wells are 138 × 104 bbl for quick−decline wells, 386 × 104 bbl for slow−decline wells, and 1168 × 104 bbl for stable−production wells.
In this context, we analyzed the relationship between dynamic reserves and various dynamic production parameters. Figure 7 shows the average cumulative oil production and the oil production index of different types of wells during the self−injection period. The average cumulative oil production during the self−injection period and the average oil production index in the steady production wells were higher than those in the slow decline wells and quick−decline wells. This suggests that the larger the dynamic reserves, the more abundant the formation energy and the more stable the pressure. The statistical data (Figure 8) showed that the initial average productivity is relatively small for stable−production wells, and the largest productivity was found in the rapid decline wells. On the other hand, the stable−production wells had the largest average dynamic reserves, resulting in the smallest initial average productivity/average dynamic reserves rather than the largest ratio in the quick−decline wells. This suggests that initial production with relatively high productivity and relatively low dynamic reserves are the main controlling factors that lead to the rapid decline rate of quick−decline production. Therefore, it is reasonable that the smaller the dynamic reserves, the lower the initial production allocation. In this context, the relationship between productivity and dynamic reserves can be analyzed to calibrate the reasonable production capacity of a production well design.
These data show that the dynamic reserves is closely related to the development dynamic parameters, such as productivity, pressure drop rate, and cumulative production during the self−flowing period. Using these data, we proposed a relationship between initial productivity and dynamic reserves for all types of wells, which are divided into distinct three domains in Figure 9: the unreasonable productivity area in the upper right corner, the reasonable productivity area in the middle area, and the area in the lower left corner that needs to be adjusted for further release productivity. These were generally characterized by a positive correlation between the initial reasonable productivity of a single well and the well−controlled dynamic reserves. In other words, the larger the dynamic reserve wells have the higher reasonable production capacity. Furthermore, the data suggest a trapezoidal fluctuation range of reasonable productivity, which is mainly composed of stable−production wells, and the size of the range increases with the dynamic reserves. this is not conducive to long−term production of the wells beyond the trapezoidal fluctuation range, but the well production capacity needs adjustment below the inner boundary of the trapezoid according to the production task. In the actual single−well management process, it is only necessary to determine the relationship between the productivity of the trapezoidal outer boundary and the well−controlled dynamic reserves to determine the reasonable well productivity through the well−controlled dynamic reserves. This is attributable to the correlation between reasonable productivity and well−controlled dynamic reserves.
4.2. Reasonable Productivity−Well Control Dynamic Reserves Correlation
By integrating the dynamic and static data from the production wells, we determined the corresponding reasonable productivity under different well−controlled dynamic reserves. For wells with systematic well testing data, the reasonable productivity of a single well can be obtained by combining the pressure drop breakpoint method and the production increment trend method. Taking well F210 as an example, the IPR curve shows that the flow state is a single−phase non−Darcy flow (Figure 10).
On this basis, we used the test data to draw the correlation curve of production, flow pressure, and nozzle and the relationship between the oil production index and the production pressure (Figure 11 and Figure 12). In Figure 11, the slope of the flow pressure curve indicates the pressure drop loss rate. In the pressure drop breakpoint analysis, the pressure drop loss speed was significantly accelerated at 4 mm nozzle, in which there was an obvious breakpoint and bad energy utilization efficiency. As a result, a reasonable production capacity should be able to consume the least energy and achieve the best production capacity. In this way, the pressure drop breakpoint at 4 mm nozzle is the optimal and reasonable production mode. In Figure 12, we used the production incremental trend method. As the nozzle continuously increased from 3 mm to 4 mm, the oil production index gradually decreased, but the production pressure change showed an increasing trend. The oil production index and production pressure corresponding to two adjacent working systems are drawn into a trapezoidal area, which can be defined as the cumulative increased oil production (Qa) with nozzle rise. As the nozzle increased from 3 mm to 4 mm, 5 mm and 6 mm, production Qa (bbl/d) increased to 616 bbl/d (Qa1), 722 bbl/d (Qa2) and 645 bbl/d (Qa3), respectively. Defining ∆Qa as the cumulative oil increase of the relative increased nozzle, we obtain ∆Qa1 = Qa2 − Qa1 = 106 bbl/d and ∆Qa2 = Qa3 − Qa2 = −77 bbl/d. This shows that with an increase in the nozzle, the actual production increase rate slowed down. If the nozzle exceeded 5 mm, the cumulative oil increase with the relatively increased nozzle became a negative value. According to the production increment trend, this also indicates that the 4 mm nozzle is the optimal and reasonable production mode. To sum up, the reasonable productivity of well F210 is about 840 bbl/d, corresponding to the test output of the 4 mm nozzle, and the dynamic reserve of well F210 is up to 1300 × 104 bbl.
We collected the production data on daily oil production and pressure of the 84 wells in the past 3 years in the Fuman Oilfield. On the compiled data, we used the productivity test method and the analog productivity test method to analyze the data. Before the statistical analysis, there were a few production tests to confirm the linearity and homogeneity of the data. With the production pressure increase, the corresponding production increase rate decreased quickly, which suggests a sharp drop in the production index and a distinct acceleration of pressure drop. As a significant transition point, the speed of bottom water coning increased the risk of early water breakthrough by the formation energy utilization, which decreased with the production pressure increase. As a result, it can check and correct the corresponding output under varied working systems to show reasonable production allocation. Statistical data analysis showed that there are few wells with systematic well test data. Therefore, it is impossible to obtain reasonable productivity corresponding to different dynamic reserves by systematic well test data. On this context, we selected a group of wells that met the following requirements: (1) stable production; (2) coverage of different dynamic reserve sizes; (3) long production time with detailed production data; (4) a working system that has changed several times and reached a relatively stable state during the production process. The quasi−system well testing method was used for these wells to obtain reasonable productivity corresponding to different dynamic reserves. For example, well Y701 has not been tested systematically and has a dynamic reserve of 700 × 104 bbl. Various working systems of 3 mm, 3.5 mm, 4 mm and 5 mm were used in the production process, and each corresponded to relatively stable production (Table 1).
In Figure 13, according to the data, the pressure drop breakpoint shows a reasonable working system of 4 mm, corresponding to a reasonable production capacity of 440 bbl/d. In this way, a reasonable productivity can be calibrated by well dynamic reserve. This can lead to a mathematical relationship between reasonable productivity and well−controlled dynamic reserves (Figure 14). The formula is as follows:
(Q: reasonable production capacity, t/d; Nt: dynamic reserve, 104 bbl)
Q = 0.6956 Nt − 8.2219 (Nt ≥ 367)
According to the obtained formula, the reasonable productivity can be inferred from the dynamic reserves of stable−production wells. Using the reasonable production capacity combined with the size of the nozzle corresponding to the reasonable production capacity, we obtained a scatter diagram of the reasonable production capacity and the reasonable production capacity of the unit nozzle (Figure 15). In this way, the nozzle size corresponding to any reasonable production capacity can be inferred.
5. Applications
5.1. Reasonable Productivity Calibration
Based on these results, we had applications on the reasonable productivity calibration and allocation of the production wells in the Fuman Oilfield. Taking well Y10 as an example, the dynamic reserves are 1100 × 104 bbl and the reasonable production capacity is inferred to be 700 bbl/d, corresponding to a reasonable oil nozzle of 5 mm. According to the above method, we calibrated the reasonable productivity of 22 stable−production wells in the Fuman Oilfield (Figure 16). This showed distinct variation in the reasonable production capacity of oil wells in the Fuman Oilfield. According to the production capacity division standard of the Fuman Oilfield (daily production ≥730 bbl is high production, between 330–730 bbl is medium production, and ≤330 bbl is low production), there is a high production capacity of stable−production wells in the Fuman Oilfield. To sum up, the rational productivity equation inferred from the well−controlled dynamic reserves improved the reasonable productivity evaluation of stable−production wells in the Fuman Oilfield. In this way, we can determine the productivity optimization of stable−production wells and confirm a reasonable development order to achieve economical oil exploitation from the complicated ultra−deep oilfield.
5.2. Prediction and Optimization of Development Indicators
As the development plan for a certain oil development block, the rational allocation of new well production is crucial to the prediction of the development indicators. Because the new wells to be deployed with static reserves data, it is difficult to reasonably allocate production in the complicated oilfield. The previous work has mainly been on analogs with the adjacent areas to infer the average single−well productivity of new wells. According to the annual change trend of the average single−well productivity, we can predict the annual average single−well productivity of new wells in the exploitation area and obtain the production index. However, this method has a large error due to the strong heterogeneity of the fault−controlled reservoirs. It cannot obtain the differential production allocation of each well, but leads to low accuracy of the prediction index. On the contrary, the application of the reasonable productivity–dynamic reserves method can more objectively reflect the different production of each well. It shows a good correlation between the reasonable productivity–dynamic reserve by the specific method of counting the dynamic and static reserves of the production wells in the Fuman Oilfield. Therefore, the static reserves can be used as proxy of the dynamic reserves to substitute the reasonable production capacity–dynamic reserves relationship. The reasonable production allocation of a new well can be inferred to more accurately design.
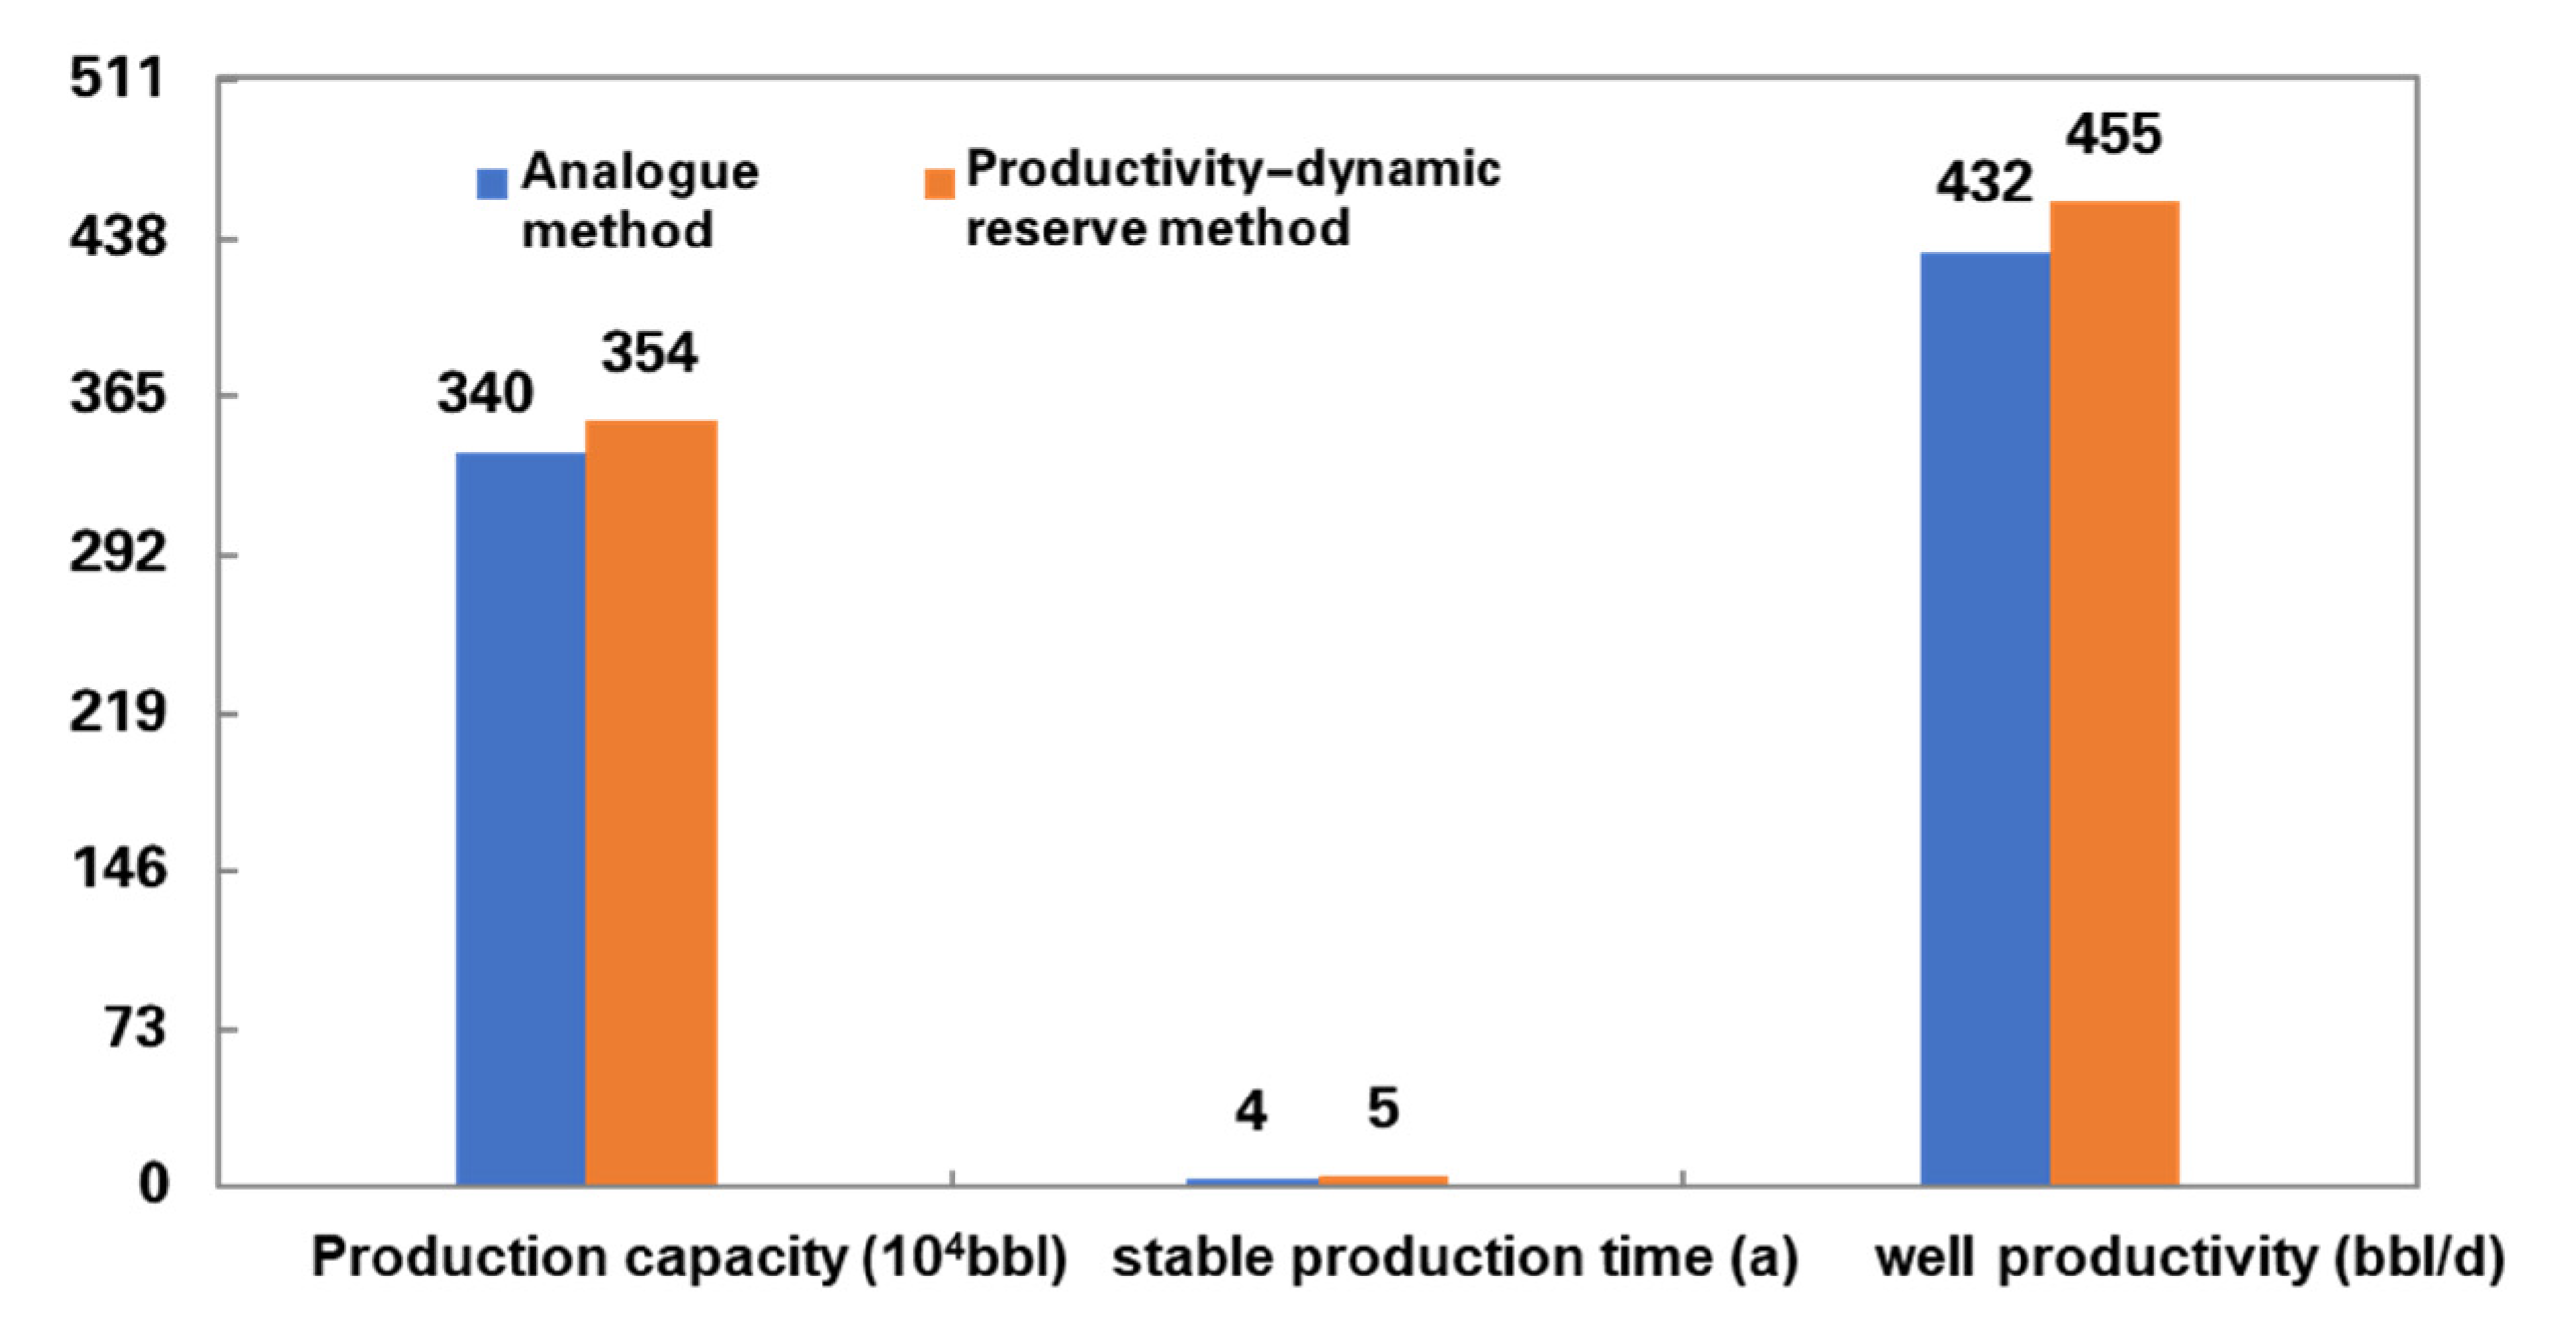
Taking a block as an example, the annual production allocation results of new wells using the analogy method and the reasonable productivity–dynamic reserves method are shown in Table 2. It shows that the reasonable productivity–dynamic reserves method is favorable for the differentiated production allocation for each new well. In this way, the scale of new production capacity, the period of stable production, and the key indicators of the average single−well productivity are all better than the analogy method (Figure 17).
Supported by these advances, more than 100 wells have obtained high and stable oil production with more than a 20% increase ratio in the Fuman Oilfield. In addition, there have been remarkable achievements in economic and large−scale development of the carbonate reservoirs for the ultra−deep strike−slip fault−controlled oilfield, with oil production of 1500 × 104 bbl/a since 2021. This case provides new insights and methods for similar oil/gas reservoir evaluation and development.
6. Conclusions
Although ultra−deep strike−slip fault−controlled oil accumulations are hard to predict in the subsurface, static and dynamic production data provide a powerful tool for well productivity analysis. The integrated analysis of the Ordovician fractured reservoirs in the Tarim Basin presented in this study is summarized in the following conclusions.
(1) The reasonable production capacity is important for stable production and efficient oil development in the ultra−deep Fuman Oilfield.
(2) The relationship between well productivity and dynamic reserves is characterized by three distinct domains, which are divided into unreasonable productivity, reasonable productivity, and unreleased productivity. The reasonable production capacity has a positive relationship with the dynamic reserve.
(3) The evaluation method of reasonable productivity–dynamic reserves is favorable for evaluating and determining the reasonable productivity of the production wells, indicating the productivity distribution and supporting production adjustment.
(4) Through the productivity evaluation for rational production allocation and optimization, the Fuman Oilfield has becominge the largest ultra−depth strike−slip fault−controlled oilfield in China, with oil production of 1500 × 104 bbl/a.
Author Contributions
Conceptualization, X.H. and R.W.; methodology, S.L. and C.Y.; software, C.Y.; investigation, S.L. and C.Y.; data curation, C.Y. and G.W.; writing—original draft preparation, C.Y. and G.W.; writing—G.W. and C.Y.; visualization, C.Y.; supervision, R.W. and J.Y.; funding acquisition, X.H. and R.W. All authors have read and agreed to the published version of the manuscript.
Funding
Prospective Basic Research Project of CNPC (2021DJ1502) and the National Natural Science Foundation of China (Grant No. 9195520441472103).
Institutional Review Board Statement
Not applicable.
Informed Consent Statement
Not applicable.
Data Availability Statement
Not applicable.
Acknowledgments
The authors thank the editor and reviewer for their comments regarding manuscript improvement. This study was partly supported by Prospective Basic Research Project of CNPC (2021DJ1502) and the National Natural Science Foundation of China (Grant No. 91955204).
Conflicts of Interest
The authors declare no conflict of interest.
References
- Sun, L.D.; Zou, C.N.; Zhu, R.K.; Zhang, Y.H.; Zhang, S.C.; Zhang, B.M.; Zhu, G.Y.; Gao, Z.Y. Formation, distribution and potential of deep hydrocarbon resources in China. Pet. Explor. Dev. 2013, 40, 687–695. [Google Scholar] [CrossRef]
- Tong, X.G.; Zhang, G.Y.; Wang, Z.M.; Wen, Z.X.; Tian, Z.J.; Wang, H.J.; Ma, F.; Wu, Y.P. Distribution and potential of global oil and gas resources. Pet. Explor. Dev. 2018, 45, 779–789. [Google Scholar] [CrossRef]
- Sylvester, A.G. Strike-slip faults. Geol. Soc. Am. Bull. 1988, 100, 1666–1703. [Google Scholar] [CrossRef]
- Woodcock, N.H.; Schubert, V. Continental Strike-Slip Tec-Tonics; Pergamon Press: Oxford, UK, 1994; pp. 251–263. [Google Scholar]
- Cunningham, W.D.; Mann, P. Tectonics of strike-slip re-straining and releasing bends. Lond. Geol. Soc. 2007, 290, 1–12. [Google Scholar] [CrossRef] [Green Version]
- Leighton, M.W.; Kolata, D.R.; Oltz, D.F.; Eidel, J.J. Interior Cratonic Basins. AAPG Mem. 1990, 51, 1–819. [Google Scholar]
- Mann, P. Comparison of structural styles and giant hydro-carbon occurrences within four active strike-slip regions: Cal-ifornia, Southern Caribbean, Sumatra, and East China. AAPG Mem. 2013, 100, 43–93. [Google Scholar]
- Yang, H.J.; Wu, G.H.; Han, J.F.; Su, Z. Structural analysis of strike-slip faults in the Tarim intracratonic Basin. Chin. J. Geol. 2020, 55, 1–16, (In Chinese with English Abstract). [Google Scholar]
- Yang, X.W.; Wang, R.J.; Deng, X.L.; Li, S.Y.; Zhang, H.; Yao, C. Theoretical exploration and practice of water injection gravity flooding oil in ultra-deep fault-controlled fractured-cavity carbonate reservoirs. Pet. Explor. Dev. 2022, 49, 133–143. [Google Scholar] [CrossRef]
- Deng, S.; Zhao, R.; Kong, Q.F.; Li, Y.T.; Li, B. Two distinct strike-slip fault networks in the Shunbei area and its surroundings, Tarim Basin: Hydrocarbon accumulation, distribution, and controlling factors. AAPG Bull. 2022, 106, 77–102. [Google Scholar] [CrossRef]
- Wu, G.H.; Zhao, K.Z.; Qu, H.Z.; Nicola, S.; Zhang, Y.T.; Han, J.F.; Xu, Y.F. Permeability distribution and scaling in multi-stages carbonate damage zones: Insight from strike-slip fault zones in the Tarim Basin, NW China. Mar. Pet. Geol. 2020, 114, 104208. [Google Scholar] [CrossRef]
- Wang, Q.H.; Yang, H.J.; Wang, R.J.; Li, S.Y.; Deng, X.L.; Li, Y.; Chang, L.J.; Wan, X.G.; Zhang, Y.T. Discovery and exploration technology of fault-controlled large oil and gas fields of ultra-deep formation in strike slip fault zone in Tarim Basin. China Pet. Explor. 2021, 26, 58–71, (In Chinese with English Abstract). [Google Scholar]
- Yang, S.; Wu, G.H.; Zhu, Y.F.; Zhng, Y.T.; Zhao, X.X.; Lu, Z.Y.; Zhang, B.S. Key oil accumulation periods of ultra-deep fault-controlled oil reservoir in northern Tarim Basin, NW China. Pet. Explor. Dev. 2022, 49, 285–289. [Google Scholar] [CrossRef]
- Barss, D.L.; Montandon, F.A. Sukunka-Bullmoose Gas Fields: Models for a Developing Trend in the Southern Foothills of Northeast British Columbia. SPG Bull. 1981, 29, 293–333. [Google Scholar]
- Camacho-Velázquez, R. Pressure-Transient and Decline-Curve Behaviors in Naturally Fractured Vuggy Carbonate Reservoirs. SPE Reserv. Eval. Eng. 2005, 8, 95–112. [Google Scholar] [CrossRef]
- Cao, P.; Chang, S.Y.; Dai, C.R.; Liu, J.L.; Luo, X.Y. Determination of reasonable work system for fractured-vuggy carbonate reservoir—Taking Lunguxi reservoir as example. J. Chongqing Univ. Sci. Technol. 2012, 14, 20–23, (In Chinese with English Abstract). [Google Scholar]
- Li, Y.; Kang, Z.J.; Xue, Z.J.; Zheng, S.Q. Theories and practices of carbonate reservoirs development in China. Pet. Explor. Dev. 2018, 45, 712–722. [Google Scholar] [CrossRef]
- Méndez, J.N.; Jin, Q.; González, M.; Zhang, X.D.; Lobo, C.; Boateng, C.; Zambrano, M. Fracture characterization and modeling of karsted carbonate reservoirs: A case study in Tahe oilfield, Tarim Basin (western China). Mar. Pet. Geol. 2020, 112, 104104. [Google Scholar] [CrossRef]
- Dong, J.X.; Shi, W.; Xu, M.Y. Numerical simulation of gas wells in different types of carbonate reservoirs. IOP Conf. Ser. Earth Environ. Sci. 2021, 675, 012206. [Google Scholar] [CrossRef]
- Li, Y.J.; Yao, J.; Li, Y.C.; Yin, C.B.; Pan, B.; Lee, J.; Dong, M.Z. An equivalent continuum approach for modeling two-phase flow in fractured-vuggy media. Int. J. Multiscale Comput. Eng. 2017, 15, 79–98. [Google Scholar] [CrossRef]
- Wang, L.; Chen, X.X.; Xia, Z.Y. A Novel Semi-Analytical Model for Multi-branched Fractures in Naturally Fractured-Vuggy Reservoirs. Sci. Rep. 2018, 8, 1–12. [Google Scholar] [CrossRef] [Green Version]
- Jia, C.Z. Tectonic Characteristics and Petroleum, Tarim Basin, China; Petroleum Industry Press: Beijing, China, 1997. [Google Scholar]
- Wu, G.H.; Pang, X.Q.; Li, Q.M.; Yang, H.J. The Structural Characteristics of Carbonate Rocks and their Effects on Hydrocarbon Exploration in Craton Basin: A Case Study of the Tarim Basin; Science Press: Beijing, China, 2016. (In Chinese) [Google Scholar]
- Deng, S.; Li, H.L.; Zhang, Z.P.; Zhang, J.B.; Yang, X. Structural characterization of intracratonic strike-slip faults in the central Tarim Basin. AAPG Bull. 2019, 103, 109–137. [Google Scholar] [CrossRef]
- Wu, G.H.; Ma, B.S.; Han, J.F.; Guan, B.Z.; Chen, X.; Yang, P.; Xie, Z. Origin and growth mechanisms of strike-slip faults in the central Tarim cratonic basin, NW China. Pet. Explor. Dev. 2021, 48, 595–607. [Google Scholar] [CrossRef]
- Lu, X.B.; Wang, Y.; Tian, F.; Li, X.H.; Yang, D.B.; Li, T.; Lv, Y.P.; He, X.M. New insights into the carbonate karstic fault system and reservoir formation in the Southern Tahe area of the Tarim Basin. Mar. Pet. Geol. 2017, 86, 587–605. [Google Scholar] [CrossRef]
- Han, J.F.; Su, Z.; Chen, L.X.; Guo, D.S.; Zhang, Y.T.; Ji, Y.G.; Zhang, H.F.; Yuan, J.Y. Reservoir-controlling and accumulation-controlling of strike-slip faults and exploration potential in the platform of Tarim Basin. Acta Pet. Sin. 2019, 40, 1296–1310, (In Chinese with English Abstract). [Google Scholar]
- Shen, W.B.; Chen, J.F.; Wang, Y.Y.; Zhang, K.; Chen, Z.Y.; Luo, G.P.; Fu, X. The origin, migration and accumulation of the Ordovician gas in the Tazhong III region, Tarim Basin, NW China. Mar. Pet. Geol. 2019, 101, 55–77. [Google Scholar] [CrossRef]
- Jiang, T.W.; Han, J.F.; Wu, G.H.; Yu, H.F.; Su, Z.; Xiong, C.; Chen, J.; Zhang, H.F. Differences and controlling factors of composite hydrocarbon accumulations in the Tazhong uplift, Tarim Basin, NW China. Pet. Explor. Dev. 2020, 47, 229–241. [Google Scholar] [CrossRef]
- Deng, X.L.; Yan, T.; Zhang, Y.T.; Wan, X.G.; Feng, K.; Yuan, A.Y.; Yao, C.; Xiao, C.Y. Characteristics and well location deployment ideas of strike-slip fault controlled carbonate oil and gas reservoirs: A case study of the Tarim Basin. Nat. Gas Ind. 2021, 41, 21–29, (In Chinese with English Abstract). [Google Scholar]
- Ding, Z.W.; Wang, R.J.; Chen, F.F.; Yang, J.P.; Zhu, Z.Q.; Yang, Z.M.; Sun, X.H.; Xian, B.; Li, E.P.; Shi, T.; et al. Origin, hydrocarbon accumulation and oil-gas enrichment of fault-karst carbonate reservoirs: A case study of Ordovician carbonate reservoirs in in South Tahe area of Halahatang oilfield, Tarim Basin. Pet. Explor. Dev. 2020, 47, 306–317. [Google Scholar] [CrossRef]
- Li, C.L. The Principles of Reservoir Engineering; Petroleum Industry Press: Beijing, China, 2010; pp. 426–428. [Google Scholar]
Figure 1.
(a) The circum−Manxi strike−slip fault system and (b) the stratigraphic column of the Cambrian–Ordovician and (c) cross geological section in the Tarim Basin (revised from references [12,13]; є: Cambrian; O: Ordovician; O3l: Lianglitage Formation of Late Ordovician; O3s: Sangtamu Formation of Late Ordovician; S: Silurian; C: Carboniferous; P: Permian; T: Triassic; J: Jurassic; K: Cretaceous; Cz: Cenozoic).

Figure 2.
Dynamic oil pressure curves of three types of wells in the Fuman Oilfield.

Figure 3.
Curves of (a) different productivity decline characteristics and (b) final recovery degree without bottom water in the Fuman Oilfield (the color lines show different oil allocation production of a well (bbl/d)).
Figure 3.
Curves of (a) different productivity decline characteristics and (b) final recovery degree without bottom water in the Fuman Oilfield (the color lines show different oil allocation production of a well (bbl/d)).
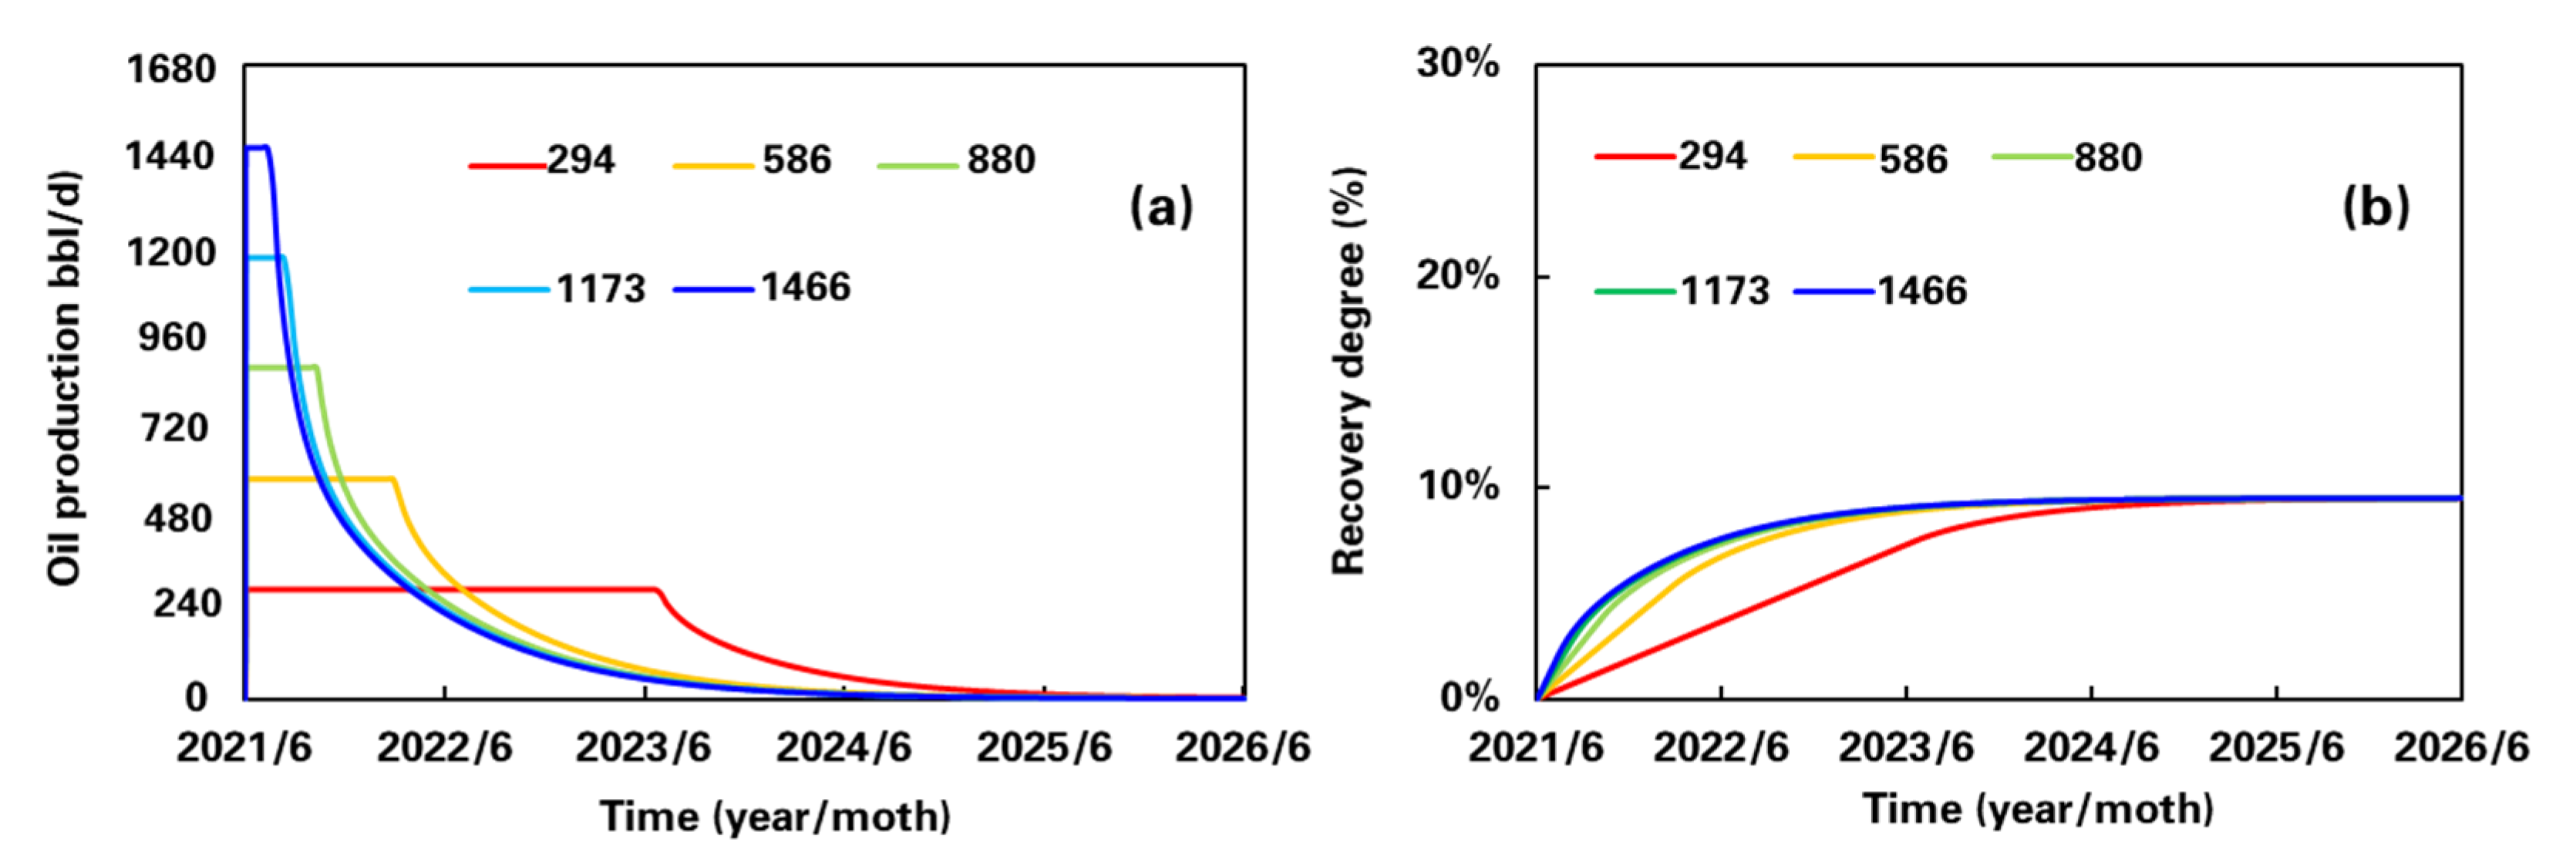
Figure 4.
(a) Stable oil production with different production capacities and (b) water breakthrough time of different production capacities with bottom water in Fuman Oilfield (the colored lines show different oil allocation production of a well (bbl/d)).
Figure 4.
(a) Stable oil production with different production capacities and (b) water breakthrough time of different production capacities with bottom water in Fuman Oilfield (the colored lines show different oil allocation production of a well (bbl/d)).
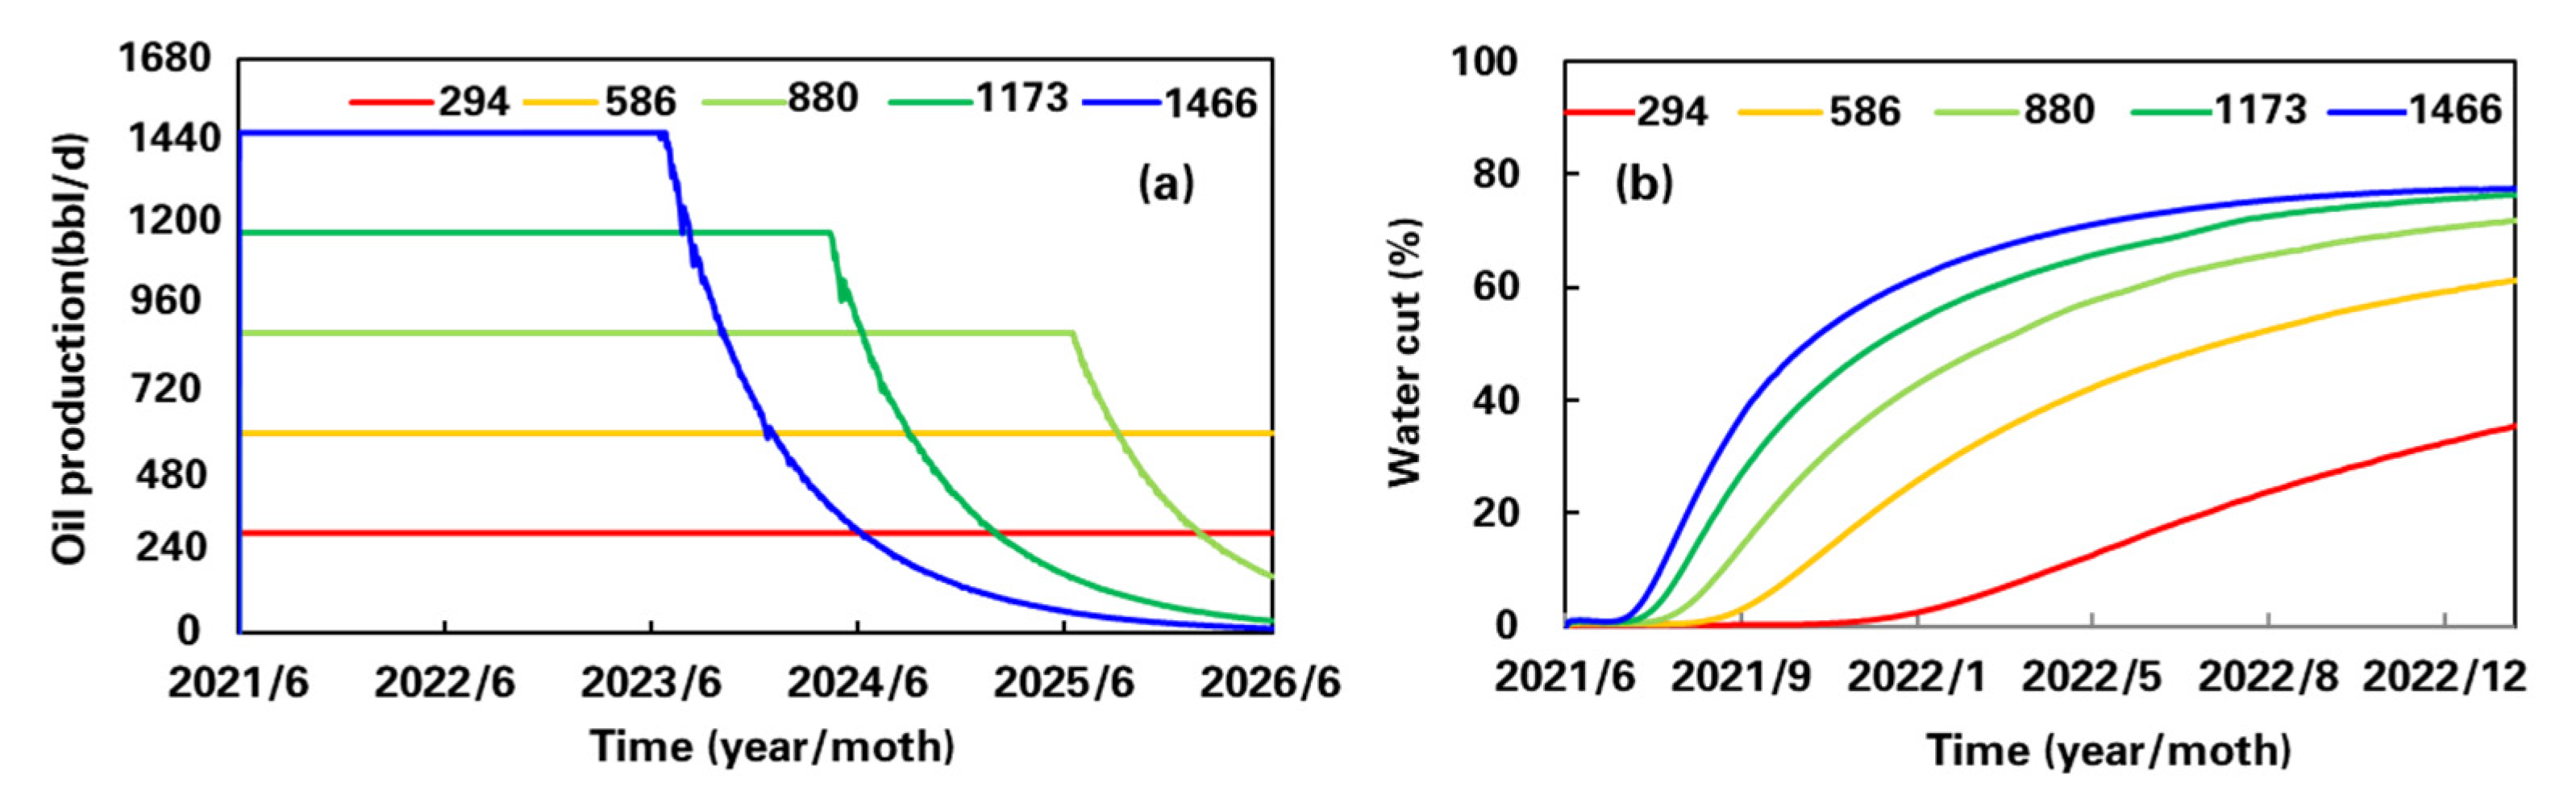
Figure 5.
(a) Oil pressure curve and (b) oil and water production curve of well Y801−H6 in the Fuman Oilfield.
Figure 5.
(a) Oil pressure curve and (b) oil and water production curve of well Y801−H6 in the Fuman Oilfield.
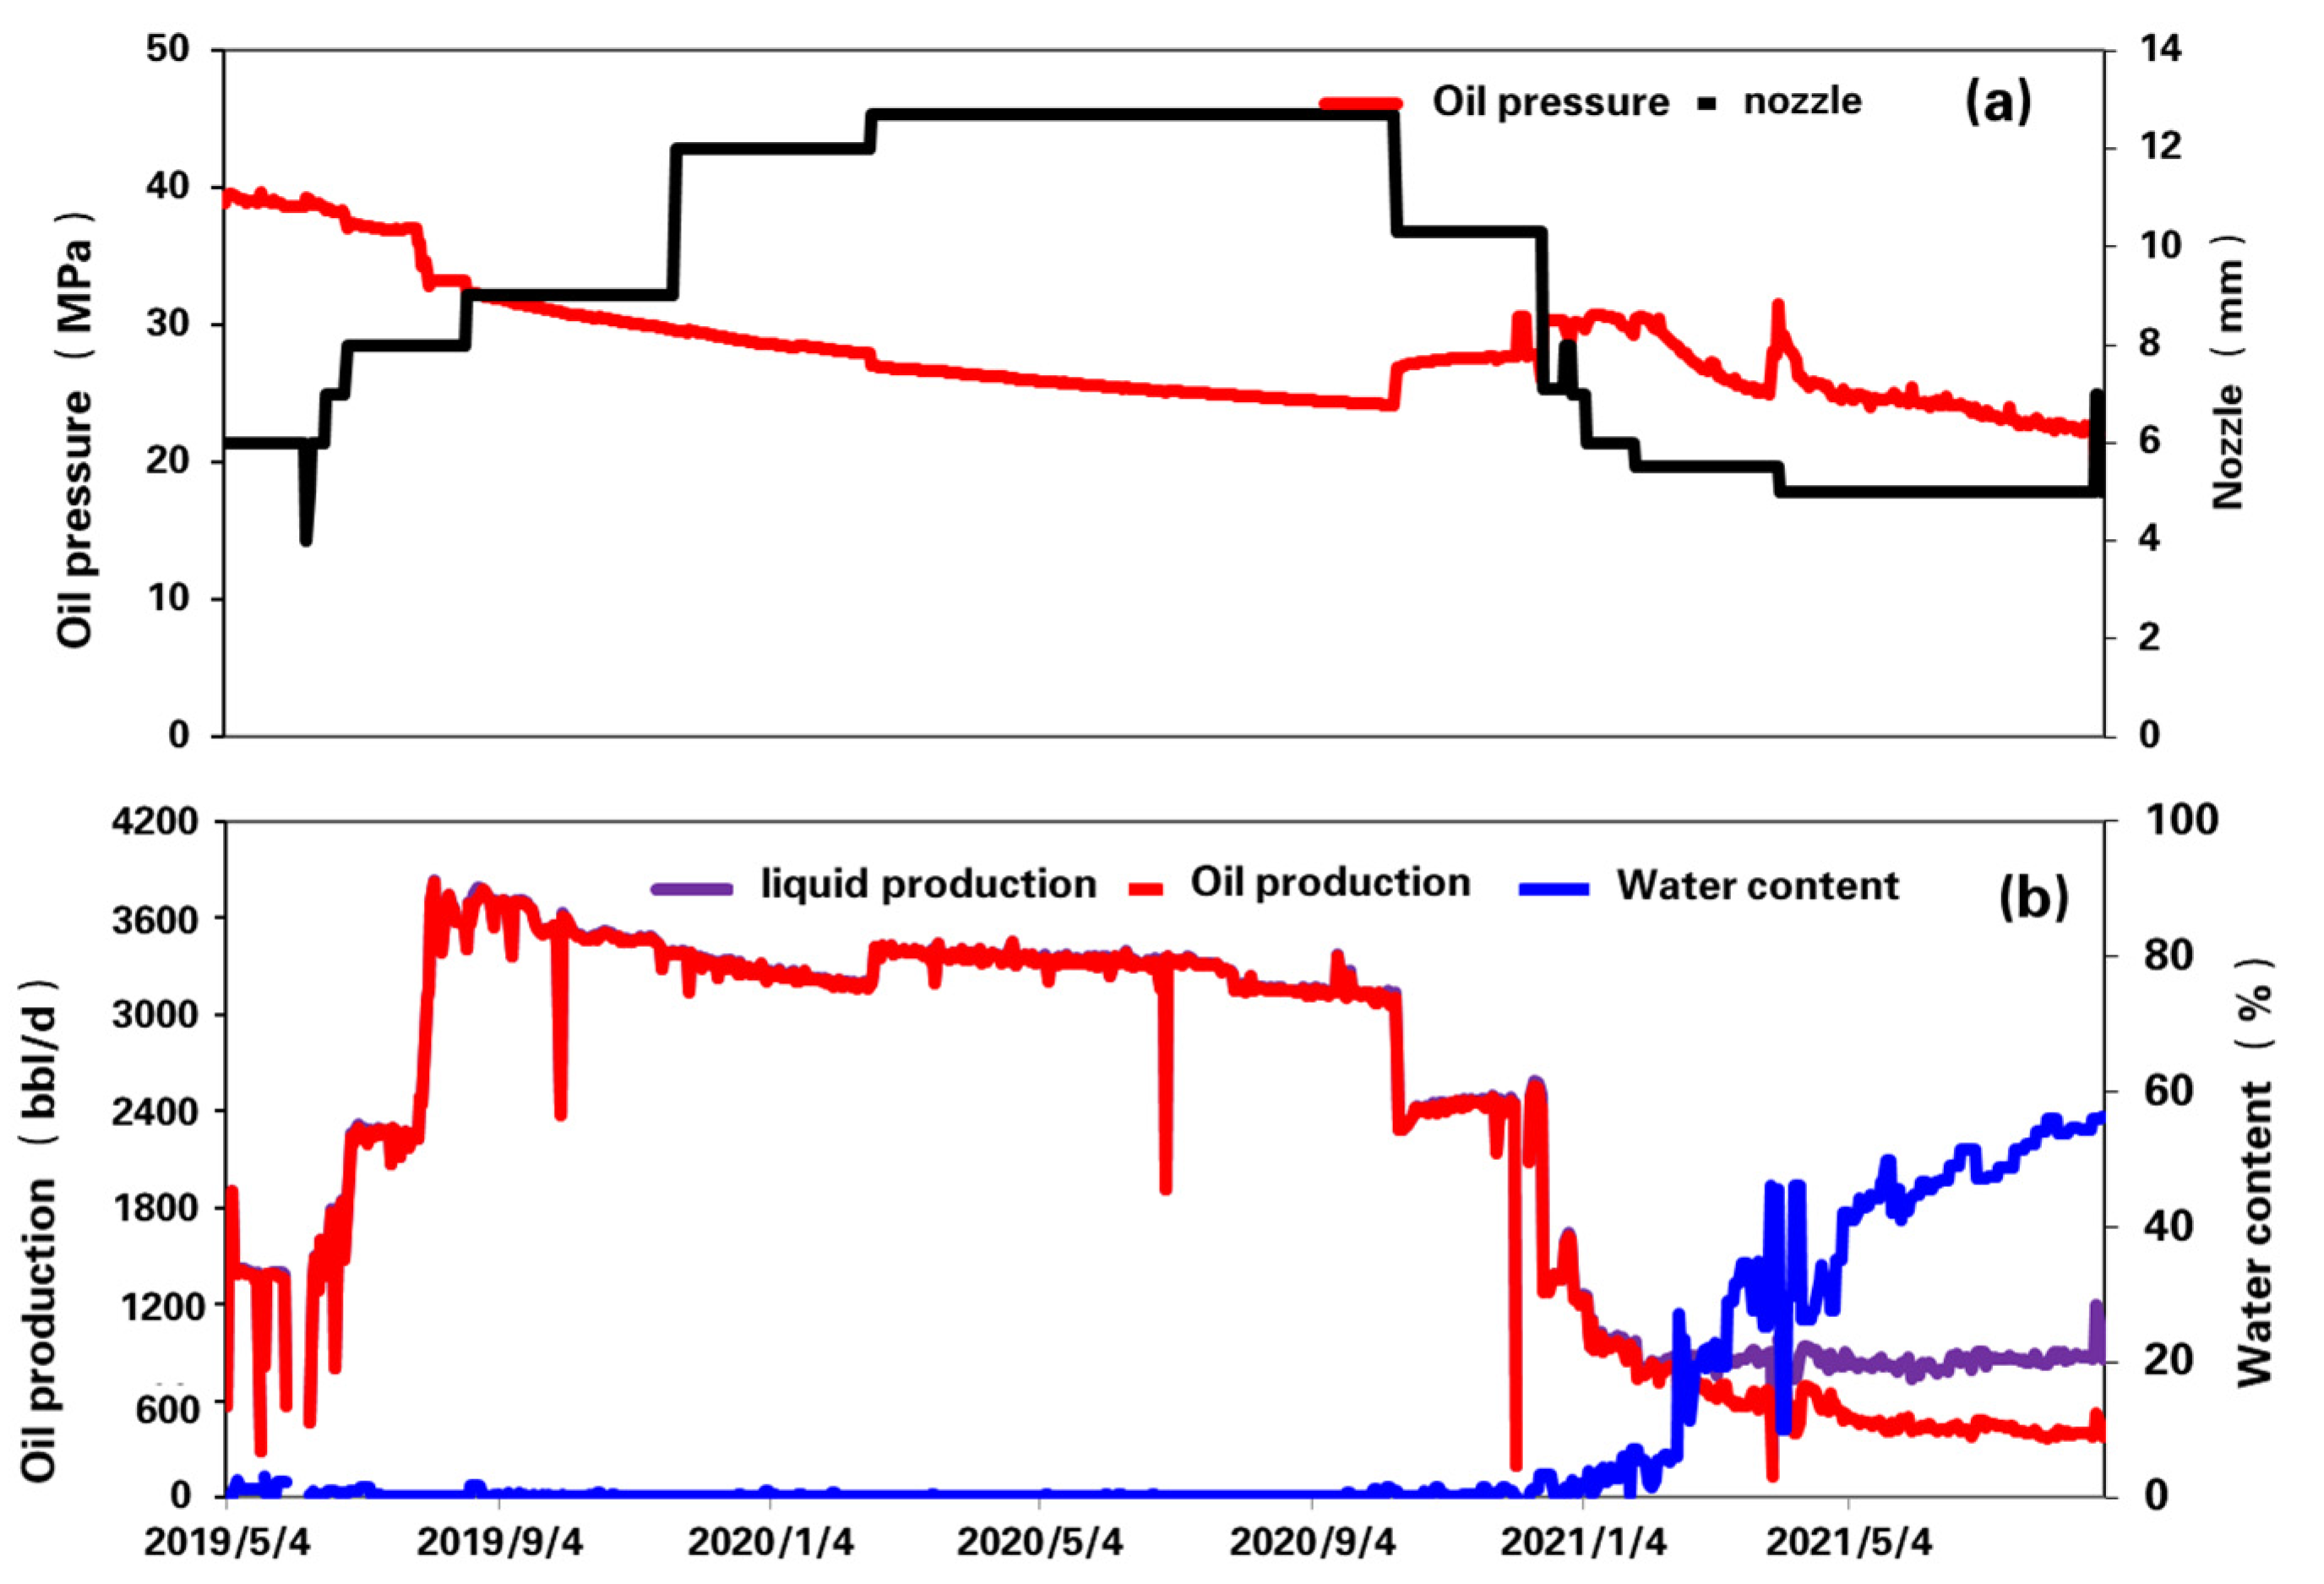
Figure 6.
Relationship between different types of production wells and dynamic reserves (from low to high production).
Figure 6.
Relationship between different types of production wells and dynamic reserves (from low to high production).
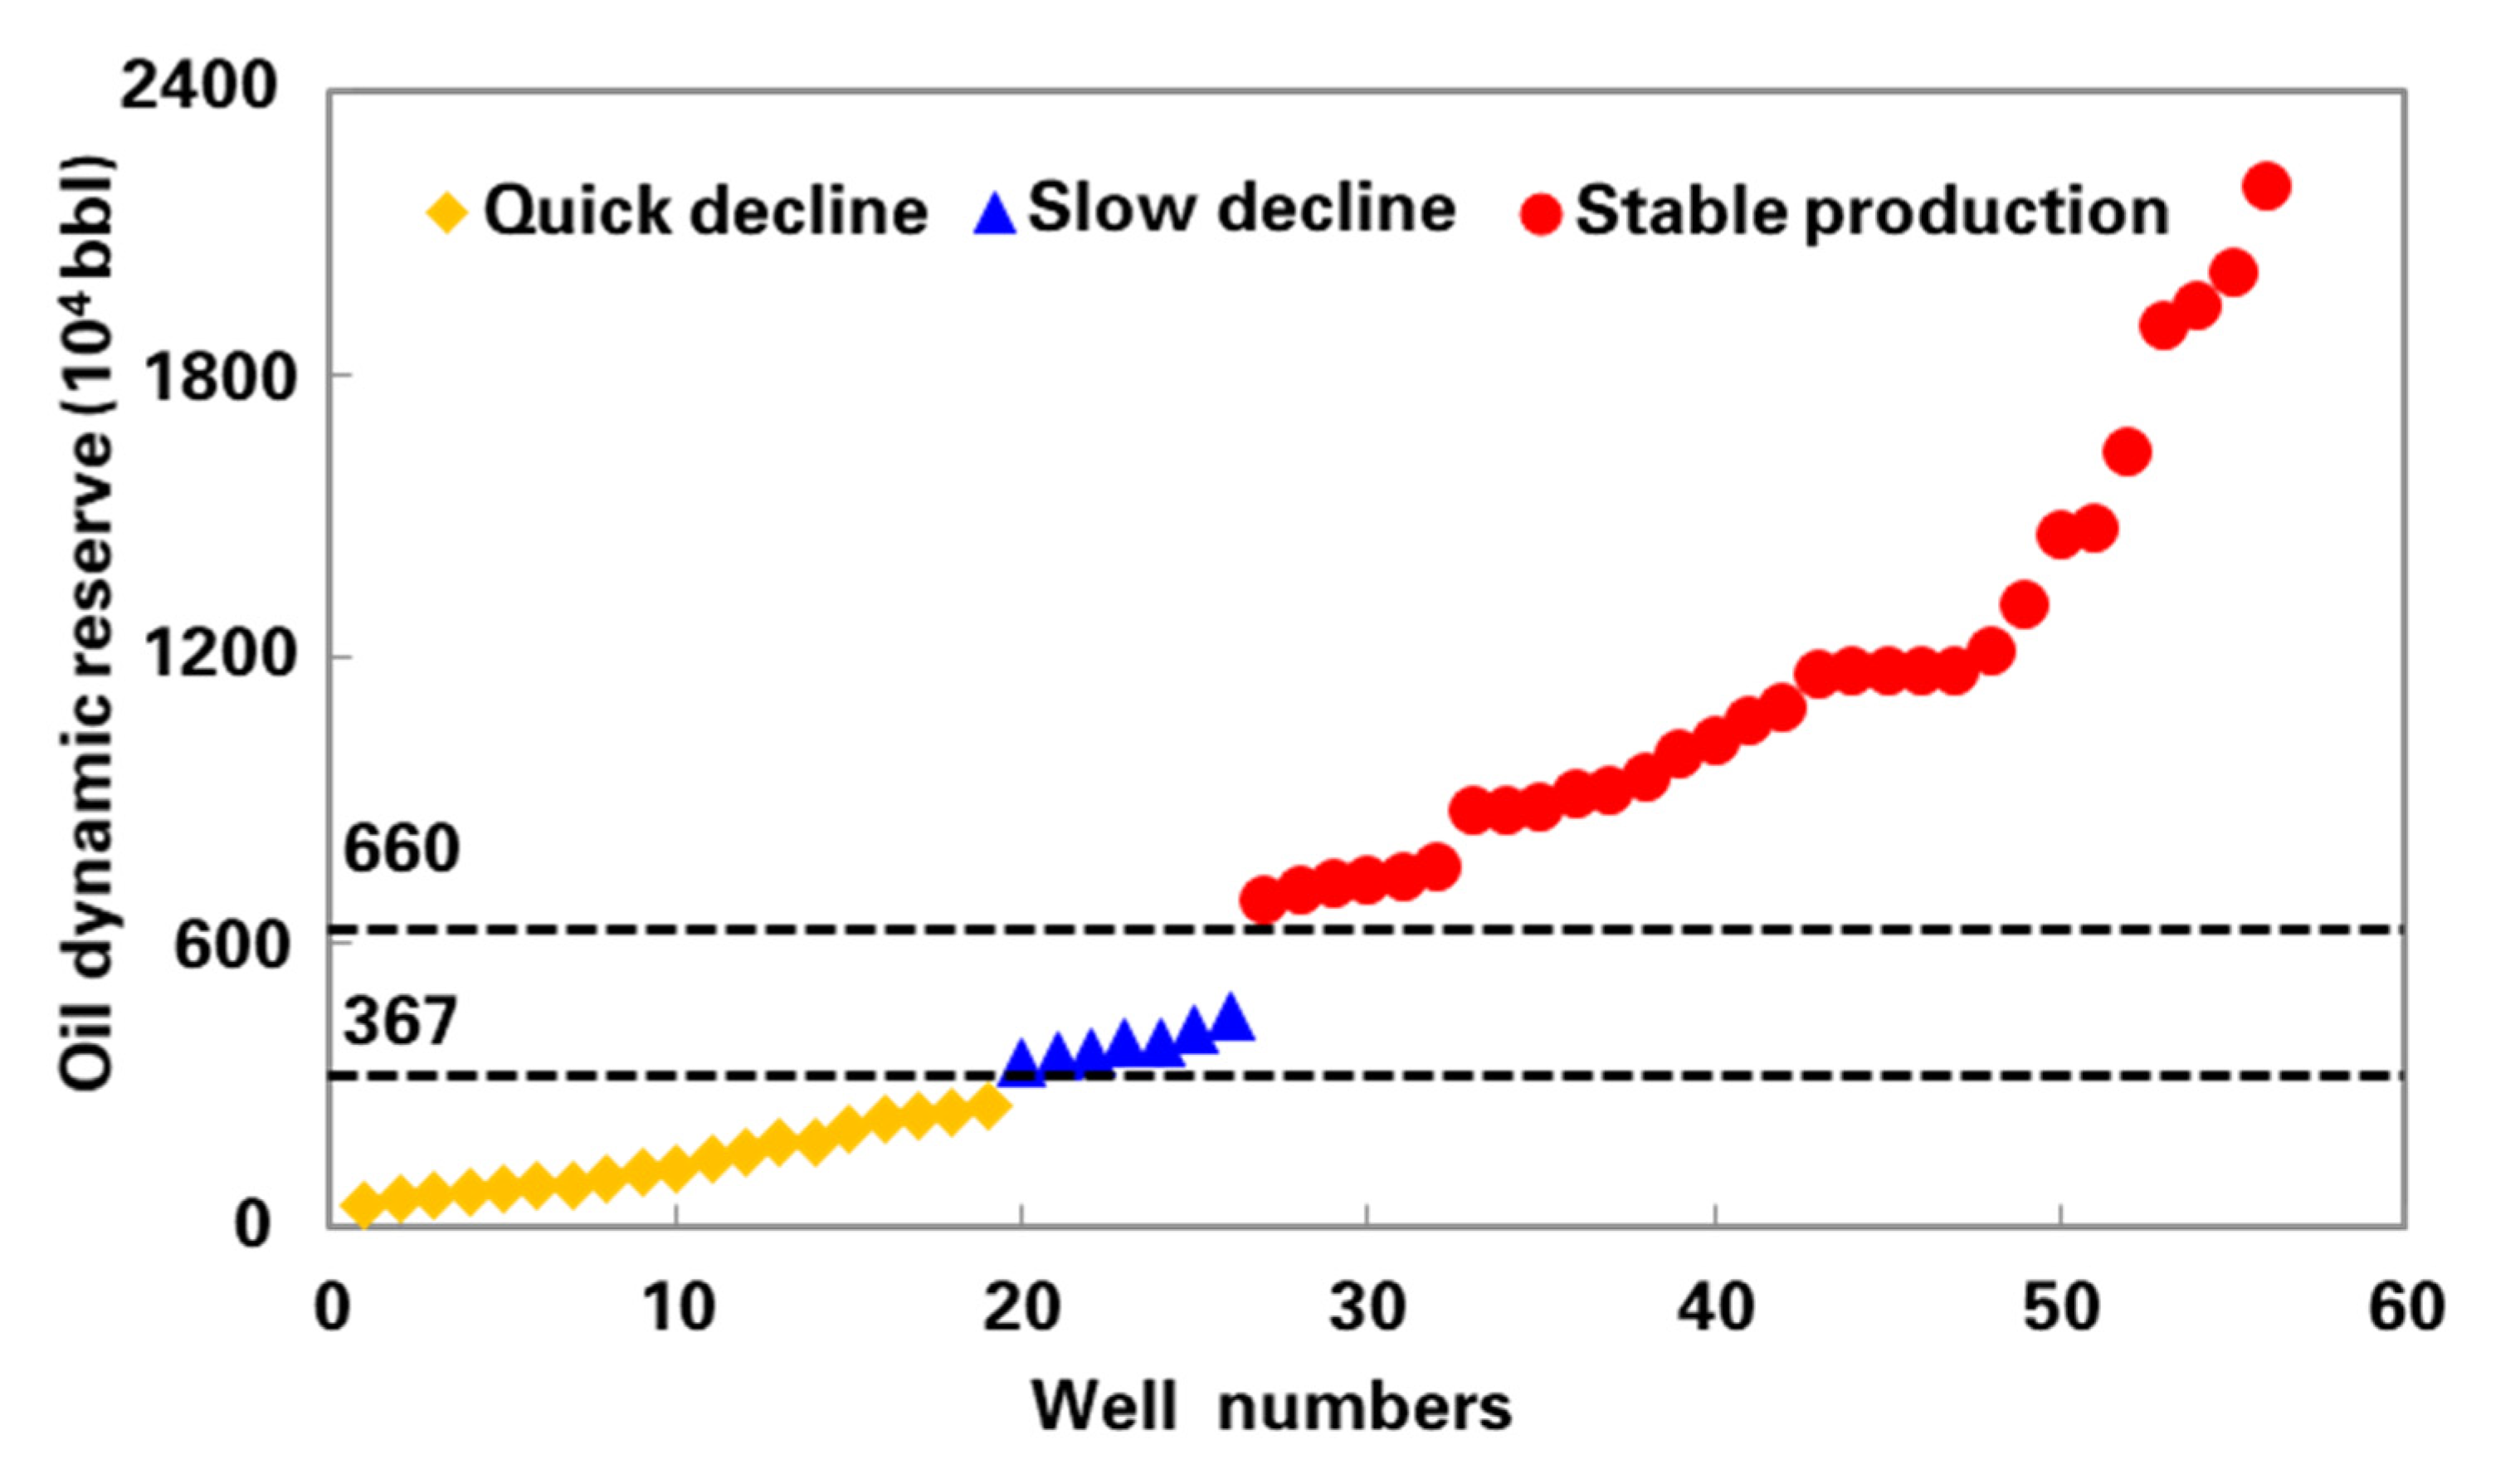
Figure 7.
The average cumulative oil production and the average oil production index of different type production wells during the blowout period.
Figure 7.
The average cumulative oil production and the average oil production index of different type production wells during the blowout period.

Figure 8.
Initial average productivity and initial average productivity/dynamic reserves of different types of wells.
Figure 8.
Initial average productivity and initial average productivity/dynamic reserves of different types of wells.
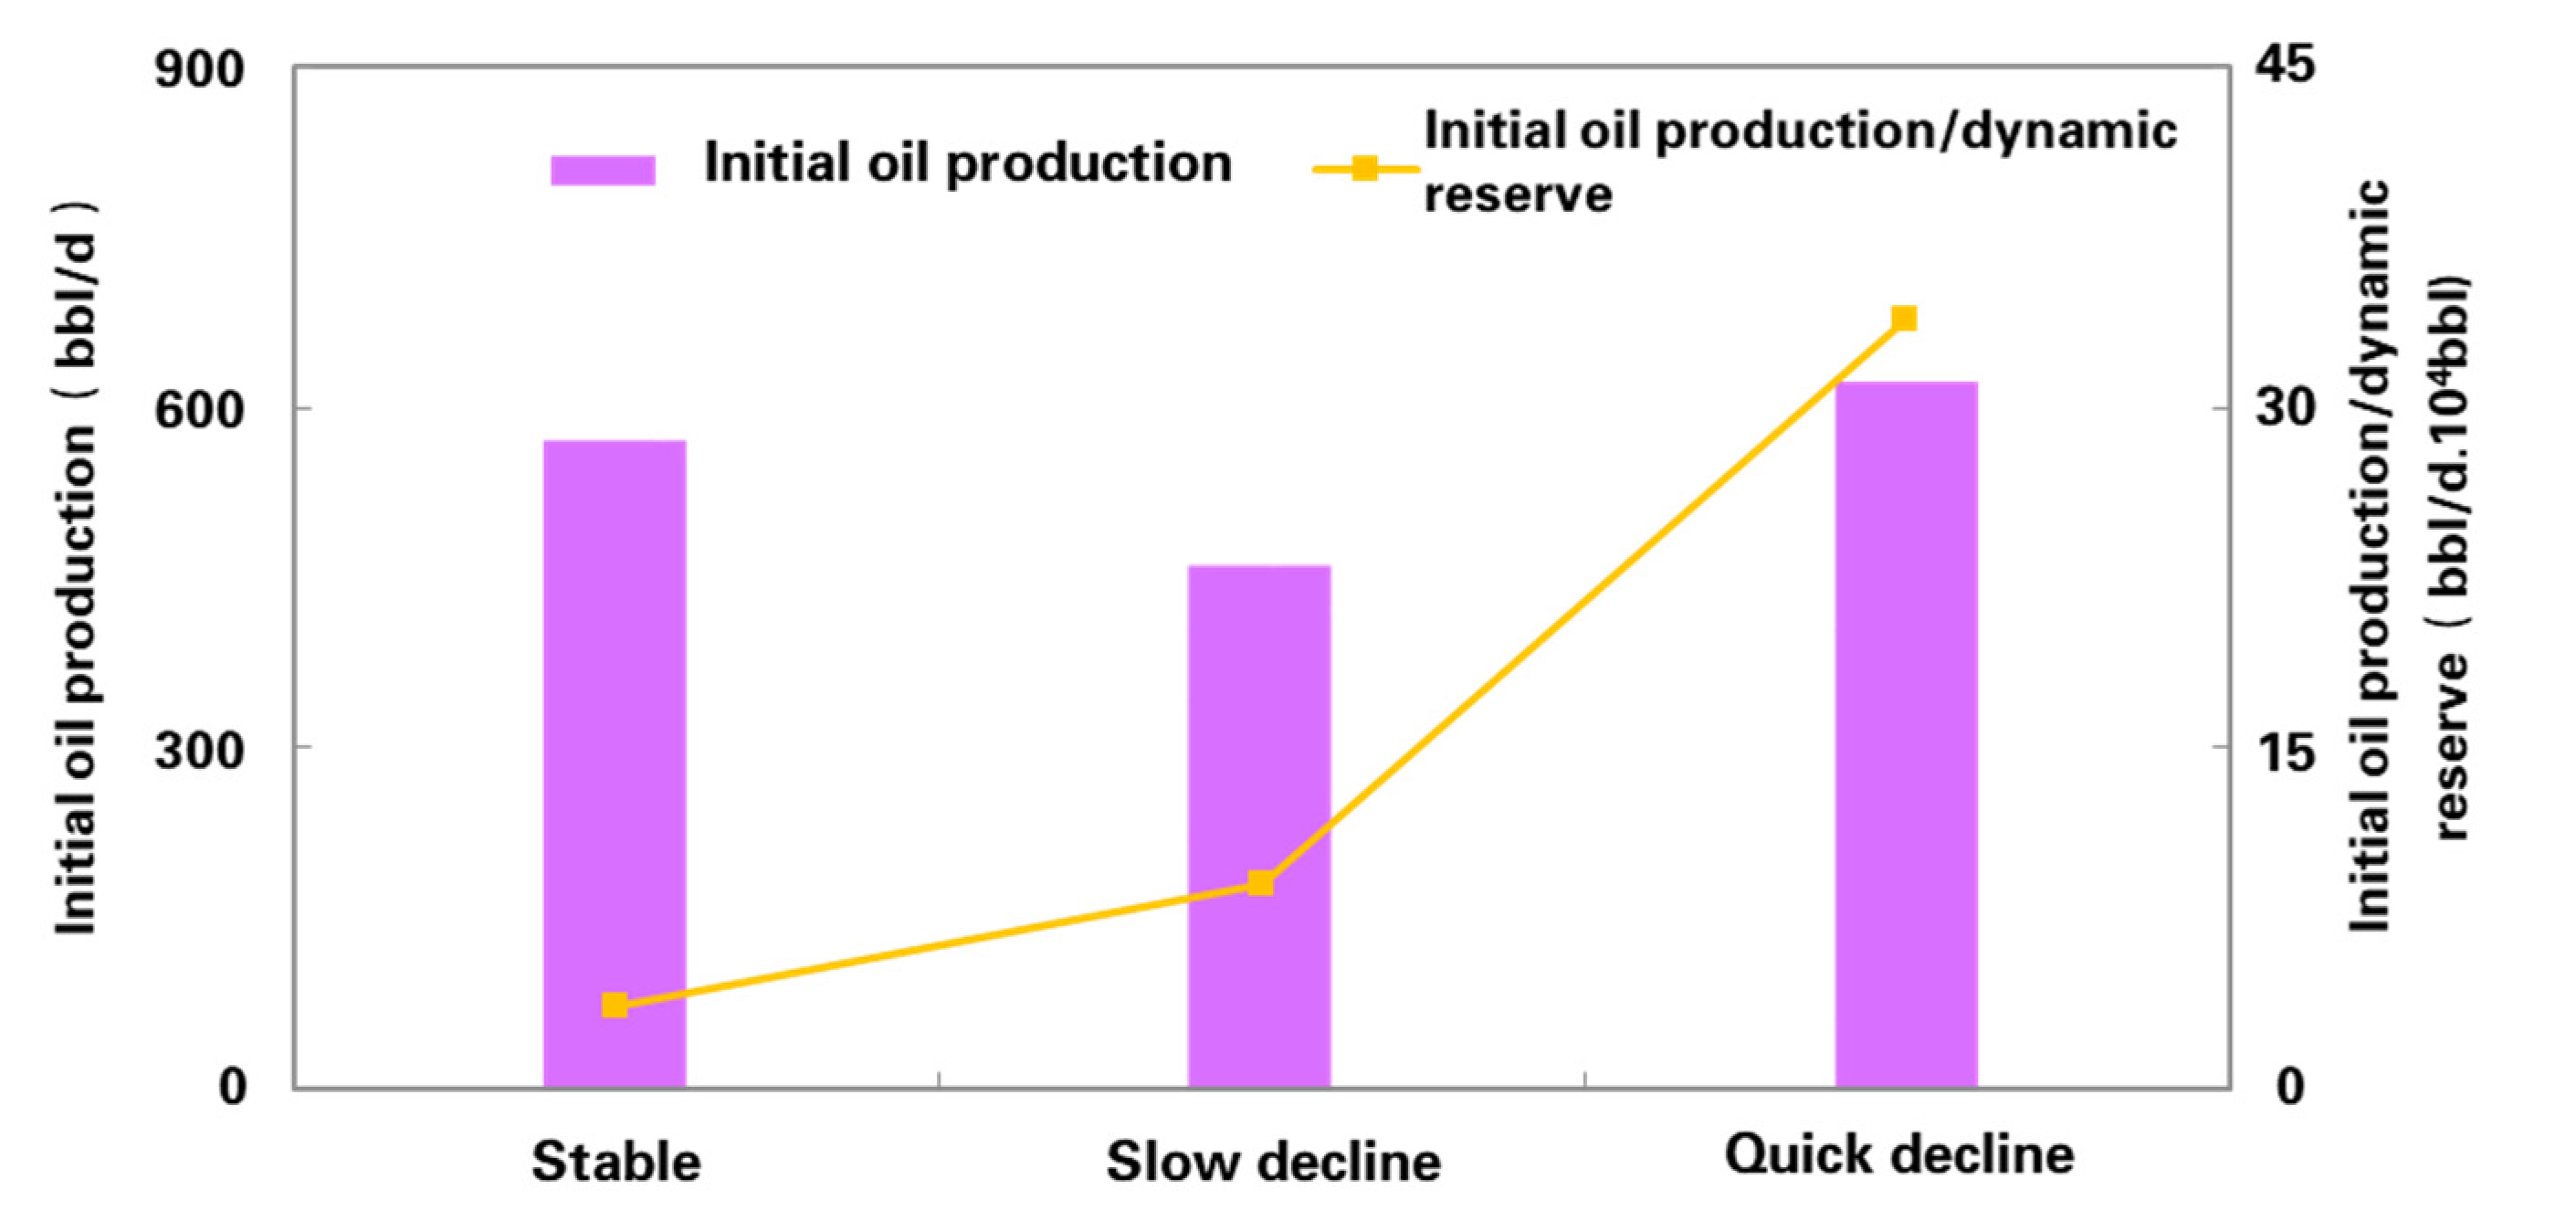
Figure 9.
Relationship between initial daily productivity and well−controlled dynamic reserves (the initial daily productivity is divided into three domains, which show unreleased production with low initial daily productivity and unreasonable production with too−high initial daily productivity).
Figure 9.
Relationship between initial daily productivity and well−controlled dynamic reserves (the initial daily productivity is divided into three domains, which show unreleased production with low initial daily productivity and unreasonable production with too−high initial daily productivity).

Figure 10.
IPR inflow dynamic curve of well F210 showing nonlinear relationship of single−phase flow.
Figure 10.
IPR inflow dynamic curve of well F210 showing nonlinear relationship of single−phase flow.

Figure 11.
Correlation of production, flow pressure and nozzle curves of well F210.
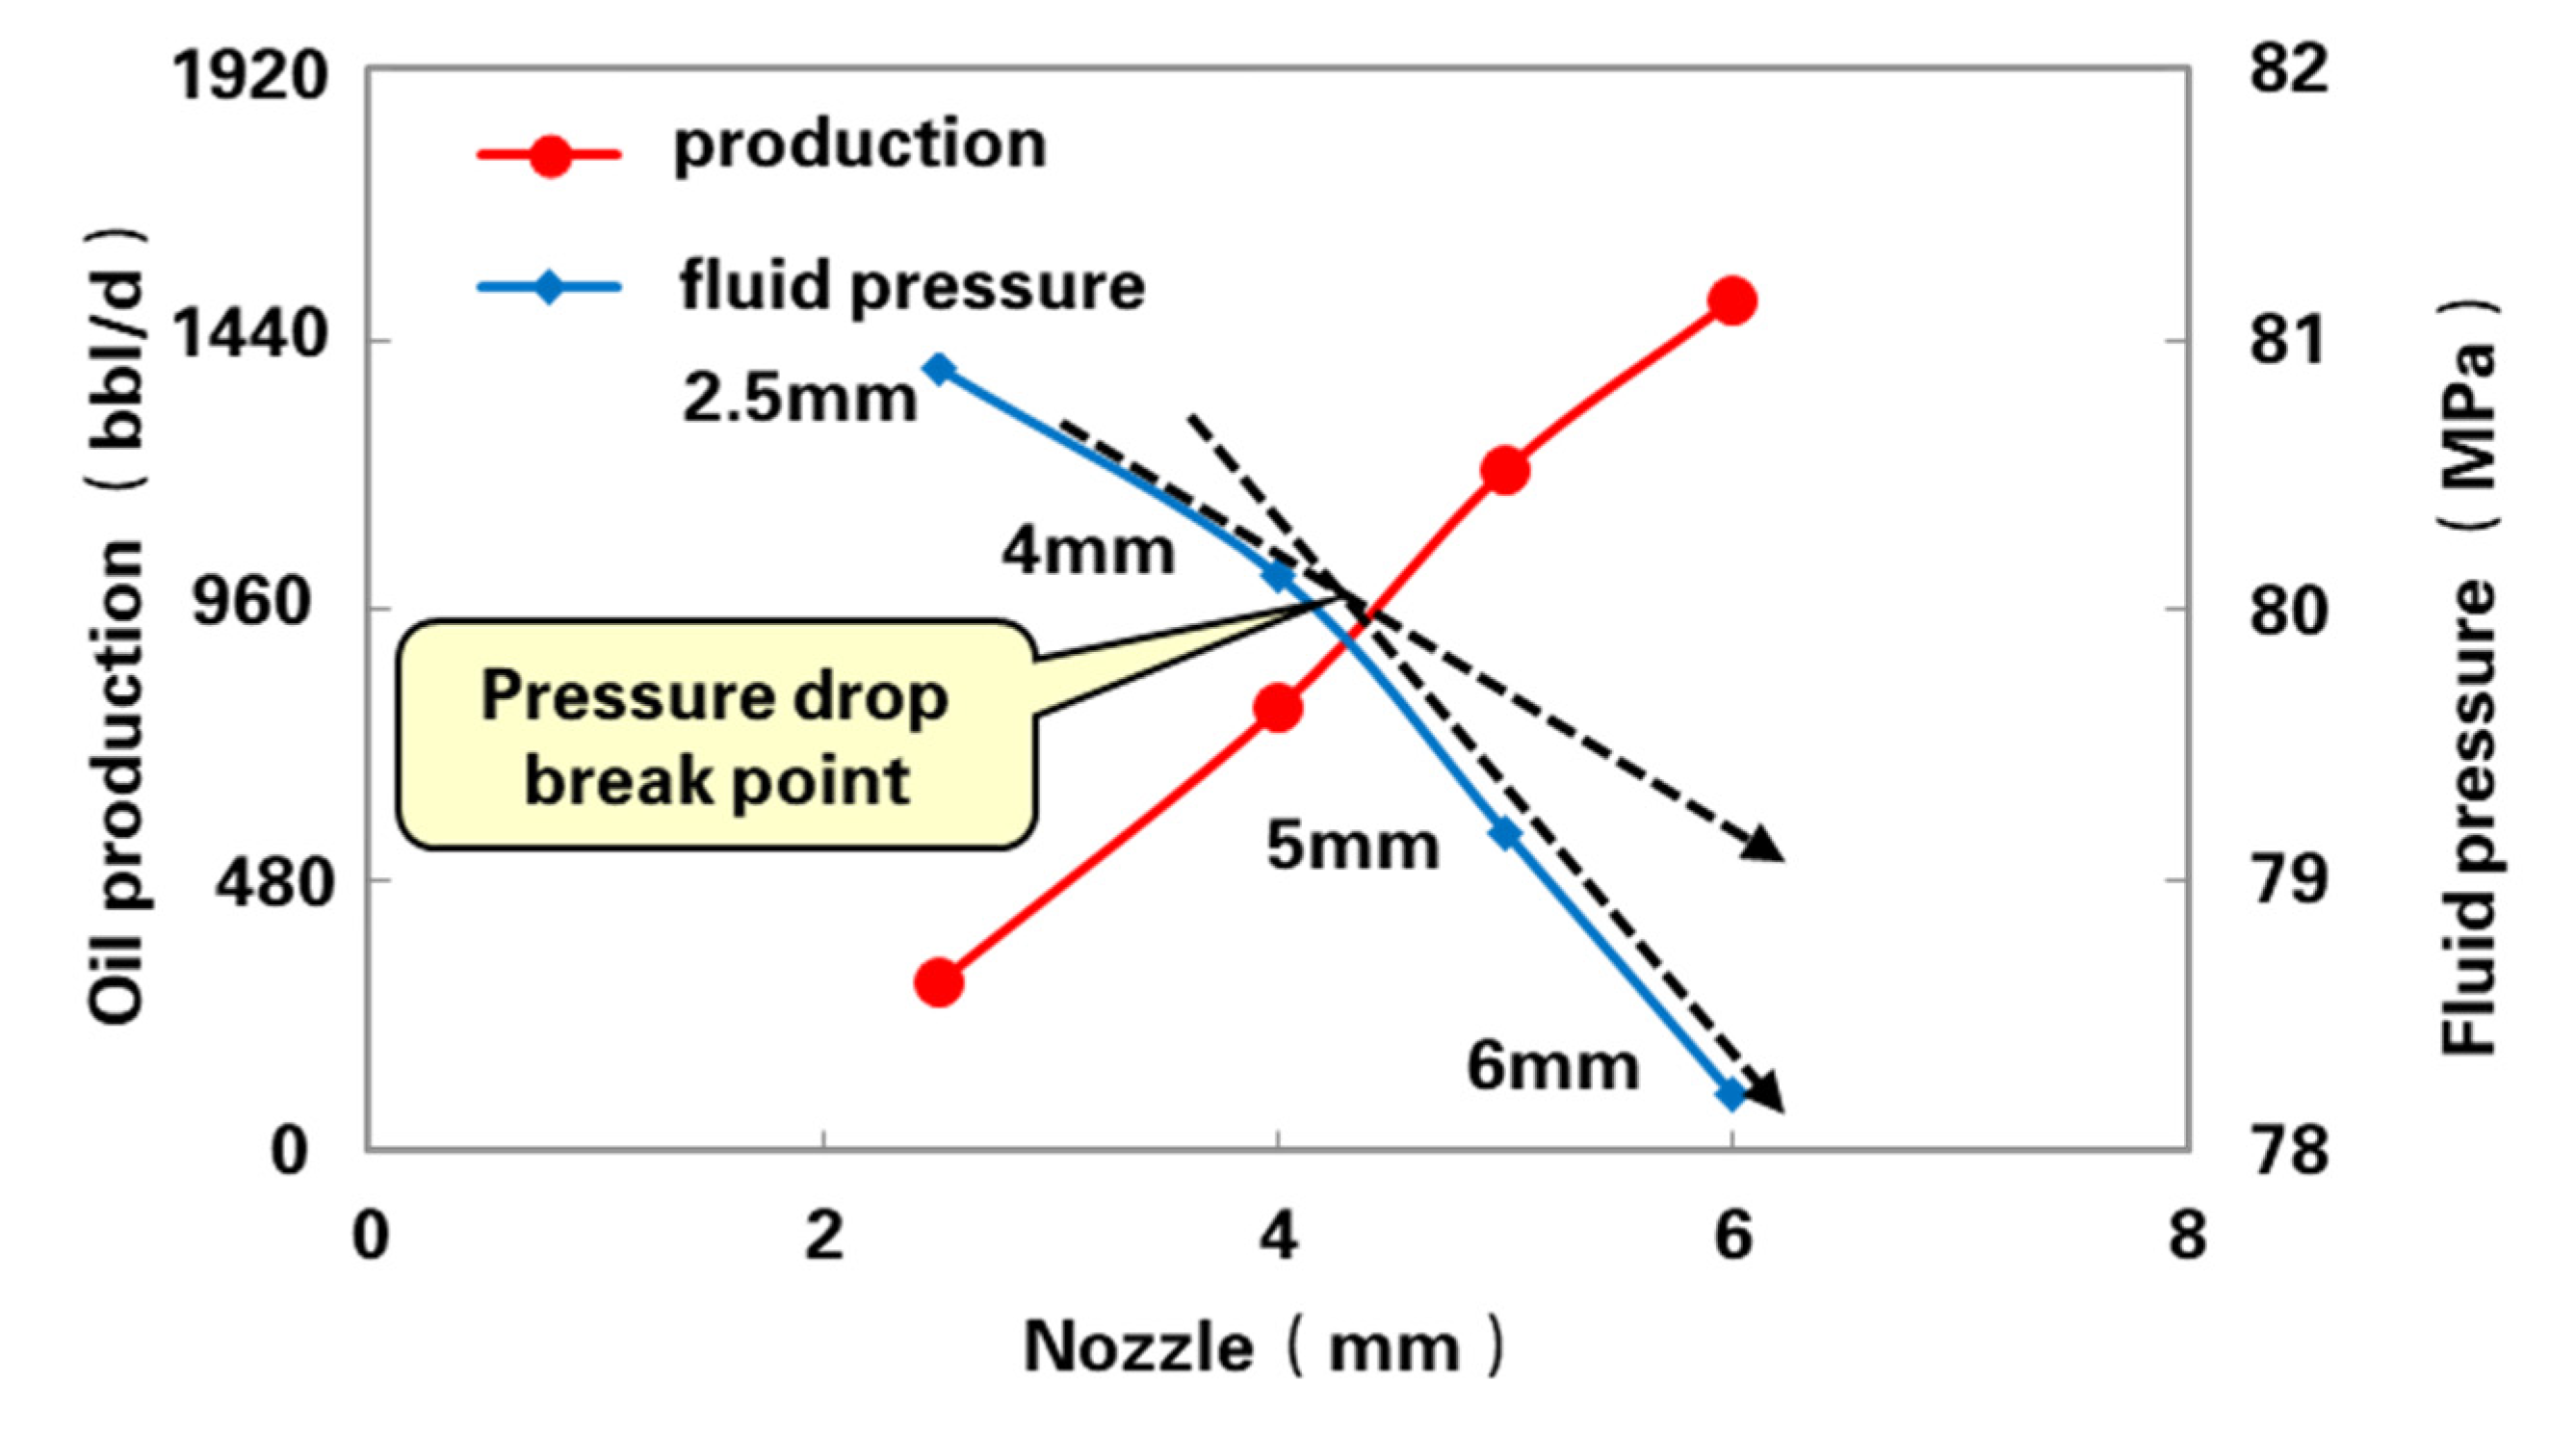
Figure 12.
Correlation of oil production index and production pressure in well F210.

Figure 13.
Correlations between production, oil pressure, and nozzle of well Y701.

Figure 14.
Relationship between reasonable productivity and well−controlled dynamic reserves.
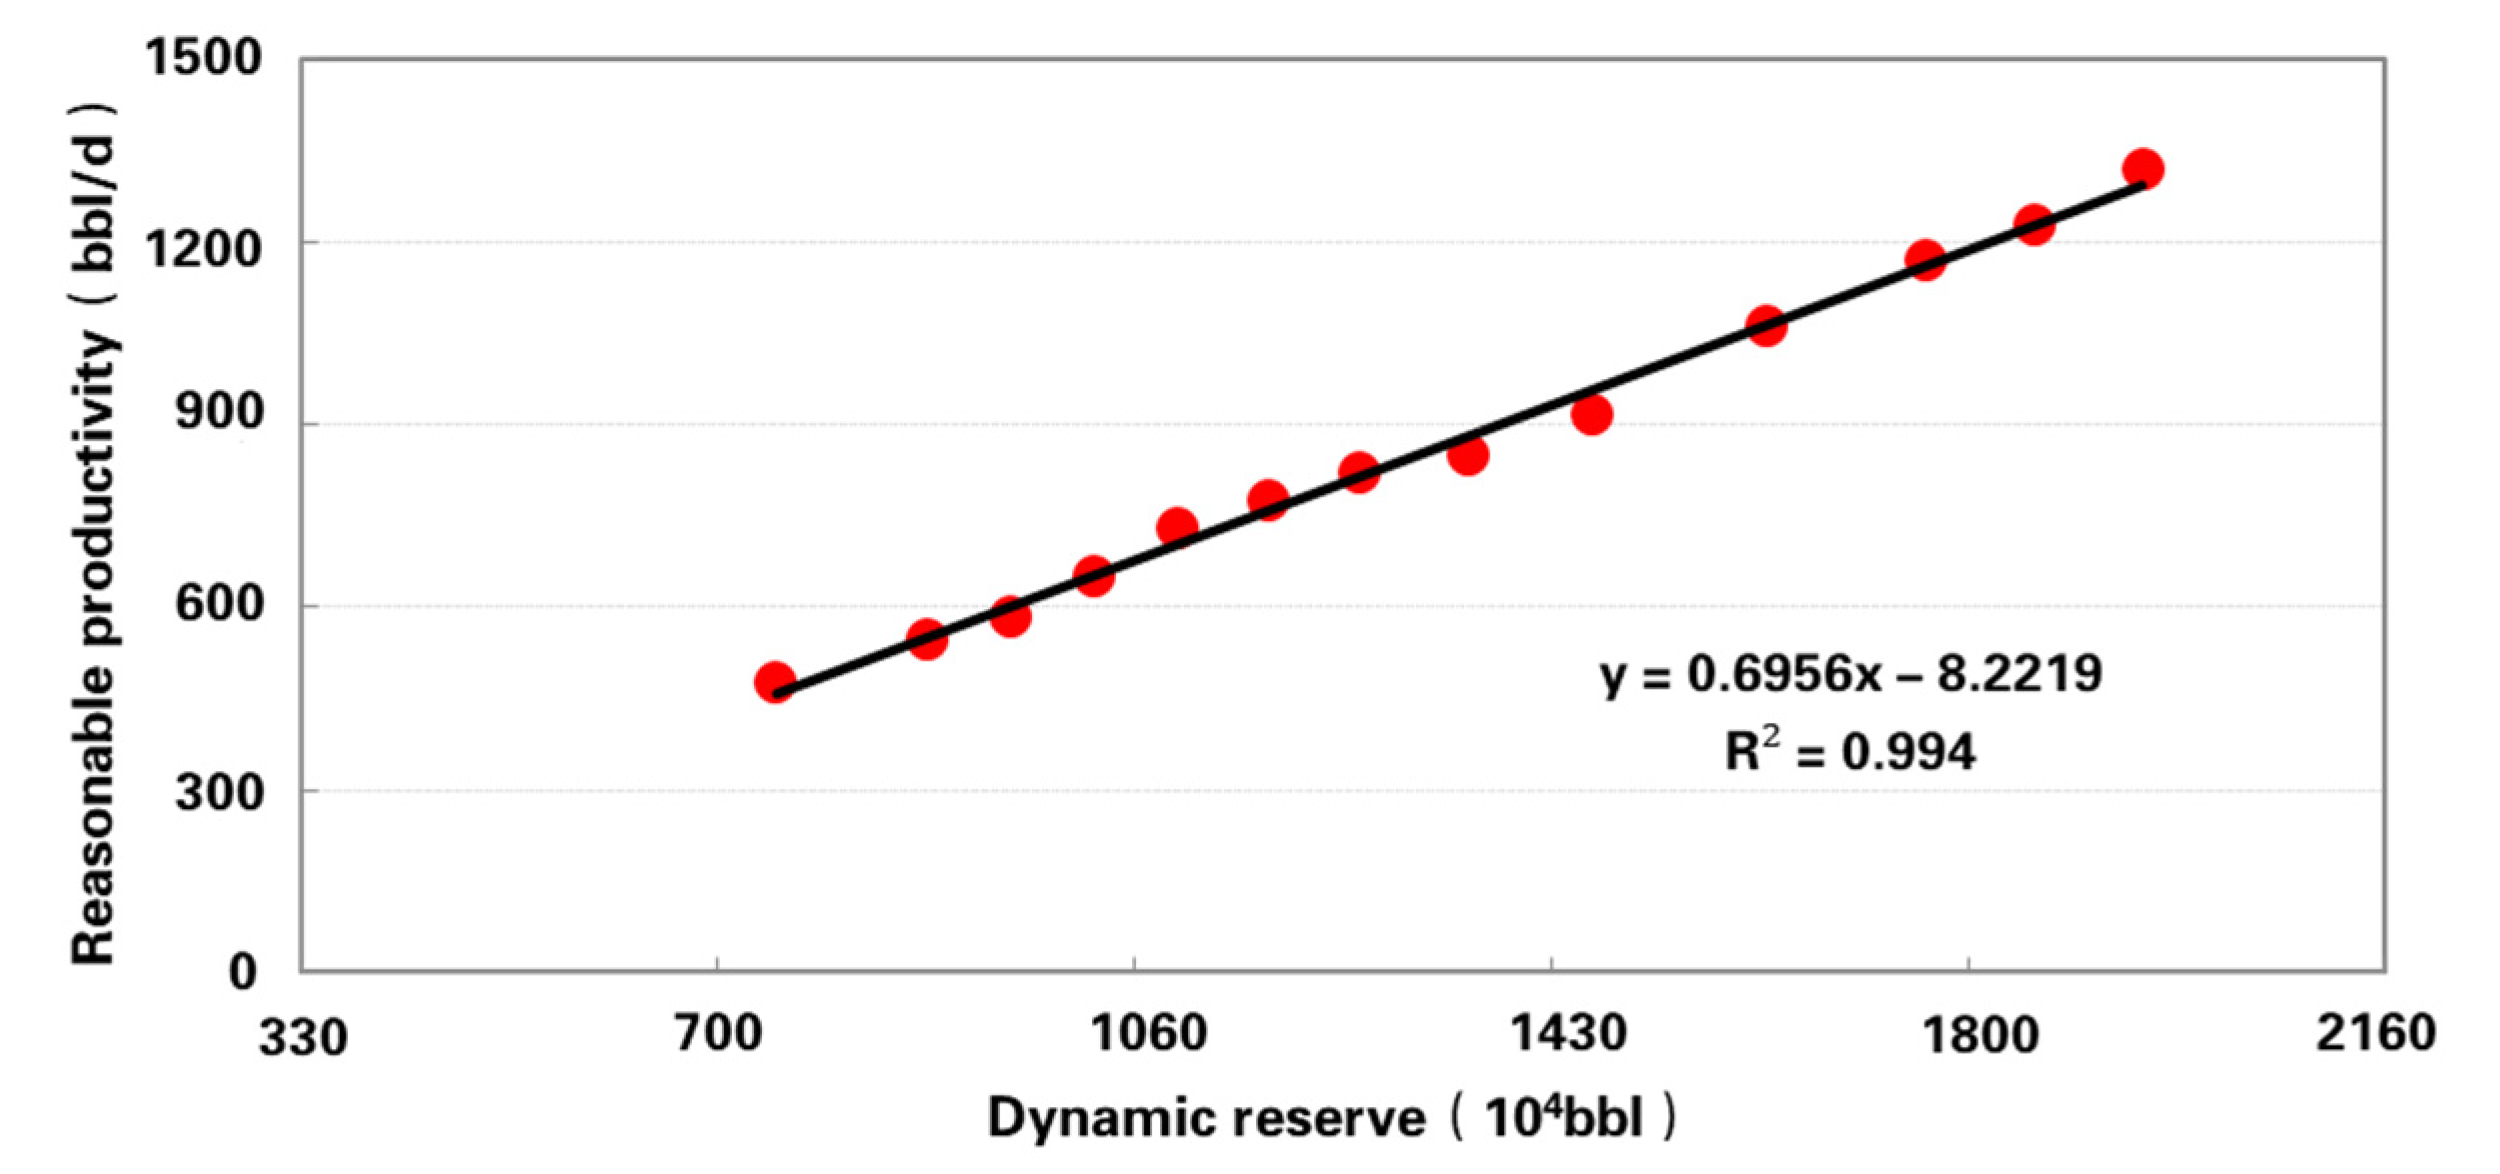
Figure 15.
The relationship between the oil productivity of unit nozzle and the reasonable production.
Figure 15.
The relationship between the oil productivity of unit nozzle and the reasonable production.
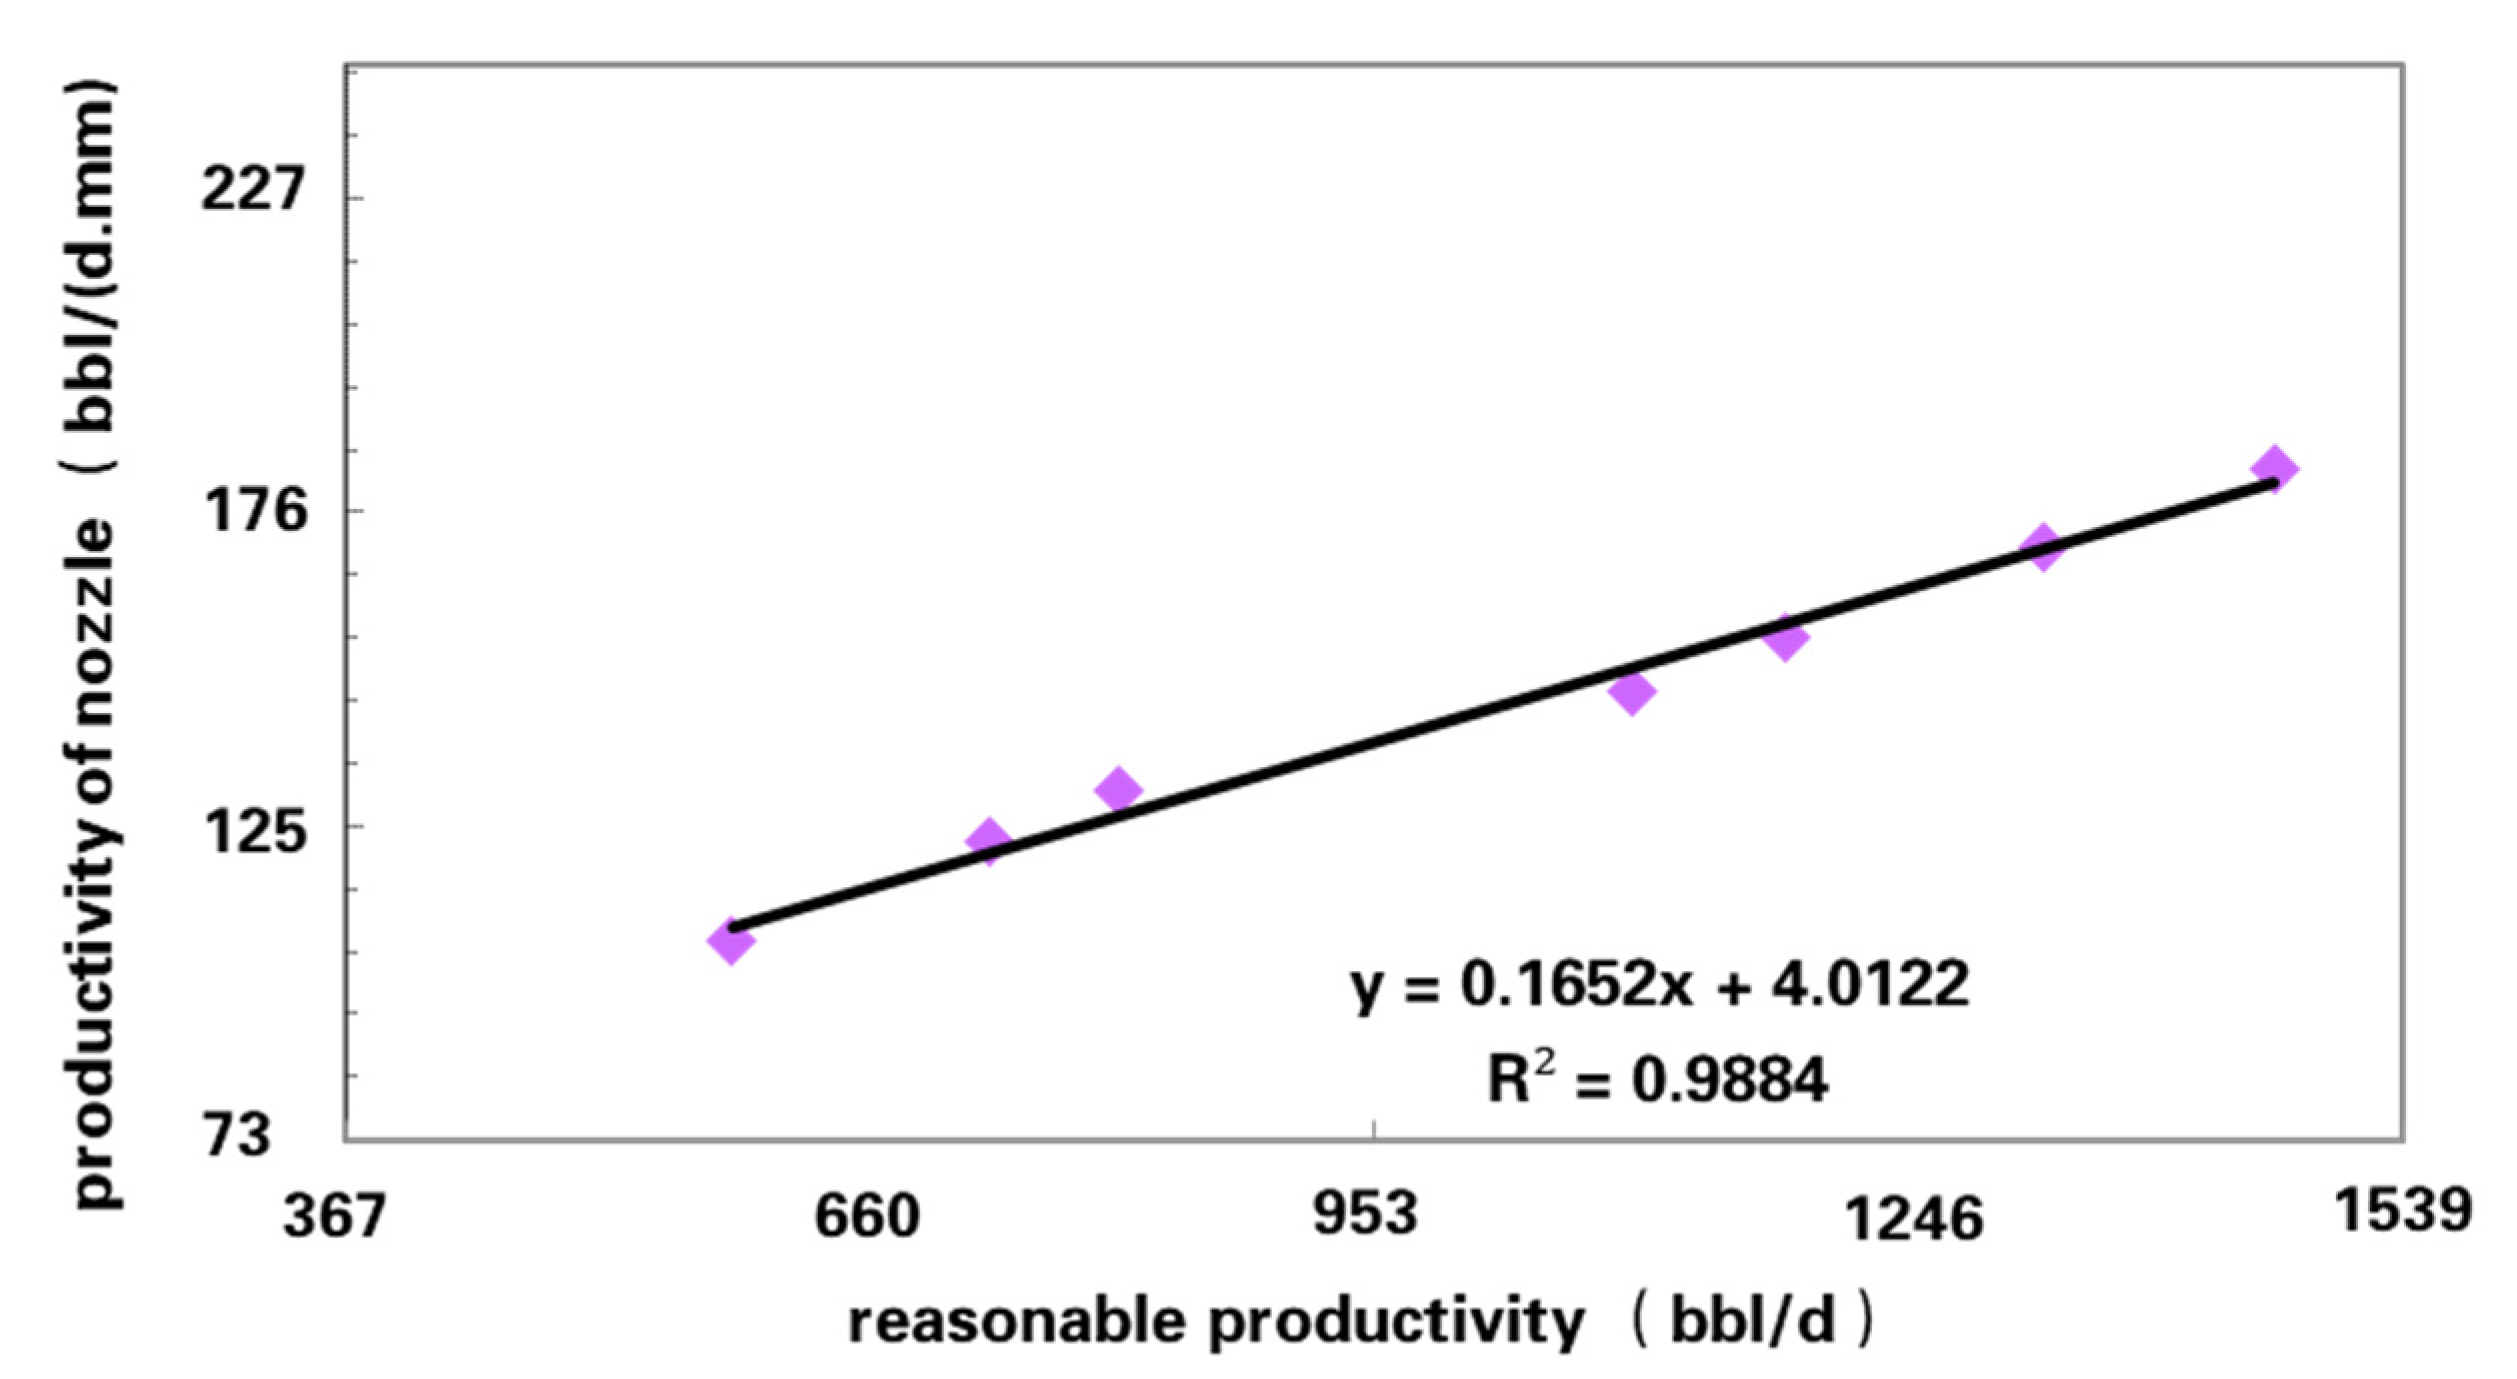
Figure 16.
Histogram of reasonable productivity of 22 stable−production wells in the Fuman Oilfield.
Figure 16.
Histogram of reasonable productivity of 22 stable−production wells in the Fuman Oilfield.
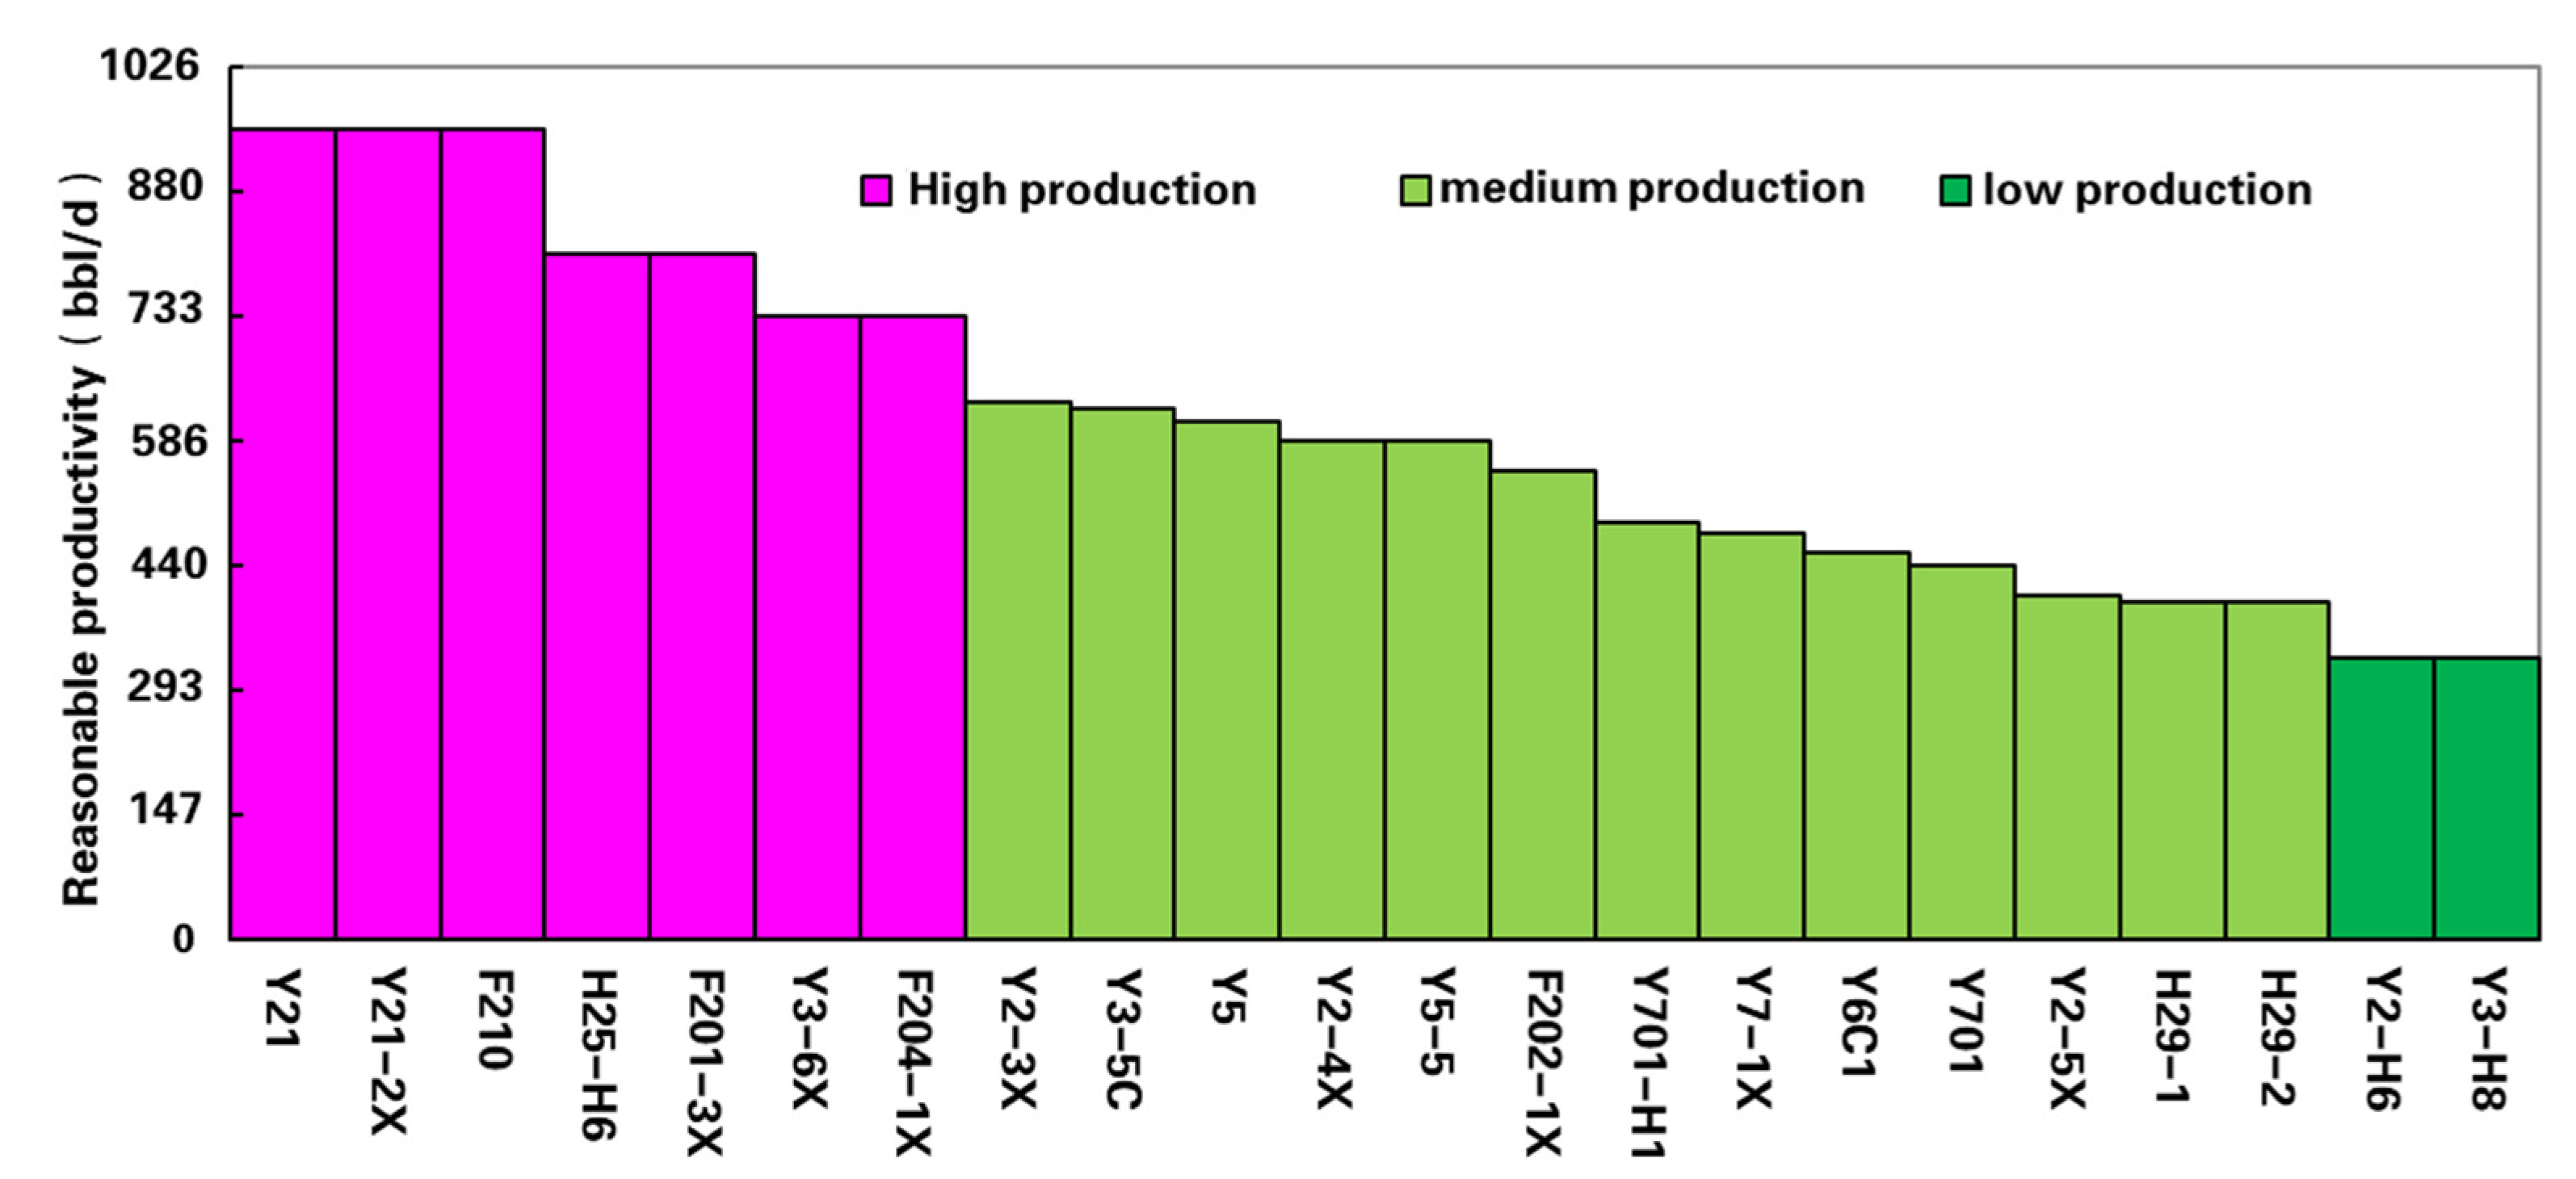
Figure 17.
Comparison diagrams of the prediction index by analogy method and reasonable productivity–dynamic reserve method.
Figure 17.
Comparison diagrams of the prediction index by analogy method and reasonable productivity–dynamic reserve method.

Table 1.
Oil pressure and production of well Y701 under different working systems.
| Nozzle (mm) | Oil Pressure (MPa) | Stable Production (bbl/d) |
|---|---|---|
| 3 | 26.2 | 328 |
| 3.5 | 25.3 | 357 |
| 4 | 23.8 | 441 |
| 5 | 18.3 | 553 |
Table 2.
A comparison table of annual production allocation of new wells between the analogy method and the productivity–dynamic reserve method.
Table 2.
A comparison table of annual production allocation of new wells between the analogy method and the productivity–dynamic reserve method.
| Years | 1 | 2 | 3 | 4 | 5 |
|---|---|---|---|---|---|
| Average well productivity in adjacent areas (bbl/d) | 513 | 462 | 425 | 388 | 352 |
| Plan to deploy new well static reserves (104 bbl) | 828~872 | 755~792 | 704~733 | 645~674 | 594~616 |
| Number of new wells to be deployed (wells) | 6 | 6 | 5 | 5 | 4 |
| Production by analogy (bbl/d) | 513 | 462 | 425 | 388 | 352 |
| Reasonable production (bbl/d) | 513~550 | 462~491 | 425~447 | 388~410 | 352~367 |
Publisher’s Note: MDPI stays neutral with regard to jurisdictional claims in published maps and institutional affiliations. |
© 2022 by the authors. Licensee MDPI, Basel, Switzerland. This article is an open access article distributed under the terms and conditions of the Creative Commons Attribution (CC BY) license (https://creativecommons.org/licenses/by/4.0/).
Share and Cite
MDPI and ACS Style
He, X.; Wang, R.; Yang, J.; Li, S.; Yao, C.; Wu, G. Optimization of Oil Productivity from the Ultra−Depth Strike−Slip Fault−Controlled Carbonate Reservoirs in Northwestern China. Energies 2022, 15, 3472. https://doi.org/10.3390/en15093472
AMA Style
He X, Wang R, Yang J, Li S, Yao C, Wu G. Optimization of Oil Productivity from the Ultra−Depth Strike−Slip Fault−Controlled Carbonate Reservoirs in Northwestern China. Energies. 2022; 15(9):3472. https://doi.org/10.3390/en15093472
Chicago/Turabian StyleHe, Xinxing, Rujun Wang, Jianping Yang, Shiyin Li, Chao Yao, and Guanghui Wu. 2022. "Optimization of Oil Productivity from the Ultra−Depth Strike−Slip Fault−Controlled Carbonate Reservoirs in Northwestern China" Energies 15, no. 9: 3472. https://doi.org/10.3390/en15093472
Note that from the first issue of 2016, this journal uses article numbers instead of page numbers. See further details here.