
Processing Studies on Banded Hematite Quartzite’s of Sandur Sciht, Karnataka, India

1
Department of Fuel, Mineral and Metallurgical Engineering, Indian Institute of Technology (ISM), Dhanbad 826004, India
2
Department of Mineral Processing, Vijayanagara Sri Krishnadevaraya University, Ballari 583119, India
*
Author to whom correspondence should be addressed.
Energies 2022, 15(7), 2542; https://doi.org/10.3390/en15072542
Submission received: 23 January 2022
/
Revised: 24 March 2022
/
Accepted: 25 March 2022
/
Published: 30 March 2022
(This article belongs to the Special Issue Low-Grade Coal Beneficiation)
Abstract
:The greater demand for high-quality iron ores has forced the iron and steel industries to utilize low-grade iron ores, such as banded hematite quartzite (BHQ). In the present work, a striped hematite quartzite sample from the Haraginadoni area, in the Sandur schist belt, Ballari District, Karnataka, India, was subjected to characterization studies and conventional mineral processing methods to produce pellet-grade concentrate, assayed as Fe > 63.0%, SiO2 + Al2O3 < 7%, (Al2O3/SiO2 < 0.5). The sample was analyzed as 35.70% Fe, 47.44% SiO2, 0.75% Al2O3, 0.06% Mn, 0.07% TiO2, 0.03% P, 0.02% S, and 0.83% LOI. We focused on two routes of beneficiating BHQ samples: (1) conventional gravity followed by reverse floatation and (2) magnetic separation followed by cleaning of magnetic concentrate by reverse floatation. Route 1, achieved pellet-grade concentrate through assaying, and was 63.73% Fe, 6.20% SiO2, 0.19% Al2O3, 0.03% Al2O3/SiO2, and 0.23% LOI, D80 45 µm, with 70.1% Fe recovery and 62.8% concentration efficiency at 39.6 wt% yield. Using Route 2, the process consisted of WHIMS at −74 µm, D80 54 µm, 10,000 Gauss, and with a 3 mm ball matrix, followed by flotation of the WHIMS concentrate, which produced a concentrate through assaying and was 63.34% Fe, 6.30% SiO2, 0.20% Al2O3 (0.03 Al2O3/SiO2), and 0.20% LOI with 77.4% Fe recovery, achieving a 68.8% concentration efficiency at 44.0 wt% yield, meeting pellet-grade specifications. Comparing and analyzing both routes for the concentration methods, Route 2, i.e., WHIMS and the reverse flotation of WHIMS concentrate, was amenable compared to Route 1.
1. Introduction
Banded hematite quartzite (BHQ) is a low-grade iron ore with an iron content ranging between 37% and 44%. India has 22,487 million tons of hematite iron ore resources, and 5422 million tons in the reserve category. Karnataka State, mainly the Sandur schist belt, accounts for about 11% of this hematite iron ore resources. The area under investigations forms the southern part of the Sandur greenstone belt and lies between longitude 76°4500″and 76°52′40″ east and latitude 15°00″ and 15°9′30″ north (Figure 1). The survey of India topo sheet no. 57A/16 includes part of the Ballari District of Karnataka and part of the Ananthpur District of the Andhra Pradesh states. The area is accessible from Haraginadoni, about 16 km west of Ballari. Since 1838, a number of researchers have worked on the various lithological units of the Ballari District, with particular focus on the Sandur greenstone belt. Still, very few have performed studies on the Haraginadoni area. Captain New bold was the first to traverse various parts of the Ballari District to study rock formations and reported copper mineralization in the Sugalammadevi Konda area of Copper Mountain [1]. Later, Bruce Foote identified granite, gneiss, and schistose formations in the Sandur greenstone belt. He found traces of copper mineralization in the old workings of the shallow caves of the Copper Mountain Range. The occurrences of aegirine and riebeckite in the BIF of the southern part of the Copper Mountain Range [2]. They concluded that thin ferruginous layers containing aegirine and riebeckite are metasomatic in origin. They also reported the presence of a diabase dyke in the Haraginadoni area of the Copper Mountain Range. Roy and Biswas [3] studied the structures of the Sandur greenstone belt. According to them, the Copper Mountain Range is a syncline, plunging towards the northwest at a moderate angle of 35°. To the south of the Copper Mountain Range, there are two subsidiary folds, a syncline and an anticline, characteristic of the en échelon type of macroscopic fold. A geological map of the Haraginadoni area is shown in Figure 2. India also has vast deposits of other low-grade iron ores, such as banded hematite quartzite (BHQ) and banded hematite jasper (BHJ).
The BHQ from the Haraginadoni area, Belagal Range, in the Sandur schist belt close to Ballari town is an essential small/medium-sized mine. Usually, iron ores are mined using an open cast mining method, leading to stacking of overburden laterite, and the adjoining BHQ low-grade iron ores are stacked and considered mine waste. Domestic steel consumption is expected to grow annually at a 10% rate. As per the national steel policy, the present target is to produce 324 million tons of steel in 2025, leading to a need for 505 million tons of raw ore for domestic purposes only, aside from the export commitments of another 100 million tons [4]. The depletion of high-grade ores and the closure of high-grade iron-ore mines due to environmental issues enhanced the demand for quality-calibrated lumps. Pellets with alumina/silica ratings of ≤0.5 required by iron and steel industries, and also long-term sustainability plans of the steel industry have resulted in the utilization of low-grade BHQ deposits, after beneficiation, to obtain the required grade, which is then followed by pelletization. It is known that a 1% decrease in alumina content of iron ore leads to a decrease in coke rates by 2.5% with an increase of 4% blast furnace productivity and a reduction in flux consumption of 30 kg per ton of hot metal. When fully charged with pellets, B.F. productivity increases by 40% [5]. The processing of BHQ and the pelletization of concentrates may augment supplies, utilize waste BHQ rocks, and improve blast furnace performance. Resource conservation, waste management, environmental and mineral conservation, and enhanced and efficient furnace productivity lead to an overall sustainable development of the ironore mining and steel hub. However, the utilization of BHQ is a challenge, as its Fe% grade is less than 45% Fe and shows fine granularity. The intricate mixing of ore and gangue mineral grains and the poor liberation characteristics of low-grade iron ores necessitate efficient fine-sized grinding for the recovery of valuables for pelletization of the concentrate for steelmaking [6]. Pelletization of iron ores utilizes very finely ground ores or concentrates with sufficient iron content greater than 63% [7]. There have been literature reviews on the processing of fine-grained banded iron oxide for the production of pellet/metallurgical-grade concentrate. The process used wet high-intensity magnetic separation, flotation, and slime gravity concentration. Mishra et al. [8], Shrell and Nevens [9], Anupam et al. [10], Gurulaxmi et al. [11], Das et al. [1,12], Mohanrao et al. [13], Nanda and Gopalkrishna [14], and Sharathkumar et al. [15] employed combinations of the above processes to upgrade BHQ in the Sandur schist belt, and in the Indian subcontinent in general.
2. Materials and Methods
About 1 ton of the representative run of mine (ROM) of banded hematite quartz material from BHQ dumps in the Haraginadoni area was collected. The representative quantity of the ROM was stage-crushed to −50 mm using a primary jaw crusher (200 × 250 mm) (MPE Mumbai), and then to −1 mm using a roll crusher (250 × 150 mm) (MPE Mumbai) in a closed circuit with a 1 mm sieve. The crushed material was riffled and prepared as 128 packets, weighing ~8 kg. The standards enumerated by Weiss (1980) were followed for size reduction and sampling methods. A 3:1 ratio of corn starch and commercial-grade NaOH, supplied by BDH, Mumbai, was used as a depressant for iron oxides (1% concentration). Commercial-grade dodecylamine (DDA) assaying with 98% purity, supplied by Hi-Media Laboratories Private Limited, Mumbai, was used as an amine collector. A 175 × 350 mm rod mill with a 13 kg rod charge that was 25–40 mm in size (MPE Mumbai) was used for stage grinding with the respective sieve, with stage grind time intervals of 5 min at 67% S pulp density. A laboratory diester shaking table (MPE Mumbai) was used for the tabling studies. A lab model wet high-intensity magnetic separator with a max. Gauss intensity of 10,000 with a ball matrix was used for magnetic separation tests. A lab model self-aerated Denver-type flotation machine (MPE Make Mumbai) was used for the flotation studies. Mineralogical studies were conducted using an ore microscope (Leitz). An electron probe microscopic analyzer (EPMA) (JEOL-JXA-8230) was used for the examination of the polished ore samples at a voltage of 15 kV. The micronized samples were analyzed by a Bruker D8 Advance powder diffractometer with a Vantec detector and fixed divergence and receiving slits with CoKα radiation. The operating parameters of the instrument were step size of 0.01, degree 2ϴ. Bruker Topas 4.0 software was used to quantify the mineral phases. Two parameters were used to assess whether the refinements were successful: the weighted-profile R-value (Rwp) and goodness of fit (GOF) test. Weighted-profile R-value (Rwp) indicates the correlation between the identified phases to the complete scanned profile. The products were sampled and analyzed according to the standard procedures recommended by IBM [16]. The test works were conducted as per the procedures listed by the equipment manufacturers and the handbook [17].
3. Results
3.1. Characterization Studies
The samples physically appeared as grayish-black, hard, compact lumps 100 mm in size; these exhibited banding, with a specific gravity of 3.2, bulk density of 1.8 t/m3, 32° angle of repose, and a 7.33 Kwh/short ton Bond’s ball mill work index. A representative sample was analyzed as 35.70% Fe, 47.44% SiO2, 0.75% Al2O3, 0.06% Mn, 0.07% TiO2, 0.03% P, 0.02% S, and 0.83% LOI. It is evident from the chemical analysis that the sample contained low iron content with a remarkably high percentage of silica and a marginally high phosphorous content. Incidentally, the alumina content of the sample was low, which is highly desirable for the Indian steel sector. The characteristics of the sample indicated that the BHQ was hard, compact, and abrasive, with amoderate work index value. The sample mainly comprised 40–45% cherty quartz that was <40 µm in size, 35–40% hematite particles with a size of <70 µm, and 15–42% martitized magnetite with a size of <100 µm. The sample also contained trace amounts of very fine-grained amphibole and apatite. The hematite grain size ranged from 100 to 25 µm. Hematite was also present as granular aggregates in the pockets and bands;these appeared as fine inclusions in the hematite grains (Figure 3 and Figure 4). Martitized magnetite occurred as grains and aggregates and was dispersed in the matrix. In some places, the sample also contained trace amounts of apatite and amphibole (Figure 4). The mineralogical findings were confirmed by XRD (Figure 5).
An EPMA study confirmed the mineralogy and indicated that most hematite grains were free at −74 µm (Figure 6). The sample has two distinct types of valuable minerals:(i) predominantly hematite grains having euhedral structure (fine- to medium-grained) with disseminated silicate inclusions and (ii) micro-crystalline hematite particles intermixed with silica grains. Area 1 of Figure 6 shows the hematite-dominant phase and Areas 3 and 4 show the silica-predominant phase, and minor cracks are also observed. XRD phase analysis suggested that the sample contained quartz (40.9%), hematite (42.5%), magnetite (5.6%), zeolite (5%), coesite (4.3%), goethite (0.6%), amphibole (0.6%), and amorphous silica (0.5%), confirming the microscopic ore studies. These results are similar to the findings of previous works by Krishna et al. [18], Nanda et al. [19], and Nadezhada et al. [20] on the characteristics of BHQ upon processing.
3.2. Effect of Mesh of Grind (MOG) on Tabling
Tabling tests were conducted by varying the stage ground mesh of the grind, all passing −210 µm, −106 µm, and −74 µm sizes. The results are given in Table 1. The results indicate that an increase in the fineness of the size increases the concentrate grade and the % Fe recovery. The concentrate grade is improved because of the adequate degree of liberation of the iron minerals at the −74 µm size, confirming mineralogical and EPMA findings. The recovery decrease is attributed to the finer size range/slimy liberated iron-bearing minerals in the feed, which were lost in the rejected fraction due to the size limitations of the tabling. Tabling at D80 54 µm produced a concentrate that was assayed as 63.03% Fe with a 45% Fe distribution, 39.7% concentration efficiency, at 25.7 wt% yield, meeting the specifications. The observations are akin to the findings of Nayak et al. [21], Vijaya Kumar et al. [22], Sharath Kumar et al. [15], and Nanda et al. [19]. Incidentally, Nayak et al. [21] recommended multi-gravity separation at −74 µm to increase % Fe recovery.
3.3. Effect of MOG on Reverse Flotation Tests
Reverse flotation tests were conducted to significantly remove gangue mineral from the BHQ samples. The test comprised stage grindingof the samples to produce −210 µm, −106 µm, and −74 µm sizes. Flotation experiments were performed at pH 9, after conditioning with 1.5 kg/t caustic starch for 10 min and conditioning with 0.25 kg/t dodecylamine cationic collector for 1 min. The results are given in Table 2. The results show that as the particle size decreased, the Fe grade improved in the concentrate and the %Fe recovery. The concentrate resulted in 63%Fe with 56%Fe recovery and a 49.04% concentration efficiency at 32.9 wt% yield at MOG of D80 54 µm. Vijaya Kumar et al. [22] recommended flotation using column cells to avert the slime entrapment problem and prevent Fe slime losses.
3.4. Effect of Feed Particle Size on WHIMS Test
Wet high-intensity magnetic separation tests were conducted on different feed particle sizes (D80 54/80/106 µm) to determine the effect of particle size on magnetic separation. A constant magnetic intensity of 10,000 Gauss and a matrix diameter of 6 mm were maintained during the tests. The results are given in Table 3. The results indicate that concentrate assaying showed that 60% Fe with 75% Fe recovery was obtained. An increase in the fineness of the MOG to −74 µm D80 54 µm increased the concentrate grade to 60% with depleting wt% yield to 45.6%. WHIMS at a 10,000 Gauss intensity, MOG −74 µm, D80 54 µm, and a 6 mm ball matrix could produce a concentrate that was assayed as 60.0% Fe with 75% Fe recovery, with a CE of 61.3 at 45.0 wt% yield. The WHIMS test at a feed particle size of −210 µm (D80 106 µm) produced concentrate that was relatively inferior in grade; this was attributed to the interlocking nature of the particles present in the feed. It was observed that the optimal MOG was D80 54 µm. Earlier studies with BHQ/BHJ from the Ballari area reported by Mishra etal. [8], Krishna et al. [18], demonstrated this effect.
3.5. Amenability of BHQ to Gravity Concentration, WHIMS, and Reverse Flotation
Tabling studies of the BHQ sample at −74 µm recovered 45% Fe values. The table concentrate was further processed using reverse flotation, followed by magnetic separation. The concentrate obtained from the tabling studies was treated in a flotation cell by conditioning the pulp with 1.5 Kg/tof caustic starch and 0.25 kg/t of dodecyl amine cationic collector, and 56% Fe values were recovered. The flotation concentrate was subjected to WHIMS at a 10,000 Gauss intensity. The 9 mm ball matrix yielded pellet-grade concentrate with a 60% recovery. Each experiment’s concentration efficiency was evaluated based on the recovery of iron-bearing minerals, as defined by Wills and Napier-Munn [23]. The concentration efficiency (C.E.) was determined as:
where C.E. is the concentration efficiency in %, is the % iron in the concentrate, is the maximum (theoretical) iron % in the concentrate (~70% for hematite), is the Fe % in the feed, and represents the yield of the concentrate in %.
The concentration efficiency for tabling, reverse flotation, and WHIMS were found to be 39.7, 49.04, and 61.35, respectively. The low concentration efficiency in the gravity concentration was attributed to problems related to slime processing. Incidentally, Nayak et al. [21] recommended multi-gravity separation at −74 µm to increase the % Fe recovery. The high concentration efficiency in the case of WHIMS may be due to the presence of martitized magnetite content in the sample. The results indicate that reverse flotation and WHIMS appeared to have optimal grade and concentration efficiency due to their efficient slime-processing characteristics, similar to the findings of Raj et al. [24], Gurulaxmi et al. [11], Das et al. [1,12], Mohanrao et al. [13], and Nanda et al. [14]. The WHIMS process appeared to be more effective, probably due to a slightly high incidence of martitized magnetite in the sample, and the results were similar to those of Raj et al. [24] and Nanda et al. [14]. The attempts to clean the WHIMS concentrate drastically reduced % Fe recovery. Raj et al. [24] indicated that WHIMS followed by flotation yielded better results than flotation–WHIMS.
3.6. Wet High-Intensity Magnetic Separation (WHIMS) Tests to Optimize Machine Parameters
WHIMS tests were carried out to establish the optimal processing parameters to obtain a desirable grade of concentrate at a satisfactory level of recovery. The tests were carried out at a feed pulp density of 30% solids by weight. Field intensities were 4950/8800/10,000 Gauss, the ball matrix diameter was 3/6/9 mm.
3.6.1. Effect of WHIMS Matrix on % Fe Grade and % Fe Recovery
WHIMS tests were conducted at −74 µm, D80 54 µm, and at 10,000 Gauss intensity, and by varying the matrix diameter (3/6/9 mm). The results are given in Table 4. The results indicate that an increase in the matrix diameter increased the concentrate grade, but decreased the wt% yield and % Fe recovery. The pellet-grade concentrate obtained at a 9 mm matrix, at −74 µm, D80 54 µm, and 10,000 Gauss intensity had 60% Fe recovery at a 35.0 wt% yield. A minimum matrix diameter of 3 mm was chosen as the optimal matrix to obtain maximum iron recovery. A concentrate assayed as ~50.76% Fe with 87.0% Fe recovery could be obtained. Grade deterioration was attributed to the gangue particle entrapment at high magnetic intensities and the reduced pore volume. This effect was witnessed by Tang et al. [25] while working on conventional WHIMS, and they recommended vertical pulsating wet high-gradient magnetic separators to avert this entrapment problem.
3.6.2. Effect of Intensity on % Fe Grade and % Fe Recovery
WHIMS tests were conducted at −74 µm, D80 54 µm, with a 3 mm ball matrix, by varying the intensities (10,000/8800/4965 Gauss). The results are given in Table 5. The results indicate that an increase in intensity increased the wt% yield and % Fe recovery, but also decreased the grade of the concentrate. A high-grade concentrate assayed as 66.50% Fe with 45.3% Fe recovery at 24.5 wt% yield was obtained at a magnetic field intensity of 4965 Gauss due to the concentration of magnetite–martite. However, 10,000 Gauss was chosen as the optimal intensity for maximum % Fe recovery. A concentrate assayed as ~50.76% Fe with 87.0% Fe recovery could be obtained at 10,000 Gauss. The dilution of grade was attributed to the entrapment of grains in the concentrate, the high gradient intensities, and the reduced pore volume in a very fine matrix. Similar observations were made previously by Raj et al. [24], Gurulakshmi et al. [11], and Nayak et al. [21]. While working on conventional WHIMS, Tang et al. [25] recommended vertical pulsating wet high-gradient magnetic separators to avert this entrapment problem.
3.6.3. WHIMS Test under Optimal Conditions
The pellet-grade concentrate was obtained in a 9 mm matrix, at −74 µm, D80 54 µm, and an intensity of 10,000 Gauss with 60% Fe recovery at 35.0 wt% yield. Alternatively, tests under the fine matrix conditions for the 3 mm ball matrix produced a concentrate assayed as 50.76% Fe with 87.0% Fe recovery at a 61.7 wt% yield. The dilution was attributed to the entrapment of grains in the concentrate at high gradient intensities, and this reduced the pore volume in the very fine matrix. Similar results were obtained by Raj et al. [24], Gurulakshmi et al. [11], and Nayak et al. [21] during WHIMS tests on BHQ, where they recommended cleaning to obtain a pellet-grade concentrate from the concentrates, obtained from 3 mm ball matrix maximum gradient intensity with a fine MOG of −74 µm, D80 54 µm. Svoboda [26] recommended one more stage to treat WHIMS magnetic fractions to obtain the best grade. However, in this case, a cleaner WHIMS produced pellet-grade concentrate with a significant drop in % Fe recovery (30%).
3.7. WHIMS Followed by Reverse Flotation
The concentrate produced by WHIMS at 10,000 Gauss with a 3 mm matrix and varying MOG was subjected to reverse flotation, which resulted in pellet-grade concentrate. The sample was conditioned with caustic starch for 10 min to depress iron-bearing minerals, followed by floating siliceous gangue minerals after conditioning with a dodecylamine collector for 1 min. The studied variables were MOG (D80 54/80/106 µm), depressant caustic starch dosage (0.5/1.0/1.5 kg/t), and collector dodecylamine (0.05/0.15/0.25 kg/t).
3.7.1. Effect of MOG on Flotation Performance
Flotation performance was analyzed by varyingMOG (D80 54/80/106 µm) to optimize the feed size. Table 6 shows that an increase in the fineness of the grind increases the % Fe grade and marginally decreases the % Fe recovery. Maximum concentrate grade was achieved at MOG −74 µm, D80 54 µm, producing concentrateassayed as 66% Fe with 69.1% Fe recovery at 37.7 wt% yield, meeting the pellet-grade specifications. This may be due to the liberation at −74 µm. However, the concentration efficiency is the maximum at D80 80 µm; this is attributed to the availability of gangue particle at coarser fractions during bubble entrainments.
3.7.2. Effect of Depressant Dosage on % Fe Grade and Recovery
Flotation tests were conducted at MOG of −74 µm, D80 54 µm, with 0.15 kg/t dodecylamine collector, and a varying depressant dosage from 0.5 to 1.5 kg/t. The results are shown in Table 7. An increase in the depressant dosage increased the grade of concentrate and % Fe recovery due to the selective depression of iron oxides and selective flotation of quartz gangue. The optimal values were obtained at a high level (1.0 kg/t) of caustic starch depressant, producing concentrates assayed as 63.5% Fe with a 77.78% Fe recovery at 44.1 wt%yield. Similar results were obtained by Rajet al. [24], Gurulaxmi et al. [11], Das et al. [1,12], and Mohanrao et al. [13], with very fine MOG. Lima et al. [27] studied the effects of caustic starch and amine collector in iron mineral flotation. They indicated that the caustic starch dosage, conditioning, and collector dosage are critical at very fine sizes.
3.7.3. Effect of (Dodecylamine) Collector Dosage on % Fe Grade and % Fe Recovery
Flotation tests were conducted at MOG of −74 µm, D80 54 µm, with 1.5 kg/t of depressant dosage and a varying collector of 0.05/0.15/0.25 kg/t. The results are given in Table 8. The results indicate that with a decrease in collector dosage, the % Fe grade was gently dropped in the concentrate, and the % Fe recovery was increased. This anomaly of obtaining pellet-grade concentrate with a high Fe recovery with a minimum collector dosage may be due to the flotation of liberated fast-floating quartz. The optimal values were obtained at 0.05 kg/t dodecylamine, as pellet-grade concentrate was produced, which was assayed as 63.34% Fe with 77.4% Fe recovery at 44.0 wt% yield. Lima et al. [27] studied the effect of caustic starch and amine collector in iron mineral flotation and indicated that at very fine sizes, the caustic starch dosage, conditioning, and amine collector dosage are critical. Similar observations were made by Vijaya Kumar et al. [22] during the reverse flotation of iron ore slimes.
3.8. Amenability to the Conventional Process of Tabling, WHIMS of Table Tailings, and Flotation of WHIMS Concentrates
The final test consisted of a stage of ground sample of −74 µm being introduced to tabling. The table tails were subjected to WHIMS after thickening of the pulp to 30% solids, at a 10,000 Gauss intensity, using a 3 mm ball matrix. The reverse flotation of WHIMS magnetic concentrate was performed after conditioning for 10 min with 1.5 kg/t caustic starch and conditioning with the collector for 1 min at 0.15 kg/t. The results are given in Table 9. The above process yielded a final concentrate, assayed as 63.73% Fe, 6.20% SiO2, 0.19% Al2O3, and 0.23% LOI with a 0.03 Al2O3/SiO2 ratio, 70.1% Fe recovery, 62.8% concentration efficiency, and at a wt% yield of 39.6, meeting the pellet-grade specifications. The conventional gravity–WHIMS–reverse flotation process was slightly low in terms of concentration efficiency and product quality compared to WHIMS and refining of the concentrate by reverse flotation, probably due to the high incidence of martitized magnetite in the sample.
3.9. The Final Process of WHIMS and Flotation of WHIMS Concentrate
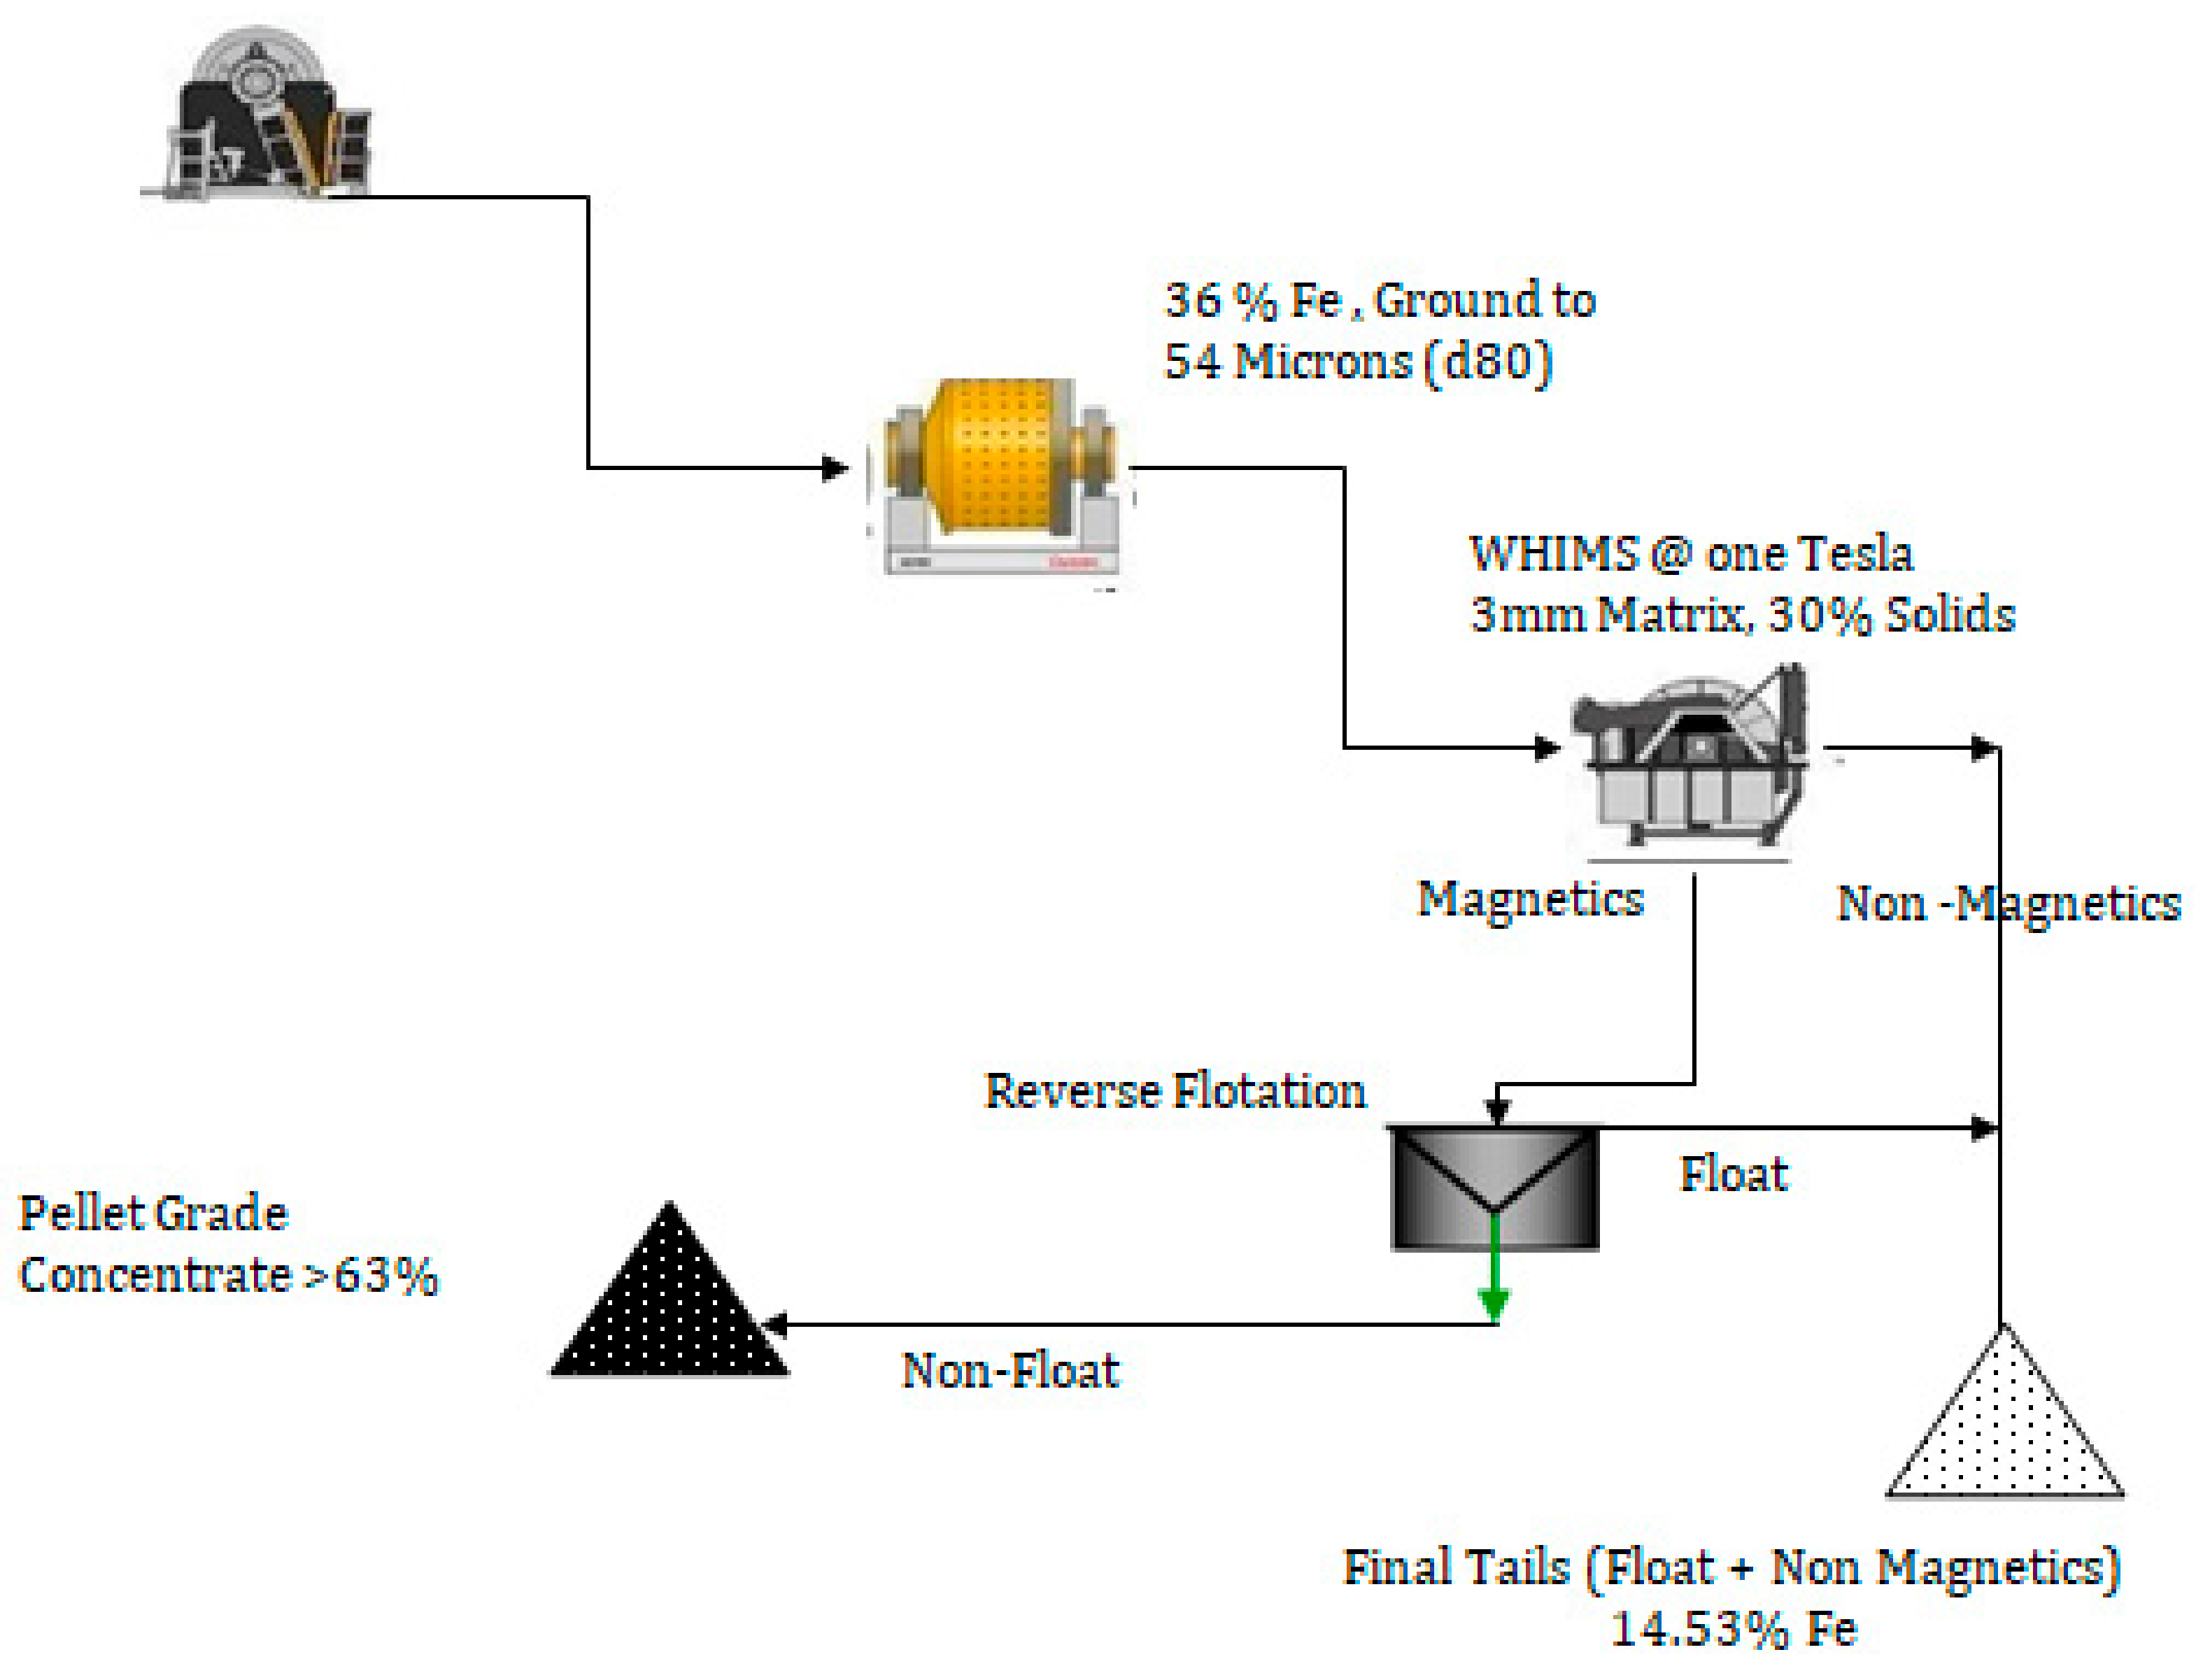
The optimal test consisted of conducting WHIMS at MOG of −74 µm, D80 54 µm, at 10,000 Gauss, flotation of WHIMS magnetic concentrate at 1.5 kg/t of caustic starch depressant dosage, and 0.05 kg/t dodecylamine collector. The results of the final test are given in Table 10. The final fine particle process of WHIMS and flotation produced a concentrate assayed as 63.34% Fe, 6.30% SiO2, 0.20% Al2O3, 0.02% P, 0.02% S, and 0.20% LOI with 0.03 Al2O3/SiO2 ratio, 77.4% Fe recovery, and 68.8% concentration efficiency at 44.0 wt% yield, meeting the specifications required for pellet manufacturing. The sample was more amenable to WHIMS and reverse flotation of WHIMS concentrate than conventional gravity, WHIMS, and the reverse flotation process. High-grade concentrate and a higher concentration efficiency were obtained due to the marginally high martitized magnetite % in the BHQ sample. The reports by Nanda and Gopal Krishna [14] showed that with two-stage WHIMS followed by reverse cationic flotation after grinding, the −74 µm obtained a concentrate assayed as 60% Fe with about 33% iron recovery from the banded hematite jasper sample. Raj et al. [24] indicated that WHIMS followed by flotation yielded better results than flotation followed by WHIMS. The final process flowsheet is shown in Figure 7. The characteristics of the final concentrate and the final tails are given in Table 11 and Table 12, respectively.
4. Conclusions
BHQ from the Haraginadoni area of the Sandur schist belt in Ballari, Karnataka, India, was analyzed and found to contain 35.70% Fe, 47.44% SiO2, 0.75% Al2O3, 0.06% Mn, 0.07% TiO2, 0.21% CaO, 0.05% MgO, 0.10% Na2O, 0.02% K2O, 0.03% P, 0.02% S, and 0.83% LOI. Mineralogically, the sample comprised 40–45% cherty quartz with a size of <40 µm, 35–40% hematite with a grain size of <70 µm, and 15–20% martitized magnetite with a grain size of <100 µm. The mineral grains were mutually intimately intermixed and interlocked. The sample also contained trace amounts of very fine-grained amphibole and apatite. The iron minerals had a fair degree of liberation at <74 µm in size. The above BHQ was amenable to tabling. Reverse flotation with 1.5 kg/t of caustic starch and 0.25 kg/t of dodecylamine collector and WHIMS at 10,000 Gauss intensity with a 3 mm ball matrix at −74 µm and D80 54 µm produced pellet-grade concentrates with 45%, 56%, and 60% Fe recovery, respectively. The conventional process consisted of tabling stage-ground product to −74 µm, D80 54 µm. WHIMS of table tailings at 10,000 Gauss, 3 mm ball matrix, and reverse flotation of WHIMS magnetic concentrate after conditioning for 10 min with 1.5 kg/t caustic starch iron oxide depressant, and floating of silica gangue after conditioning for 1 min with 0.15 kg/t dodecylamine collector produced a final concentrate (table + flotation) assayed as 63.73% Fe, 6.20% SiO2, 0.19% Al2O3, 0.03% Al2O3/SiO2, and 0.23% LOI, D80 45 µm, with 70.1% Fe recovery and 62.8% concentration efficiency at a wt% yield of 39.6, meeting pellet-grade specifications. The final process consisted of feed of size −74 µm, D80 54 µm subjected to WHIMS at 10,000 Gauss intensity with 3 mm ball matrix. The WHIMS concentrate fed to flotation with reagent dosages of 1.5 kg/t caustic starch depressant and dodecylamine collector dosage of 0.05 kg/t. The final concentrate assayed as 63.34% Fe, 6.30% SiO2, 0.20% Al2O3, 0.02% P, 0.02% S, 0.03% Al2O3/SiO2, and 0.20% LOI with 77.4% Fe recovery and 68.8% concentration efficiency at 44.0 wt% yield, meeting pellet-grade specifications of Fe > 63.0%, SiO2 + Al2O3 < 7%, and SiO2/Al2O3 < 0.5. The sample is more amenable to WHIMS and reverse flotation of WHIMS concentrate. However, the results obtained are for the specific type of BHQ sample from the study area.We recommend pilot-scale studies to confirm the ore response to the treatment.
Author Contributions
Conceptualization, S.N.; formal analysis, P.S.K.; writing—original draft preparation, A.K.S. All authors have read and agreed to the published version of the manuscript.
Funding
This research received no external funding.
Conflicts of Interest
The authors declare no conflict of interest.
Abbreviations
| BHQ | Banded hematite quartzite |
| WHIMS | Wet high-intensity magnetic separator |
| LOI | Loss on ignition |
| ROM | Run of mine |
| DDA | Dodecylamine |
| MOG | Mesh of grind |
| D80 | 80% passing size |
| Kwh | Kilowatt hour |
| XRD | X-ray diffraction |
| EPMA | Electron probe microscopic analysis |
| CE | Concentration efficiency |
| MPE | Mineral processing equipment |
| IBM | Indian Bureau of Mines |
References
- Das, B.; Mishra, P.K.; Prakash, S.; Das, S.K.; Reddy, P.S.R.; Angadi, S.L. Magnetic and flotation studies of BHQ ore for pelletgrade concentrate. Int. J. Miner. Metall. Mater. 2010, 17, 675–682. [Google Scholar] [CrossRef]
- Sadasivaiah, M.S.; Karisiddaiah, S.M. Occurrence of Aegirine and Riebeckite in the Banded FerruginiousQuartziteofSanjeevarayanakota, Bellary, Karnataka. J. Kar. Uni. 1976, 21, 65–70. [Google Scholar]
- Roy, A.; Biswas, A.K. Stratigraphy and structure of Sandurschist belt, Karnataka. J. GSI 1983, 24, 19–28. [Google Scholar]
- IBM. Monographon Iron Ore; IBM: Nagpur, India, 1997. [Google Scholar]
- IBM. Ironand Steel Vision 2020; IBM: Nagpur, India, 2011. [Google Scholar]
- Khosravi, R.; Dehghani, F.; Siavoshi, H.; Pazoki, A.; Jahanian, R.; Ghosh, T. The Application of Numerical Taxonomy Technique in the Iron Ore Flotation to Determine Appropriate pH and Particle Size Distribution. Am. J. Eng. Appl. Sci. 2020, 13, 827–836. [Google Scholar] [CrossRef]
- Kumar, P.S.; Ravi, B.P.; Sivrikaya, O.; Nanda, R.K. The Study of Pelletizing of Mixed Hematite and Magnetite Ores. Sci. Sinter. 2019, 51, 27–38. [Google Scholar] [CrossRef] [Green Version]
- Mishra, B.K.; Reddy, P.S.; Das, B.; Biswal, S.K.; Prakash, S.; Das, S.K. Issues Relating to Characterization and Beneficiation of Low Grade Iron Ore Fines. Available online: www.worldsteel.org (accessed on 15 December 2007).
- Sherell, I.; Nevens, M. Iron ore-mineral processing overview. In Proceedings of the XXV International Mineral Processing Congress, Queensland, Australia, 6–10 September 2010; pp. 1227–1234. [Google Scholar]
- Anupam, A.; Singh, G.; Raghav, P.K.; Suresh, N. Studies on beneficiation of BHQ samples by different methods. In Proceedings of the XI International Seminar on Mineral Processing Technology (MPT—2010), Jamshedpur, India, 15–17 December 2010; p. 572. [Google Scholar]
- Gurulaxmi, S.N.; Ghosh, T.K.; Mukherjee, A.K. State of Art Characterization Study of Banded Hematite Jasper for Beneficiation. In Proceedings of the International Seminar on Mineral Processing Technology (MPT—2010), Jamshedpur, India, 15–17 December 2010; p. 440. [Google Scholar]
- Das, B.; Rath, S.S.; Reddy, P.S.; Das, S.K.; Mishra, B.K. The flotation response of Banded Iron Ore of Karnataka Region, India. In Proceedings of the 26th International Mineral Processing Congress (IMPC2012), New Delhi, India, 24–28 September 2012; pp. 1030–1040. [Google Scholar]
- Mohanrao, A.; Rudramuniyappa, M.V.; Hiremath, M.S.; Naganoor, P.C. Flotation studies on Banded Hematite Quartzite from Sandur Schist Belt, Bellary district, Karnataka. In Proceedings of the XXVI International Mineral Processing Congress (IMPC 2012), New Delhi, India, 24–28 September 2012; pp. 3452–3459. [Google Scholar]
- Nanda, N.K.; Gopalkrishna, S.J. Development of Process for Beneficiation of low grade iron ore fines from Karnataka. J. Mines Met. Fuels 2015, 62, 5–9. [Google Scholar]
- Sharath Kumar, P.S.; Ravi, B.P.; Krishna, S.J.G.; Patil, M.R.; Reddy, U.M. Processing of BMQ for pellet making. IJIR 2016, 2, 1–3. [Google Scholar]
- IBM. Manual of Classical and Instrumental Analysis of Ores, Mineral, and Environmental Samples; IBM: Nagpur, India, 2012. [Google Scholar]
- Weiss, N. Handbook of Mineral Processing; SME: New York, NY, USA, 1980. [Google Scholar]
- Krishna, S.J.G.; Patil, M.R.; Rudrappa, C.; Kumar, S.P.; Ravi, B.P. Characterization and processing of some Iron ores of India. J. Inst. Eng. India Ser. D 2013, 94, 113–120. [Google Scholar] [CrossRef] [Green Version]
- Nanda, S.K.; Pani, S.; Beura, D. Recovery of iron values through conventional beneficiation techniques from BHJ of eastern India with reference to mineralogical and chemical characterization. Ind. J. Sci. Technol. 2020, 13, 3960–3969. [Google Scholar] [CrossRef]
- Nadezhda, V.N.; Tatiana, N.A.; Elena, L.C.; Anastasia, A. Mineral and Technological Features of Magnetite–Hematite Ores and Their Influence on the Choice of Processing Technology. Am. Chem. Soc. Omega 2021, 6, 9077–9085. [Google Scholar]
- Nayak, N.; Das, A.; Paul, B.K. Feasibility of beneficiation of BHJ of eastern India. Int. J. Eng. Res. Technol. 2012, 1, 1–11. [Google Scholar]
- Vijaya Kumar, T.V.; Prabhakar, S.; Gopalkrishna, S.J. Selection of cationic collector for reduction of alumina and silica in Iron ore slimes of an operating plant by flotation. Int. J. Eng. Sci. Res. Technol. 2013, 2, 3295–3302. [Google Scholar]
- Wills, B.A.; Napier-Munn, T.J. Mineral Processing Technology—An Introduction to the Practical Aspects of Ore Treatment and Mineral Recovery, 7th ed.; Elsevier: Amsterdam, The Netherlands, 2006; p. 18. [Google Scholar]
- Raj, B.; Rao, B.S.S.; Mathur, N. Development of a Process flow sheet for Beneficiation of Indian Banded Hematite Quartz (BHQ) Iron Ore. In Proceedings of the Iron Ore 2007 Conference Perth: AUS IMM, Perth, Australia, 20–22 August 2007; pp. 375–380. [Google Scholar]
- Tang, Y.; Zhang, J.; Wernham, J. The research on the application of new technologies in High Gradient Magnetic Separator with horizontal magnetic line. In Proceedings of the International Mineral Processing Congress, Brisbane, Australia, 6–10 September 2010; pp. 1281–1286. [Google Scholar]
- Svoboda, J. Magnetic Methods for the Treatment of Minerals; Elsevier: Amsterdam, The Netherlands, 1987; pp. 516–527. [Google Scholar]
- Lima, N.P.; Valadão, G.E.S.; Peres, A.E.C. Effect of amine and starch dosages on the reverse cationic flotation of iron ore. Miner. Eng. 2013, 45, 180–184. [Google Scholar] [CrossRef]
Figure 1.
Location of the study area of Haraginadoni.
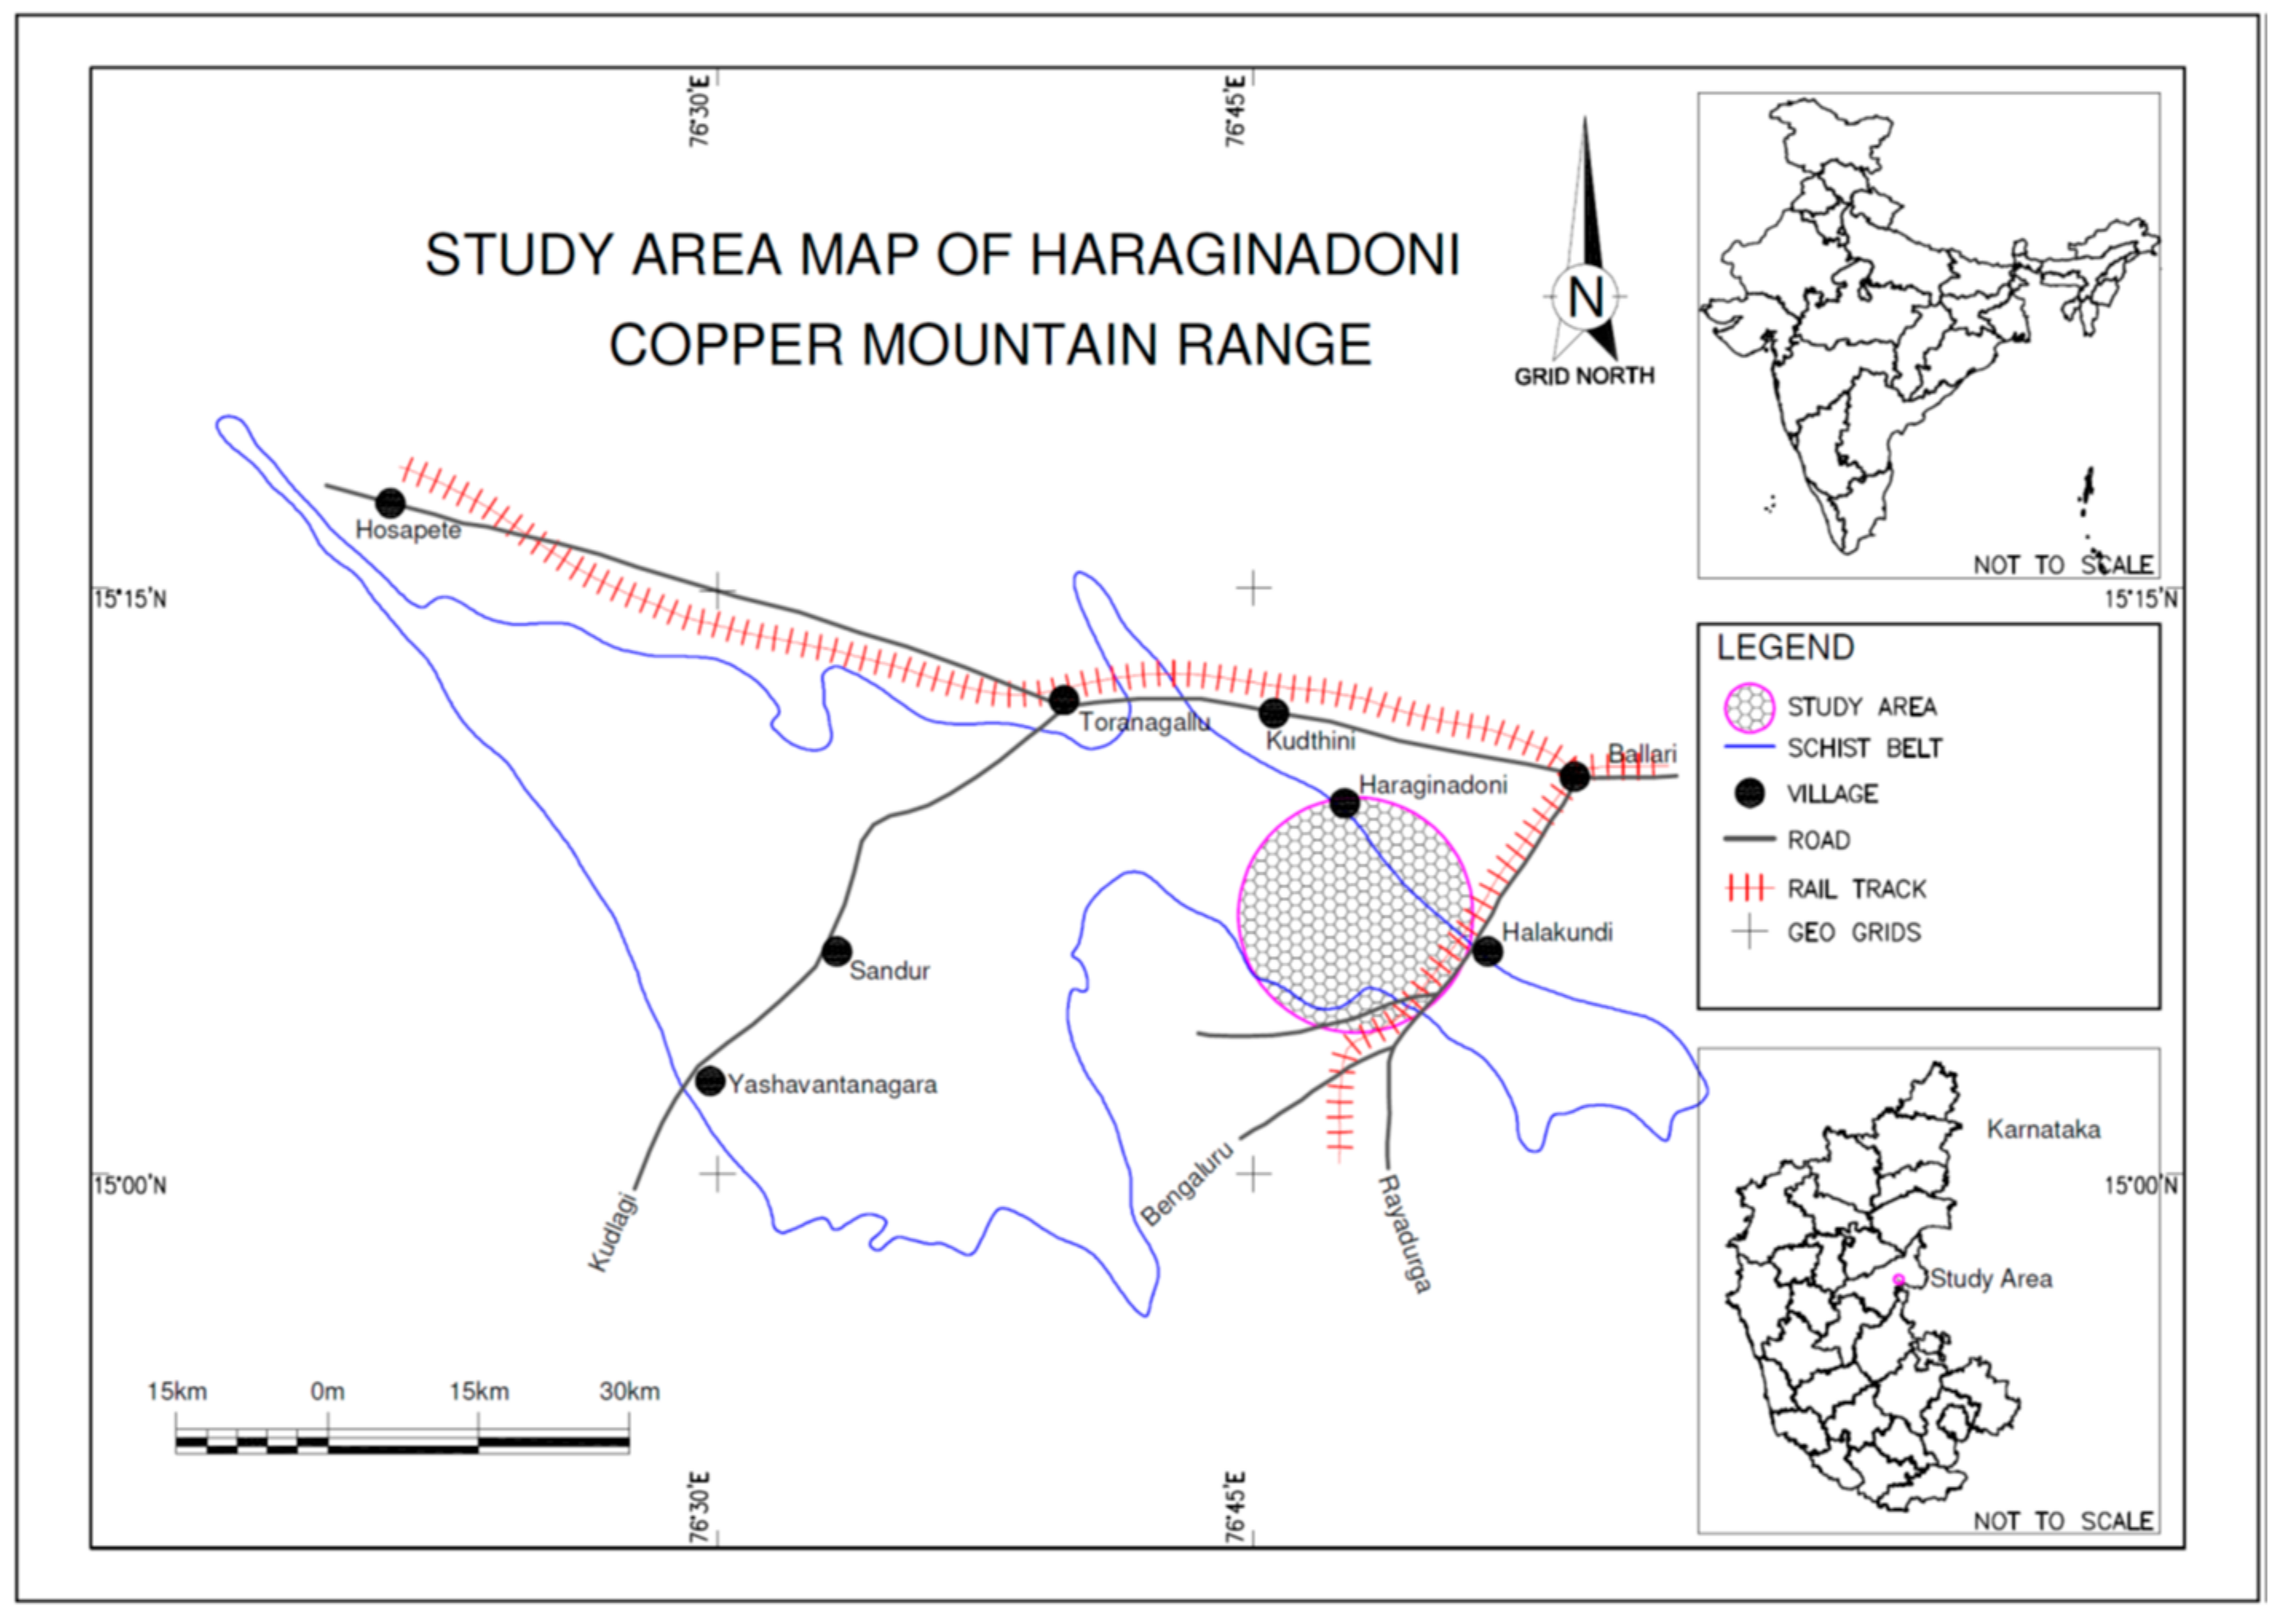
Figure 2.
Geological map of the study area.
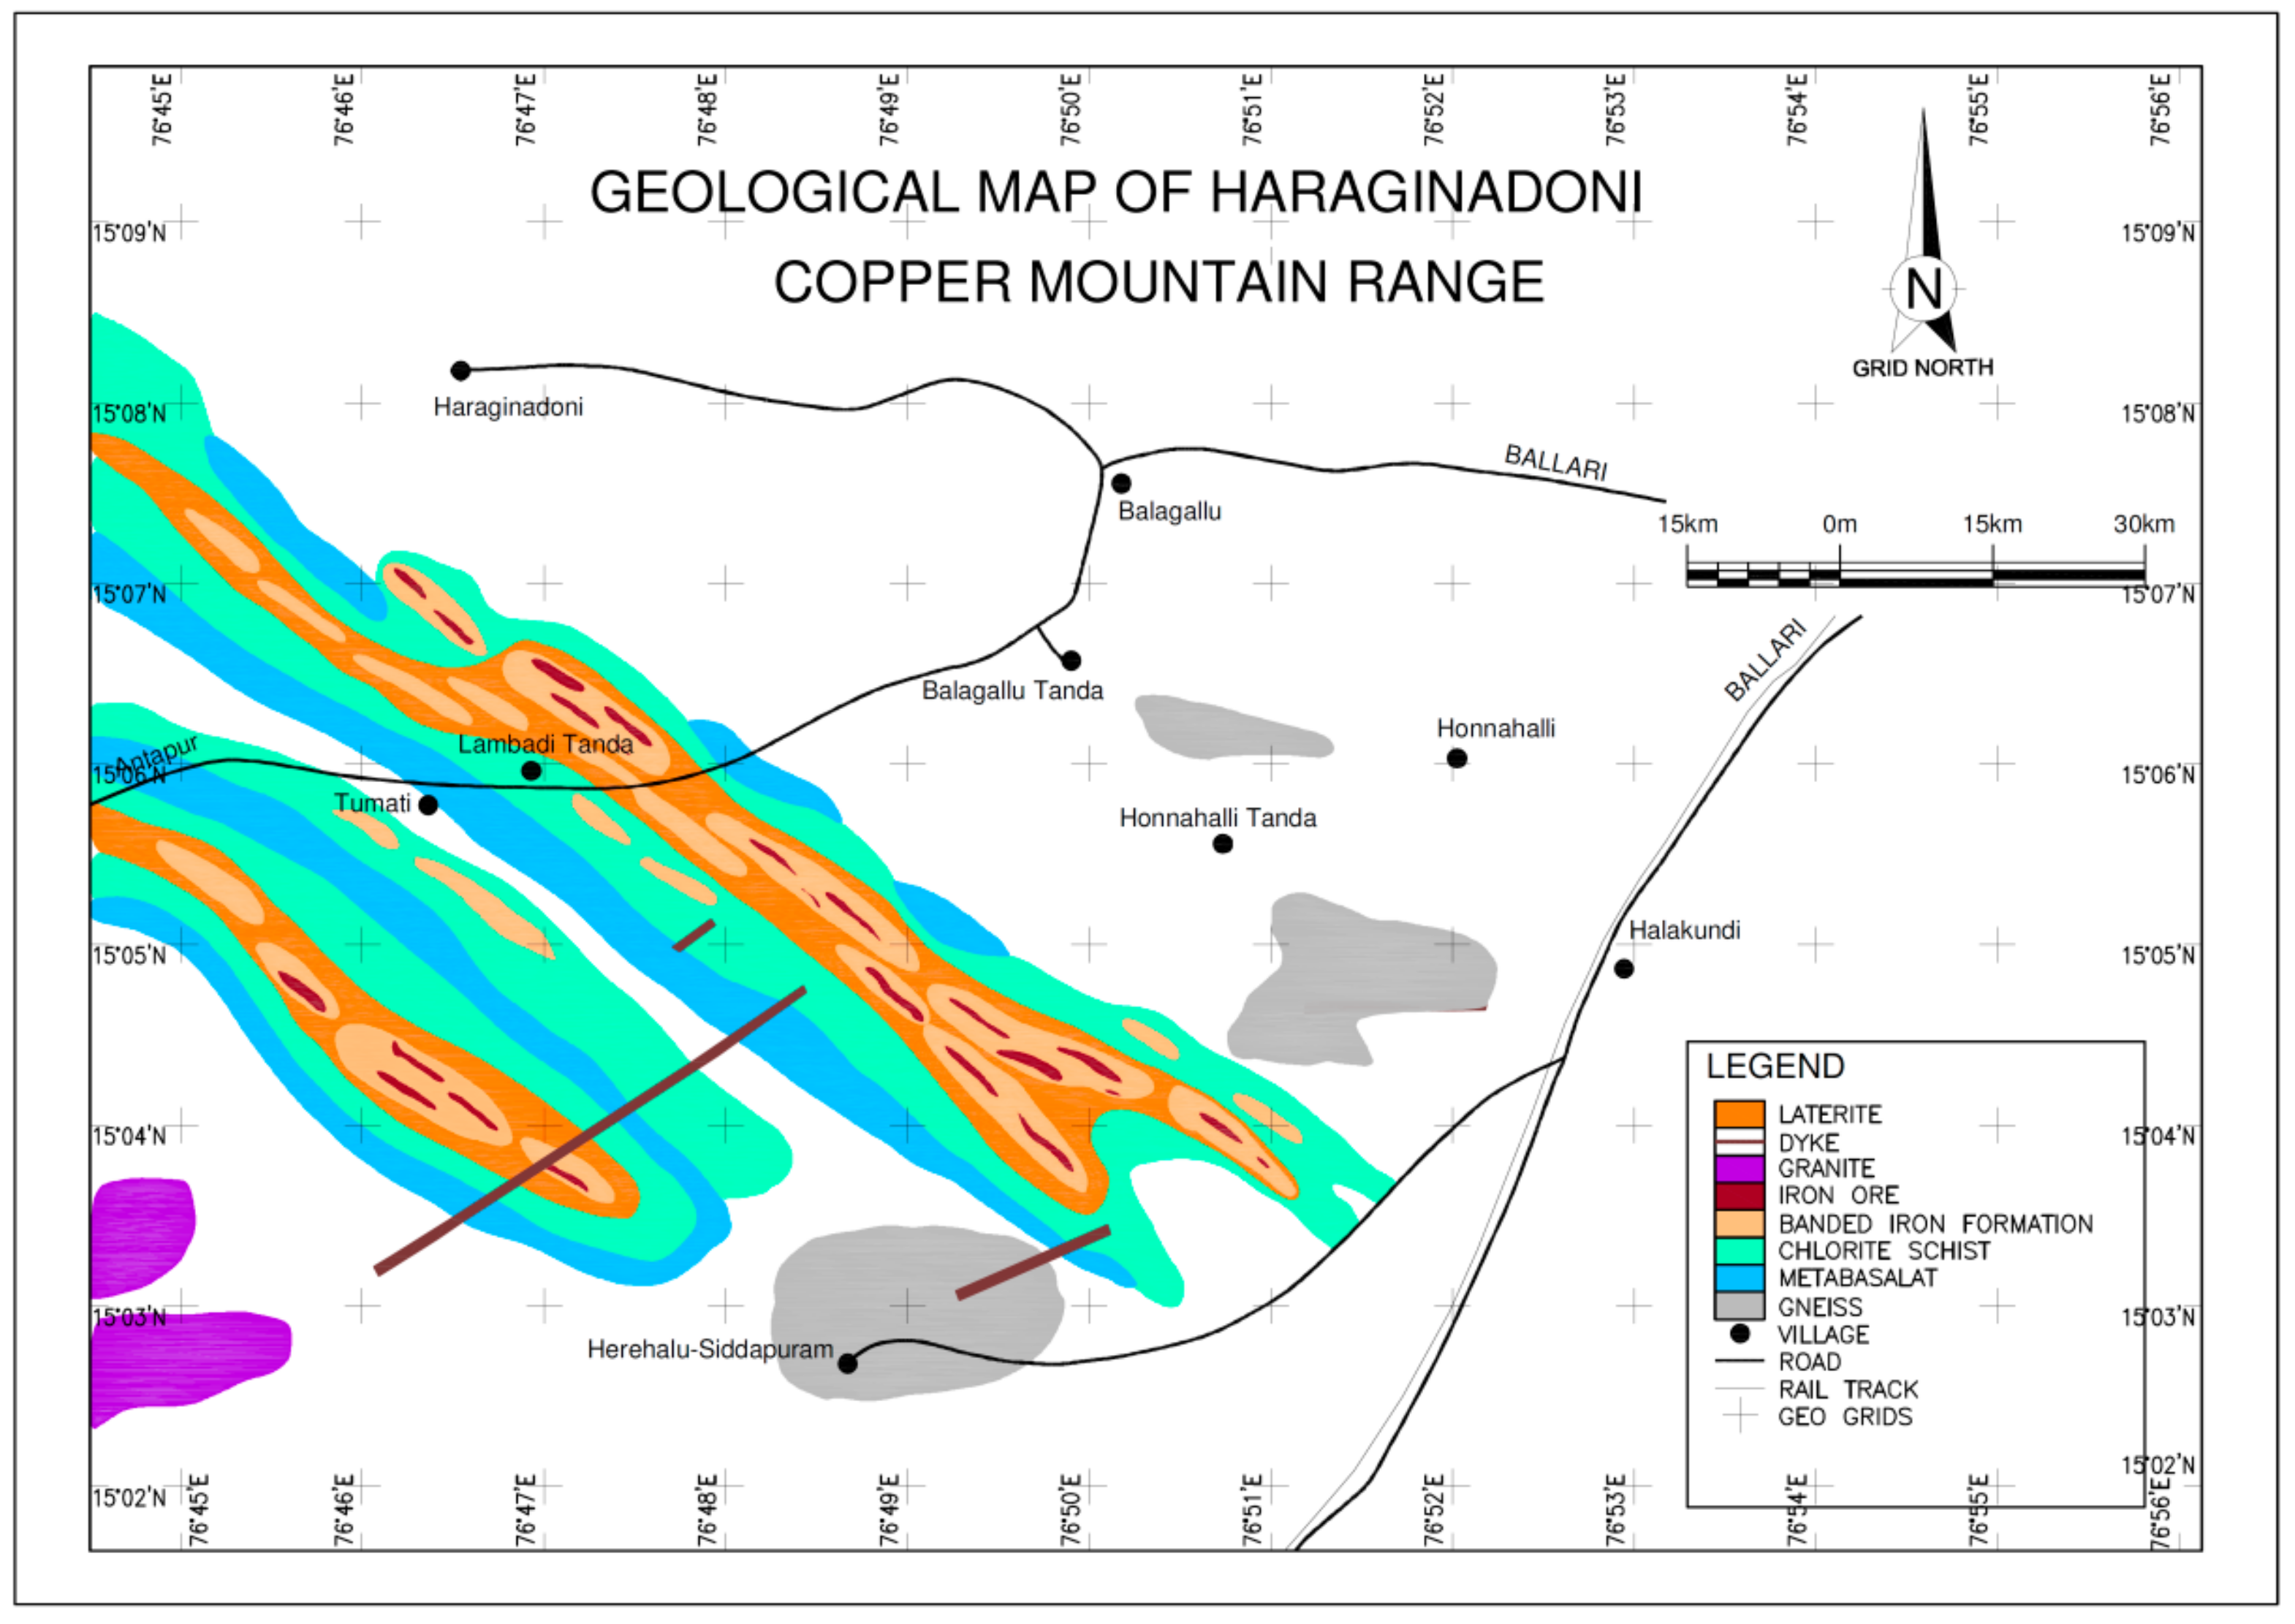
Figure 3.
Dispersions of fine-grained hematite with quartz (×250).
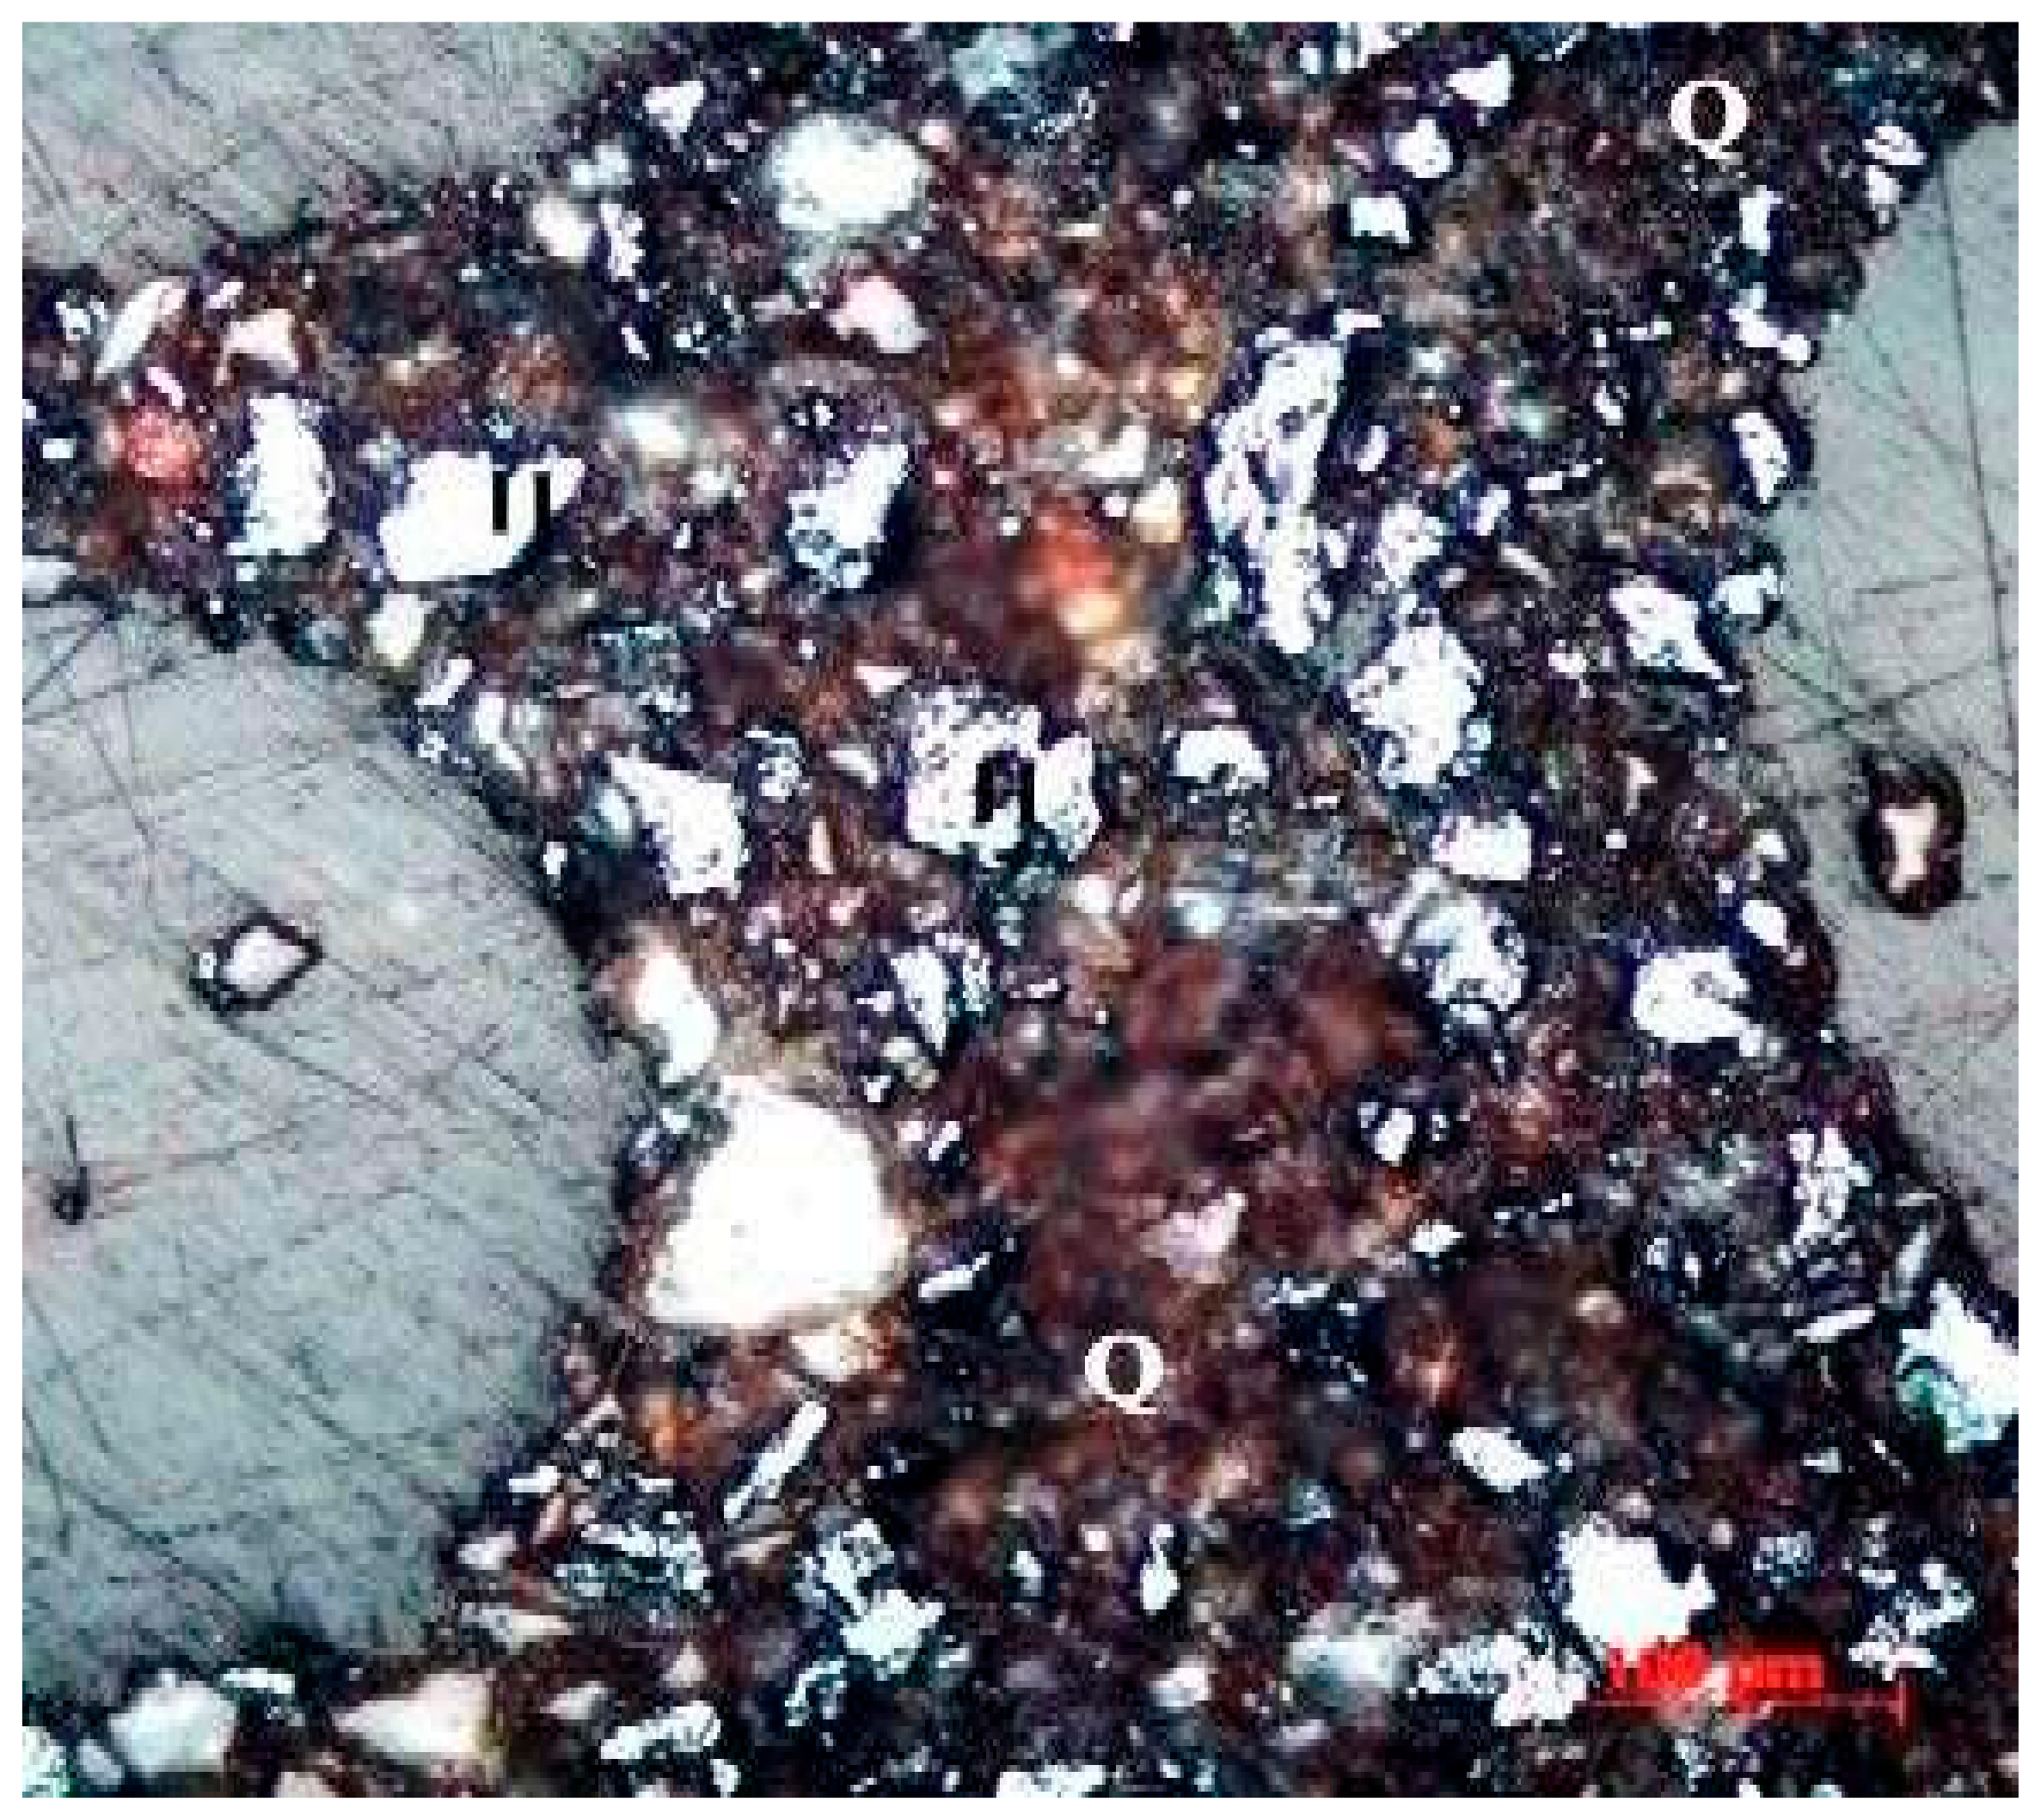
Figure 4.
Association of amphibole with quartz and magnetite (×200).
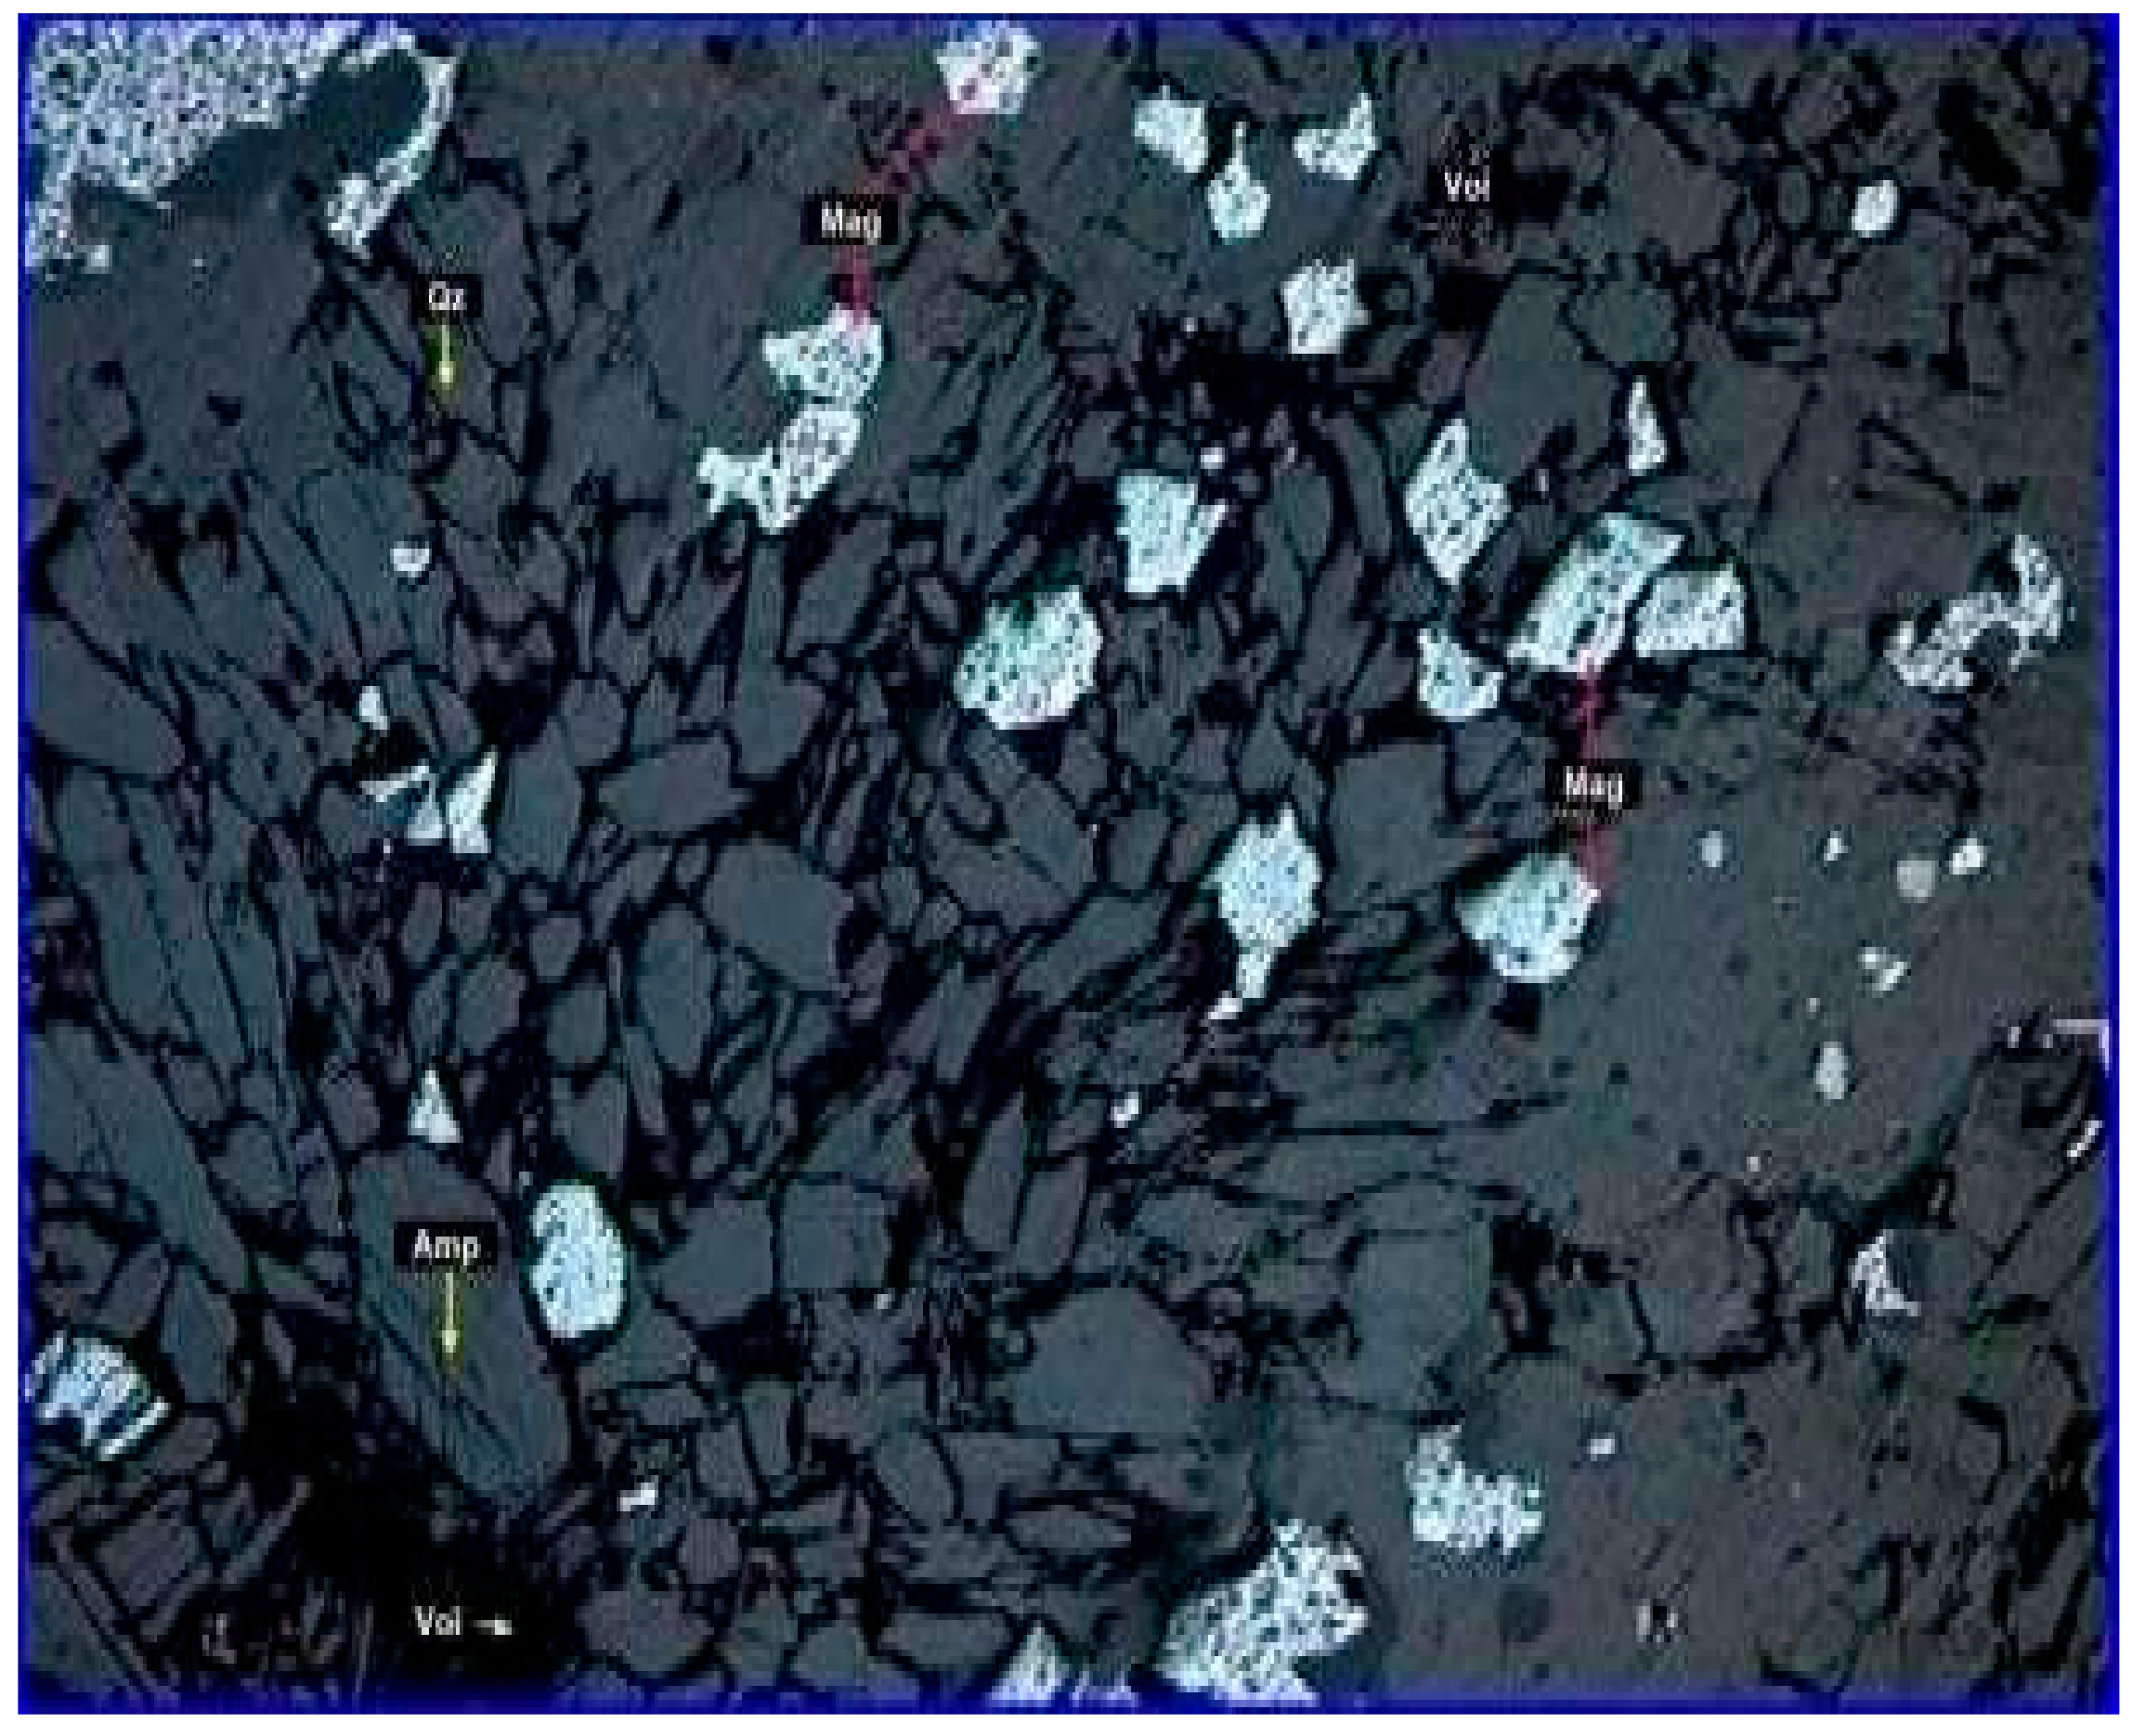
Figure 5.
XRD plot of the BHQ sample.
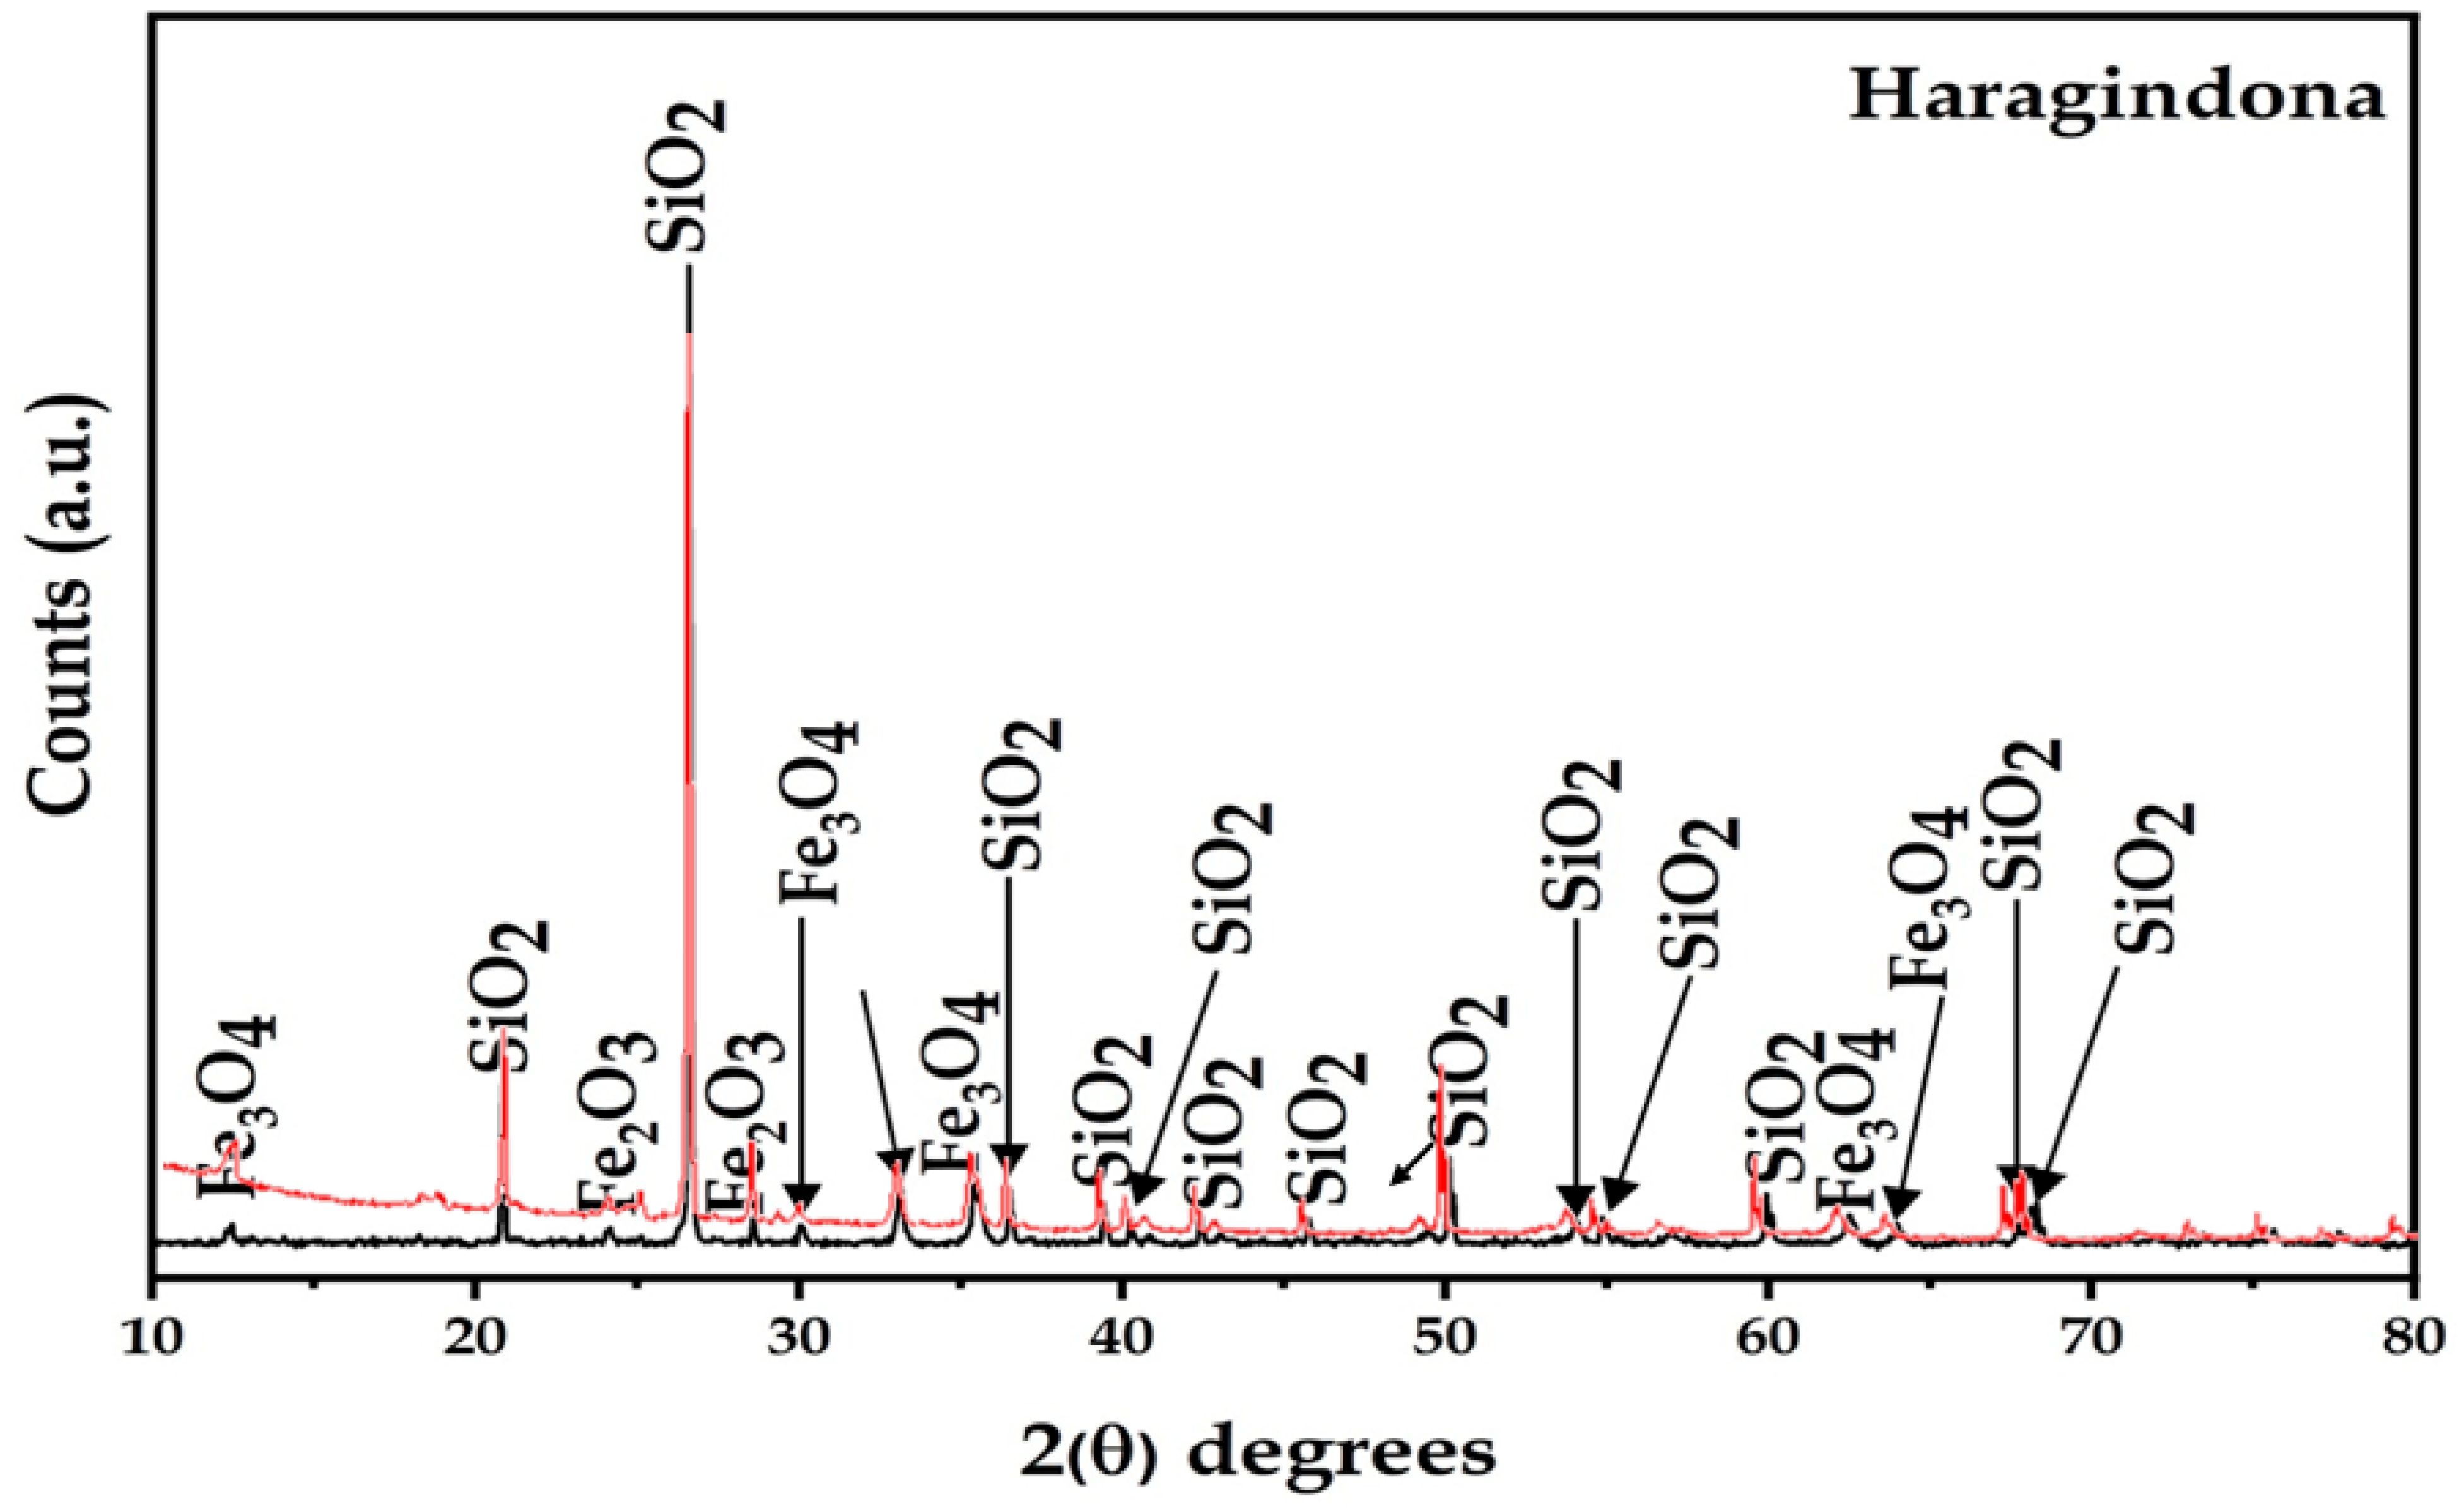
Figure 6.
EPMA analysis of the BHQ sample of study area.
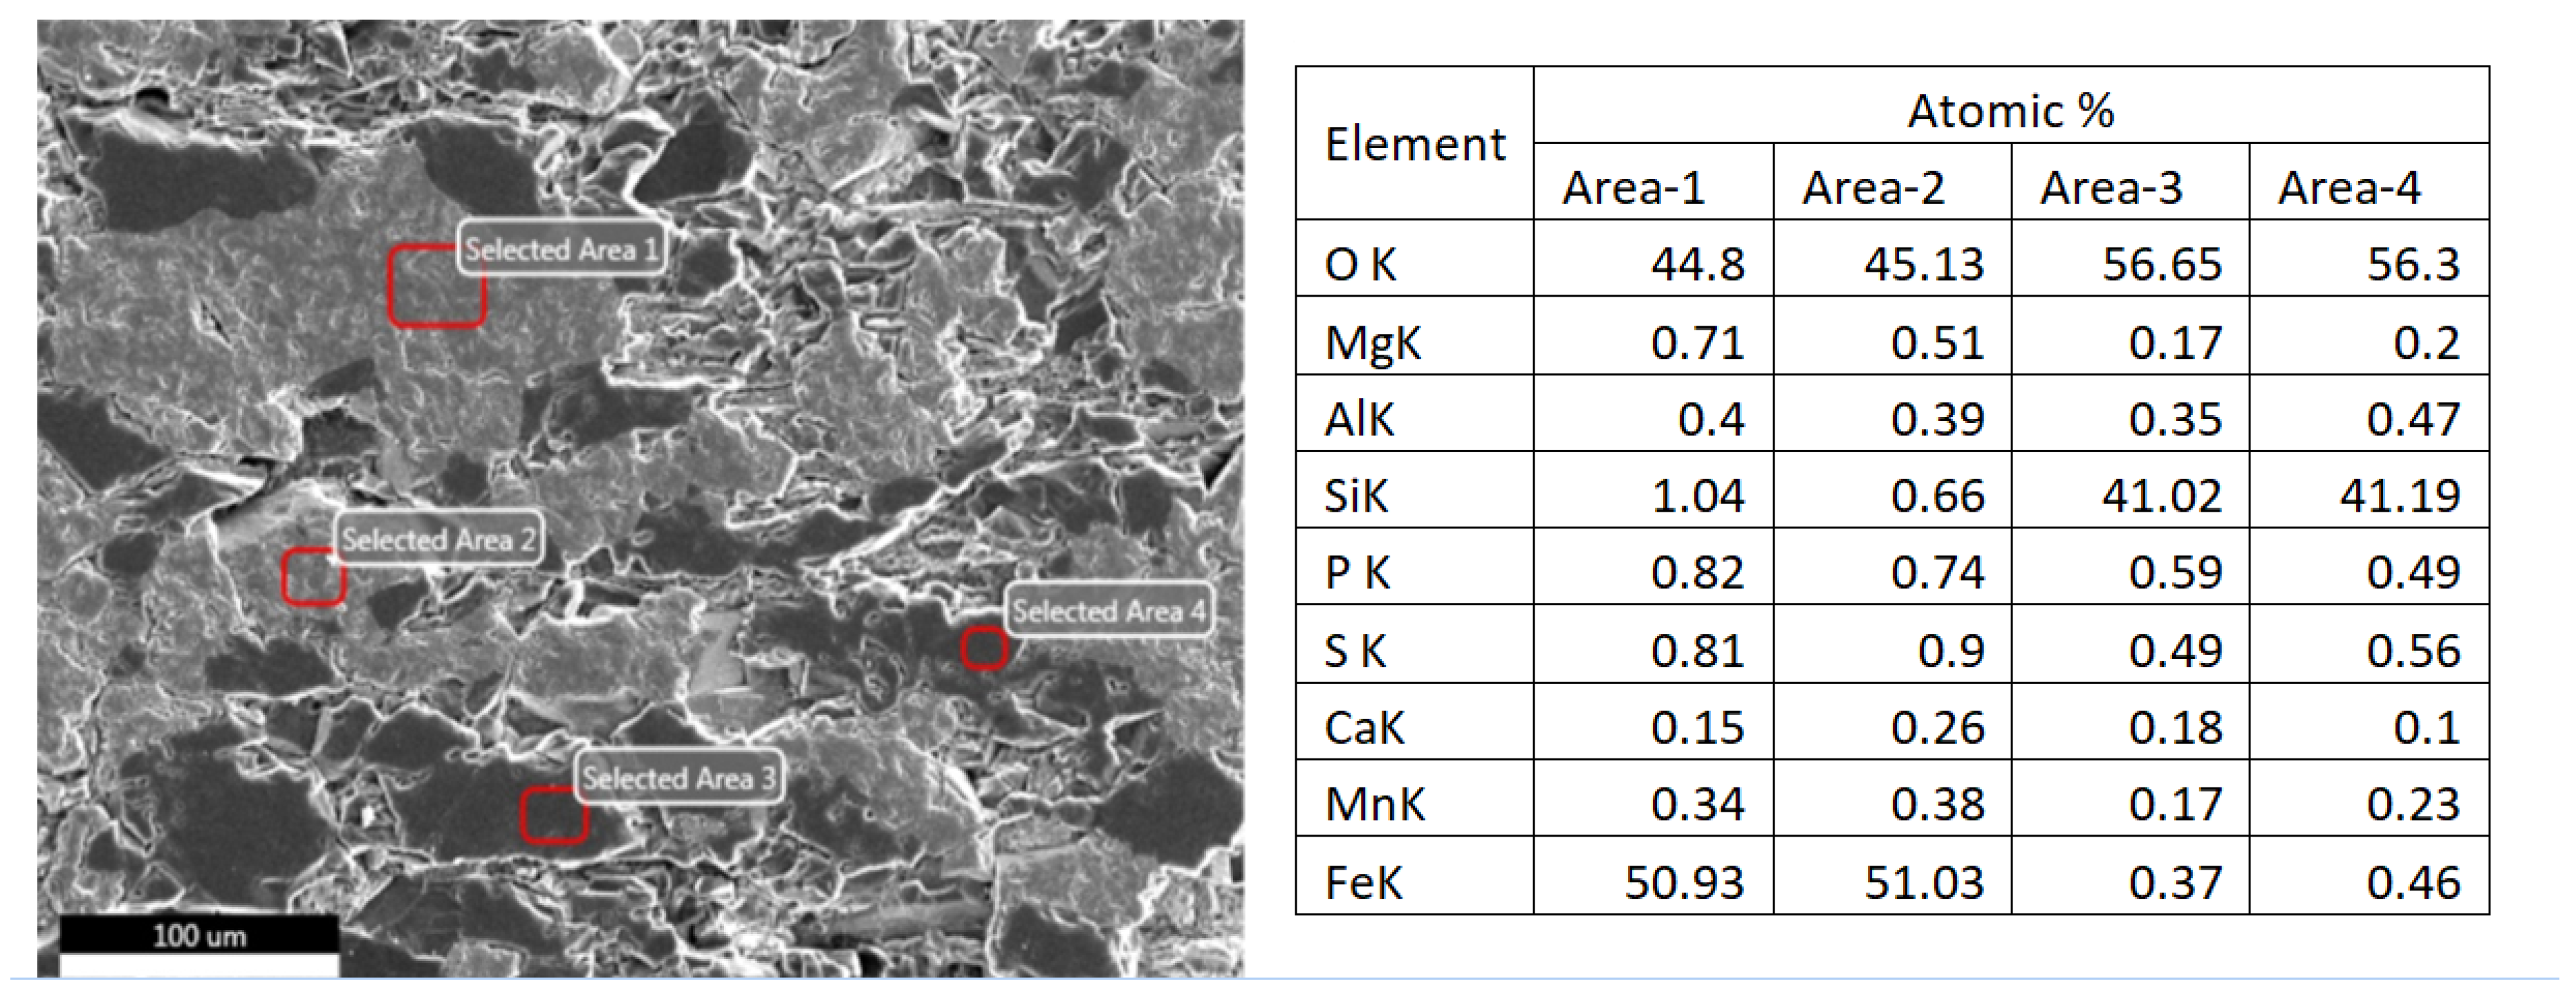
Figure 7.
Final process flowsheet for processing BHQ.

Table 1.
Effect of the mesh of the grind on tabling.
| Feed Particle Size | Product | wt% | %Fe | CE | |
|---|---|---|---|---|---|
| Grade | Recovery | ||||
| <210 µm D80 106 µm | Concentrate | 19.8 | 57.5 | 31.7 | 24.3 |
| Tailings | 80.2 | 30.7 | |||
| Feed | 100.0 | 36.0 | |||
| <106 µm D80 80 µm | Concentrate | 28.2 | 59.2 | 46.4 | 37.4 |
| Tailings | 71.8 | 26.9 | |||
| Feed | 100.0 | 36.0 | |||
| <74 µm D80 54 µm | Concentrate | 25.7 | 63.0 | 45.0 | 39.7 |
| Tailings | 74.3 | 26.7 | |||
| Feed | 100.0 | 36.0 | |||
Table 2.
Amenability to flotation with varying MOGs.
| Feed Particle Size | Product | %Fe | CE | ||
|---|---|---|---|---|---|
| wt% | Grade | Recovery | |||
| <210 µm D80 106 µm | Concentrate | 29.4 | 50.2 | 41.0 | 23.9 |
| Tailings | 70.6 | 30.1 | |||
| Feed | 100.0 | 36.0 | |||
| <−106 µm D80 80 µm | Concentrate | 34.7 | 59.7 | 56.8 | 46.1 |
| Tailings | 65.3 | 24.2 | |||
| Feed | 100.0 | 36.5 | |||
| <−74 µm D80 54 µm | Concentrate | 32.9 | 63.0 | 56.0 | 49.0 |
| Tailings | 67.1 | 24.3 | |||
| Feed | 100.0 | 37.0 | |||
Table 3.
Amenability to WHIMS by varying MOG intensity, 10,000 Gauss, and 6 mm ball matrix.
| Feed Particle Size | Product | %Fe | CE | ||
|---|---|---|---|---|---|
| wt% | Grade | Recovery | |||
| −210 µm D80 106 µm | Concentrate | 69.4 | 46.0 | 90.0 | 41.7 |
| Tailings | 30.6 | 11.6 | |||
| Feed | 100.0 | 35.5 | |||
| −106 µm D80 80 µm | Concentrate | 57.9 | 50.1 | 80.0 | 45.9 |
| Tailings | 22.1 | 22.7 | |||
| Feed | 100.0 | 36.3 | |||
| −74 µm D80 54 µm | Concentrate | 45.6 | 60.0 | 75.0 | 61.3 |
| Tailings | 54.4 | 16.8 | |||
| Feed | 100.0 | 36.5 | |||
Table 4.
Amenability to WHIMS by varying the ball matrix size.
| Ball Size in Matrix | Product | wt% | % Fe | ||
|---|---|---|---|---|---|
| Grade | Recovery | CE | |||
| 9 mm | Concentrate | 35.0 | 63.5 | 60.0 | 53.2 |
| Tailings | 65.0 | 22.8 | |||
| Feed | 100.0 | 37.0 | |||
| 6 mm | Concentrate | 45.6 | 60.0 | 78.0 | 61.3 |
| Tailings | 54.4 | 16.8 | |||
| Feed | 100.0 | 36.5 | |||
| 3 mm | Concentrate | 61.7 | 50.8 | 87.0 | 52.1 |
| Tailings | 38.3 | 12.1 | |||
| Feed | 100.0 | 36.0 | |||
Table 5.
Amenability to WHIMS by varying magnetic intensity and other parameters of ballmatrix 3 mm, −74 µm, D80 54 µm.
Table 5.
Amenability to WHIMS by varying magnetic intensity and other parameters of ballmatrix 3 mm, −74 µm, D80 54 µm.
| Magnetic Intensity (Gauss) | Product | % Fe | |||
|---|---|---|---|---|---|
| wt% | Grade | Recovery | CE | ||
| 4965 | Concentrate | 24.5 | 66.5 | 45.3 | 42.7 |
| Tailings | 75.5 | 26.1 | |||
| Feed | 100.0 | 36.0 | |||
| 8800 | Concentrate | 45.6 | 59.4 | 75.3 | 61.1 |
| Tailings | 73.5 | 16.4 | |||
| Feed | 100.0 | 36.0 | |||
| 10,000 | Concentrate | 61.7 | 50.8 | 87.0 | 52.1 |
| Tailings | 38.3 | 12.1 | |||
| Feed | 100.0 | 36.0 | |||
Table 6.
Effect of MOG on WHIMS followed by flotation of WHIMS concentrate.
| Feed Particle Size | Product | % Fe | CE | ||
|---|---|---|---|---|---|
| wt% | Grade | Recovery | |||
| −210 µm D80 106 µm | Concentrate | 68.4 | 48.7 | 92.5 | 49.6 |
| Flotationtailings | 15.2 | 8.8 | |||
| WHIMS non-mag | 16.4 | 8.3 | |||
| Feed | 100 | 36 | |||
| Flotation feed/WHIMS mag (Cal) | 83.6 | 41.4 | 96.2 | ||
| −106 µm D80 80 µm | Concentrate | 48.7 | 61.5 | 92.2 | 71 |
| Flotationtailings | 11.1 | 36 | |||
| WHIMSnon-mag | 20 | 7.2 | |||
| Feed | 100 | 36 | |||
| Flotation feed/WHIMS mag (Cal) | 80 | 43.2 | 96 | ||
| −74 µm D80 54 µm | Concentrate | 37.7 | 66 | 69.1 | 64.7 |
| Flotation tailings | 24 | 26.9 | |||
| WHIMS non-mag | 38.3 | 12.1 | |||
| Feed | 100 | 36 | |||
| Flotation feed/WHIMS mag (Cal) | 61.7 | 50.8 | 87 | ||
Test conditions: ball matrix 3 mm;10,000 Gauss intensity; depressant caustic starch, 1.5 kg/t of WHIMS mag; collector dodecylamine, 0.15 kg/t.
Table 7.
Effects of depressant dosage on reverse flotation of WHIMS concentrate.
| Depressant Caustic Starch Dosage kg/t | Product | %Fe | CE | ||
|---|---|---|---|---|---|
| wt% | Grade | Recovery | |||
| 0.5 | Concentrate | 34.1 | 59.3 | 56.1 | 45.4 |
| Flotation tailings | 27.6 | 40.3 | |||
| WHIMS non-mag | 38.3 | 12.1 | |||
| Feed | 100.0 | 36.0 | |||
| Flotation feed/WHIMS mag (Cal) | 61.7 | 50.8 | 87.0 | ||
| 1 | Concentrate | 44.1 | 63.5 | 77.78 | 69.4 |
| Flotation tailings | 18.5 | 26.6 | |||
| WHIMS non-mag | 38.3 | 12.1 | |||
| Feed | 100.0 | 36.0 | |||
| Flotation feed/WHIMS mag (Cal) | 61.7 | 50.8 | 87.0 | ||
| 1.5 | Concentrate | 37.7 | 66.0 | 69.1 | 64.7 |
| Flotation tailings | 24.0 | 26.9 | |||
| WHIMS non-mag | 38.3 | 12.1 | |||
| Feed | 100.0 | 36.0 | |||
| Flotation feed/WHIMS mag (Cal) | 61.7 | 50.8 | 87.0 | ||
Test Conditions: MOG of −74 µm, D80 54 µm; ball matrix 3 mm; 10,000 Gauss intensity; depressant caustic starch 0.5/1/1.5 kg/t of WHIMS concentrate; collector dodecylamine 0.15 kg/t of WHIMS concentrate.
Table 8.
Effects of collector dosage on reverse flotation of WHIMS concentrate.
| Collector Dosage (kg/t) | Product | % Fe | CE | ||
|---|---|---|---|---|---|
| wt% | Grade | Recovery | |||
| 0.05 | Concentrate | 44.0 | 63.3 | 77.4 | 68.8 |
| Flotation tailings | 17.7 | 17.5 | |||
| WHIMS non-mag | 38.3 | 12.1 | |||
| Feed | 100.0 | 36.0 | |||
| Flotation feed/WHIMS mag (Cal) | 61.7 | 50.8 | 87.0 | ||
| 0.15 | Concentrate | 37.7 | 66.0 | 69.1 | 64.7 |
| Flotation tailings | 24.0 | 26.9 | |||
| WHIMS non-mag | 38.3 | 12.1 | |||
| Feed | 100.0 | 36.0 | |||
| Flotation feed/WHIMS mag (Cal) | 61.7 | 50.8 | 87.0 | ||
| 0.25 | Concentrate | 36.0 | 67.0 | 67.0 | 63.9 |
| Flotation tailings | 25.7 | 28.0 | |||
| WHIMS non-mag | 38.3 | 12.1 | |||
| Feed | 100.0 | 36.0 | |||
| Flotation feed/WHIMS mag (Cal) | 61.7 | 50.8 | 87.0 | ||
Test conditions: MOG of −74 µm, D80 54 µm; ball matrix 3 mm; 10,000 Gauss intensity; depressant caustic starch 1.5 kg/t of WHIMS concentrate; collector dodecylamine 0.05/0.15/0.25 kg/t of WHIMS concentrate.
Table 9.
Final conventional process flowsheet results.
| Product | wt% | % FeGrade | % FeDist. |
|---|---|---|---|
| Table concentrate | 25.70 | 63.03 | 45.00 |
| Flotation concentrate | 13.90 | 65.00 | 25.10 |
| WHIMS tails | 38.30 | 12.12 | |
| Flotation floattailings | 24.00 | 26.85 | |
| HeadCal | 100.00 | 36.00 | |
| Final concentrate | 39.60 | 63.73 | 70.10 |
| Finaltails (WHIMS-non-mag + flotation tailings) | 60.40 | 17.82 | |
| Table tailings (WHIMS feed) | 74.30 | 26.05 | |
| Flotation feed/WHIMS conc | 26.80 | 48.40 |
Test conditions: tabling at −74 µm, D80 54 µm; WHIMS of thickened table tailings at 10,000 Gauss;25% S; 3 mm ball matrix; flotation of WHIMS magnetic with 1.5 kg/t of caustic starch depressant, 0.15 kg/t of dodecyl amine.
Table 10.
Final test with WHIMS followed by flotation of WHIMS concentrate.
| Product | wt% | Grade (% Fe) | Recovery (% Fe) |
|---|---|---|---|
| Reverse flotation concentrate (final) | 44.00 | 63.34 | 77.40 |
| Reverse flotation tails | 17.70 | 17.49 | |
| WHIMS non-mag (tails) | 38.30 | 12.12 | |
| Head Cal | 100.00 | 36.00 | |
| WHIMS mag conc (flotation feed) | 61.70 | 50.76 | |
| Final tails (flotation tailings + WHIMS non-mag) | 56.00 | 14.53 |
Table 11.
The characteristics of concentrate of the final process.
| Product | Physico-Chemical | Mineralogy | Photo |
|---|---|---|---|
| Final Concentrate | Black fine powder,4.5 SG, 2.9 t/m3 BD, −0.074 mm, D80 0.045 mm, 63.34% Fe, 6.30% SiO2, 0.20% Al2O3, 0.02% P, 0.02% S (0.03 Al2O3/SiO2), and 0.20% LOI with 77.4% Fe recovery, 68.8% concentration efficiency at 44.0 wt% yield. | It contained fine-grained (<100 µm) martitized magnetite (30–35%), fine-grained (<74 µm) hematite (60–65%), and extremely fine-grained (<40 µm) cherty quartz (5–10%). Most of the grains are free. | 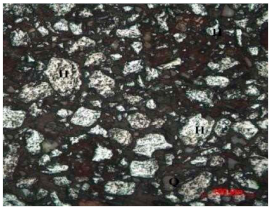 |
Test conditions: MOG D80 54 µm; intensity 10,000 Gauss; 3 mm ball matrix; 1.5 kg/t caustic starch depressant; 0.05 kg/t dodecylamine.
Table 12.
The characteristics of tails of the final process.
| Product | Physico-Chemical | Mineralogy | Photo |
|---|---|---|---|
| Final tails | Gray fine powder, 3 S.G., 1.9 t/m3 BD0.074 mm, D80 0.06 mm, 14.53% Fe, 79.75% SiO2, 1.18% Al2O3, and LOI 1.33% with 23.6% Fe recovery at a wt% of 56.0. | It contained fine-grained (<74 µm) hematite (20–25%) and extremely fine-grained (<40 µm) cherty quartz (75–80%). Most of the grains are free. Some hematite grains are seen as inclusions in quartz. | 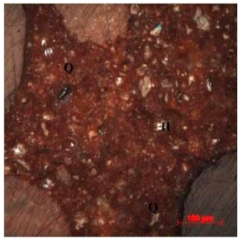 |
Publisher’s Note: MDPI stays neutral with regard to jurisdictional claims in published maps and institutional affiliations. |
© 2022 by the authors. Licensee MDPI, Basel, Switzerland. This article is an open access article distributed under the terms and conditions of the Creative Commons Attribution (CC BY) license (https://creativecommons.org/licenses/by/4.0/).
Share and Cite
MDPI and ACS Style
Swamy, A.K.; Nikkam, S.; Kumar, P.S. Processing Studies on Banded Hematite Quartzite’s of Sandur Sciht, Karnataka, India. Energies 2022, 15, 2542. https://doi.org/10.3390/en15072542
AMA Style
Swamy AK, Nikkam S, Kumar PS. Processing Studies on Banded Hematite Quartzite’s of Sandur Sciht, Karnataka, India. Energies. 2022; 15(7):2542. https://doi.org/10.3390/en15072542
Chicago/Turabian StyleSwamy, Aspari Kumara, Suresh Nikkam, and Palthur Sharath Kumar. 2022. "Processing Studies on Banded Hematite Quartzite’s of Sandur Sciht, Karnataka, India" Energies 15, no. 7: 2542. https://doi.org/10.3390/en15072542
Note that from the first issue of 2016, this journal uses article numbers instead of page numbers. See further details here.