
Comparison of Ground-Based Global Horizontal Irradiance and Direct Normal Irradiance with Satellite-Based SUNY Model


 , , , and
Abstract
:1. Introduction
2. Materials and Methods
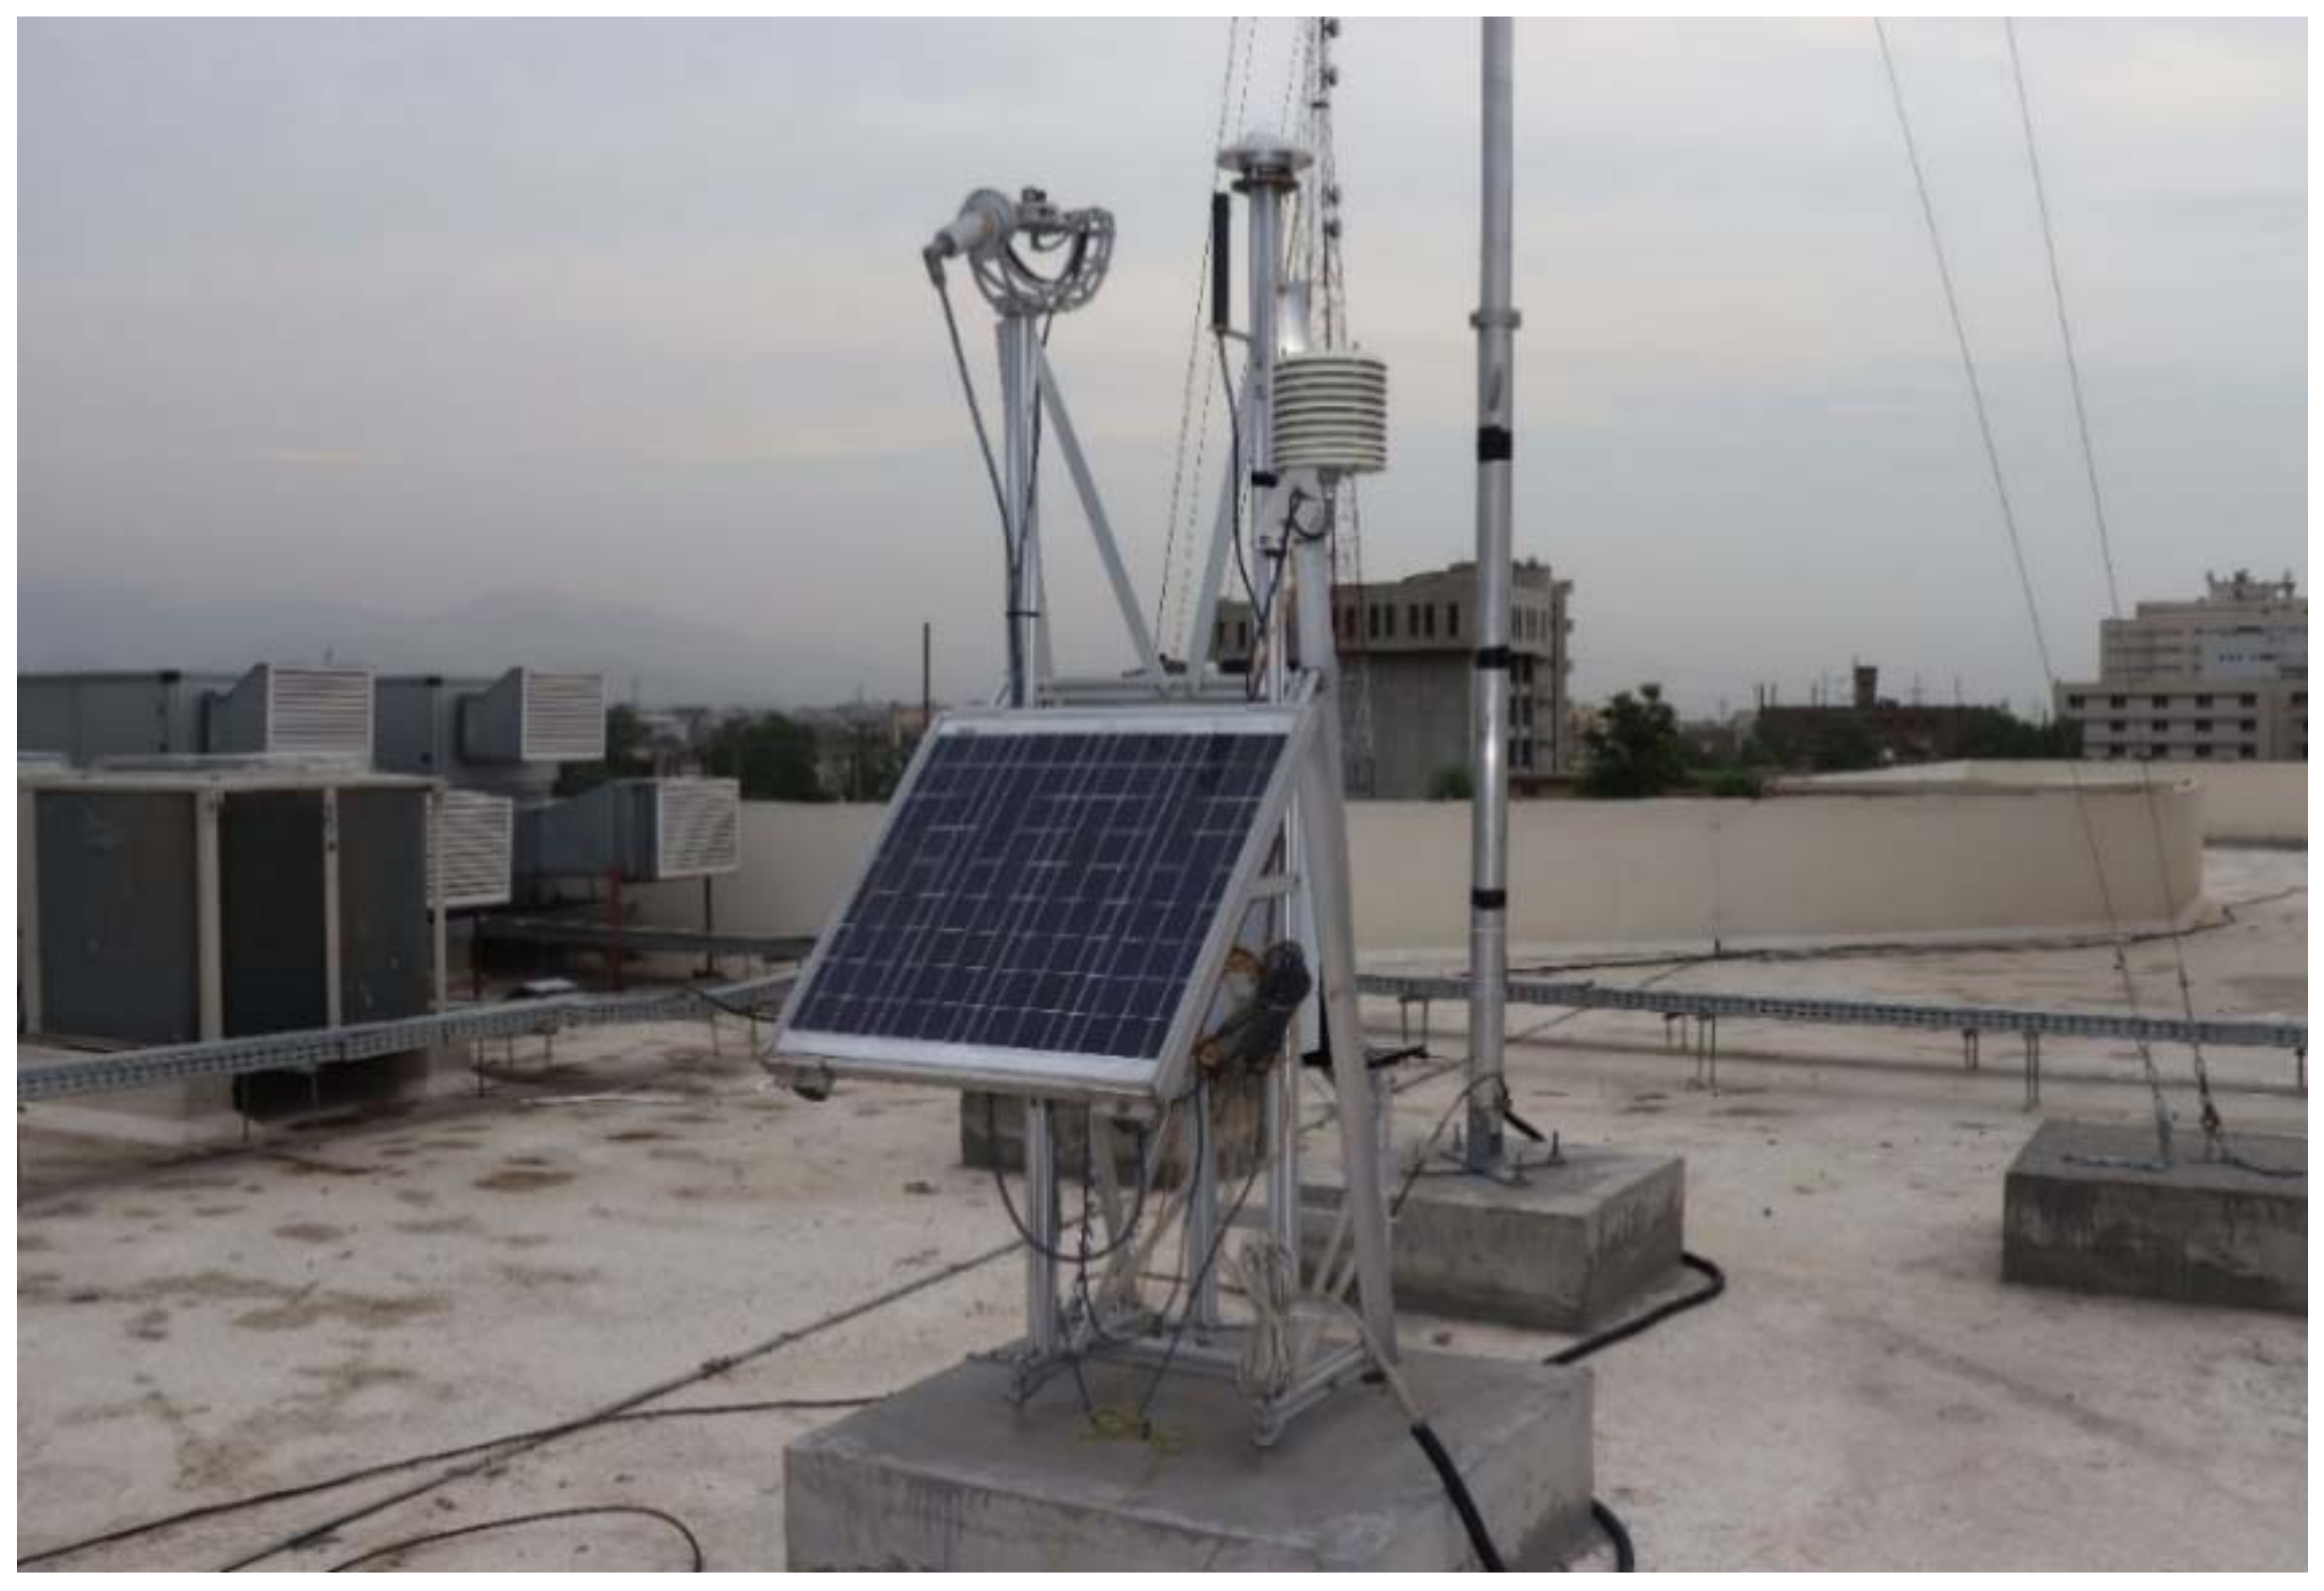
2.1. Equipment
2.1.1. Pyranometer
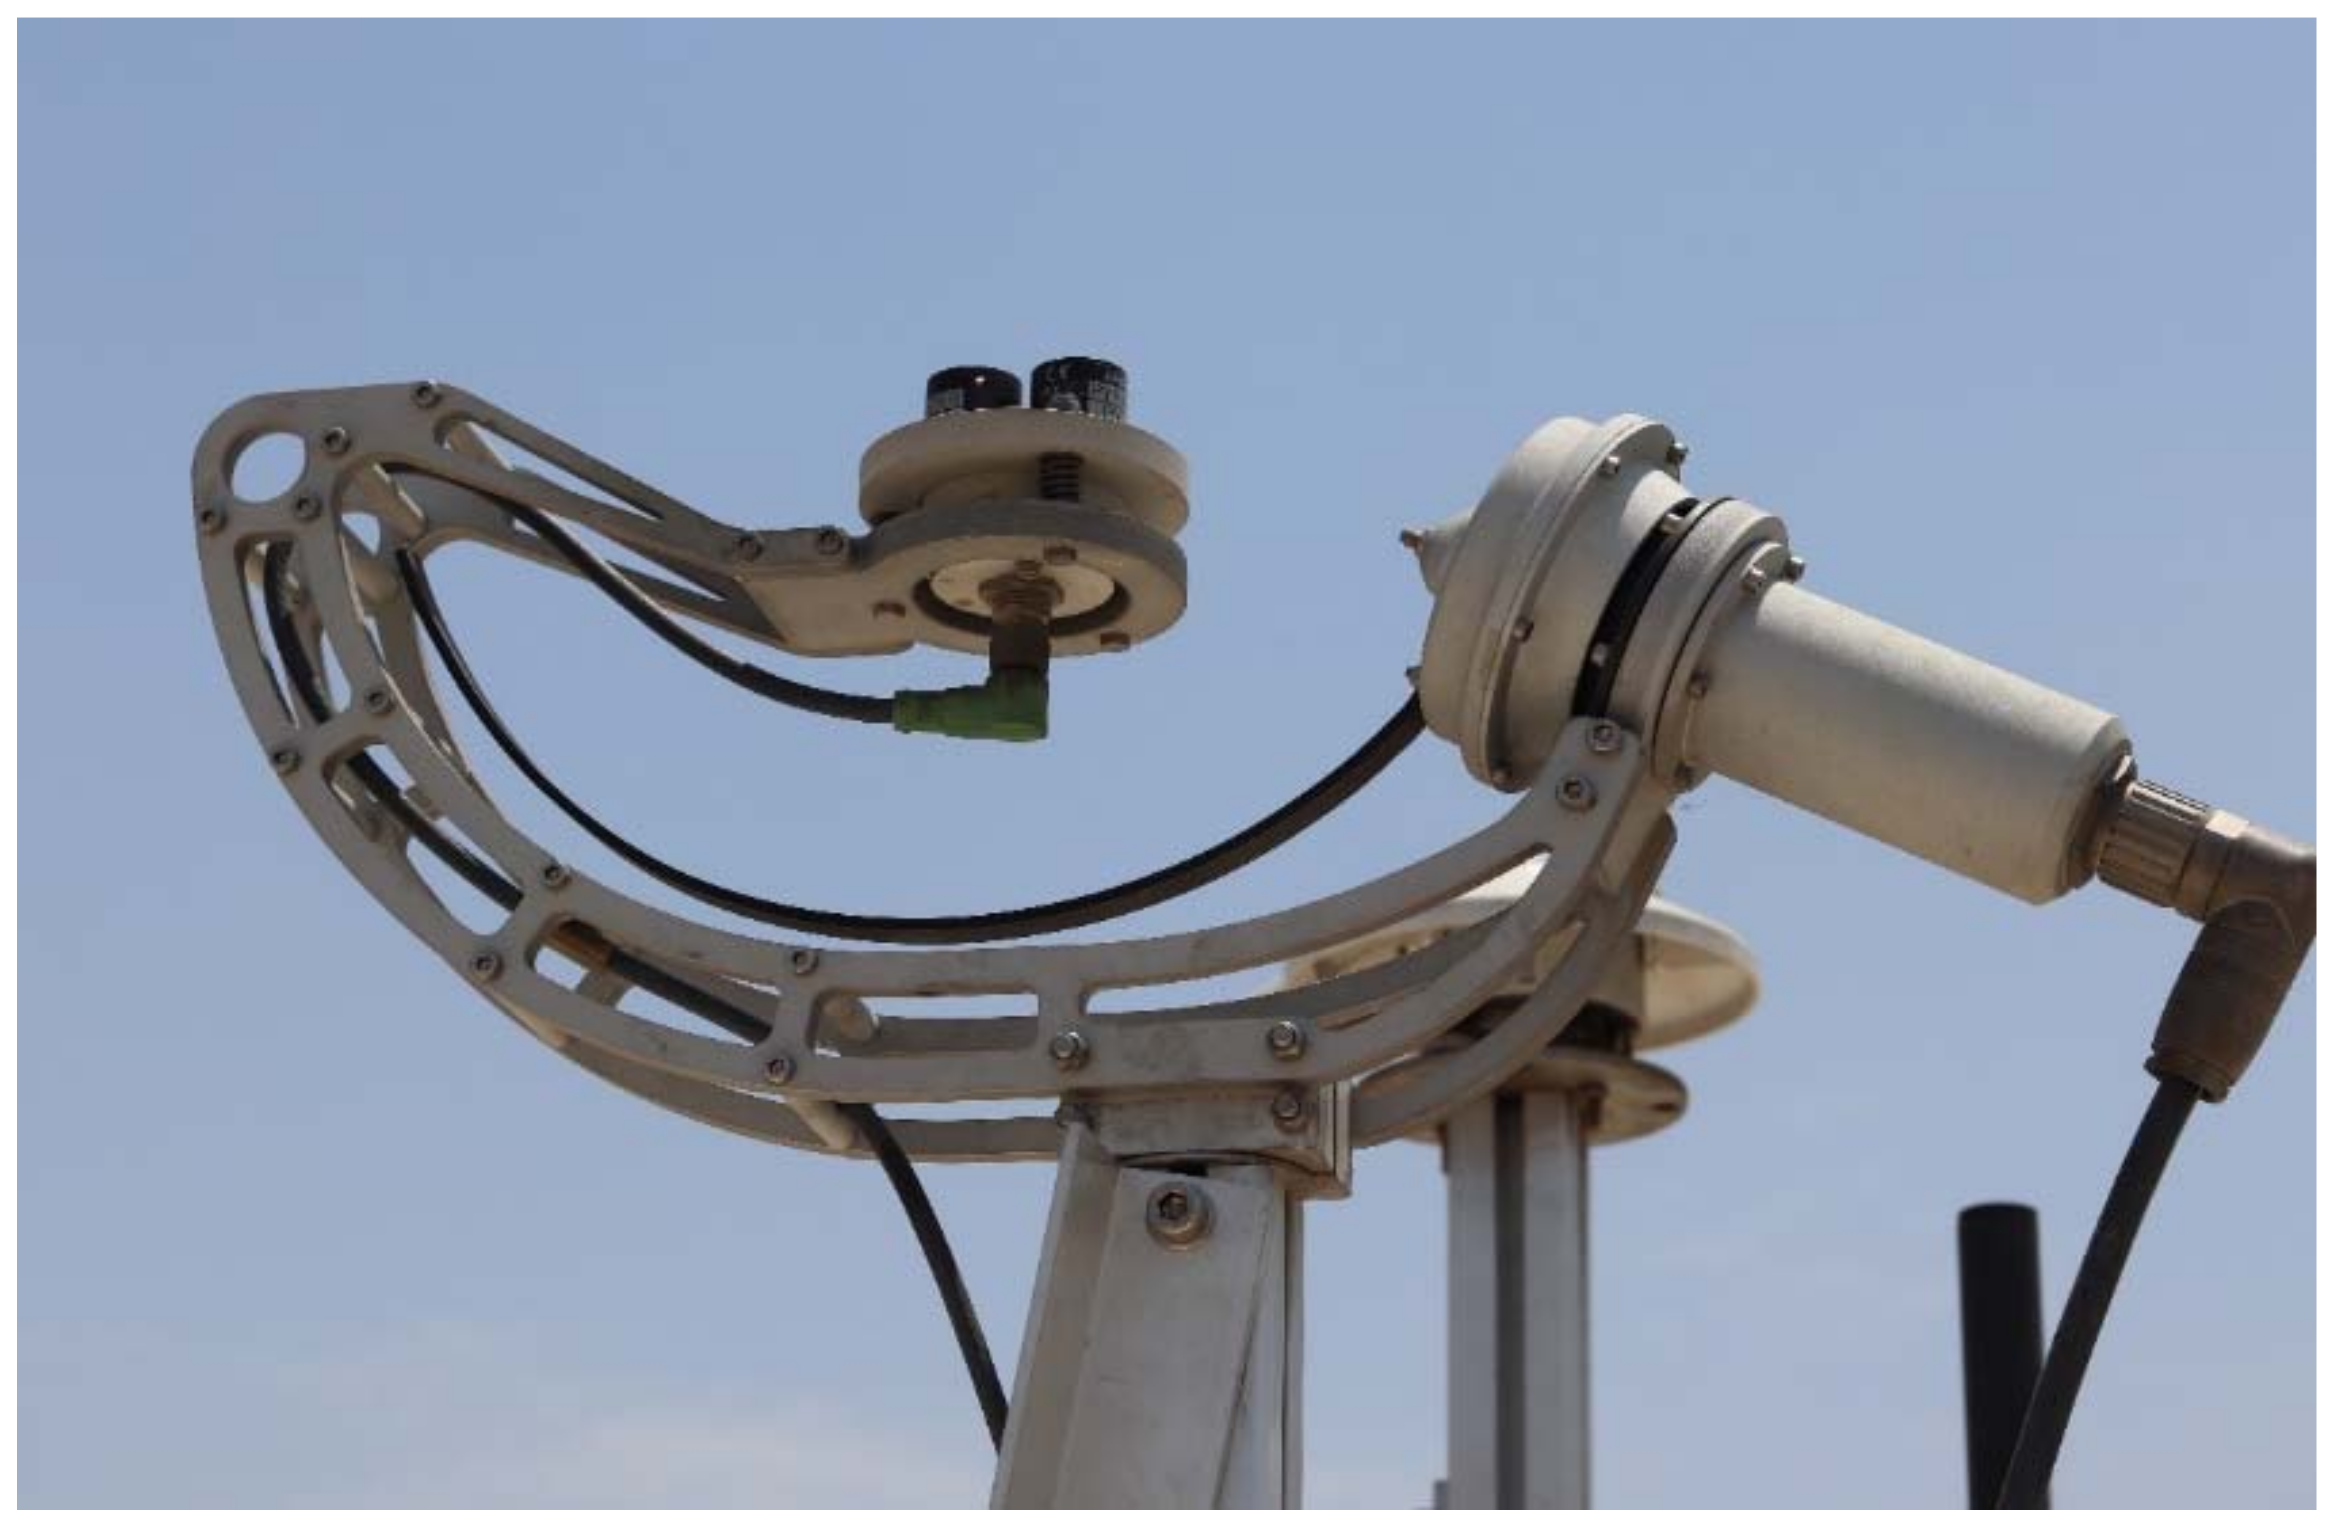
2.1.2. Rotating Shadowband Irradiometer (RSI)
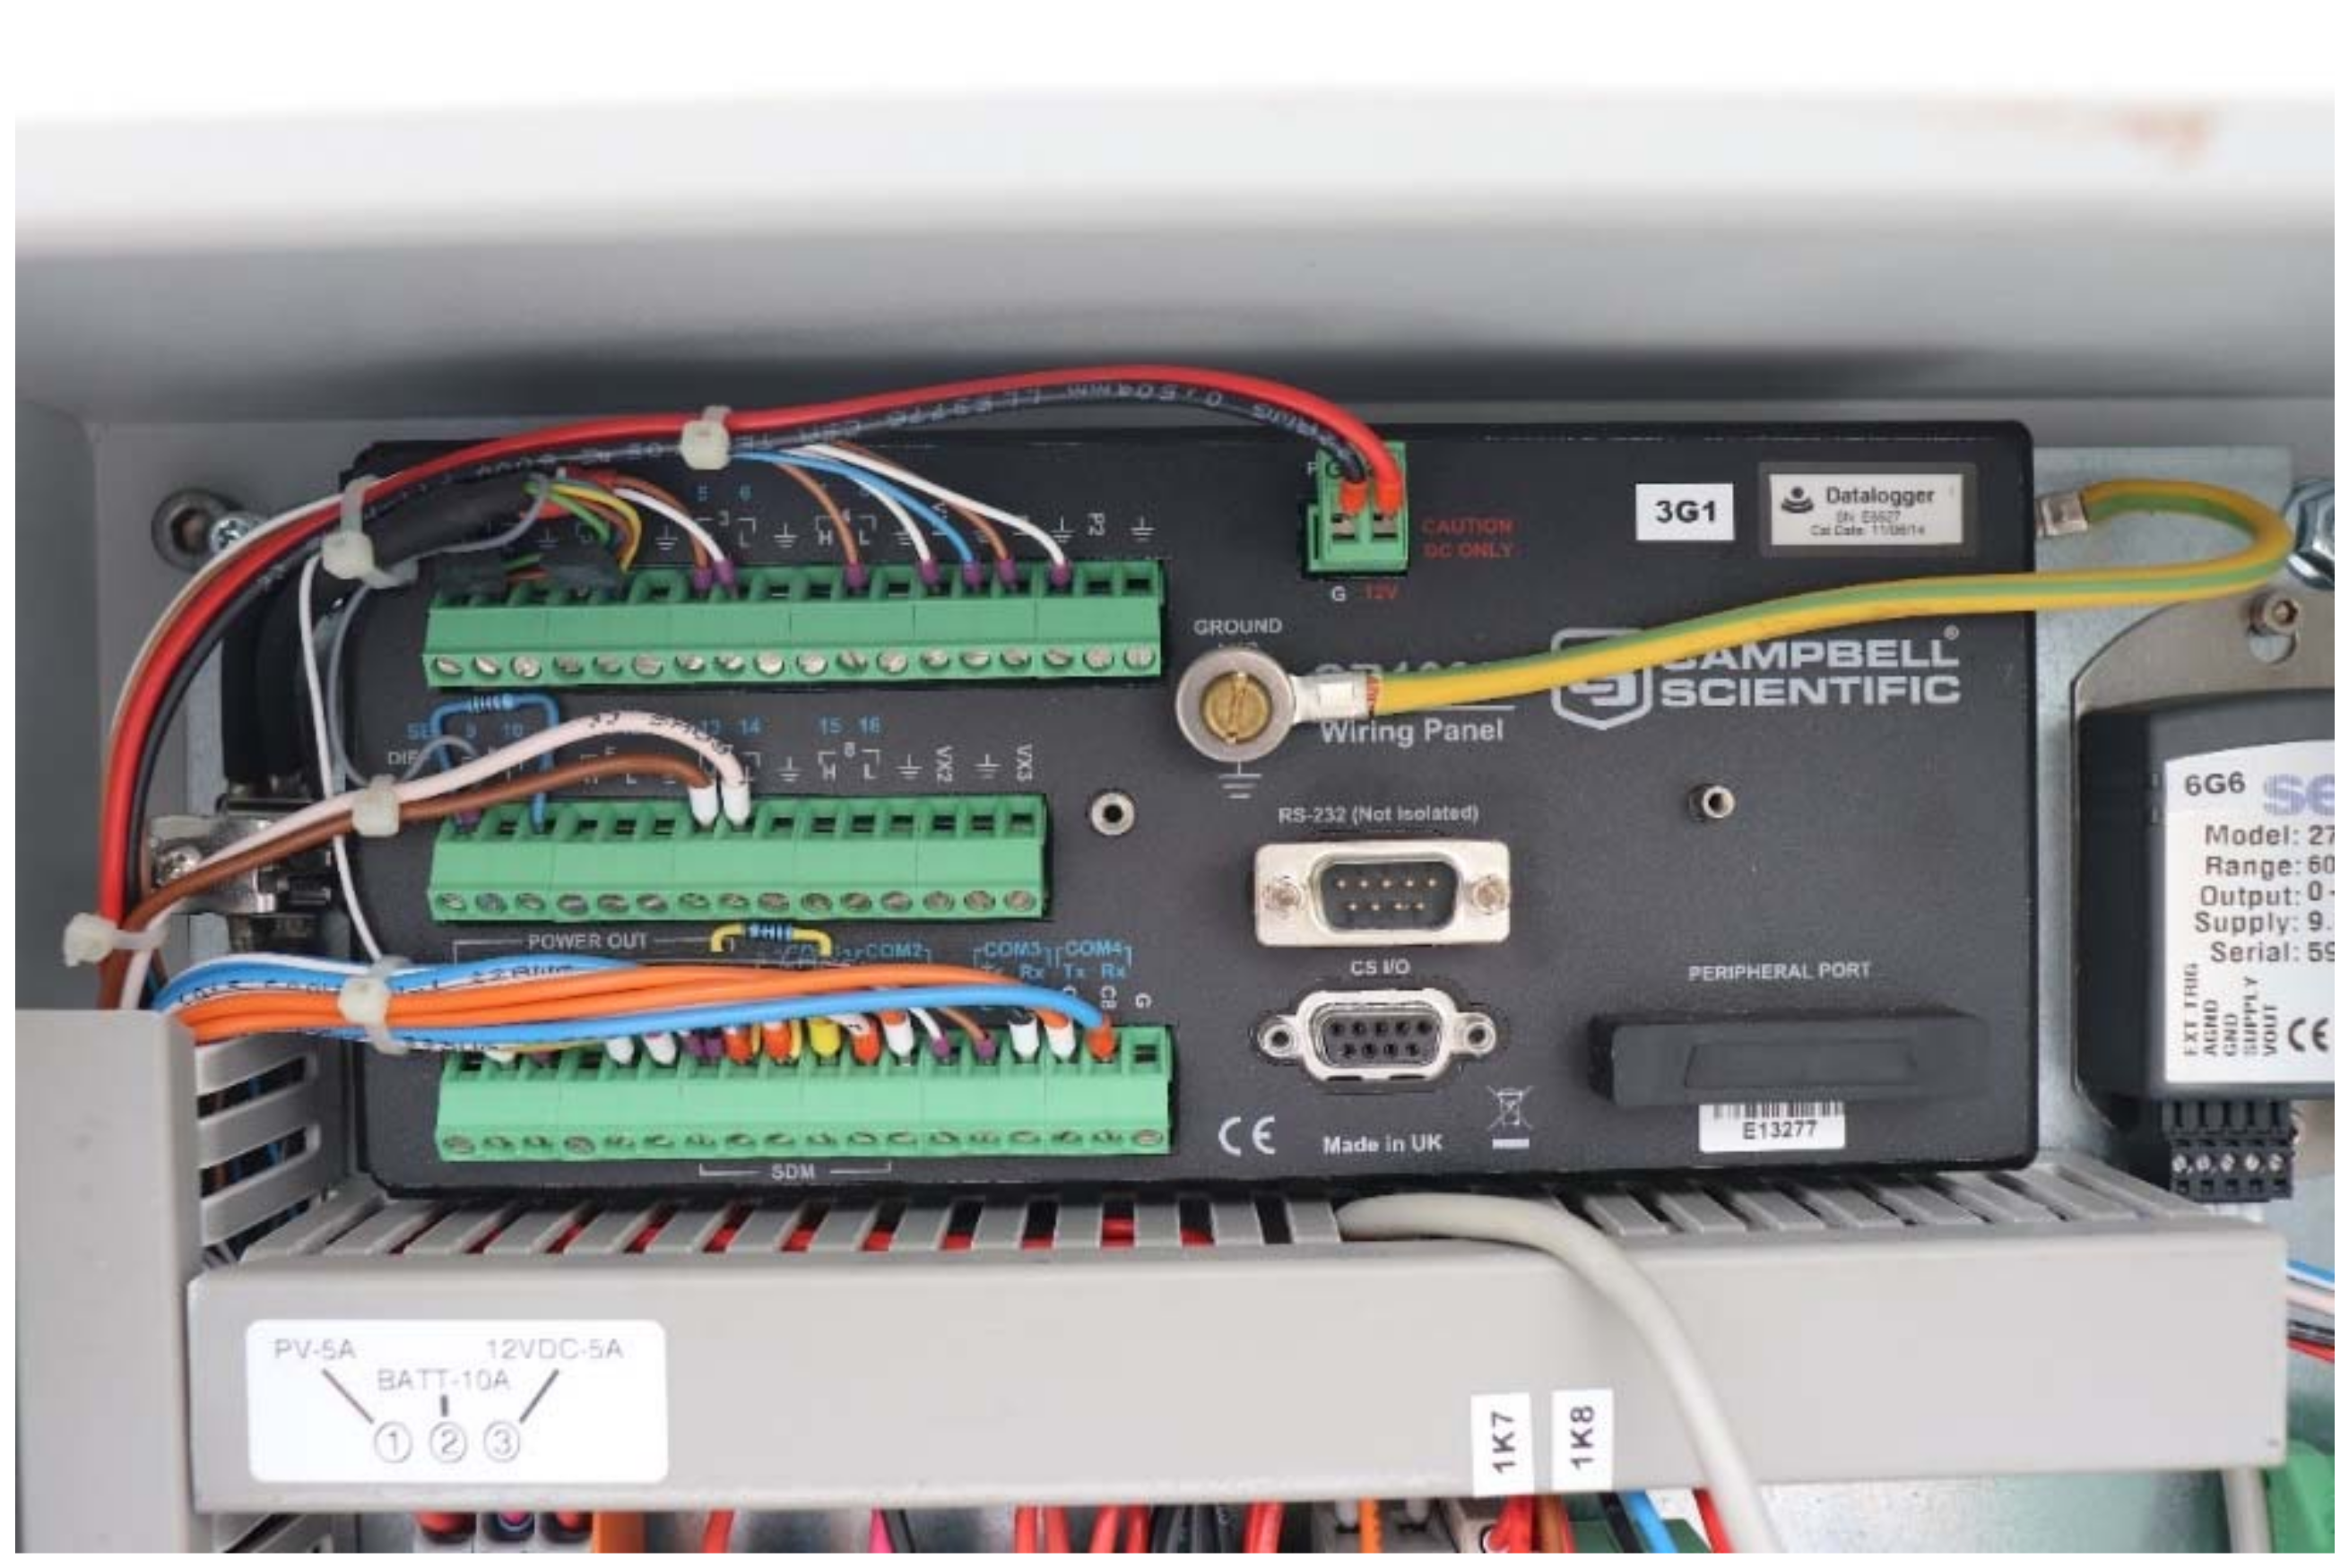
2.1.3. Data Logger
2.2. Location of UET Peshawar
2.3. Methodology Adopted
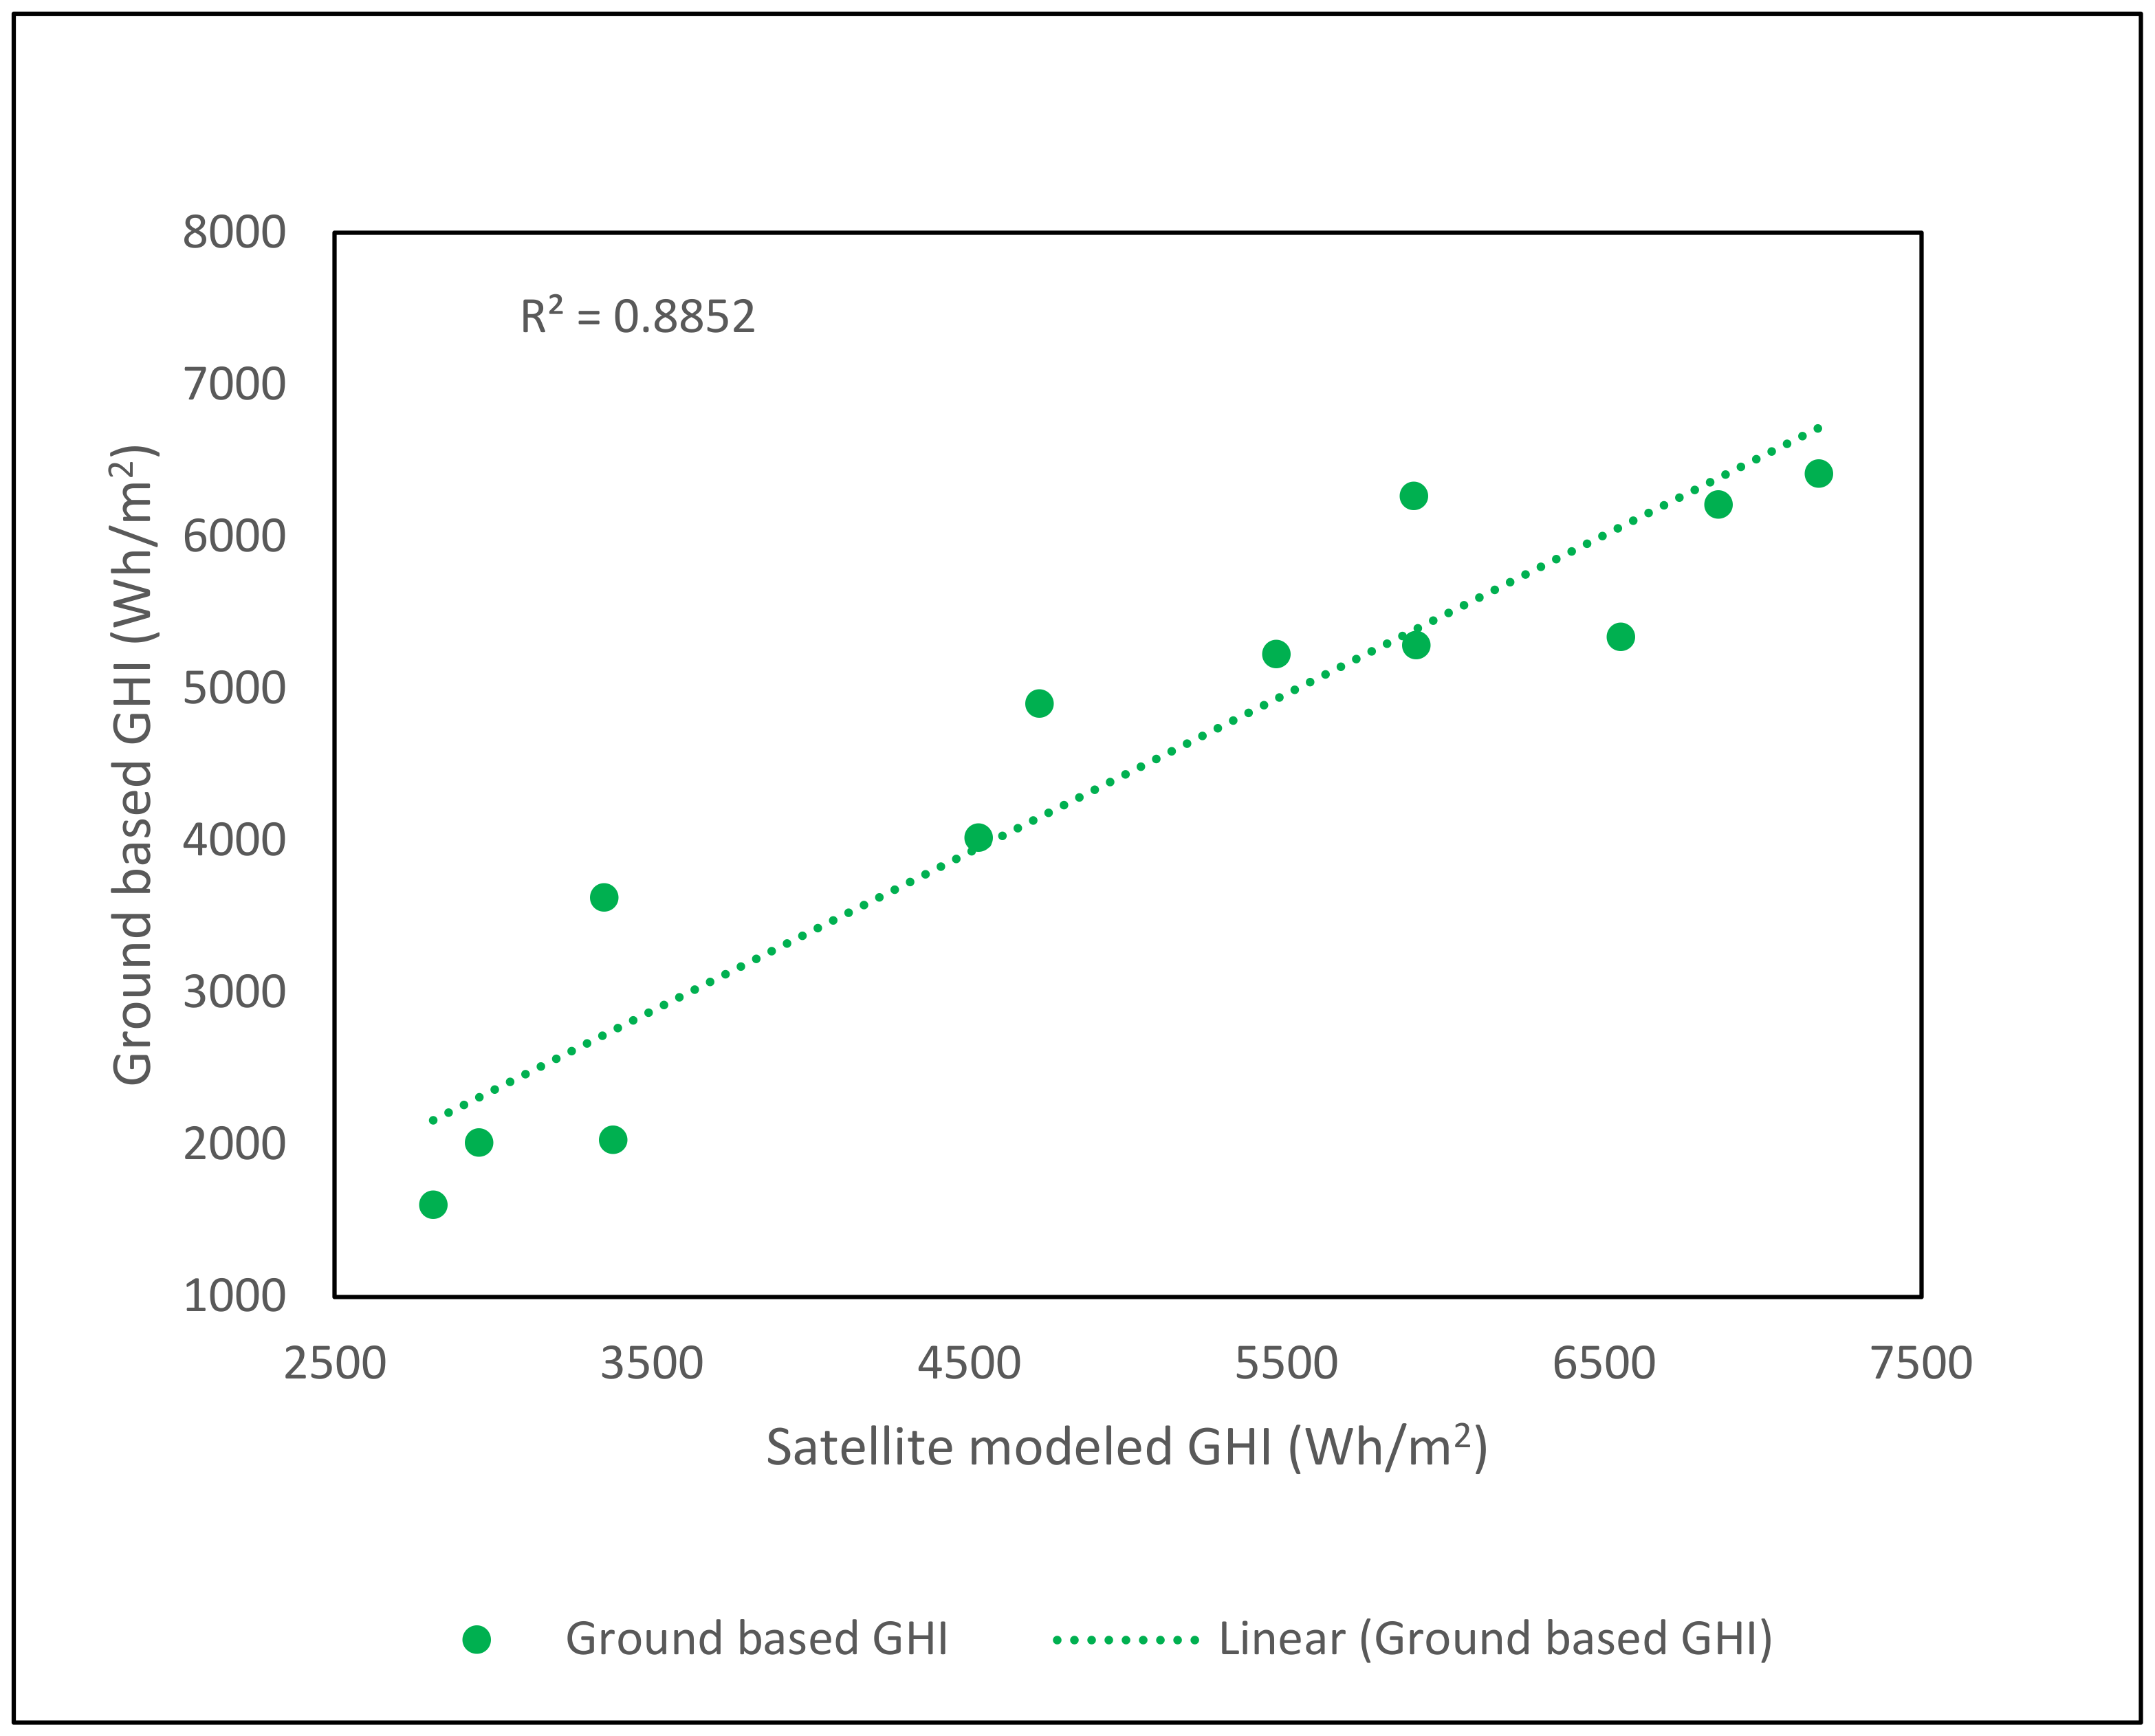
3. Results and Discussions

| Month | Satellite Value (Wh/m2) | Ground Value (Wh/m2) | Difference (Satellite-Ground) (Wh/m2) | Percent Difference {(Sat-Ground)/Sat}s × 100 |
|---|---|---|---|---|
| January | 2955 | 2013 | 942 | 31.87% |
| February | 3350 | 3627 | −277 | −8.26% |
| March | 4721 | 4902 | −181 | −3.83% |
| April | 5901 | 6267 | −366 | −6.20% |
| May | 6861 | 6210 | 651 | 9.48% |
| June | 7177 | 6415 | 762 | 10.61% |
| July | 6553 | 5341 | 1212 | 18.49% |
| August | 5909 | 5286 | 623 | 10.54% |
| September | 5468 | 5226 | 242 | 4.42% |
| October | 4530 | 4020 | 510 | 11.25% |
| November | 3378 | 2032 | 1346 | 39.84% |
| December | 2811 | 1605 | 1206 | 42.90% |
| Month | Satellite Value (Wh/m2) | Ground Value (Wh/m2) | Difference (Satellite-Ground) (Wh/m2) | Percent Difference {(Sat-Ground)/Sat}s × 100 |
|---|---|---|---|---|
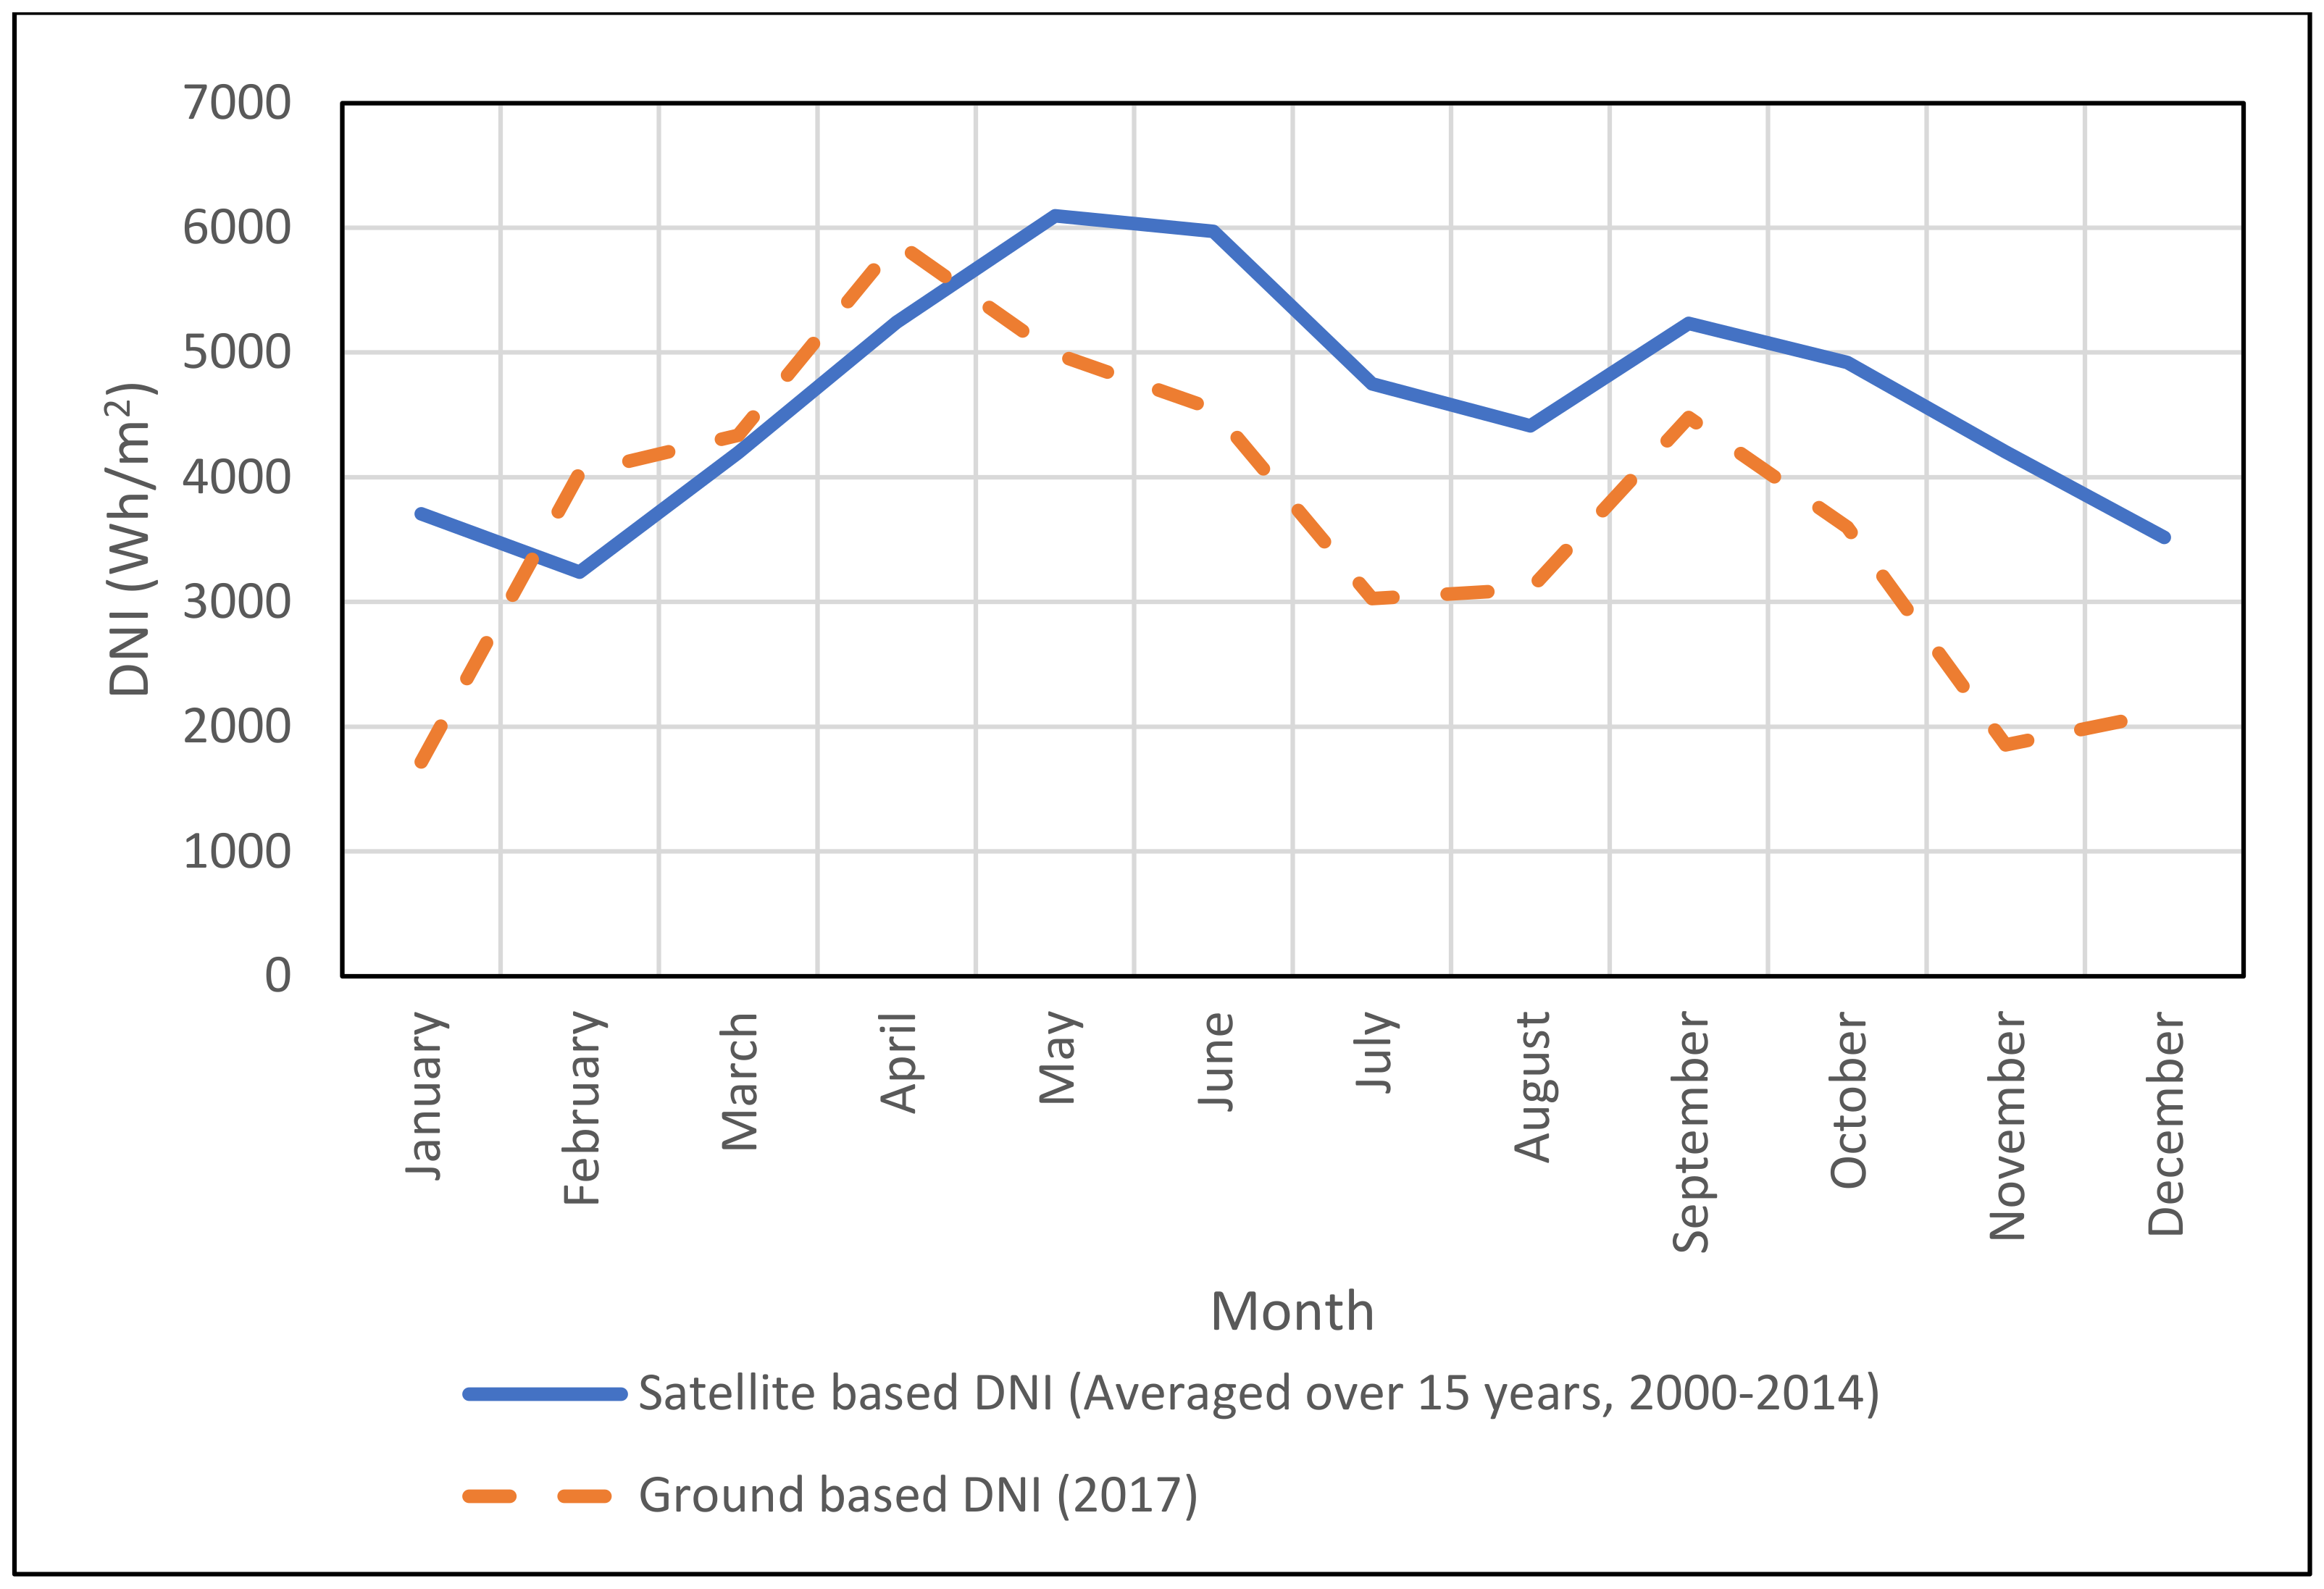
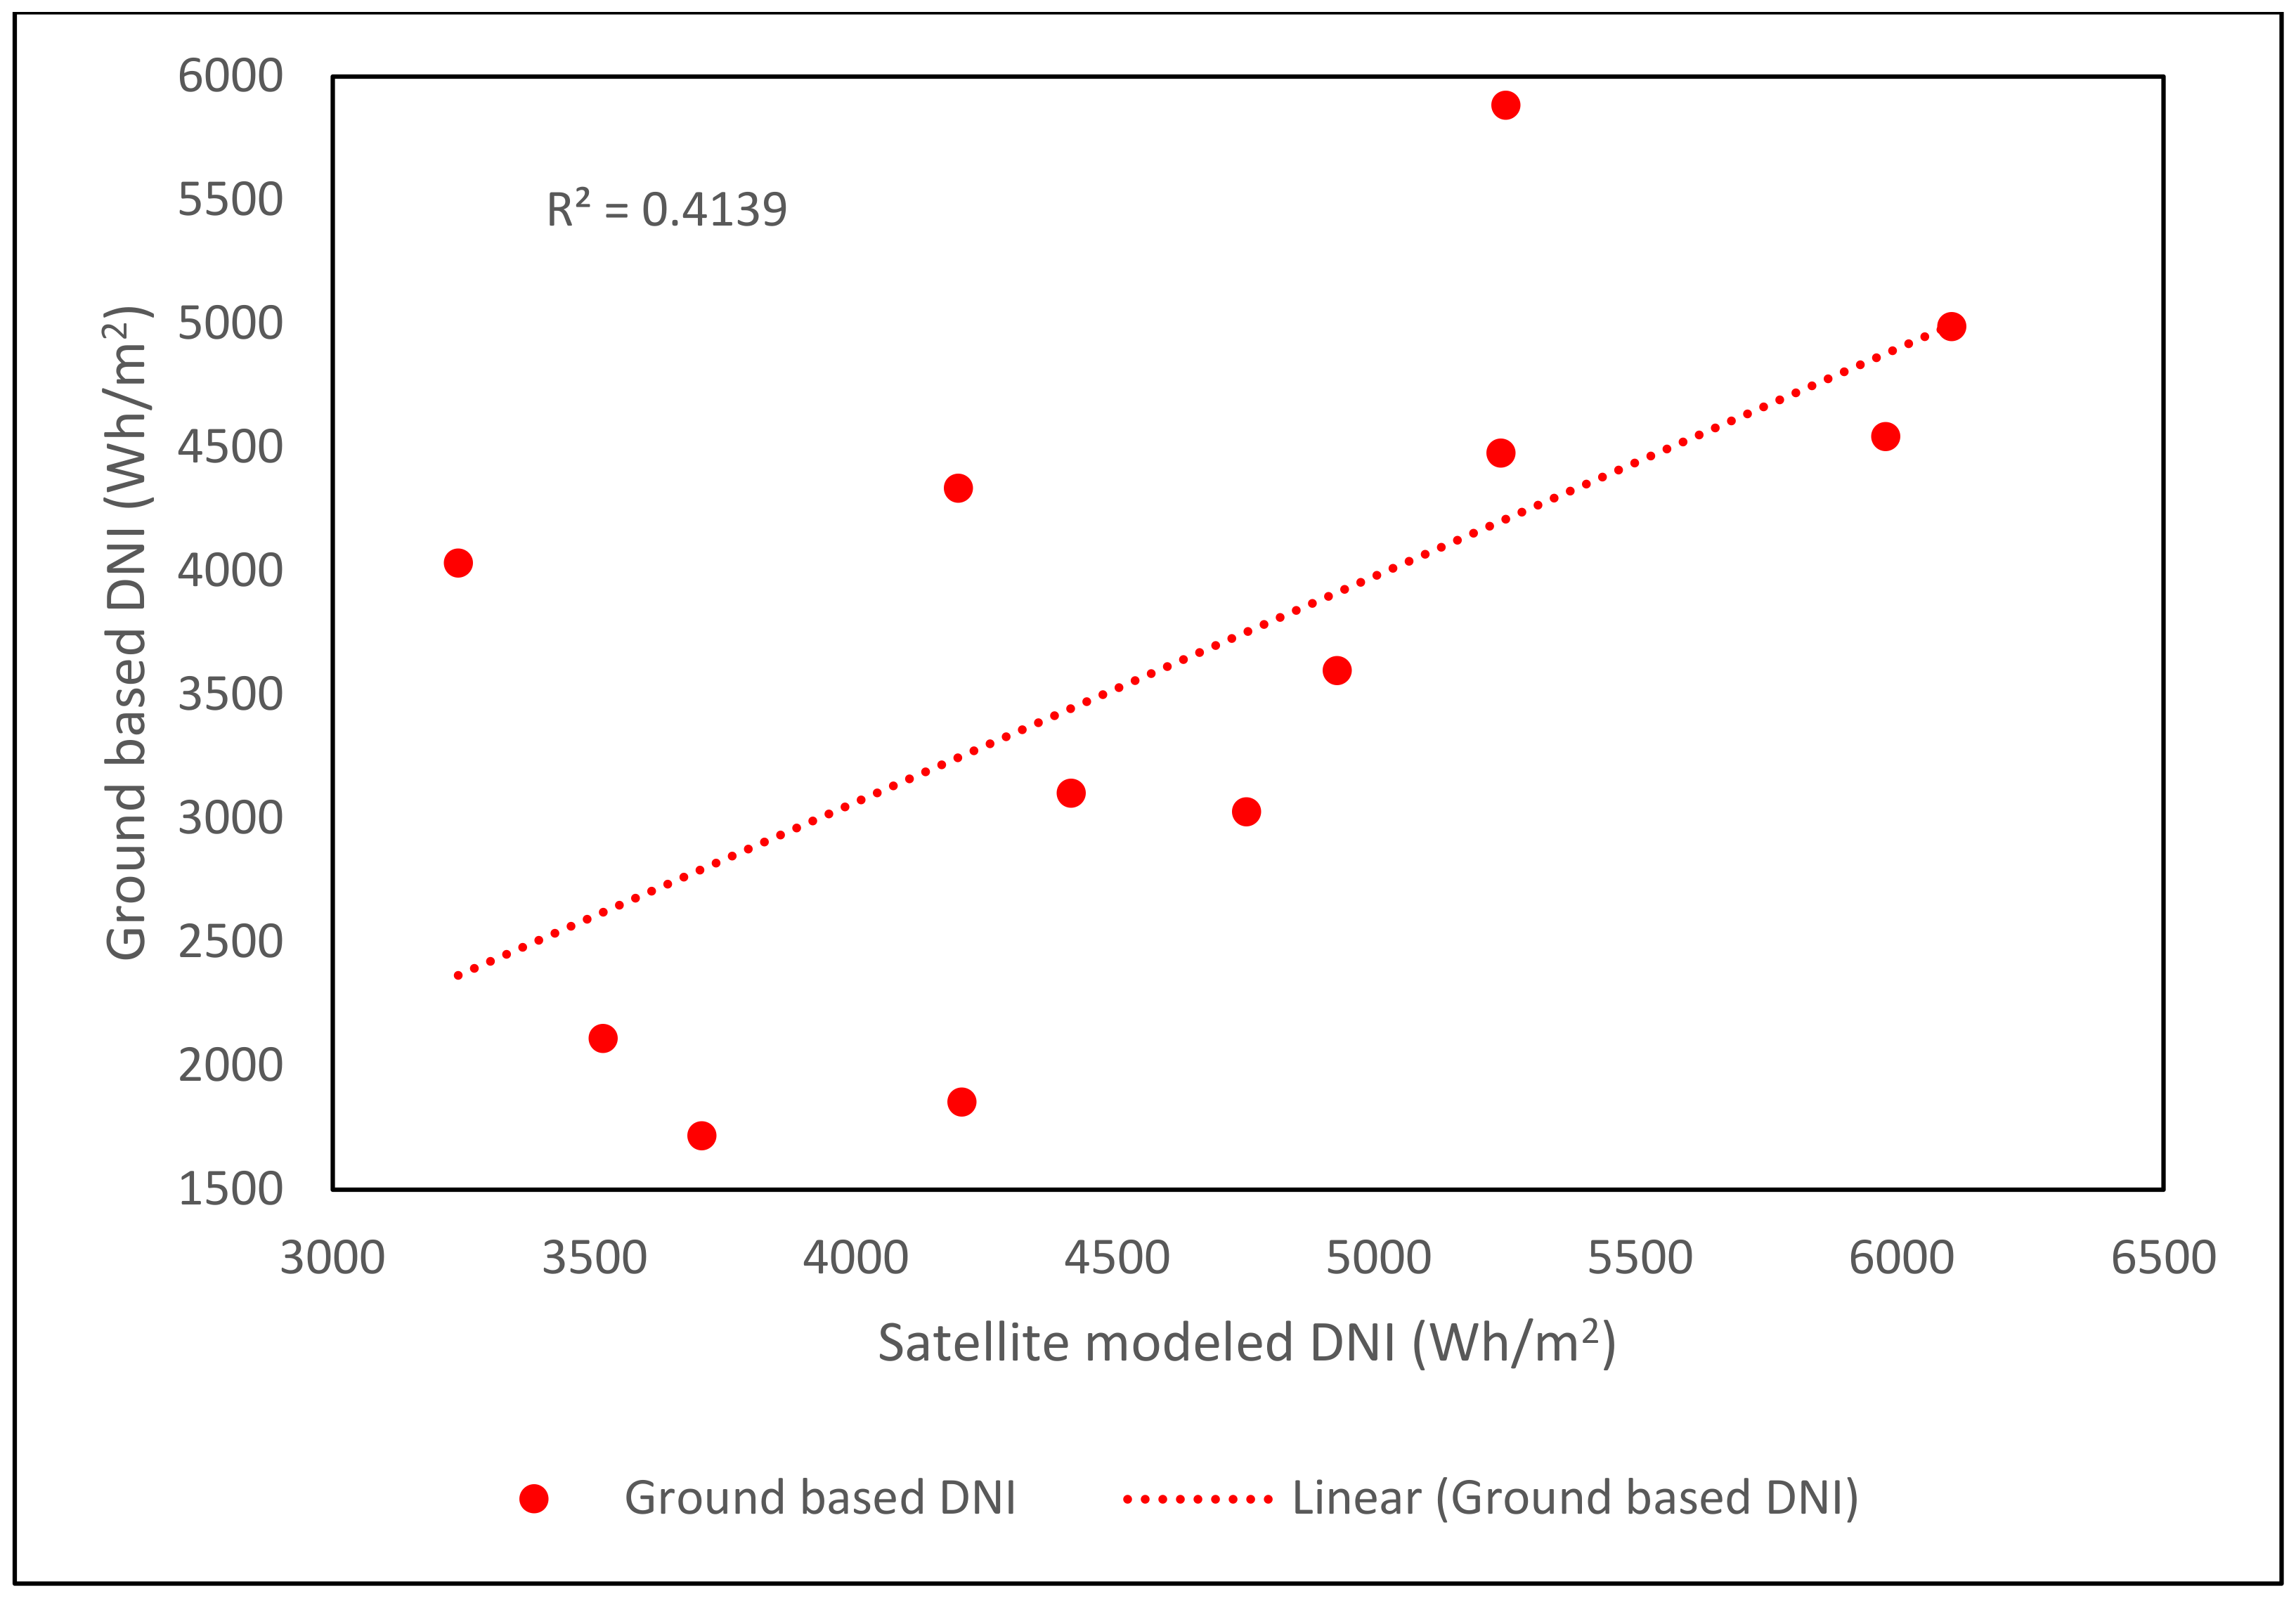
| January | 3706 | 1718 | 1988 | 53.64% |
| February | 3240 | 4034 | −794 | −24.50% |
| March | 4196 | 4336 | −140 | −3.34% |
| April | 5243 | 5884 | −641 | −12.22% |
| May | 6095 | 4989 | 1106 | 18.15% |
| June | 5969 | 4545 | 1424 | 23.86% |
| July | 4747 | 3027 | 1720 | 36.23% |
| August | 4412 | 3103 | 1309 | 29.67% |
| September | 5233 | 4478 | 755 | 14.43% |
| October | 4920 | 3599 | 1321 | 26.85% |
| November | 4203 | 1855 | 2348 | 55.86% |
| December | 3517 | 2112 | 1405 | 39.95% |
- Presence of aerosols in atmosphere;
- Presence of various gases in atmosphere;
- Presence of water vapors in air;
- Poor estimation of satellite model;
- Presence of mountains in vicinity;
- Shading of trees in the surrounding;
- Satellite confuses between clouds and snow.
4. Conclusions
Author Contributions
Funding
Institutional Review Board Statement
Informed Consent Statement
Data Availability Statement
Acknowledgments
Conflicts of Interest
Nomenclature
| PV | Photovoltaic |
| UET | University of Engineering and Technology |
| GHI | Global Horizontal Irradiance |
| DNI | Direct Normal Irradiance |
| SUNY | State University of New York |
| NSRDB | National Solar Radiation Database |
| RSI | Rotating Shadowband Irradiometer |
References
- Bhattacharya, T.; Chakraborty, A.K.; Pal, K. Effects of Ambient Temperature and Wind Speed on Performance of Monocrystalline Solar Photovoltaic Module in Tripura, India. J. Sol. Energy 2014, 2014, 817078. [Google Scholar] [CrossRef] [Green Version]
- Ayaz, A.; Ahmad, F.; Saher, S.; Noman, M. Solar Thermal Opportunities and Challenges in Pakistan. In IOP Conference Series: Materials Science and Engineering; IOP Publishing: Bristol, UK, 2020; Volume 899, p. 012008. [Google Scholar]
- Cuce, E.; Cuce, P.M.; Bali, T. An experimental analysis of illumination intensity and temperature dependency of photovoltaic cell parameters. Appl. Energy 2013, 111, 374–382. [Google Scholar] [CrossRef]
- Ayaz, A.; Ahmad, H.; Ahmad, F.; Khan, A.; hasnain Tarmazi, S.M.; Gul, R.M. Self-cleaning of glass surface to maximize the PV cell efficiency. In IOP Conference Series: Materials Science and Engineering; IOP Publishing: Bristol, UK, 2020; Volume 899, p. 012006. [Google Scholar]
- Gueymard, C.A.; Wilcox, S.M. Assessment of spatial and temporal variability in the US solar resource from radiometric measurements and predictions from models using ground-based or satellite data. Sol. Energy 2011, 85, 1068–1084. [Google Scholar] [CrossRef]
- Zell, E.; Gasim, S.; Wilcox, S.; Katamoura, S.; Stoffel, T.; Shibli, H.; Engel-Cox, J.; Al Subie, M. Assessment of solar radiation resources in Saudi Arabia. Sol. Energy 2015, 119, 422–438. [Google Scholar] [CrossRef] [Green Version]
- AlYahya, S.; Irfan, M.A. Analysis from the new solar radiation Atlas for Saudi Arabia. Sol. Energy 2016, 130, 116–127. [Google Scholar] [CrossRef]
- Alnaser, W.; Eliagoubi, B.; Al-Kalak, A.; Trabelsi, H.; Al-Maalej, M.; El-Sayed, H.; Alloush, M. First solar radiation atlas for the Arab world. Renew. Energy 2004, 29, 1085–1107. [Google Scholar] [CrossRef]
- Bachour, D.; Perez-Astudillo, D. Ground measurements of Global Horizontal Irradiation in Doha, Qatar. Renew. Energy 2014, 71, 32–36. [Google Scholar] [CrossRef]
- Janjai, S.; Laksanaboonsong, J.; Nunez, M.; Thongsathitya, A. Development of a method for generating operational solar radiation maps from satellite data for a tropical environment. Solar Energy 2005, 78, 739–751. [Google Scholar] [CrossRef]
- Gueymard, C.A.; George, R. Gridded aerosol data for improved direct normal irradiance modeling: The case of India. In Proceedings of the American Solar Energy Society Annual Conference, Raleigh, NC, USA, 17–20 May 2011. [Google Scholar]
- Ineichen, P. Comparison of eight clear sky broadband models against 16 independent data banks. Sol. Energy 2006, 80, 468–478. [Google Scholar] [CrossRef] [Green Version]
- Mueller, R.; Dagestad, K.; Ineichen, P.; Schroedter-Homscheidt, M.; Cros, S.; Dumortier, D.; Kuhlemann, R.; Olseth, J.; Piernavieja, G.; Reise, C.; et al. Rethinking satellite-based solar irradiance modelling The SOLIS clear-sky module. Remote Sens. Environ. 2004, 91, 160–174. [Google Scholar] [CrossRef]
- Kostylev, V.; Pavlovski, A. Solar power forecasting performance–towards industry standards. In 1st International Workshop on the Integration of Solar Power into Power Systems, Aarhus, Denmark; Energynautics GmbH Mühlstraße: Langen, Germany, 2011. [Google Scholar]
- Vignola, F.; Harlan, P.; Perez, R.; Kmiecik, M. Analysis of satellite derived beam and global solar radiation data. Sol. Energy 2007, 81, 768–772. [Google Scholar] [CrossRef]
- Blanksby, C.; Bennett, D.; Langford, S. Improvement to an existing satellite data set in support of an Australia solar atlas. Sol. Energy 2012, 98, 111–124. [Google Scholar] [CrossRef]
- Pereira, E.B.; Abreu, S.L.; Stuhlmann, R.; Rieland, M.; Colle, S. Survey of the incident solar radiation in Brazil by use of meteosat satellite data. Sol. Energy 1996, 57, 125–132. [Google Scholar] [CrossRef]
- Janjai, S. A method for estimating direct normal solar irradiation from satellite data for a tropical environment. Sol. Energy 2010, 84, 1685–1695. [Google Scholar] [CrossRef]
- Nonnenmacher, L.; Kaur, A.; Coimbra, C.F. Verification of the SUNY direct normal irradiance model with ground measurements. Sol. Energy 2014, 99, 246–258. [Google Scholar] [CrossRef]
- Perez, R.; Seals, R.; Zelenka, A. Comparing satellite remote sensing and ground network measurements for the production of site/time specific irradiance data. Sol. Energy 1997, 60, 89–96. [Google Scholar] [CrossRef]
- Janjai, S.; Pankaew, P.; Laksanaboonsong, J. A model for calculating hourly global solar radiation from satellite data in the tropics. Appl. Energy 2009, 86, 1450–1457. [Google Scholar] [CrossRef]
- Tarpley, J.D. Estimating Incident Solar Radiation at the Surface from Geostationary Satellite Data. J. Appl. Meteorol. 1979, 18, 1172–1181. [Google Scholar] [CrossRef] [Green Version]
- Gautier, C.; Diak, G.; Masse, S. A Simple Physical Model to Estimate Incident Solar Radiation at the Surface from GOES Satellite Data. J. Appl. Meteorol. 1980, 19, 1005–1012. [Google Scholar] [CrossRef] [Green Version]
- Mabasa, B.; Lysko, M.D.; Moloi, S.J. Validating Hourly Satellite Based and Reanalysis Based Global Horizontal Irradiance Datasets over South Africa. Geomatics 2021, 1, 429–449. [Google Scholar] [CrossRef]
- Kheddioui, A.; El Ouiqary, E.M.; Smiej, M. Estimation of the global horizontal solar irradiation GHI for the Moroccan national territory from meteorological satellite images of the Second Generation Meteosat series MSG. Eur. J. Mol. Clin. Med. 2021, 8, 2814–2826. [Google Scholar]
- Jain, S.; Singh, C.; Tripathi, A.K. A Flexible and Effective Method to Integrate the Satellite-Based AOD Data into WRF-Solar Model for GHI Simulation. J. Indian Soc. Remote Sens. 2021, 49, 2797–2813. [Google Scholar] [CrossRef]
- Xing, W.; Zhang, G.; Poslad, S. Estimation of global horizontal irradiance in China using a deep learning method. Int. J. Remote Sens. 2021, 42, 3899–3917. [Google Scholar] [CrossRef]
- Rodríguez-Benítez, F.J.; López-Cuesta, M.; Arbizu-Barrena, C.; Fernández-León, M.M.; Pamos-Ureña, M.Á.; Tovar-Pescador, J.; Santos-Alamillos, F.J.; Pozo-Vázquez, D. Assessment of new solar radiation nowcasting methods based on sky-camera and satellite imagery. Appl. Energy 2021, 292, 116838. [Google Scholar] [CrossRef]
- Alani, O.E.; Ghennioui, H.; Abraim, M.; Ghennioui, A.; Blanc, P.; Saint-Drenan, Y.M.; Naimi, Z. Solar Energy Resource Assessment Using GHI and DNI Satellite Data for Moroccan Climate. In International Conference on Advanced Technologies for Humanity; Springer: Cham, Switzerland, 2021; pp. 275–285. [Google Scholar]
- Zelenka, A.; Perez, R.; Seals, R.; Renné, D. Effective Accuracy of Satellite-Derived Hourly Irradiances. Arch. Meteorol. Geophys. Bioclimatol. Ser. B 1999, 62, 199–207. [Google Scholar] [CrossRef]
- Lohmann, S.; Schillings, C.; Mayer, B.; Meyer, R. Long-term variability of solar direct and global radiation derived from ISCCP data and comparison with reanalysis data. Sol. Energy 2006, 80, 1390–1401. [Google Scholar] [CrossRef] [Green Version]
- Cebecauer, T.; Suri, M. Accuracy improvements of satellite-derived solar resource based on GEMS re-analysis aerosols. In Proceedings of the Conference SolarPACES, Perpignan, France, 21–24 September 2010. [Google Scholar]
- Suri, M.; Cebecauer, T. Satellite-based solar resource data: Model validation statistics versus user’s un-certainty. In Proceedings of the ASES SOLAR 2014 Conference, San Francisco, CA, USA, 7 July 2014; pp. 7–9. [Google Scholar]
- Maxwell, E.; Wilcox, S.; Rymes, M. User’s Manual for SERI QC Software, Assessing the Quality of Solar Radiation Data; Solar Energy Research Institute: Golden, CO, USA, 1993. [Google Scholar]
- Younes, S.; Claywell, R.; Muneer, T. Quality control of solar radiation data: Present status and proposed new approaches. Energy 2005, 30, 1533–1549. [Google Scholar] [CrossRef]


| Properties | Values |
|---|---|
| Spectral range (50% Points) | 285 to 2800 nm |
| Sensitivity | 7 to 14 µV/W/m² |
| Response Time | <5 s |
| Zero offset A | <7 W/m² |
| Zero offset B | <2 W/m2 |
| Directional response (up to 80° with 1000 W/m2 beam) | <10 W/m² |
| Temperature dependence of sensitivity (−10 °C to +40 °C) | <1% |
| Operational temperature range | −40 °C to +80 °C |
| Maximum solar irradiance | 4000 W/m2 |
| Temperature range | −30 to +65 °C |
| Humidity | 0 to 100% Rh |
| Dimensions | 500 × 100 × 200 mm |
| Weight | 2.1 kg |
| Power demand | <1 W at average |
| Output signal | ≈90 μA per 1000 W/m² |
| Response time | 10 μs |
| Property | Equipment Uncertainty (%) | SUNY Uncertainty (%) | Combined Uncertainty (%) | Maximum Difference (%) |
|---|---|---|---|---|
| GHI | 2 | 9.6 | 11.6 | 42.9 |
| DNI | 2 | 15.9 | 17.9 | 55.86 |
Publisher’s Note: MDPI stays neutral with regard to jurisdictional claims in published maps and institutional affiliations. |
© 2022 by the authors. Licensee MDPI, Basel, Switzerland. This article is an open access article distributed under the terms and conditions of the Creative Commons Attribution (CC BY) license (https://creativecommons.org/licenses/by/4.0/).
Share and Cite
Ayaz, A.; Ahmad, F.; Irfan, M.A.A.; Rehman, Z.; Rajski, K.; Danielewicz, J. Comparison of Ground-Based Global Horizontal Irradiance and Direct Normal Irradiance with Satellite-Based SUNY Model. Energies 2022, 15, 2528. https://doi.org/10.3390/en15072528
Ayaz A, Ahmad F, Irfan MAA, Rehman Z, Rajski K, Danielewicz J. Comparison of Ground-Based Global Horizontal Irradiance and Direct Normal Irradiance with Satellite-Based SUNY Model. Energies. 2022; 15(7):2528. https://doi.org/10.3390/en15072528
Chicago/Turabian StyleAyaz, Adnan, Faraz Ahmad, Mohammad Abdul Aziz Irfan, Zabdur Rehman, Krzysztof Rajski, and Jan Danielewicz. 2022. "Comparison of Ground-Based Global Horizontal Irradiance and Direct Normal Irradiance with Satellite-Based SUNY Model" Energies 15, no. 7: 2528. https://doi.org/10.3390/en15072528