
Environmental Impact Assessment and Classification of 48 V Plug-in Hybrids with Real-Driving Use Case Simulations

 , ,
, ,
Abstract
:1. Introduction
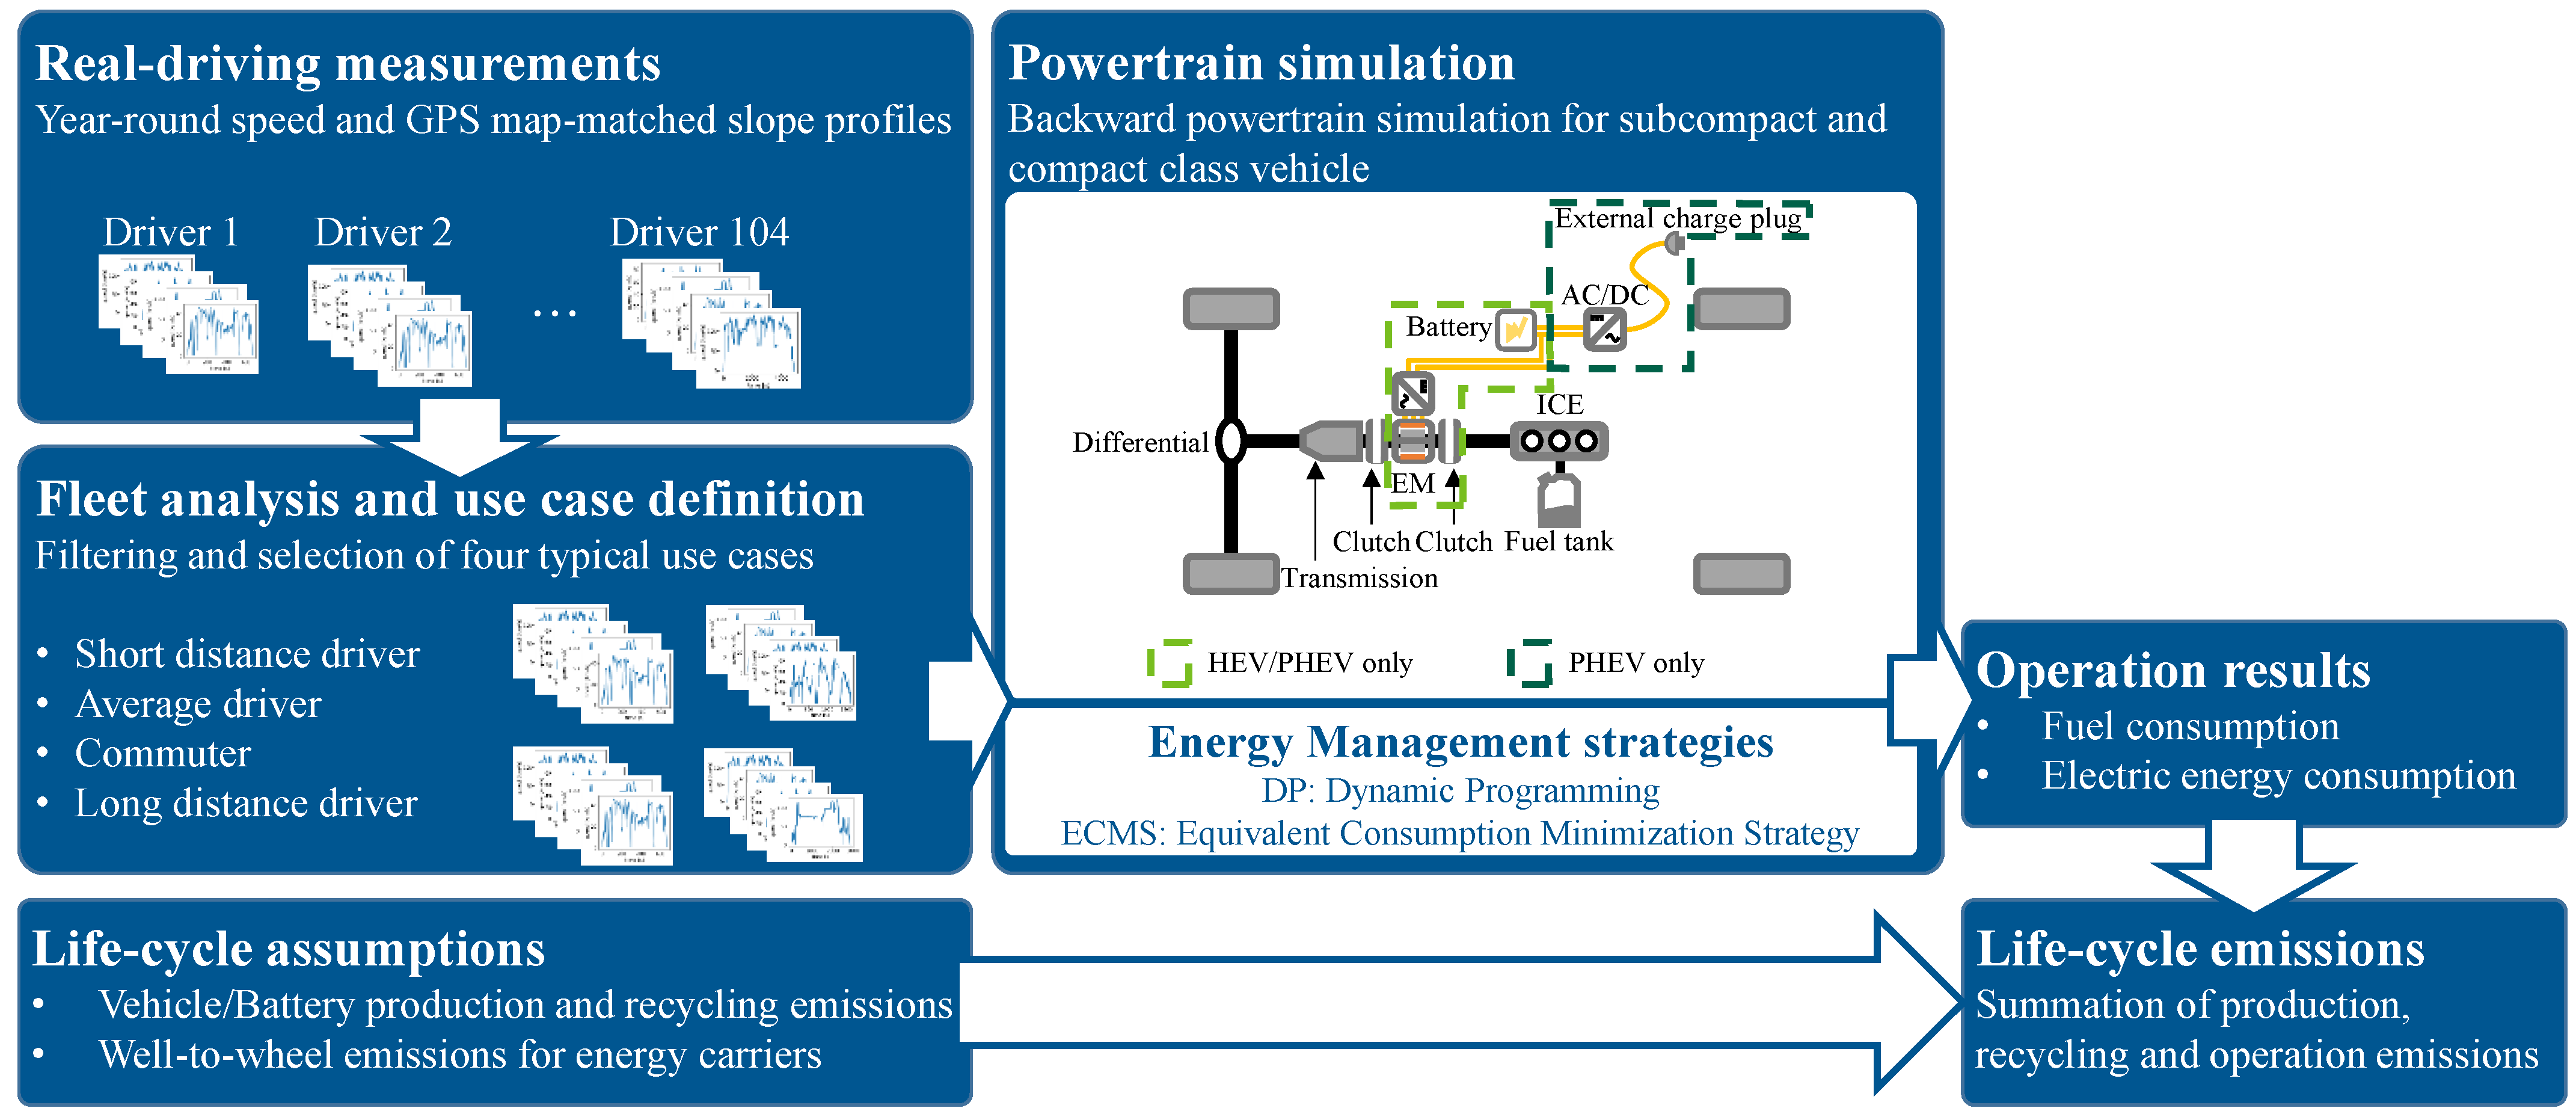
2. Research Method
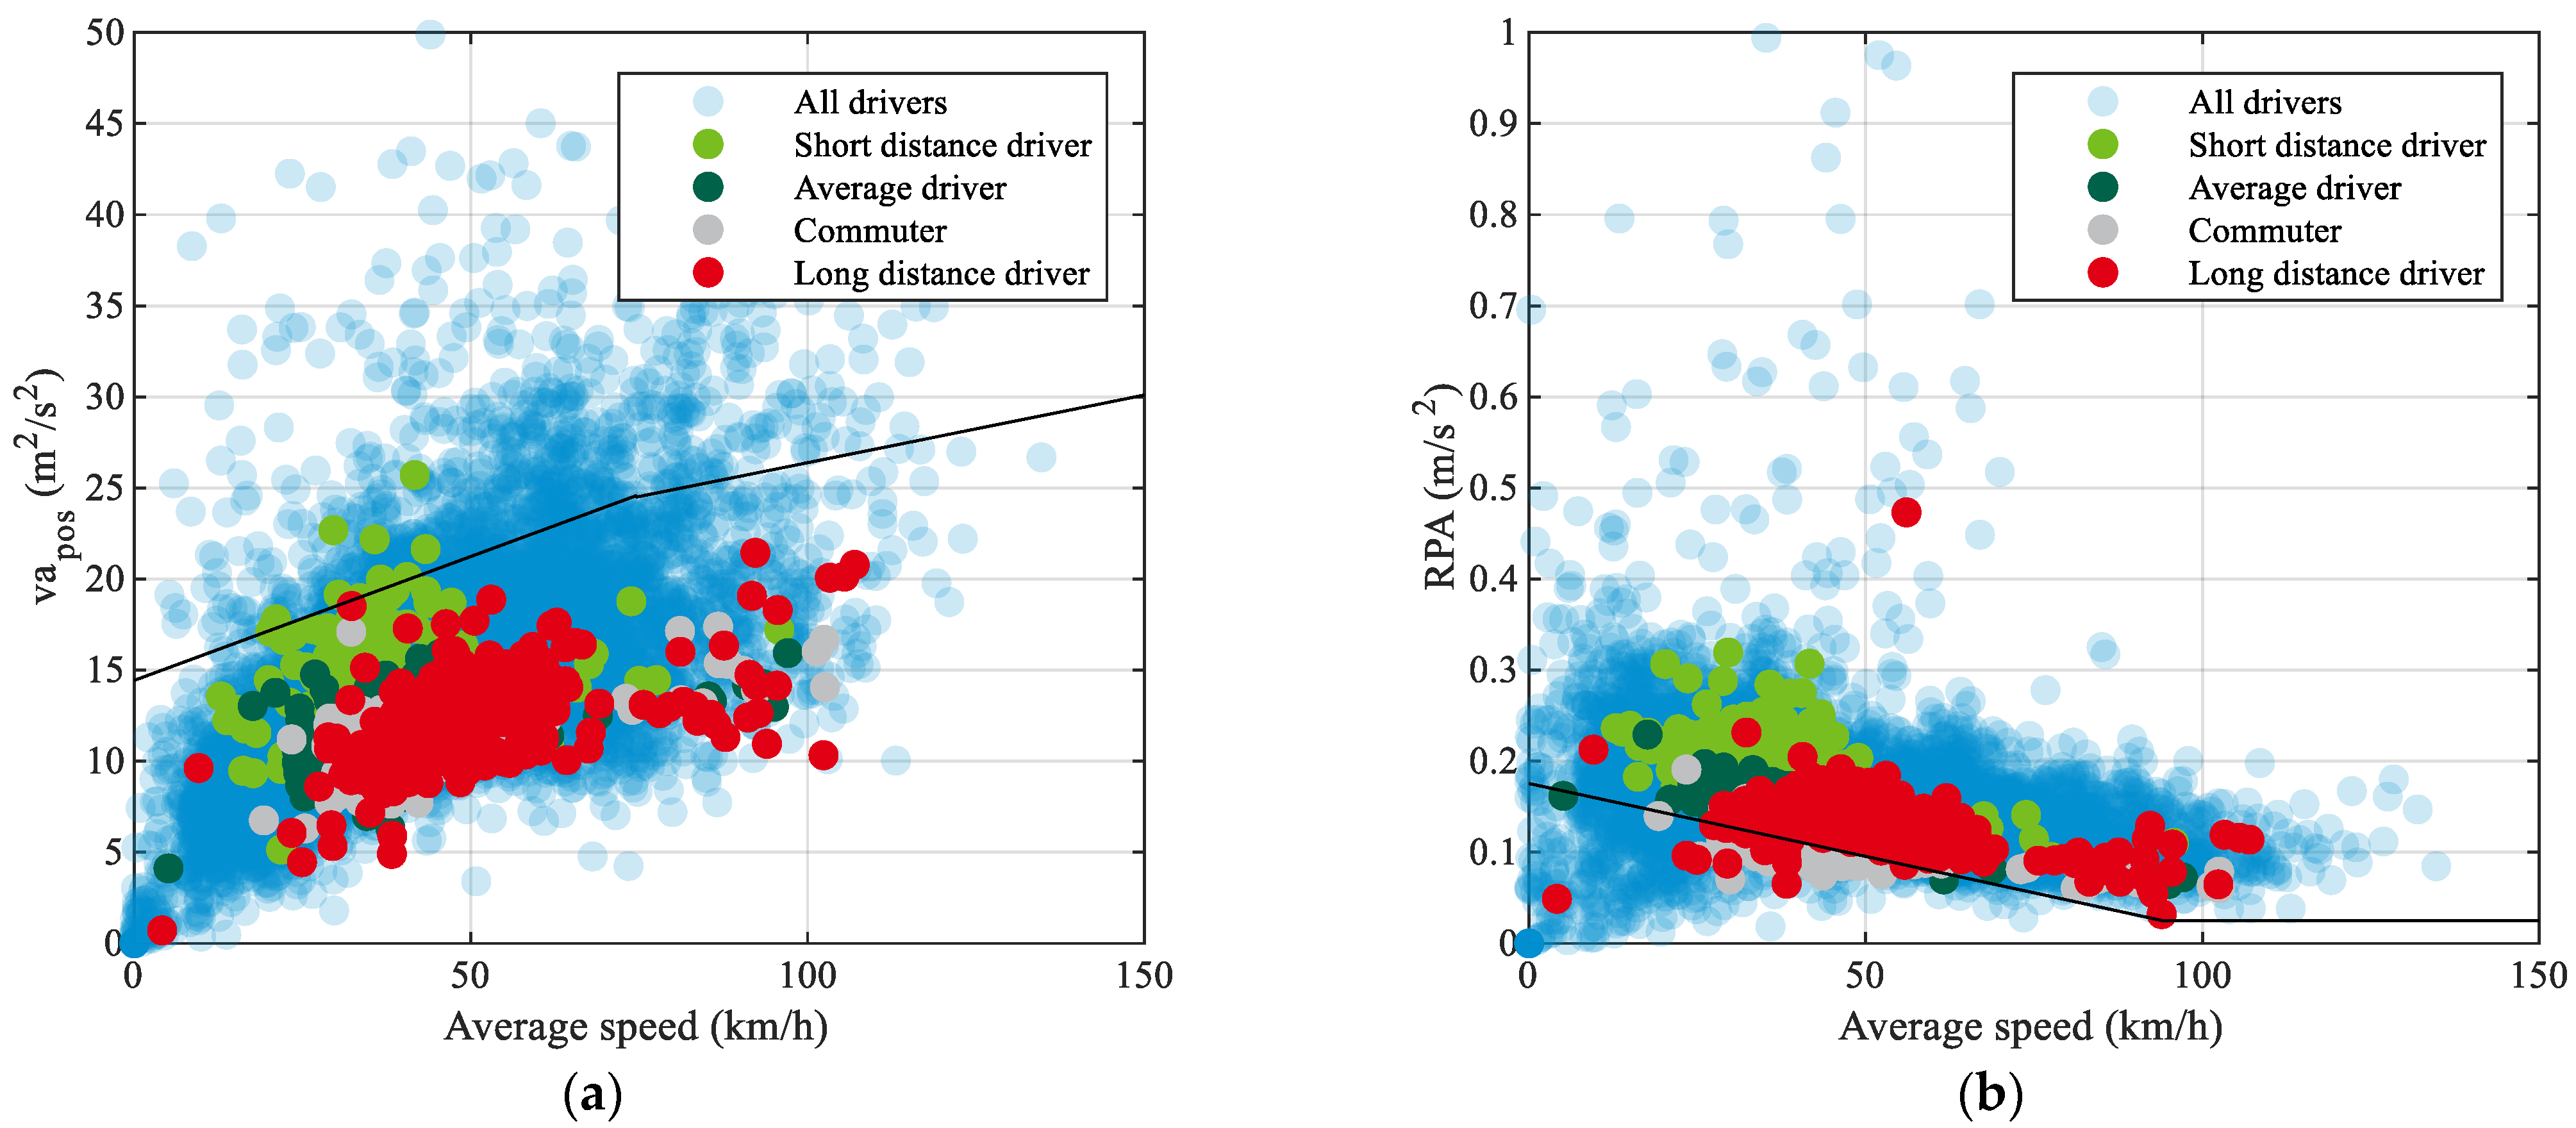
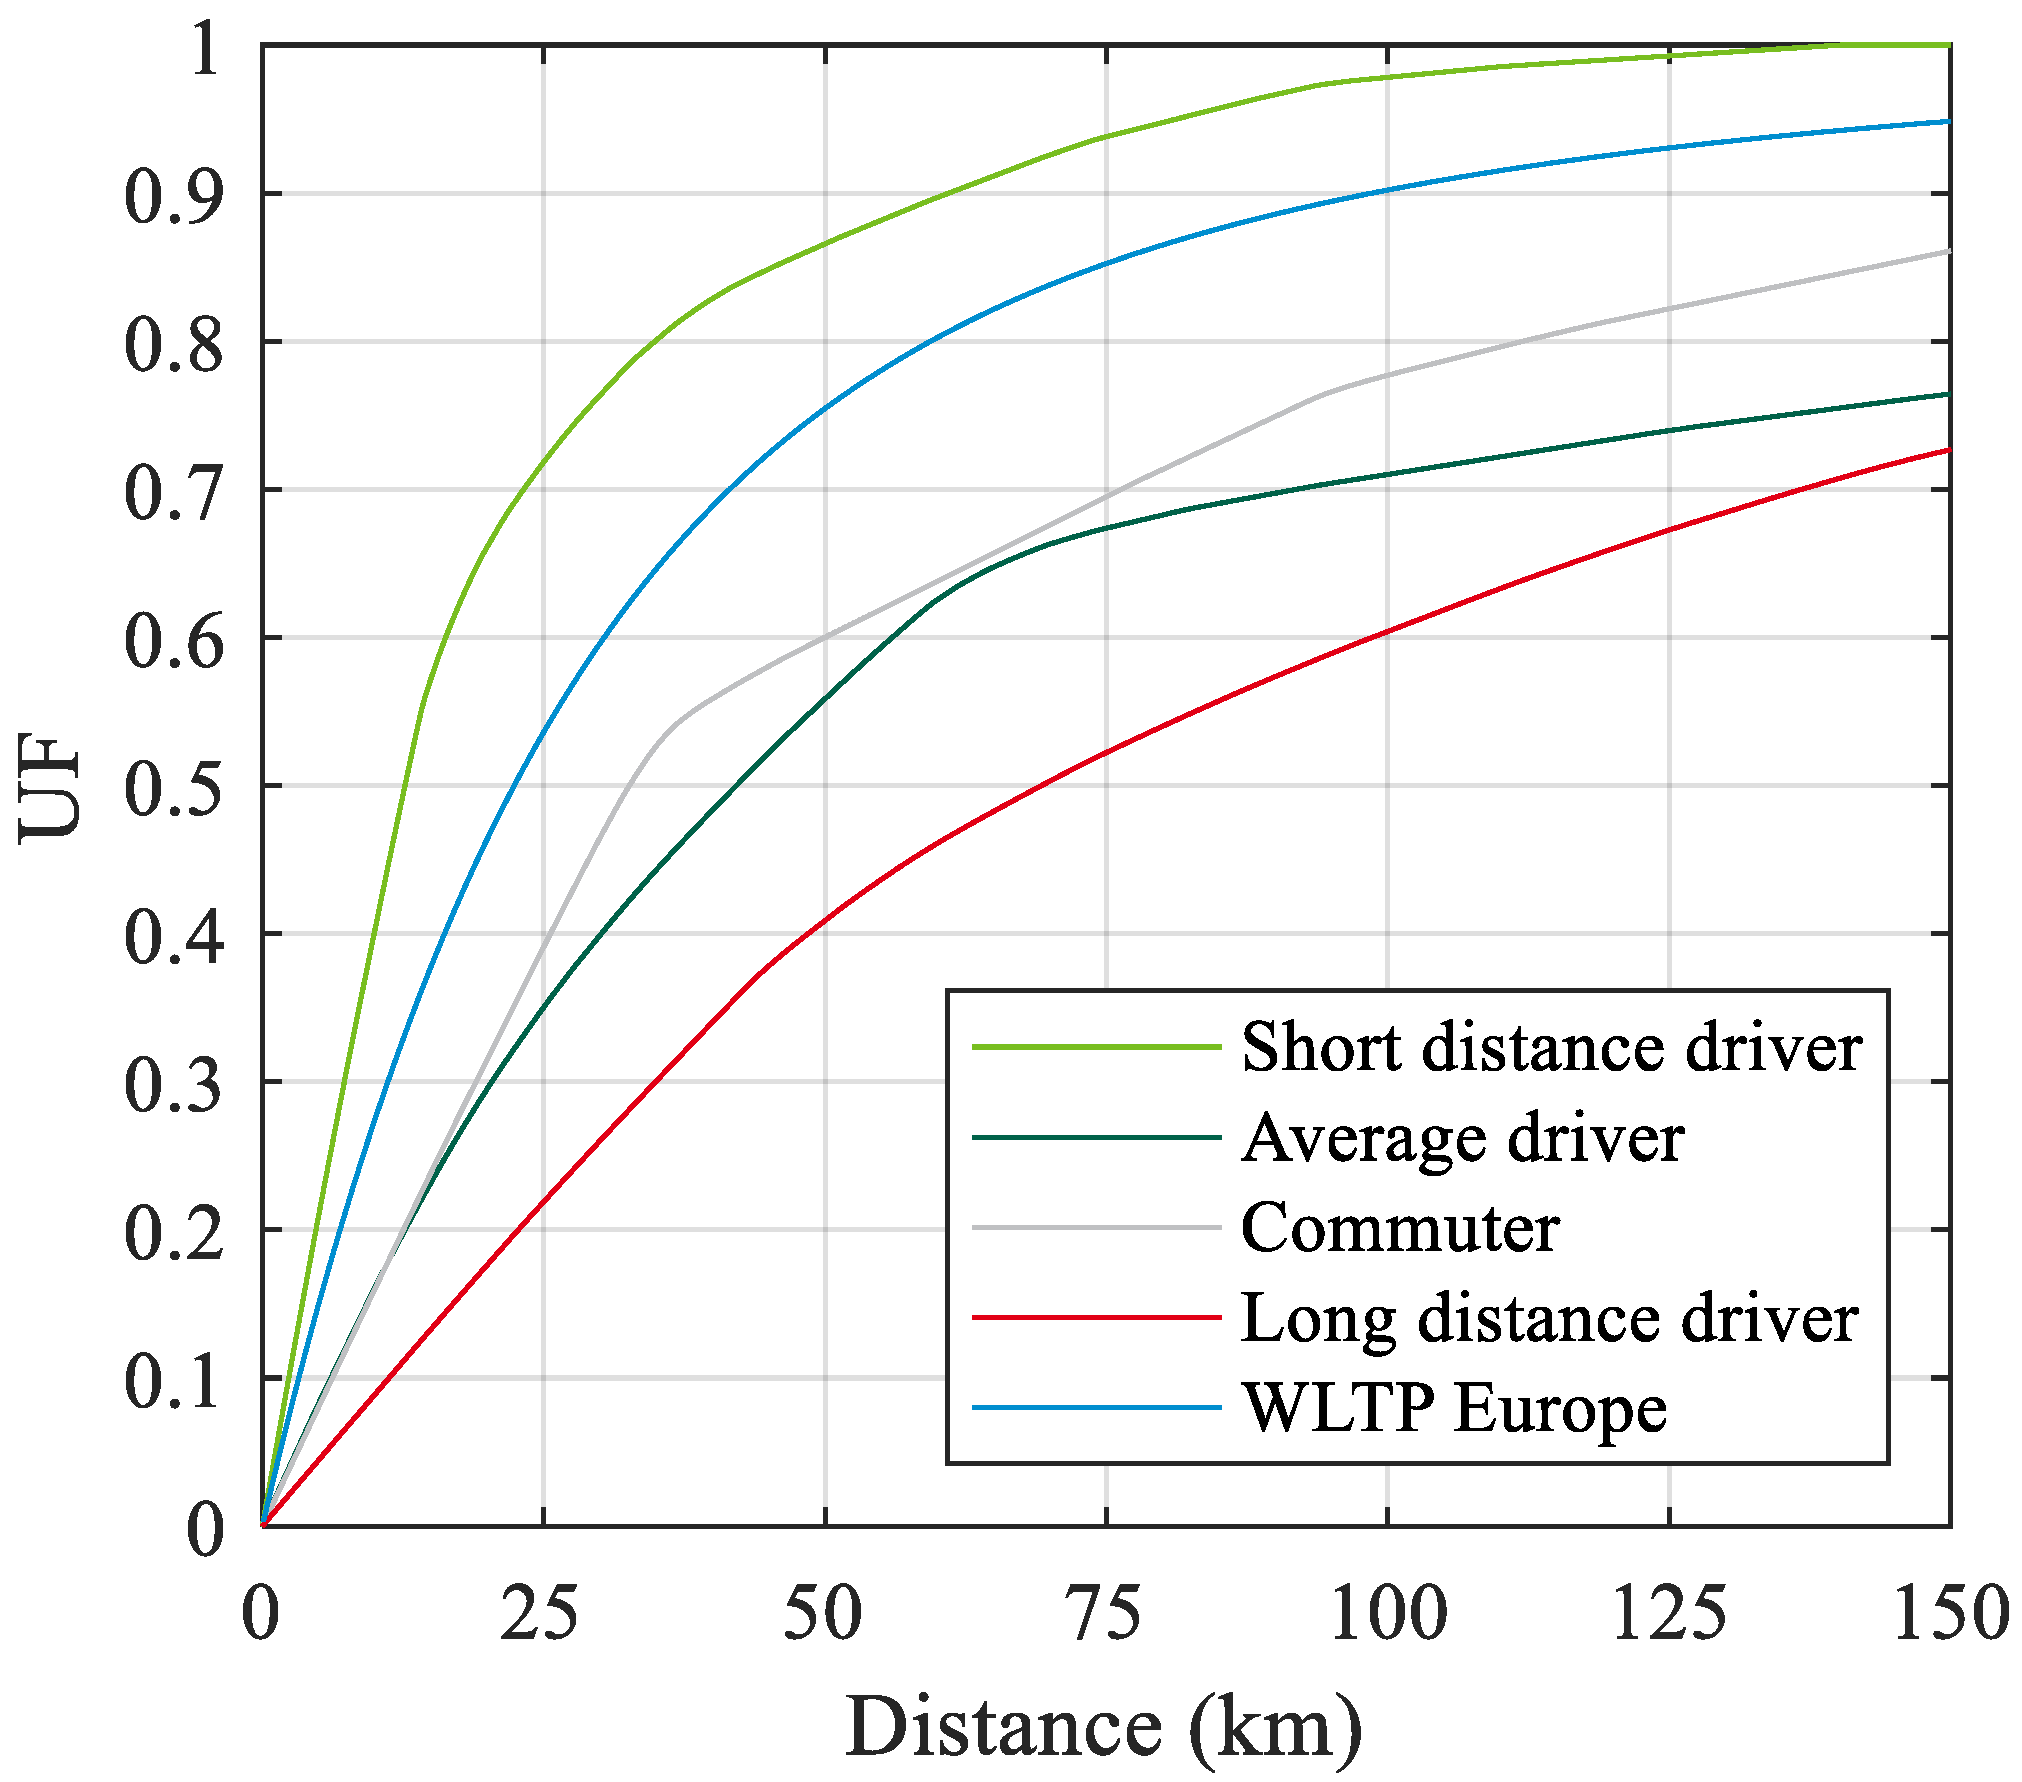
2.1. Fleet Analysis and Use Case Definition
- Short-distance driver, high share of trips less than 10 km;
- Average driver, annual mileage is close to German passenger car average of 13.602 km (2019) [27];
- Long-distance driver, high share of trips longer than 100 km;
- Commuter, prominent peak at a certain trip distance.
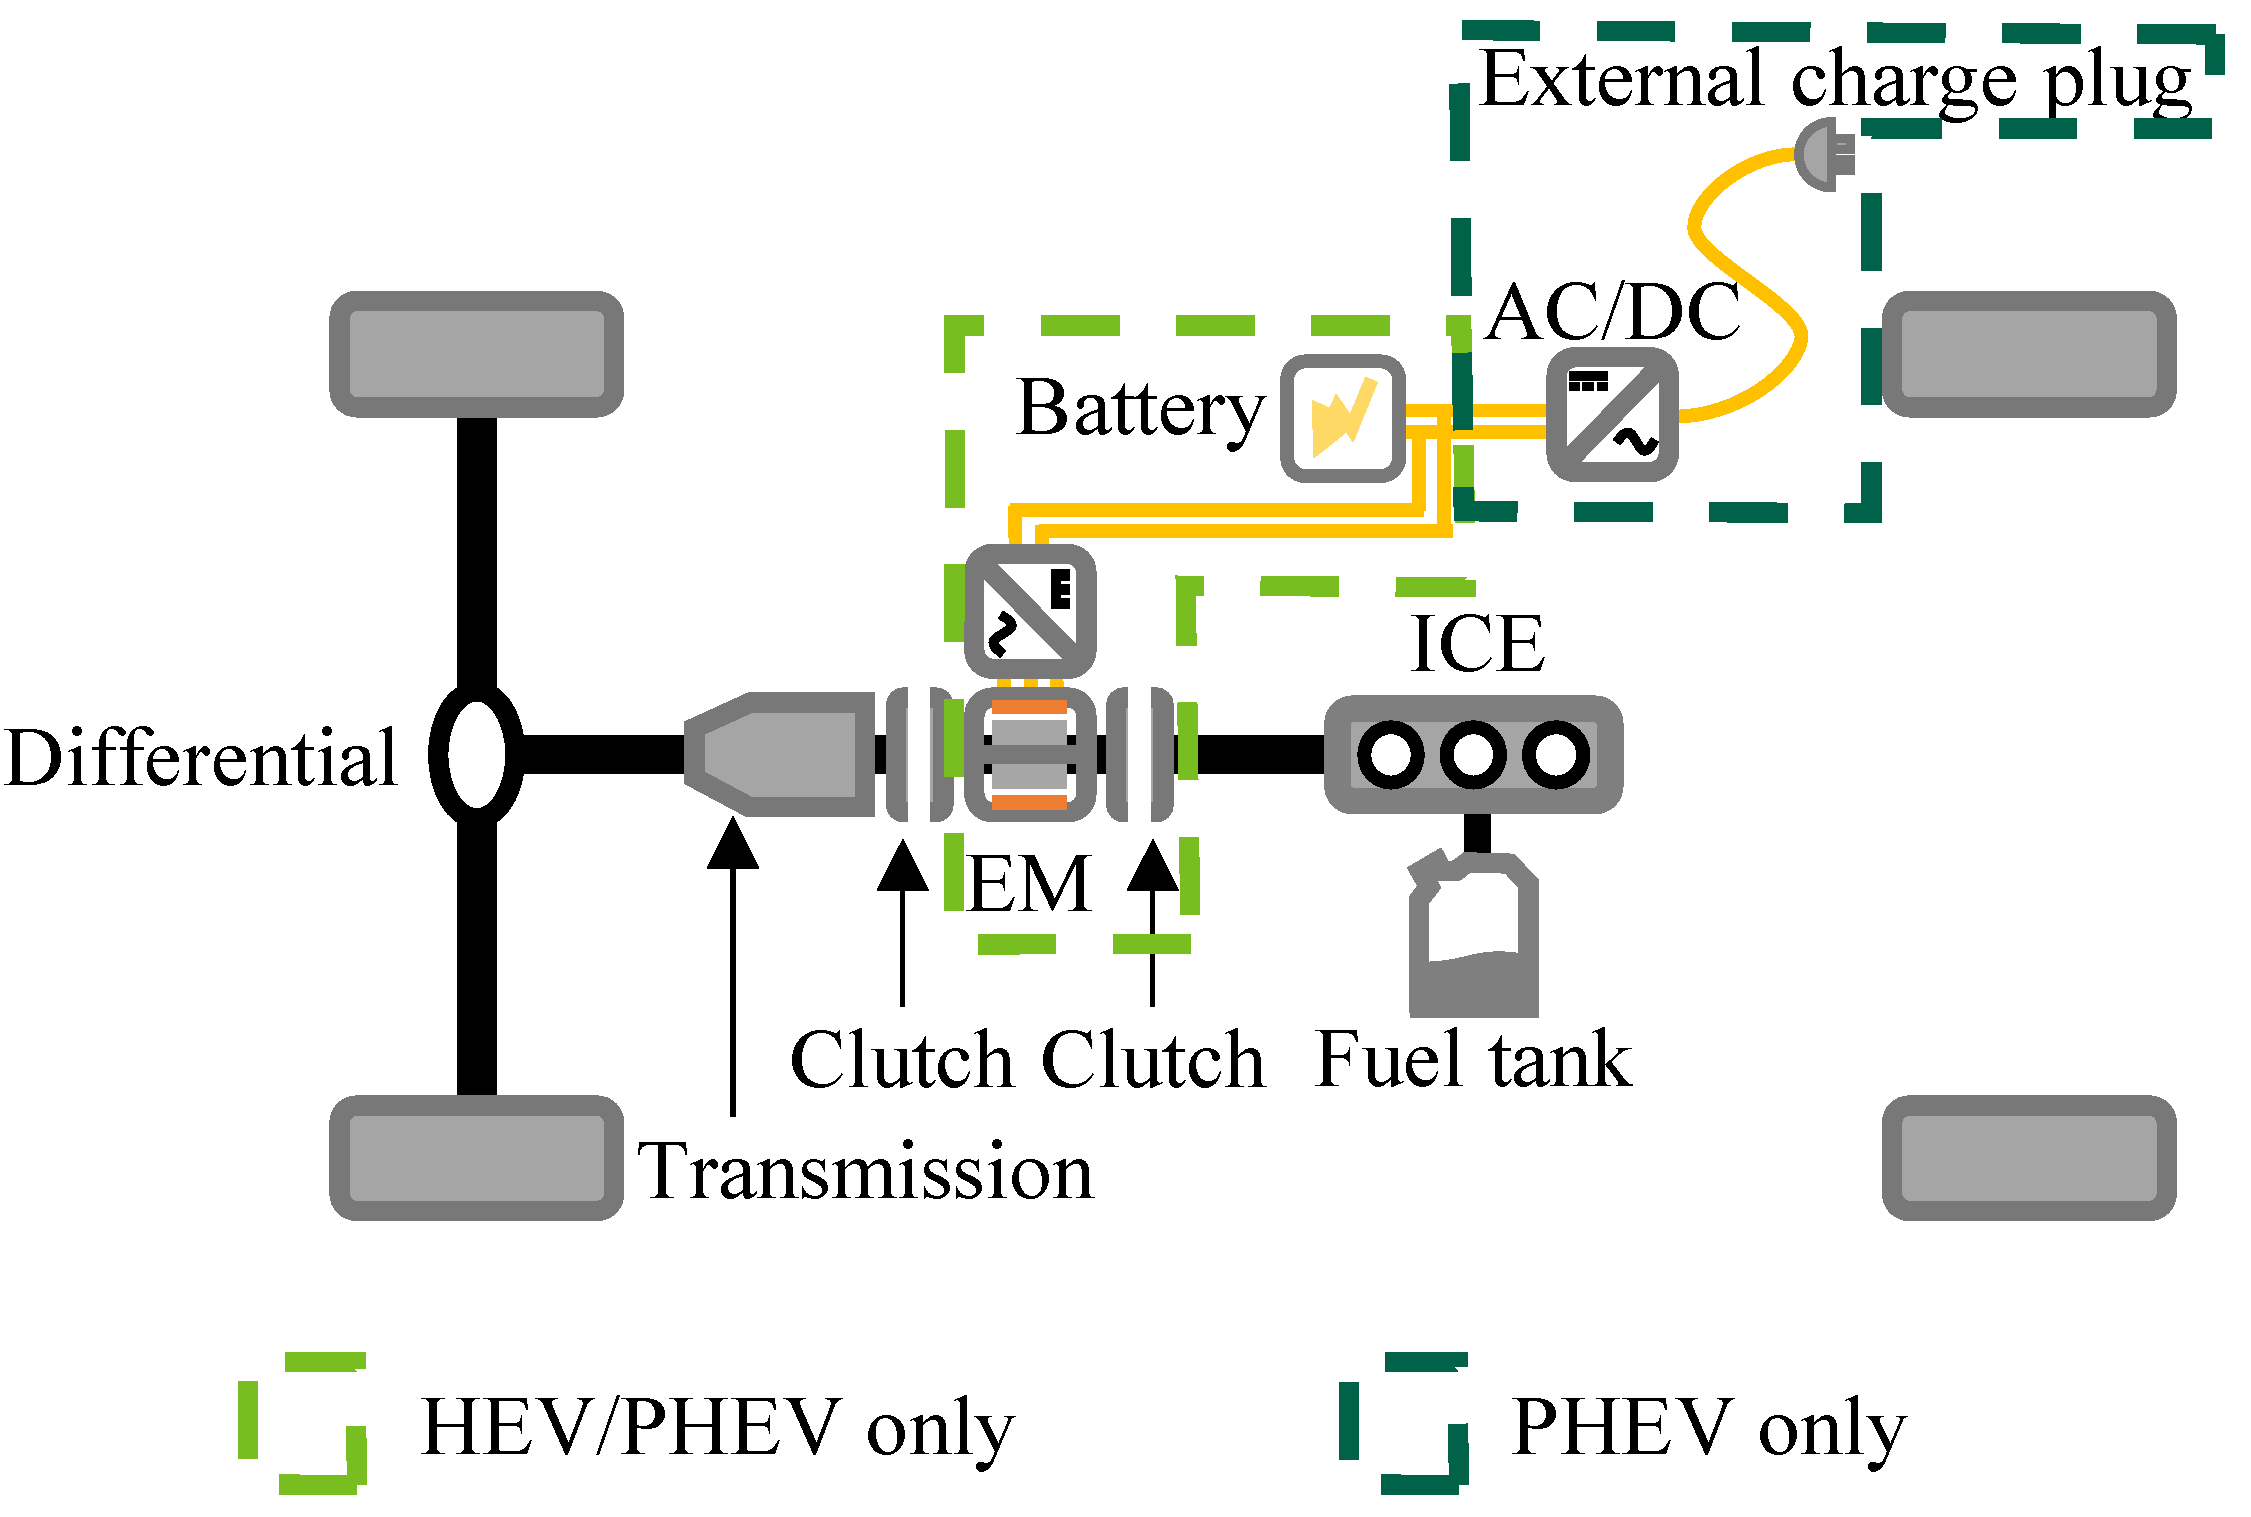
2.2. Powertrain Simulation
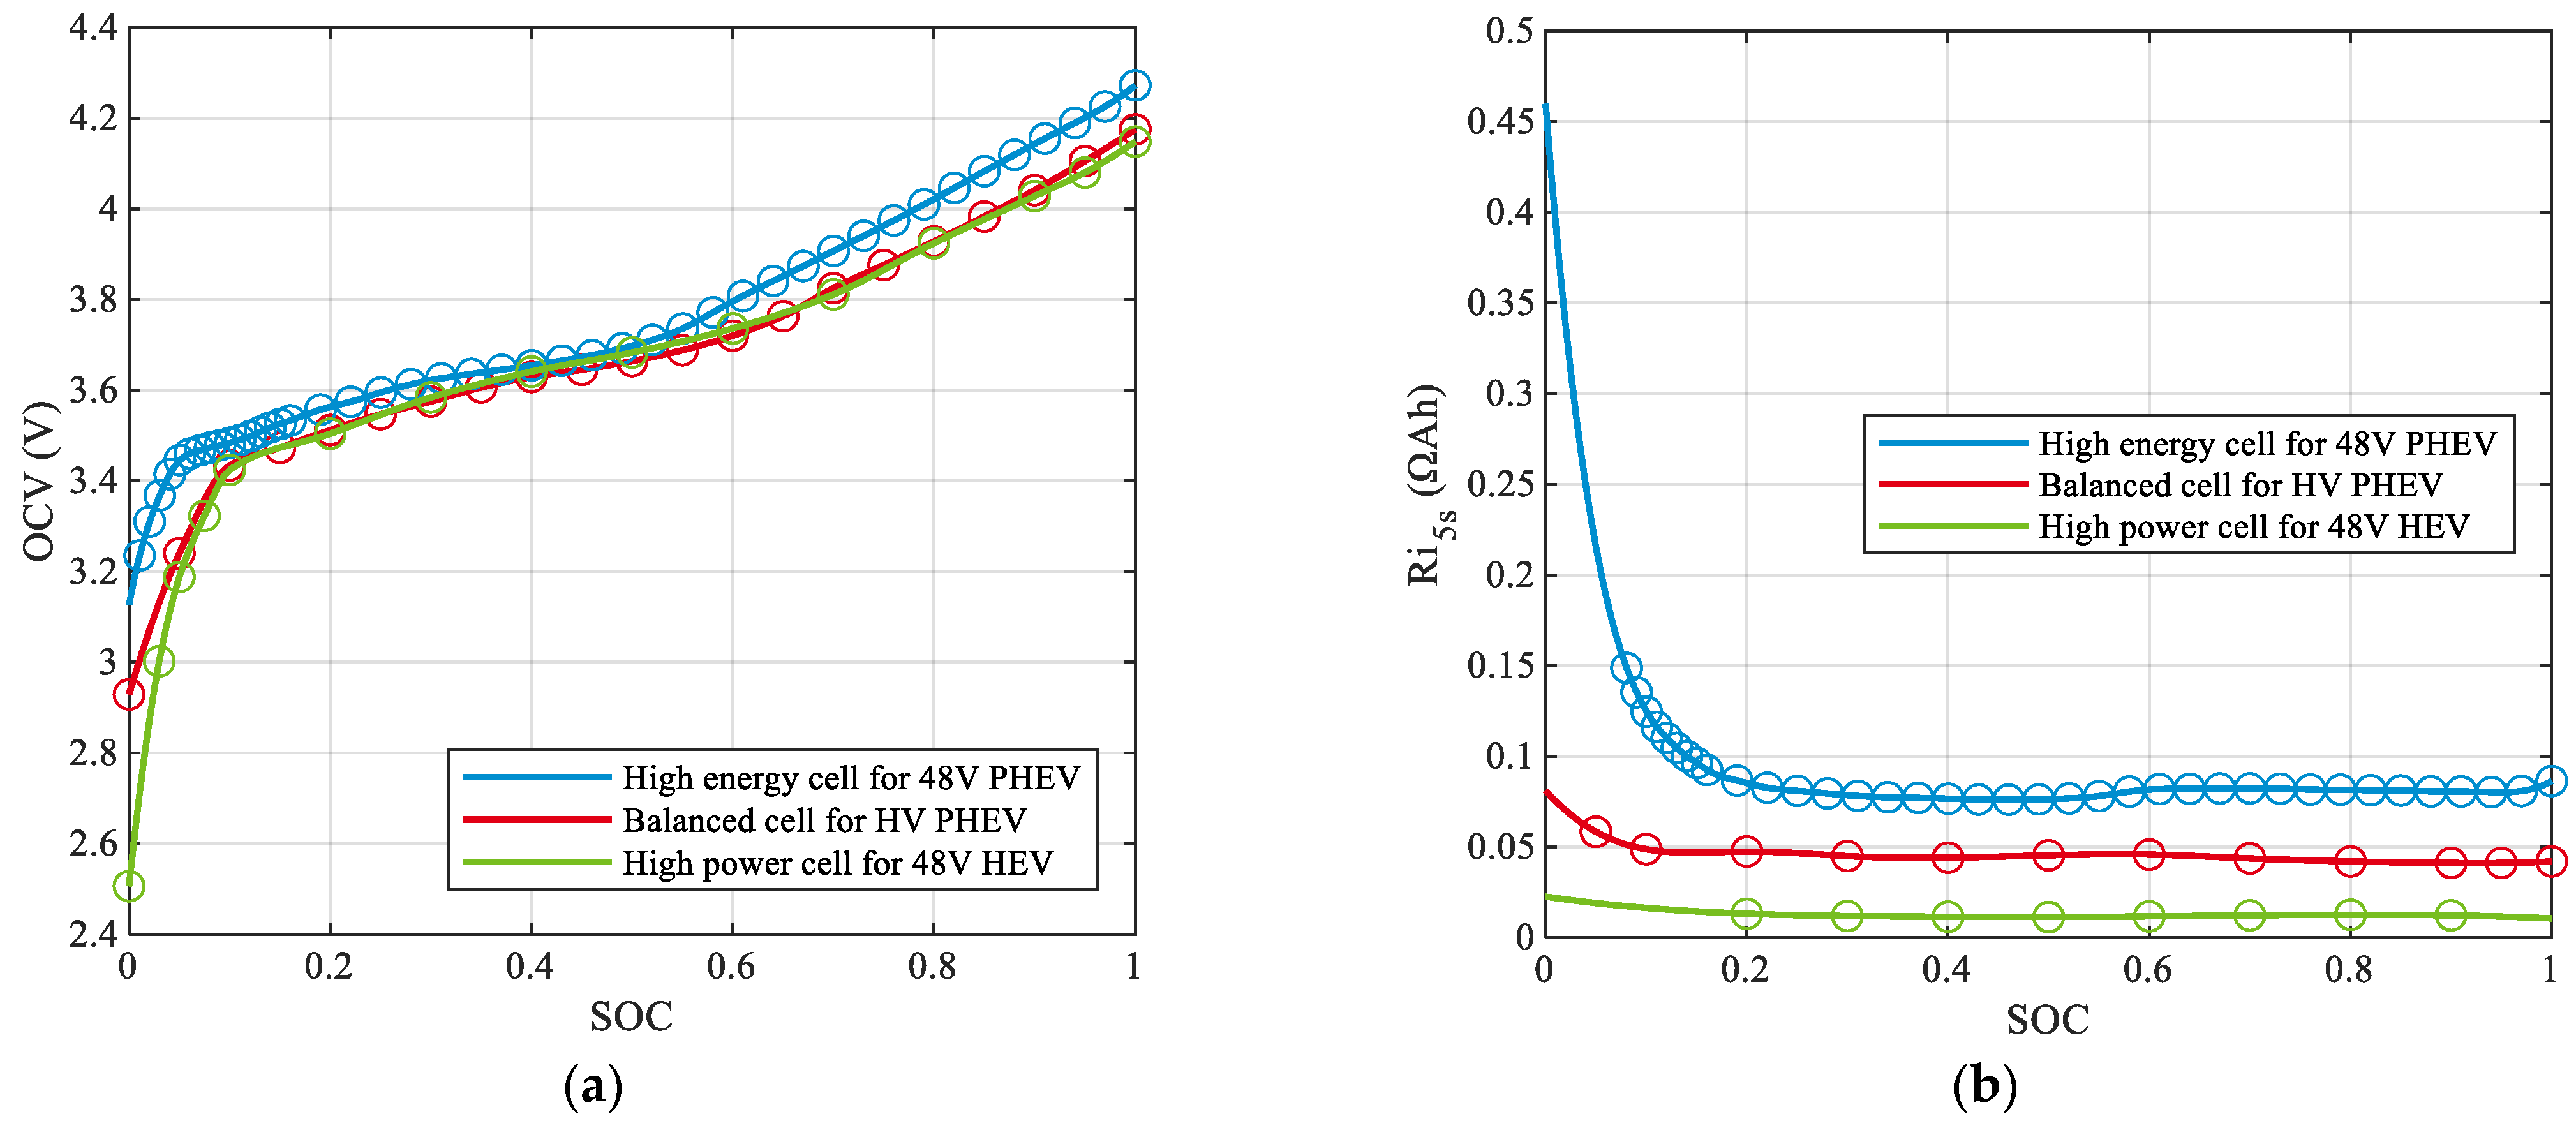
2.3. Battery Pack Modeling
2.4. Energy Management Strategies
2.5. Life Cycle Variables
3. Results of Year-Round LCA
3.1. EMS Influence
3.2. Influence of Investigated Year
3.3. Use Case Influence
3.4. Vehicle Class Influence
4. Discussion
4.1. Road towards Climate Neutrality and Potential of 48 V PHEVs
4.2. External Influencing Factors
5. Conclusions
Author Contributions
Funding
Conflicts of Interest
Nomenclature and Acronyms
| Frontal Area (m²) | |
| Positive acceleration (m/s2) | |
| / | Scaled/measured battery cell capacity (Ah) |
| Air resistance coefficient | |
| Distance of daily trip (m) | |
| Battery energy (kWh) | |
| Tire rolling resistance coefficient | |
| Gravitational acceleration (m/s²) | |
| Total fuel consumption (kg) | |
| Optimal cost-to-go function at timestep t (kg/s) | |
| Fuel consumption matrix (kg/s) | |
| Equivalent fuel consumption rate (kg/s) | |
| Fuel consumption rate (kg/s) | |
| // | Vehicle/vehicle base/electric powertrain without battery mass (kg) |
| Driving cycle steps | |
| Total number of trips for one driver | |
| / | number of serial/parallel cells |
| Proportional gain | |
| / | Maximum motoric/generator power (kW) |
| /// | 12 V electrical system/EM/ICE/Battery terminal power (W) |
| Lower heating value (J/kg) | |
| Charge-depleting range (m) | |
| scaled battery cell resistance (Ω) | |
| normalized cell resistance (ΩAh) | |
| Tire radius (m) | |
| /// | Battery upper limit/lower limit/current/target SOC |
| s-factor | |
| Initial s-factor | |
| Control input vector | |
| Vehicle speed (m/s) | |
| State vector | |
| Climbing angle | |
| Scaling factor | |
| /// | Gearbox/EM and Inverter/DCDC/charging efficiency |
| Equivalent rotational inertia (kgm²) | |
| Air density (kg/m³) | |
| Battery gravimetric energy density (kWh/kg) | |
| Power split between the EM and ICE | |
| A-ECMS | Adaptive-Equivalent Consumption Minimization Strategy |
| BEV | Battery electric vehicle |
| CD | Charge depleting |
| CS | Charge sustaining |
| DC | Direct current |
| DP | Dynamic Programming |
| EM | Electric machine |
| EMS | Energy management strategy |
| EU | European Union |
| GHG | Greenhouse gas |
| HEV | Hybrid electric vehicle |
| HV | High voltage |
| ICE | Internal combustion engine |
| LCA | Life cycle assessment |
| OCV | Open-circuit voltage |
| PHEV | Plug-in hybrid electric vehicle |
| RDE | Real-driving emission |
| RPA | Relative positive acceleration |
| SOC | State of charge |
| UF | Utility factor |
| WLTP | Worldwide Harmonized Light Vehicles Test Procedure |
References
- European Commission. Communication from the commission to the European Parliament, the European Council, the Council, the European Economic and Social Committee and the Committee of the Regions: The European Green Deal. COM(2019)640. 2019. Available online: https://www.eumonitor.eu/9353000/1/j9vvik7m1c3gyxp/vl4cnhyp1ort (accessed on 13 January 2022).
- Conway, G.; Joshi, A.; Leach, F.; García, A.; Senecal, P.K. A review of current and future powertrain technologies and trends in 2020. Transp. Eng. 2021, 5, 100080. [Google Scholar] [CrossRef]
- Ou, S.; Gohlke, D.; Lin, Z. Quantifying the impacts of micro- and mild-hybrid vehicle technologies on fleetwide fuel economy and electrification. eTransportation 2020, 4, 100058. [Google Scholar] [CrossRef]
- Benajes, J.; García, A.; Monsalve-Serrano, J.; Martínez-Boggio, S. Optimization of the parallel and mild hybrid vehicle platforms operating under conventional and advanced combustion modes. Energy Convers. Manag. 2019, 190, 73–90. [Google Scholar] [CrossRef]
- Dahodwala, M.; Joshi, S.; Dhanraj, F.; Ahuja, N.; Koehler, E.; Franke, M.; Tomazic, D. Evaluation of 48V and High Voltage Parallel Hybrid Diesel Powertrain Architectures for Class 6–7 Medium Heavy-Duty Vehicles. SAE Tech. Pap. 2021. [Google Scholar] [CrossRef]
- Enang, W.; Bannister, C. Modelling and control of hybrid electric vehicles (A comprehensive review). Renew. Sustain. Energy Rev. 2017, 74, 1210–1239. [Google Scholar] [CrossRef] [Green Version]
- Ali, A.M.; Söffker, D. Towards Optimal Power Management of Hybrid Electric Vehicles in Real-Time: A Review on Methods, Challenges, and State-Of-The-Art Solutions. Energies 2018, 11, 476. [Google Scholar] [CrossRef] [Green Version]
- Hu, X.; Han, J.; Tang, X.; Lin, X. Powertrain Design and Control in Electrified Vehicles: A Critical Review. IEEE Trans. Transp. Electrif. 2021, 7, 1990–2009. [Google Scholar] [CrossRef]
- Lauer, S.; Perugini, M.; Weldle, R.; Graf, F. 48 Volt High Power—Much More than a Mild Hybrid. In Proceedings of the 29th Aachen Colloquium Sustainable Mobility 2020, Aachen, Germany, 5–7 October 2020. [Google Scholar]
- Oechslen, H.; Binder, T.; Cramme, M.; Warth, M. Flexible 48-V Electrification with an Optimum Cost-benefit Ratio. ATZ Electron. Worldw. 2019, 14, 30–35. [Google Scholar] [CrossRef]
- Fritsch, K.-M.; Rieger, D.; Warth, M.; Scharrer, O. 48-V Drive Module for Electric Vehicles. MTZ Worldw. 2018, 79, 28–33. [Google Scholar] [CrossRef]
- Werra, M.; Kücükay, F. CO2-Analysis and Dimensioning of 48V Hybrid Drivetrains in Legal and Customer Based Cycles. In Proceedings of the 28th Aachen Colloquium Automobile and Engine Technology 2019, Aachen, Germany, 7–9 October 2019; pp. 1431–1448. [Google Scholar]
- Decker, L.; Förster, D.; Gauterin, F.; Doppelbauer, M. Physics-Based and Data-Enhanced Model for Electric Drive Sizing during System Design of Electrified Powertrains. Vehicles 2021, 3, 31. [Google Scholar] [CrossRef]
- Kapus, P.; Brendel, M.; Teuschl, G.; Pels, T. 48-V Plug-in Hybrid Vehicles for Inner-city Zero Emission. ATZ Worldw. 2019, 121, 26–33. [Google Scholar] [CrossRef]
- Song, Z.; Zhang, X.; Li, J.; Hofmann, H.; Ouyang, M.; Du, J. Component sizing optimization of plug-in hybrid electric vehicles with the hybrid energy storage system. Energy 2018, 144, 393–403. [Google Scholar] [CrossRef]
- Huang, Y.; Wang, H.; Khajepour, A.; Li, B.; Ji, J.; Zhao, K.; Hu, C. A review of power management strategies and component sizing methods for hybrid vehicles. Renew. Sustain. Energy Rev. 2018, 96, 132–144. [Google Scholar] [CrossRef]
- Mahmoodi-k, M.; Montazeri-Gh, M.; Madanipour, V. Simultaneous Multi-Objective Optimization of a PHEV Power Management System and Component Sizing in Real World Traffic Condition. Energy 2021, 233, 121111. [Google Scholar] [CrossRef]
- Xie, S.; Hu, X.; Zhang, Q.; Lin, X.; Mu, B.; Ji, H. Aging-aware co-optimization of battery size, depth of discharge, and energy management for plug-in hybrid electric vehicles. J. Power Sources 2020, 450, 227638. [Google Scholar] [CrossRef]
- Du, J.; Zhang, X.; Wang, T.; Song, Z.; Yang, X.; Wang, H.; Ouyang, M.; Wu, X. Battery degradation minimization oriented energy management strategy for plug-in hybrid electric bus with multi-energy storage system. Energy 2018, 165, 153–163. [Google Scholar] [CrossRef]
- Bansal, S.; Dey, S.; Khanra, M. Energy storage sizing in plug-in Electric Vehicles: Driving cycle uncertainty effect analysis and machine learning based sizing framework. J. Energy Storage 2021, 41, 102864. [Google Scholar] [CrossRef]
- Shaobo, X.; Qiankun, Z.; Xiaosong, H.; Yonggang, L.; Xianke, L. Battery sizing for plug-in hybrid electric buses considering variable route lengths. Energy 2021, 226, 120368. [Google Scholar] [CrossRef]
- Zhang, L.; Liu, W.; Qi, B. Energy optimization of multi-mode coupling drive plug-in hybrid electric vehicles based on speed prediction. Energy 2020, 206, 118126. [Google Scholar] [CrossRef]
- Plötz, P.; Funke, S.A.; Jochem, P.; Wietschel, M. CO2 Mitigation Potential of Plug-in Hybrid Electric Vehicles larger than expected. Sci. Rep. 2017, 7, 16493. [Google Scholar] [CrossRef]
- Plötz, P.; Funke, S.Á.; Jochem, P. Empirical Fuel Consumption and CO2 Emissions of Plug-In Hybrid Electric Vehicles. J. Ind. Ecol. 2018, 22, 773–784. [Google Scholar] [CrossRef] [Green Version]
- Onat, N.C.; Kucukvar, M.; Tatari, O. Conventional, hybrid, plug-in hybrid or electric vehicles? State-based comparative carbon and energy footprint analysis in the United States. Appl. Energy 2015, 150, 36–49. [Google Scholar] [CrossRef]
- Andersson, Ö.; Börjesson, P. The greenhouse gas emissions of an electrified vehicle combined with renewable fuels: Life cycle assessment and policy implications. Appl. Energy 2021, 289, 116621. [Google Scholar] [CrossRef]
- KBA. Inländerfahrleistung. Available online: https://www.kba.de/DE/Statistik/Kraftverkehr/VerkehrKilometer/vk_inlaenderfahrleistung/vk_inlaenderfahrleistung_node.html (accessed on 13 January 2022).
- Xia, H.; Li, T.; Wang, B.; He, P.; Chen, Y. Energy Management Optimization for Plug-In Hybrid Electric Vehicles Based on Real-World Driving Data. SAE Tech. Pap. 2019. [Google Scholar] [CrossRef]
- European Commission. Regulation (EU) 2017/1151 of the European Parliament and of the Council. Off. J. Eur. Union 2017, 175, 1–643. [Google Scholar]
- Hao, X.; Yuan, Y.; Wang, H.; Ouyang, M. Plug-in hybrid electric vehicle utility factor in China cities: Influencing factors, empirical research, and energy and environmental application. eTransportation 2021, 10, 100138. [Google Scholar] [CrossRef]
- Díaz, S. European Vehicle Market Statistics Pocketbook 2020/2021; The International Council on Clean Transportation: San Francisco, CA, USA, 2021. [Google Scholar]
- Carlson, R.B.; Wishart, J.; Stutenberg, K. On-Road and Dynamometer Evaluation of Vehicle Auxiliary Loads. SAE Int. J. Fuels Lubr. 2016, 9, 260–268. [Google Scholar] [CrossRef]
- Tian, Y.; Liu, J.; Yao, Q.; Liu, K. Optimal Control Strategy for Parallel Plug-in Hybrid Electric Vehicles Based on Dynamic Programming. World Electr. Veh. J. 2021, 12, 85. [Google Scholar] [CrossRef]
- Wang, X.; He, H.; Sun, F.; Zhang, J. Application Study on the Dynamic Programming Algorithm for Energy Management of Plug-in Hybrid Electric Vehicles. Energies 2015, 8, 3225–3244. [Google Scholar] [CrossRef] [Green Version]
- Cai, Y.; Ouyang, M.G.; Yang, F. Impact of power split configurations on fuel consumption and battery degradation in plug-in hybrid electric city buses. Appl. Energy 2017, 188, 257–269. [Google Scholar] [CrossRef]
- Zeng, Y.; Cai, Y.; Kou, G.; Gao, W.; Qin, D. Energy Management for Plug-In Hybrid Electric Vehicle Based on Adaptive Simplified-ECMS. Sustainability 2018, 10, 2060. [Google Scholar] [CrossRef] [Green Version]
- Bellman, R. Dynamic programming. Science 1966, 153, 34–37. [Google Scholar] [CrossRef] [PubMed]
- Sundstrom, O.; Guzzella, L. A generic dynamic programming Matlab function. In Proceedings of the 2009 IEEE Control Applications, (CCA) & Intelligent Control, (ISIC), St. Petersburg, Russia, 8–10 July 2009; pp. 1625–1630. [Google Scholar]
- Tang, B.; Xu, Y.; Wang, M. Life Cycle Assessment of Battery Electric and Internal Combustion Engine Vehicles Considering the Impact of Electricity Generation Mix: A Case Study in China. Atmosphere 2022, 13, 252. [Google Scholar] [CrossRef]
- Bieker, G. A Global Comparison of the Life-Cycle Greenhouse Gas Emissions of Combustion Engine and Electric Passenger Cars; The International Council on Clean Transportation: San Francisco, CA, USA, 2021. [Google Scholar]
- Nikolas, H.; Sofia, A.; Samantha, M.-P.; Tom, N.; Judith, B.; Hinrich, H.; Horst, F.; Kirsten, B.; Nabil, A.; Julius, J.; et al. Determining the Environmental Impacts of Conventional and Alternatively Fuelled Vehicles through LCA; Ricardo-AEA, ifeu, and E4tech report for the European Commission; Publications Office of the European Union: Luxembourg, 2020. [Google Scholar] [CrossRef]
- Bouter, A.; Guichet, X. The greenhouse gas emissions of automotive lithium-ion batteries: A statistical review of life cycle assessment studies. J. Clean. Prod. 2022, 344, 130994. [Google Scholar] [CrossRef]
- Prussi, M.; Yugo, M.; de Prada, L.; Padella, M.; Edwards, R.; Lonza, L. JEC Well-to-Tank Report v5, EUR 30269 EN; Publications Office of the European Union: Luxembourg, 2020. [Google Scholar] [CrossRef]
- European Environment Agency. Trends and Projections in Europe 2021; EEA Report; Publications Office of the European Union: Luxembourg, 2021. [Google Scholar]
- Paffumi, E.; de Gennaro, M.; Martini, G. Alternative utility factor versus the SAE J2841 standard method for PHEV and BEV applications. Transp. Policy 2018, 68, 80–97. [Google Scholar] [CrossRef]
- Plötz, P.; Moll, C.; Bieker, G.; Mock, P.; Li, Y. Real-World Usage of Plug-In Hybrid Electric Vehicles: Fuel Consumption, Electric Driving, and CO2 Emissions; The International Council on Clean Transportation: San Francisco, CA, USA, 2020. [Google Scholar]
- Wu, F.; Maier, J.; Yu, Y. Guidelines and trends for next-generation rechargeable lithium and lithium-ion batteries. Chem. Soc. Rev. 2020, 49, 1569–1614. [Google Scholar] [CrossRef]
- Mandev, A.; Plötz, P.; Sprei, F. The effect of plug-in hybrid electric vehicle charging on fuel consumption and tail-pipe emissions. Environ. Res. Commun. 2021, 3, 81001. [Google Scholar] [CrossRef]
- Huin, X.; Di Loreto, M.; Bideaux, E.; Benzaoui, H. Improving performance specifications of internal combustion engine dedicated to plug-in hybrid electric vehicles based on coupled optimization methodology. Trans. Inst. Meas. Control. 2021, 45, 1–12. [Google Scholar] [CrossRef]
- Jung, H. Fuel Economy of Plug-In Hybrid Electric and Hybrid Electric Vehicles: Effects of Vehicle Weight, Hybridization Ratio and Ambient Temperature. World Electr. Veh. J. 2020, 11, 31. [Google Scholar] [CrossRef] [Green Version]
- Feinauer, M.; Ehrenberger, S.; Epple, F.; Schripp, T.; Grein, T. Investigating Particulate and Nitrogen Oxides Emissions of a Plug-In Hybrid Electric Vehicle for a Real-World Driving Scenario. Appl. Sci. 2022, 12, 1404. [Google Scholar] [CrossRef]
- Wróblewski, P.; Kupiec, J.; Drożdż, W.; Lewicki, W.; Jaworski, J. The Economic Aspect of Using Different Plug-In Hybrid Driving Techniques in Urban Conditions. Energies 2021, 14, 3543. [Google Scholar] [CrossRef]


| Use Case | Annual Distance (km) | Recorded Distance (km) | Recorded Timespan (Days) | Days with Usage (Days) | Usage Frequency (Routes/Day) |
|---|---|---|---|---|---|
| Short-distance driver | 5314 | 4149 | 285 | 179 | 3.4 |
| Average driver | 12,862 | 10,078 | 286 | 171 | 4.1 |
| Long-distance driver | 31,930 | 31,930 | 365 | 287 | 4.2 |
| Commuter | 9410 | 8946 | 347 | 144 | 2.2 |
| Property | Symbol | Subcompact Class | Compact Class |
|---|---|---|---|
| Vehicle base weight (kg) | 1255 | 1565 | |
| Frontal area (m²) | 2.10 | 2.13 | |
| Air resistance coefficient | 0.265 | 0.250 | |
| Rolling resistance coefficient | 0.008 | 0.008 | |
| Tire radius (m) | 0.3065 | 0.3065 | |
| Equivalent rotational inertia (kgm²) | 1.1 | 1.1 | |
| Gearbox mechanical efficiency | 0.9 | 0.9 |
| Property | Symbol | Conv. | 48 V HEV | 48 V PHEV | HV PHEV |
|---|---|---|---|---|---|
| Electric powertrain weight (kg) | 0 | 36 | 50 | 50 | |
| Battery energy density (Wh/kg) | 0 | 55 | 130 | 95 | |
| Maximum motoric power (kW) | 0 | 20 | 20 | 100 | |
| Maximum generator power (kW) | 3 | 25 | 25 | 120 | |
| 12 V electrical system load (W) | 700 | 750 | 800 | 800 | |
| Combined EM/Inverter efficiency | 0.7 | 0.9 | 0.9 | 0.9 | |
| Converter efficiency | 1.00 | 0.95 | 0.95 | 0.95 | |
| Charge efficiency | - | - | 0.85 | 0.85 | |
| Battery upper SOC limit | - | 0.80 | 0.95 | 0.95 | |
| Battery lower SOC limit | - | 0.3 | 0.2 | 0.2 |
| 2020 | 2030 | |
|---|---|---|
| Conv./48 V HEV production (t CO2,eq/tvehicle) | 5.20 | 4.42 |
| PHEV production (t CO2,eq/tvehicle) | 5.70 | 4.85 |
| Battery production (kg CO2,eq/kWh) | 90 | 35 |
| Gasoline (g CO2,eq/MJ) | 90.4 | 90.4 |
| Electric energy (g CO2,eq/kWh) | 438 | 254 |
| System | 48 V PHEV | HV PHEV | ||||||||
|---|---|---|---|---|---|---|---|---|---|---|
| Year | 2020 | 2030 | 2020 | 2030 | ||||||
| EMS | DP | ECMS | DP | ECMS | DP | ECMS | DP | ECMS | ||
| Subcompact class | Capacity (kWh) | Short-distance driver | 8.3 | 12.0 | 14.6 | 15.2 | 11.0 | 15.3 | 18.9 | 20.5 |
| Average driver | 10.0 | 10.8 | 23.5 | 27.8 | 10.9 | 11.3 | 30.0 | 30.0 | ||
| Long-distance driver | 14.1 | 18.5 | 28.5 | 29.8 | 18.8 | 24.3 | 30.0 | 30.0 | ||
| Commuter | 15.0 | 15.3 | 30.0 | 30.0 | 18.9 | 20.7 | 30.0 | 30.0 | ||
| GHG (gCO2,eq/km) | Short-distance driver | 120 | 124 | 89 | 93 | 112 | 112 | 75 | 75 | |
| Average driver | 123 | 127 | 99 | 102 | 120 | 124 | 94 | 96 | ||
| Long-distance driver | 133 | 138 | 107 | 110 | 131 | 135 | 100 | 103 | ||
| Commuter | 128 | 132 | 99 | 102 | 125 | 128 | 91 | 93 | ||
| Compact class | Capacity (kWh) | Short-distance driver | 8.3 | 11.4 | 14.3 | 14.7 | 11.1 | 16.5 | 20.3 | 21.4 |
| Average driver | 10.2 | 11.0 | 22.0 | 22.3 | 12.0 | 12.6 | 30.0 | 30.0 | ||
| Long-distance driver | 13.6 | 17.9 | 26.9 | 28.5 | 19.8 | 26.7 | 30.0 | 30.0 | ||
| Commuter | 14.9 | 15.0 | 30.0 | 30.0 | 19.7 | 20.5 | 30.0 | 30.0 | ||
| GHG (gCO2,eq/km) | Short-distance driver | 142 | 146 | 109 | 113 | 128 | 129 | 87 | 87 | |
| Average driver | 139 | 143 | 113 | 117 | 134 | 138 | 105 | 107 | ||
| Long-distance driver | 149 | 154 | 122 | 125 | 145 | 149 | 111 | 114 | ||
| Commuter | 142 | 146 | 112 | 115 | 137 | 140 | 101 | 103 | ||
Publisher’s Note: MDPI stays neutral with regard to jurisdictional claims in published maps and institutional affiliations. |
© 2022 by the authors. Licensee MDPI, Basel, Switzerland. This article is an open access article distributed under the terms and conditions of the Creative Commons Attribution (CC BY) license (https://creativecommons.org/licenses/by/4.0/).
Share and Cite
Frambach, T.; Kleisch, R.; Liedtke, R.; Schwarzer, J.; Figgemeier, E. Environmental Impact Assessment and Classification of 48 V Plug-in Hybrids with Real-Driving Use Case Simulations. Energies 2022, 15, 2403. https://doi.org/10.3390/en15072403
Frambach T, Kleisch R, Liedtke R, Schwarzer J, Figgemeier E. Environmental Impact Assessment and Classification of 48 V Plug-in Hybrids with Real-Driving Use Case Simulations. Energies. 2022; 15(7):2403. https://doi.org/10.3390/en15072403
Chicago/Turabian StyleFrambach, Tobias, Ralf Kleisch, Ralf Liedtke, Jochen Schwarzer, and Egbert Figgemeier. 2022. "Environmental Impact Assessment and Classification of 48 V Plug-in Hybrids with Real-Driving Use Case Simulations" Energies 15, no. 7: 2403. https://doi.org/10.3390/en15072403