
Production Improvement via Optimization of Hydraulic Acid Fracturing Design Parameters in a Tight Carbonate Reservoir

1
School of Engineering, Asia Pacific University of Technology and Innovation (APU), Kuala Lumpur 57000, Malaysia
2
FACT Inc., 3345 State Street, Suite 3282, Santa Barbara, CA 93130, USA
3
Independent Consultant, Ahvaz 63187-14317, Iran
*
Author to whom correspondence should be addressed.
Energies 2022, 15(5), 1947; https://doi.org/10.3390/en15051947
Submission received: 11 December 2021
/
Revised: 18 January 2022
/
Accepted: 23 January 2022
/
Published: 7 March 2022
(This article belongs to the Special Issue Hydraulic Fracturing: Progress and Challenges)
Abstract
:Hydraulic fracturing can be utilized to extract trapped hydrocarbon where integrated fracture networks do not exist for sufficient production. In this work, design parameters of a hydraulic acid fracturing of a tight carbonate reservoir in the Middle East were optimized. The effect of optimized hydraulic fracturing on production performance and rate was investigated. Using the petrophysical well logs, formation integrity tests, core data the Mechanical Earth Model (MEM) of the tight carbonate reservoir was created, which resulted in rock mechanical properties and in-situ stresses. The other required parameters for fracturing design were either measured or found from empirical correlations. Following a candidate selection of suitable layers for fracturing, the input parameters were loaded in GOHFER software to design and optimize the fracturing job. Finally, the production forecast was performed and compared with current conditions. The injection parameters (flow rate, total volume, and number of stages) of the fracturing fluid (composed of guar and CMHPG and polymer with 15% HCL acid) were optimized to reach optimum resultant fracture geometry. Finally, optimized injection parameters were found at the injection flow rate of 18 barrels per minute, total injection volume of 90 K-gal, and three stages of injection. Using the optimal injection parameters, the optimized fracture geometrical sizes were determined: the fracture half-length (Lf): 148 m (486 ft), fracture height (Hf) of 64 m (210 ft) and fracture width (Wf) of 0.0962 in. Finally, the effect of this stimulation method on future production performance was investigated. The well production rate showed an increase from 840 STB/Day (before fracturing) to 1270 STB/Day (post fracturing). This study contributes to the practical design and optimization of hydraulic fracturing in the tight carbonate formation of the investigated oilfield and the other potential fields in the region. The results showed that this stimulation method can efficiently improve production performance from reservoir formation.
1. Introduction
Carbonates comprise many oil and gas reservoirs. There are several techniques to stimulate these reservoirs consisting of matrix acidizing, acid fracturing, and propped hydraulic fracturing [1]. The first two stimulation methods are based on the dissolvability of carbonates in acids. In carbonates, acid fracturing is preferred over matrix acidizing in low confining stress and hard and low-permeability rocks [2], the cited publication found the cut-off permeability as well, as was the case with [3]. Acid fracturing is also preferred over propped hydraulic fracturing particularly in offshore carbonates with high closure stresses [4,5] owing to its operational simplicity as well as the integrity of wellbore equipment and its lower cost [6].
Acid fracturing has shown to be an efficient stimulation method contributing to improving production conditions. Ref. [7] presented an equation for the well flow behavior and production following acid fracturing and discussed that fracture conductivity and thus the production rate may decrease with time due to the effect of the closure stress. Therefore, the post-fracturing production rate is controlled by the retained fracture conductivity [8]. In a modeling approach, ref. [9] developed a three-dimensional model to predict fluid flow and production following hydraulic acidizing in carbonates. Ref. [10] investigated the effects of both permeability and rock elastic properties on the overall conductivity of an acid fracture and attributed them to future production. This stimulation method has the advantage of changing the production regime from radial to linear flow.
Several researchers have investigated the positive effect of hydraulic acid fracturing on production rates [11,12,13,14,15,16]. Their evaluation of acid fracturing was an increase in the production rate, also mentioned by [17]. Ref. [18] showed high fracture conductivity (contributing to production rate), confirmed by pressure transient tests, following acid fracturing in Khuff carbonate formation in Saudi Arabia. Experimental analysis and field observations showed the positive effect of acid fracturing on fracture conductivity and possible production in deep carbonate reservoirs offshore Brazil [6]. Ref. [8] studied the effect of acid fracturing on fracture conductivity versus closure stress. Ref. [19] utilized field data to statically simulate production conditions from SW, Iran and reported their contribution to significant production increase. Ref. [20] showed considerable production improvement in carbonate reservoir fracturing using an acid fracturing combined with a proppant fracturing modeling approach.
Most wells of the oilfield from South-West, Iran studied in this paper, have been completed in the carbonate reservoir-A. The formation is a highly naturally fractured formation with a rather interconnected fracture network. Due to long exploitation from this reservoir formation (at least longer than six decades), excessive reservoir pressure depletion and production drop have been experienced particularly during the last two decades. As a compensating substitute option to sustain the production rate in the country, which is dependent on oil, exploitation from the underlying reservoir-B is under attention. Although this reservoir has a considerable original oil in place, it is considered a very tight and low-permeable carbonate formation (with limited or very low interconnected fractures network in the rock matrix). Production rates from this unconventional reservoir are low which may not be sometimes cost-effective. Based on past successful experiences with acid fracturing, multistage acid fracturing can be considered an effective method to produce from such tight reservoirs by creating interconnected fractures within the matrix which can intersect with natural fractured [21,22]. Previous few works about hydraulic acid fracturing of the tight carbonate reservoir studied in the region studied in this paper are very limited and are merely confined to feasibility studies or primary candidate well selection [20,23,24]. Therefore, this work fills the gap by presenting a first comprehensive and stepwise optimization design of an acid fracturing work in a tight carbonate reservoir of the Middle East, to the best knowledge of the authors.
The objective of this study is to study the effect of hydraulic fracturing in enhancing production rates from tight carbonate reservoirs in the Middle East. This was followed by the design and optimization of hydraulic fracturing parameters in a candidate well with a tight carbonate reservoir to find out its effect on production rate. The well was drilled and completed in reservoir-B in 2013. The completion or production mode was originally cased-hole through perforations made in the 5-in liner. The production rate ranged from 700 to 800 STB/Day with the wellhead pressure of 300 to 400 psig. In 2015, following extensive acidizing jobs, the production rate of the well was increased to 1000–1200 STB/Day, however, this was unstable and lasted only one to two months before production was halted. Since then, hydraulic fracturing was considered as another stimulation method to be implemented on this well. Though fracturing through the already existing perforated intervals is desired, it is also possible to perforate other intervals and fracture there.
To achieve the aforementioned objective, as the first step, the required input data was gathered, consisting of: rock and fluid properties, calibrated petrophysical well logs, and the geomechanical parameters. Therefore, mechanical earth modeling should be performed to obtain the geomechanical parameters calibrated with core data. Such geomechanical parameters evaluations allow the determination of reservoir response to fracturing fluid injections [25], as is the case with this work. Next, optimization of design injection parameters of hydraulic acid fracturing is performed to check and verify the success of the practical operation. This is carried out using a three-dimensional fracture model by GOHFER which uses a finite difference grid structure to describe the entire reservoir, and thus the optimum fracture geometry is found. The injection parameters consist of the injection rate, volume, and the number of stages that are optimized. Finally, having found the optimum fracture geometrical dimensions, the effect of hydraulic fracturing on production performance is found. The limitations of the work will be described and possible ways to remove these limitations will also be mentioned.
2. Input Parameters
The input parameters required for design and optimization of acid fracturing and production analysis, consist of well schematic and dimensions, rock properties including acid coefficients, fluid properties, acid concentration and type of polymer, geomechanical parameters, and production-related ones from South-West Iran.
Figure 1 shows the schematic of the investigated well with indicated tight carbonate reservoir and perforation intervals.
The required rock and fluid properties and production parameters are listed in Table 1.
3. Mechanical Earth Modeling
The geomechanical parameters required for hydraulic fracturing modeling were obtained following the construction of the mechanical Earth model (MEM). Figure 2 shows the workflow of construction of the MEM. The MEM was constructed using petrophysical well logs in Figure 3 (gamma ray, dipole sonic slowness, bulk density, neuron porosity, water saturation), formation lithology, measured Biot’s coefficient (0.6), measured pore pressure, and mud weight. The MEM was calibrated using core data, Leak-Off Test (LOT) data, field drilling observations, and image logs (Figure 4). The MEM results consist of estimated rock elastic moduli and strength (compressive and tensile) as well as values and directions of in-situ stresses (Figure 5).
For hydraulic fracturing design by GOHFER, using the MEM outputs, it is necessary to find other geomechanics-related parameters:
- ✓
- Friction angle (FANG):
It is correlated to porosity and shale volume by Plumb correlation [26,27]. In this tight hard formation, FANG was found to range from 40 to 50 degrees.
- ✓
- Brittleness Index (B):
Normalized Young’s modulus (
) is:
Normalized Poisson’s ratio () is:
- ✓
- Brittleness Factor (BRF):
BRF is defined as the ratio of the Young’s modulus () over Poisson’s ratio (). The greater the BRF of a rock is, the more appropriate it is for hydraulic fracturing.
- ✓
- Pore pressure offset:
Pore pressure offset is found as difference between the minimum horizontal stress and the pore pressure.
- ✓
- Stress offset (∆S):
Stress offset is found as the difference between the maximum and minimum horizontal stress (Shmin) and the maximum horizontal stress (SHMAX).
- ✓
- Process Zone Stress (PZS):
PZS is a directly measured pressure taken from the extension pressure and the closure pressure in a fracture injection test. Because the PZS includes effect of fluid lag, intact rock strength (tensile strength) and other nonlinear stress dissipations around the tip of the fracture, it is not related to only one property.
where:
PZSContrast = 1 (a relative amount between shale line and good porosity, e.g., 0.25)
PHIE Max (maximum porosity) = 0.25
- ✓
- Critical Fissure Opening Pressure (CFOP):
CFOP describes the amount of pressure offset above the minimum horizontal stress that is required to open natural fractures. The magnitude of CFOP which is approximately the same as PZS, is found by:
where CFOP Contrast = 1 and CFOP Max = 1500.
- ✓
- Transmissibility Factor (T):
Transmissibility is found as hydraulic conductivity () multiplied by reservoir thickness (h).
In addition, there are several indices which are found for sake of candidate selection only (discussed in the Results section).
- ✓
- Total Fracability Index (TFI):
TFI is term defined to be related to several factors: Fracability Index (FI), stress offset (∆S) and minimum horizontal stress (Shmin).
FI indicates how easily a fracture can close after initiation. Therefore, a good formation to frack is one which has a low FI. This term was attributed to Brittleness and Young’s modulus by several researchers [29,30,31] whereas [32] Mullen and Enderlin (2012) considered other important parameters as well (such as sedimentation and orientation of beddings). [29] Jin et al. (2014) proposed the following:
where Bn and En are the normalized Brittleness Index and Young’s modulus respectively:
TFI is found by [33]:
with the coefficients or assigned weights found from an Analytical Hierarchy Process AHP method [34].
- ✓
- Containment Index (CI):
If fractures migrate to underlying or overlying barriers, hydraulic fracturing will fail. Therefore, containment and limitation of the fracture height (Hf) is an important required feature particularly in massive fracturing jobs [35]. CI is related to linear elastic properties (particularly normalized Young’s modulus En), normalized shale volume (Vs), and minimum horizontal stress (Shmin):
- ✓
- Thickness Index (TI):
The thicker the layer to be fractured, the less the probability of fracture propagation to other layers (including aquifers). TI is found by dividing the layer thickness in meters by 100.
See Appendix A for tables of geomechanical units based on the aforementioned three indices.
4. Design and Optimization of Injection Parameters
Conventional design of hydraulic fracturing works was carried out using 2D models (PKN or GDK); however, 3D modeling is commonly used [1]. Therefore, in this work 3D modeling of the fracturing job was done by the GOHFER software. This software uses a finite difference grid structure to describe the entire reservoir which allows vertical and lateral variations, single and multiple perforated intervals, and bi-wing asymmetric fractures in order to accurately model even the most complex reservoirs.
After inserting the input data into GOHFER, the type of fracking fluid is determined. The injection fluid in hydraulic fracturing is composed of batches of acid and polymers pumped. The selected acid was 15% HCl acid and the polymer is CMHPG#35_Zr_180 (Carboxy Methyl Hydroxyl Propyl Guar). The acid to polymer volume pumped has a ratio of 60/40. Since the reservoir is very tight, special attention to increasing fluid viscosity is not essential as fluid leak-off to the formation tends to be low [36].
Next, following an arbitrary pumping schedule selection, the hydraulic fracture treatment is designed or simulated. The engine is run and the output parameters are displayed (bottom-hole pressure, well pressure, fracture length, fracture width, fracture height, injection rate, injection volume, etc.). Next, for sensitivity analysis, the pumping schedule is systematically changed, and the effect is investigated on hydraulic fracture growth behavior. This is performed to identify the optimal pump injection rate, pumped volume, and number of stages [37,38]. This sensitivity analysis is for the purpose of optimization of injection parameters in order to reach fracture geometrical parameters which can result in high enough production performance.
5. Results and Discussion
The results fall into four findings of the work: candidate selection, estimation of the breakdown pressure, optimization of the injection parameters and schedule, and evaluation of the effect of hydraulic fracturing on production performance with limitations mentioned:
5.1. Candidate Selection
To find the desired perforation interval for acid fracturing, the candidate selection indices or criteria are compared, as shown in Figure 6. Based on this figure and Table 2 (while using guide tables in the Appendix A), the first perforation interval and the third perforation interval have rather moderate quality for the interested indices whereas the second perforation interval has low or weak quality of indices for fracturing. Therefore, the first and third intervals are the optimum candidates recommended for hydraulic fracturing. Despite that, there is another zone of 3555–3620 m (11,664–11,877 ft) which has better candidate selection indices. Since this zone is not perforated, it cannot be practically used for fracturing and was not thus considered.
5.2. Breakdown Pressure
Breakdown pressure is the maximum pressure required for complete rock failure. This pressure is greater than the minimum horizontal stress required to open the fracture. Using the MEM model, the breakdown pressure at 3600 m (11,811 ft) is about 17,000 psi (see Figure 7). This means it is necessary that the pressure rating of wellheads and surface installations exceed 20 K-psi.
5.3. Optimum Injection Parameters and Fracture Geometry
Optimization of injection fluid volume is important for technical, cost, and environmental reasons. Therefore, injection of more than enough (acid and polymer) fluid volume is prevented, while maintaining high production performance. The other advantage is lower environmental concerns.
To find the optimized fracture geometrical sizes (half-length Lf; height Hf; and width Wf), it is required to determine the injection parameters of the fracturing fluid (polymer pads and acid batches). These parameters are (a) optimum injection flow rate, (b) optimum injection volume, and (c) optimum number of stages required.
5.3.1. Optimum Injection Rate
Figure 8 illustrates the injection rate (of polymer pads and acids) versus fracture size. The injection rate of 18 BPM (barrel per minute) is selected as the optimum as it creates the largest Lf and particularly Wf. The magnitude of Wf has the greatest effect on fracture permeability and conductivity [39]. To provide the 18 BPM rate in the operation, three pump trucks are required (with one standby pump truck). It is noted that the selection of greater injection rates also has another disadvantage of resulting in the surface applied pressures exceeding working pressures of wellhead and surface installations.
5.3.2. Optimum Injection Fluid Volume
Next, the optimized total fluid volume must be essentially found at a constant injection rate of 18 BPM. To do that, the volume was increased gradually from 10 K-gal to 300 K-gal. In each case, the fracture geometrical sizes are found and compared in Figure 9. Based on this figure, the total injection volume of 90 K-gal is found as the optimum injection fluid volume. This is because, at this volume, the greatest effect on fracture width (Wf) is observed. Wf is the parameter with the greatest effect on fracture conductivity and thus well productivity. Therefore, the selection of a greater injection volume does not only have a positive effect on Wf, but also causes extra costs for the job.
5.3.3. Optimum Number of Stages
Following the selection of the optimum injection rate and total fluid volume, it is required to find the optimum number of injection stages. To do that, while maintaining the injection flow rate and total fluid volume constant, the number of stages is increased from 3 to 10. The optimum number of stages is selected three (3) based on Figure 10. With this number of stages, we have the greatest effect on Wf and fracture conductivity. With the number of six (6) stages, the fracture geometrical sizes are similar or slightly better than those with three stages. However, there is no need to make the fracturing fluid system sequences complex by adding further stages.
Using all the sensitivity analyses and optimization, the final optimized fracture geometrical sizes are presented in Table 3:
Following optimization of injection parameters, Figure 11 and Figure 12 present the final optimum pumping schedule for the hydraulic fracturing job respectively in tabular and graphical forms. Each stage consists of a polymer fluid batch pumped followed by an acid batch pumped. The final pump schedule profile with optimized parameters is shown in Figure 13. Based on the figure, in the first stage, when the polymer (a combination of guar and CMHPG) is pumped, a fracture is initiated which is indicated by Lf and Wf increase. This is achieved by high enough pump pressure (signaled by an increase in the bottom hole pressures). Following injection of the initial polymer fluid, at the time of 16 min, the first acid batch is pumped to enter the fracture system. In this interval, Lf increases slightly (depending on injection rate, acid reaction rate, and loss rate); however, Wf starts to greatly increase due to acid reaction and dissolution in the created fracture. This continues for the period of 23:49 min when Wf reaches its maximum with Lf and well pressure being constant. Following fracture initiation, Hf remained constant at 64 m (210 ft). This is a positive indication as the more confined the fracture is, the lower the possibility of propagation of fractures to unwanted layers or aquifers. In the next stages, each time the polymer is pumped, fracture length increases, but the fracture width slightly reduces (i.e., slight closing of the fracture aperture). Similarly, when the acid batch is pumped, the fracture width increases. It is noted that in the next stages, the pumped polymer fluid behaves a bit differently from the first stage. Unlike the first stage, when the polymer fluid is involved in initiating a fracture in the formation (Lf and Wf increase), in the next stages the polymer fluid is involved in propagating the fracture (increase in Lf and decrease in Wf). The decrease in Wf occurs in accordance with the mass conservation law. It is noted that the acid batch pumped in the next stages behaves the same way as in the first stage.
5.4. Effect on Production Performance
The production condition before hydraulic fracturing job is with flow rate 840 STB/D and bottom-hole pressure of 4425 psi, as shown in Figure 13.
To investigate the effect of the hydraulic fracture on production performance, the modelled fracture geometrical sizes together with other rock and fluid data are entered into PIPESIM.
The permeability of the created fracture is not really known; therefore, a sensitivity analysis is run on that. The value of 10 D is considered a poor fracture permeability. Therefore, if the hydraulic fracturing is executed well enough, it is assumed that the created fracture has at least 50 D fracture permeability.
Next, the production parameters/conditions from the reservoir incorporating the hydraulic fractures were simulated and shown in Figure 14. Since fracture permeability is not known, its effect is investigated on the production conditions using sensitivity analysis (shown in Figure 14 and Table 4).
Comparing the production results Figure 10 and Figure 11, it is inferred that the production conditions show to improve considerably with an increase in production flow rate from 840 STB/D to 1270 STB/D (assuming an average value of 50 D for the fracture permeability). This is identical to a 51% increase in the production rate by virtue of hydraulic fracturing, which is a considerable production improvement.
There are some limitations in evaluating the post-fracturing production. First, a static prediction of the effect of acid fracturing on the tight carbonate was performed. Next, the fracture permeability was assumed 50 D based on the field experience of the authors, but that causes some uncertainty in the evaluation. Therefore, it is important to use dynamic production modeling software packages in order to improve the prediction of the effect of time on fracture aperture, and thus production rate.
6. Summary Conclusions and Future Work
In this work, the design and optimization of acid fracturing were considered in order to provide increased production from the unconventional Middle Eastern tight reservoir-B carbonate (with a limited fractures network in its rock matrix). Having performed a candidate zone selection, the pumping parameters of the fracturing fluid (composed of guar, CMHPG, and polymer with 15% HCL acid) were optimized to reach optimum resultant fracture geometry. Our study has resulted in the following conclusions:
- Using the MEM model results, the required breakdown pressure for Middle Eastern carbonate rocks at depth of 3600 m (11,811 ft) was about 17,000 psi, which would require three pump trucks.
- The optimized injection parameters were found: the optimal rate was 18 barrels per minute, the total injection volume was 90 K-gal (2143 bbl), and the optimal number of stages of injection was three. Using the optimized injection parameters, the optimized fracture geometrical sizes were determined: the fracture half-length (Lf): 148 m (486 ft), fracture height (Hf) of 64 m (210 ft) and fracture width (Wf) of 0.0962 in.
- The well production rate showed to increase from 840 STB/Day (before fracturing) to 1270 STB/Day (after fracturing), which shows 51% increase in production rate. For further confirmation, the application/extension of this specific study to other sites is planned as future studies.
- As a limitation of this work, a static prediction of the effect of acid fracturing on the tight carbonate was performed. In future work, a dynamic post-fracturing simulation should be performed to investigate possible time-based closing of the created fractures in reservoir-B. There is also an uncertainty in the fracture permeability. As another future study, the comparison of acid fracturing with proppant fracturing is important in this formation.
- Using past hydraulic acid fracturing data, the application of machine learning techniques and algorithms is also recommended to further optimize the operational parameters [40].
Author Contributions
Conceptualization, R.A.; Investigation, R.A.; Software, R.A. and A.K.; Writing—review & editing, F.A. All authors have read and agreed to the published version of the manuscript.
Funding
This research received no external funding.
Institutional Review Board Statement
Not applicable.
Informed Consent Statement
Not applicable.
Data Availability Statement
Not applicable.
Acknowledgments
The authors wish to appreciate G. A. Safian and R. Salehi for their constructive comments and consultations during the course of this project.
Conflicts of Interest
The authors declare no conflict of interest.
Nomenclature
| B | Brittleness index |
| BRF | Brittleness Factor |
| CFOP | Critical Fissure Opening Pressure |
| BHP | Bottomhole Pressure |
| CI | Containment Index |
| CMHPG | Carboxy Methyl Hydroxyl Propyl Guar |
| E | Young’s modulus [pa] or [psi] |
| FANG | Internal friction angle [deg] |
| FI | Fracability Index |
| Hf | Fracture height [m] or [ft] |
| Kf | Fracture permeability [D] |
| Lf | Fracture length [m] or [ft] |
| LOT | Leak-Off Test |
| MEM | Mechanical Earth Model |
| PZS | Process Zones Stress [pa] or [psi] |
| Q | Production rate [STB/Day] |
| Minimum horizontal (in-situ) stress | |
| Maximum horizontal (in-situ) stress | |
| STB/Day | Stock-tank barrel per day (rate of production) |
| Stress offset [pa] or [psi] | |
| TFI | Total Fracability Index |
| TI | Thickness Index |
| Vs | Shale volume |
| Wf | Fracture width [in] |
| Poisson’s ratio | |
| n (subscript) | Normalized |
Appendix A
Tables of qualitative classification of layers based on three criteria indices:

Table A1.
Geomechanical units based on Total Fracability Index (TFI).
| Fracability Index (FI) | Qualitative Rank | Geomechanical Unit |
|---|---|---|
| 0–0.2 | Very Weak | GMU-1 |
| 0.2–0.3 | Weak | GMU-2 |
| 0.3–0.37 | Weak | GMU-3 |
| 0.37–0.45 | Moderate | GMU-4 |
| 0.45–0.52 | Moderate | GMU-5 |
| 0.52–0.6 | Moderate | GMU-6 |
| 0.6–0.7 | Good | GMU-7 |
| 0.7–1 | Very Good | GMU-8 |
Table A2.
Geomechanical units based on Containment Index (CI).
| Thickness Index (TI) | Qualitative Rank |
|---|---|
| 0–0.2 | Very Weak |
| 0.2–0.35 | Weak |
| 0.35–0.5 | Moderate |
| 0.5–0.7 | Good |
| 0.7–1 | Very Good |
Table A3.
Geomechanical units based on Thickness Index (TI).
| Layer Thickness [m] | Thickness Index (TI) | Qualitative Rank |
|---|---|---|
| 0–5 | 0–0.05 | Very Weak |
| 5–20 | 0.05–0.2 | Weak |
| 20–50 | 0.2–0.5 | Moderate |
| 50–100 | 0.5–1 | Good |
| >100 | >1 | Very Good |
References
- Economides, M.J.; Nolte, K.G. Reservoir Stimulation, 3rd ed.; John Wiley and Sons: Hoboken, NJ, USA, 2000. [Google Scholar]
- Schwalbert, M.P.; Aljawad, M.S.; Hill, A.D.; Zhu, D. Decision Criterion for Acid Stimulation Method in Carbonate Reservoirs: Matrix Acidizing or Acid Fracturing? In Proceedings of the SPE International Conference and Exhibition on Formation Damage Control, Lafayette, LA, USA, 19–21 February 2020. [Google Scholar] [CrossRef]
- Daneshy, A.; Valkó, P.; Norman, L. Well Stimulation. In Petroleum Well Construction; Economides, M.J., Watters, L.T., Dunn-Norman, S., Eds.; Wiley: New York, NY, USA, 1998; Chapter 17. [Google Scholar]
- Neumann, L.F.; Oliveira, T.J.; Fernandes, P.D.; de Oliveira e Sousa, J.L.; Brandão, E.M. Building Acid Frac Conductivity in Highly-Confined Carbonates. In Proceedings of the Society of Petroleum Engineers—SPE Hydraulic Fracturing Technology Conference, The Woodlands, TX, USA, 6–8 February 2012. [Google Scholar] [CrossRef]
- Azevedo, C.T.; Rosolen, M.A.; Rocha, J.D.H.; Neumann, L.F.; Melo, R.C.L. Challenges Facedto Execute Hydraulic Fracturing in Brazilian Pre-Salt Wells; American Rock Mechanics Association: Alexandria, VA, USA, 2010. [Google Scholar]
- Oliveira, T.J.L.; Neumann, L.F.; Azevedo, C.T. Acid or Propped Fracturing in Deep Carbonates? Experiments and Field Results. In Proceedings of the Society of Petroleum Engineers—SPE International Symposium and Exhibition on Formation Damage Control, Lafayette, LA, USA, 19–21 February 2014. [Google Scholar] [CrossRef]
- Ali, S.A.; Kalfayan, L.; Montgomery, C. Acid Stimulation; SPE Monograph Series; Society of Petroleum Engineers: Richardson, TX, USA, 2016; Volume 26, ISBN 978-1-61399-426-9. [Google Scholar]
- Suleimenova, A.; Wang, X.; Zhu, D.; Hill, A.D. Comparative Study of Acid Fracturing and Propped Hydraulic Fracturing for a Tight Carbonate Formation. In Proceedings of the SPE EUROPEC Featured at 78th EAGE Conference and Exhibition, Vienna, Austria, 30 May–2 June 2016. [Google Scholar] [CrossRef]
- Oeth, C.V.; Hill, A.D.; Zhu, D. Acid Fracture Treatment Design with Three-Dimensional Simulation. In Proceedings of the SPE Hydraulic Fracturing Technology Conference, The Woodlands, TX, USA, 4–6 February 2014. [Google Scholar] [CrossRef]
- Deng, J.; Mou, J.; Hill, A.D.; Zhu, D. A New Correlation of Acid Fracture Conductivity Subject to Closure Stress. In Proceedings of the SPE Hydraulic Fracturing Technology Conference, The Woodlands, TX, USA, 24–26 January 2011. [Google Scholar] [CrossRef]
- Chong, K.K.; Grieser, B.; Jaripatke, O.; Passman, A. A Completion Roadmap to Shale-Play Development. In Proceedings of the CPS/SPE International Oil & Gas Conference and Exhibition, Beijing, China, 8–10 June 2010. SPE 130369. [Google Scholar] [CrossRef]
- King, G.E. Thirty Years of Gas Shale Fracturing. In Proceedings of the SPE Annual Technical Conference and Exhibition, Florence, Italy, 19–22 September 2010. SPE 133456. [Google Scholar] [CrossRef]
- King, G.E. 60 Years of Multi-Fractured Vertical, Deviated and Horizontal Wells: What Have We Learned? In Proceedings of the SPE Annual Technical Conference and Exhibition, Amsterdam, The Netherlands, 27–29 October 2014. SPE 17095. [Google Scholar] [CrossRef]
- Allix, P.; Burnham, A.; Fowler, T.; Herron, M.; Kleinberg, R.; Symington, B. Coaxing oil from shale. Oilfield Rev. 2011, 22, 4–16. [Google Scholar]
- Baihly, J.D.; Malpani, R.; Edwards, C.; Han, S.Y.; Kok, J.C.; Tollefsen, E.M.; Wheeler, C.W. Unlocking the Shale mystery: How Lateral Measurements and Well Placement Impact Completions and Resultant Production. In Proceedings of the SPE Annual Technical Conference and Exhibition, Florence, Italy, 19–22 September 2010. SPE 138427. [Google Scholar] [CrossRef]
- Manchanda, R.; Sharma, M.M. Impact of Completion Design on Fracture Complexity in Horizontal Shale Wells. SPE Drill. Complet. 2014, 29, 78–87. [Google Scholar] [CrossRef]
- Kalfayan, L. Production Enhancement with Acid Stimulation, 2nd ed.; PennWell Corporation: Nashville, TN, USA, 2008; ISBN 978-1593703844. [Google Scholar]
- Rahim, Z.; Ahmed, M.S. Analysis of Long-Term Production Performance in Acid-Fractured Carbonate Wells. In Proceedings of the SPE Annual Technical Conference and Exhibition, Dallas, TX, USA; 2005. [Google Scholar] [CrossRef]
- Heydarabadi, F.R.; Moghadasi, J.; Safian, G.; Ashena, R. Criteria for Selecting a Candidate Well for Hydraulic Fracturing. In Proceedings of the Nigeria Annual International Conference and Exhibition, Tinapa-Calabar, Nigeria, 31 July–7 August 2010. SPE 136988. [Google Scholar] [CrossRef]
- Bale, A.; Smith, M.B.; Henry, H.K. Stimulation of Carbonates Combining Acid Fracturing with Proppant (CAPF): A Revolutionary Approach for Enhancement of Sustained Fracture Conductivity and Effective Fracture Half-Length. In Proceedings of the SPE Annual Technical Conference and Exhibition, Florence, Italy, 19–22 September 2010. [Google Scholar] [CrossRef]
- Blanton, T.L. Propagation of Hydraulically and Dynamically Induced Fractures in Naturally Fractured Reservoirs. In Proceedings of the SPE Unconventional Gas Technology Symposium, Louisville, KY, USA, 18–21 May 1986. SPE 15261-MS. [Google Scholar] [CrossRef]
- Guo, J.C.; Luo, B.; Zhao, X.; Zhu, H.A. Numerical simulation of interaction of hydraulic fracture and natural fracture based on the cohesive zone finite element method. J. Nat. Gas Sci. Eng. 2015, 25, 180–188. [Google Scholar] [CrossRef]
- Shadizadeh, S.R.; Habibnia, B.; Syllabee, R. Investigation and selection of suitable layers in Bangestan reservoir for hydraulic fracturing operation. Sceitia Iran. Trans. C Chem. Chem. Eng. 2009, 16, 149–160. [Google Scholar]
- Heydarabadi, F.R.; Moghadasi, J.; Safian, G.A. Hydraulic Fracturing in Iran-Lessons from Four Case Histories. In Proceedings of the SPE Production and Operations Conference and Exhibition, Tunis, Tunisia, 8–10 June 2010. [Google Scholar] [CrossRef]
- Aminzadeh, F. Hydraulic Fracturing. In Fossil Energy. Encyclopedia of Sustainability Science and Technology Series; Malhotra, R., Ed.; Springer: New York, NY, USA, 2020. [Google Scholar] [CrossRef]
- Plumb, R. Influence of composition and texture on the failure properties of clastic rocks. In Proceedings of the SPE 28022-MS, Rock Mechanics in Petroleum Engineering, Delft, The Netherlands, 29–31 August 1994. [Google Scholar]
- Ashena, R.; Elmgerbi, A.; Rasouli, V.; Ghalambor, A.; Rabiei, M.; Bahrami, A. Severe wellbore instability in a complex lithology formation necessitating casing while drilling and continuous circulation system. J. Pet. Explor. Prod. Technol. 2020, 10, 1511–1532. [Google Scholar] [CrossRef] [Green Version]
- Rickman, R.; Mullen, M.; Petre EGrieset, B.; Kundert, D. A Practical Use of Shale Prtrophysics for Stimulation Design Optimization: All Shale Plays Are Not Clones of the Barnett Shale. In Proceedings of the SPE ATCE, Denver, CO, USA, 21–24 September 2008. SPE 115258. [Google Scholar] [CrossRef] [Green Version]
- Jin, X.; Shah, S.N.; Roegiers, J.C. Fracability evaluation in shale reservoirs—An integrated petrophysics and geomechanics approach. SPE J. 2014, 20, 518–526. [Google Scholar] [CrossRef]
- Sun, J.M.; Han, Z.L.; Qin, R.B.; Zhang, J. Log evaluation method of fracturing performance in tight gas reservoir. Acta Pet. Sin. 2015, 36, 74–80, (In Chinese with English Abstract). [Google Scholar] [CrossRef]
- Li, J.; Li, X.-R.; Zhan, H.-B.; Song, M.-S.; Liu, C.; Kong, X.-C.; Sun, L.-N. Modified method for fracability evaluation of tight sandstones based on interval transit time. Pet. Sci. 2020, 17, 477–486. [Google Scholar] [CrossRef] [Green Version]
- Mullen, M.J.; Enderlin, M.B. Fracability Index—More Than Rock Properties. In Proceedings of the SPE Annual Technical Conference and Exhibition, San Antonio, TX, USA, 8–10 October 2012. SPE 159755. [Google Scholar] [CrossRef]
- Zhang, F.; Zhang, H.; Yuan, F.; Wang, Z.; Chen, S.; Li, C.; Han, X. Geomechanical Mechanism of Hydraulic Fracturing and Fracability Evaluation of Natural Fractured Tight Sandstone Reservoir in Keshen Gasfield in Tarim Basin. In Proceedings of the Abu Dhabi International Petroleum Exhibition and Conference, Abu Dhabi, United Arab Emirates, 9–12 November 2015. SPE 177457. [Google Scholar] [CrossRef]
- Dagdeviren, M. Decision making in equipment selection: An integrated approach with AHP and PROMETHEE. J. Intell. Manuf. 2008, 19, 376–406. [Google Scholar] [CrossRef]
- Simonson, E.R.; Abou-Sayed, A.S.; Clifton, R.J. Containment of Massive Hydraulic Fractures. SPE J. 1978, 18, 27–32. [Google Scholar] [CrossRef]
- Mata, D.; Zhou, Y.; Ma, Y.Z.; Gonzales, V. Hydraulic Fracture Treatment, Optimization, and Production Modeling. In Unconventional Oil and Gas Resources Handbook; Ma, Y.Z., Holditch, S.A., Eds.; Gulf Professional Publishing: Woburn, MA, USA, 2016; Chapter 8; pp. 215–242. ISBN 9780128022382. [Google Scholar] [CrossRef]
- Leguizamon, J.; Aguilera, R. Hydraulic Fracturing of Naturally Fractured Tight Gas Formations. In Proceedings of the SPE Middle East Unconventional Gas Conference and Exhibition, Muscat, Oman, 31 January–2 February 2011. SPE 142727-MS. [Google Scholar] [CrossRef]
- Langbauer, C.; Herbert, H.; Albina, M. Bio Enhanced Energy Recovery Technology for Clean and Efficient Energy Production. In Proceedings of the SPE Asia Pacific Oil and Gas Conference and Exhibition, Brisbane, Australia, 23–25 October 2018. SPE 192122. [Google Scholar] [CrossRef]
- Corbett, P. Is Our Carbonate Reservoir Fractured or not? Adapted from 2013–2014 AAPG Foundation Distinguished Lecture. 2014. Available online: http://www.searchanddiscovery.com/pdfz/documents/2014/41485corbett/ndx_corbett.pdf.html (accessed on 12 August 2020).
- Rezaei, R.; Aminzadeh, F.; Von Lunen, E. Applications of Machine Learning for Estimating the Stimulated Reservoir Volume (SRV) URTeC: 5537. In Proceedings of the Unconventional Resources Technology Conference, Houston, TX, USA, 26–28 July 2021. [Google Scholar]
Figure 1.
Well schematic with indicated tight carbonate reservoir and perforations intervals.
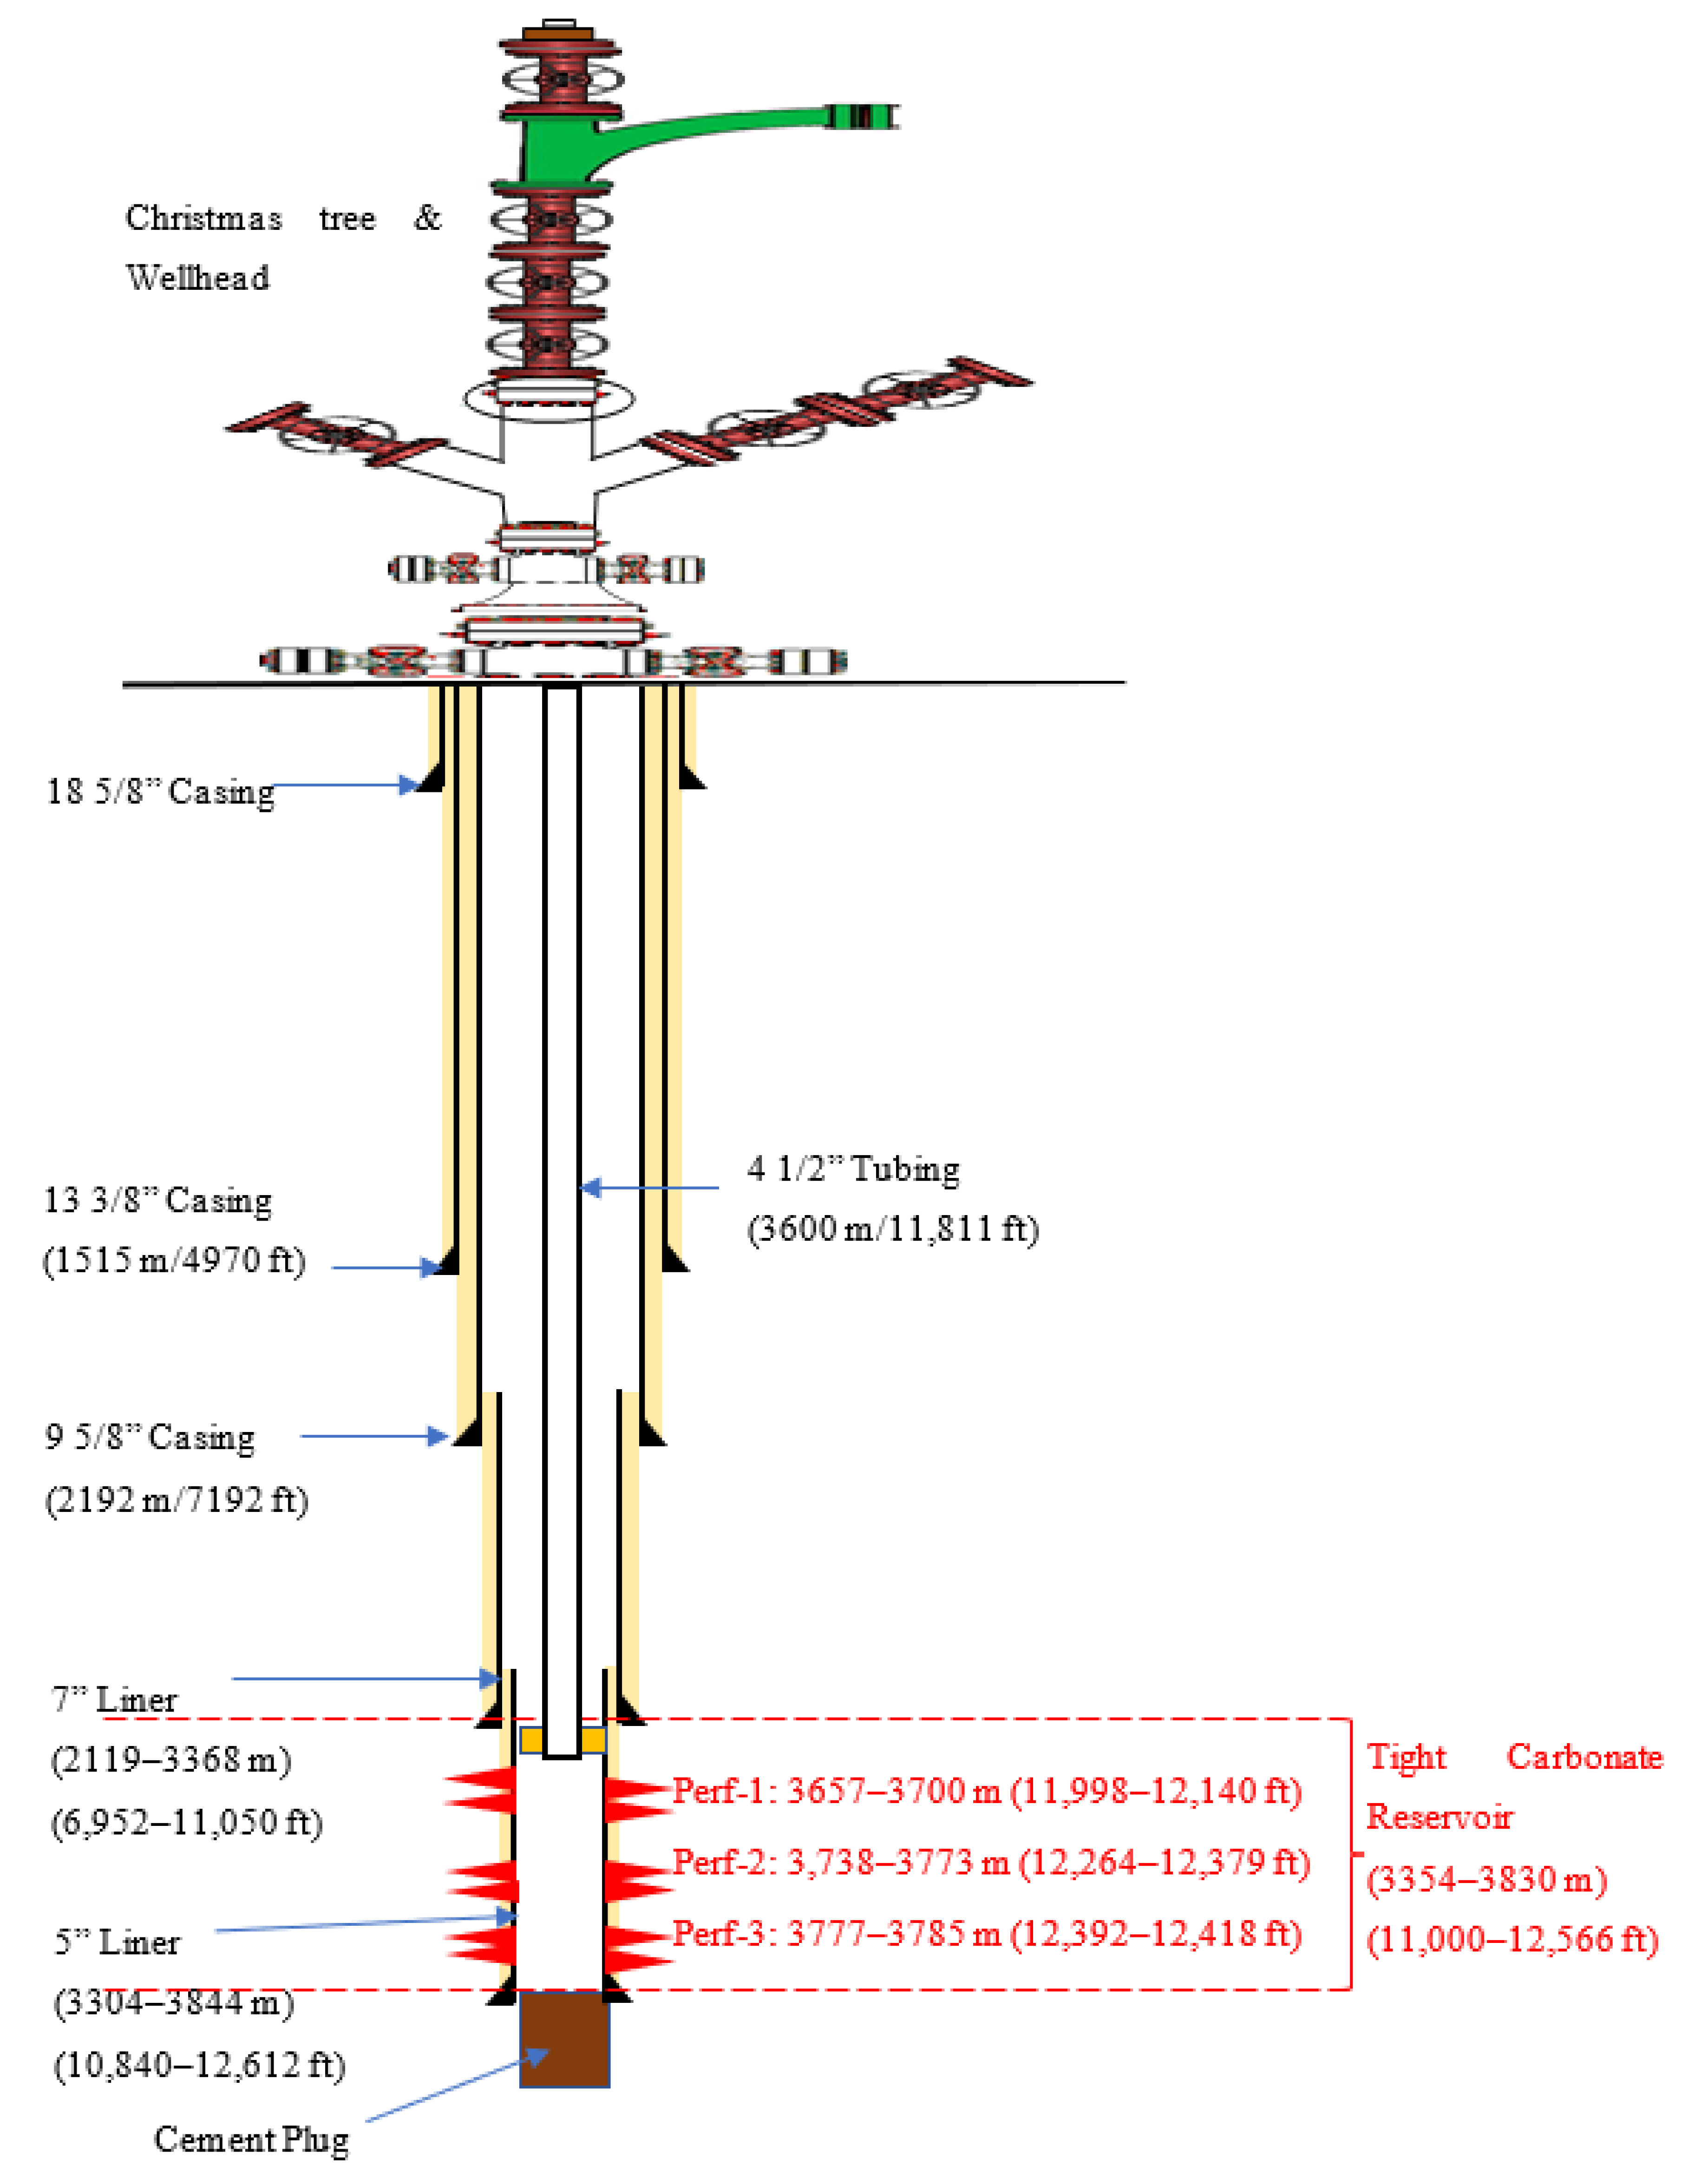
Figure 2.
Constructing the Mechanical Earth Model (MEM) to find rock elastic moduli and strength and in-situ horizontal and vertical stresses.
Figure 2.
Constructing the Mechanical Earth Model (MEM) to find rock elastic moduli and strength and in-situ horizontal and vertical stresses.
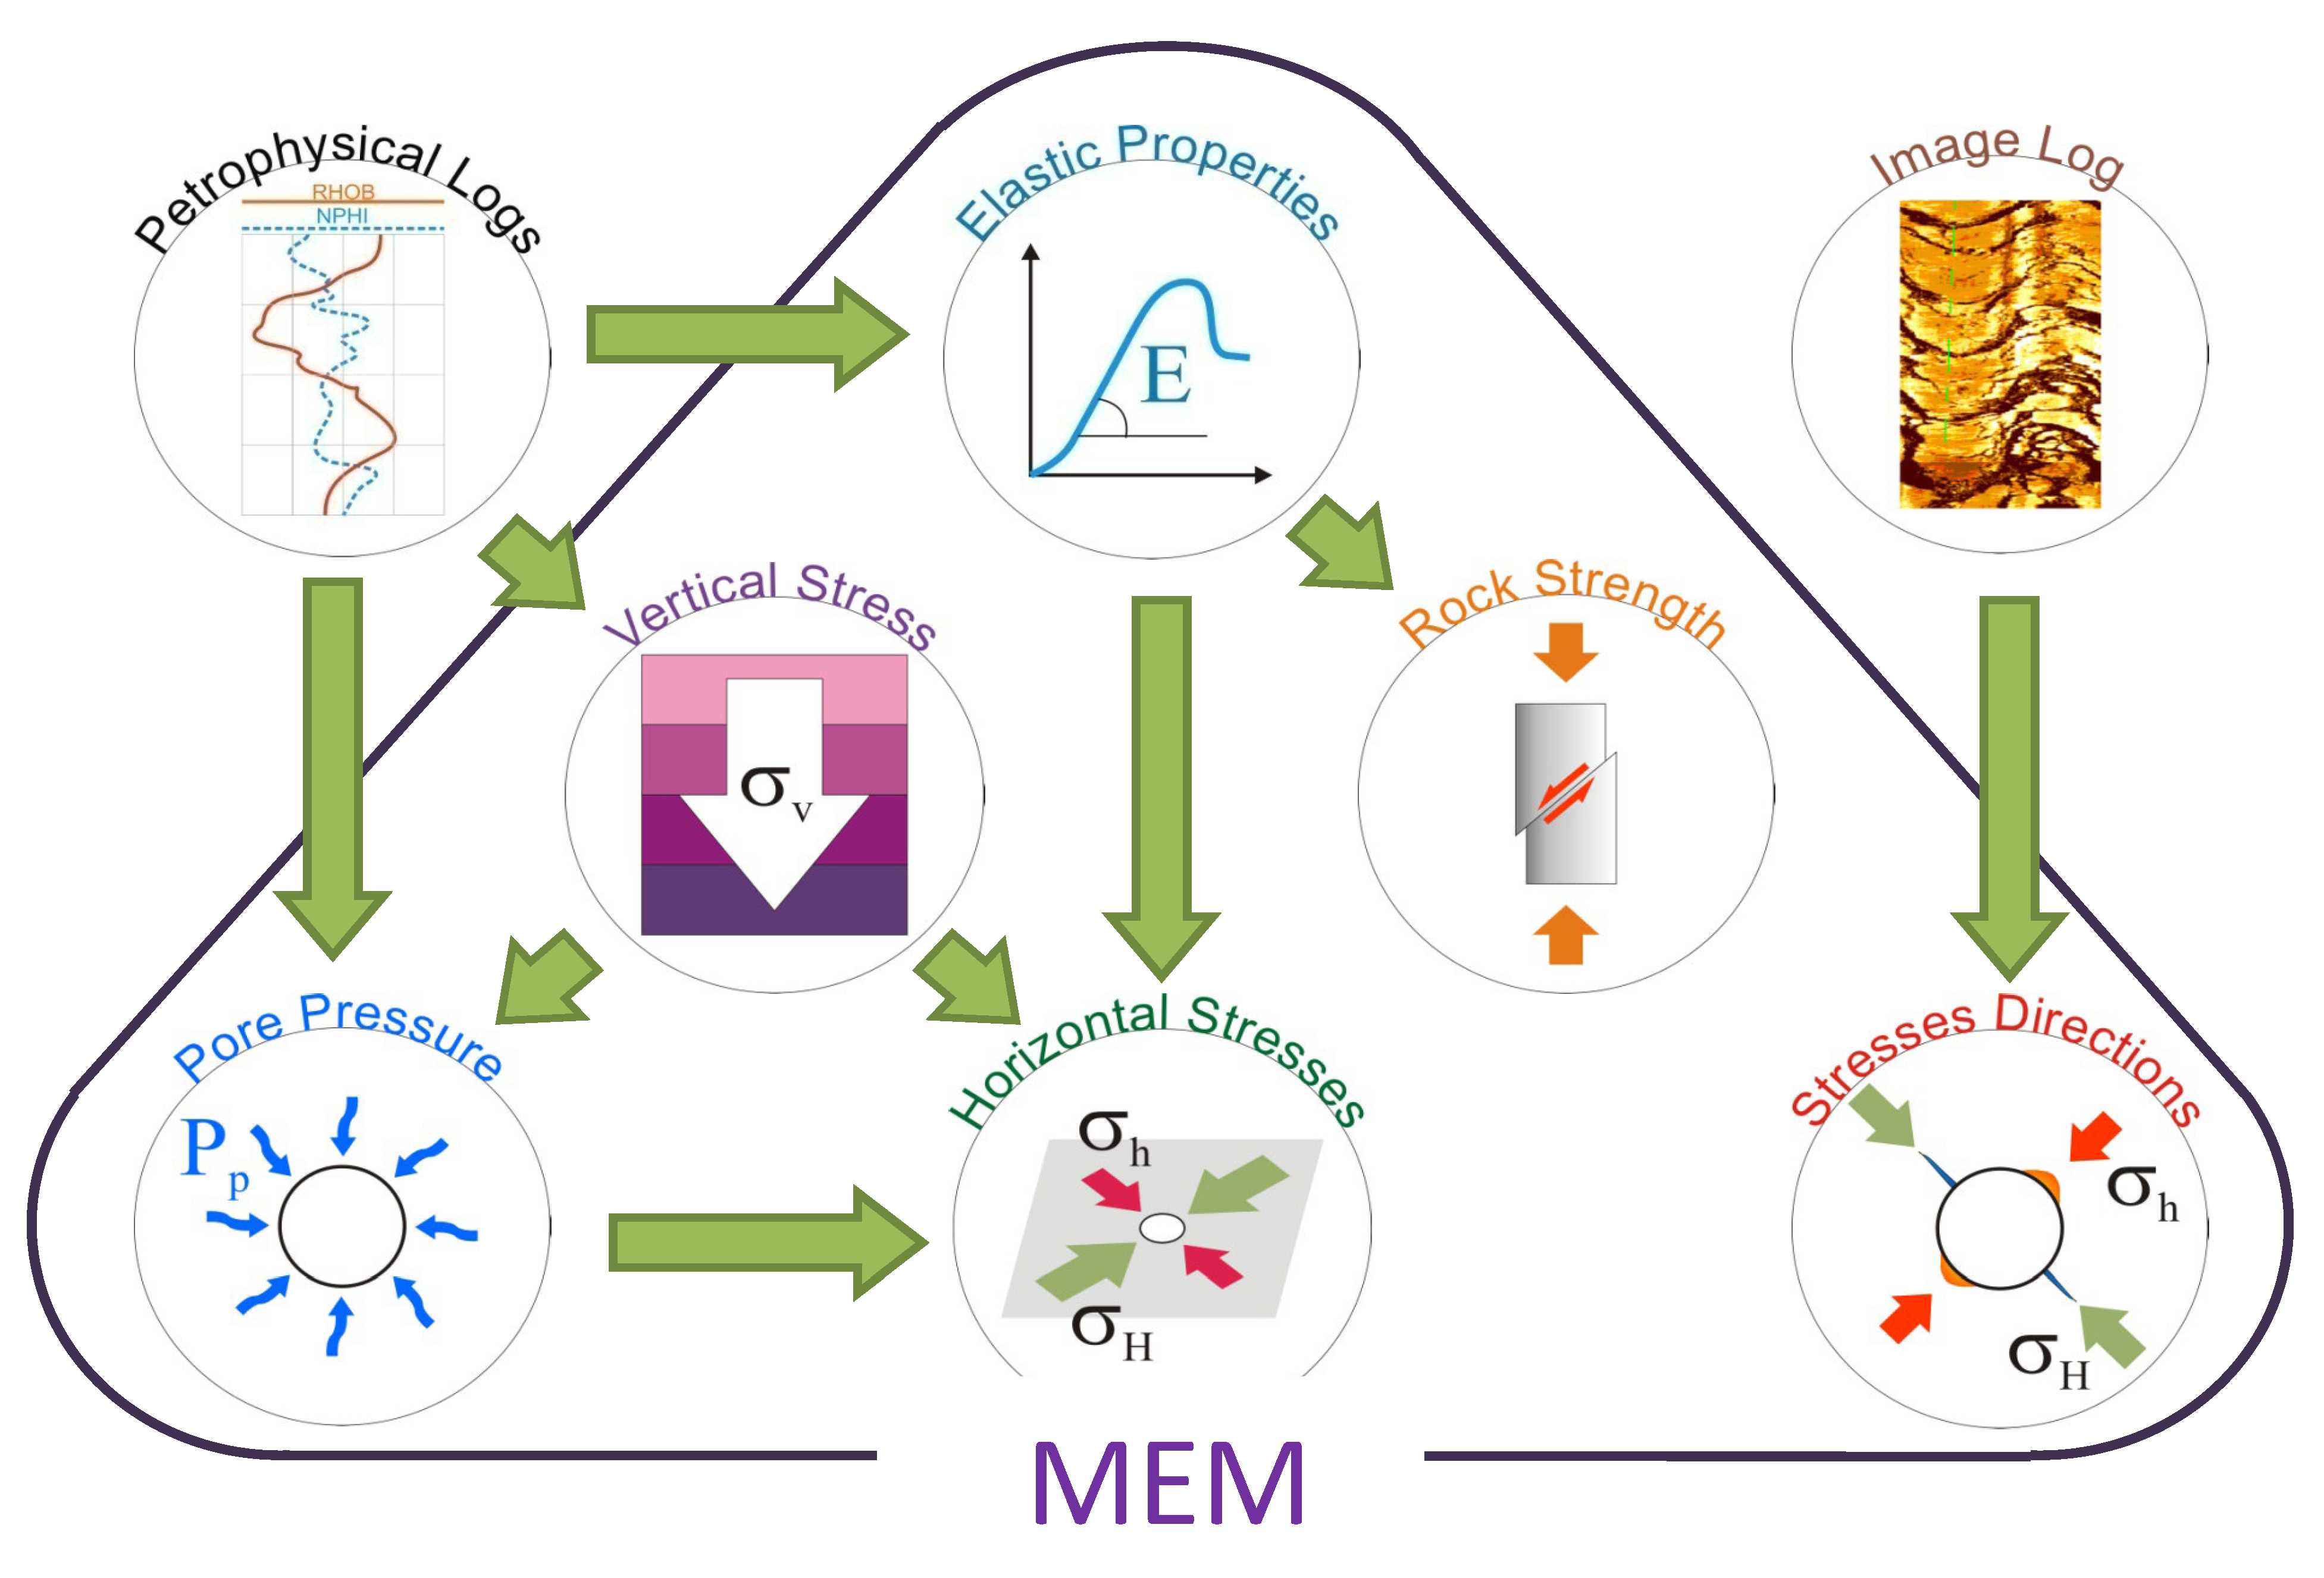
Figure 3.
(a)Input petrophysical well data for depth interval of 3370–3570 m (11,057 to 11,713 ft). (b) Input petrophysical well data for depth interval of 3570–3815 m (11,713 to 12,517 ft). Legend: MD—measured depth; Az—azimuth; Inc—inclination angle; DEG—degree; CGR—compensated gamma ray; GAPI—gamma ray unit; Cal—caliper; BS—bit size; IN—inch; DTC—acoustic compressional slowness; DTS—acoustic shear slowness; US/FT—micro-second per foot; NPHI—neutron porosity; V/V—(pore) volume to (bulk) volume ratio; RHOB—bulk density, G/CC—gram per cubic centimeter, MW—mud weight, ppg—pounds per gallon.
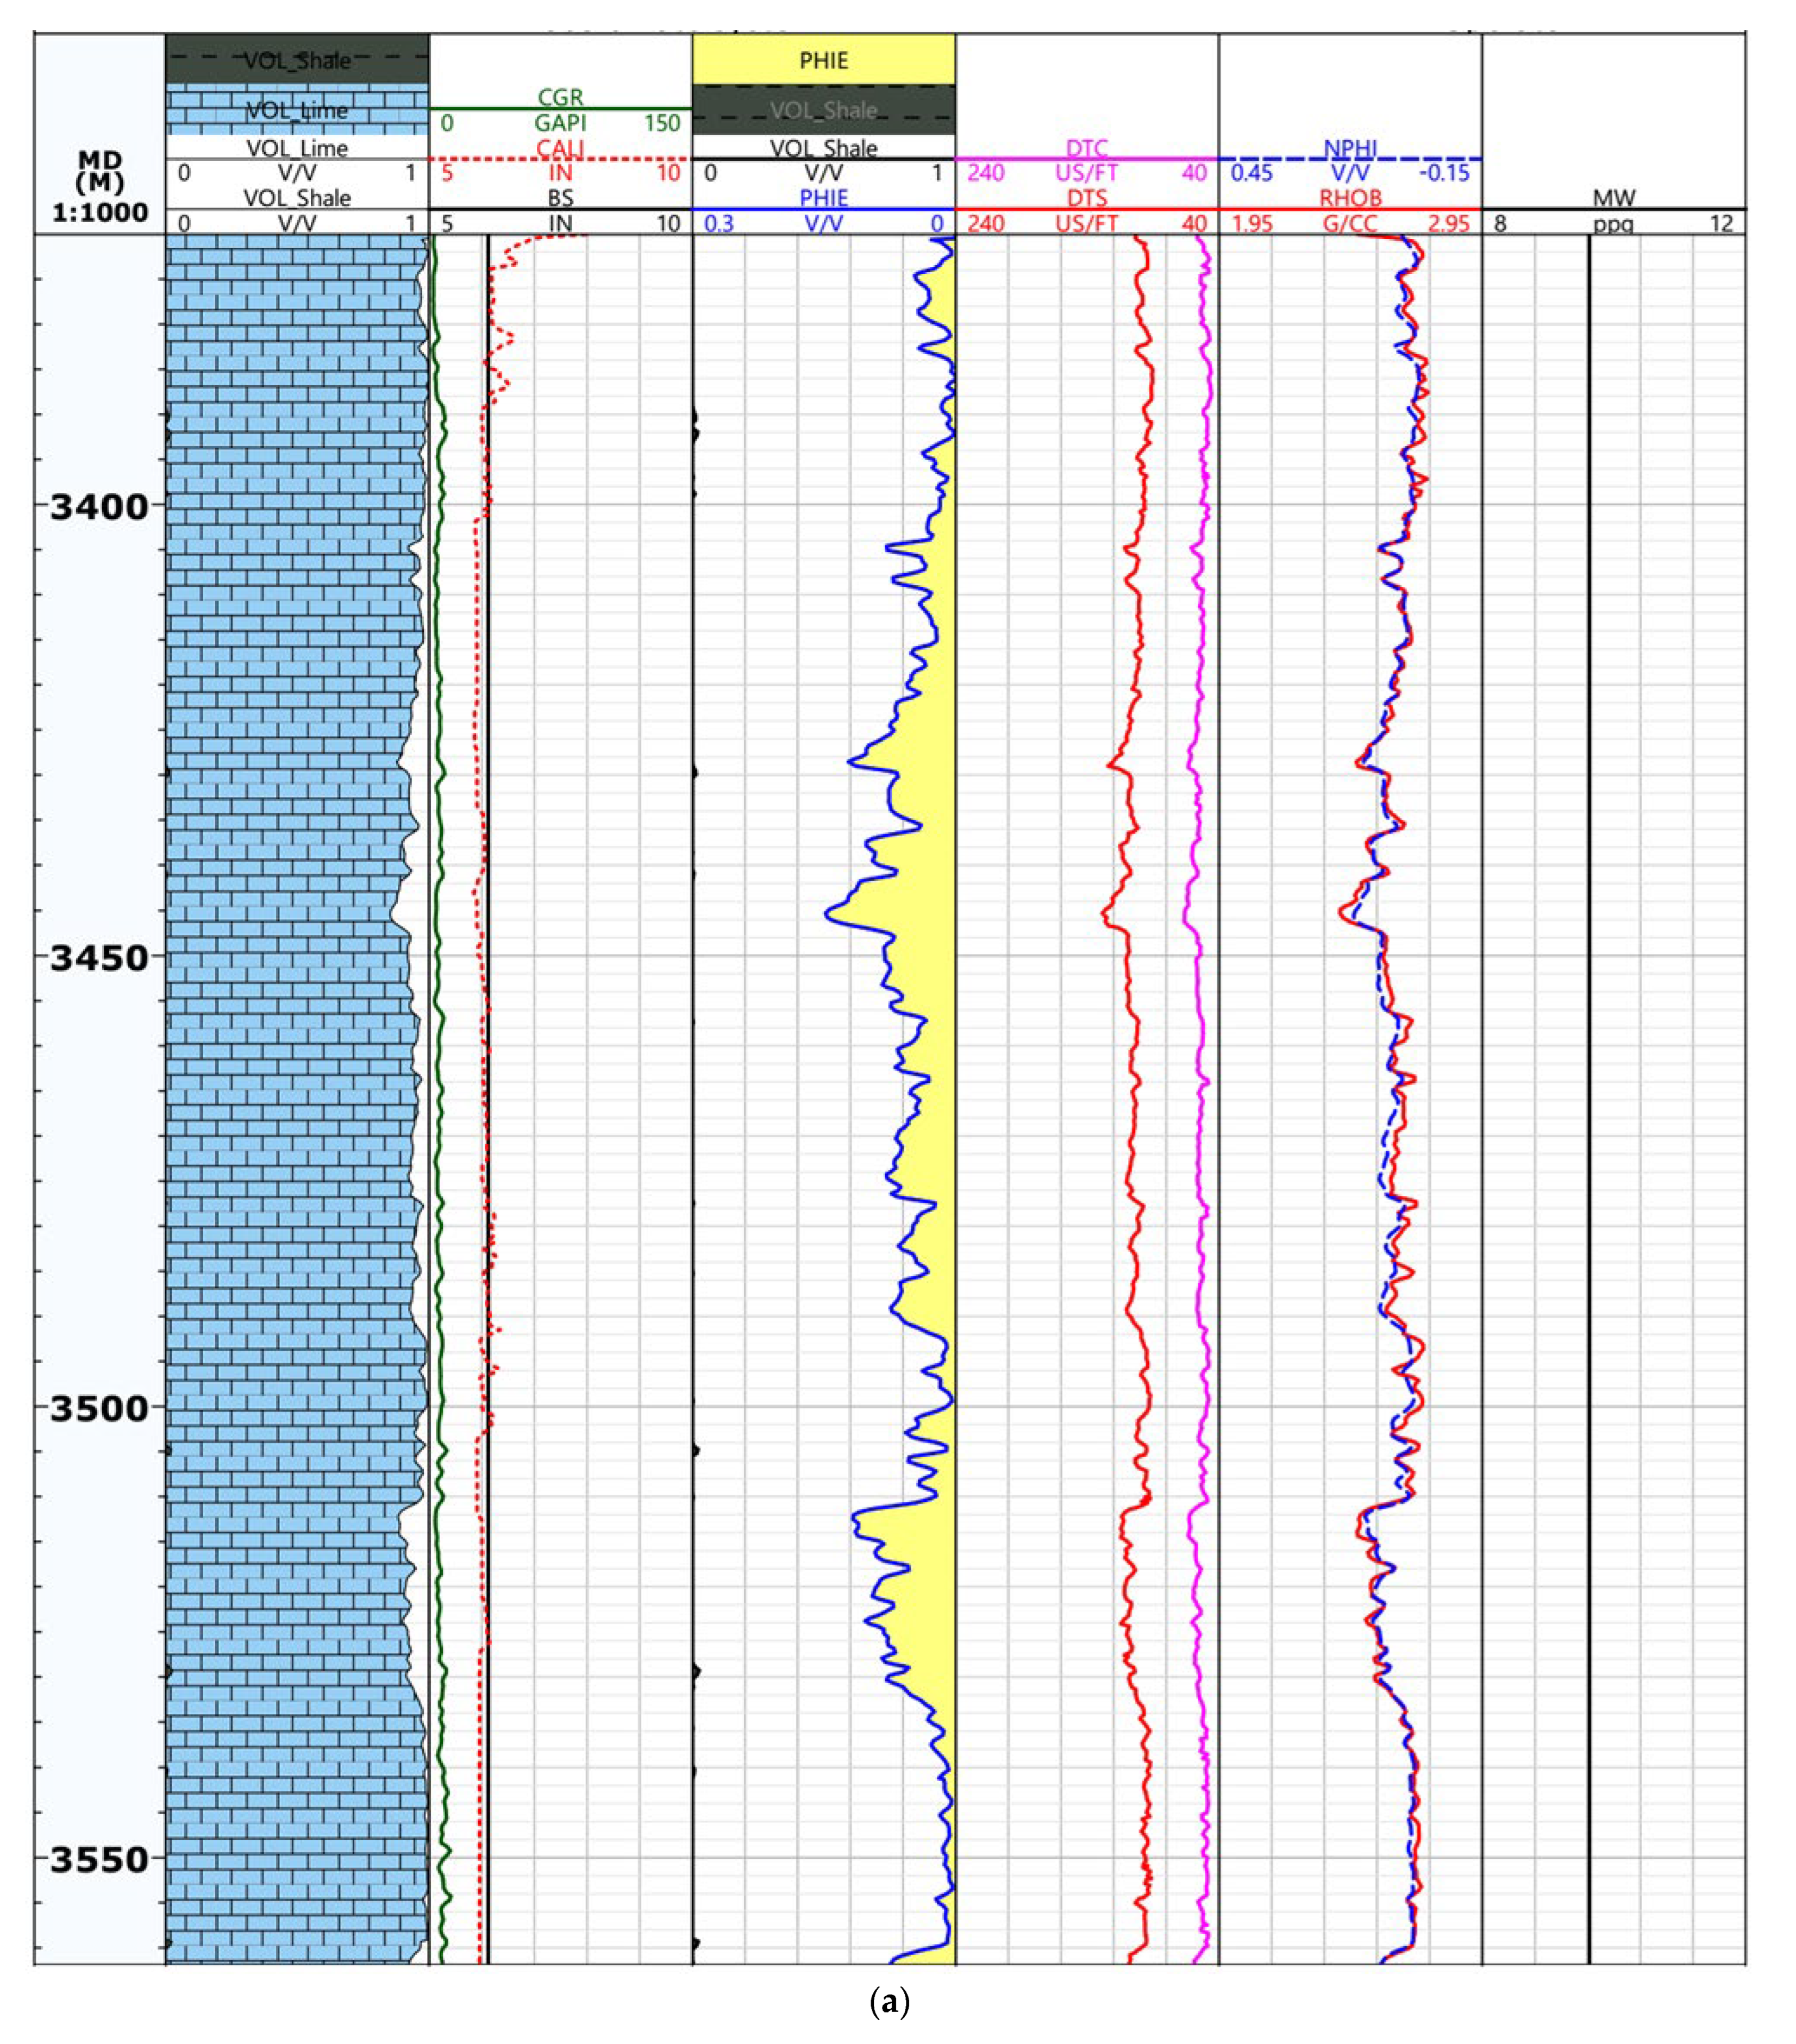
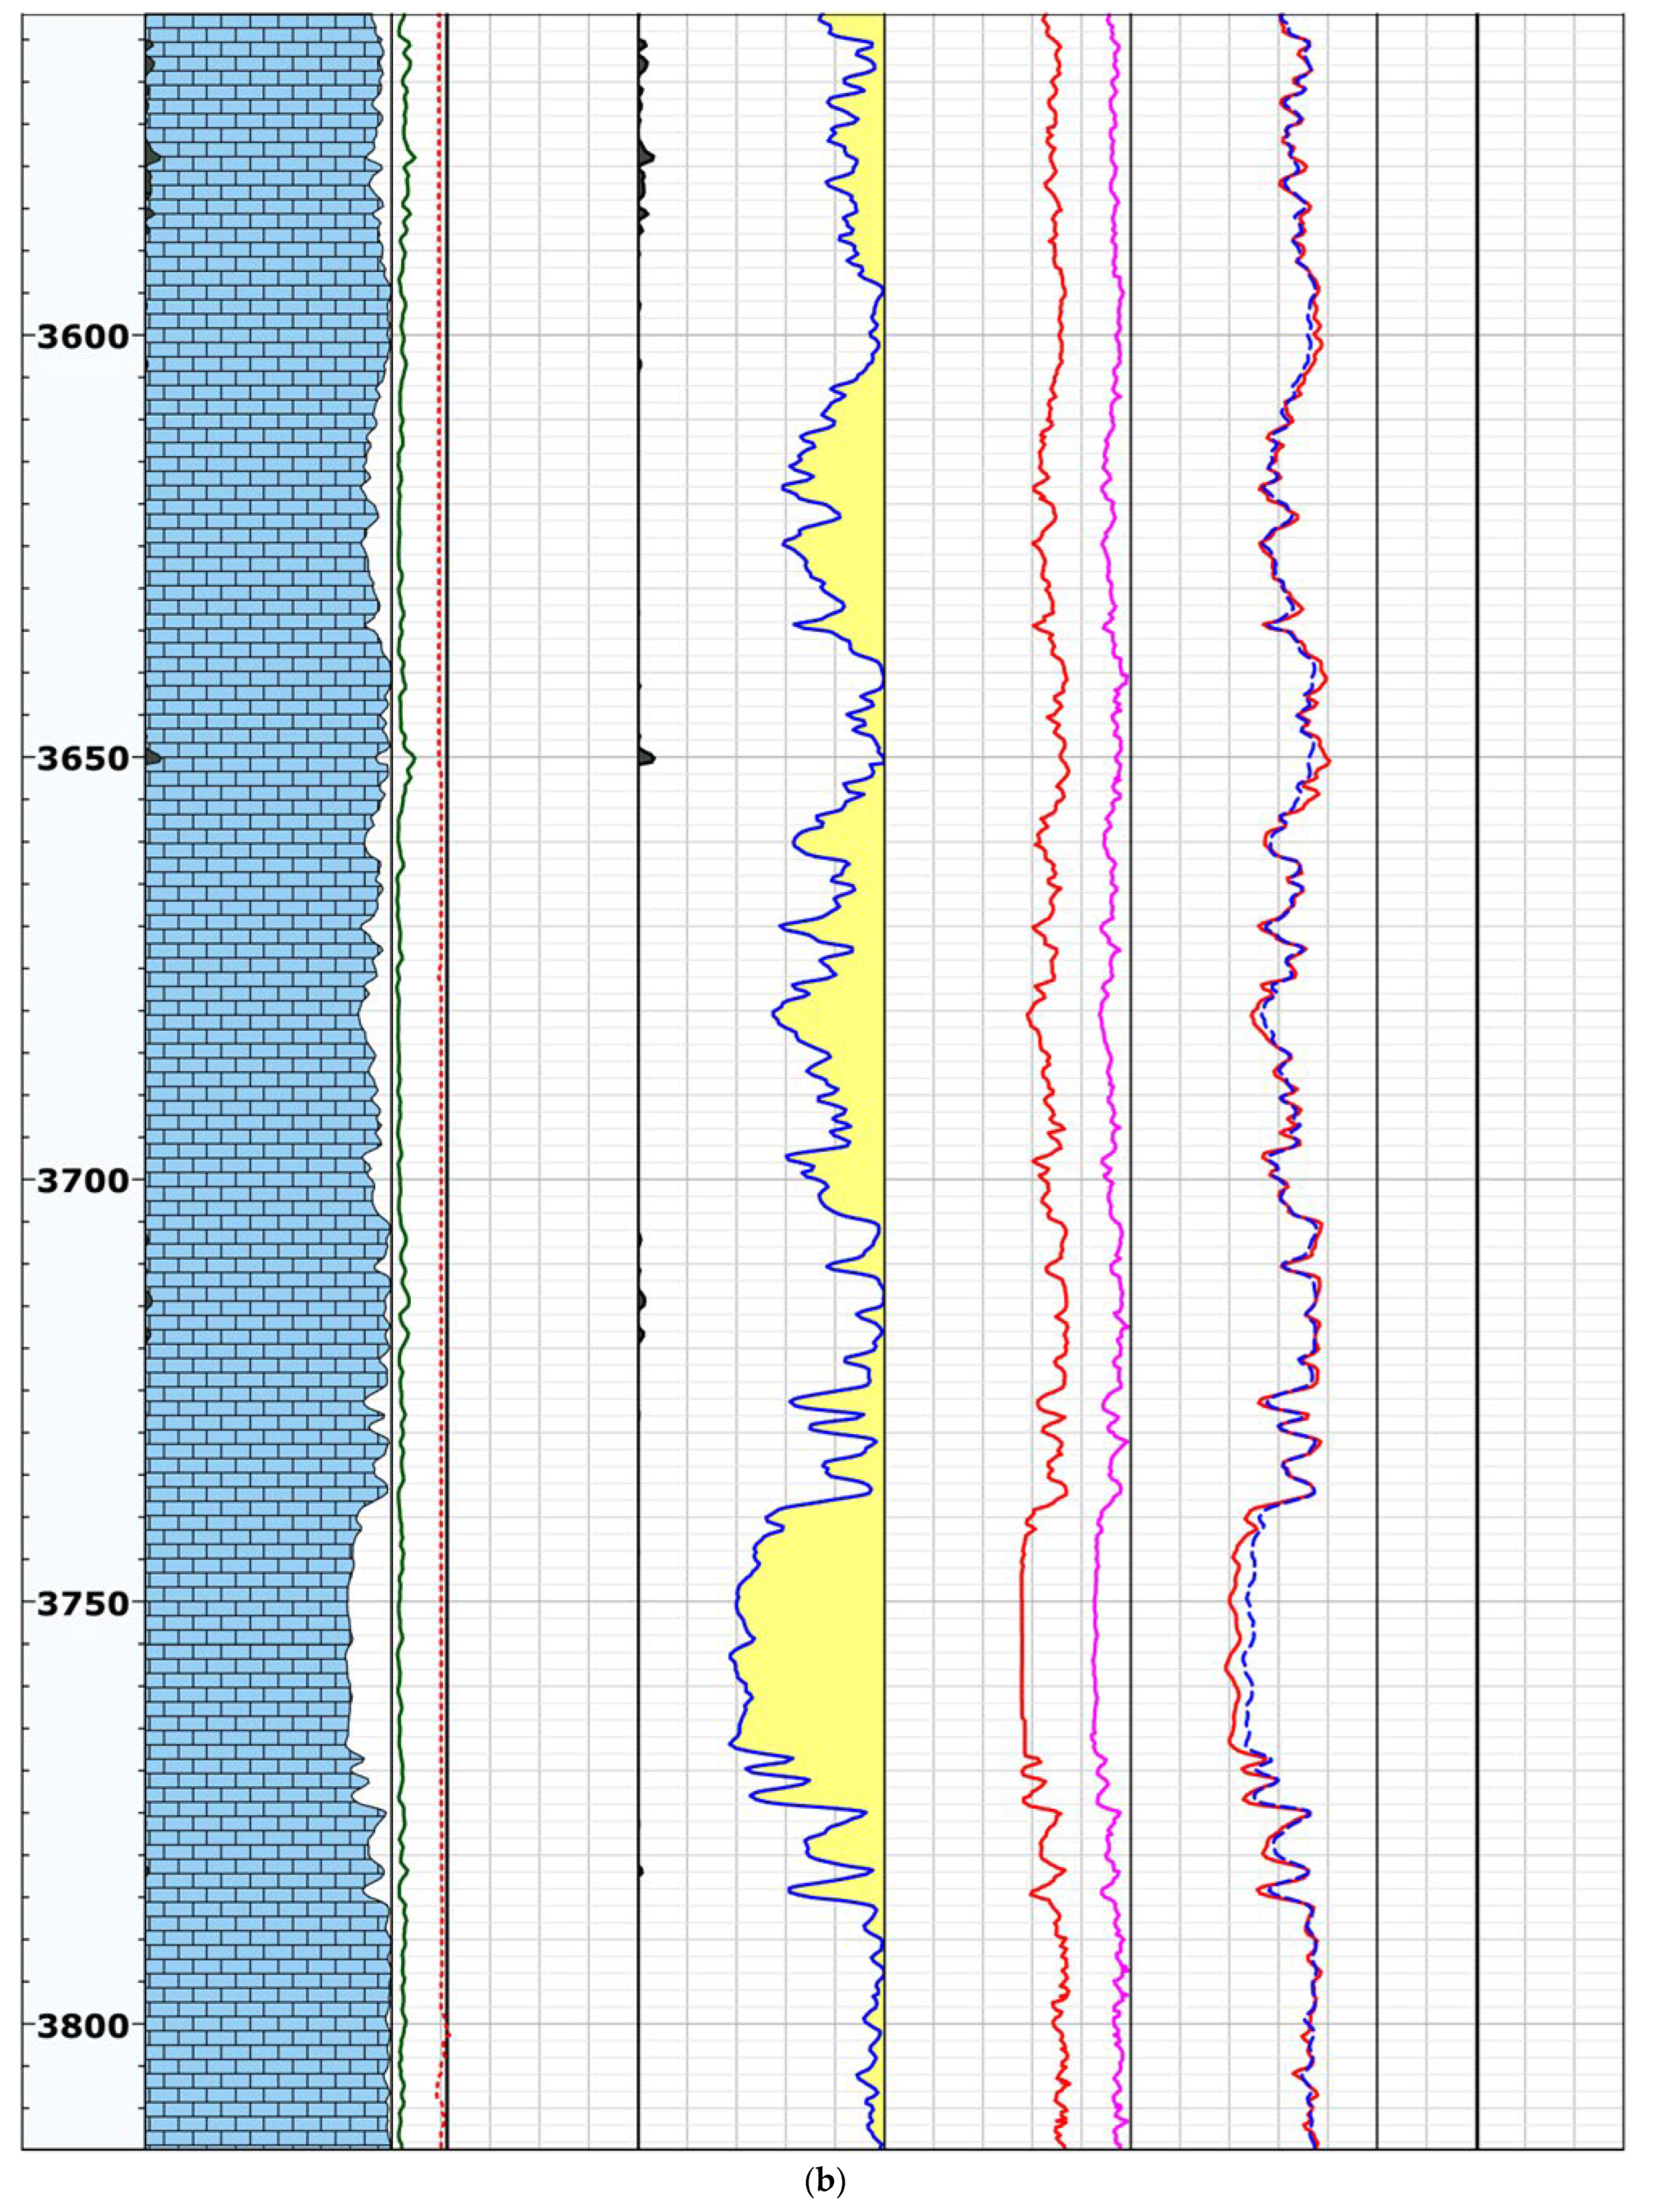
Figure 4.
The image log, the induced fractures show the direction of the maximum horizontal stress to be mainly “N60E”. Since no image logs were available for the interested depths across reservoir-B for hydraulic fracturing, it was assumed that the stress directions can be extrapolated downhole to the formation.
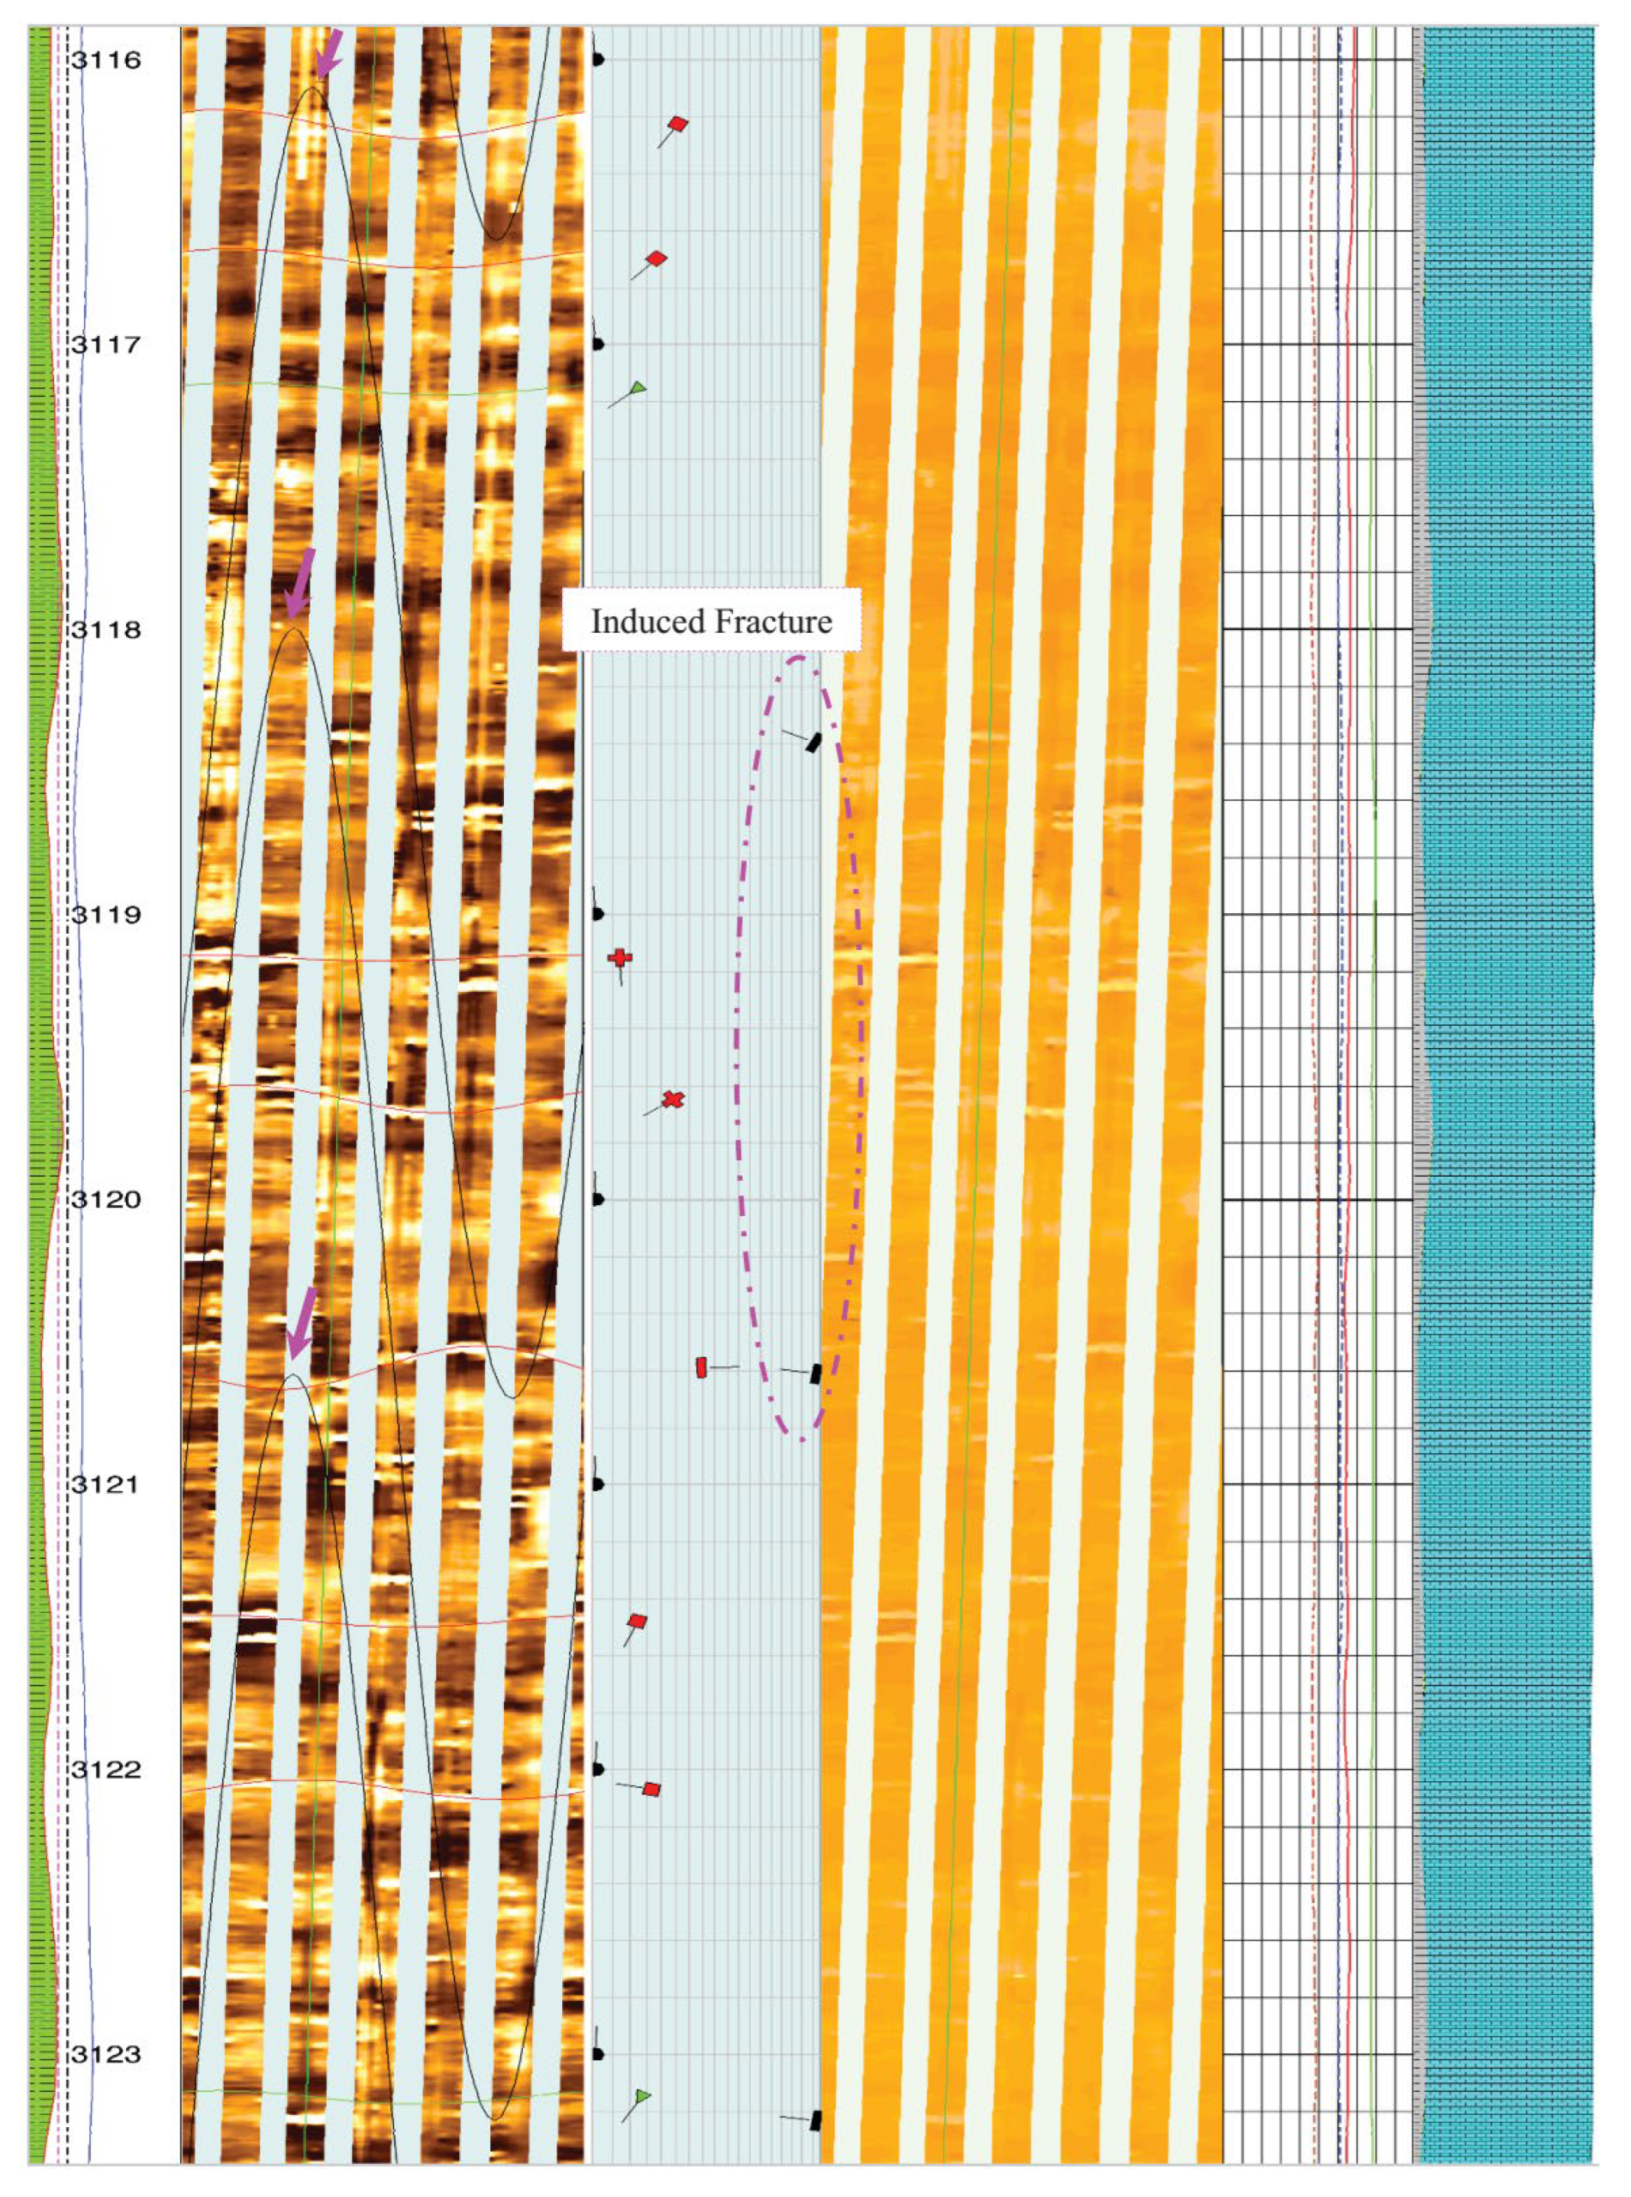
Figure 5.
(a) Mechanical Earth Modeling results for depth interval of 3370–3570 m (11,057 to 11,713 ft). (b) Mechanical Earth Modeling results for depth interval of 3570–3815 m (11,713 to 12,517 ft). Legend: MD—measured depth; YME_DYN—dynamic Young’s modulus; YME_STA—static Young’s modulus; PR_STA—static Poisson’s ratio; UCS—uniaxial compressive strength; SHMAX—maximum in-situ horizontal stress; SHMIN—minimum in-situ horizontal stress; SVERTICAL—Vertical Stress.
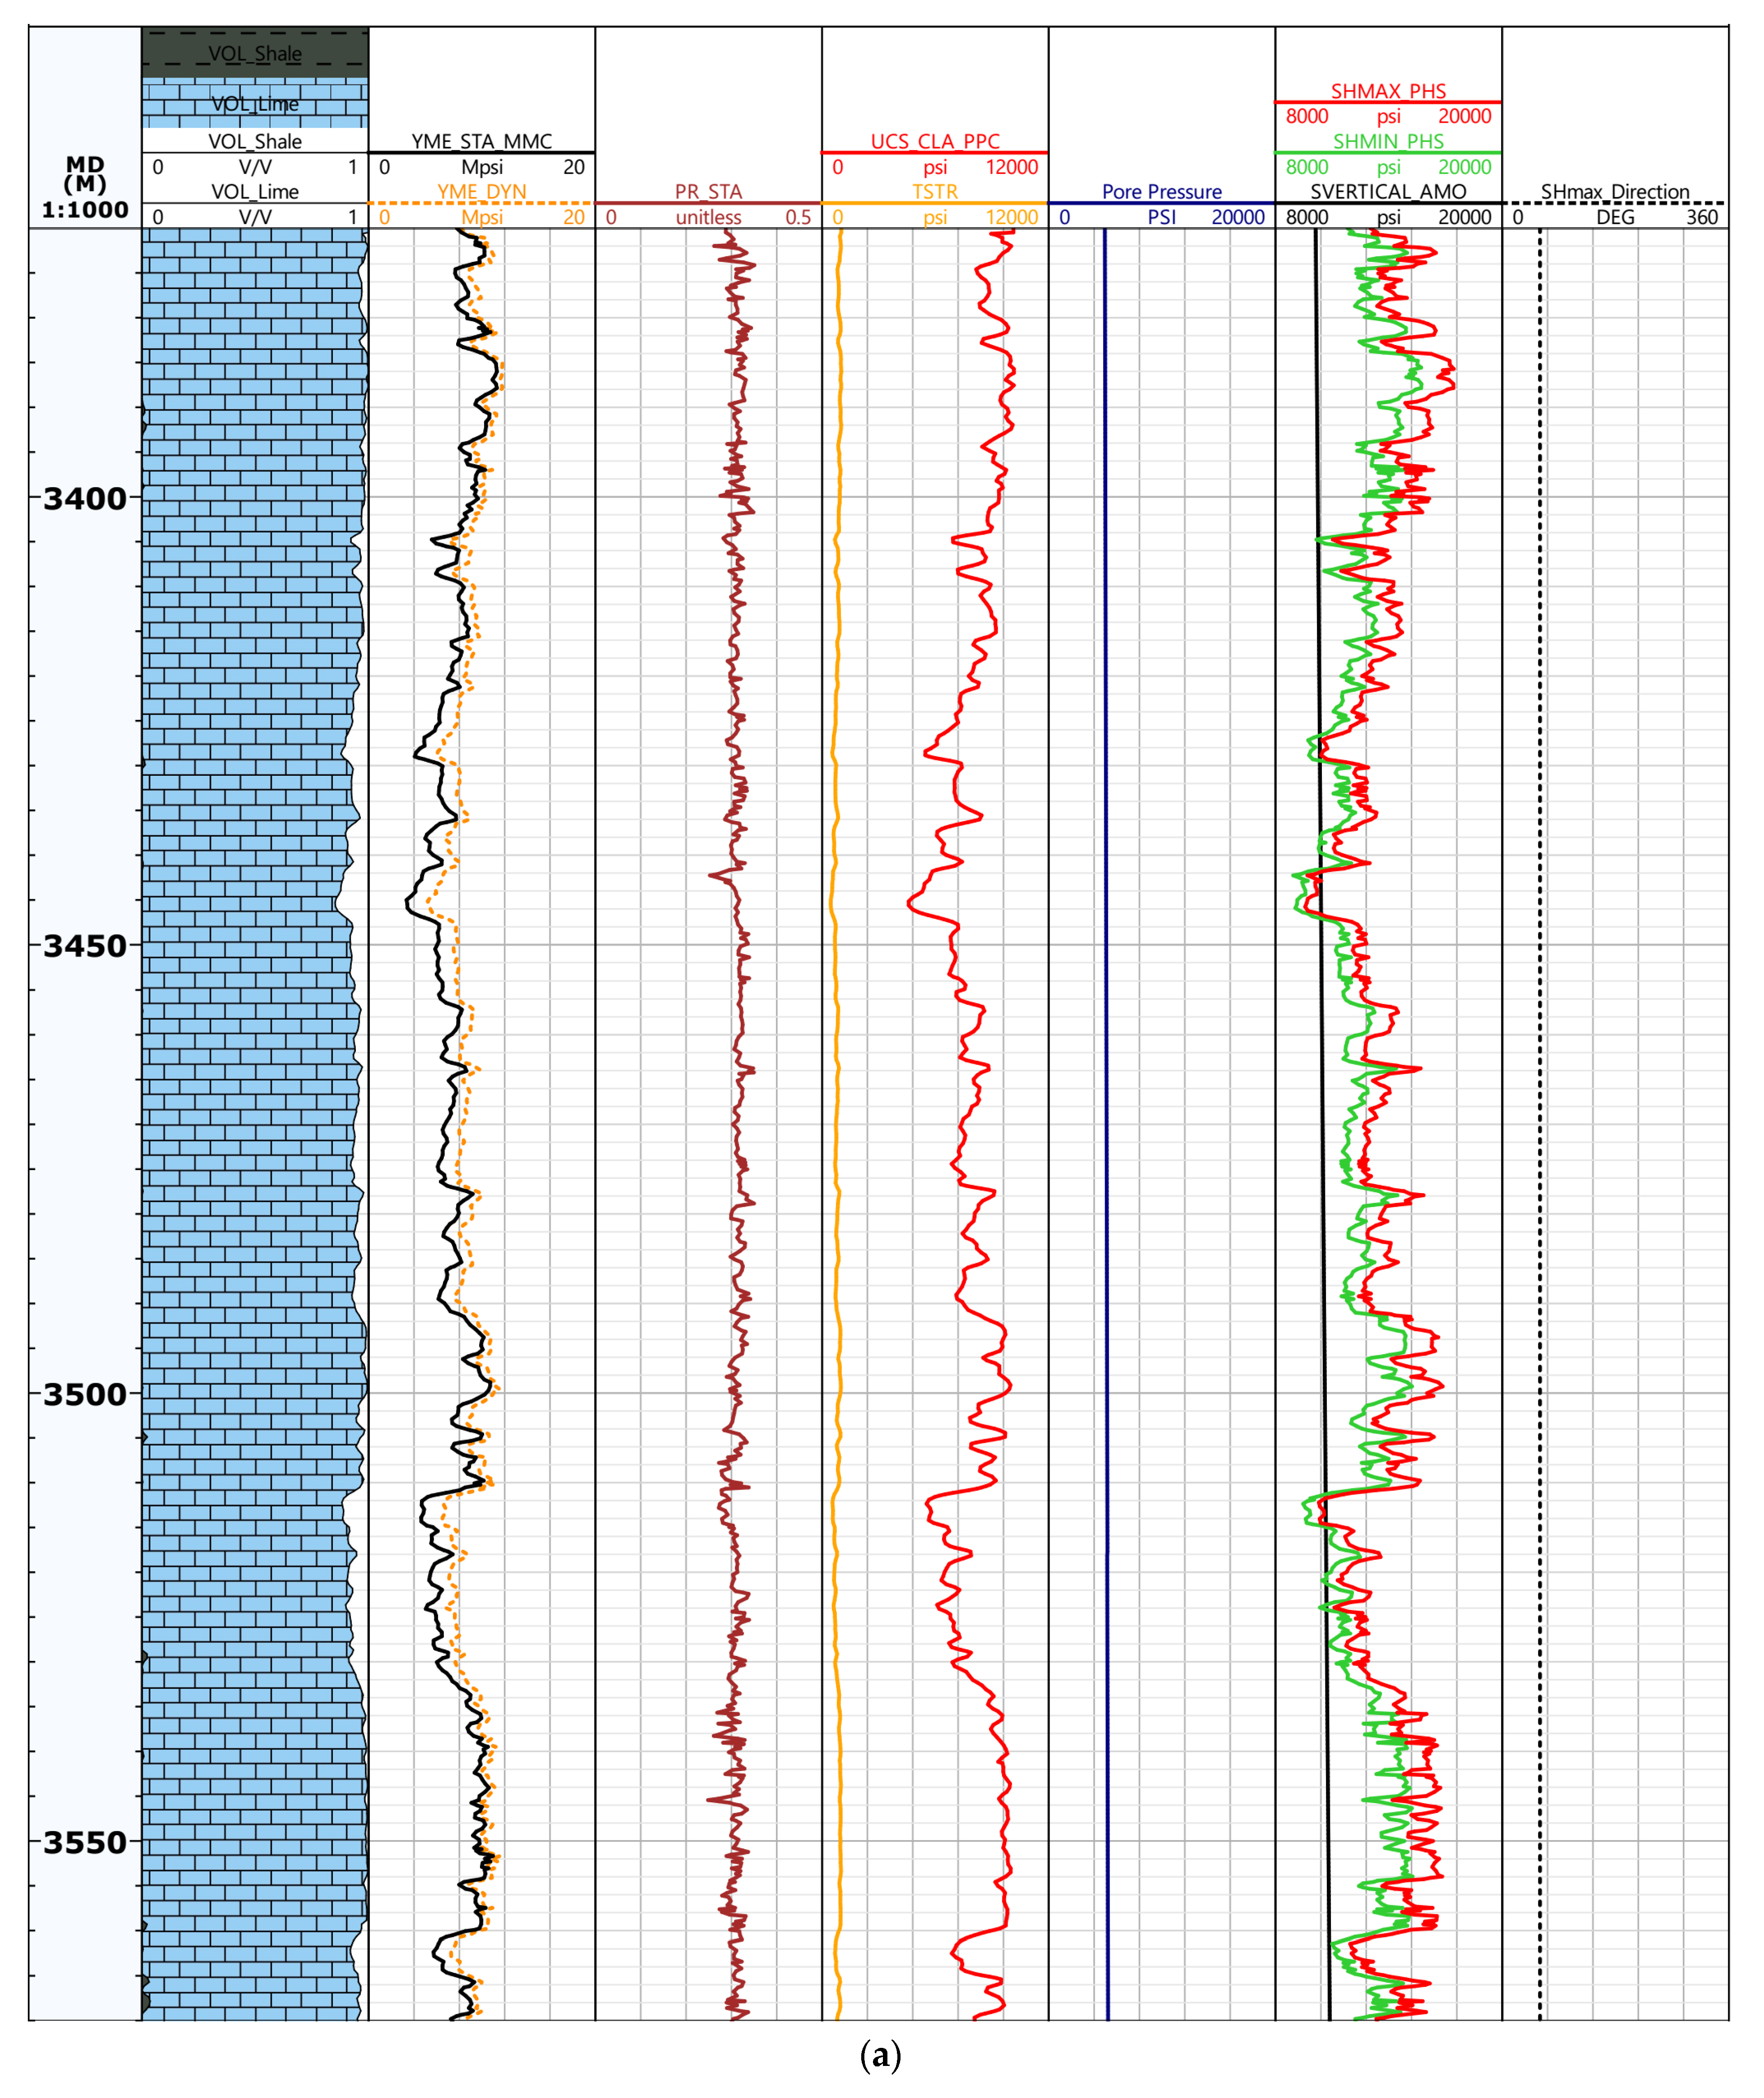
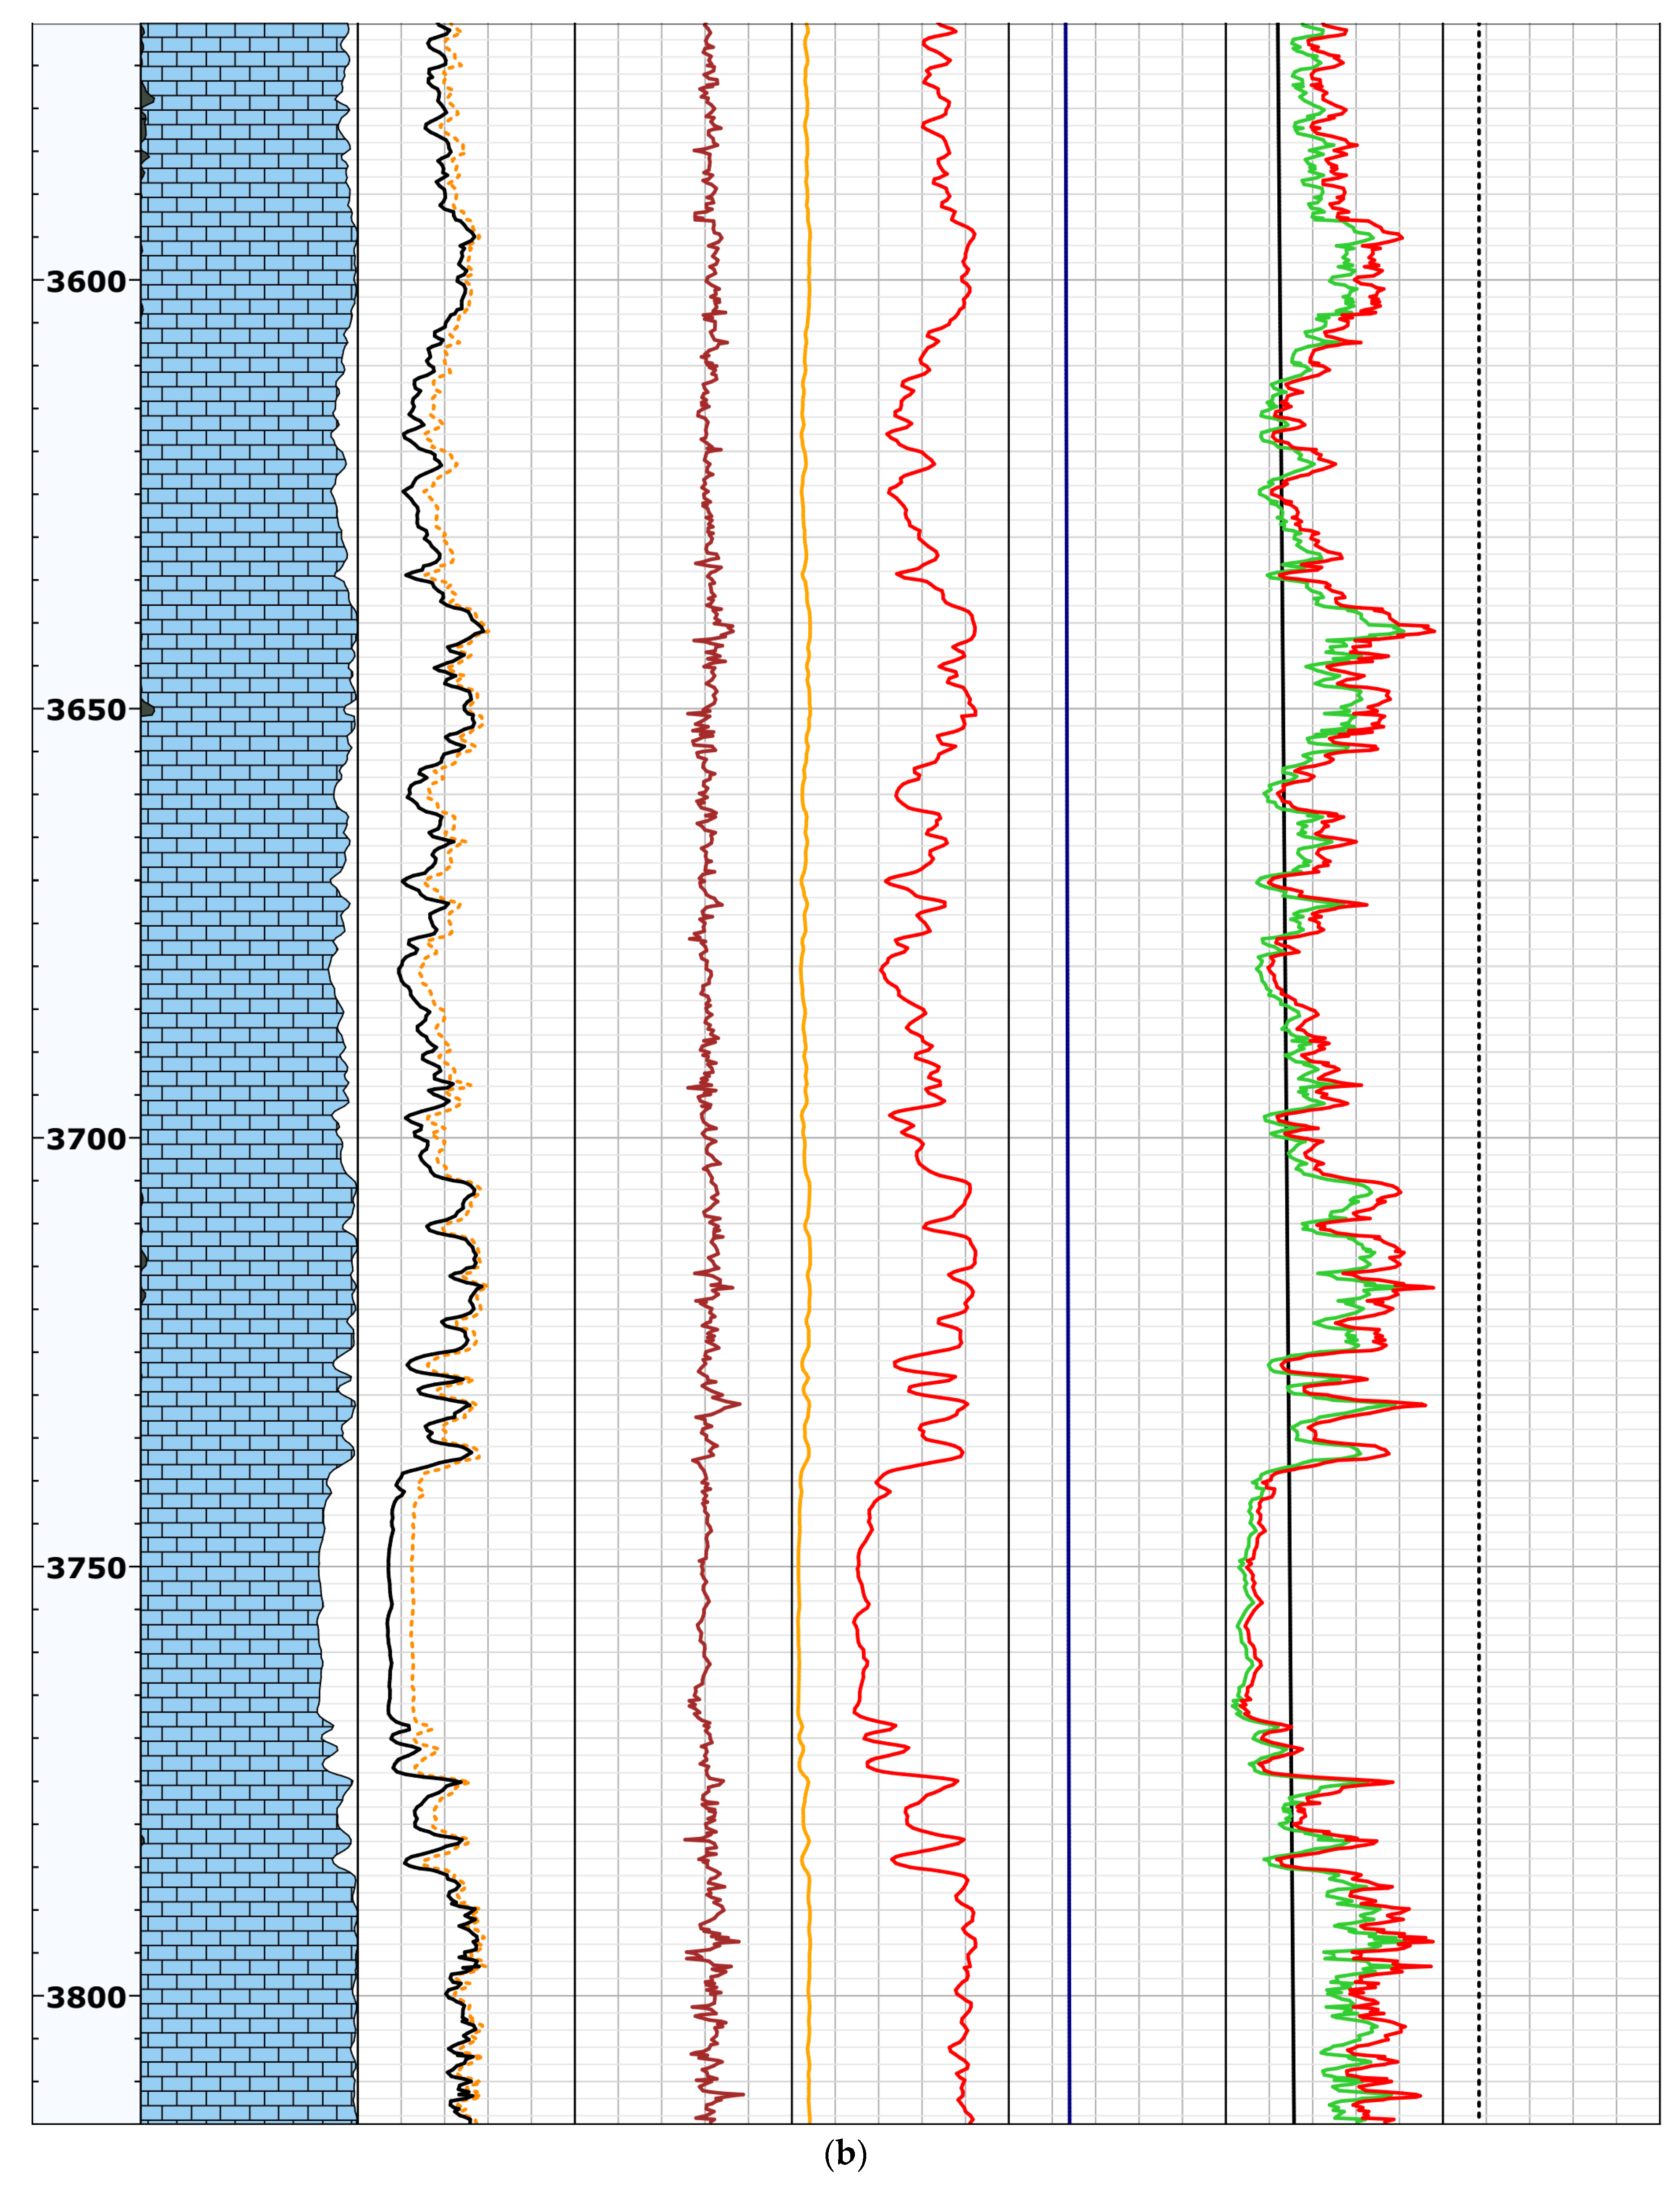
Figure 6.
Candidate selection from the three perforation intervals for hydraulic fracturing.

Figure 7.
Breakdown pressure for the investigated well.
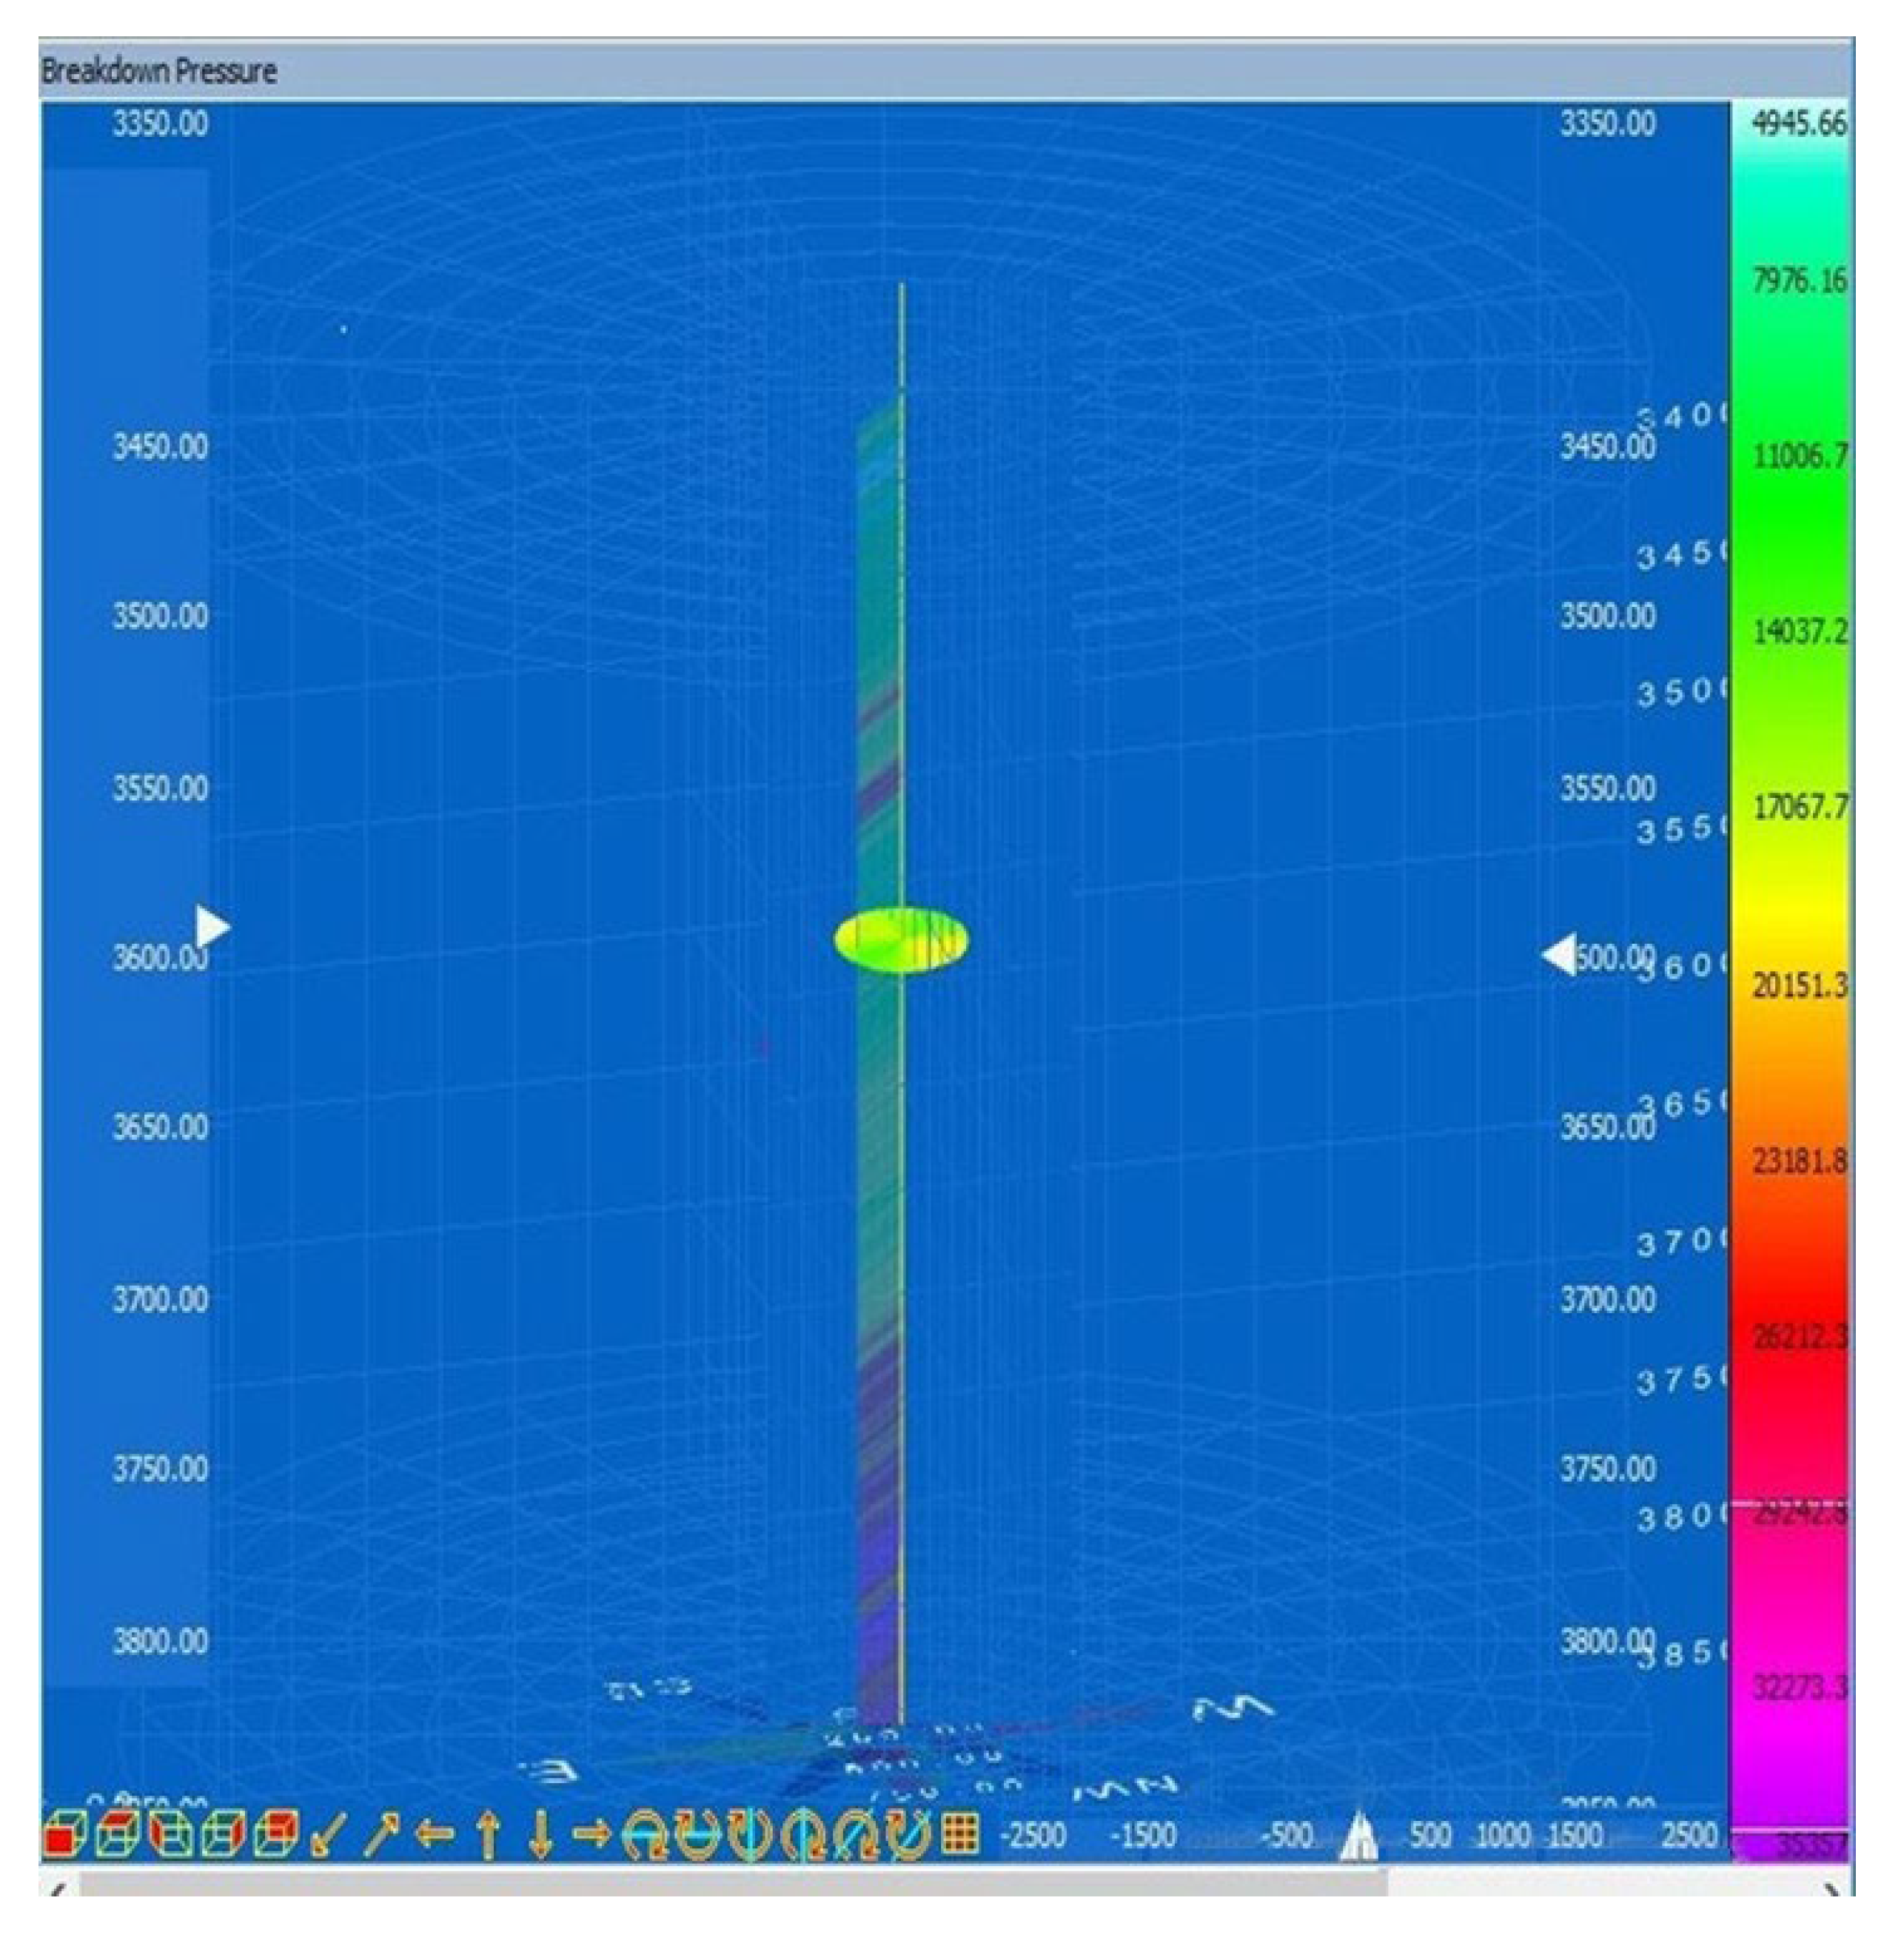
Figure 8.
Injection flow rates optimization with three stages of acid batch and with total fluid volume of 90 K-gal.
Figure 8.
Injection flow rates optimization with three stages of acid batch and with total fluid volume of 90 K-gal.

Figure 9.
Finding optimized injection volume of 90 k-gal at the optimum injection rate of 18 BPM and with three stages of acid batches.
Figure 9.
Finding optimized injection volume of 90 k-gal at the optimum injection rate of 18 BPM and with three stages of acid batches.
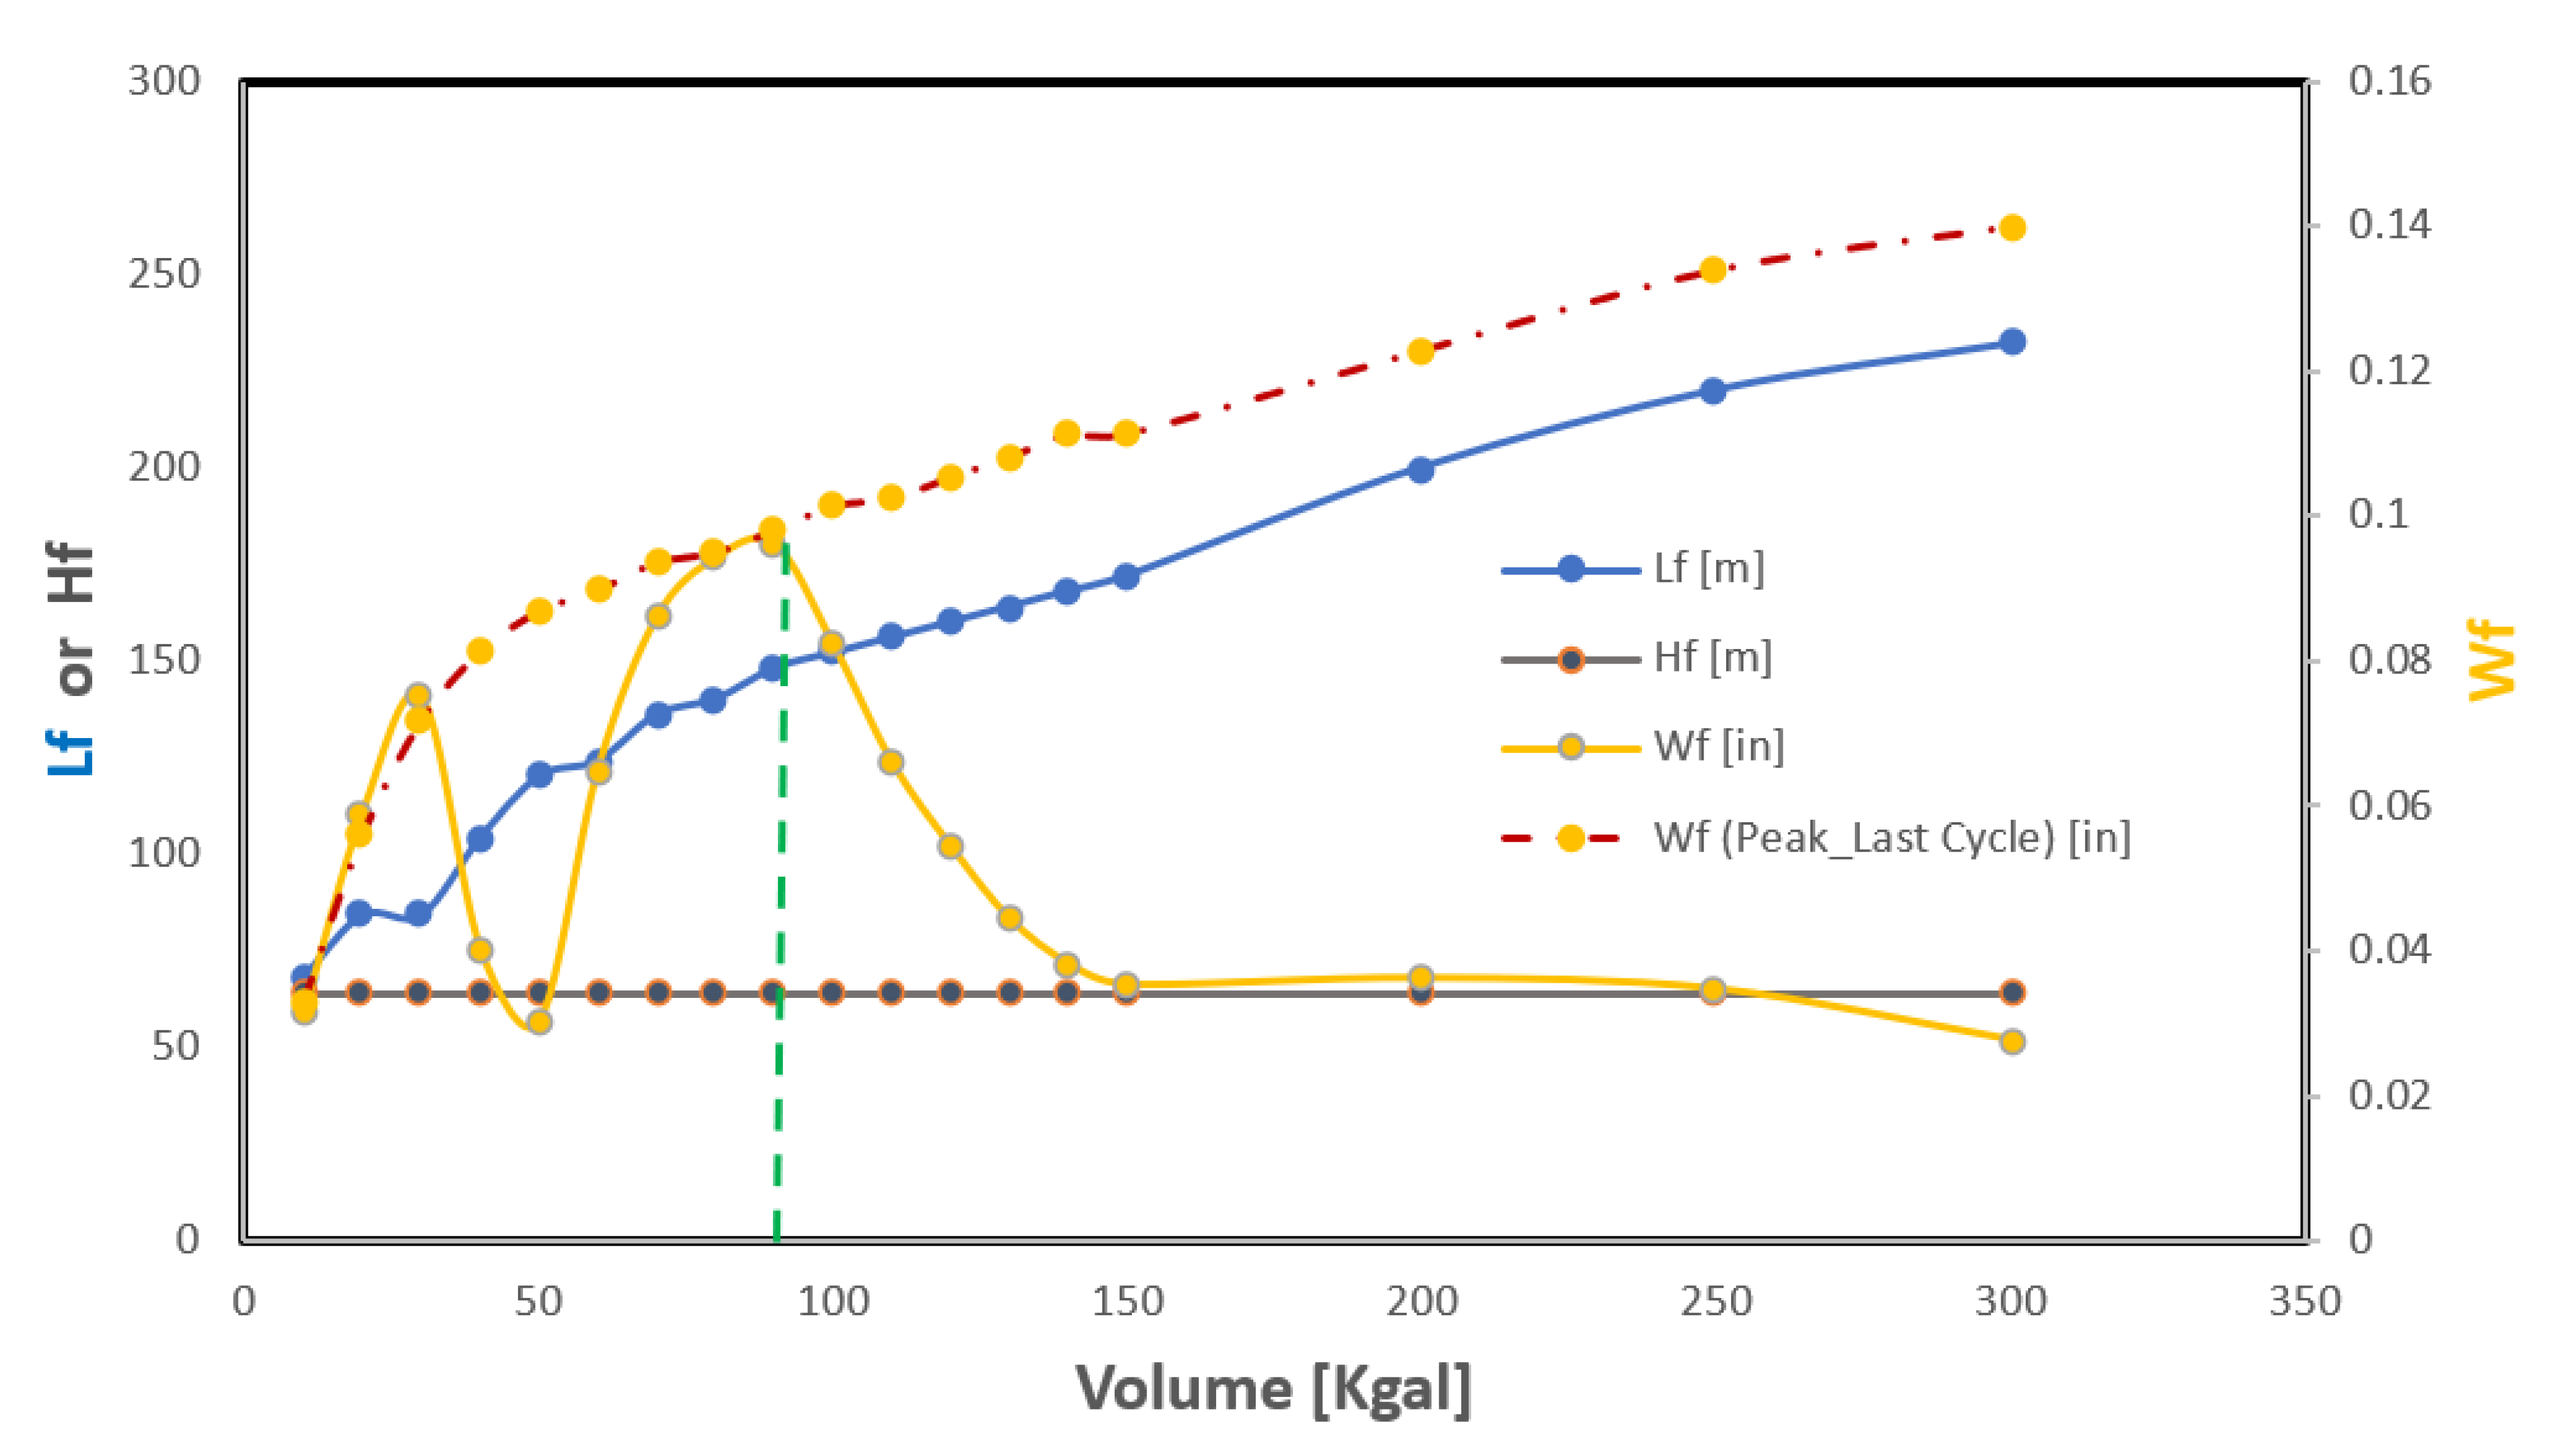
Figure 10.
Finding optimized number of stages for 90 K-gal injection volume and 18 BPM injection rate.
Figure 10.
Finding optimized number of stages for 90 K-gal injection volume and 18 BPM injection rate.

Figure 11.
Pumping schedule for optimized condition with 90 K-gal fluid volume, 18 BPM injection rate and three (3) stages.
Figure 11.
Pumping schedule for optimized condition with 90 K-gal fluid volume, 18 BPM injection rate and three (3) stages.

Figure 12.
Final curves for the multistage fracturing scenario with optimized injection parameters (90 K-gal of fracturing fluid volume, 18 BPM injection rate, in three stages).
Figure 12.
Final curves for the multistage fracturing scenario with optimized injection parameters (90 K-gal of fracturing fluid volume, 18 BPM injection rate, in three stages).
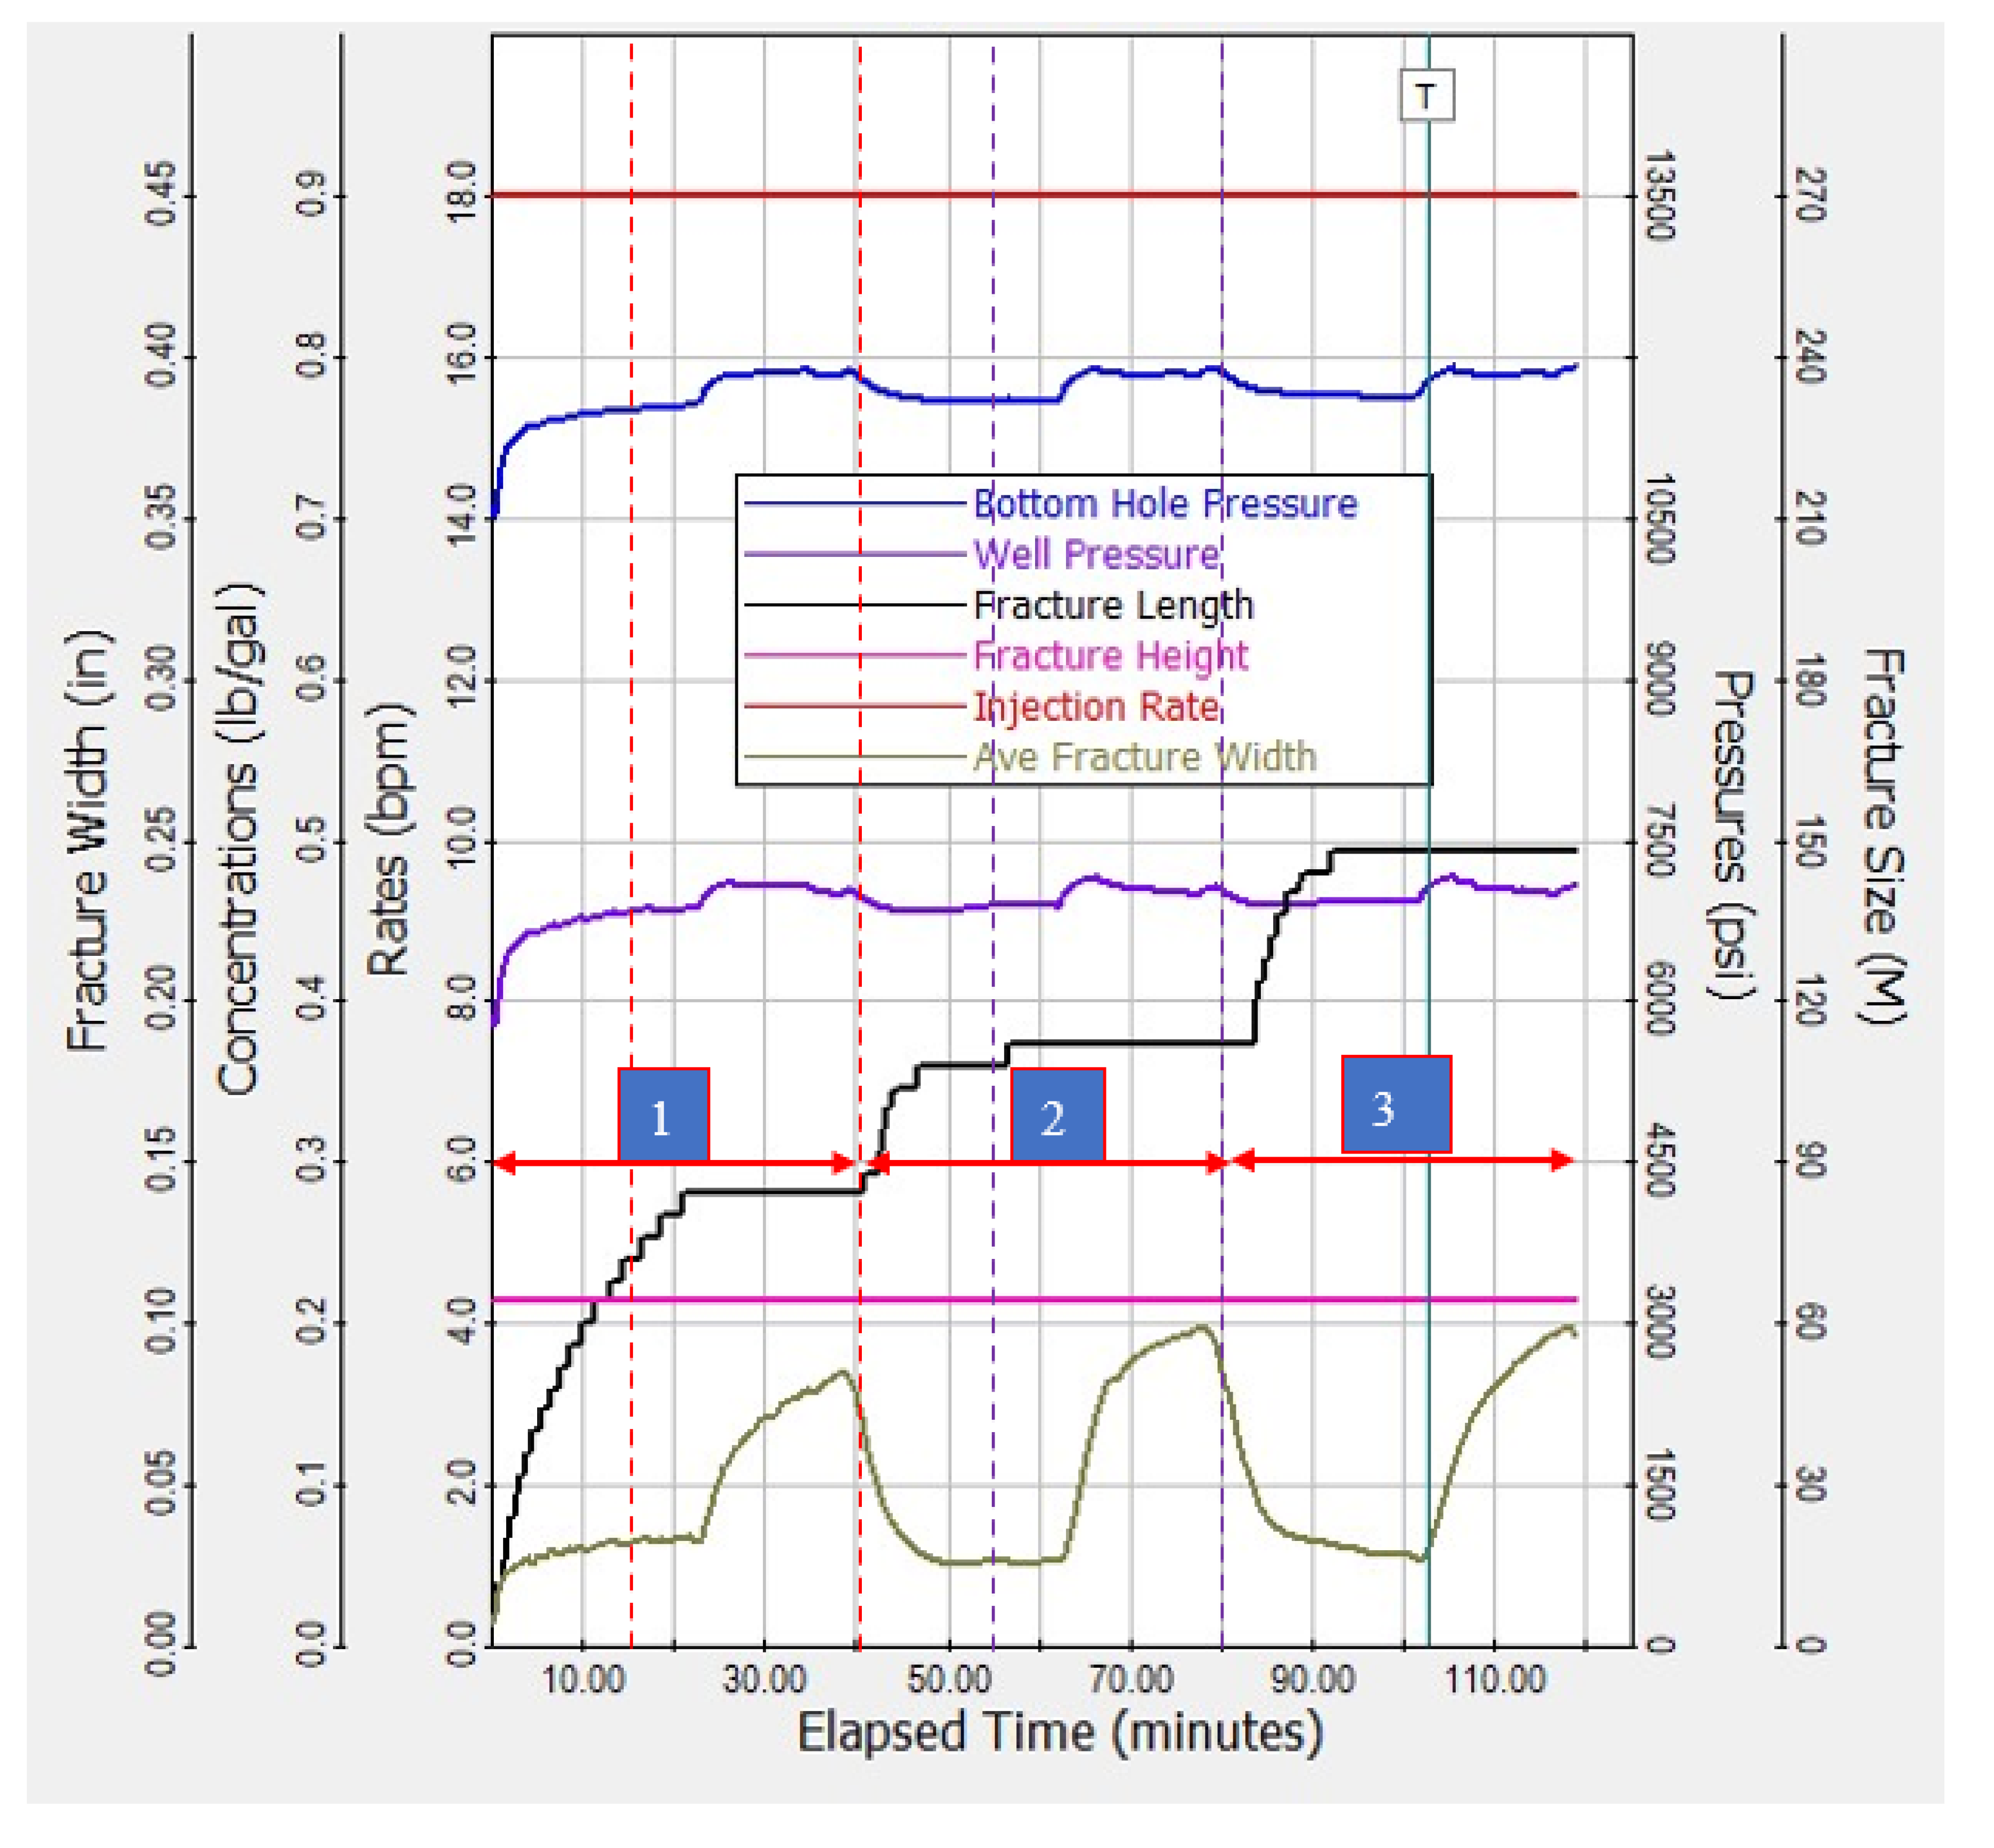
Figure 13.
Production conditions before the hydraulic fracturing.
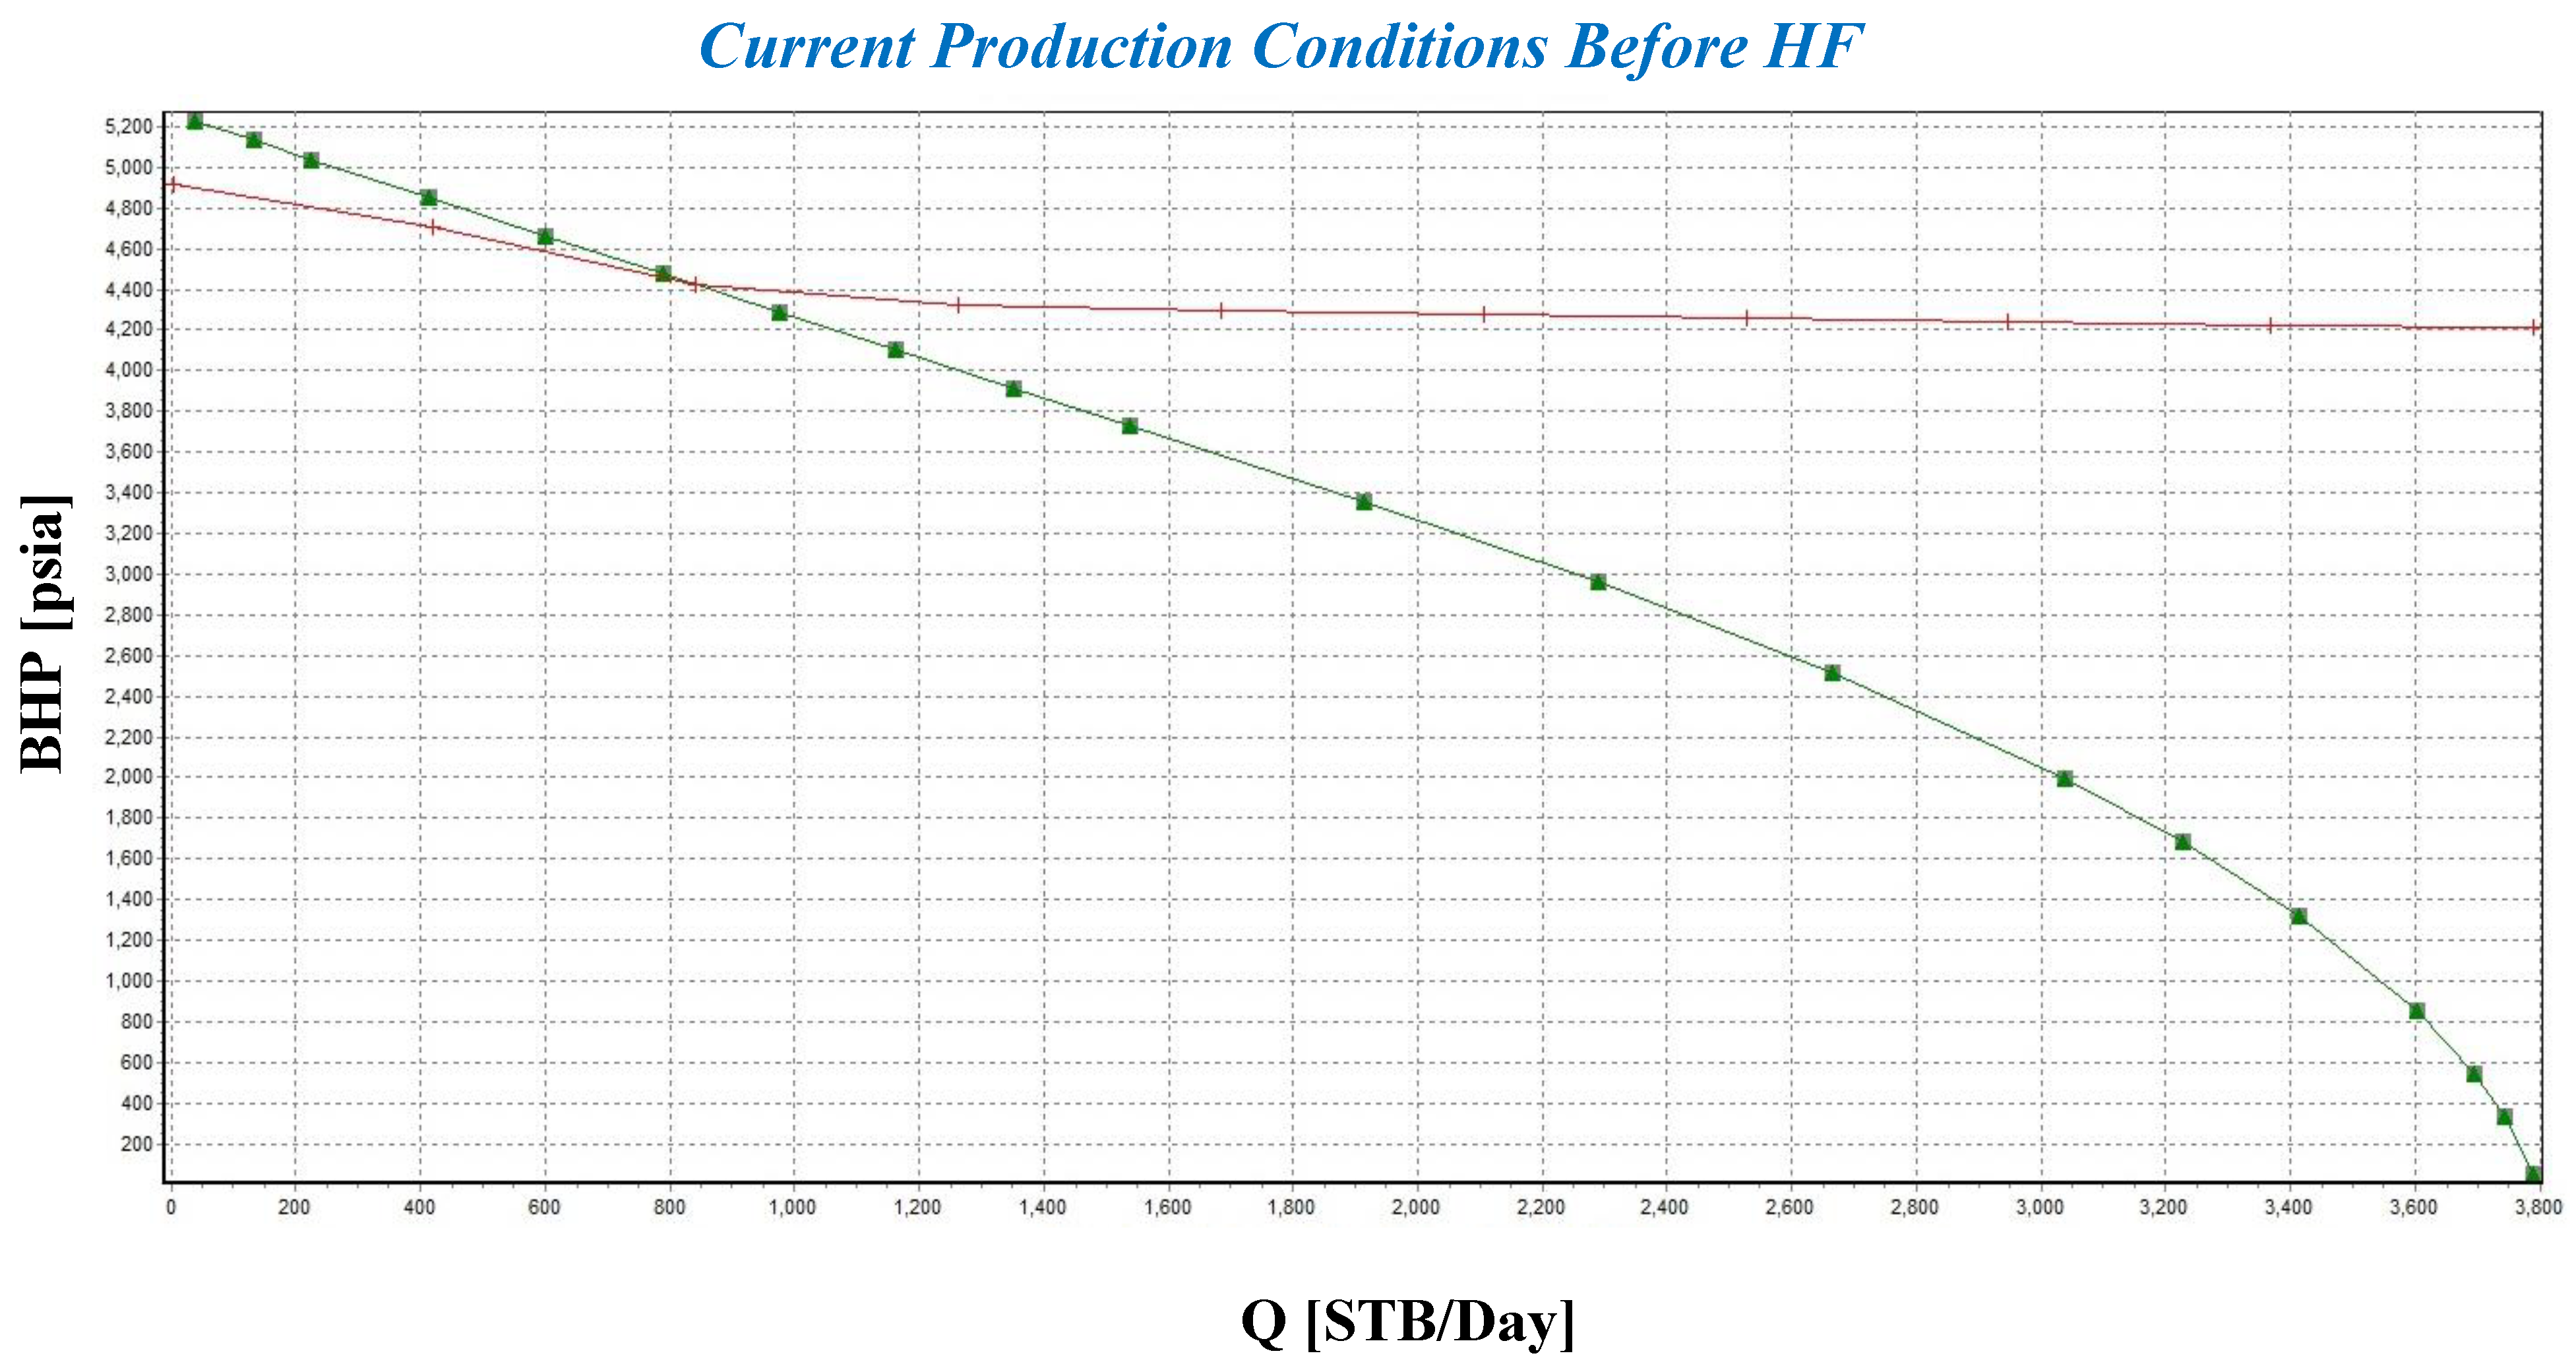
Figure 14.
Production parameters after hydraulic fracturing with sensitivity analysis on the fracture permeability ranging from 10 D (blue-color curve) to 100 D (green-color curve).
Figure 14.
Production parameters after hydraulic fracturing with sensitivity analysis on the fracture permeability ranging from 10 D (blue-color curve) to 100 D (green-color curve).

Table 1.
Input rock and fluid properties required for optimization of acid fracturing of this work.
| Parameter | Value | |
|---|---|---|
| Rock Properties | Porosity | 6.5% (on average) (depth-based well log is given) |
| Permeability | 4 mD | |
| Rock Compressibility | 10−5 1/psi | |
| Reservoir Thickness (perforation Interval in Cased Hole): | 128 m (3657–3785 m) (420 ft) | |
| Acid Coefficients | Limestone Reaction Order | 0.7 |
| Dolomite Reaction Order | 0.3 | |
| Limestone Reaction Rate | 1600 mole/s | |
| Dolomite Reaction Rate | 0.005 mole/s | |
| Fluid Properties | Viscosity at 116 °C (240 °F) | 1.66 |
| Oil API Gravity | 24.3 | |
| Oil Formation Volume Factor, Bo | 1.141 bbl/STB | |
| Pore Pressure | (measured versus depth) | |
| Bubble Point Pressure | 1439 psi | |
| Oil Pressure Gradient | 0.35 psi.ft | |
| Gas Oil Ratio | 430 scf/STB | |
| Oil Compressibility | 1/psi | |
| Water Compressibility | 1/psi | |
| CO2 | 1.2% | |
| N2 | 0.28% | |
| H2S | 0.47% | |
| HCl Acid Concentration | 15% | |
| Polymer Type | CMHPG#35_Zr_180 (Carboxy Methyl Hydroxyl Propyl Guar) | |
| Reservoir Pressure & Temperature | Pressure | 5255 psi |
| Temperature | 116 °C (240 °F) | |
| Temperature Gradient | 0.018 °C/m (0.01 °F/ft) | |
| Production Parameters | Gas Oil Ratio (GOR) | 385 scf/STB |
| Water Cut | 0.4% | |
| Productivity Index (before Hydraulic Fracturing) | 3.175 STB/Day/psi |
Table 2.
Candidate selection indices or criteria for acid fracturing.
| Total Fracability Index (TFI) | Containment Index (CI) | Thickness Index (TI) | Quality | |
|---|---|---|---|---|
| Perf-1 (3657–3700 m) (11,998–12,140 ft) | 0.41–0.56 (GMU-4 to 6) | 0.15–0.42 (Weak to Moderate) | 0.04–0.2 (Weak) | Mostly Moderate |
| Perf-2 (3738–3773 m) (12,264–12,379 ft) | 0.41–0.51 (GMU-4 to 5) | 0.002–0.27 (Very Weak to Weak) | 0.03–0.17 (Weak) | Very Weak to Weak |
| Perf-3 (3777–3785 m) (12,392–12,418 ft) | 0.41–0.6 (GMU-4 to 6) | 0.12–0.46 (Very Weak to Moderate) | 0.17–0.17 (Weak to Moderate) | Mostly Moderate |
Table 3.
Optimized fracture geometrical sizes.
| Parameter | Value | |
|---|---|---|
| Lf: | 148 m | (485.58 ft) |
| Hf: | 64 m | (209.98 ft) |
| Wf: | 0.0962 in | (0.008 ft) |
Table 4.
Sensitivity analysis of fracture permeability on production conditions.
| Kf [D] | Q [STB/D] | BHP [psi] | |
|---|---|---|---|
| Value | Characteristic | ||
| 10 | Poor | 850 | 4483 |
| 20 | Medium | 972 | 4440 |
| 50 | Good | 1270 | 4350 |
| 100 | Excellent | 1525 | 4304 |
Publisher’s Note: MDPI stays neutral with regard to jurisdictional claims in published maps and institutional affiliations. |
© 2022 by the authors. Licensee MDPI, Basel, Switzerland. This article is an open access article distributed under the terms and conditions of the Creative Commons Attribution (CC BY) license (https://creativecommons.org/licenses/by/4.0/).
Share and Cite
MDPI and ACS Style
Ashena, R.; Aminzadeh, F.; Khoramchehr, A. Production Improvement via Optimization of Hydraulic Acid Fracturing Design Parameters in a Tight Carbonate Reservoir. Energies 2022, 15, 1947. https://doi.org/10.3390/en15051947
AMA Style
Ashena R, Aminzadeh F, Khoramchehr A. Production Improvement via Optimization of Hydraulic Acid Fracturing Design Parameters in a Tight Carbonate Reservoir. Energies. 2022; 15(5):1947. https://doi.org/10.3390/en15051947
Chicago/Turabian StyleAshena, Rahman, Fred Aminzadeh, and Amir Khoramchehr. 2022. "Production Improvement via Optimization of Hydraulic Acid Fracturing Design Parameters in a Tight Carbonate Reservoir" Energies 15, no. 5: 1947. https://doi.org/10.3390/en15051947
Note that from the first issue of 2016, this journal uses article numbers instead of page numbers. See further details here.