
Water Invasion Law and Water Invasion Risk Identification Method for Deep Sea Bottom-Water Gas Reservoir

1
School of Petroleum Engineering, Northeast Petroleum University, Daqing 163318, China
2
Key Laboratory of Enhanced Oil Recovery, Northeast Petroleum University, Ministry of Education, Daqing 163318, China
3
School of Electrical Engineering & Information, Northeast Petroleum University, Daqing 163318, China
*
Author to whom correspondence should be addressed.
Energies 2022, 15(5), 1937; https://doi.org/10.3390/en15051937
Submission received: 18 January 2022
/
Revised: 15 February 2022
/
Accepted: 1 March 2022
/
Published: 7 March 2022
Abstract
:This study analyzes the water invasion characteristics and water encroachment of the deep sea bottom-water gas reservoir (LS17 field) in the South China Sea for the purpose of developing horizontal wells. Gas-producing profile tests and a three-dimensional (3D) water invasion simulation are used to produce a quantitative analysis of the bottom-water cresting influence factors. On this basis, we establish a suitable risk identification method for the water influx of a deep bottom-water reservoir. The results show that: (1) During the development of a bottom-water gas reservoir, the water ridging is affected by reservoir heterogeneity, production system and heel–toe effect of a horizontal wellbore, and reservoir heterogeneity is the main influencing factor; (2) the horizontal–vertical ratio of the well area determines whether the gas well productivity will be affected by the risk of water invasion. The stronger the reservoir heterogeneity, the smaller the safety limit value of the horizontal–vertical ratio; (3) when the permeability differential increases gradually, the safety limit value of the transverse longitudinal ratio decreases in turn; (4) based on the relationship curve between permeability level difference and the safety limit value of the horizontal–vertical ratio in the well area, the horizontal–vertical ratio of the N1H well is far greater than the safety limit value. The well is at high risk of water invasion and should be developed by water control. In order to improve deep seabed water and gas reservoirs, water control development should be carried out in well areas with sufficient water energy and high water invasion risk. The water invasion characteristics of bottom-water gas reservoirs under different water control technologies (such as variable density screen technology, filling water blocking, breathable coated gravel technology, etc.) and production systems (periodic gas production technology) should be studied. The research results can not only judge the water invasion risk of deep seabed water and gas reservoirs under different permeability levels and gas production rates but also provide a reference for water control development of offshore and onshore bottom-water and gas reservoirs.
1. Introduction
In recent years, Yacheng, Lingshen and other large deepwater gas fields have been discovered in the process of oil and gas exploration in the South China Sea [1], in which the oil and gas resources in the deep-water area account for 70% of the total resources. The structure of the LS gas field is located in the central valley of Lingshui Sag, Qiongdongnan Basin. The main producing layers are located in the classes I, II, III and IV of the Paleogene Huangliu Formation, with burial depth ranging from 3200 to 3400 m and about 1900 m below the mud line. The geological reserves of natural gas are 1014.2 × 108 m3, and the geological reserves of bottom-water gas reservoir are 712.0 × 10⁸ m3. The average distance between the bottom–waterfront interface and the top of the gas reservoir is 33 m, indicating a high risk of water invasion after production [2,3]. Because water invasion will reduce the recovery efficiency of water gas reservoirs, it is of great significance to clarify the water invasion mechanism and put forward an effective water invasion risk identification method for the efficient development of water gas reservoirs. Fang Feifei et al. [4], Zubarev et al. [5], Guo Chengfei et al. [6], and Sheng Ruyan et al. [7] all show that the influencing factors of water invasion in water gas reservoirs are complex, and reservoir heterogeneity is one of the main factors. Liu Huaxun et al. [8] believed that the stronger the reservoir heterogeneity was, the faster the formation water advanced and the earlier the water appeared in the gas well. For bottom-water gas reservoirs, the horizontal/vertical ratio of the well area is also a key factor causing water invasion risk, but no relevant research results have been reported publicly. Scholars have also studied the identification methods of water invasion in gas reservoirs with water. Xu Changhai et al. [9] proposed a quantitative identification method to judge the dominant direction of water intrusion. Deng Chenggang et al. [10] believed that the apparent geological reserve method could be used to discover the characteristics of water invasion in pore type and relatively homogeneous weak water drive gas reservoirs earlier. Li Yong et al. [11] proposed a water-penetration risk assessment method for water drive gas reservoirs.
At present, there is still a simple and universal method to identify water invasion in bottom-water gas reservoirs. To this end, based on the geological characteristics, water features and development of the deep South China Sea field, the authors assess the development of a horizontal well using gas-producing profile tests and a large 3D bottom-water gas reservoir water invasion simulation experiment [12]. In order to provide guidance for the development of offshore and onshore bottom-water gas reservoirs, a quantitative analysis of the bottom-water cresting influence factors is used to establish a suitable risk identification method for bottom-water reservoir water invasion.
2. Geological Characteristics of LS Gas Field
2.1. Reservoir Physical Characteristics
The core porosity of the LS gas field is 21.4%~36.3%, the average porosity is 30.4%, the gas permeability is 92~2563 mD, the average permeability is 552 mD, and the overall physical properties are good, including high permeability and high porosity. The horizontal section of well N1H in the LS17 area is 300 m, the formation pressure is 39.6 MPa, the formation temperature is 90.7 °C, and the gas production in the trial production stage is 63~664 × 104 m3/d. The average distance between the bottom-waterfront interface and the top of the gas reservoir is 66 m, the relative density of natural gas is 0.642, and the dissolved gas–oil ratio is up to 16,044.6 m3/m3. The effect of condensate on gas well production can be ignored. The permeability distribution along the horizontal well is shown in Table 1.
2.2. Water Characteristics
The water characteristic parameters of each well area of the LS17 gas field are shown in Table 2. Only two blocks (LS17-2 and LS17-3) develop edge water, and the distance between the wells (N2, N4) and edge water is far, being 376 and 543 m, respectively. Bottom water is developed in other well areas. The maximum distance between the bottom of the gas well and the bottom water is 66 m, the minimum is 13.2 m, and the average is 39.54 m. Because the well area with bottom water is large, the average control area is up to 24 km2, resulting in the risk of water invasion.
2.3. Development Characteristics
The gas well is a horizontal well, and the bottom-water ridge is formed in the development process because of reservoir heterogeneity, the heel–toe effect and production pressure difference [13,14]. In order to form the water control development technology of the bottom-water gas reservoir, it is necessary to clarify the influence mechanism of the above factors on bottom-water water invasion, and on this basis, establish the quantitative relationship between gas well productivity and water invasion degree.
3. Horizontal Well Gas Production Profile Test
3.1. Experimental Purpose
For a deep seabed water reservoir, when a horizontal well is used for development, if the radial inflow of the gas production profile along each section of the horizontal well is more balanced, the influence degree of water invasion will be less, while if the gas production profile is more volatile and jumping, the influence degree of water invasion will be greater. Therefore, the effects of reservoir heterogeneity, heel–toe effect, production pressure difference and water avoidance height on water invasion were quantitatively revealed through laboratory tests of the horizontal well gas production profile along the course.
3.2. Experimental Steps and Scheme
The experimental steps are as follows: (1) Connect each piece of experimental equipment according to Figure 1, put the core with a length of 10 cm into each core gripper, and close all valves; (2) open source, open 1~6 one-way valves, observe the cylinder pressure gauge, open the outlet valve after the pressure is stable, and after achieving a stable gas meter reading, set the production pressure differential to 0.4 MPa (corresponding to the gas recovery rate 3%), read the stable production in the process of 1~6 gas meter record gas flow, drawing from the section producing gas; (3) adjust the production pressure difference, read the gas flow rate recorded by number 1–6 gas flowmeter in the stable production process, and draw the corresponding gas production profile; (4) according to the designed experimental scheme, combine cores with different permeabilities and repeat the above experimental steps (1–3). The experimental scheme parameters are shown in Table 3.
For the above experiments, the following two points need to be explained: (1) The gas source, core and high-pressure airtight container set of the horizontal well are linked together, which can truly reflect the horizontal wellbore flow and reservoir percolation in the development process of the coupling, as well as the high-pressure airtight container space in rooms 1~6. This enables testing the radial inflow volume along the wellbore sections, thereby reproducing the horizontal wellbore according to the gas-producing profile; (2) for an experiment without a horizontal well group, the first part of the device in Figure 1 should be removed, and the second part of the device should be used for the test experiment without wellbore influence. After opening the gas source, the stable gas flow through cores number 1~6 should be recorded.
3.3. Analysis of Experimental Results
The deviation degree (δ) of gas production along a certain section of a horizontal wellbore can be calculated as follows:
Type: QLi—the radial flow of the horizontal well along the i section, mL/min; Qk—the radial flow mL/min of the wellbore section when the reservoir permeability is averaged.
3.3.1. Influence of Reservoir Heterogeneity
Firstly, the positive sequence of cores with permeability of 100, 500, 1000, 2000 and 2500 mD were connected in parallel, and the gas-producing profile test with and without horizontal wells was carried out with a production pressure difference of 0.4 MPa. As shown in Figure 2, the higher the reservoir permeability, the greater the gas flow in the corresponding horizontal section. Under the influence of the heel–toe effect, the gas flow at the end of the horizontal well will decrease. As shown in Table 4, when the permeability difference is 10, δ has reached 276.3%.
Then, the position of the core was adjusted to test the gas production profile with and without horizontal wells. Six test points are set along the horizontal wellbore, and the core permeability is 100, 2000, 2500, 1500, 1000 and 500 mD, respectively. In general, the higher the reservoir permeability, the greater the gas flow in the horizontal section (Figure 2 and Figure 3), and the high permeability reservoir is the dominant channel for the formation of the bottom-water ridge. At the same time, a different understanding is obtained. In heterogeneous reservoirs, if the heel of the horizontal wellbore is located in the low permeability reservoir and its toe is located in the high permeability reservoir, the heel–toe effect can weaken the deviation degree of the gas-producing profile, and vice versa, it can enhance the deviation degree. As shown in Figure 2 and Figure 3, reservoir heterogeneity has a greater impact on whether the gas-producing profile is balanced. Therefore, in order to prevent the formation of a bottom-water ridge, it is very important to reduce the influence of reservoir heterogeneity.
3.3.2. Influence of Heel–Toe Effect
Five cores with the same permeability (100, 500, 1000, 2000 and 2500 mD) were used to simulate the homogeneous reservoir. The horizontal well gas production profile test was carried out under the production pressure difference of 0.4 MPa, and then the δ along the horizontal wellbore of each group was calculated. As shown in Figure 4, due to the heel–toe effect in the horizontal wellbore, δ increases gradually from heel to toe of the horizontal well, and the higher the reservoir permeability, the higher the δ. Therefore, in order to prevent the formation of a bottom-water ridge, reducing the heel gas production of the horizontal well or increasing the toe gas production can play a certain role in controlling the balanced gas production profile.
3.3.3. Influence of Production Pressure Difference
Five cores with a permeability of 500 mD were used to simulate a homogeneous reservoir, and the horizontal well gas production profile test was carried out under the production pressure differential conditions of 0.2, 0.4, 0.6, 0.8, 1.0 and 2.0 MPa, and then the δ along the horizontal wellbore of each experimental group was calculated. As shown in Figure 5, with the increase in production pressure difference, δ increases gradually along the horizontal wellbore. When the production pressure difference is 2 MPa, the δ difference of the toe and heel can reach 35.2%. When the production pressure difference is less than 1 MPa, the difference values of δ along the horizontal wellbore are all less than 5% under different production pressure differences. Therefore, the critical production pressure difference can be set as 1 MPa. As long as it is below this critical value, the change of production pressure difference has little influence on the gas production profile. In general, the production pressure difference is one of the factors affecting the water invasion rate, and the adverse effects of water invasion on gas reservoir development can be alleviated by optimizing the production system.
3.3.4. Influence of Water Repellent Height
Five cores with the same permeability (100, 500, 1000, 2000 and 2500 mD) were used to simulate the homogeneous reservoir. Different core lengths are used to simulate the water avoidance height. The core lengths are 5, 10, 15, 20, 25 and 30 cm, respectively, and the horizontal well gas production profile test was conducted under the condition of 0.4 MPa production pressure difference. Then, the delta along the horizontal wellbore of each group was calculated. As shown in Figure 6, the experimental results show that the increase in the water escape height has little influence on δ along the horizontal wellbore. However, under the condition of the same water invasion rate, the water appearance time of the gas well will be delayed. It can be seen that the water escape height also has a certain influence on the final cumulative gas production of gas wells.
3.4. Discussion of Experimental Results
- (1)
- Reservoir heterogeneity results in small δ, small energy loss, and strong gas flow along the high permeability zone of the wellbore, resulting in a fast bottom-water ridge speed, which is the main seepage channel for water intrusion. Reservoir heterogeneity and uneven distribution of the production pressure profile in the wellbore are the root causes of uneven advances of a bottom-water front between units and in the region. Eliminating heterogeneity and maintaining the pressure balance in the wellbore are at the core of controlling the water body ridge in advance [15,16,17];
- (2)
- The heel–toe effect has a great influence on horizontal wellbore δ. The main reason is that after the wellbore pipe flow of the horizontal well forms a coupled flow with the reservoir seepage, the additional acceleration resistance formed by the radial inflow of the horizontal downhole section increases the flow resistance in the process of the fluid from the upstream section to the downstream, resulting in the heel–toe effect in the development of the horizontal well and the imbalance of the production pressure profile along the wellbore. The funnel-shaped distribution of the pressure gradually decreases from toe to heel [18,19,20];
- (3)
- The unreasonable setting of the production system (production differential pressure) leads to the aggravation of the horizontal well along the wellbore δ, affecting the migration rate of the water ridge interface. The pressure drop rate of the gas layer is greater than the pressure supplement rate of the bottom-water layer, resulting in the increase in the real ridge advance pressure difference between the bottom-water layer and the gas layer and the gradual aggravation of the bottom-water invasion. A reasonable production pressure difference is the key point of controlling the water body ridge;
- (4)
- The effect and impact of water avoidance height on δ along the wellbore is small, but it will have a great impact on the productivity of horizontal wells. For a bottom-water drive gas reservoir, the flow capacity of the gas phase is much stronger than that of the water phase. If the height of avoiding water is insufficient and the water body reaches the horizontal wellbore, a large amount of gas has not been produced on both wings of the gas reservoir, and the water body enters the wellbore, which will seriously affect the productivity of gas wells.
For bottom-water gas reservoirs, it is necessary to formulate “3 in 1” cooperative gas production and water control countermeasures. Through the water control technology, the pressure profile in the wellbore is as flat as possible, so that there is no difference in flow resistance, the flow energy loss in the horizontal section is reduced, superconductivity is achieved or the uneven pressure distribution is solved, a new flow channel is setup, a synchronous pressure relief bottom is added, and a uniform advance of the bottom-water front is achieved.
4. Large-Scale 3D Physical Simulation Experiment of Water Invasion in Bottom-Water Gas Reservoir
4.1. Experimental Purpose
The water invasion risk identification experiment is carried out to study the water invasion law of bottom-water gas reservoirs under the comprehensive influence of water escape height, reservoir heterogeneity and the heel–toe effect, and then establish the water invasion risk identification method. In a real 3D geological reservoir, the influence of the water escape height on bottom-water gas reservoir development and the water invasion law of bottom-water gas reservoir development after the comprehensive influence of reservoir heterogeneity, the heel–toe effect and production pressure differences are clarified, and the method of identifying the water invasion risk mechanism of the bottom-water gas reservoir is established.
4.2. Experimental Methods and Steps
The experimental device is shown in Figure 7. The length, width and height of the kettle body are 500 mm, and 25 groups of electrode probes are set inside the kettle body, with 125 test points in total. The experimental device is used to test the variation of water saturation and production data of the bottom-water drive gas reservoir under different exploitation conditions, and then the risk of water invasion is evaluated [21,22,23,24]. Based on the N1H gas well parameters and similarity criteria [25], the production pressure difference was set as 0.4 MPa (corresponding to 3% gas production rate), and the horizontal section length of the simulated well was set as 30 cm. In order to further study the law of bottom-water ridging, the water shelter height is set as 30 cm. However, if the water shelter height is fixed, problems will be encountered in setting the horizontal and vertical ratio of the well area later. For example, when the horizontal to vertical ratio of the well area is set to 20, the length of the gas reservoir should be set as 600 cm, while the internal size of the kettle body is less than 600 cm. Therefore, a large 90 L gas storage tank (connected with a No. 2 valve) should be connected to the existing kettle body according to the virtual length (600 cm), so as to obtain the equivalent gas storage of 0.12 m3. For the experimental kettle body, the experimental steps are as follows: (1) The horizontal well is arranged with a diameter of 6 mm and an opening degree of 0.3, and holes are evenly distributed. The kettle body is filled with quartz sand and the bottom-water layer separator is installed (two steel separators with a 90-mesh screen and uniform holes), and the bottom-water layer thickness is 10 cm; (2) saturate the water and measure the pore volume of the gas reservoir model (32.6 L), then saturate the gas until the pressure in the kettle reaches 30 MPa; (3) the bottom-water pressure is stabilized at 30 MPa, and the horizontal well is produced at a 0.4 MPa production pressure difference. The gas production and water production are recorded, and the bottom-water front advance of the gas reservoir is observed by real-time computer inversion until the water cut at the produced end reaches 98%. Special attention should be paid to the following two points: (1) We simulated the reservoir’s heterogeneity in a large sand-filled model. In order to have a filling with a low permeability, we divided the kettle body’s interior space into several small spaces with slots in the steel partitions; (2) the number 2 valve is connected with a large gas storage tank and, to ensure that the ridging bottom-water does not flow back into the tank, a one-way valve is required near the number 2 valve.
4.3. Experimental Scheme
Experimental parameters of each group are shown in Table 5. The horizontal and vertical ratio of the well area is the ratio of the larger value in the length and width of the well area to the water-repellent height. In addition, the production pressure difference of each group is 0.4 MPa, and the water-repellent height is 30 cm. Scheme WS-6~16 simulates the production dynamics of heterogeneous bottom-water gas reservoirs. With a 15 cm horizontal wellbore as the boundary, quartz sand is filled on the left side of the kettle body to form a high permeability area, and quartz sand is filled on the right side of the kettle body to form a low permeability area.
4.4. Experimental Results
4.4.1. Homogeneous Reservoir
As shown in Figure 8a–c, for homogeneous reservoirs, when the horizontal/vertical ratio of the well area is less than 40 (WS-1, WS-2, WS-3), no water is found at the producing end until the end of development, and the recovery rate of simulated gas reservoirs is close to 100%. It can be seen that for homogeneous reservoirs, the small horizontal/vertical ratio of the well area has basically no effect on the recovery rate of gas reservoirs. When the horizontal and vertical ratio of the well area is 60 (WS-4), the water flowing into the bottom ridge significantly shorted the stable production period of the gas well, and the recovery rate of the gas reservoir decreased to 87.68%. The three-dimensional section of the model shows that the gas saturation of the reservoir in the horizontal well has decreased when the water cut at the produced end is 98% (Figure 8d). When the horizontal/vertical ratio of the well area was 77 (WS-5), the recovery rate was reduced to 68.07%, and the impact of bottom-water invasion was serious (Figure 8d). The curve of the relationship between the transverse/longitudinal ratio and recovery factor was fitted, and the transverse/longitudinal ratio corresponding to the inflection point of the curve was 43.52, which was the safe limit value of the transverse/longitudinal ratio. If the horizontal/vertical ratio is greater than this value, it is necessary to control the water development of the bottom-water reservoir. If it is less than this value, the effect of bottom-water invasion on the gas reservoir development can be ignored.
4.4.2. Heterogeneous Reservoir
As shown in Figure 9a–c, for heterogeneous reservoirs (permeability level difference is 10), when the horizontal to vertical ratio of well area is less than 20 (WS-6 and WS-7), the bottom-water front does not reach the horizontal wellbore at the end of gas production, and the recovery of the gas reservoir is close to 100%. When the horizontal/vertical ratio of the well area is 40 (WS-8), the steady production period of the gas well is shortened significantly due to water intrusion, and the recovery rate of the gas reservoir is 88.08%. When the horizontal/vertical ratio of the well area was 77 (WS-10), the 3D section showed severe water intrusion (Figure 9d) and the recovery rate was reduced to 55.08%. The safety limit of the ratio is 22.75 after fitting the curve of the relation between the ratio and the recovery factor. When the horizontal/vertical ratio of well area is less than 20, regardless of whether the reservoir is homogeneous or heterogeneous, the development results show that the bottom-water front does not reach the horizontal wellbore, and the recovery rate of the gas reservoir is close to 100%. This indicates that when the horizontal/vertical ratio of well area is small, the reservoir heterogeneity does not affect the recovery rate of the gas reservoir. For homogeneous reservoirs, when the horizontal to vertical ratio of the well area is greater than 60, the water ridge will affect the productivity of the gas well, while for heterogeneous reservoirs, when the horizontal to vertical ratio of well area is greater than 40, the water ridge will affect the productivity of the gas well, indicating that reservoir heterogeneity accelerates the speed of the water ridge. It can be seen that the horizontal/vertical ratio of the well area determines whether the gas well productivity is affected by water invasion, and the heterogeneity of the reservoir will affect the identification limit of the water invasion risk. Furthermore, the stronger the reservoir heterogeneity, the smaller the horizontal/vertical ratio safety limit value. The experimental results show that when the permeability level difference is 1, 10, 20 and 30, the safety limit value of the transverse/longitudinal ratio is 43.52, 22.75, 13.08 and 6.44, respectively. On this basis, the relationship between permeability level difference and the safety limit value of the horizontal/vertical ratio of the well area is established (Figure 10). Based on this relationship, we establish whether the horizontal/vertical ratio will cause water invasion risk for a bottom-water gas reservoir with a permeability level difference ranging from 1 to 30 and gas recovery rate of 3%,
For well N1H, the reservoir plane permeability level difference is 30, the average length of the well area is 5.15 km, the vertical water escape height of the horizontal well is 66.8 m, and the transverse/vertical ratio is 77.13, which is far greater than the safety limit value of the transverse/vertical ratio of 6.44. As a result, the well is at high risk of water intrusion and must be developed with water control.
The horizontal and vertical ratio of the well area directly determines whether the gas well productivity is affected by water invasion risk. At the same time, the heterogeneity of the reservoir will affect the identification limit of the water invasion risk. The heterogeneity shows the characteristics of aggravating the water invasion speed. The increase in the reservoir grade difference will shorten the time from the water ridge to the bottom of the well, that is, the stronger the heterogeneity of the reservoir, the smaller the horizontal and vertical ratio limit value of the water invasion risk discrimination. The experimental results show that the horizontal and vertical ratio of the water invasion risk limit of the well area developed by a homogeneous reservoir with a bottom-water gas reservoir (permeability level difference is 1) is 43.52, and the horizontal and vertical ratio of the water invasion risk limit of a well area developed by a heterogeneous reservoir with a bottom-water gas reservoir (permeability level difference is 10) becomes 22.75.
5. Water Control Development Strategy for Bottom-Water Gas Reservoir
According to the physical characteristics of development wells of the bottom-water gas reservoir, the water invasion risk is determined in this paper. If the transverse/vertical ratio is greater than the safety limit, it is necessary to carry out water control development of the gas well to limit the impact of a bottom-water ridge on gas well development [26,27].
The goal of water control in the horizontal wellbore of a bottom-water gas reservoir is to make the pressure profile in the wellbore as gentle as possible, so as to make no difference in flow resistance, reduce the flow energy loss in the horizontal section, achieve superconductivity or solve the uneven pressure distribution, set up a new flow channel, add synchronous pressure relief bottom hole, and force the front edge of the bottom-water to advance evenly [28].
Aiming at the water control development of a deep seabed water gas reservoir, the following strategies are put forward [29,30,31,32,33]: (1) To suppress the uneven inflow of bottom-water by improving the heel–toe effect of a horizontal wellbore and weakening the influence of reservoir heterogeneity. The corresponding water control measures are the annular multi-stage artificial bottom hole technology [34] and variable density screen technology suitable for horizontal wells; (2) the exploitation system should be regulated to prevent the formation of uneven water invasion, and the corresponding water control measures should be periodic gas recovery technologies; (3) a water-blocking barrier was established near the bottom of the well to suppress the ridge of the front water head, and the corresponding measures were filling the horizontal well with permeability and water-blocking gravel technology; (4) the comprehensive technology of water control and development for deep seabed water gas reservoirs is formed, in which all stages complement and accommodate each other.
6. Conclusions
Based on the experiment, this paper studies the influence of different factors on the gas production profile along the horizontal wellbore and the variation law of gas well productivity under different reservoir physical properties, establishes the water invasion risk identification mechanism of edge and bottom-water gas reservoirs, and analyzes the water control development strategy of bottom-water gas reservoirs. The specific research conclusions and water control development strategies are as follows:
- (1)
- During the development of bottom-water gas reservoirs, water ridging is mainly affected by reservoir heterogeneity, the production system and the heel–toe effect of horizontal wellbores, and the influence degree of the above three factors on water influx decreases successively.
- (2)
- The horizontal/vertical ratio of the well area determines whether the gas well productivity is affected by water invasion, and the heterogeneity of the reservoir will affect the identification limit of water invasion risk. The stronger the reservoir heterogeneity, the smaller the horizontal/vertical ratio safety limit value. When the permeability level difference is 1, 5, 10, 20 and 30, the safety limit value of the horizontal/vertical ratio is 43.52, 32.86, 22.75, 13.08 and 6.44, respectively.
- (3)
- Based on the established relationship curve between permeability level difference and the safety limit value of the transverse/longitudinal ratio in the well area, the reservoir plane permeability level difference and transverse/longitudinal ratio of well N1H are 30 and 77.13, which are far greater than the safety limit value of the transverse/longitudinal ratio (6.44). The well is subject to a high risk of water invasion and must be controlled by water development.
- (4)
- Water control development strategies for deepwater bottom-water gas reservoirs include: (1) Reducing the heel–toe effect of the horizontal wellbore and the influence of reservoir heterogeneity to inhibit the uneven inflow of bottom-water. The corresponding water control measures are the annular multi-stage artificial bottom hole technology and variable density screen technology suitable for horizontal wells; (2) the exploitation system should be regulated to prevent the formation of uneven water invasion, and the corresponding water control measures should be periodic gas recovery technologies; (3) a water-blocking barrier was established near the bottom of the well to suppress the ridge of the front water head, and the corresponding measures were filling the horizontal well with permeability and water-blocking gravel technology; (4) the comprehensive technology of water control and development for deepwater and bottom-water gas reservoirs is formed, in which each stage complements and accommodates each other.
Author Contributions
Conceptualization, J.Z. and L.B.; methodology, G.Q.; formal analysis, J.Z.; data curation, N.J. and R.Z.; writing—review and editing, J.Z. and L.B.; project administration, J.Z. and G.Q. All authors have read and agreed to the published version of the manuscript.
Funding
The project is supported by the reform and development fund of local universities supported by Heilongjiang Provincial undergraduate universities (2020YQ17). This study was supported by “Study on Water Invasion Mechanism and Seepage Law of Deep Water Gas Reservoir” (2019YDL-08) and “Research on Optimization Method of Oilfield Injection Production Strategy Based on Intelligent Optimization Algorithm” (2020YDL-25).
Institutional Review Board Statement
Not applicable.
Informed Consent Statement
Not applicable.
Data Availability Statement
All relevant data have been presented in this paper.
Conflicts of Interest
The authors declare no conflict of interest.
References
- Zhang, K.; Lu, R.; Zhang, L.; Zhang, X.; Yao, J.; Li, R.; Zhao, H. A two-stage efficient history matching procedure of non-Gaussian fields. J. Pet. Sci. Eng. 2016, 138, 189–200. [Google Scholar] [CrossRef]
- Han, J.F.; Zhang, H.Z.; Yu, H.F.; Ji, Y.G.; Dong, R.X. Hydrocarbon accumulation characteristic and exploration on large marine carbonate condensate field in Tazhong Uplift. Acta Petrol. Sin. 2012, 28, 769–782. [Google Scholar]
- Liu, Y.; Wang, H.; Meng, W.; Zhang, C.; Zhi, J.; Shen, A. Stimulation experiment of horizontal wells filled with permeable and water-blocking gravel in deepsea bottom-water gas reservoirs. Nat. Gas Ind. 2020, 40, 61–68. [Google Scholar] [CrossRef]
- Fang, F.F.; Li, X.Z.; Gao, S.S.; Xue, H.; Zhu, W.Q.; Liu, H.X.; An, W.G.; Li, C.H. Visual simulation experimental study on water invasion rules of gas reservoir with edge and bottom water. Nat. Gas Geosci. 2016, 27, 2246–2252. [Google Scholar]
- Zubarev, D.; Nnebocha, E.; Vasper, A. Feasibility study and selection process for ICD applications in an offshore Niger Delta Field. In Proceedings of the SPE Nigeria Annual International Conference and Exhibition, Lagos, Nigeria, 6–8 August 2018. [Google Scholar] [CrossRef]
- Guo, C.F.; Li, H.B.; Tao, Y.; Lang, L.Y.; Niu, Z.X. Water invasion and remaining gas distribution in carbonate gas reservoirs using core displacement and NMR. J. Cent. South Univ. 2020, 27, 531–541. [Google Scholar] [CrossRef]
- Sheng, R.; Li, X. Influences of gas recovery rate and aquifer size on production of sandstone water-drive gas reservoirs. Pet. Explor. Dev. 2005, 32, 94–97. [Google Scholar]
- Huaxun, L.; Dong, R.; Shusheng, G.; Zhiming, H.; Liyou, Y.; Xia, L. Water influx mechanism and development strategy of gas reservoirs with edge and bottom water. Nat. Gas Ind. 2015, 35, 47–53. [Google Scholar]
- Xu, C.; Tao, J.; Wang, J.; He, F.; Zhang, Q.; Zhou, G. A quantitative recognition method on water-invasion direction in edge-water gas reservoirs: An example from bioreef gas reservoirs of Changxing Formation, Huanglongchang structure, eastern Sichuan Basin. Nat. Gas Explor. Dev. 2019, 42, 90–96. [Google Scholar]
- Deng, C.; Li, J.; Chai, X.; Chen, F.; Yang, X.; Wang, H. Early identification methods of water invasion in weak water drive gas reservoirs in Sebei gas field, Qaidam Basin. Lithol. Reserv. 2020, 32, 128–134. [Google Scholar]
- Li, Y.; Zhang, J.; Li, B. New method of aquifer influx risk classification for wells in gas reservoir with aquifer support. Nat. Gas Geosci. 2016, 27, 128–133. [Google Scholar]
- Shen, W.J.; Li, X.Z.; Liu, X.H.; Lu, J.L.; Jiao, C.Y. Physical simulation of water influx mechanism in fractured gas reservoirs. J. Cent. South Univ. (Sci. Technol.) 2014, 45, 3283–3287. [Google Scholar]
- Zou, W.; Yao, Y.; Wang, Q. Study on influential factors of water cresting morphology in horizontal well of bottom water reservoirs. Pet. Geol. Recovery Effic. 2017, 24, 70–77. [Google Scholar]
- Kabir, C.S. Predicting gas well performance coning water in bottom-water-drive reservoirs. In Proceedings of the SPE Annual Technical Conference and Exhibition, San Francisco, CA, USA, 5–8 October 1983. [Google Scholar] [CrossRef]
- Wang, Y.; Chen, J.; Li, B.; Jiang, W.; Wang, X. Study on water production characteristics of Dixi 18 volcanic gas reservoir. Nat. Gas Explor. Dev. 2013, 36, 48–52. [Google Scholar]
- Shen, W.J.; Liu, X.H.; Li, X.Z.; Lu, J.L. Water coning mechanism in Tarim fractured sandstone gas reservoirs. J. Cent. South Univ. 2015, 22, 344–349. [Google Scholar] [CrossRef]
- Zendehboudi, S.; Elkamel, A.; Chatzis, I.; Ahmadi, M.A.; Bahadori, A.; Lohi, A. Estimation of breakthrough time for water coning in fractured systems: Experimental study and connectionist modeling. AICHE J. 2014, 60, 1905–1919. [Google Scholar] [CrossRef]
- Tan, Y.; Li, H.; Jiang, B.; Wang, Y.; Nan, Z. A non-steady state model of gas reservoir and horizontal wellbore coupling based on volume source. Reserv. Eval. Dev. 2018, 8, 24–29. [Google Scholar] [CrossRef]
- Yong, L.I.; Jing, Y.A. Water-cut rising patterns and optimal water injection techniques of horizontal wells in thin carbonate reservoir with bottom water. Lithol. Reserv. 2019, 31, 135–144. [Google Scholar]
- Guo, D. The Water Cone Problem of a Horizontal Well in Bottom Water Reservoir. J. Southwest Pet. Univ. (Sci. Technol. Ed.) 1995, 17, 119–123. [Google Scholar]
- Fang, F.; Shen, W.; Gao, S.; Liu, H.; Wang, Q.; Li, Y. Experimental Study on the Physical Simulation of Water Invasion in Carbonate Gas Reservoirs. Appl. Sci. 2017, 7, 697. [Google Scholar] [CrossRef] [Green Version]
- Fang, F.; Shen, W.; Li, X.; Gao, S.; Liu, H.; Li, J. Experimental study on water invasion mechanism of fractured carbonate gas reservoirs in Longwangmiao Formation, Moxi block, Sichuan Basin. Environ. Earth Sci. 2019, 78, 1–11. [Google Scholar] [CrossRef]
- Zhou, M.; Li, X.; Hu, Y.; Xu, X.; Jiang, L.; Li, Y. Physical Simulation Experimental Technology and Mechanism of Water Invasion in Fractured-Porous Gas Reservoir: A Review. Energies 2021, 14, 3918. [Google Scholar] [CrossRef]
- Hu, Y.; Li, X.; Shen, W.; Guo, C.; Jiao, C.; Xu, X.; Jia, Y. Study on the Water Invasion and Its Effect on the Production from Multilayer Unconsolidated Sandstone Gas Reservoirs. Geofluids 2021, 2021, 5135159. [Google Scholar] [CrossRef]
- Shen, W.; Li, X.; Lu, J. Similarity theory of physical simulation in the development of abnormal pressure gas reservoirs. Sci. Technol. Eng. 2013, 13, 10460–10465. [Google Scholar]
- Cao, P.; Chang, S.; Ai, C.D.; Luo, X.; Zhao, J. Review of water cresting of horizontal well in bottom water driving reservoirs. J. Chongqing Univ. Sci. Technol. (Nat. Sci. Ed.) 2014, 63–66. [Google Scholar] [CrossRef]
- Yu, G.; Li, H.; Chen, Y.; Liu, L.; Zhang, D. Risk Decision-Making Technology in Gas Reservoir Development at Sichuan Basin. Shock Vib. 2021, 2021, 4890871. [Google Scholar] [CrossRef]
- Huang, X.; Guo, X.; Zhou, X.; Shen, C.; Lu, X.; Qi, Z.; Xiao, Q.; Yan, W. Effects of water invasion law on gas wells in high temperature and high pressure gas reservoir with a large accumulation of water-soluble gas. J. Nat. Gas Sci. Eng. 2019, 62, 62–78. [Google Scholar] [CrossRef]
- Feng, X.; Zhong, B.; Yang, X.; Deng, H. Effective water influx control in gas reservoir development: Problems and countermeasures. Nat. Gas Ind. 2015, 35, 35–40. [Google Scholar] [CrossRef] [Green Version]
- Xu, X.; Li, X.; Hu, Y.; Mei, Q.; Shi, Y.; Jiao, C. Physical simulation for water invasion and water control optimization in water drive gas reservoirs. Sci. Rep. 2021, 11, 6301. [Google Scholar] [CrossRef]
- Li, X.; Guo, Z.; Hu, Y.; Luo, R.; Su, Y.; Sun, H.; Liu, X.; Wan, Y.; Zahng, Y.; Li, L. Efficient development strategies for large ultra-deep structural gas fields in China. Pet. Explor. Dev. 2018, 45, 118–126. [Google Scholar] [CrossRef]
- Li, X.; Gao, S.; Wan, Y.; Liu, X.; Zhang, M.; Xie, W.; Su, Y.; Hu, Y.; Feng, J.; Yang, B.; et al. Geological characteristics and development strategies for Cambrian Longwangmiao Formation gas reservoir in Anyue gas field, Sichuan Basin, SW China. Pet. Explor. Dev. 2017, 44, 428–436. [Google Scholar] [CrossRef]
- Li, M.; Li, T.; Jiang, Q.; Yang, H.; Liu, S.C. The gas recovery of water-drive gas reservoirs. J. Hydrodyn. 2015, 27, 530–541. [Google Scholar] [CrossRef]
- Wang, H.; Liu, Y. Horizontal well completion with multiple artifificial bottom holes improves production performance in bottom water reservoir. Math. Probl. Eng. 2020, 6, 1–11. [Google Scholar]
Figure 1.
Schematic diagram of the testing device for the gas production profile of a horizontal well.
Figure 1.
Schematic diagram of the testing device for the gas production profile of a horizontal well.
Figure 2.
Gas production profile of cores with different permeabilities in parallel with a positive sequence.
Figure 2.
Gas production profile of cores with different permeabilities in parallel with a positive sequence.
Figure 3.
Gas production profile of cores with different permeabilities in parallel with a non-positive sequence.
Figure 3.
Gas production profile of cores with different permeabilities in parallel with a non-positive sequence.
Figure 4.
δ distribution along the horizontal well under the influence of the heel–toe effect.
Figure 5.
Distribution of δ along the horizontal well under different production pressures.

Figure 6.
Distribution of δ along the horizontal well at different water shelter heights.

Figure 7.
Water invasion simulation experiment device diagram of large 3D bottom-water gas reservoir: (a) Connection flow chart of experimental equipment, (b) front view of main kettle body and (c) physical drawing of experimental device.
Figure 7.
Water invasion simulation experiment device diagram of large 3D bottom-water gas reservoir: (a) Connection flow chart of experimental equipment, (b) front view of main kettle body and (c) physical drawing of experimental device.

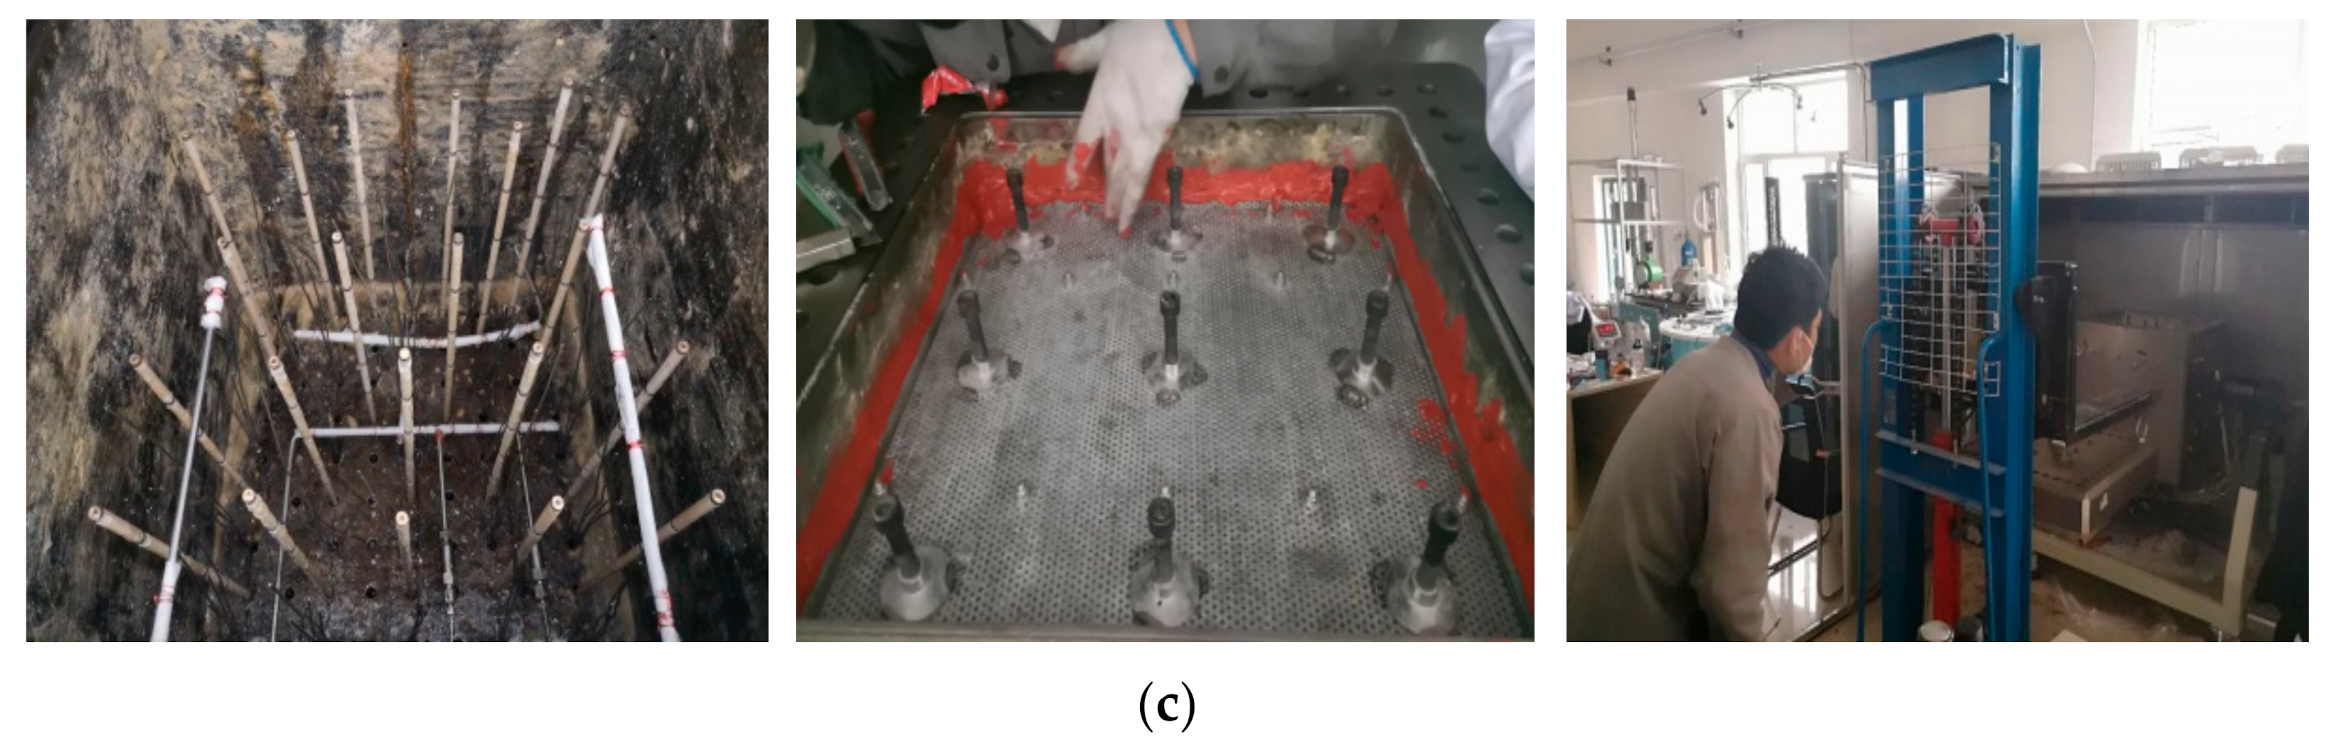
Figure 8.
Experimental results of the physical simulation of water invasion in a homogeneous bottom-water gas reservoir: (a) water yield relationship curve, (b) gas production relationship curve, (c) recovery factor relationship curve and (d) 3D profile diagram.
Figure 8.
Experimental results of the physical simulation of water invasion in a homogeneous bottom-water gas reservoir: (a) water yield relationship curve, (b) gas production relationship curve, (c) recovery factor relationship curve and (d) 3D profile diagram.
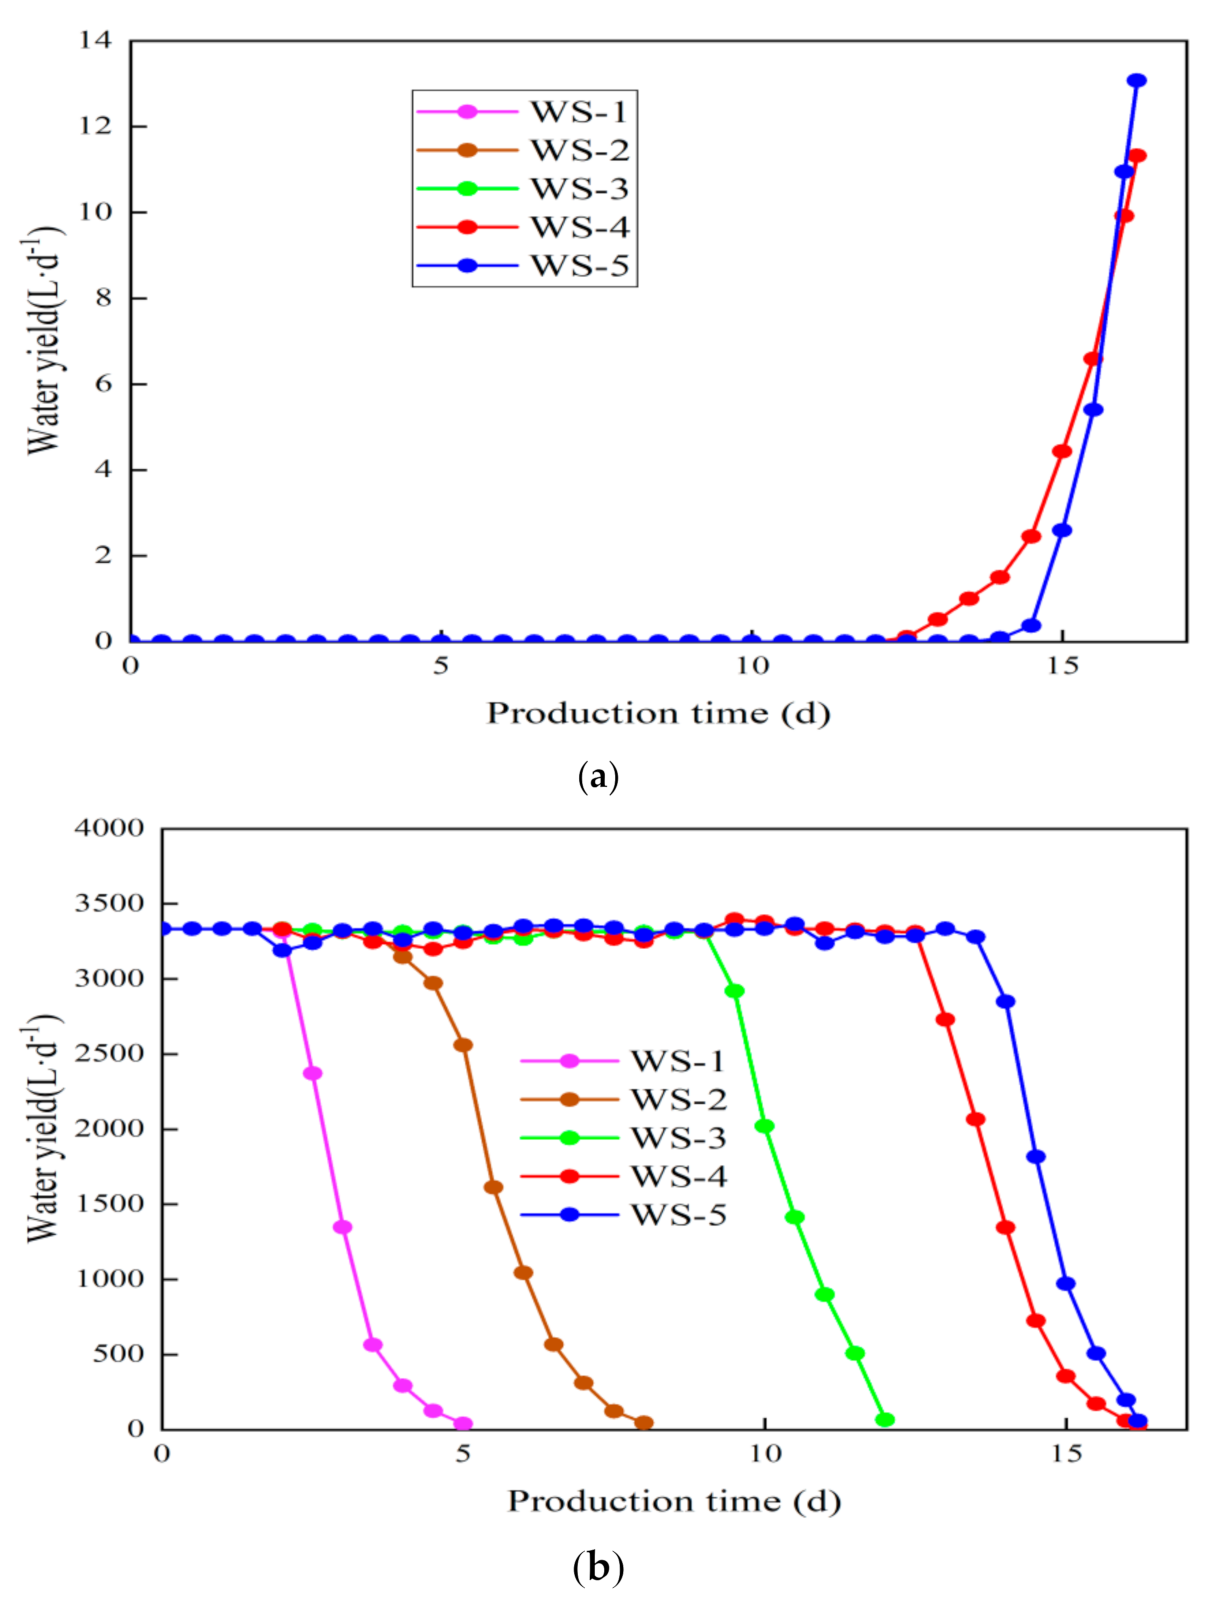

Figure 9.
Experimental results of the physical simulation of water invasion in a heterogeneous bottom-water gas reservoir: (a) Water yield relationship curve, (b) gas production relationship curve, (c) recovery factor relationship curve and (d) 3D profile diagram.
Figure 9.
Experimental results of the physical simulation of water invasion in a heterogeneous bottom-water gas reservoir: (a) Water yield relationship curve, (b) gas production relationship curve, (c) recovery factor relationship curve and (d) 3D profile diagram.

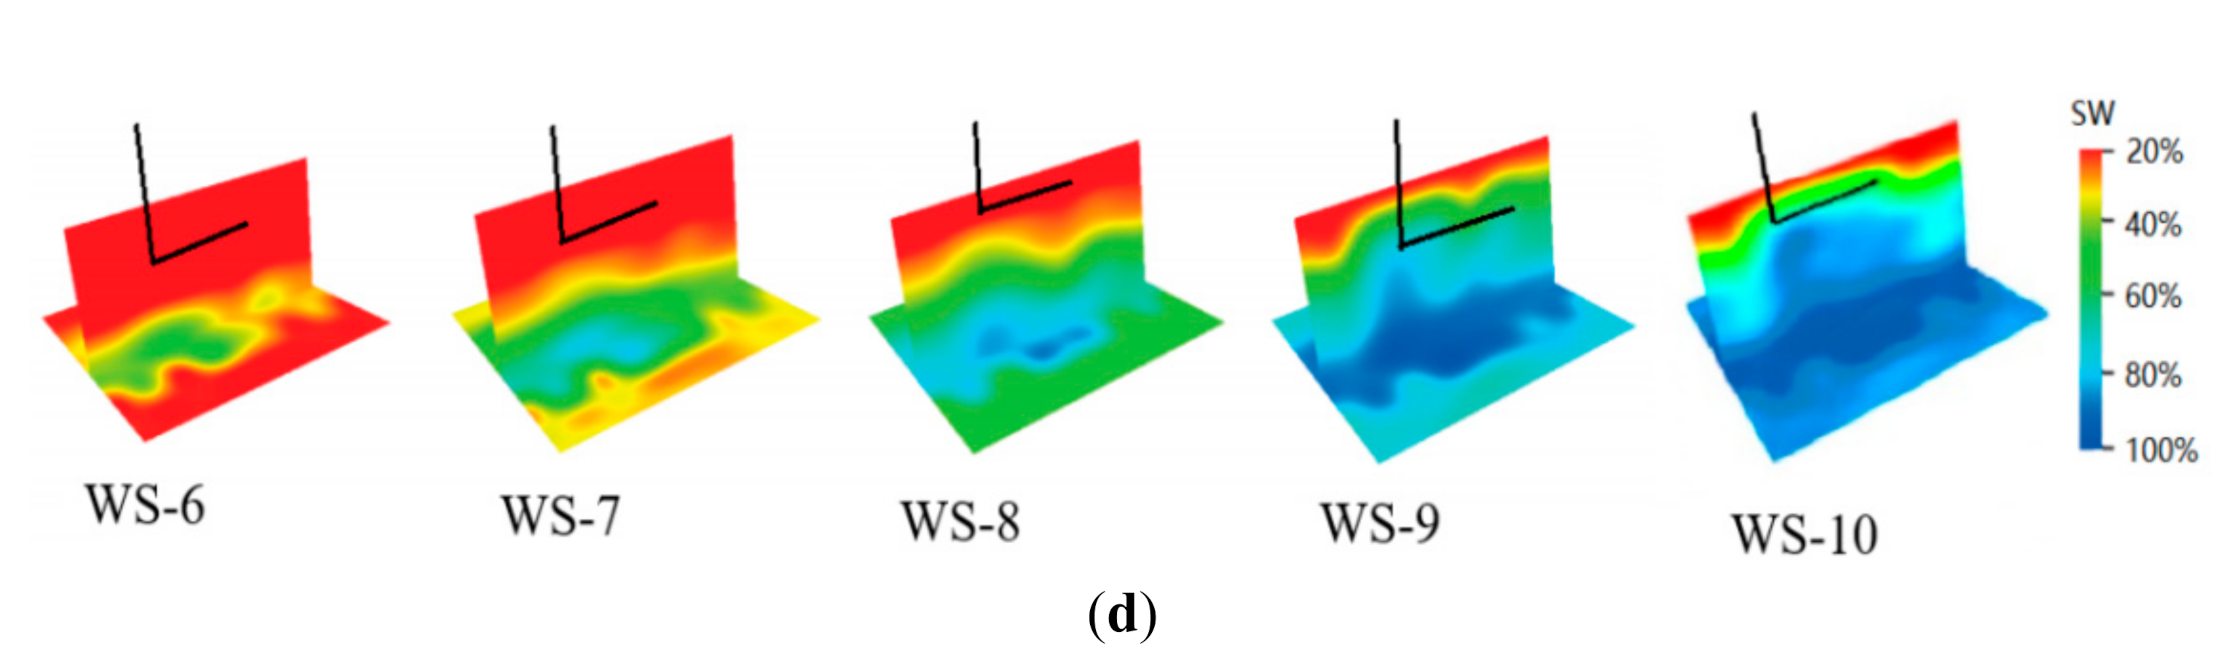
Figure 10.
The relation curve between the safety limit value r of the horizontal/vertical ratio and permeability level difference d in the well area.
Figure 10.
The relation curve between the safety limit value r of the horizontal/vertical ratio and permeability level difference d in the well area.


Table 1.
Data table of permeability distribution in the horizontal section of well N1H.
| Horizontal Location of Reservoir (m) | Average Permeability (mD) |
|---|---|
| 0~100 | 250 |
| 100~150 | 2500 |
| 150~250 | 500 |
| 250~300 | 1500 |
Table 2.
Water distribution characteristic parameters of each well in the LS17 gas field.
| Well | Length (km) | Width (km) | Area (km2) | Water Type | Multiple Water | Distance to Water Body (m) | Geological Reserves (108 m3) |
|---|---|---|---|---|---|---|---|
| N1H | 6.55 | 4.84 | 26.5 | Bottom-water | 4.1 | 66.8 | 178 |
| N2 | 15.07 | 3.97 | 44.8 | Edge water | 2.8 | 376 | 264 |
| N3H | 11.22 | 2.43 | 16.2 | Bottom-water | 1.7 | 44.1 | 116 |
| N4 | 6.15 | 4.25 | 17.5 | Bottom-water | 7.3 | 543 | 76 |
| N5 | 16.54 | 8.11 | 33.7 | Bottom-water | 10.7 | 57.5 | 213 |
| N6H | 15.42 | 4.03 | 40.3 | Bottom-water | 5.3 | 30.4 | 143 |
| N7H | 7.12 | 1.94 | 8.13 | Bottom-water | 2.8 | 12.2 | 86 |
Table 3.
Experimental scheme parameters.
| Package Number | Horizontal Well | Permeability (mD) | |||||
|---|---|---|---|---|---|---|---|
| Number 1 Core | Number 2 Core | Number 3 Core | Number 4 Core | Number 5 Core | Number 6 Core | ||
| 1 | Yes | 100 | 500 | 1000 | 1500 | 2000 | 2500 |
| 2 | No | 100 | 500 | 1000 | 1500 | 2000 | 2500 |
| 3 | Yes | 100 | 2000 | 2500 | 1500 | 1000 | 500 |
| 4 | Yes | 100 | 100 | 100 | 100 | 100 | 100 |
| 5 | Yes | 500 | 500 | 500 | 500 | 500 | 500 |
| 6 | Yes | 1000 | 1000 | 1000 | 1000 | 1000 | 1000 |
| 7 | Yes | 2000 | 2000 | 2000 | 2000 | 2000 | 2000 |
| 8 | Yes | 2500 | 2500 | 2500 | 2500 | 2500 | 2500 |
Table 4.
Statistical table of the corresponding relationship between permeability ratio and deviation degree of gas production (δ).
Table 4.
Statistical table of the corresponding relationship between permeability ratio and deviation degree of gas production (δ).
| Permeability Ratio | Deviation Degree of Gas Production |
|---|---|
| 1 | 0 |
| 2 | 72.34% |
| 4 | 161.1% |
| 5 | 193.5% |
| 10 | 276.3% |
Table 5.
The parameters of the physical water invasion simulation experiment scheme.
| Serial Number | Permeability (mD) | Wellblock Length (cm) | Horizontal and Longitudinal Ratio of Well Area | External Air Storage (m3) |
|---|---|---|---|---|
| WS-1 | 500 | 300 | 10 | 0.058 |
| WS-2 | 500 | 600 | 20 | 0.116 |
| WS-3 | 500 | 1200 | 40 | 0.231 |
| WS-4 | 500 | 1800 | 60 | 0.347 |
| WS-5 | 500 | 2310 | 77 | 0.445 |
| WS-6 | 2500/250 | 300 | 10 | 0.058 |
| WS-7 | 2500/250 | 600 | 20 | 0.116 |
| WS-8 | 2500/250 | 1200 | 40 | 0.231 |
| WS-9 | 2500/250 | 1800 | 60 | 0.347 |
| WS-10 | 2500/250 | 2310 | 77 | 0.445 |
| WS-11 | 5000/250 | 300 | 10 | 0.058 |
| WS-12 | 5000/250 | 600 | 20 | 0.116 |
| WS-13 | 5000/250 | 1200 | 40 | 0.231 |
| WS-14 | 5000/250 | 2310 | 77 | 0.445 |
| WS-15 | 7500/250 | 300 | 10 | 0.058 |
| WS-16 | 7500/250 | 600 | 20 | 0.116 |
| WS-17 | 7500/250 | 1200 | 40 | 0.231 |
| WS-18 | 7500/250 | 2310 | 77 | 0.445 |
Publisher’s Note: MDPI stays neutral with regard to jurisdictional claims in published maps and institutional affiliations. |
© 2022 by the authors. Licensee MDPI, Basel, Switzerland. This article is an open access article distributed under the terms and conditions of the Creative Commons Attribution (CC BY) license (https://creativecommons.org/licenses/by/4.0/).
Share and Cite
MDPI and ACS Style
Zhi, J.; Bo, L.; Qu, G.; Jiang, N.; Zhang, R. Water Invasion Law and Water Invasion Risk Identification Method for Deep Sea Bottom-Water Gas Reservoir. Energies 2022, 15, 1937. https://doi.org/10.3390/en15051937
AMA Style
Zhi J, Bo L, Qu G, Jiang N, Zhang R. Water Invasion Law and Water Invasion Risk Identification Method for Deep Sea Bottom-Water Gas Reservoir. Energies. 2022; 15(5):1937. https://doi.org/10.3390/en15051937
Chicago/Turabian StyleZhi, Jiqiang, Lifeng Bo, Guohui Qu, Nan Jiang, and Rongzhou Zhang. 2022. "Water Invasion Law and Water Invasion Risk Identification Method for Deep Sea Bottom-Water Gas Reservoir" Energies 15, no. 5: 1937. https://doi.org/10.3390/en15051937
Note that from the first issue of 2016, this journal uses article numbers instead of page numbers. See further details here.