Article

Appropriate Volt–Var Curve Settings for PV Inverters Based on Distribution Network Characteristics Using Match Rate of Operating Point

1
Department of Electrical and Electronic Engineering, College of Engineering, Chubu University, Kasugai 487-8501, Japan
2
Department of Electrical Engineering, Graduate School of Engineering, Tohoku University, Sendai 980-8579, Japan
3
Tokyo Electric Power Company Holdings, Inc., 4-1, Egasaki-cho, Tsurumi-ku, Yokohama 230-8510, Japan
*
Author to whom correspondence should be addressed.
Energies 2022, 15(4), 1375; https://doi.org/10.3390/en15041375
Submission received: 20 January 2022 / Revised: 10 February 2022 / Accepted: 11 February 2022 / Published: 14 February 2022

Abstract

:
This paper describes the process of setting up an appropriate volt–var curve for the reactive power control of a photovoltaic (PV) inverter interconnected to a distribution line that is voltage controlled by a load ratio control transformer (LRT). Computer simulations with 360 patterns of volt–var curves applied to five actual distribution line models are presented. The number of patterns was narrowed down to 23 by using voltage, distribution-line loss, number of LRT tap operations, and a new evaluation index, the match ratio. When a power-factor constraint is imposed on the PV inverter, it may not output the reactive power according to the volt–var curve depending on the active power output. The match rate is an index to show the percentage of the operating points of the PV inverter that conform with the volt–var curve. By evaluating the match rate, it can be demonstrated if the PV inverter efficiently contributes to the voltage control, which greatly contributes to narrowing of the volt–var curve. It is demonstrated that the volt–var curve obtained using the proposed method is superior in terms of voltage controllability, distribution line losses, and the number of LRT tap controls.

1. Introduction

1.1. Background and Related Works

The introduction of renewable energy sources, such as solar and wind power, is increasing. In Japan, the feed-in-tariff (FIT) system, which aims to promote the use of renewable energy sources, has, in particular, led to the introduction of photovoltaic (PV) generation. The capacity of PV installed in 2012, before the introduction of the FIT system, was 5.6 GW. After the introduction of the FIT system, the capacity of the installed PV increased, reaching 57 GW in 2020. The cost of PV installation has been steadily decreasing with the increase in installation capacity and the development of technology [1,2,3]. The capacity of PV installation is expected to continue to increase worldwide.
The increase in the capacity of the installed PV causes difficulties in maintaining the power quality of the power system because the power generation depends on the weather. The impact of the increase in PV output on the supply-demand balance may cause frequency fluctuations and the PV output may be curtailed as a countermeasure from the viewpoint of frequency quality [4]. In the distribution system, the problem of voltage fluctuation is significant. It has been pointed out that the increase in reverse power flow causes large fluctuations in the voltage on the customer side, and the problem of maintaining the supply voltage within an appropriate range has been identified [5,6].
As a countermeasure to the voltage violation that may occur when a large amount of PV is installed in the distribution system, the installation of voltage-control devices such as a step-voltage regulator (SVR) [7], static var compensator (SVC) [8], battery-storage system [9], thickening of distribution lines, and partial boosting of medium-voltage distribution lines [10,11] have been proposed. In addition, coordinated control of multiple voltage-control devices in the distribution system has been proposed to keep the voltage within an appropriate range for the fluctuations caused by the PV penetration [12,13,14]. It has also been shown that controlling the power factor of the PV inverter at a constant level can suppress the increase in the distribution line voltage [15].

1.2. Motivation and Contribution

Smart inverters, which are power conditioning systems (PCSs) with advanced power control and communication functions, are an effective countermeasure in power systems in which PV generation has been massively introduced [16]. Smart inverters have a number of functions that contribute to improving the power-system stability, for example, a function to continue the power system operation even under abnormal conditions to prevent the PCSs from being simultaneously disconnected because of a disturbance in the power system, a frequency-watt control function to suppress the output when the frequency increases, a function to limit the rate of change of output, and a system status monitoring and communication function [17,18]. The voltage–reactive power function (volt–var function) has attracted considerable attention as a function that supports the voltage control of distribution systems. Since the volt–var function does not output reactive power when the voltage is maintained within the appropriate range, it is expected that the distribution-line losses will not increase unnecessarily [19,20]. The control by the volt–var function is also expected to increase the amount of generated power from PV to a higher extent compared with that increased by the constant power factor control.
The volt–var function of smart inverters is expected to improve the voltage controllability of the distribution system. However, the appropriate shape of the volt–var curve for the volt–var function is not clear. If the parameters are set incorrectly, the smart inverter may adversely affect the voltage control, depending on the configuration of the distribution system and the introduction of the smart inverter. Thus, it is necessary to set the volt–var curve appropriately to make the best use of the volt–var function.
Many studies on the setting of the volt–var curve have been reported. The basic idea of setting the parameters of the volt–var curve has been described in [21]. The study demonstrates that the appropriate volt–var curve depends on the location of the inverter and that multiple smart inverters may output unnecessary reactive power owing to mutual interference. In [22], a time-domain simulation was performed for a total of 187 patterns of volt–var curves using a detailed power distribution-system model, and the optimal volt–var curve was selected for each evaluation index. The specification of the volt–var curve has been discussed as an evaluation index for the hosting capacity of PV generation based on the computer simulation using actual distribution lines in California [23]. An optimization method based on a genetic algorithm has been proposed to optimize the setting of the volt–var function, and it was shown that the control characteristics of the distribution system can be improved [24,25,26]. A method to determine the volt–var curve based on the relationship between the optimum reactive power and the inverter voltage using the interior point method has been proposed [27]. A method of setting the volt–var curve using the voltage sensitivity matrix of the power system without using an optimization method has been proposed, and was proven to be as effective as the volt–var curve obtained using the optimization method [28]. Although the number of tap operations of transformers by on-load tap changer (LTC) control can be reduced depending on the setting of the volt–var curve [29], very little study is currently available in the published literature on the coordination of volt–var control with other voltage control devices, such as transformers. It is necessary to understand the effect of the volt–var curve on the operation of existing voltage-control equipment depending on the distribution system configuration and the volt–var curve.
Although an extremely high voltage-control effect can be expected when the volt–var curve is optimized for each PV inverter, it is considered to be impractical from the viewpoint of distribution-system operation [30]. Because the number of distribution lines managed by a distribution-system operator is huge and the number of inverters for PV is even higher, it is operationally appropriate to set one standard volt–var curve for the distribution system.
There is little information on the relationship between the actual operating point of the PCS and the volt–var curve. PCS output may be limited by the constraint of inverter capacity and power factor. If the reactive power output is limited, the reactive power specified by the volt–var curve cannot be output and the expected effect of volt–var control on the voltage may not be obtained. We focus on this point and consider evaluating the operating point of the PCS when determining the volt–var curve.

1.3. Outline

In this study, we describe a method to set a standard volt–var curve considering the effect of tap devices, such as a load ratio control transformer (LRT). Five different distribution-system models and 360 patterns of volt–var curves were developed, and computer simulation was used to study the selection of a standard volt–var curve. The selection conditions were considered to be no voltage deviation, low distribution loss, and low number of tap operations of LRT. As a novel evaluation index, we evaluated if the volt–var curve is suitable for the distribution line by defining the match rate, which indicates how well the operating point of the PV inverter matches the volt–var curve.
The remainder of this paper is organized as follows: the simulation model of the volt–var function and the novel proposed evaluation index and match rate are explained in Section 2. The results of computer simulations regarding the effects of the volt–var function using a grid model based on an actual distribution system are presented in Section 3. The method for selecting the volt–var curve is described in Section 4. Finally, Section 5 describes the conclusion of the present study.

2. Specifications in Volt–Var Curve for PV Inverter

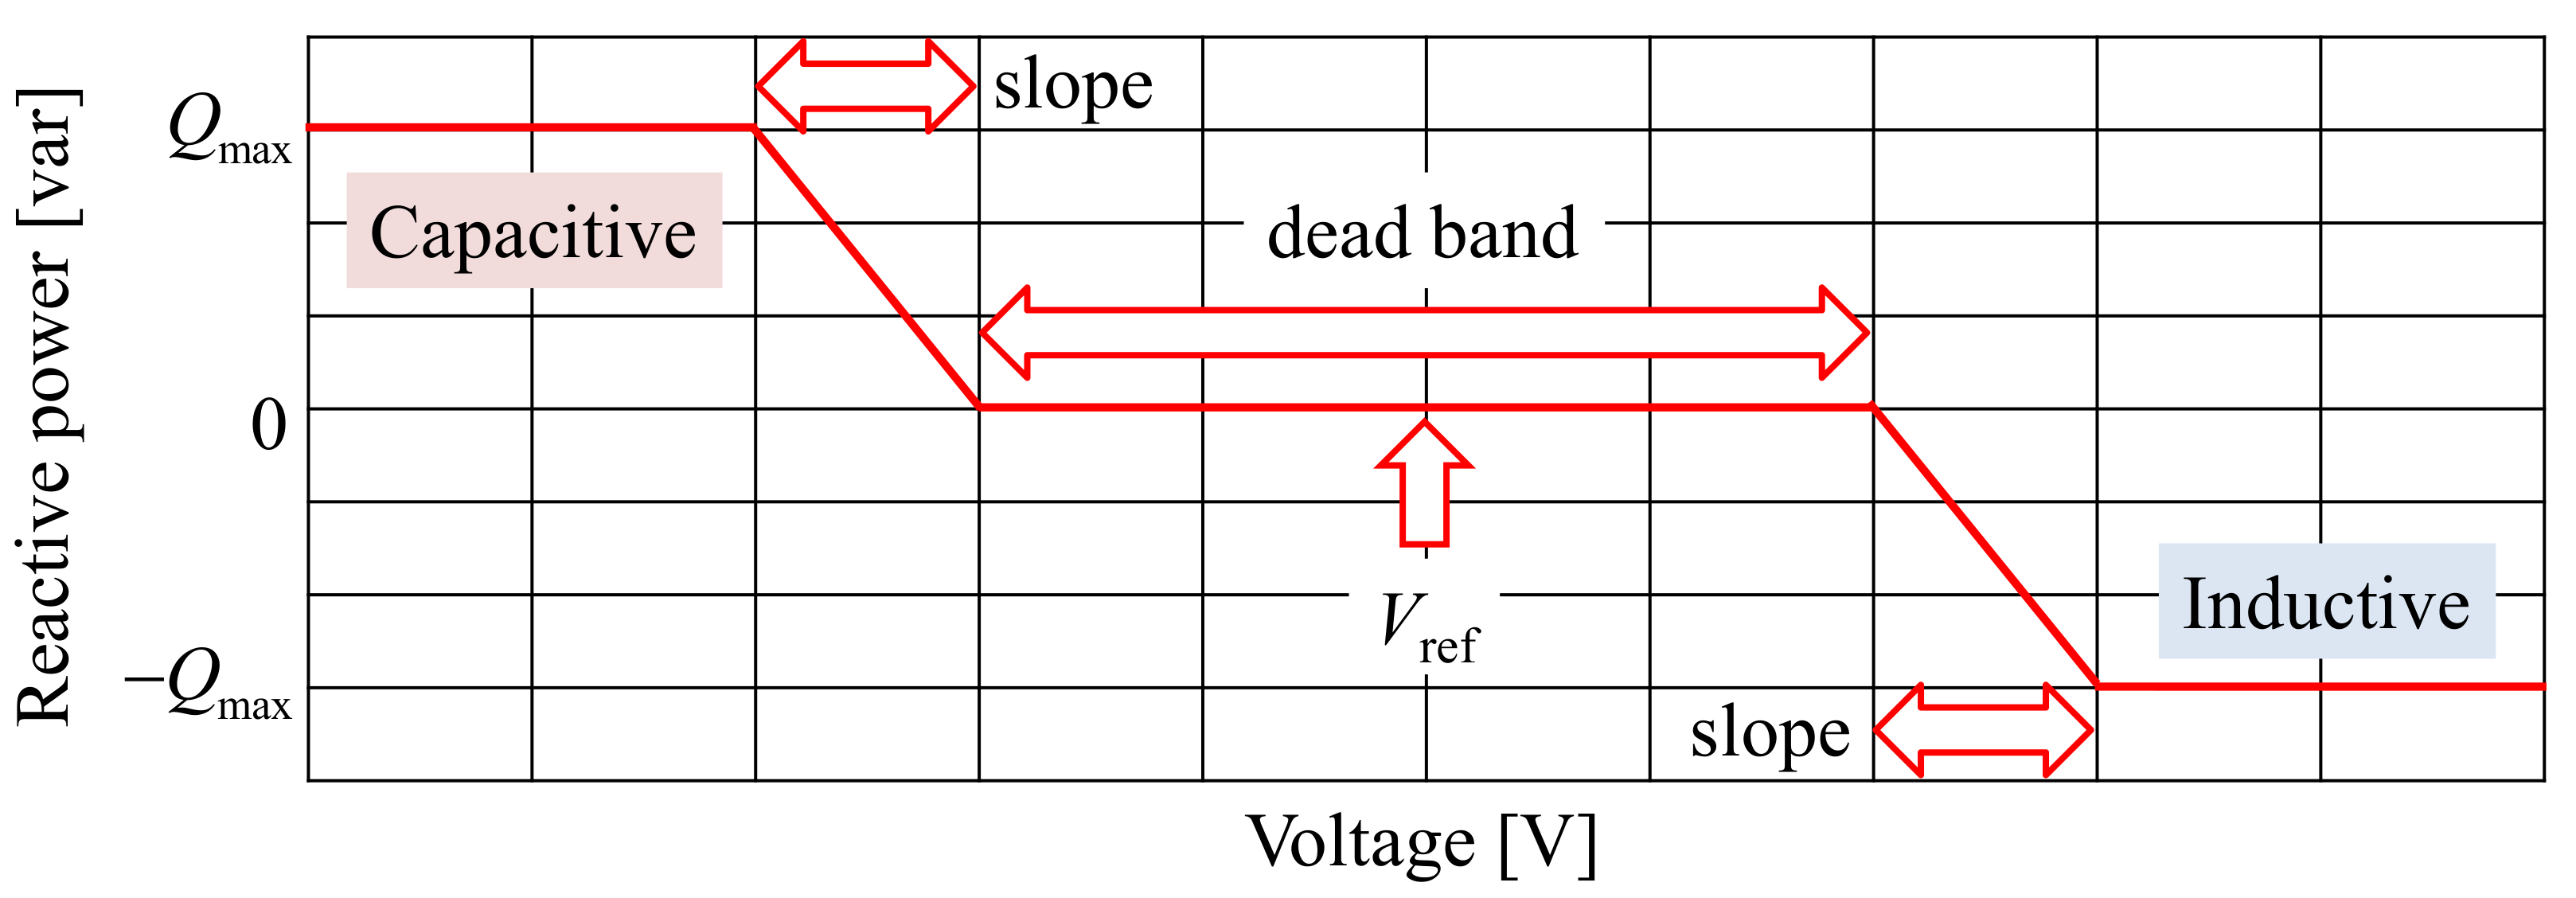
2.1. Volt–Var Characterictic

To clarify the appropriate volt–var curve considering the differences between various areas, such as residential and rural areas, computer simulations of a power-distribution-system model were conducted for various volt–var curves. Figure 1 shows the volt–var curve, which consists of four parameters: center voltage Vref, dead zone, slope, and maximum reactive power Qmax. Because a large number of PV inverters are interconnected in a distribution feeder, it is necessary to individually determine the optimal volt–var curve for each inverter to obtain the ultimate optimization of supply voltage and distribution power loss. However, setting up an optimal volt–var curve for every inverter is difficult from the technical aspects of obtaining all the necessary voltages and impedances, as well as the huge amount of work involved. Therefore, from the realistic workload of distribution-system operation and planning, the volt–var curves of all the PV inverters installed in a distribution feeder were assumed to be the same, and the effects of the four parameters shown in Figure 1 on the voltage control and distribution line losses of the distribution system were investigated.
In this study, computer simulations were carried out for 360 patterns of volt–var curves. The breakdown of the parameter combinations is shown in Table 1; considering all the combinations of the four parameters, 360 patterns were obtained.

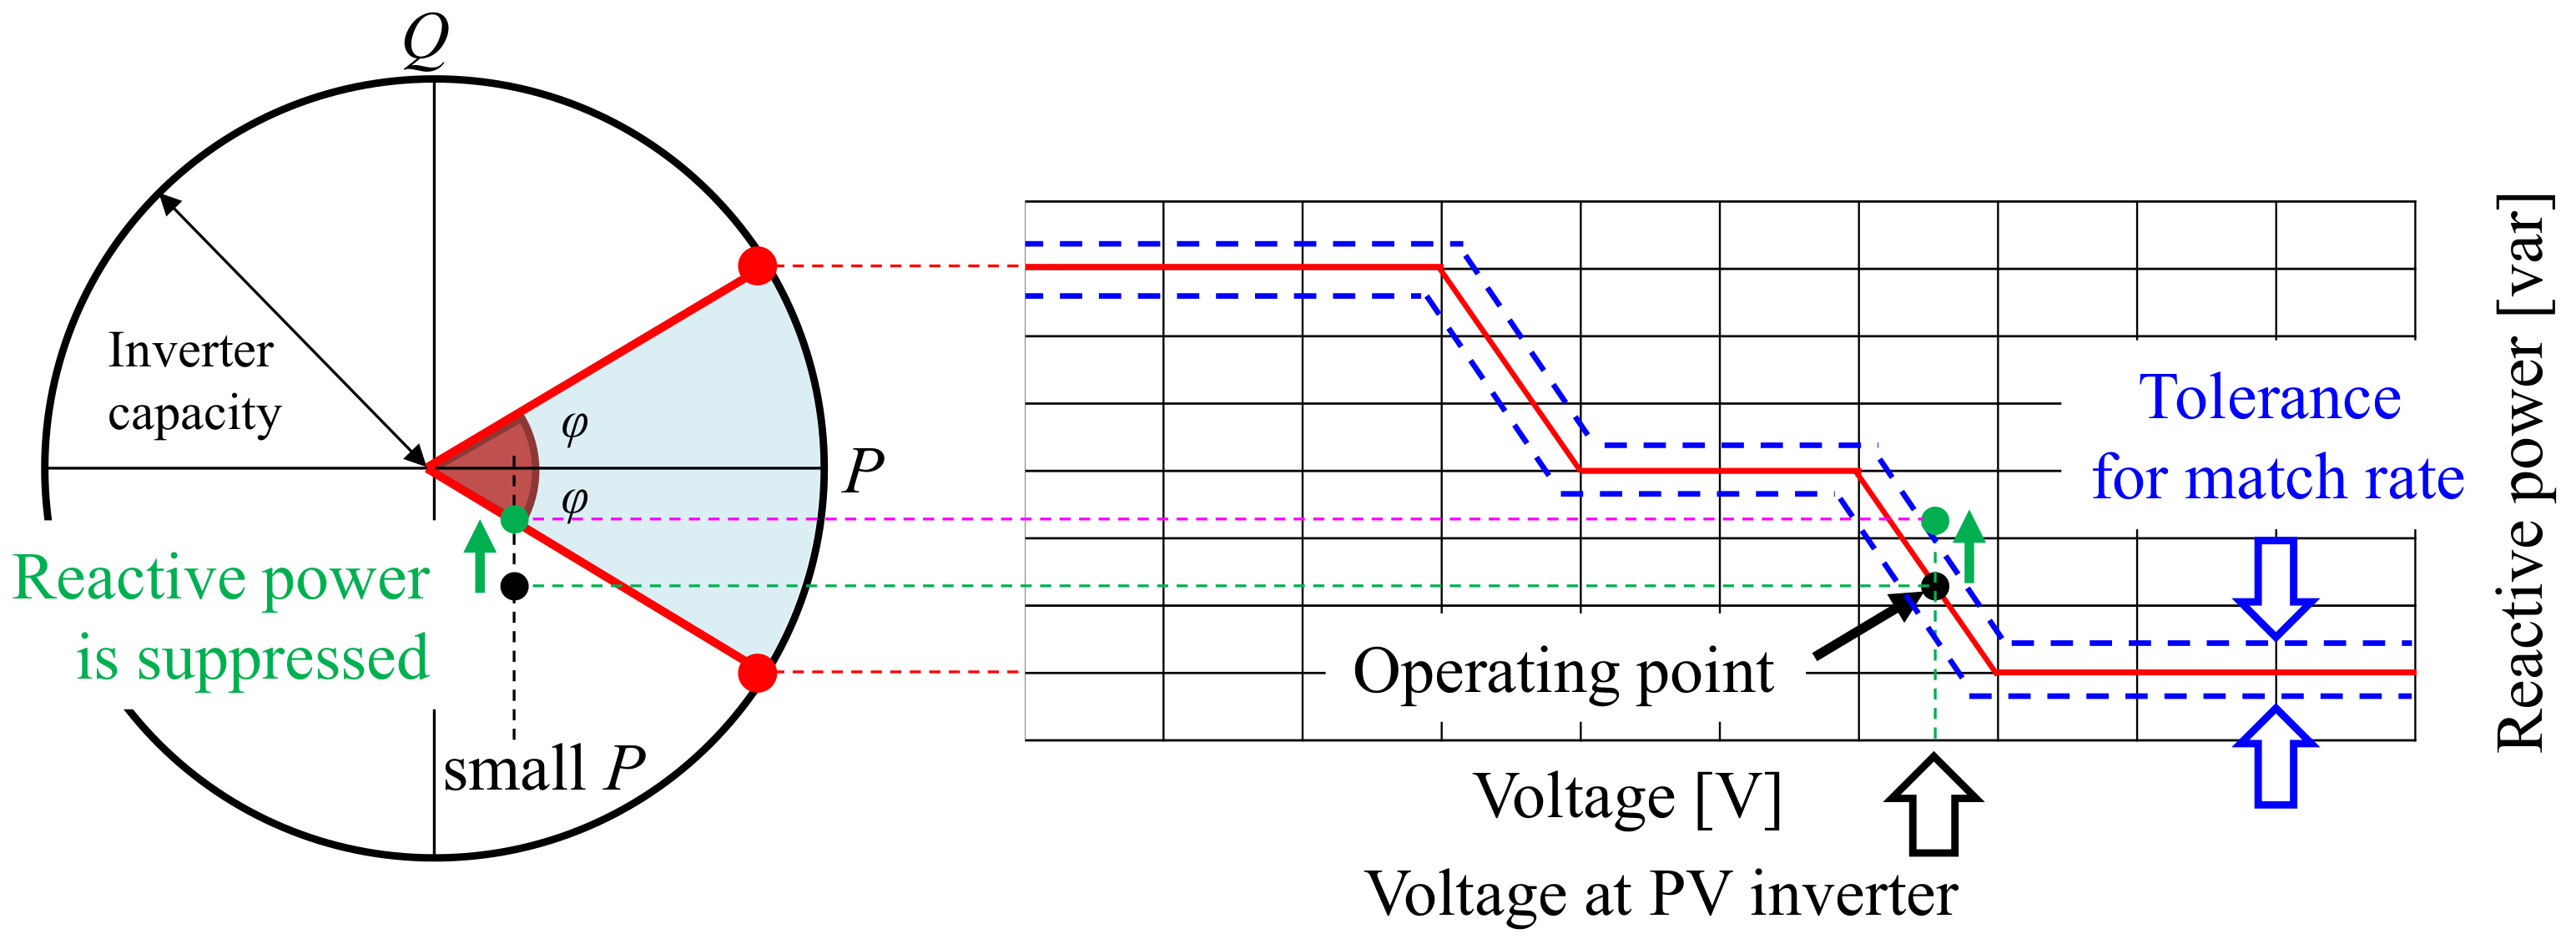
2.2. Capacity Restriction of Inverter

To fully demonstrate the volt–var function, the inverter capacity must be sufficiently larger than the PV panel capacity. Although the effect of the volt–var function depends on the ratio of the PV panel capacity to the inverter capacity, this is beyond the scope of the present study and will be investigated in the future. In this study, the computer simulations were conducted assuming that the PV panel capacity and the inverter capacity are equal. It was assumed that when the inverter output exceeds the inverter capacity owing to the volt–var function, the reactive power output is prioritized, and the active power is curtailed.
When active and reactive power are output within the range of inverter capacity based on the volt–var curve, the output range is usually limited by the reactive power. Although the effect of the volt–var function depends on the method of setting the output range, in this study, the output range of reactive power was set in such a way that the power factor is 0.85 or higher, in accordance with the Japanese grid-interconnection code. Figure 2 depicts the operational range of the inverter. When the power factor is 0.85 or higher, the operational range of the inverter is the area indicated by the fan shape. The maximum reactive power value shown in Table 1 corresponds to the maximum reactive power in the range shown in Figure 2.
If the operating range of the inverter is set as shown in Figure 2, it may not be able to output sufficient reactive power when the active power output is small. The volt–var curve is also shown in Figure 2. The reactive power commanded at the operating point indicated by the black circle deviates from the operable range of the inverter when the active power output is small. In such a case, it is assumed that the reactive power output is suppressed by prioritizing the power-factor constraint. As a result, the operating point on the volt–var curve shifts to the green circle, suggesting that the reactive power output may not match the volt–var curve.
We have indicated that the reactive power may deviate from the volt–var curve when the active power output of the PV inverter is small. The volt–var curve in which this phenomenon occurs frequently is an inappropriate curve from the viewpoint of distribution-line voltage control. To evaluate the inappropriate curve, we set a tolerance on the reactive power of the volt–var curve. If the reactive power is within the tolerance, the operating point is judged to be in agreement with the volt–var curve. The operating points of all the PV inverters connected to the distribution line are monitored at each time step of the simulation, and the probability that the operating point is within the allowable range is defined as the match rate. The allowable range is set for each distribution line and is defined as the reactive power when the voltage of the distribution line fluctuates by 0.5%.

2.3. Calculation of Operating Point on Volt–Var Curve

The simulations were conducted every 30 min for 24 h, and the method to converge the reactive power for the PV inverter in each time section was investigated. When the PV inverter outputs the reactive power according to the volt–var curve, the voltage at the PV-inverter interconnection point changes. In reality, the PV inverter outputs reactive power according to the interconnection point voltage, which changes continuously based on the control cycle. To analyze the actual behavior of the PV inverter in the simulation every 30 min, the reactive power output was converged by changing the reactive power gradually in response to the change in the interconnection point voltage.
First, the load-flow calculation is performed assuming that the reactive power of the PV inverter is zero. When the voltage at the interconnection point of the PV inverter is obtained, the value of the reactive power is determined from the volt–var curve. If this value is applied in the simulation, a different voltage from the actual one may be obtained when the simulation is executed every 30 min. Therefore, the inner point of the reactive power was obtained according to the volt–var curve, and the voltage deviation because of the change in reactive power was converged.
Figure 3 illustrates the method to find the internal point of reactive power. It is assumed that the reactive power QINV(n − 1) is applied to the (n − 1) th calculation and the voltage VINV(n − 1) is obtained. From the volt–var curve, the reactive power of next time step is represented by QINV(VINV(n − 1)). However, if the difference between QINV(n − 1) and QINV(VINV(n − 1)) is large, the voltage at the next time step varies considerably; thus, the voltage convergence may be poor. Therefore, the volt–var curve in the (n − 1)th calculation is proportionally divided by a factor α. The reactive power applied to the n th calculation is expressed by the following equation.
Q INV n = Q INV V INV n 1 · α + Q INV n 1 · 1 α
The convergence calculations described above were applied to all PV inverters. The calculations were carried out until the change in voltage obtained from the iterative calculations became significantly small.

3. Dependence of Effect of Volt–Var Curve on Distribution System Configuration

The power-distribution-system model used in the analysis was created based on actual power distribution lines. Five distribution systems were targeted, taking into account the differences in areas, such as residential and rural areas. The volt–var curves controlling a large number of PV inverters interconnected in one distribution system were all assumed to be the same. The simulation was performed by changing the shape of the curve, and an appropriate volt–var curve was selected for each distribution system.

3.1. Residential Area 1

3.1.1. Simulation Model

Figure 4 depicts the distribution system model of a residential area. Figure 4a,b depict the distribution line configuration of the medium-voltage (6.6 kV) and low-voltage (200 V) systems. The main-line length of the medium-voltage distribution line is 4 km. The node represented by the green square is connected to the medium-voltage customer, and the node represented by the orange circle is connected to the low-voltage system shown in Figure 4b. The distribution system shown in Figure 4 serves eight medium-voltage customers and 1404 low-voltage customers. To reduce the computational load, the low-voltage distribution network is modeled as a reduced equivalent network for the voltage analysis, as shown in Figure 4b. All the low-voltage customers have PV systems with capacities ranging from 3 to 6 kW. All the PV inverters output reactive power according to the same volt–var curve.
The time variation of the total output of all the connected PV inverters in Figure 4 is shown in Figure 5. The time variation of the total active and reactive powers of the eight medium-voltage customers is also shown. The same is shown for the 1404 low-voltage customers. The PV output is based on a sunny day and the load curve is based on a weekday. The maximum total output of the PV inverters is 6.3 MW, and the reverse power flows from the distribution line to the sub-transmission system during the daytime. In this study, the active and reactive powers shown in Figure 5 were set every 30 min and were applied to the load-flow calculations every 30 min for 24 h.
Although the distribution line voltage is controlled by the reactive power of PV inverters, a load ratio control transformer (LRT) in the substation is also controlled by the conventionally used line-drop compensator (LDC). The effect of the volt–var curve on the number of tap operations of the LRT can be evaluated by applying the LDC model.

3.1.2. Simulation Results

The model described in the previous section was used to calculate the time variation of the supply voltage to the low-voltage customers. Figure 6 shows the simulation results without volt–var control and voltages of all low-voltage customers. The voltage increases during the daytime, when the output of PV system increases is remarkable and exceeds the upper limit of the appropriate range, that is, 222 V, which is 110% of the standard voltage of 202 V.
Next, an example of the result of applying volt–var control is presented. Figure 7 shows the supply voltage to the low-voltage customer when Vref, deadband, and slope are set to 202 V, 12 V, and 6 V, respectively, which are the parameters that determine the volt–var curve. Volt–var control improves the voltage deviation during the daytime, and the voltage is controlled within the proper range. The time variation of the reactive-power output of each PV inverter is shown in Figure 8. The time variation of the reactive power output is the result of following the volt–var curve and the capacity constraint of the inverter.
One of the positive effects of volt–var control on the power-distribution system is the reduction in the number of LRT tap operations. Figure 9 shows the time variation of the LRT tap position. When the volt–var control is not applied, the LRT tap is switched according to the LDC control to suppress the voltage rise in the distribution system. The number of operations is 15 times in a day. On the other hand, when the volt–var control is applied, the number of tap operations decreases because the voltage at the target point controlled by the LDC decreases owing to the voltage drop caused by the PV inverter’s consumption of lagging reactive power.
On the contrary, one of the negative effects of volt–var control on the distribution system is the increase in distribution losses. Figure 10 shows the time variation of the distribution loss. Depending on the setting of the volt–var curve, it is possible to greatly improve the voltage rise on the distribution line; however, the increase in distribution losses is also likely to be significant. To set the volt–var curve, it is necessary to consider the effects on other devices, such as the number of LRT tap operations, and to set parameters that are well-balanced for the operation of the distribution system.
The 24 h interconnection-point voltage and reactive power output of each PV inverter are plotted on the volt–var curve shown in Figure 11. Because the reactive power output is suppressed when the constraint of output range of inverter with regard to power factor is violated, the operating point of PV inverter may deviate from the volt–var curve depending on the time and the interconnection position of the PV inverter. For the volt–var curve shown in Figure 11, the match rate shown in Section 2.2 was calculated to be 83.8%. If the match rate is high, it indicates that the PV inverter is outputting the reactive power according to the volt–var curve, which means that the volt–var curve conforms to the characteristics of the distribution line. On the contrary, if the match rate is low, the PV inverter cannot output the reactive power according to the volt–var curve, which indicates that the power-factor constraint of the inverter has a significant effect, and the volt–var curve does not conform to the characteristics of the distribution line.

3.1.3. Control Characteristics

Table 2 shows the match rate of 360 patterns of volt–var curves. When Vref and the dead band are small, reactive power output is required by the volt–var curve even if the voltage at PV inverter is not high enough to violate the voltage constraint. However, owing to the power factor constraint of the inverter, it may not be possible to output the commanded reactive power according to the volt–var curve. As a result, the match rate is reduced as shown in Table 2. The 360 patterns of volt–var curves can be narrowed down to 128 patterns if we select those with a match rate of 99% or higher.
Figure 12 summarizes the results of the 24 h simulation described in the previous section, in which 360 patterns of volt–var curves are applied to the distribution-system model shown in Figure 4. Figure 12 depicts the relationship between the number of LRT tap operations, the cumulative reactive power of all the PV inverters, and the distribution loss for each volt–var curve in 24 h. When the PV inverter mainly consumes lagging reactive power throughout the 24 h period, the cumulative reactive power is negative. The red arrow indicates the direction in which the lagging reactive power increases, indicating that the distribution loss increases, and the number of LRT tap operations decreases, when such a volt–var curve is selected. From the simulation results of applying each volt–var curve, it can be seen that the volt–var curves with voltage deviations where the distribution line voltage cannot be controlled within an appropriate range are distributed on the right side of Figure 12, and the volt–var curves with a match rate of 99% or less are distributed on the left side of Figure 12.

3.2. Rural Area 1

3.2.1. Simulation Model

The same simulation as described in Section 3.1 was conducted using a power-distribution-system model of a rural area. Figure 13 shows the distribution system model based on an actual distribution system with a main-line length of 4.4 km. The distribution system supplies power to 28 medium-voltage customers and 3600 low-voltage customers. The node represented by the orange circle represents the low-voltage distribution system, which is composed of the customers with PV system. The maximum total output value of the PV inverters is 9.5 MW.

3.2.2. Control Characteristics

Using 360 patterns of volt–var curves, 24 h simulations were performed, and the number of LRT tap operations, cumulative reactive power, and distribution losses are summarized in Figure 14. The characteristics in the direction indicated by the red arrow are the same as the results for residential area 1 shown in Figure 12. The difference from the characteristics shown in Figure 12 is that there are volt–var curves in the direction of the blue arrow in which both the number of LRT tap operations and the distribution line loss increase as the cumulative reactive power increases. This is because the resistance component of the distribution line in rural area 1 shown in Figure 13 is smaller than that in the residential area 1 shown in Figure 4 and the effect of the reactive power output of the PV inverter is relatively high.
It is desirable to select an appropriate volt–var curve that causes low distribution losses, high match rate, no voltage violation, and no significant increase in the number of LRT tap operations. As shown in Figure 12 and Figure 14, the relationship between the volt–var curve and the evaluation parameters depends on the configuration of the distribution system. It is difficult to optimize all the evaluation parameters. If the volt–var curve is to be set individually for each distribution system, it is possible to determine the optimal volt–var curve according to the evaluation function by solving an optimization problem. However, from the viewpoint of distribution-system operation, the work cost is enormous. To select a single volt–var curve that is suitable for all the distribution systems managed by the distribution-system operator, it is necessary to select a common volt–var curve that will provide the effect expected by the distribution-system operator by creating control characteristic diagrams such as those shown in Figure 12 and Figure 14 for various distribution systems.

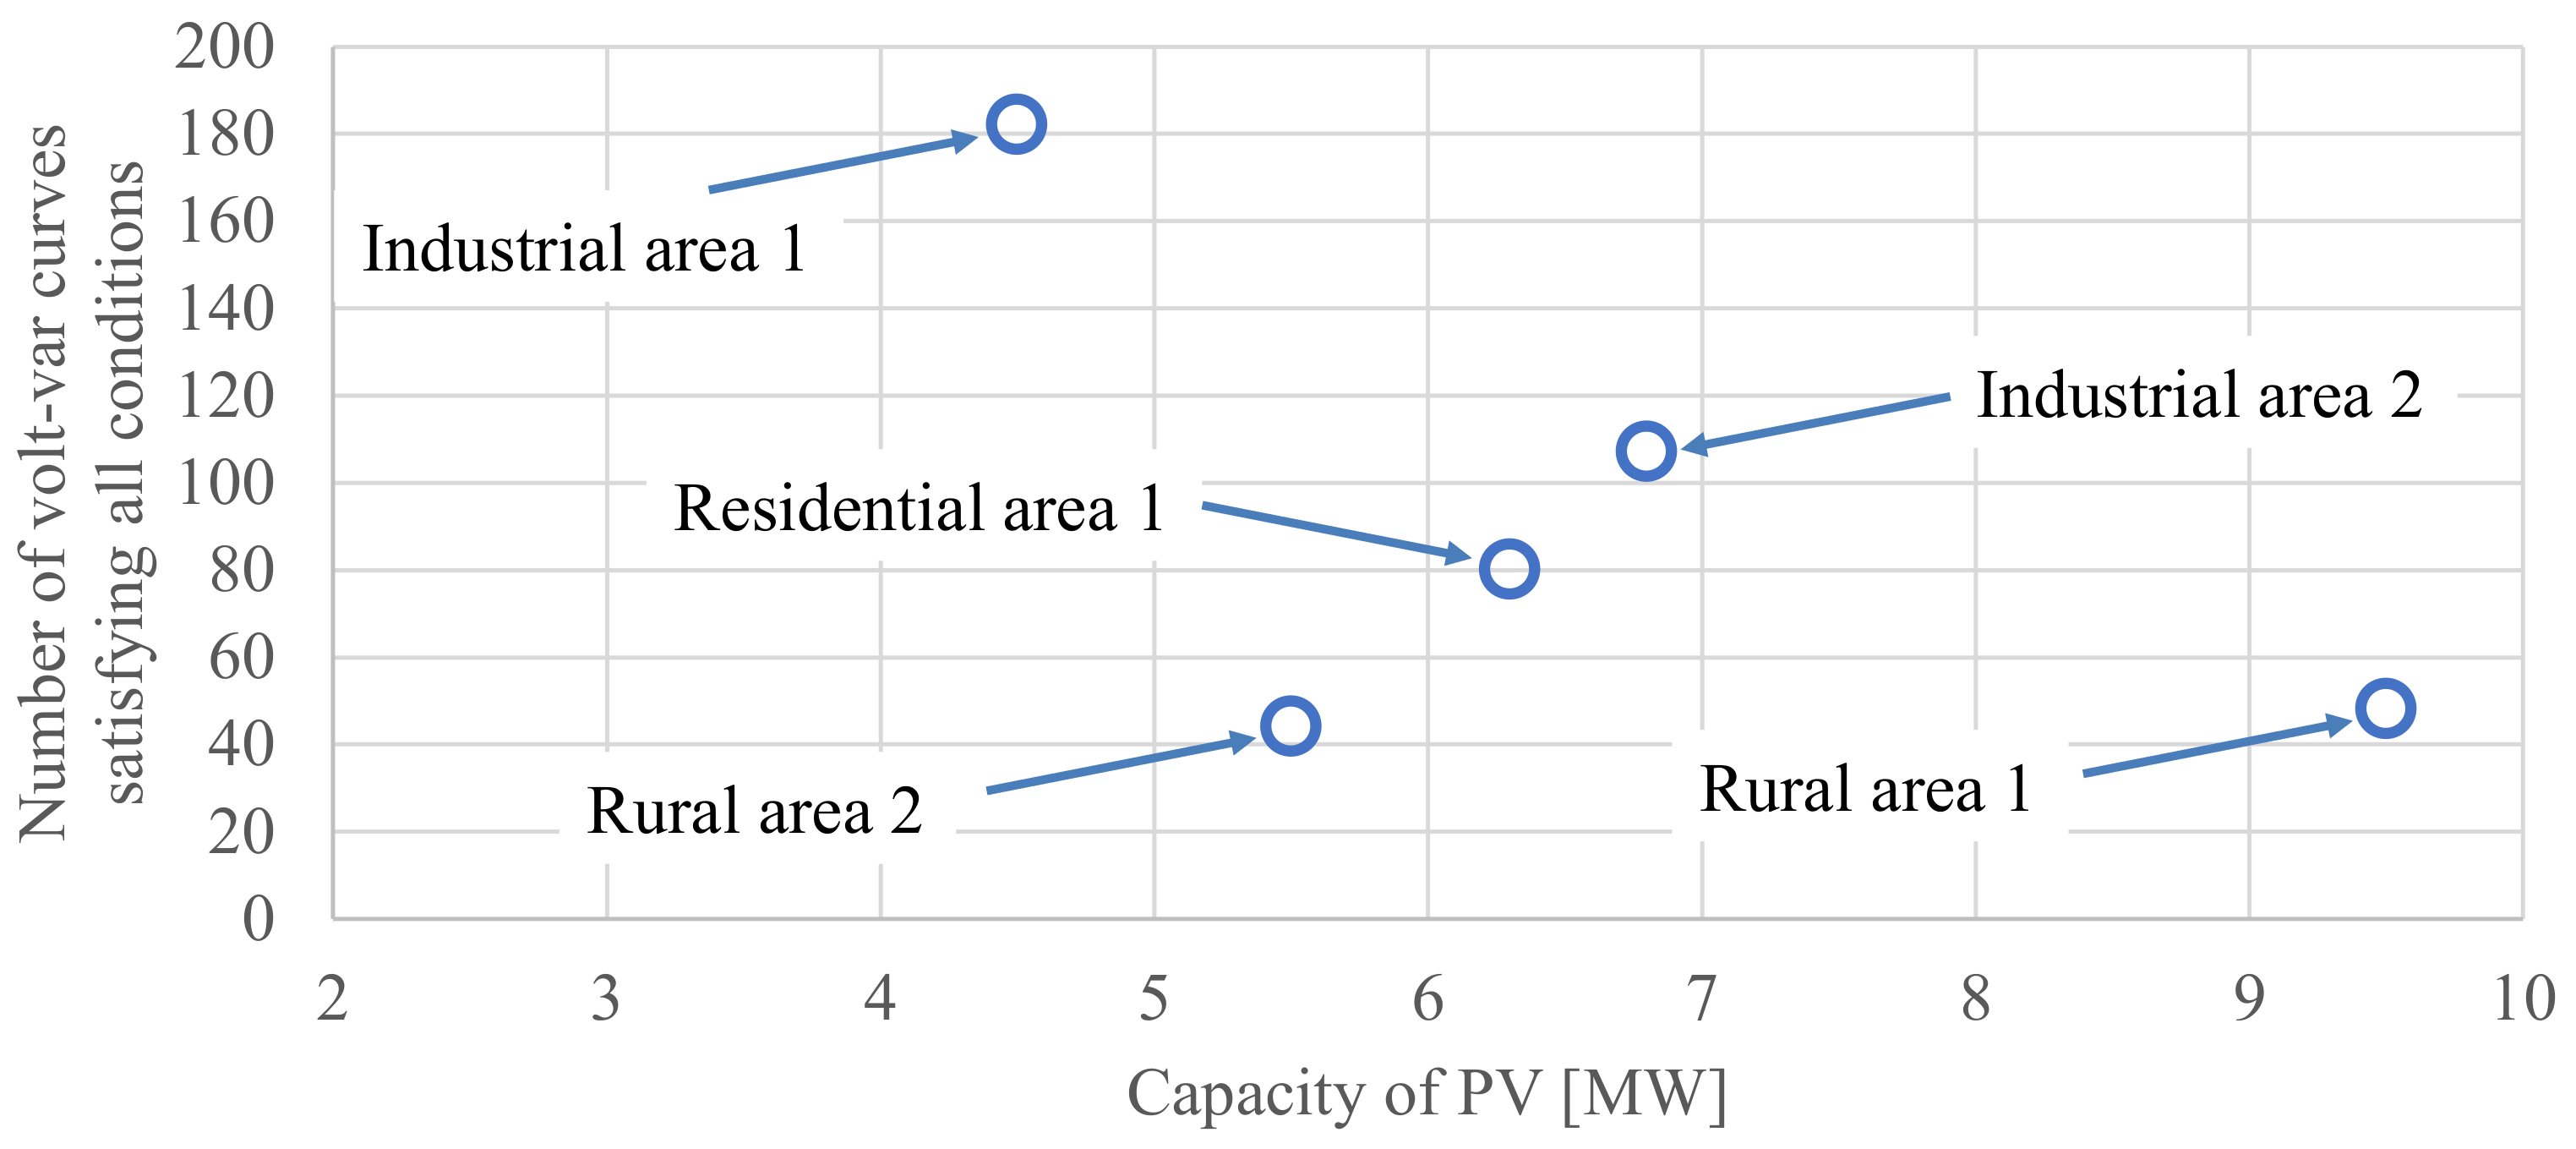
3.3. Dependence on PV Capacity and Line Length

We analyzed three distribution system models in addition to the two described in the previous section. From these results, the number of volt–var curves that satisfy the evaluation conditions was investigated among 360 patterns of volt–var curves for each distribution-system model. Table 3 shows the main line length and the installed PV capacity for each distribution system model. Table 4 shows the evaluation conditions.
Figure 15 shows the relationship between the number of volt–var curves satisfying all the conditions listed in Table 4 and the installed PV capacity. The number of volt–var curves satisfying all the conditions tends to decrease as the capacity of installed PV increases. Because the voltage of distribution line increases with the increase in the PV capacity, voltage deviations may occur depending on the setting of the volt–var curve. In addition, although the reactive power is controlled to suppress the voltage rise, the match rate tends to decrease owing to the power factor constraint of the inverter. As a result, the number of volt–var curves satisfying all the conditions is the lowest in the rural area 1 model, which has the largest installed PV capacity, and the highest in the industrial area 1 model, which has the smallest installed PV capacity.
Although the capacity of PV installed in the models of residential area 1, rural area 2, and industrial area 2 are relatively close, there is a difference in the number of volt–var curves that satisfy all the conditions. The rural area 2 model has fewer volt–var curves satisfying all the conditions than residential area 1 model because the former model has a longer line length and is more prone to voltage deviations. In addition, the voltage rise is smaller in the industrial area 2 model than in the residential area 1 model because of the smaller distribution-line resistance and the number of volt–var curves satisfying all the conditions is larger. From the above results, it was quantitatively verified that the number of volt–var curves satisfying the conditions becomes smaller when the installed PV capacity is large, distribution-line length is long, and the distribution-line resistance is large.

4. Selection of Volt–Var Curve

The number of candidate volt–var curves can be narrowed down by setting the conditions for voltage deviation, match rate, and the number of LRT tap operations. However, the number of candidates varies on the basis of the distribution-line characteristics. Although it is possible to set a suitable volt–var curve for each distribution system, it is more convenient to set one suitable volt–var curve for all the distribution systems, from the viewpoint of the labor required for distribution system operation. Therefore, we decided to derive a candidate volt–var curve by taking the logical product of the extracted volt–var curves for each distribution system shown in Figure 15. As a result, we were able to narrow down the 360 patterns of volt–var curves to 23 patterns. Figure 16 shows the obtained volt–var curves.
On comparing the volt–var curves from Figure 16, it can be inferred that the reactive power characteristics for voltage rise are almost the same. On the other hand, the reactive power characteristics for voltage drop are different. This is because the simulation in this study is mainly focused on suppressing the voltage rise, and it is assumed that there are few time periods when the voltage drops.
Table 5 summarizes the electrical characteristics of the distribution system model with the application of the 23 selected volt–var curves. The average values of line loss, curtailment, match rate, voltage violation, and LRT tap operation when the volt–var curve is applied to the five distribution system models shown in Table 3 are indicated, respectively. It confirmed that there is no significant difference in the effect of the selected volt–var curves. The difference between the maximum and minimum values of line loss is small (99 kWh). Because the PV capacity in the distribution system model is in the MW class, the curtailment is also small. The number of tap operation is not the number that reduces the lifetime of the equipment more than necessary.
To select one of the 23 selected volt–var curves, we propose to choose a volt–var curve such that the reactive power output is the minimum necessary to minimize the distribution losses, that is, from the volt–var curves shown in Figure 16, we selected the one with the widest dead zone and largest slope range value defined in Figure 1. Figure 17 depicts the selected volt–var curve.

5. Discussion

In this study, one volt–var curve shown in Figure 17 is extracted as the optimal solution from the analysis of electrical characteristics for 360 patterns of volt–var curves. 360 candidate patterns are defined by the central voltage Vref, dead zone, and slope, and cover almost all the volt–var curves that may be applied in practice. As another solution, the volt–var curve can be determined by solving the volt–var curve optimization problem [24,25,26,27], which is one of state-of-the-art counterparts to determine the volt–var curve. However, the solution obtained should be equal to or very close to one of the 360 patterns. As shown in Table 5, all of the 23 selected volt–var curves can provide excellent effects on the distribution system.
The selected volt–var curve, shown in Figure 17, was evaluated by comparing it with the state-of-the-art volt–var curve used in the actual field at the Hawaii Power company as the standard volt–var curve. Although a simple comparison cannot be made because of the different system configurations between Hawaii and Japan, the significance of setting the volt–var curve according to the distribution system characteristics in the area can be evaluated. First, comparing the shapes of the volt–var curves, the dead zone of the volt–var curve shown in Figure 17 is more than twice as wide as that of the Hawaii power company. Subsequently, the results of applying the curve shown in Figure 17 and that of the Hawaii power company to each distribution system listed in Table 3 are compared, and the results are summarized in Table 6.
It can be observed from Table 6 that when the proposed volt–var curve is applied, the distribution-line loss is smaller, the curtailment owing to the constraint of inverter capacity is also smaller, and the match rate is extremely higher, compared with those obtained using the volt–var curve of the Hawaii Power Company. Moreover, the number of LRT tap operations did not increase significantly. These results indicate that that setting the volt–var curve according to the characteristics of the area can greatly improve the problem of the operating point deviating from the volt–var curve.

6. Conclusions

In this study, a method to set an appropriate volt–var curve for PV inverters connected to distribution lines with a tap controller, such as LRT, was proposed. Five different distribution line models and 360 patterns of volt–var curves were developed to study how to select a standard volt–var curve using voltage controllability, number of tap operations, distribution loss, and a new evaluation index, the match rate. The primary results of this study are as follows:
  • From the simulation results for the 360 patterns of the volt–var curve, the reactive-power-output accumulation of the PV inverters, distribution loss, and the number of tap operations of LRT are plotted in a three-dimensional graph, and the response of the volt–var curve can be characterized visually.
  • The three-dimensional graph indicates that as the lagged reactive power accumulation increases, the distribution line loss also increases; however, the increase or decrease in the number of tap operations depends on the characteristics of the distribution line.
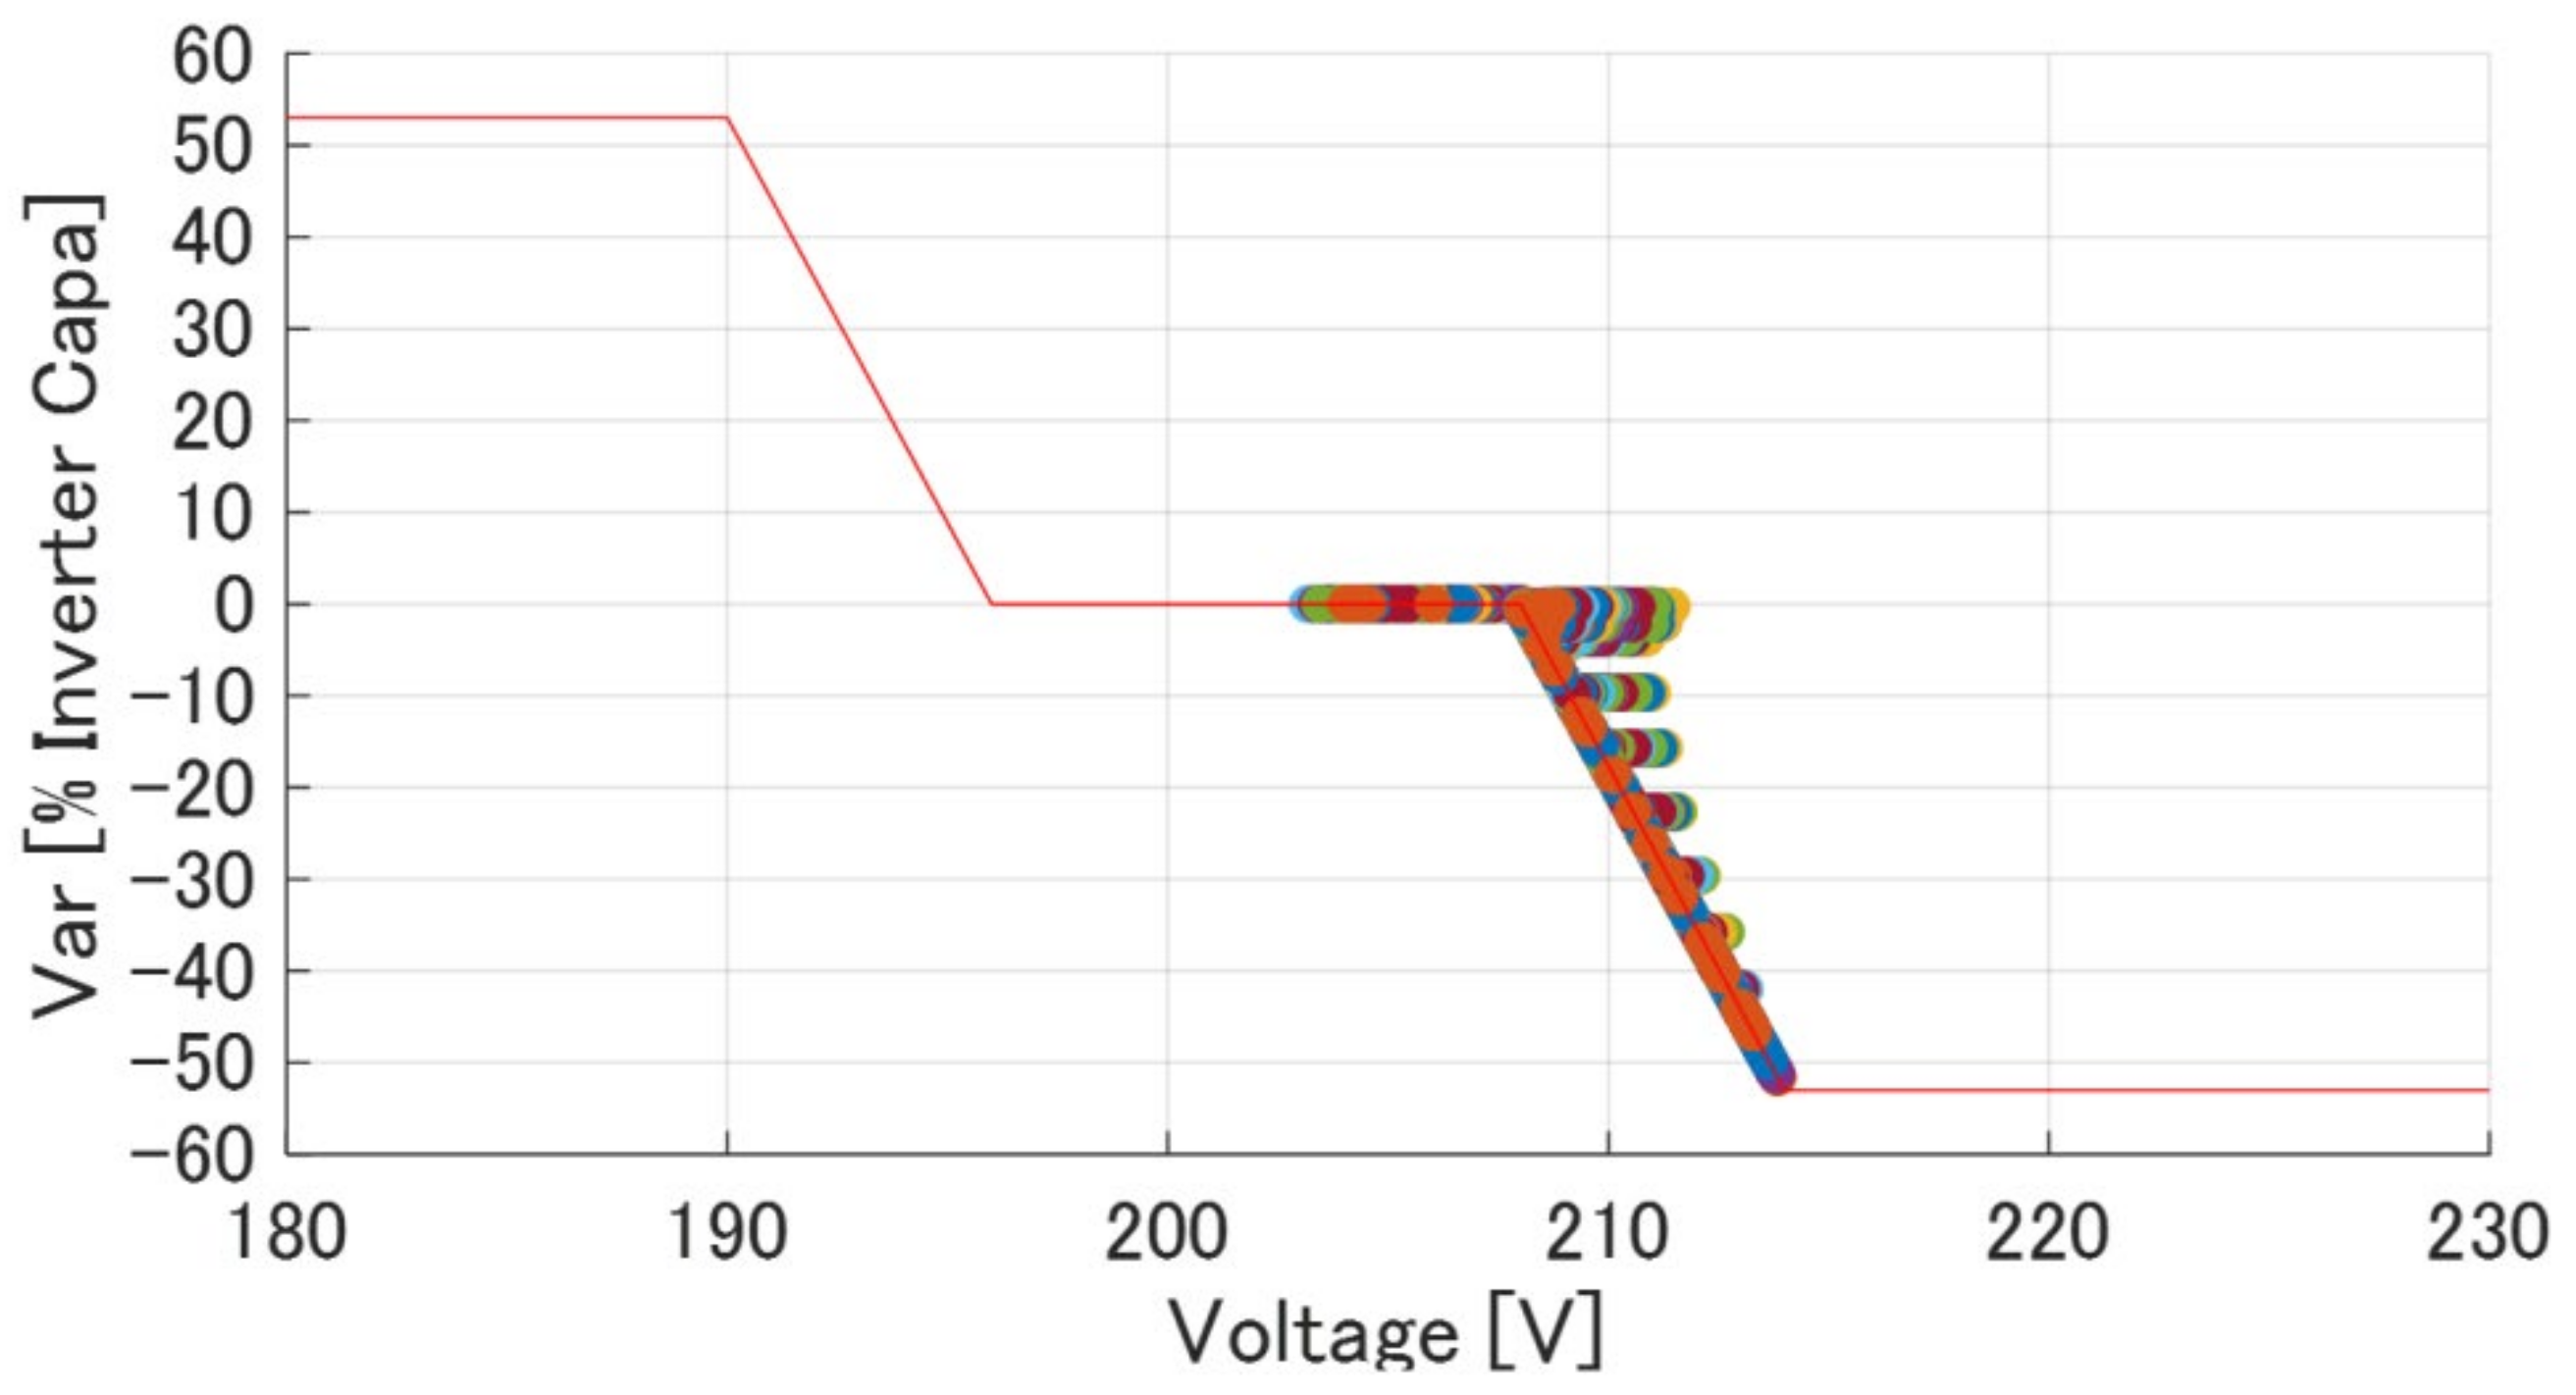
  • Owing to the power factor constraint of the inverter, it is not possible to output the commanded reactive power according to the volt–var curve. By calculating the match rate to evaluate this, we can narrow down the volt–var curve that can effectively utilize the reactive power of the PV inverter for voltage control.
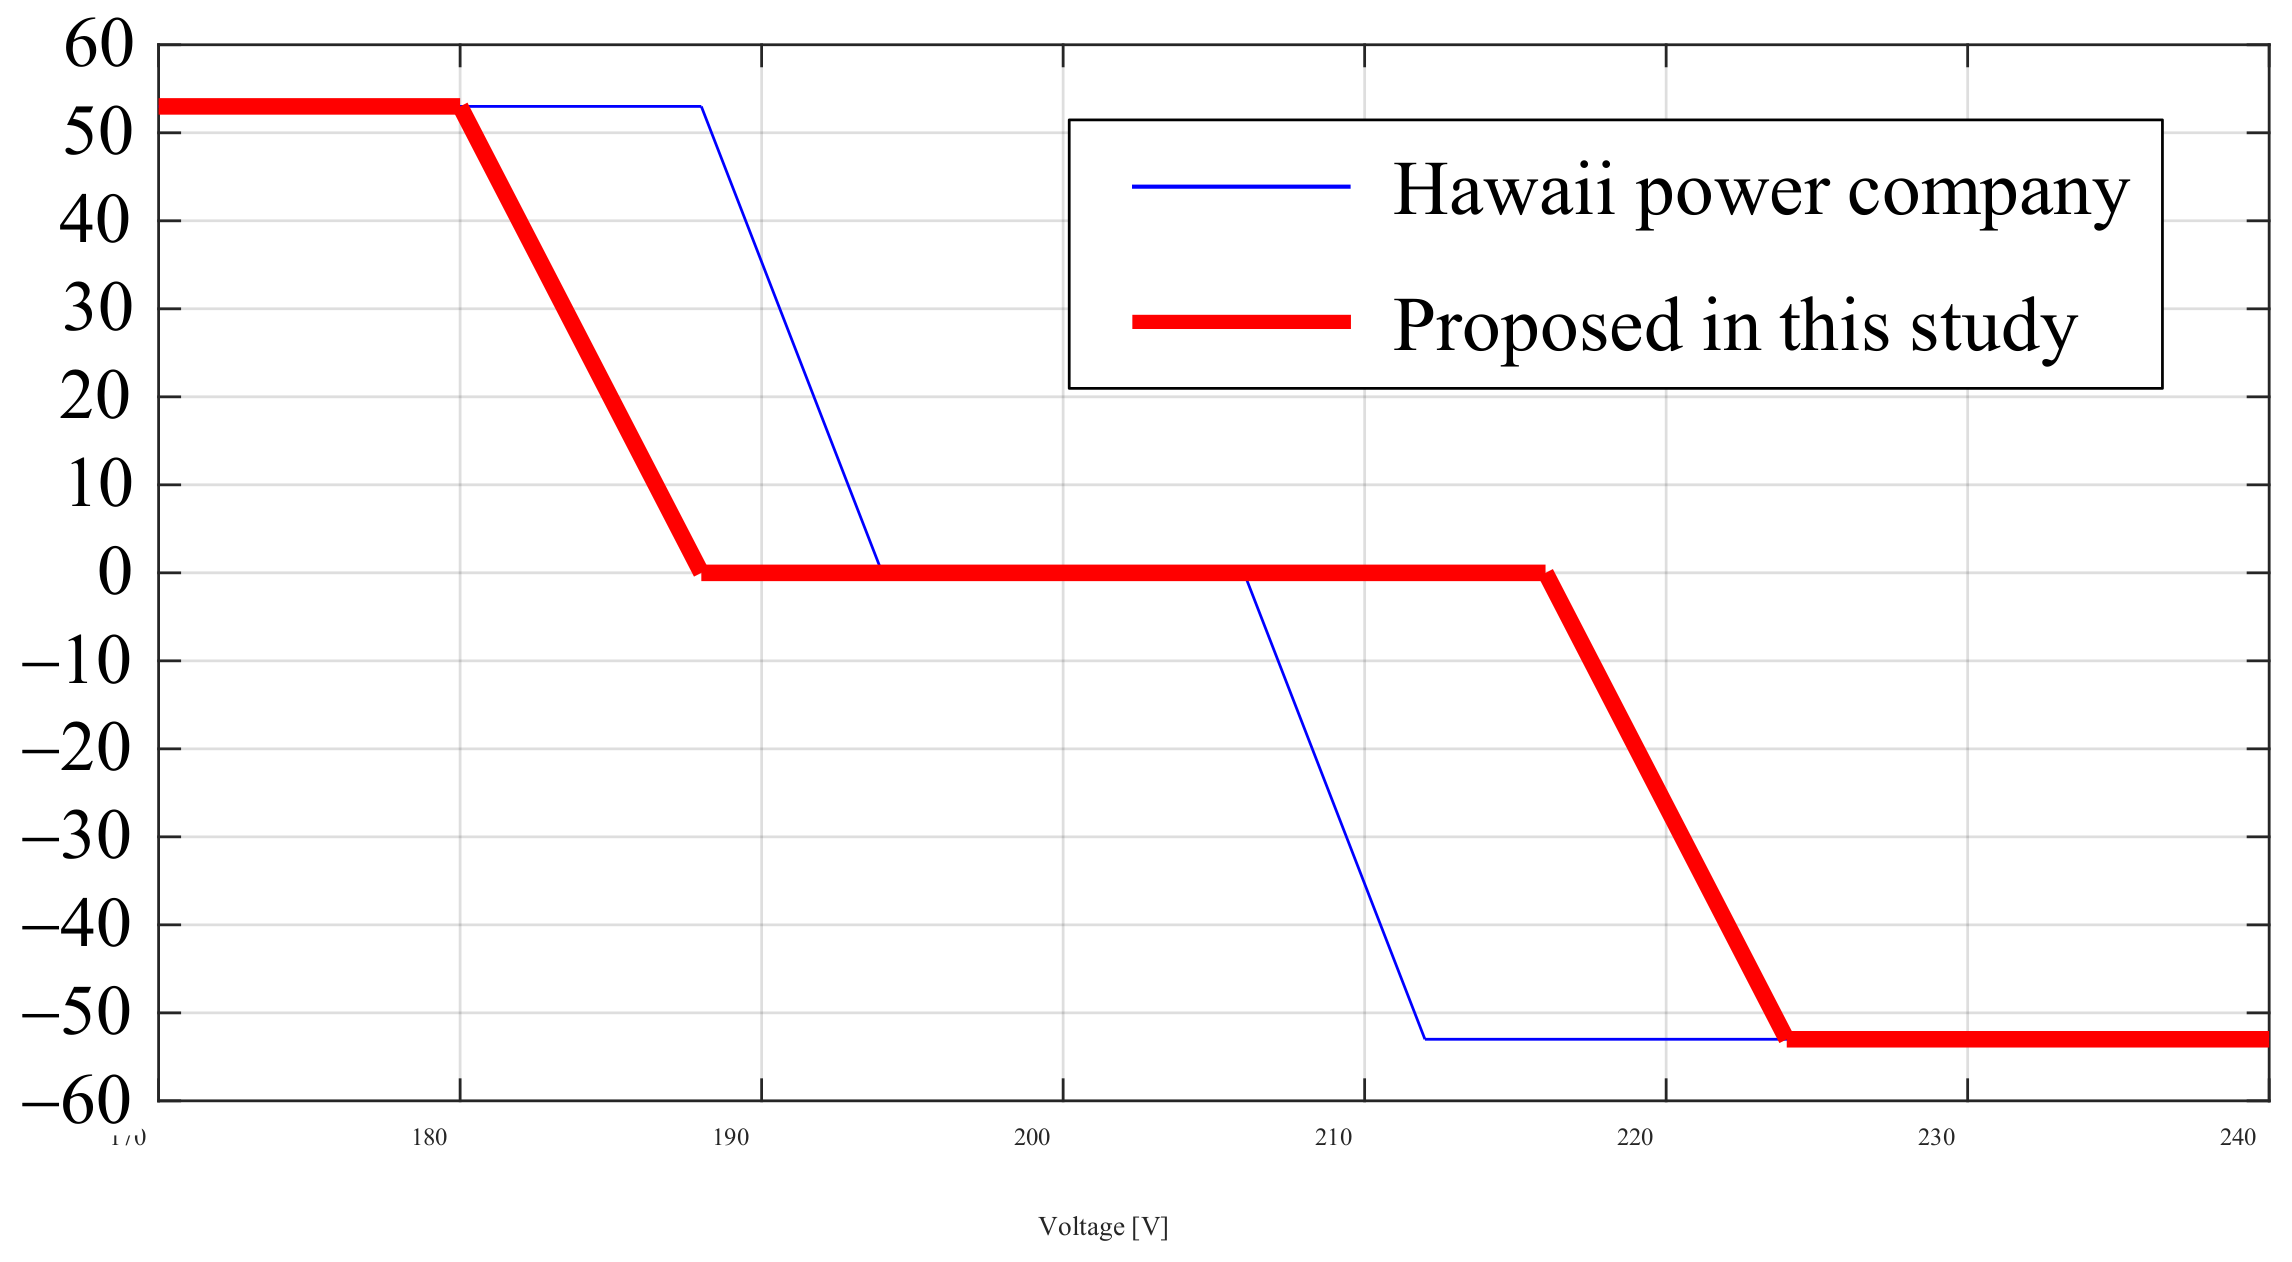
  • Furthermore, by selecting the volt–var curve that can control the voltage within the appropriate range, we were able to narrow down the 360 patterns of volt–var curves to 23 patterns. When the volt–var curve that minimizes the reactive power output is selected and compared with the standard volt–var curve of the Hawaii Power Company, it was found that the volt–var curve selected using the proposed method is superior to that of the Hawaii Power Company from the viewpoint of distribution loss, voltage violation, and match rate.

Author Contributions

This study is a collaborative effort among the authors, and all the authors have read and agreed to the published version of the manuscript. Conceptualization, D.I. and K.K.; methodology, D.I. and K.K.; software, D.I. and K.K.; validation, T.M. (Takahiro Matsuura) and H.H.; formal analysis, D.I. and K.K.; investigation, K.K.; resources, T.M. (Takahiro Matsuura), H.H. and T.M. (Teru Miyazaki); data curation, K.K.; writing—original draft preparation, D.I.; writing—review and editing, D.I., K.K., T.M. (Takahiro Matsuura), H.H. and T.M. (Teru Miyazaki); visualization, D.I. and K.K.; supervision, H.H. and T.M. (Teru Miyazaki); project administration, H.H. and T.M. (Teru Miyazaki). All authors have read and agreed to the published version of the manuscript.

Funding

This research received no external funding.

Institutional Review Board Statement

Not applicable.

Informed Consent Statement

Not applicable.

Conflicts of Interest

The authors declare no conflict of interest.

References

  1. Green, M.A. Photovoltaic technology and visions for the future. Prog. Energy 2019, 1, 013001. [Google Scholar] [CrossRef]
  2. Wang, R.; Mujahid, M.; Duan, Y.; Wang, Z.-K.; Xue, J.; Yang, Y. A Review of Perovskites Solar Cell Stability. Adv. Funct. Mater. 2019, 29, 1808843. [Google Scholar] [CrossRef]
  3. Xiao, L.; Kolaczkowski, M.A.; Min, Y.; Liu, Y. Substitution Effect on Thiobarbituric Acid End Groups for High Open-Circuit Voltage Non-Fullerene Organic Solar Cells. ACS Appl. Mater. Interfaces 2020, 12, 41852–41860. [Google Scholar] [CrossRef]
  4. Gandhi, O.; Kumar, D.S.; Rodríguez-Gallegos, C.D.; Srinivasan, D. Review of power system impacts at high PV penetration Part I: Factors limiting PV penetration. Sol. Energy 2002, 210, 181–201. [Google Scholar] [CrossRef]
  5. Noone, B.; Bruce, A.; MacGill, I.; Bletterie, B.; Bründlinger, R.; Mayr, C.; De Brabandere, K.; Dierckxsens, C.; Yibo, W.; Stetz, T.; et al. High Penetration of PV in Local Distribution Grids; Report IEA PVPS T14-02; International Energy Agency (IEA): Paris, France, 2014. [Google Scholar]
  6. Iioka, D.; Fujii, T.; Orihara, D.; Tanaka, T.; Harimoto, T.; Shimada, A.; Goto, T.; Kubuki, M. Voltage reduction due to reverse power flow in distribution feeder with photovoltaic system. Int. J. Electr. Power Energy Syst. 2019, 113, 411–418. [Google Scholar] [CrossRef]
  7. Hossain, M.I.; Yan, R.; Saha, T.K. Investigation of the interaction between step voltage regulators and large-scale photovoltaic systems regarding voltage regulation and unbalance. IET Renew. Power Gener. 2016, 10, 299–309. [Google Scholar] [CrossRef] [Green Version]
  8. Iioka, D.; Sakakibara, K.; Yokomizu, Y.; Matsumura, T.; Izuhara, N. Distribution voltage rise at dense photovoltaic generation area and its suppression by SVC. Electr. Eng. Jpn. 2009, 166, 47–53. [Google Scholar] [CrossRef]
  9. Zeraati, M.; Hamedani Golshan, M.E.; Guerrero, J.M. Distributed Control of Battery Energy Storage Systems for Voltage Regulation in Distribution Networks with High PV Penetration. IEEE Trans. Smart Grid 2018, 9, 3582–3593. [Google Scholar] [CrossRef] [Green Version]
  10. Iioka, D.; Miura, K.; Machida, M.; Kikuchi, S.; Imanaka, M.; Baba, J.; Takagi, M.; Asano, H. Hosting capacity of large scale PV power station in future distribution networks. In Proceedings of the 2017 IEEE Innovative Smart Grid Technologies—Asia (ISGT-Asia), Auckland, New Zealand, 4–7 December 2017; pp. 1–6. [Google Scholar] [CrossRef]
  11. Kikuchi, S.; Machida, M.; Tamura, J.; Imanaka, M.; Baba, J.; Iioka, D.; Miura, K.; Takagi, M.; Asano, H. Hosting capacity analysis of many distributed photovoltaic systems in future distribution networks. In Proceedings of the 2017 IEEE Innovative Smart Grid Technologies—Asia (ISGT-Asia), Auckland, New Zealand, 4–7 December 2017; pp. 1–5. [Google Scholar] [CrossRef]
  12. Liu, X.; Aichhorn, A.; Liu, L.; Li, H. Coordinated Control of Distributed Energy Storage System with Tap Changer Transformers for Voltage Rise Mitigation Under High Photovoltaic Penetration. IEEE Trans. Smart Grid 2012, 3, 897–906. [Google Scholar] [CrossRef]
  13. Agalgaonkar, Y.P.; Pal, B.C.; Jabr, R.A. Distribution Voltage Control Considering the Impact of PV Generation on Tap Changers and Autonomous Regulators. IEEE Trans. Power Syst. 2014, 29, 182–192. [Google Scholar] [CrossRef] [Green Version]
  14. Wang, L.; Bai, F.; Yan, R.; Saha, T.K. Real-Time Coordinated Voltage Control of PV Inverters and Energy Storage for Weak Networks with High PV Penetration. IEEE Trans. Power Syst. 2018, 33, 3383–3395. [Google Scholar] [CrossRef] [Green Version]
  15. Iioka, D.; Fujii, T.; Tanaka, T.; Harimoto, T.; Motoyama, J. Voltage Reduction in Medium Voltage Distribution Systems Using Constant Power Factor Control of PV PCS. Energies 2020, 13, 5430. [Google Scholar] [CrossRef]
  16. Edge, R.; York, B.; Enber, N. Rolling Out Smart Inverters—Assessing Utility Strategies and Approaches. Solar Electric Power Association (SEPA) and Electric Power Research Institute (EPRI)s’ Technical Report; EPRI: Washington, DC, USA, 2015. [Google Scholar]
  17. International Electrotechnical Commission (IEC). IEC TR 61850-90-7. IEC’s Technical Report; Edition 1.0 2013-02; International Electrotechnical Commission (IEC): London, UK, 2013. [Google Scholar]
  18. Seal, B.; Ealey, B. Common Function for Smart Inverters, 4th ed.; Electric Power Research Institute (EPRI)’s Technical Report; EPRI: Washington, DC, USA, 2016. [Google Scholar]
  19. Ding, F.; Nagarajian, A.; Chakrabotory, C.; Baggu, M.; Nguyen, A.; Walinga, S.; McCarty, M.; Bell, F. Photovoltaic Impact Assessment of Smart Inverter Volt-Var Control on Distribution System Conservation Voltage Reduction and Power Quality; NREL Technical Report; NREL: Golden, CO, USA, 2016. [Google Scholar]
  20. Parajeles, M.J.; Quirós-Tortós, J.; Valverde, G. Assessing the performance of smart inverters in large-scale distribution networks with PV systems. In Proceedings of the 2017 IEEE PES Innovative Smart Grid Technologies Conference—Latin America (ISGT Latin America), Quito, Ecuador, 20–22 September 2017; pp. 1–6. [Google Scholar] [CrossRef]
  21. Horowitz, K.A.; Peterson, Z.; Coddington, M.H.; Ding, F.; Sigrin, B.O.; Saleem, D.; Baldwin, S.E.; Lydic, B.; Stanfield, S.C.; Enbar, N.; et al. An Overview of Distributed Energy Resource (DER) Interconnection: Current Practices and Emerging Solutions; NREL Technical Report, TP-6A20-72102; NREL: Golden, CO, USA, 2019. [Google Scholar]
  22. Bello, M.; Montenegro-Martinez, D.; York, B.; Smith, J. Optimal Settings for Multiple Groups of Smart Inverters on Secondary Systems Using Autonomous Control. IEEE Trans. Ind. Appl. 2018, 54, 1218–1223. [Google Scholar] [CrossRef]
  23. Rylander, M.; Reno, M.J.; Quiroz, J.E.; Ding, F.; Li, H.; Broderick, R.J.; Mather, B.; Smith, J. Methods to determine recommended feeder-wide advanced inverter settings for improving distribution system performance. In Proceedings of the 2016 IEEE 43rd Photovoltaic Specialists Conference (PVSC), Portland, OR, USA, 5–10 June 2016; pp. 1393–1398. [Google Scholar] [CrossRef]
  24. Dao, V.T.; Ishii, H.; Hayashi, Y. Optimal smart functions of large-scale PV inverters in distribution systems. In Proceedings of the 2017 IEEE Innovative Smart Grid Technologies—Asia (ISGT-Asia), Auckland, New Zealand, 4–7 December 2017; pp. 1–7. [Google Scholar] [CrossRef]
  25. Jafari, M.; Olowu, T.O.; Sarwat, A.I. Optimal Smart Inverters Volt-VAR Curve Selection with a Multi-Objective Volt-VAR Optimization using Evolutionary Algorithm Approach. In Proceedings of the 2018 North American Power Symposium (NAPS), Fargo, ND, USA, 9–11 September 2018; pp. 1–6. [Google Scholar] [CrossRef]
  26. Lee, H.; Kim, J.C.; Cho, S.M. Optimal Volt–Var Curve Setting of a Smart Inverter for Improving Its Performance in a Distribution System. IEEE Access 2020, 8, 157931–157945. [Google Scholar] [CrossRef]
  27. Yamane, K.; Orihara, D.; Iioka, D.; Aoto, Y.; Hashimoto, J.; Goda, T. Determination method of Volt-Var and Volt-Watt curve for smart inverters applying optimization of active/reactive power allocation for each inverter. Electr. Eng. Jpn. 2019, 209, 10–19. [Google Scholar] [CrossRef]
  28. Yoshizawa, S.; Yanagiya, Y.; Ishii, H.; Hayashi, Y.; Matsuura, T.; Hamada, H.; Mori, K. Voltage-Sensitivity-Based Volt-VAR-Watt Settings of Smart Inverters for Mitigating Voltage Rise in Distribution Systems. IEEE Open Access J. Power Energy 2021, 8, 584–595. [Google Scholar] [CrossRef]
  29. Kraiczy, M.; York, B.; Bello, M.; Montenegro, D.; Akagi, S.; Braun, M. Coordinating Smart Inverters with Advanced Distribution Voltage Control Strategies. In Proceedings of the 2018 IEEE Power & Energy Society General Meeting (PESGM), Portland, OR, USA, 5–10 August 2018; pp. 1–5. [Google Scholar] [CrossRef]
  30. Rylander, M.; Li, H.; Smith, J.; Sunderman, W. Default Volt-Var inverter settings to improve distribution system performance. In Proceedings of the 2016 IEEE Power and Energy Society General Meeting (PESGM), Boston, MA, USA, 17–21 July 2016; pp. 1–5. [Google Scholar] [CrossRef]
Figure 1. Volt–var curve for PV inverter.
Energies 15 01375 g001
Figure 2. Output range of inverter and operating point on volt–var curve.
Energies 15 01375 g002
Figure 3. Convergence method of reactive power obtained by volt–var curve.
Energies 15 01375 g003
Figure 4. Distribution-network model (residential area 1): (a) medium-voltage distribution network; (b) low-voltage distribution network.
Energies 15 01375 g004
Figure 5. PV and load curves.
Energies 15 01375 g005
Figure 6. Time variation in voltage of low-voltage customers without volt–var control.
Energies 15 01375 g006
Figure 7. Time variation in voltage of low-voltage customers with volt–var control (Vref = 202 [V], dead band = 12 [V], and slope = 6 [V]).
Energies 15 01375 g007
Figure 8. Time variation in reactive power of PV inverters with volt–var control (Vref = 202 [V], dead band = 12 [V], and slope = 6 [V]).
Energies 15 01375 g008
Figure 9. Time variation in LRT tap with volt–var control (Vref = 202 [V], dead band = 12 [V], and slope = 6 [V]).
Energies 15 01375 g009
Figure 10. Time variation in power loss of distribution network with volt–var control (Vref = 202 [V], dead band = 12 [V], and slope = 6 [V]).
Energies 15 01375 g010
Figure 11. Operating point of PV inverters on volt–var curve.
Energies 15 01375 g011
Figure 12. Relationship between cumulative reactive power, network loss, and the number of LRT tap operations when 360 patterns of volt–var curves are applied to the distribution system model (residential area 1).
Energies 15 01375 g012
Figure 13. Distribution network model (rural area 1).
Energies 15 01375 g013
Figure 14. Relationship between cumulative reactive power, network loss, and the number of LRT tap operations when 360 patterns of volt–var curves are applied to distribution system model (rural area 1).
Energies 15 01375 g014
Figure 15. Relationship between the number of volt–var curves satisfying all the conditions listed in Table 4 and the installed PV capacity.
Energies 15 01375 g015
Figure 16. Candidates of volt–var curve by taking the logical product of the extracted volt–var curves for each distribution system model.
Energies 15 01375 g016
Figure 17. Selected volt–var curve that the reactive power output is the minimum necessary to minimize the distribution losses. The standard volt–var curve in the grid interconnection rules of the Hawaii Power company is also shown.
Energies 15 01375 g017
Table 1. Parameters of Volt–Var curve.
ParameterList of Values
Center voltage Vref [V]202, 204, 206, 208, 210, 212, 214, 216, 218
deadband [V]0, 4, 8, 12, 16, 20, 24, 28
slope [V]2, 4, 6, 8, 10, 12, 14, 16, 18, 20
Maximum reactive power Qmax [%]53 (Value dependent on power factor constraint)
Table 2. Match rate calculation for residential area 1.
Vref
(V)
Slope
(V)
Dead Band (V)
0481216202428
202226.027.743.459.271.282.988.6100.0
426.133.750.270.596.3100.0100.0100.0
629.140.161.283.897.2100.0100.0100.0
833.551.773.187.397.5100.0100.0100.0
1043.364.277.588.597.7100.0100.0100.0
204227.043.459.271.282.988.6100.0100.0
433.050.270.596.3100.0100.0100.0100.0
639.861.283.897.2100.0100.0100.0100.0
851.473.187.397.5100.0100.0100.0100.0
1063.977.588.597.7100.0100.0100.0100.0
206238.458.770.982.988.6100.0100.0100.0
446.070.196.1100.0100.0100.0100.0100.0
657.783.497.0100.0100.0100.0100.0100.0
870.086.897.3100.0100.0100.0100.0100.0
1074.888.197.6100.0100.0100.0100.0100.0
208247.466.281.588.2100.0100.0100.0100.0
459.691.898.799.7100.0100.0100.0100.0
673.693.198.799.7100.0100.0100.0100.0
877.093.798.799.8100.0100.0100.0100.0
1079.994.198.899.8100.0100.0100.0100.0
210247.467.683.498.699.6100.0100.0100.0
473.386.495.598.799.7100.0100.0100.0
675.188.195.898.799.7100.0100.0100.0
876.588.996.298.799.8100.0100.0100.0
1077.390.396.398.899.8100.0100.0100.0
212239.557.083.594.998.699.6100.0100.0
463.374.985.495.598.799.7100.0100.0
665.776.688.195.898.799.7100.0100.0
867.777.988.996.298.799.8100.0100.0
1068.879.490.396.398.899.8100.0100.0
214242.557.968.582.894.998.699.6100.0
452.360.973.585.195.598.799.7100.0
657.563.476.288.195.898.799.7100.0
859.465.877.988.996.298.799.8100.0
1061.467.879.490.396.398.899.8100.0
216244.748.957.468.082.494.998.699.6
447.651.260.272.984.895.598.799.7
649.756.462.776.088.195.898.799.7
852.358.865.577.988.996.298.799.8
1055.660.867.879.490.396.398.899.8
218238.944.348.357.468.082.494.998.6
443.347.251.060.272.984.895.598.7
646.449.356.262.776.088.195.898.7
848.552.258.865.577.988.996.298.7
1050.655.660.867.879.490.396.398.8
Table 3. Specifications of analyzed distribution system model.
ModelPV Capacity (MW)Main Line Length (km)
Residential area 16.34.2
Rural area 19.54.4
Rural area 25.57.5
Industrial area 14.53.6
Industrial area 26.84.7
Table 4. Evaluation parameters for volt–var curves.
ParameterEvaluation Condition
Voltage of low-voltage customer V (pu)0.9 ≤ V≤ 1.1
Match rate PM (%)99 ≤ PM
LRT tap operation N per dayN ≤ 15
Table 5. Comparison of the effect of the selected volt–var curves.
Vref
(V)
Deadband
(V)
Slope
(V)
Line Loss (kWh)Curtailment
(kWh)
Match Rate(%)Voltage Violation (kV2s)LRT Tap Operation
202284262012299.905.2
20228625825899.905.6
20228825703999.905.6
204244262012299.905.2
20424625825899.905.6
20424825703999.905.6
204282254674100.006.4
204284253740100.006.4
206204262012299.905.2
20620625825899.905.6
20620825703999.905.6
206242254674100.006.4
206244253740100.006.4
206282252125100.007.6
208164262012299.905.2
20816625825899.905.6
20816825703999.905.6
208202254674100.006.4
208204253740100.006.4
208242252125100.007.6
21016225467499.906.4
21016425374099.906.4
210202252125100.007.6
Table 6. Comparison of the effect of volt–var curves: (a) volt–var curve of the Hawaii power company; (b) volt–var curve, shown in Figure 17, proposed in this study.
Volt-Var CurveModelLine Loss
(kWh)
Curtailment
(kWh)
Match Rate
(%)
Voltage Violation (kV2s)LRT Tap Operation
(a)Residential area 14482180161.203
Rural area 15505386726.009
Rural area 23038156050.906
Industrial area 11998172234.35.98
Industrial area 23448232145.1010
(b)Residential area 1290612100013
Rural area 1387511399.705
Rural area 224005910004
Industrial area 11278010004
Industrial area 223921110002
Publisher’s Note: MDPI stays neutral with regard to jurisdictional claims in published maps and institutional affiliations.

