
Spatial Network Structure of China’s Provincial-Scale Tourism Eco-Efficiency: A Social Network Analysis


Abstract
:1. Introduction
2. Materials and Methodology
2.1. Method
2.1.1. Super-SBM
2.1.2. Modified Gravity Model
2.1.3. Social Network Analysis
2.2. Index System Selection
2.3. Data Source
3. Results
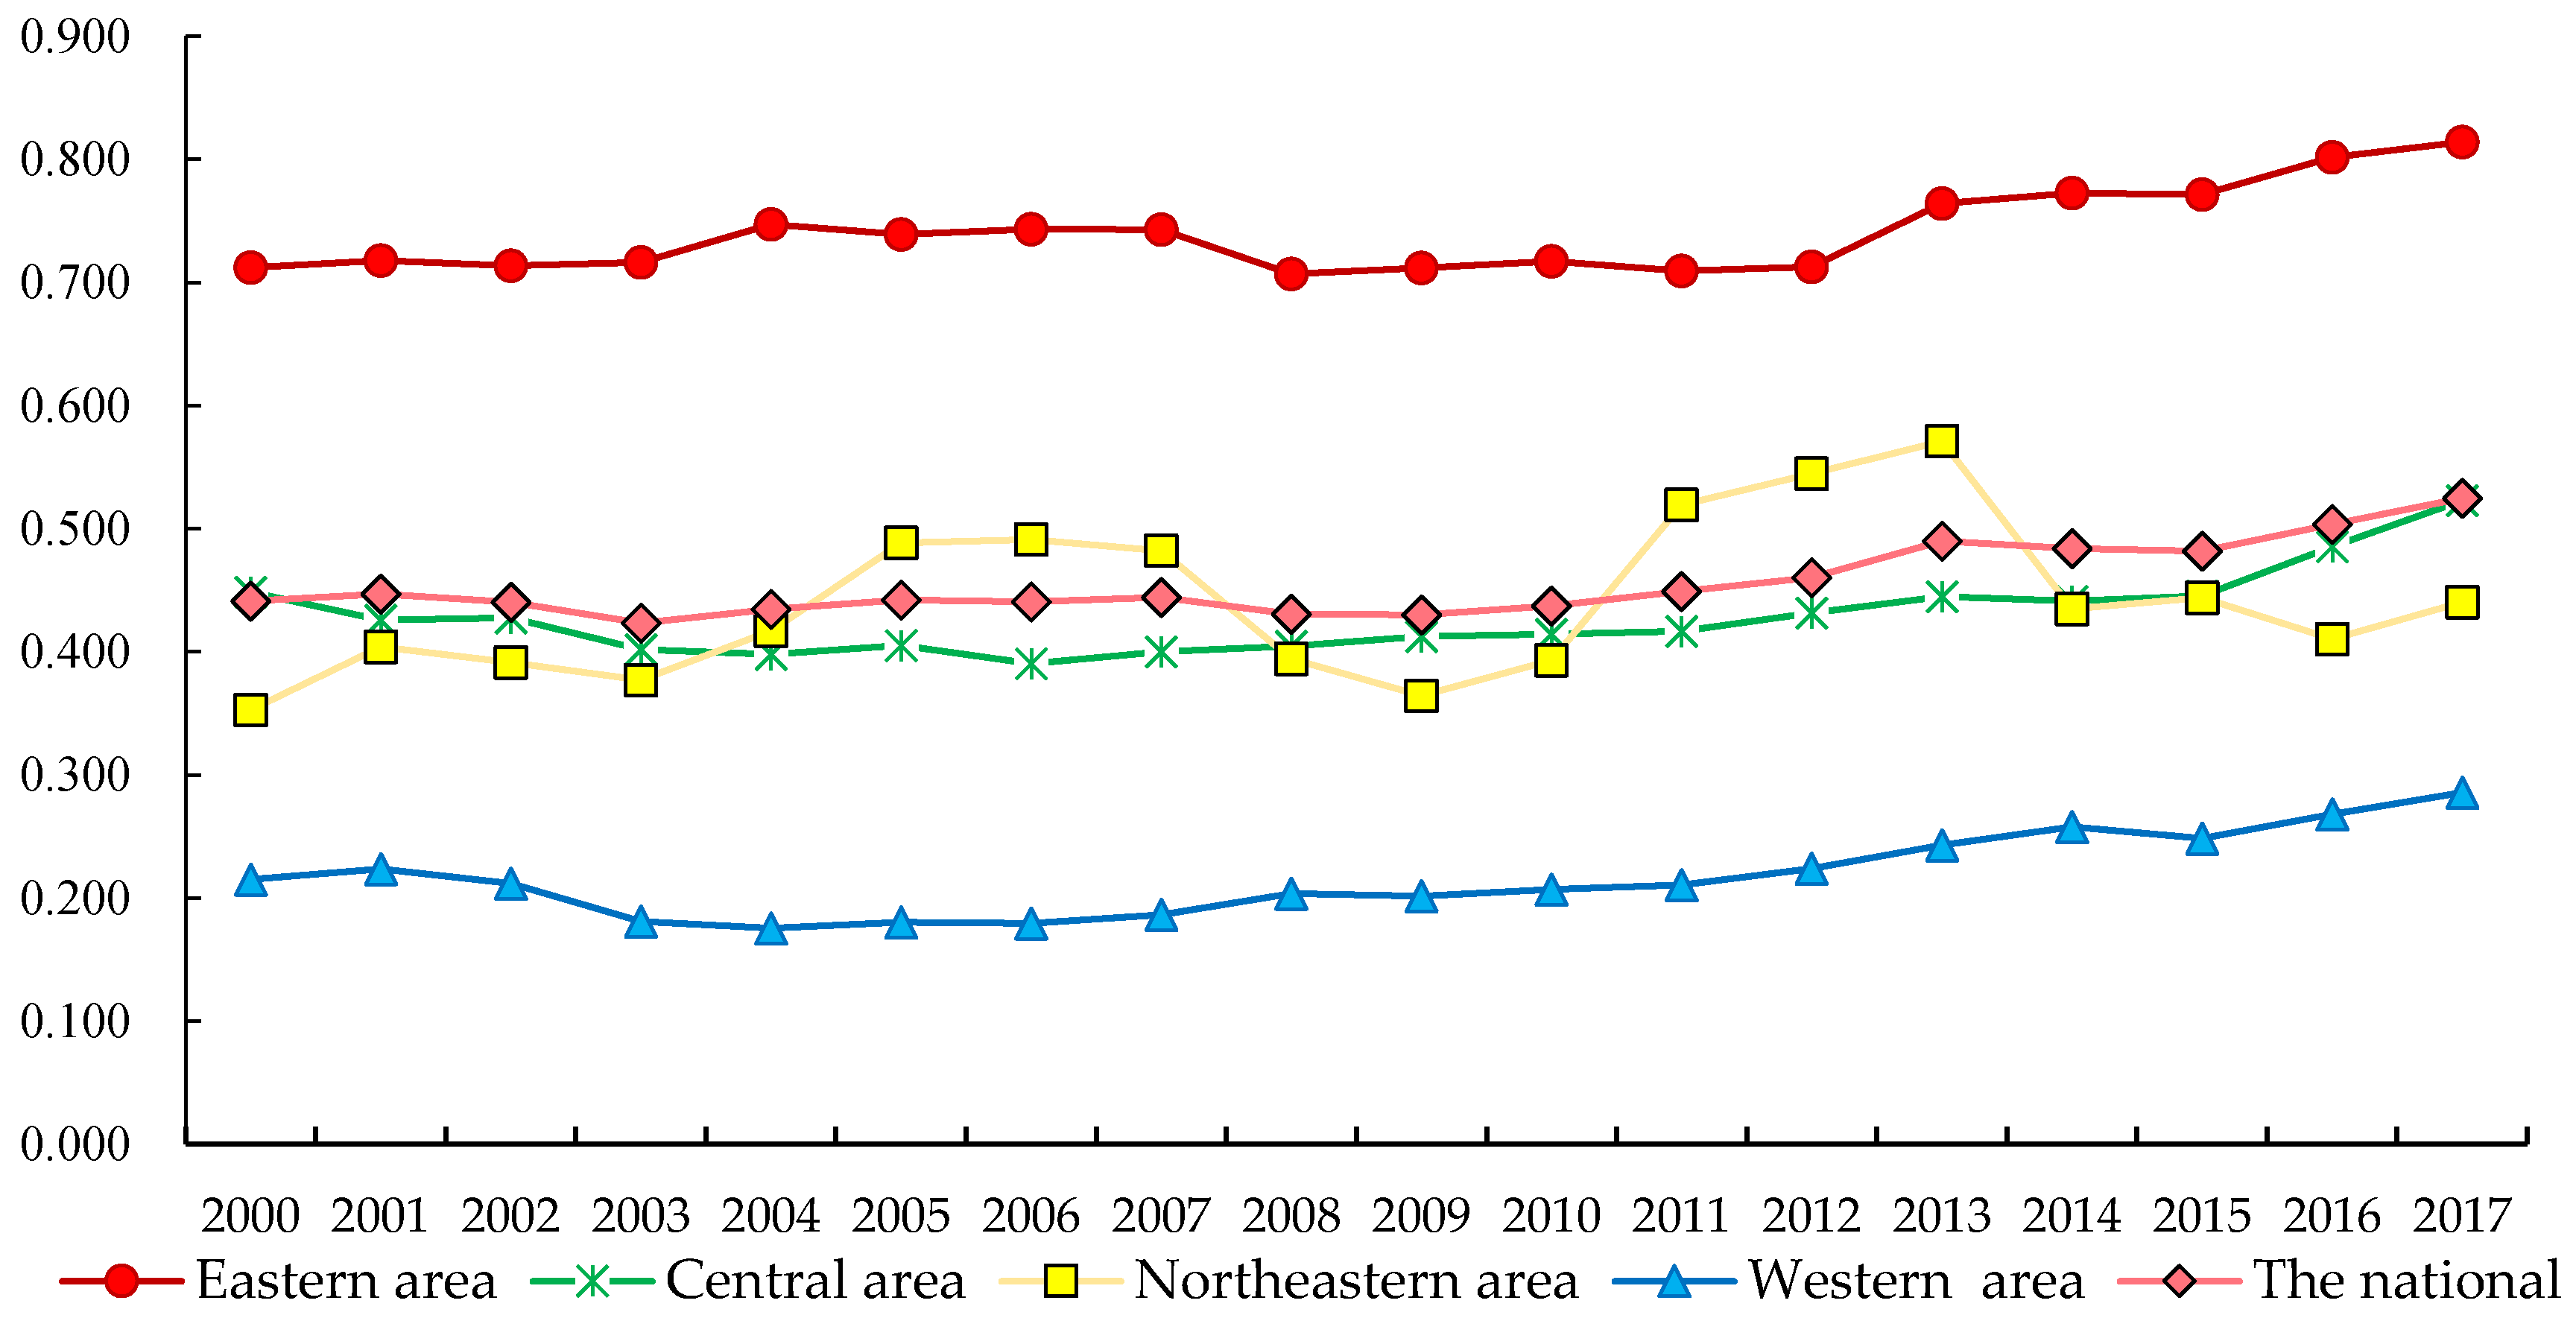
3.1. Measurement of Tourism Eco-Efficiency
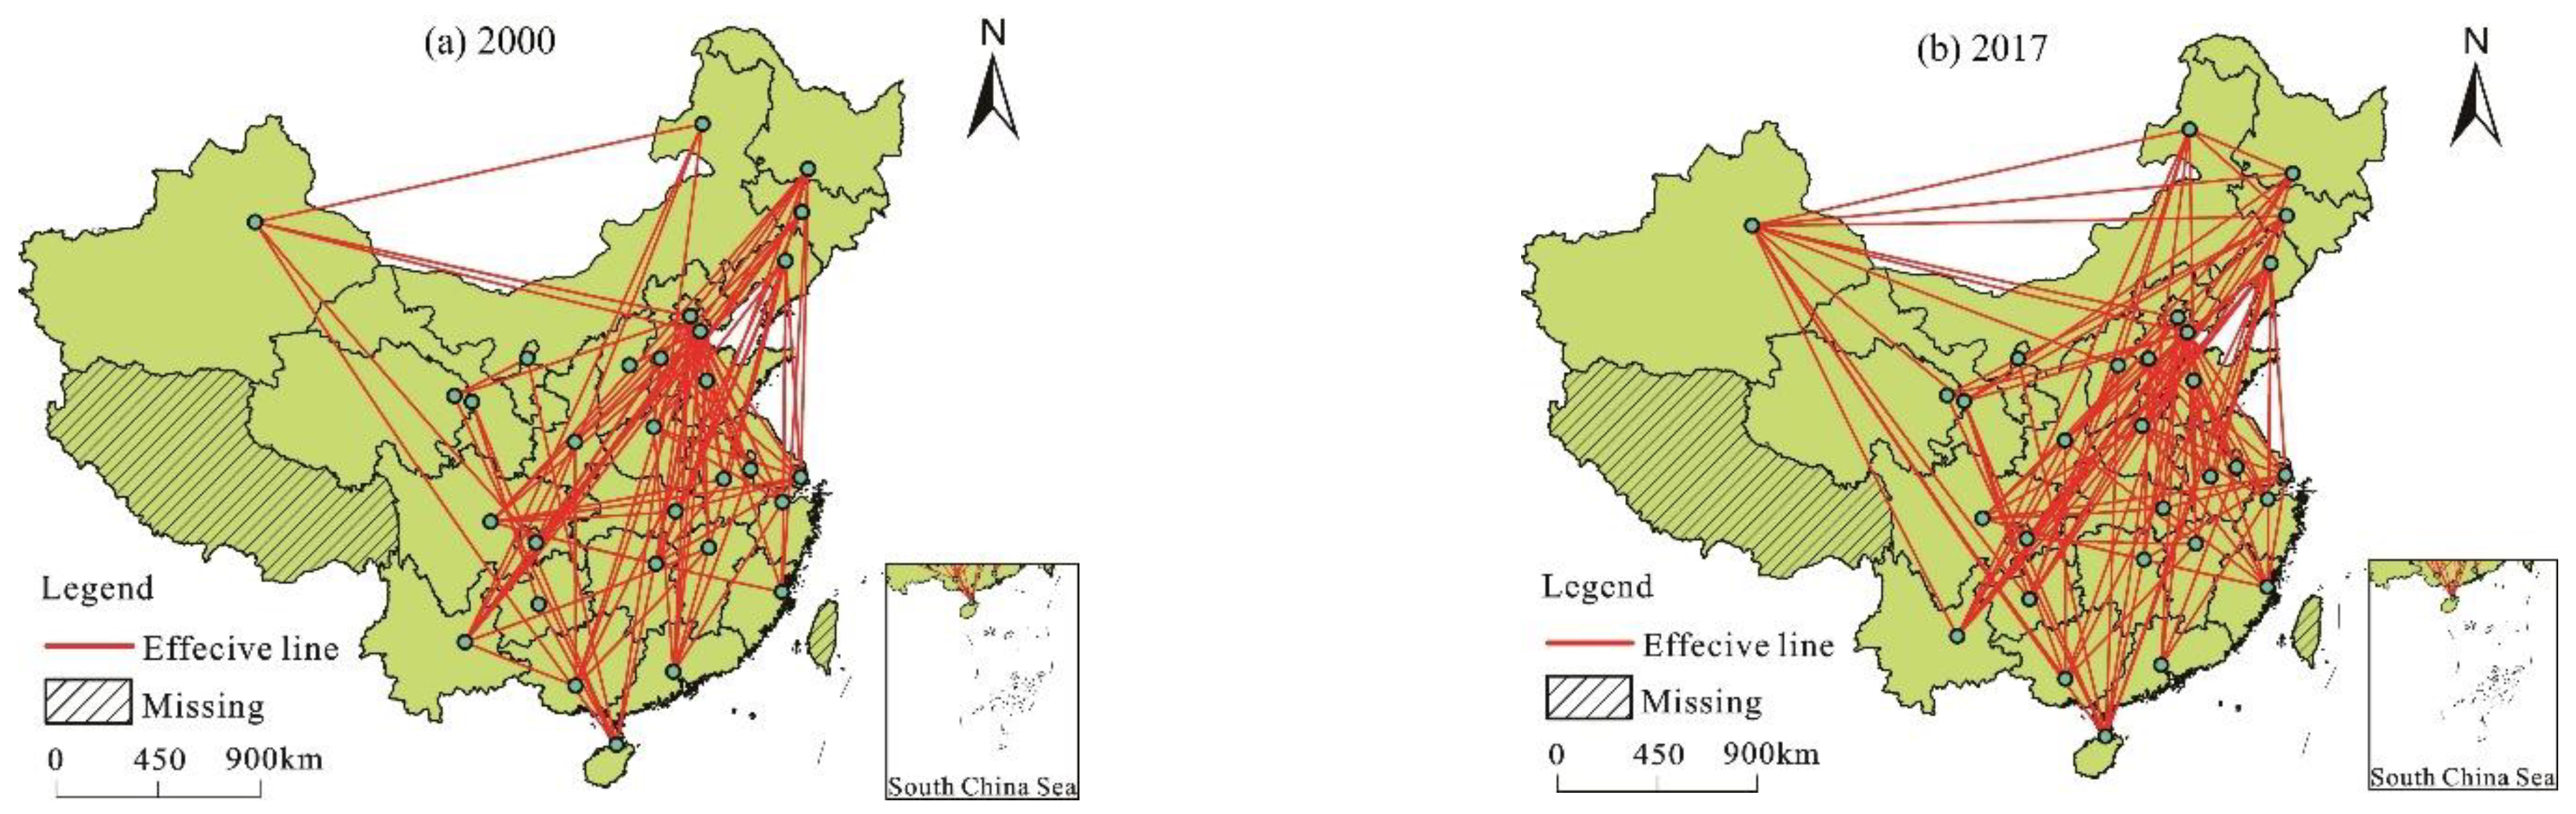
3.2. The Spatial Network Structures
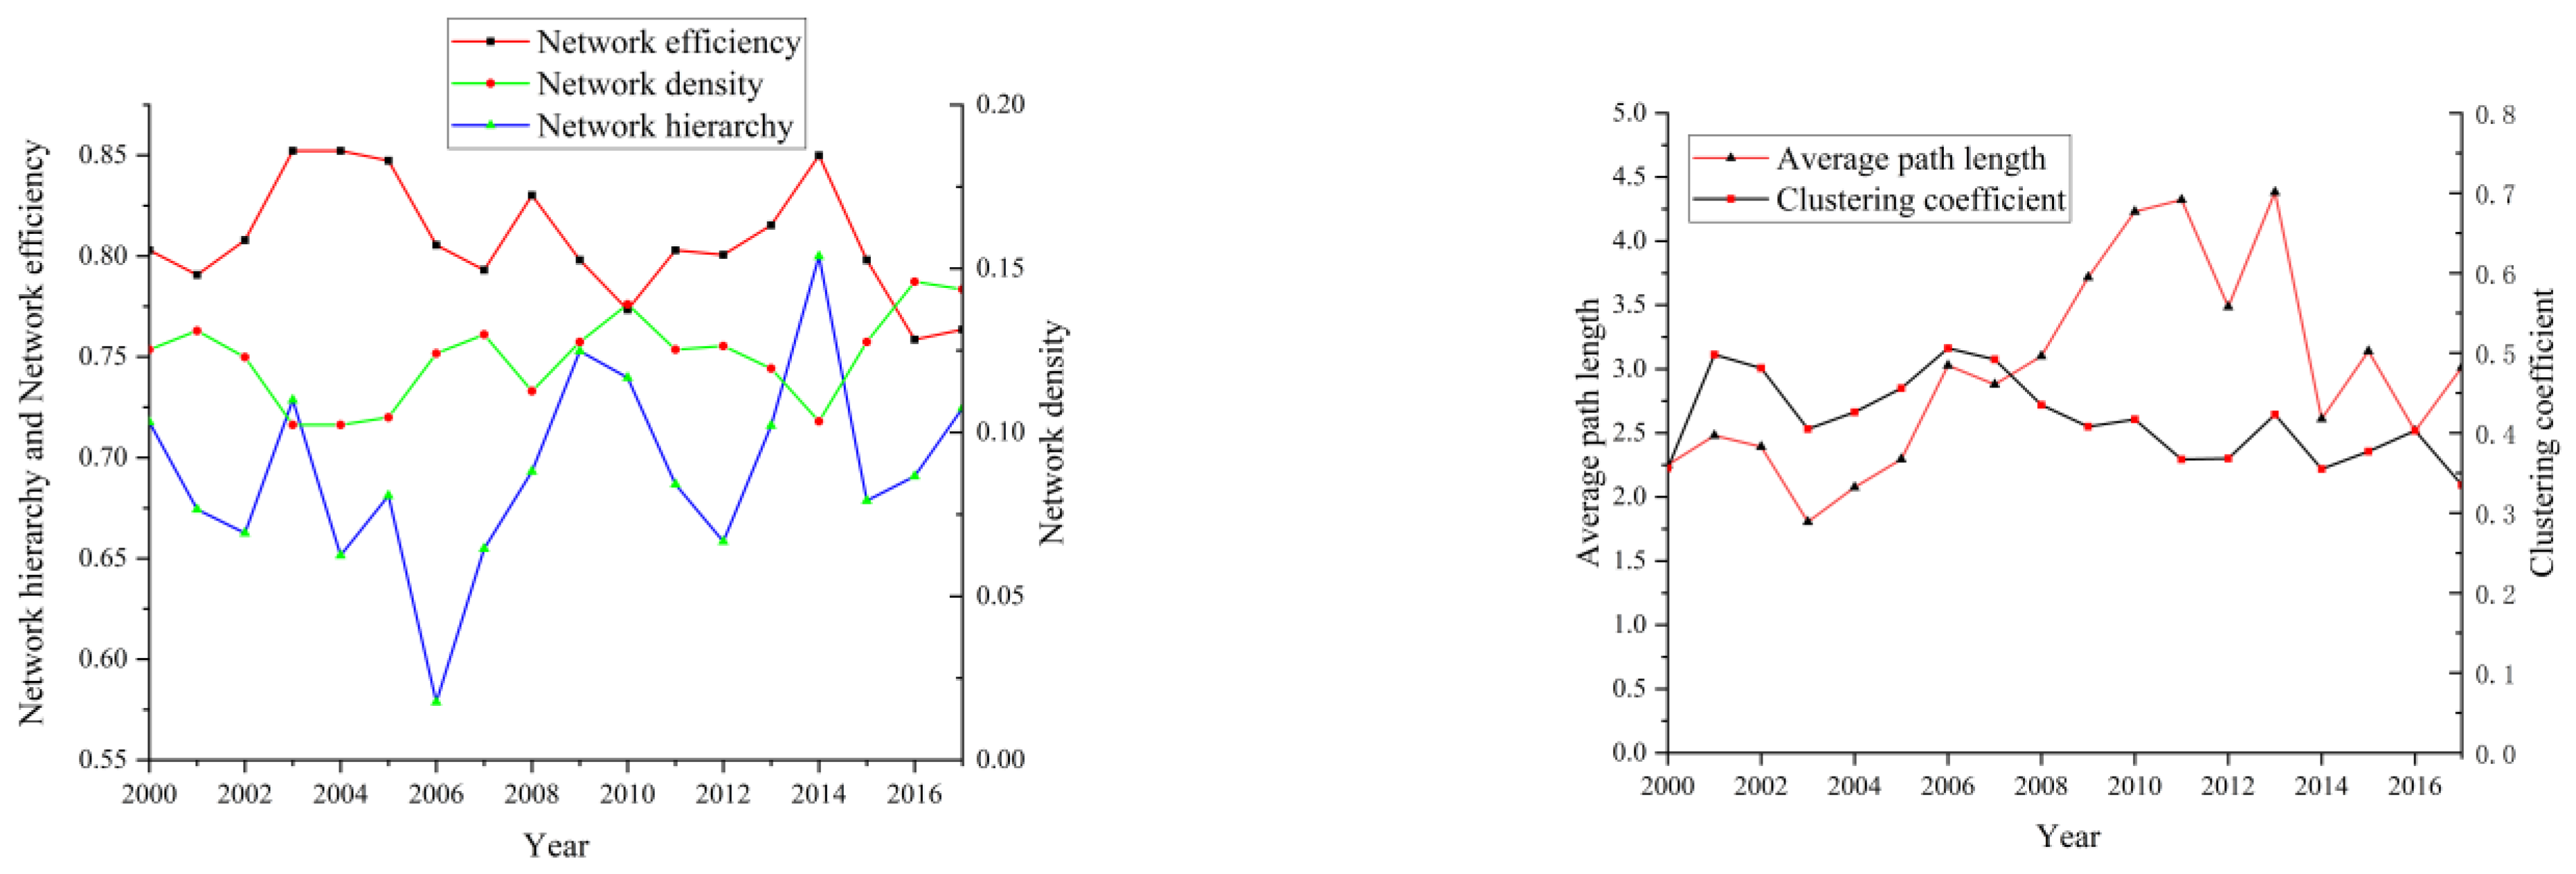
3.2.1. Overall Network Characteristics
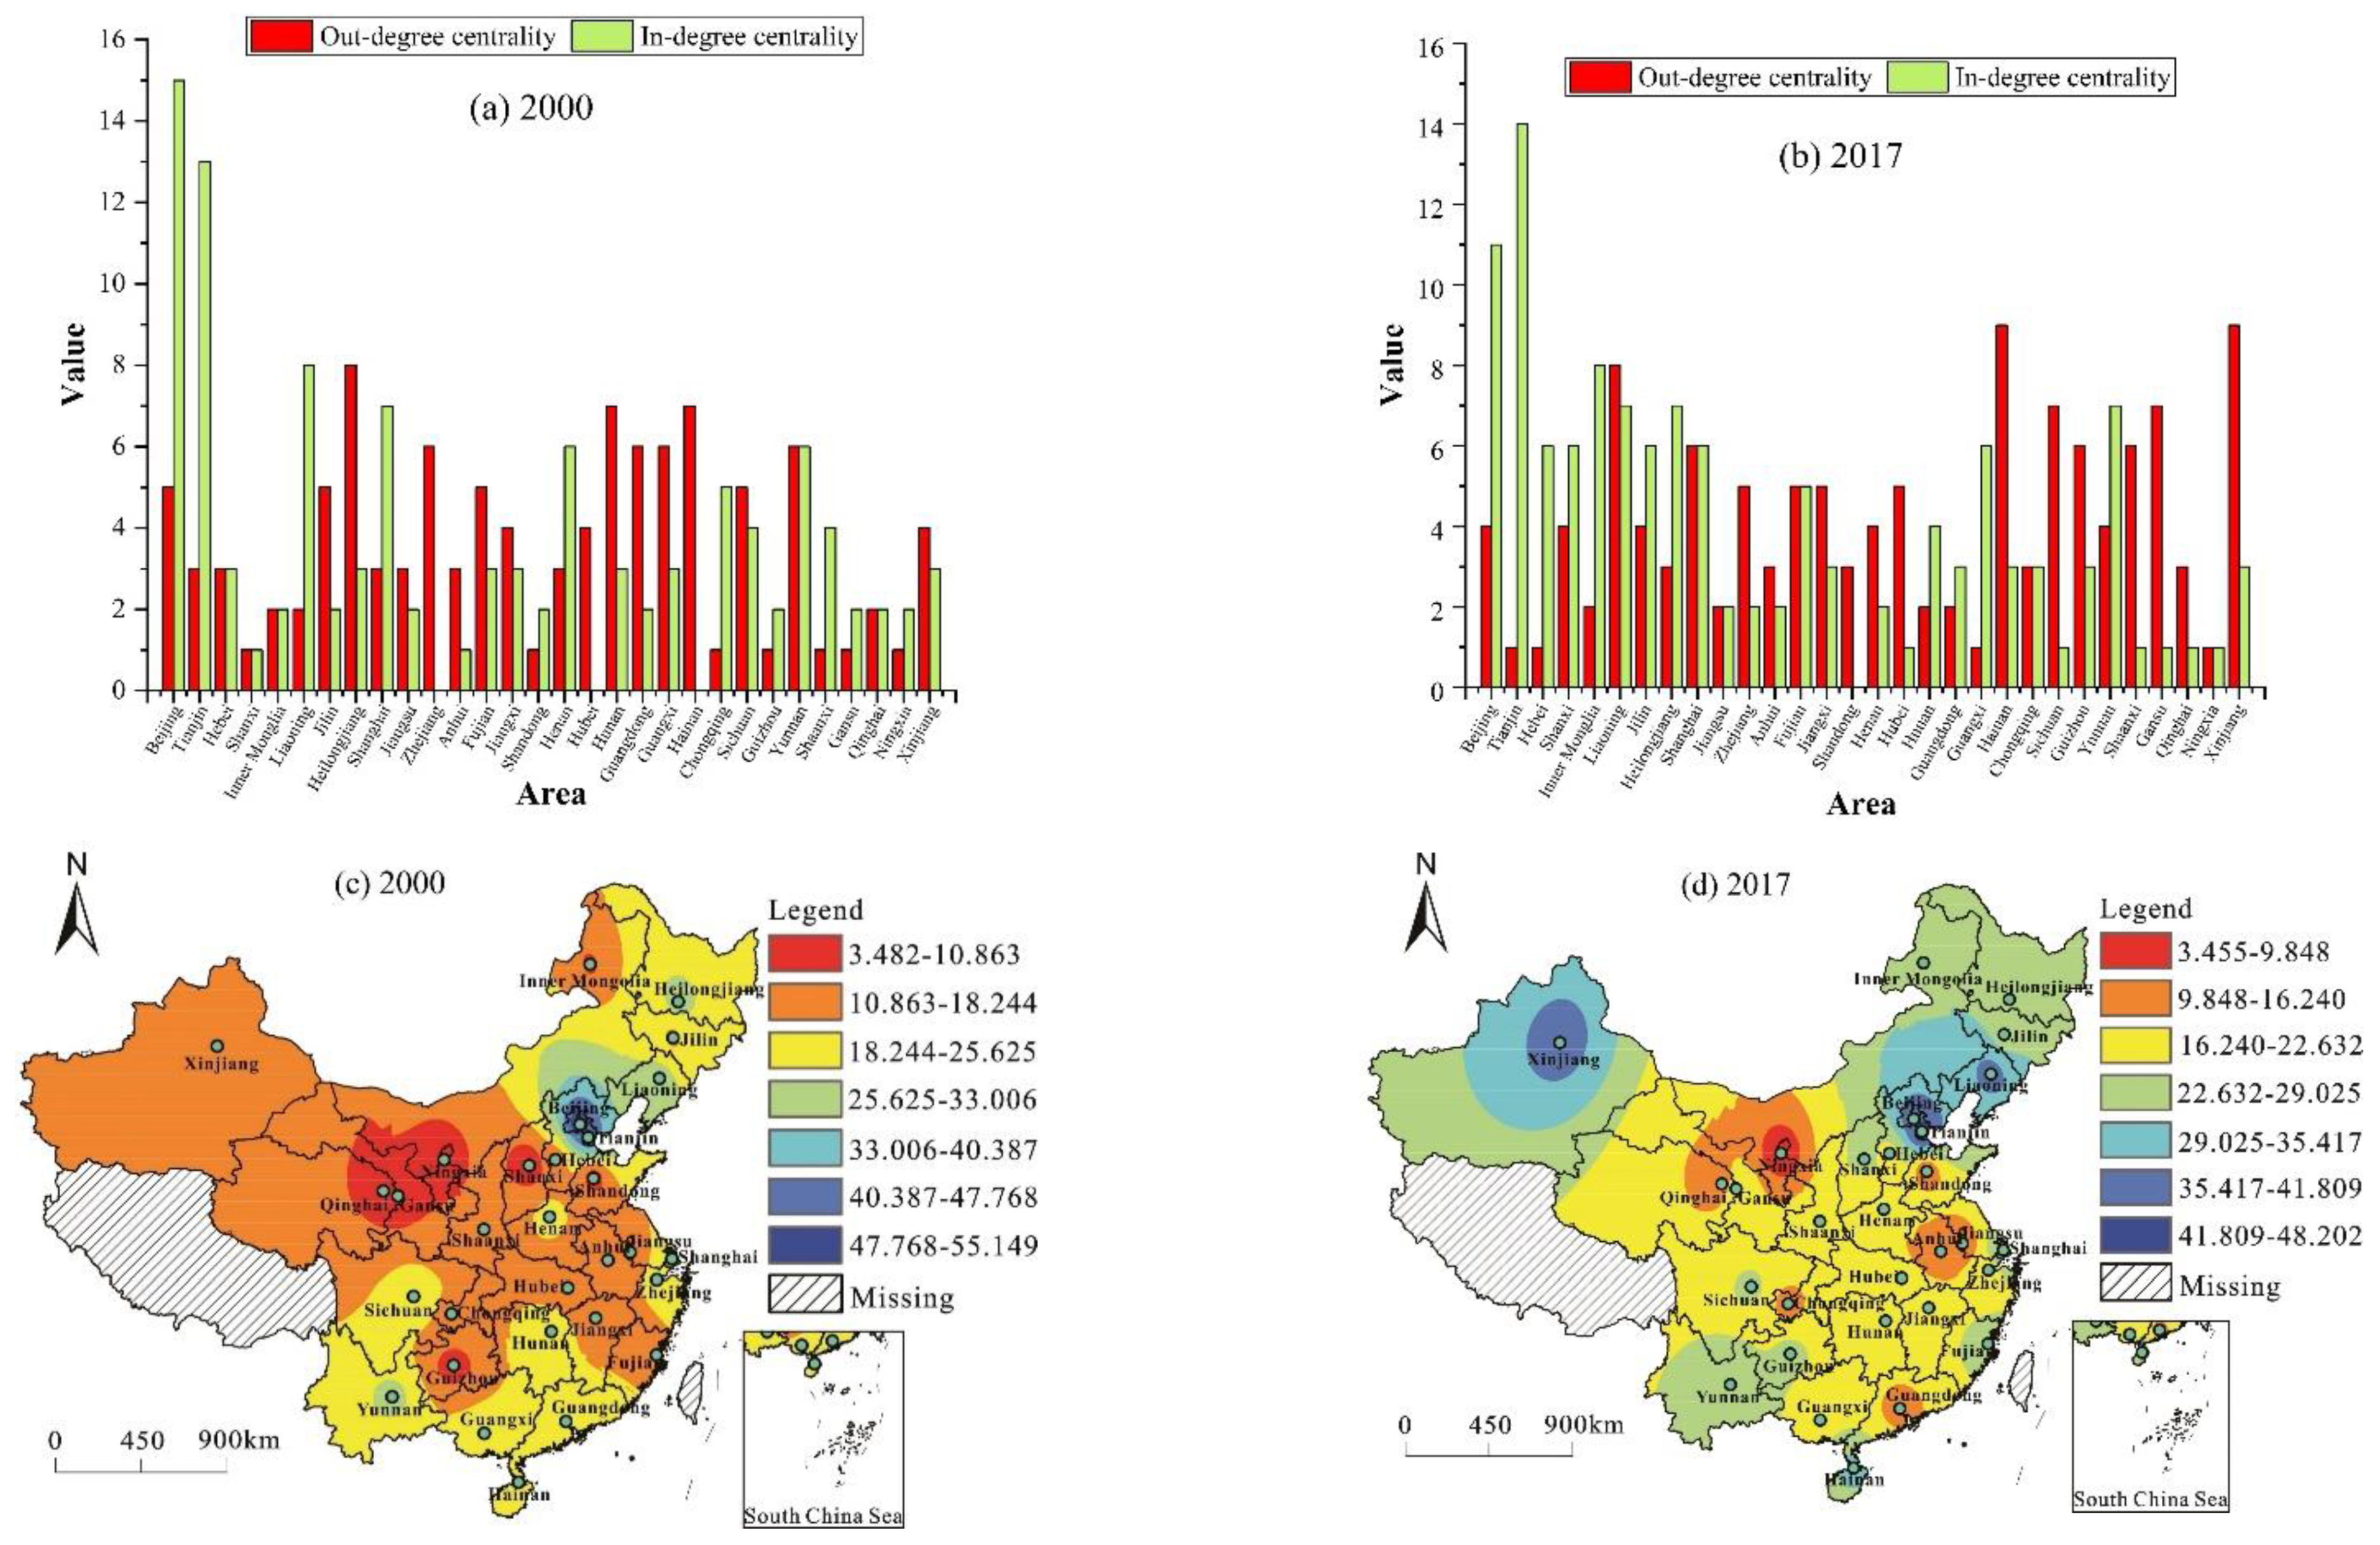
3.2.2. Individual Network Characteristics
- (1)
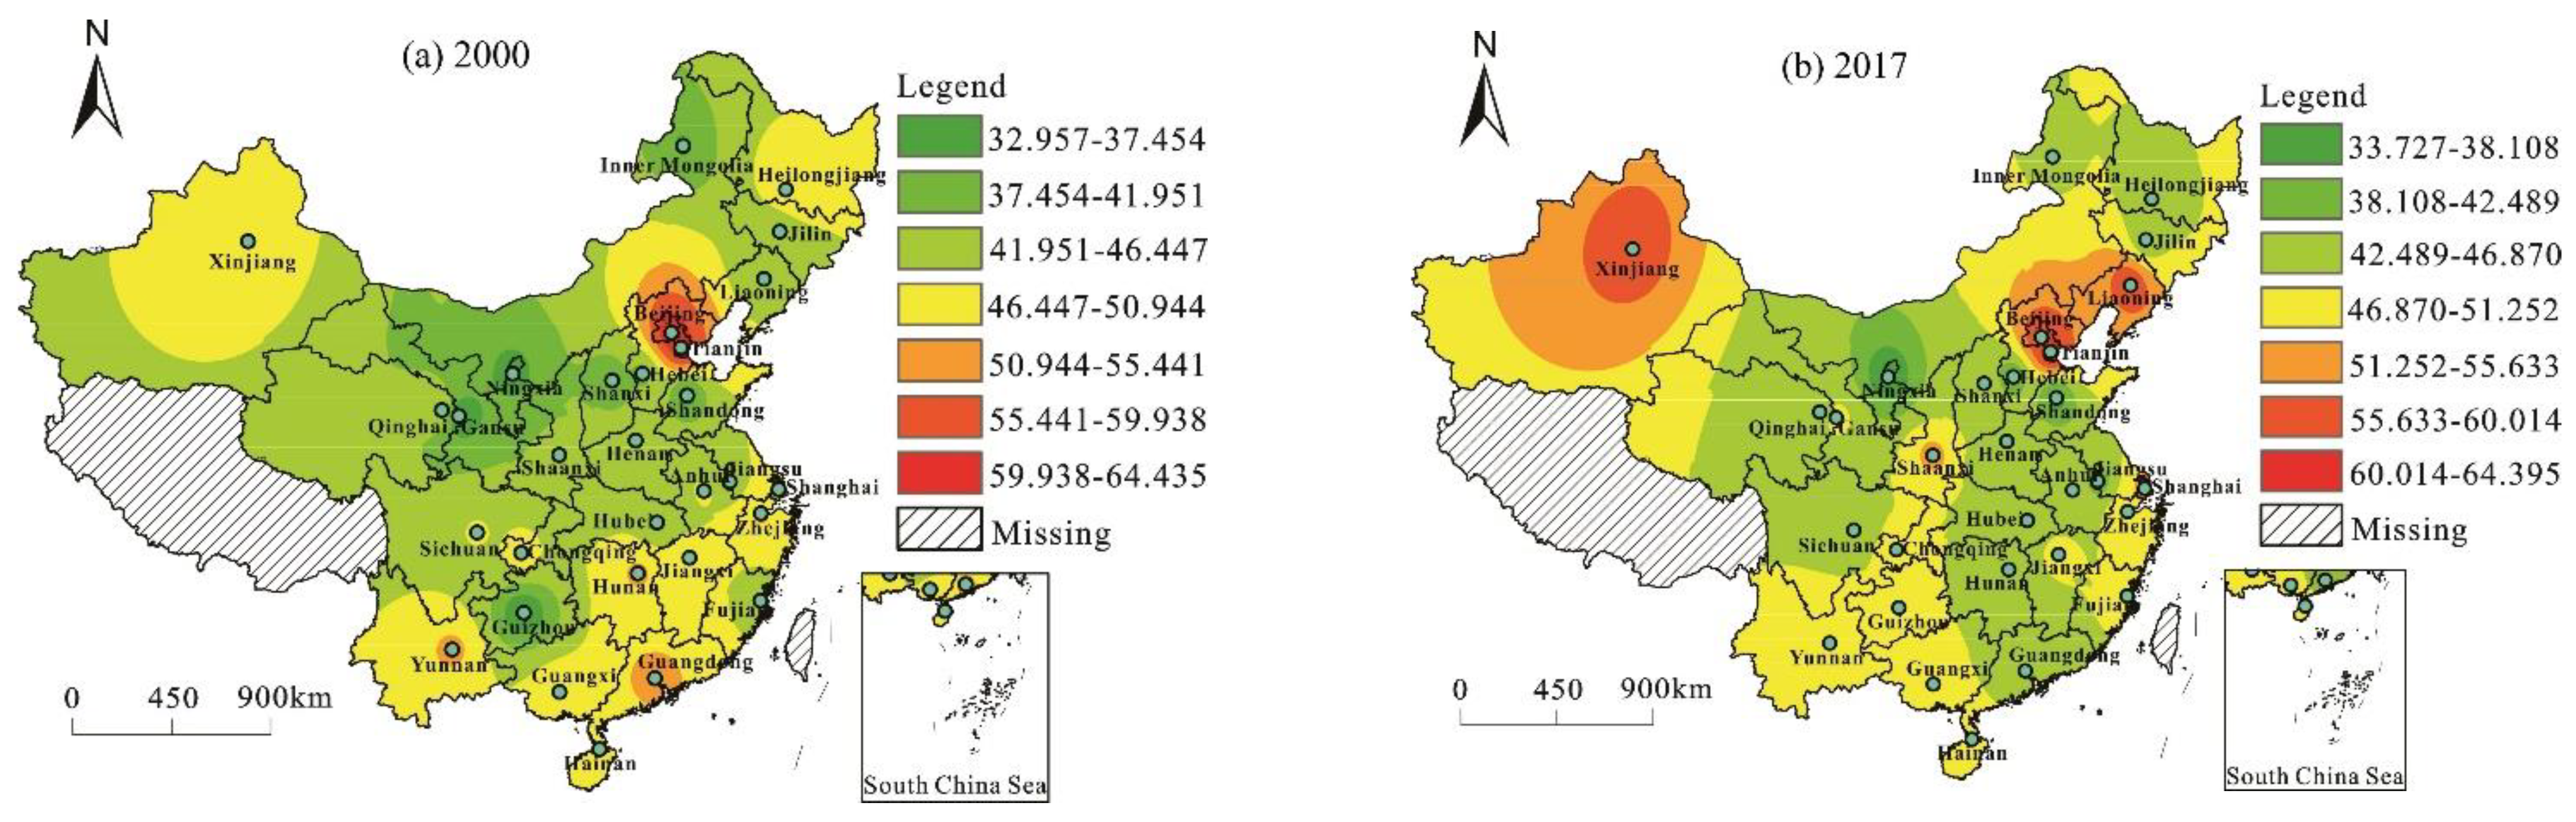
- Point Degree
- (2)
- Closeness Centrality
- (3)
- Betweenness Centrality
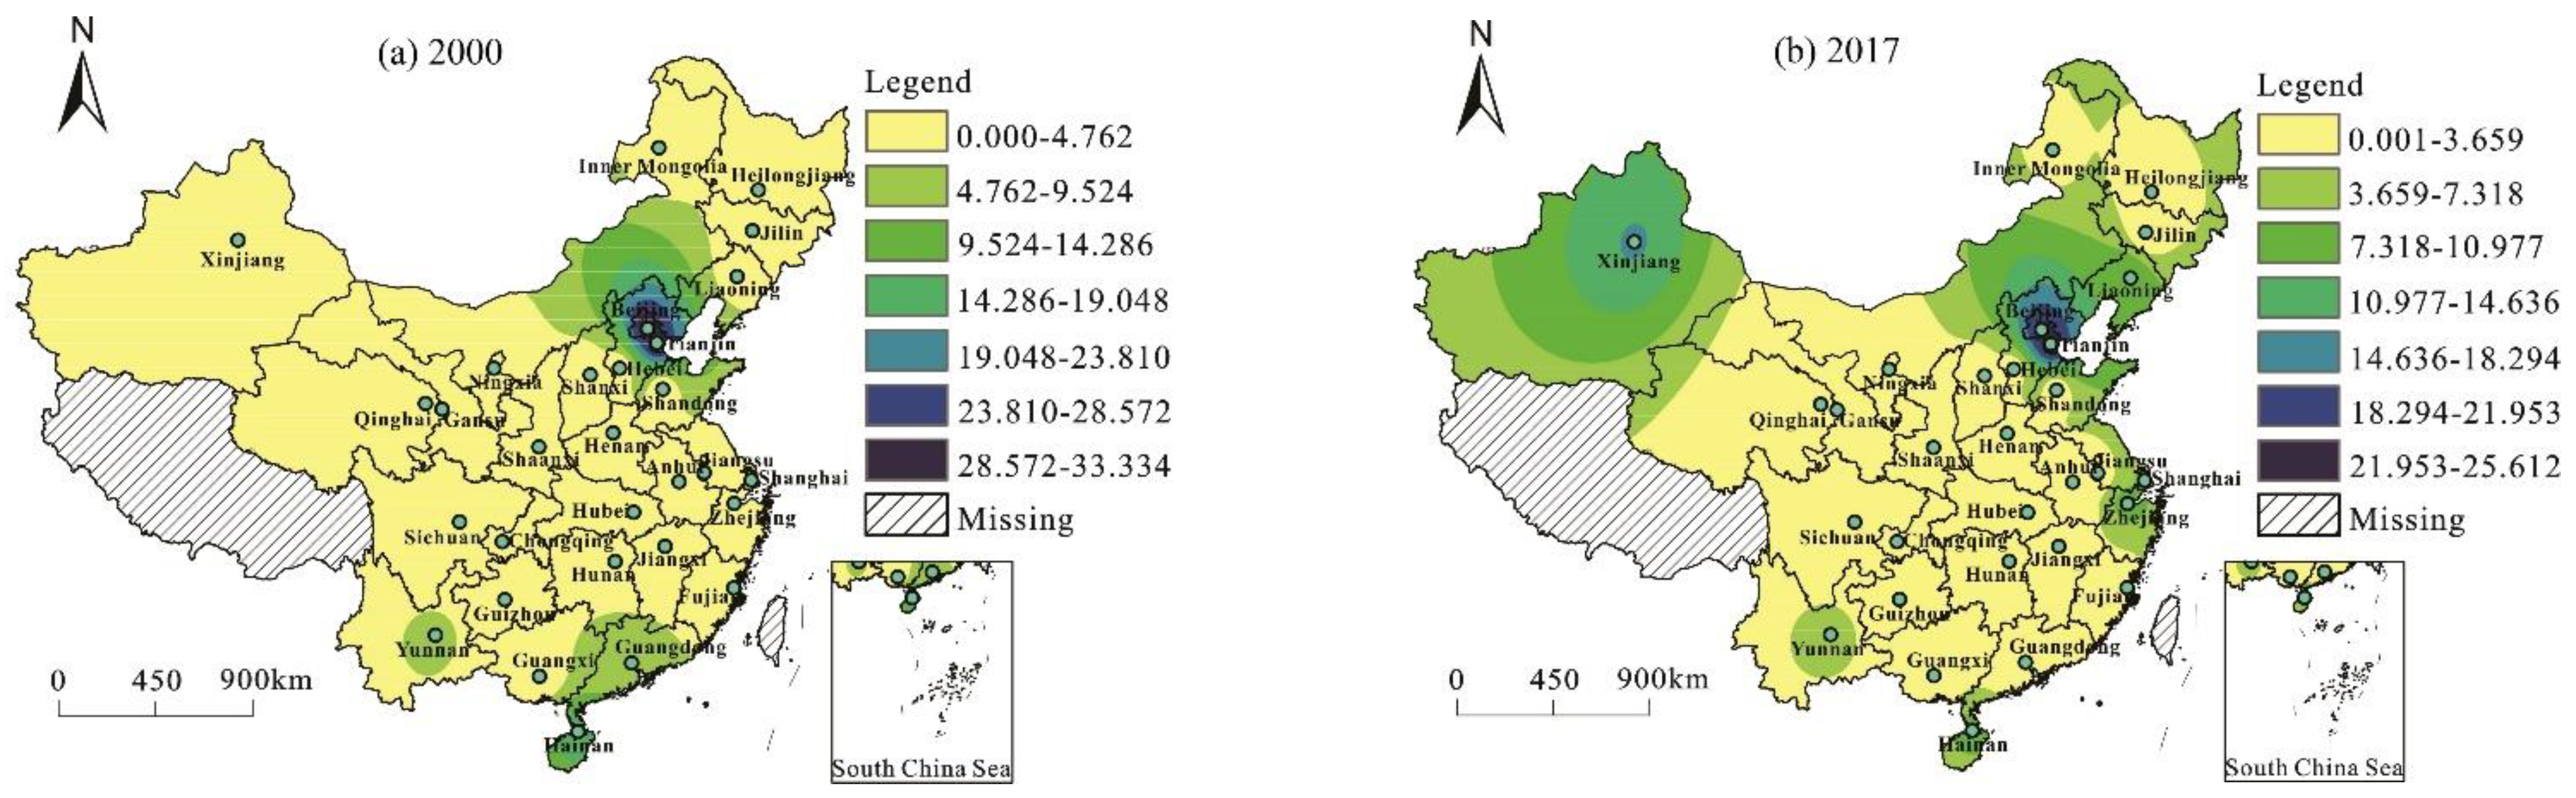
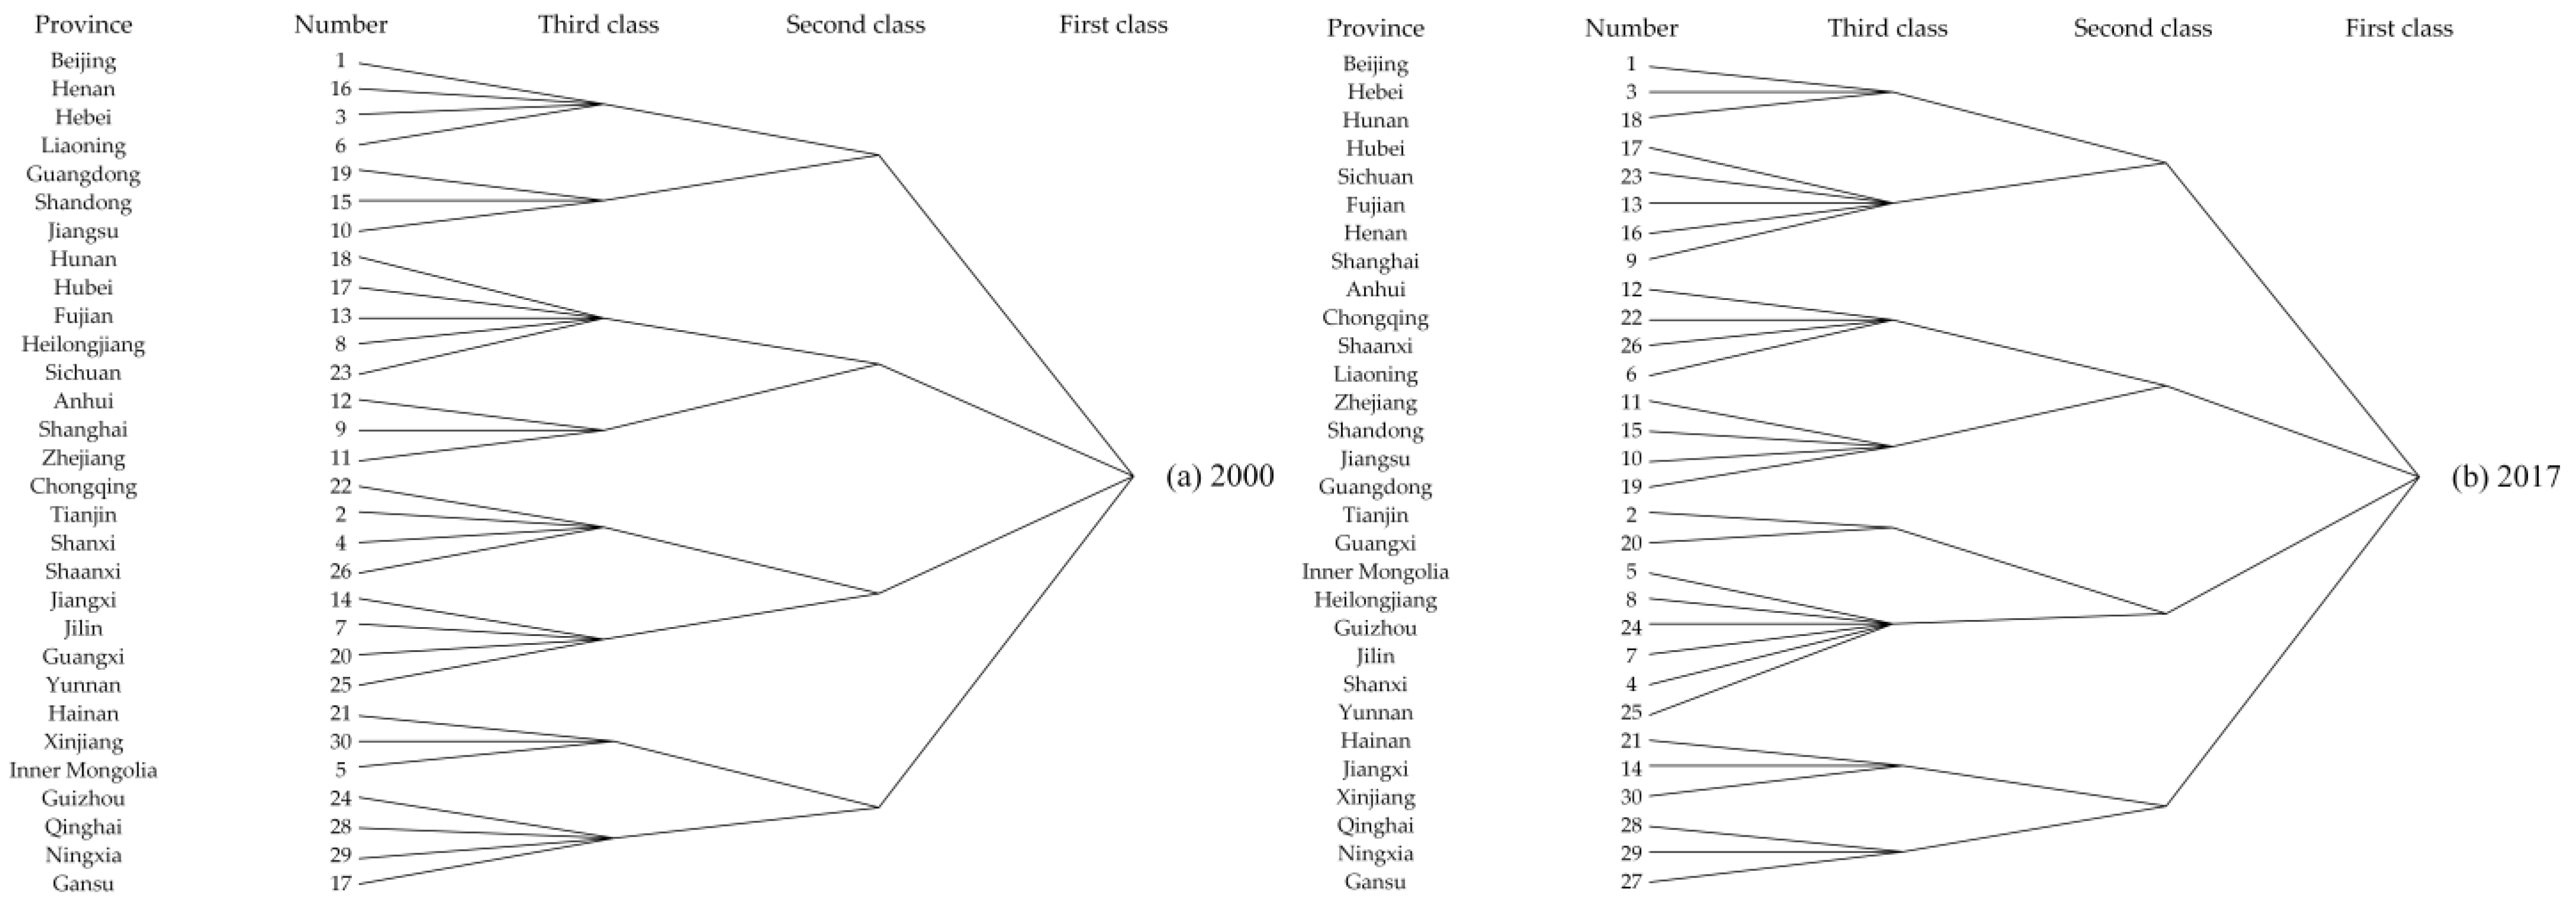
3.3. Cohesive Sub-Group
4. Discussion and Conclusions
4.1. General Discussion
4.2. Theoretical Contributions
4.3. Practical Implications
4.4. Limitations and Future Research
Author Contributions
Funding
Institutional Review Board Statement
Informed Consent Statement
Data Availability Statement
Acknowledgments
Conflicts of Interest
Appendix A
Evaluation on Carbon Dioxide Emission and Energy Consumption from the Tourism Industry
References
- Wang, Z.; Liu, Q.; Xu, J.; Fujiki, Y. Evolution characteristics of the spatial network structure of tourism efficiency in China: A province-level analysis. J. Destin. Mark. Manag. 2020, 18, 100509. [Google Scholar] [CrossRef]
- Sun, Y.; Hou, G. Analysis on the Spatial-Temporal Evolution Characteristics and Spatial Network Structure of Tourism Eco-Efficiency in the Yangtze River Delta Urban Agglomeration. Int. J. Environ. Res. Public Health 2021, 18, 2577. [Google Scholar] [CrossRef] [PubMed]
- Scott, D.; Peeters, P.; Gössling, S. Can tourism deliver its “aspirational” greenhouse gas emission reduction targets? J. Sustain. Tour. 2010, 18, 393–408. [Google Scholar] [CrossRef]
- Peng, H.; Zhang, J.; Lu, L.; Tang, G.; Yan, B.; Xiao, X.; Han, Y. Eco-efficiency and its determinants at a tourism destination: A case study of Huangshan National Park, China. Tour. Manag. 2017, 60, 201–211. [Google Scholar] [CrossRef]
- Liu, J.; Zhang, J.; Fu, Z. Tourism eco-efficiency of Chinese coastal cities—Analysis based on the DEA-Tobit model. Ocean. Coast. Manag. 2017, 148, 164–170. [Google Scholar] [CrossRef]
- Gössling, S.; Peeters, P.; Ceron, J.-P.; Dubois, G.; Patterson, T.; Richardson, R.B. The eco-efficiency of tourism. Ecol. Econ. 2005, 54, 417–434. [Google Scholar] [CrossRef]
- Sun, Y.; Hou, G.; Huang, Z.; Zhong, Y. Spatial-Temporal Differences and Influencing Factors of Tourism Eco-Efficiency in China’s Three Major Urban Agglomerations Based on the Super-EBM Model. Sustainability 2020, 12, 4156. [Google Scholar] [CrossRef]
- Gössling, S.; Broderick, J.; Upham, P.; Ceron, J.-P.; Dubois, G.; Peeters, P.; Strasdas, W. Voluntary Carbon Offsetting Schemes for Aviation: Efficiency, Credibility and Sustainable Tourism. J. Sustain. Tour. 2007, 15, 223–248. [Google Scholar] [CrossRef]
- Perch-Nielsen, S.; Sesartic, A.; Stucki, M. The greenhouse gas intensity of the tourism sector: The case of Switzerland. Environ. Sci. Policy 2010, 13, 131–140. [Google Scholar] [CrossRef]
- Yu, L.; Bai, Y.; Liu, J. The dynamics of tourism’s carbon footprint in Beijing, China. J. Sustain. Tour. 2019, 27, 1553–1571. [Google Scholar] [CrossRef]
- Lin, L. Research on the spatio-temporal evolution of tourism eco-efficiency by using the ecological footprint model. Fresenius Environ. Bull. 2021, 30, 10665–10674. [Google Scholar]
- Yang, G.; Li, P.; Zheng, B.; Zhang, Y. GHG Emission-Based Eco-Efficiency Study on Tourism Itinerary Products in Shangri-La, Yunnan Province, China. Curr. Issues Tour. 2008, 11, 604–622. [Google Scholar] [CrossRef]
- Zha, J.; Yuan, W.; Dai, J.; Tan, T.; He, L. Eco-efficiency, eco-productivity and tourism growth in China: A non-convex metafrontier DEA-based decomposition model. J. Sustain. Tour. 2020, 28, 663–685. [Google Scholar] [CrossRef]
- Zha, J.; He, L.; Liu, Y.; Shao, Y. Evaluation on development efficiency of low-carbon tourism economy: A case study of Hubei Province, China. Socio-Econ. Plan. Sci. 2019, 66, 47–57. [Google Scholar] [CrossRef]
- Wang, R.; Xia, B.; Dong, S.; Li, Y.; Li, Z.; Ba, D.; Zhang, W. Research on the Spatial Differentiation and Driving Forces of Eco-Efficiency of Regional Tourism in China. Sustainability 2020, 13, 280. [Google Scholar] [CrossRef]
- Lu, F.; Qin, W.; Wang, Y.-X.; Gupta, P. Research on Spatial Pattern Dynamic Evolution Algorithm and Optimization Model Construction and Driving Mechanism of Provincial Tourism Eco-Efficiency in China under the Background of Cloud Computing. Sci. Program. 2021, 2021, 1951264. [Google Scholar] [CrossRef]
- Qiu, X.; Fang, Y.; Yang, X.; Zhu, F. Tourism Eco-Efficiency Measurement, Characteristics, and Its Influence Factors in China. Sustainability 2017, 9, 1634. [Google Scholar] [CrossRef] [Green Version]
- Pan, F.; Hall, S.; Zhang, H. The spatial dynamics of financial activities in Beijing: Agglomeration economies and urban planning. Urban Geogr. 2020, 41, 849–864. [Google Scholar] [CrossRef]
- Li, B.; Ma, X.; Chen, K. Eco-efficiency measurement and spatial-temporal evolution of forest tourism. Arab. J. Geosci. 2021, 14, 568. [Google Scholar] [CrossRef]
- Su, L.; Ji, X. Spatial-temporal differences and evolution of eco-efficiency in China’s forest park. Urban For. Urban Green. 2021, 57, 126894. [Google Scholar] [CrossRef]
- Nurmatov, R.; Fernandez Lopez, X.L.; Coto Millan, P.P. Tourism, hospitality, and DEA: Where do we come from and where do we go? Int. J. Hosp. Manag. 2021, 95, 102883. [Google Scholar] [CrossRef]
- Tone, K. A slacks-based measure of efficiency in data envelopment analysis. Eur. J. Oper. Res. 2001, 130, 498–509. [Google Scholar] [CrossRef] [Green Version]
- Zhang, J.; Su, Y.; Wu, J.; Liang, H. GIS based land suitability assessment for tobacco production using AHP and fuzzy set in Shandong province of China. Comput. Electron. Agric. 2015, 114, 202–211. [Google Scholar] [CrossRef]
- Tone, K. Dealing with Undesirable Outputs in DEA: A Slacks-based Measure (SBM) Approach. GRIPS Res. Rep. Ser. 2003, 2003, 44–45. [Google Scholar]
- Bai, C.; Zhou, L.; Xia, M.; Feng, C. Analysis of the spatial association network structure of China’s transportation carbon emissions and its driving factors. J. Environ. Manag. 2020, 253, 109765. [Google Scholar] [CrossRef] [PubMed]
- He, Y.-Y.; Wei, Z.-X.; Liu, G.-Q.; Zhou, P. Spatial network analysis of carbon emissions from the electricity sector in China. J. Clean. Prod. 2020, 262, 121193. [Google Scholar] [CrossRef]
- Shen, W.; Liang, H.; Dong, L.; Ren, J.; Wang, G. Synergistic CO2 reduction effects in Chinese urban agglomerations: Perspectives from social network analysis. Sci. Total Environ. 2021, 798, 149352. [Google Scholar] [CrossRef]
- Gan, C.; Voda, M.; Wang, K.; Chen, L.; Ye, J. Spatial network structure of the tourism economy in urban agglomeration: A social network analysis. J. Hosp. Tour. Manag. 2021, 47, 124–133. [Google Scholar] [CrossRef]
- Pierce, P.P.; Kabo, F.; Killian, J.; Stucky, C.; Huffman, S.; Migliore, L.; Braun, L. Social network analysis: Exploring connections to advance military nursing science. Nurs. Outlook 2021, 69, 311–321. [Google Scholar] [CrossRef]
- Yao, Q.; Li, R.Y.M.; Song, L.; Crabbe, M.J.C. Construction safety knowledge sharing on Twitter: A social network analysis. Saf. Sci. 2021, 143, 105411. [Google Scholar] [CrossRef]
- Dai, L.; Derudder, B.; Liu, X. The evolving structure of the Southeast Asian air transport network through the lens of complex networks, 1979-2012. J. Transp. Geogr. 2018, 68, 67–77. [Google Scholar] [CrossRef] [PubMed]
- Zhang, P.; Zhao, Y.; Zhu, X.; Cai, Z.; Xu, J.; Shi, S. Spatial structure of urban agglomeration under the impact of high-speed railway construction: Based on the social network analysis. Sustain. Cities Soc. 2020, 62, 102404. [Google Scholar] [CrossRef]
- Song, M.; Li, H. Estimating the efficiency of a sustainable Chinese tourism industry using bootstrap technology rectification. Technol. Forecast. Soc. Chang. 2019, 143, 45–54. [Google Scholar] [CrossRef]
- Chaabouni, S. China’s regional tourism efficiency: A two-stage double bootstrap data envelopment analysis. J. Destin. Mark. Manag. 2019, 11, 183–191. [Google Scholar] [CrossRef]
- Castilho, D.; Fuinhas, J.A.; Marques, A.C. The impacts of the tourism sector on the eco-efficiency of the Latin American and Caribbean countries. Socio-Econ. Plan. Sci. 2021, 78, 101089. [Google Scholar] [CrossRef]
- Wu, P.; Shi, P.H. An estimation of energy consumption and CO2 emissions in tourism sector of China. J. Geogr. Sci. 2011, 21, 733–745. [Google Scholar] [CrossRef]
- Wu, P.; Han, Y.; Tian, M. The measurement and comparative study of carbon dioxide emissions from tourism in typical provinces in China. Acta Ecol. Sin. 2015, 35, 184–190. [Google Scholar] [CrossRef]
- He, L.; Zha, J.; Loo, H.A. How to improve tourism energy efficiency to achieve sustainable tourism: Evidence from China. Curr. Issues Tour. 2019, 23, 1–16. [Google Scholar] [CrossRef]

| Index | Formula | Number | Explanation of Formula |
|---|---|---|---|
| Network density | (3) | Where D is the network density, L is the actual relationship number, and N is the number of research areas. | |
| Network hierarchy | (4) | Where H is the network hierarchy, K is the symmetric reachable points, and max(K) is the maximum possible point logarithm. | |
| Network efficiency | (5) | Where E is the network efficiency, M is the number of redundant lines, and max(M) is the maximum number of possible redundant lines. | |
| Clustering coefficient | (6) | Where Ci is the clustering coefficient, ei represents the number of edges between k neighbors of province I, ki is the number of edges of node i. | |
| Average path length | (7) | Where N is the total of network nodes, dij is distance between province i and province j. | |
| Degree centrality | (8) | Where De is the point centrality, n is the number of nodes connected with the province, and N is the maximum number of nodes connected with the province. | |
| Betweenness centrality | (9) | Where Cbi is betweenness centrality; bij is the number of the shortcuts between city i and city j; and bij(l) represents the number of shortcuts between province i and province j. | |
| Closeness centrality | (10) | Where is closeness centrality; and dij is the shortest distance between province i and province j. |
| Province | 2000 | 2003 | 2006 | 2009 | 2012 | 2015 | 2017 | Mean |
|---|---|---|---|---|---|---|---|---|
| Beijing | 0.440 | 0.523 | 0.577 | 0.504 | 0.419 | 0.397 | 0.421 | 0.469 |
| Tianjin | 1.670 | 1.749 | 1.763 | 1.517 | 1.460 | 1.461 | 1.548 | 1.595 |
| Hebei | 0.380 | 0.297 | 0.296 | 0.328 | 0.380 | 0.423 | 0.502 | 0.362 |
| Shanxi | 0.221 | 0.184 | 0.175 | 0.242 | 0.326 | 0.400 | 0.551 | 0.277 |
| Inner Monglia | 0.295 | 0.287 | 0.296 | 0.344 | 0.434 | 0.591 | 0.621 | 0.399 |
| Liaoning | 0.628 | 0.732 | 1.016 | 0.583 | 1.031 | 0.631 | 0.608 | 0.783 |
| Jilin | 0.140 | 0.156 | 0.200 | 0.233 | 0.299 | 0.415 | 0.415 | 0.256 |
| Heilongjiang | 0.291 | 0.244 | 0.257 | 0.278 | 0.304 | 0.286 | 0.298 | 0.282 |
| Shanghai | 1.164 | 1.139 | 1.139 | 1.189 | 1.131 | 1.214 | 1.156 | 1.174 |
| Jiangsu | 1.052 | 1.069 | 1.095 | 1.112 | 1.119 | 1.137 | 1.139 | 1.105 |
| Zhejiang | 0.486 | 0.493 | 0.609 | 0.564 | 0.662 | 1.031 | 1.160 | 0.707 |
| Anhui | 0.215 | 0.204 | 0.198 | 0.224 | 0.217 | 0.245 | 0.320 | 0.229 |
| Fujian | 0.262 | 0.243 | 0.277 | 0.315 | 0.283 | 0.298 | 0.315 | 0.284 |
| Jiangxi | 0.304 | 0.262 | 0.253 | 0.293 | 0.338 | 0.326 | 0.433 | 0.308 |
| Shandong | 0.390 | 0.356 | 0.384 | 0.343 | 0.369 | 0.449 | 0.579 | 0.407 |
| Henan | 1.394 | 1.355 | 1.322 | 1.267 | 1.218 | 1.217 | 1.219 | 1.283 |
| Hubei | 0.269 | 0.198 | 0.222 | 0.260 | 0.286 | 0.293 | 0.370 | 0.267 |
| Hunan | 0.289 | 0.209 | 0.173 | 0.188 | 0.204 | 0.192 | 0.245 | 0.209 |
| Guangdong | 1.122 | 1.151 | 1.149 | 1.113 | 1.132 | 1.129 | 1.132 | 1.134 |
| Guangxi | 0.130 | 0.121 | 0.138 | 0.171 | 0.219 | 0.292 | 0.369 | 0.205 |
| Hainan | 0.153 | 0.143 | 0.144 | 0.134 | 0.170 | 0.176 | 0.189 | 0.158 |
| Chongqing | 0.368 | 0.282 | 0.294 | 0.283 | 0.268 | 0.276 | 0.316 | 0.298 |
| Sichuan | 0.198 | 0.142 | 0.143 | 0.160 | 0.177 | 0.167 | 0.170 | 0.166 |
| Guizhou | 0.271 | 0.268 | 0.255 | 0.336 | 0.366 | 0.383 | 0.406 | 0.328 |
| Yunnan | 0.249 | 0.179 | 0.162 | 0.215 | 0.255 | 0.253 | 0.327 | 0.227 |
| Shaanxi | 0.286 | 0.244 | 0.229 | 0.258 | 0.272 | 0.258 | 0.336 | 0.264 |
| Gansu | 0.194 | 0.151 | 0.153 | 0.141 | 0.157 | 0.177 | 0.221 | 0.166 |
| Qinghai | 0.139 | 0.102 | 0.097 | 0.101 | 0.092 | 0.083 | 0.079 | 0.100 |
| Ningxia | 0.079 | 0.071 | 0.066 | 0.058 | 0.054 | 0.055 | 0.053 | 0.062 |
| Xinjiang | 0.161 | 0.146 | 0.140 | 0.150 | 0.170 | 0.200 | 0.245 | 0.171 |
| Mean | 0.441 | 0.423 | 0.441 | 0.430 | 0.460 | 0.482 | 0.525 | 0.456 |
Publisher’s Note: MDPI stays neutral with regard to jurisdictional claims in published maps and institutional affiliations. |
© 2022 by the authors. Licensee MDPI, Basel, Switzerland. This article is an open access article distributed under the terms and conditions of the Creative Commons Attribution (CC BY) license (https://creativecommons.org/licenses/by/4.0/).
Share and Cite
Liu, Q.; Song, J.; Dai, T.; Xu, J.; Li, J.; Wang, E. Spatial Network Structure of China’s Provincial-Scale Tourism Eco-Efficiency: A Social Network Analysis. Energies 2022, 15, 1324. https://doi.org/10.3390/en15041324
Liu Q, Song J, Dai T, Xu J, Li J, Wang E. Spatial Network Structure of China’s Provincial-Scale Tourism Eco-Efficiency: A Social Network Analysis. Energies. 2022; 15(4):1324. https://doi.org/10.3390/en15041324
Chicago/Turabian StyleLiu, Qingfang, Jinping Song, Teqi Dai, Jianhui Xu, Jianmei Li, and Enru Wang. 2022. "Spatial Network Structure of China’s Provincial-Scale Tourism Eco-Efficiency: A Social Network Analysis" Energies 15, no. 4: 1324. https://doi.org/10.3390/en15041324