
Optimization and Techno-Economic Appraisal of Parabolic Trough Solar Power Plant under Different Scenarios: A Case Study of Morocco
 ,
,  , , and
Abstract
:1. Introduction
2. Methodology
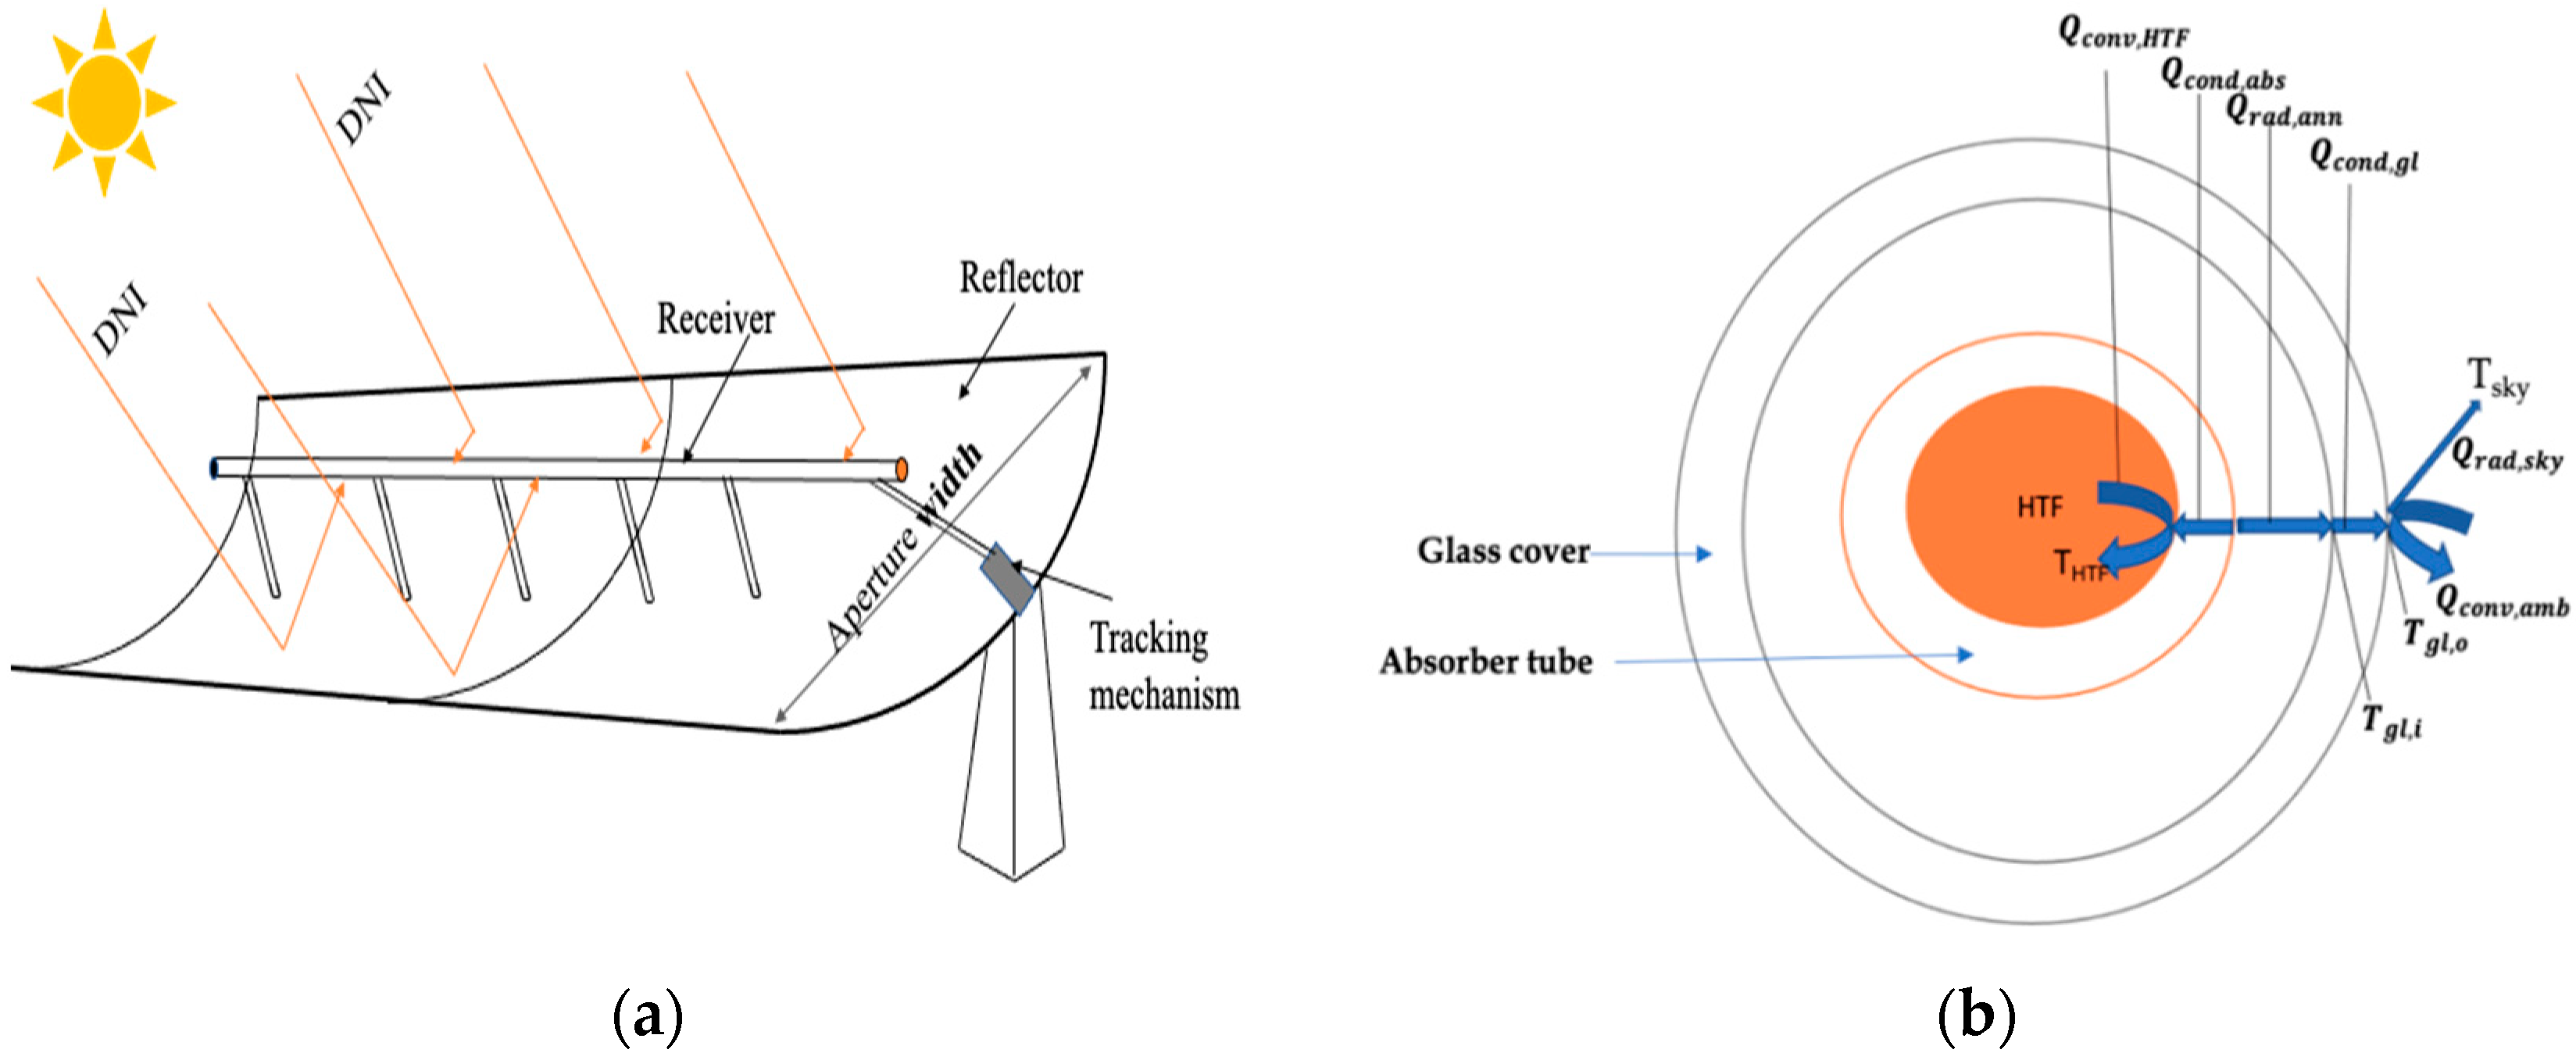
2.1. System Description and Modeling of PTC Plant
- Scenario 1: PTC facility with various solar collector assemblies (SCAs);
- Scenario 2: PTC facility with various receivers (HCEs);
- Scenario 3: PTC facility with various heat transfer fluids (HTFs);
- Scenario 4: PTC facility with various types of cooling options (Wet and Dry);
- Scenario 5: PTC facility with various solar multiple values (SM);
- Scenario 6: PTC facility with various thermal storage times (TES);
- Scenario 7: PTC best configuration and sensitivity analysis.
2.2. Mathematical Description
- DNI: direct normal irradiation (W/m2);
- : total solar field aperture area;
- : incidence angle.
- HTF convection heat transfer coefficient;
- absorber pipe’s inside diameter;
- : temperature of the absorber pipe’s inside surface;
- : the HTF’s average temperature.
- kabs: the absorber’s thermal conductivity at the average absorber temperature;
- : temperature of the absorber’s inner surface;
- : temperature of the exterior surface of the absorber;
- : absorber inside diameter;
- : absorber outside diameter.
- Tabs,o: temperature of the outer absorber surface in Kelvin;
- Tgl,i: surface temperature of the inside glass envelope in Kelvin;
- εabs: emissivity of absorber selective coating;
- εgl: glass surface emissivity;
- : outer absorber diameter;
- : inner glass envelope diameter;
- σ: Stefan–Boltzmann constant.
- kgl: glass thermal conductivity.
- glass envelope outer diameter;
- Tgl,o,Kelvin: glass envelope outer surface temperature;
- Tsky,Kelvin: sky temperature.
2.2.1. Storage System
- MHT: mass inside the hot tank;
- MCT: mass inside the cold tank;
- : outlet mass flow rate from the hot tank;
- : outlet mass flow rate from the cold tank;
- t0: The two tanks’ lowest limit;
- t: The two tanks’ highest saturation limit.
- : temperature of the salt in the hot tank;
- : temperature of the salt in the cold tank.
2.2.2. Solar Multiple (SM)
- : thermal power generated in the solar field;
- : thermal power demanded by the power block.
2.2.3. Capacity Factor CF
2.3. Economic Parameters and System Costs
2.3.1. Levelized Cost of Energy
2.3.2. Net Present Value
3. Site Location and Solar Resources
4. Results and Discussion
- Scenario 1: PTC facility with various solar collector assemblies (SCAs)
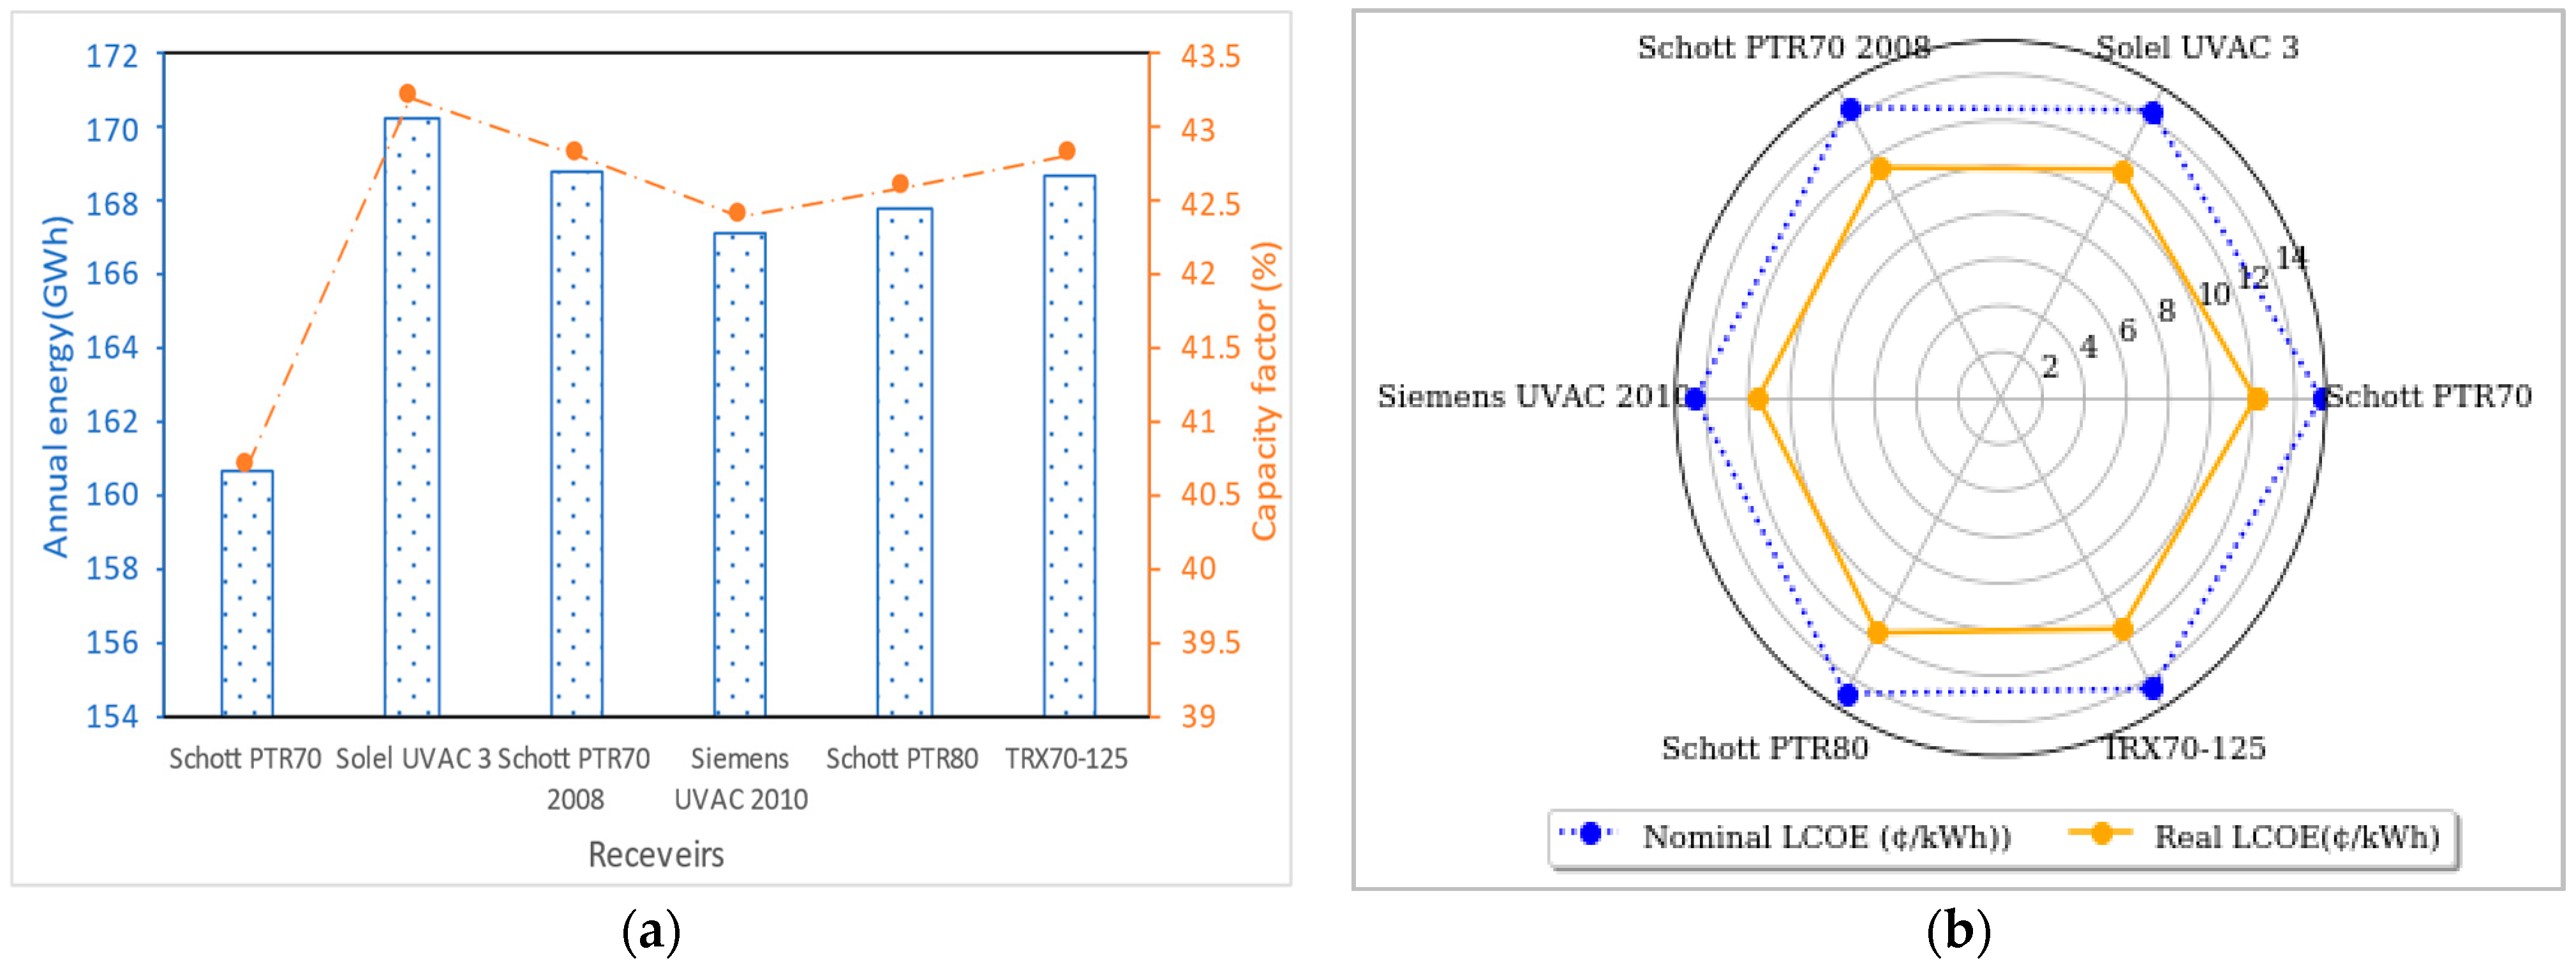
- Scenarios 2: PTC facility with various receivers (HCEs)
- Scenarios 3: PTC facility with various heat transfer fluid (HTFs)
- Scenario 4: PTC facility with various types of cooling options (Wet and Dry)
- Scenarios 5: PTC facility with various solar multiple (SM) values
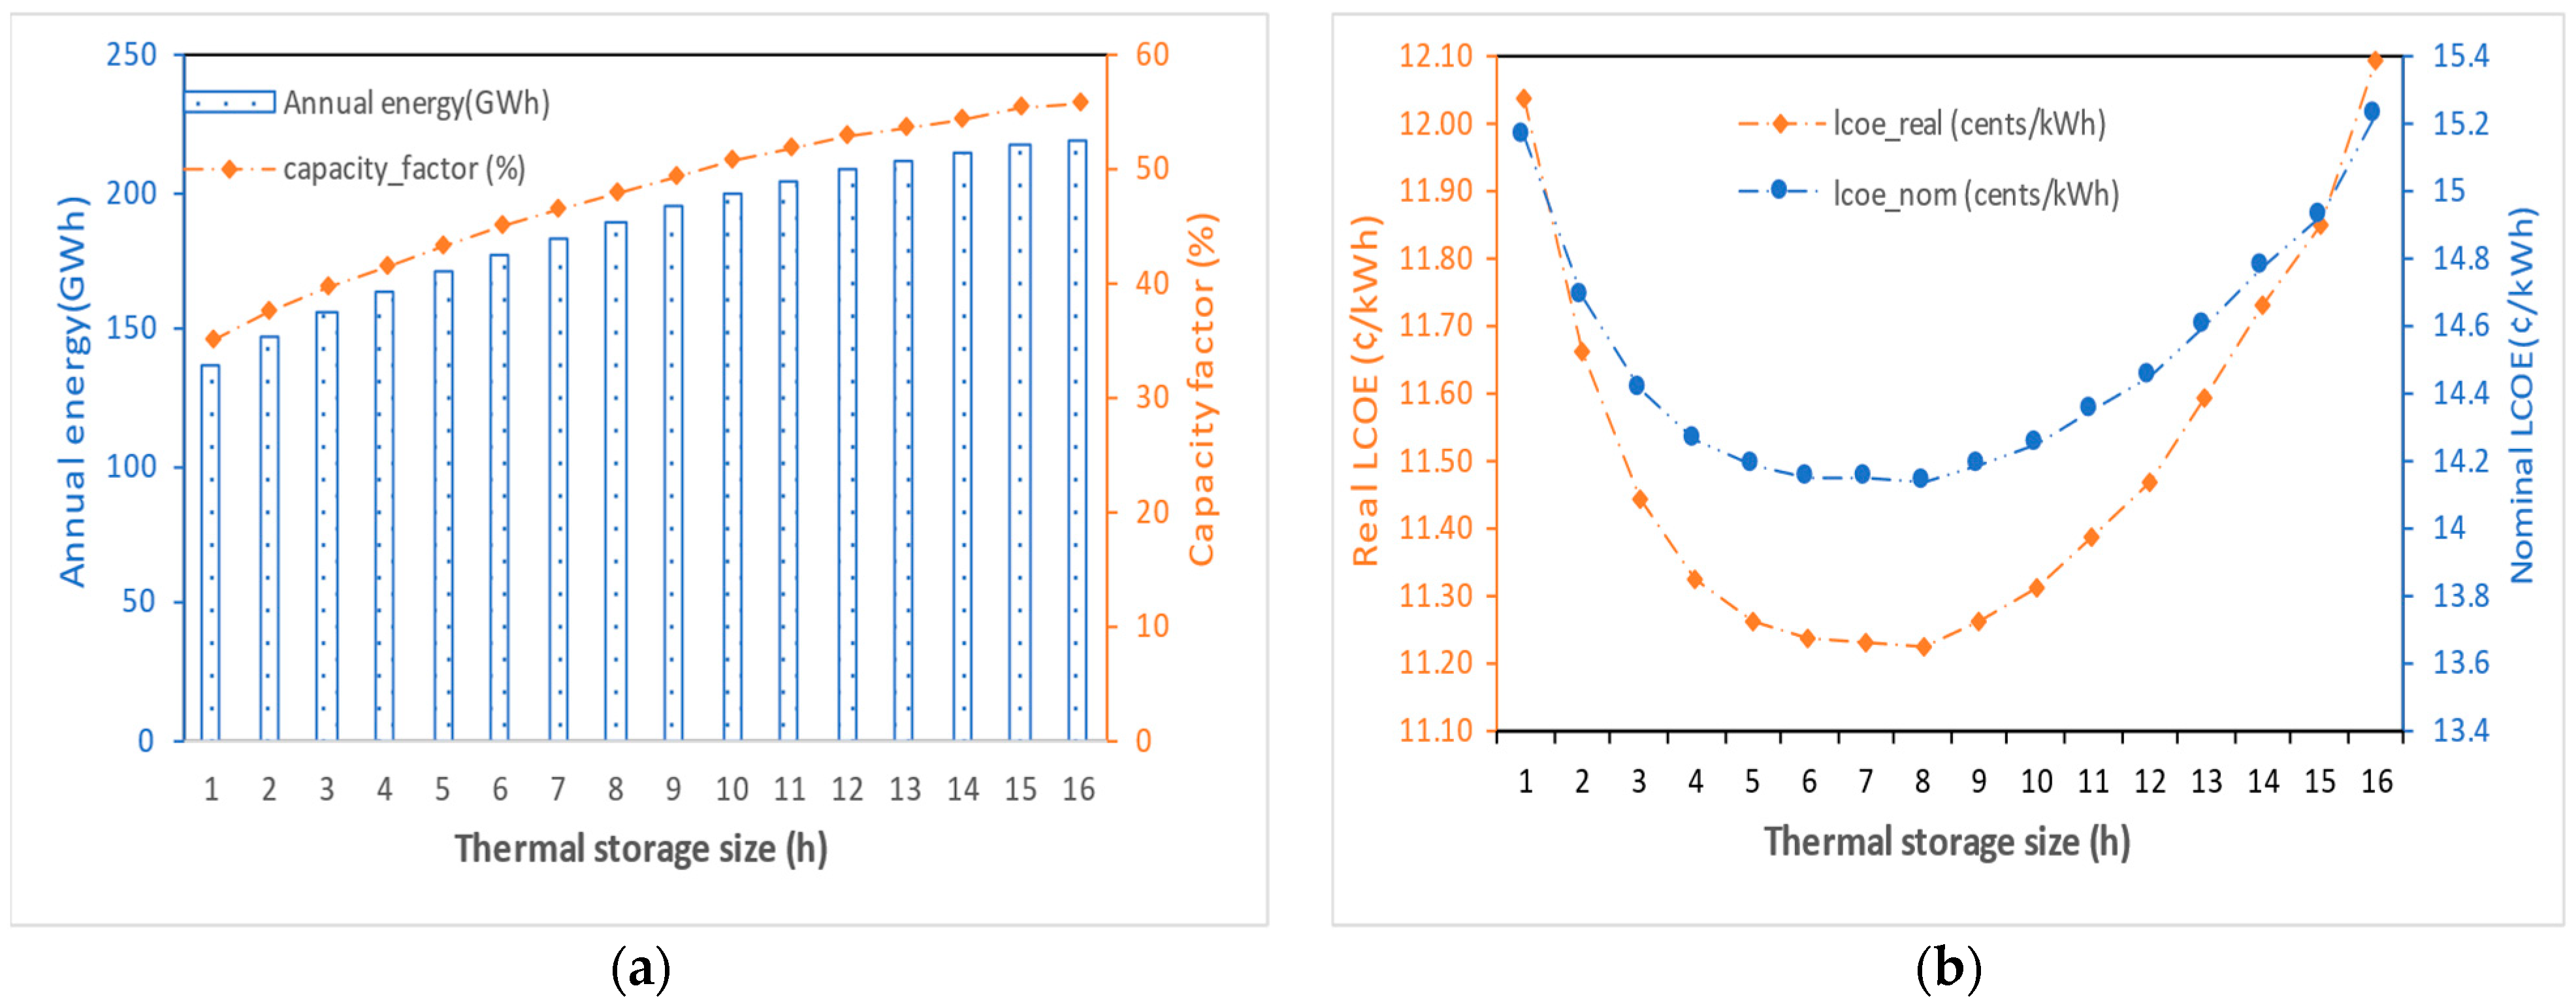
- Scenarios 6: PTC facility with various thermal storage times (TES)
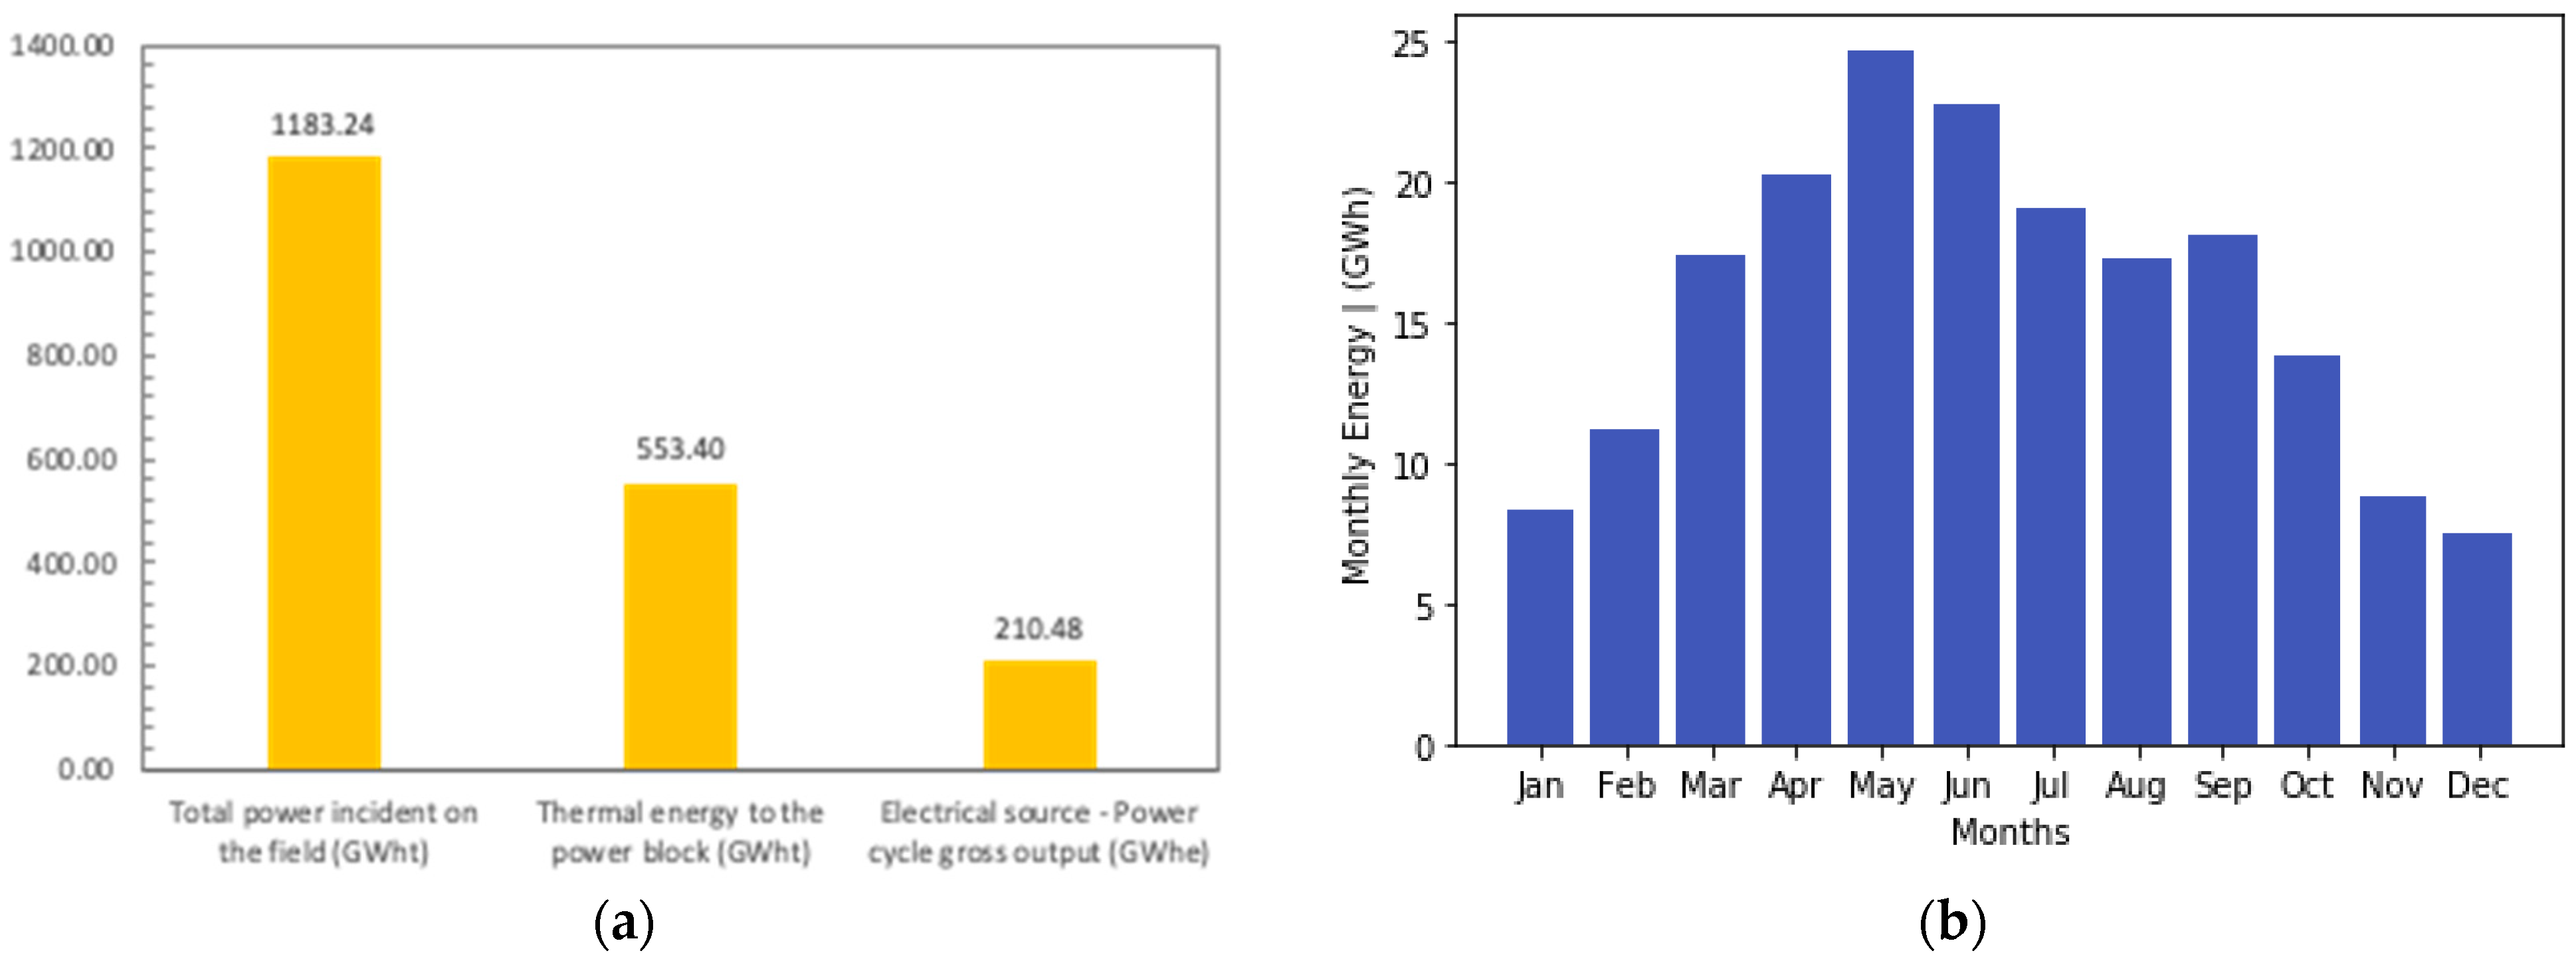
- Scenario 7: PTC best configuration and sensitivity analysis
5. Sensitivity Analyses
6. Conclusions and Recommendations
- The use of the Luz LS-3 as the collector/SCA, Solel UVAC 3 as receiver/HCE, and Dowtherm Q as heat transfer fluid showed higher performance in terms of yearly energy production yield and capacity factor, as well as the lowest real and nominal LCOEs;
- The annual energy and capacity factor using the wet cooling mode increased by almost 7% compared to the PTC facility with a dry cooling mode. However, the dry cooling system significantly reduced water consumption by almost 94% in the PTC plant;
- PTC plants with large storage capacity demonstrated better annual performance, such as net electricity output and capacity factor, but higher real and nominal LCOEs due to the high costs of TES systems. As a result, the number of full loads of storage must be optimized, otherwise the LCOE increases significantly;
- The optimal solar multiple value was 2.4, corresponding to the lowest real and nominal LCOE. Moreover, the duration of TES had significant effects on the annual performance simulations and LCOEs. The optimum investigated PTC plant TES was 8 h, for which the real and nominal LCOEs were estimated to be 0.112 USD/kWh and 0.141 USD/kWh, respectively;
- The maximum and minimum net electricity outputs for the best-configuration PTC plant were 24.6 GWh and 7.4 GWh in May and December, respectively. The capacity factor and the gross-to-net conversion factor for the optimized plant were found to be 93.5% and 47.9%, respectively;
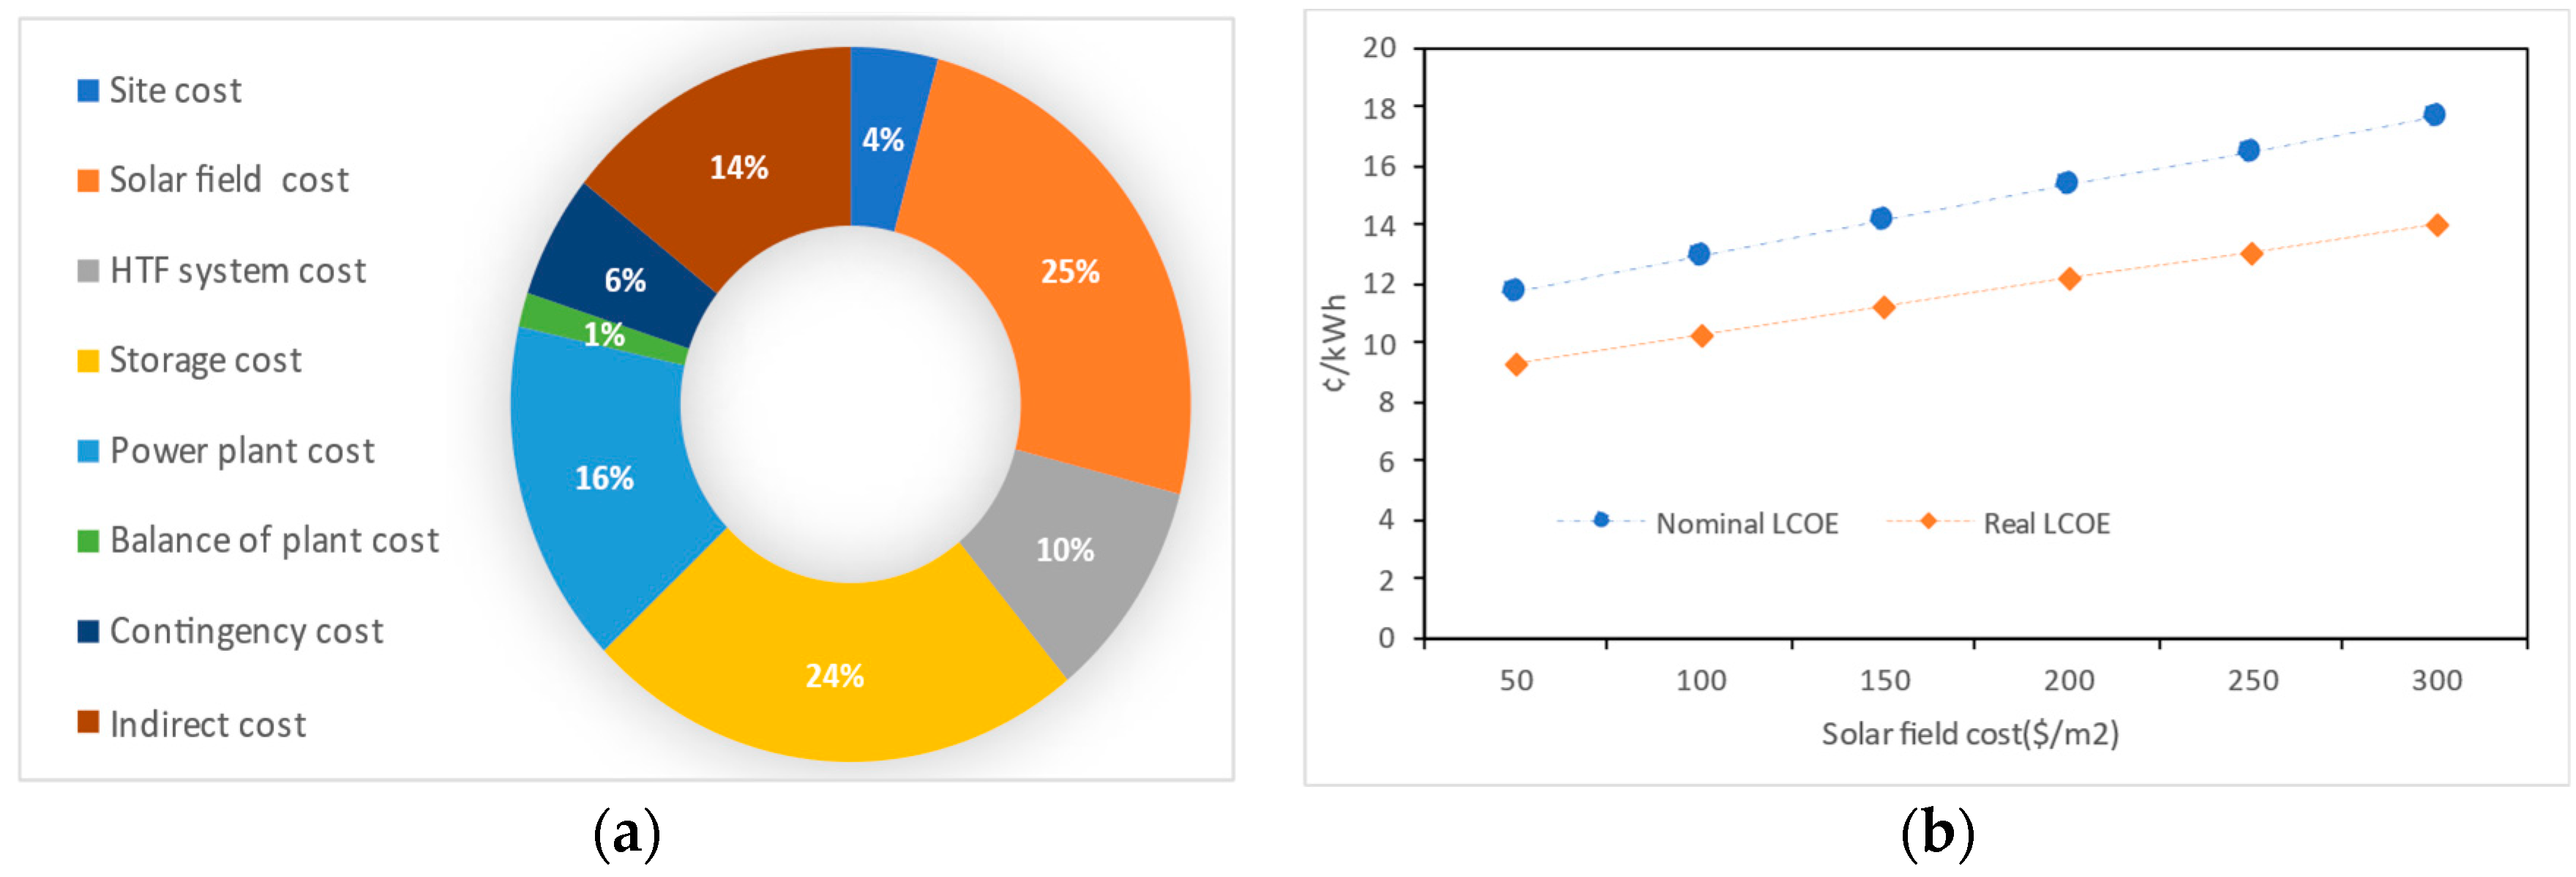
- The sensitivity study of the PTC facility demonstrated ±15% and ±10% uncertainties in input parameters for the financial assessments. According to the sensitivity study, the collector cost was the key economic parameter affecting the real and nominal LCOE, and the increase of 10% in the discount rate caused a correspondent decrease in the NPV and verse versa.
Author Contributions
Funding
Institutional Review Board Statement
Informed Consent Statement
Data Availability Statement
Conflicts of Interest
Abbreviations
| CDF | Cumulative distribution function |
| CF | Capacity factor |
| CSP | Concentrating solar power |
| DNI | Direct normal irradiance |
| HTF | Heat transfer fluid |
| LCOE | Levelized cost of electricity |
| PTC | Parabolic trough collector |
| SAM SM | System Advisor Model Solar multiple |
| SCA | Solar collector assembly |
| TES | Thermal energy storage |
| TMY | Typical meteorological year |
References
- Yasmeen, R.; Yao, X.; Padda, I.U.H.; Shah, W.U.H.; Jie, W. Exploring the role of solar energy and foreign direct investment for clean environment: Evidence from top 10 solar energy consuming countries. Renew. Energy 2022, 185, 147–158. [Google Scholar] [CrossRef]
- Hosseini, S.E.; Wahid, M.A. Hydrogen from solar energy, a clean energy carrier from a sustainable source of energy. Int. J. Energy Res. 2020, 44, 4110–4131. [Google Scholar] [CrossRef]
- Touili, S.; Merrouni, A.A.; Hassouani, Y.E.; Amrani, A.; Rachidi, S. Analysis of the yield and production cost of large-scale electrolytic hydrogen from different solar technologies and under several Moroccan climate zones. Int. J. Hydrogen Energy 2020, 45, 26785–26799. [Google Scholar] [CrossRef]
- Shalaby, S.M.; Sharshir, S.W.; Kabeel, A.E.; Kandeal, A.W.; Abosheiasha, H.F.; Abdelgaied, M.; Hamed, M.H.; Yang, N. Reverse osmosis desalination systems powered by solar energy: Preheating techniques and brine disposal challenges—A detailed review. Energy Convers. Manag. 2022, 251, 114971. [Google Scholar] [CrossRef]
- EL-Mesery, H.S.; EL-Seesy, A.I.; Hu, Z.; Li, Y. Recent developments in solar drying technology of food and agricultural products: A review. Renew. Sustain. Energy Rev. 2022, 157, 112070. [Google Scholar] [CrossRef]
- Mouaky, A.; Alami Merrouni, A.; Laadel, N.E.; Bennouna, E.G. Simulation and experimental validation of a parabolic trough plant for solar thermal applications under the semi-arid climate conditions. Sol. Energy 2019, 194, 969–985. [Google Scholar] [CrossRef]
- Ouali, H.A.L.; Raillani, B.; Hassani, S.E.; Moussaoui, M.A.; Mezrhab, A.; Amraqui, S. Techno-economic evaluation of very large-scale photovoltaic power plant, case study: Eastern Morocco. In Proceedings of the 2020 5th International Conference on Renewable Energies for Developing Countries (REDEC), Marrakech, Morocco, 29–30 June 2020; Volume 2020. [Google Scholar] [CrossRef]
- Ouali, H.A.L.; Moussaoui, M.A.; Mezrhab, A.; Naji, H. Comparative study between direct steam generation and molten salt solar tower plants in the climatic conditions of the eastern Moroccan region. Int. J. Renew. Energy Dev. 2020, 9, 287–294. [Google Scholar] [CrossRef]
- Renewables 2020—Analysis-IEA n.d. Available online: https://www.iea.org/reports/renewables-2020 (accessed on 22 April 2022).
- Şevik, S.; Aktaş, A. Performance enhancing and improvement studies in a 600 kW solar photovoltaic (PV) power plant; manual and natural cleaning, rainwater harvesting and the snow load removal on the PV arrays. Renew. Energy 2022, 181, 490–503. [Google Scholar] [CrossRef]
- Khezri, R.; Mahmoudi, A.; Aki, H. Optimal planning of solar photovoltaic and battery storage systems for grid-connected residential sector: Review, challenges and new perspectives. Renew. Sustain. Energy Rev. 2022, 153, 111763. [Google Scholar] [CrossRef]
- Liu, T.; Yang, J.; Yang, Z.; Duan, Y. Techno-economic feasibility of solar power plants considering PV/CSP with electrical/thermal energy storage system. Energy Convers. Manag. 2022, 255, 115308. [Google Scholar] [CrossRef]
- Marazgioui, S.E.; Fadar, A.E. Impact of cooling tower technology on performance and cost-effectiveness of CSP plants. Energy Convers. Manag. 2022, 258, 115448. [Google Scholar] [CrossRef]
- Raillani, B.; Ouali, H.A.L.; Amraqui, S.; Moussaoui, M.A.; Mezrhab, A. Techno-economic impact of optical soiling losses on solar tower and linear Fresnel reflector power plants: Experimental and numerical investigation. Int. J. Green Energy 2022, 1–10. [Google Scholar] [CrossRef]
- Hanrieder, N.; Ghennioui, A.; Merrouni, A.A.; Wilbert, S.; Wiesinger, F.; Sengupta, M.; Zarzalejo, L.; Schade, A. Atmospheric Transmittance Model Validation for CSP Tower Plants. Remote Sens. 2019, 11, 1083. [Google Scholar] [CrossRef] [Green Version]
- Karim, M.; Naamane, S.; Hassani, I.E.A.E.; Delord, C.; Belcadi, S.; Tochon, P.; Bennouna, A. Towards the prediction of CSP mirrors wear: Methodology of analysis of influencing parameters on the mirrors surface degradation: Application in two different sites in Morocco. Sol. Energy 2014, 108, 41–50. [Google Scholar] [CrossRef]
- Boujdaini, L.E.; Ouali, H.A.L.; Mezrhab, A.; Moussaoui, M.A. Techno-economic investigation of parabolic trough solar power plant with indirect molten salt storage. In Proceedings of the 2019 International Conference Computer Science and Renewable Energies, Agadir, Morocco, 22–24 July 2019; pp. 1–7. [Google Scholar] [CrossRef]
- Azadeh, A.; Ghaderi, S.F.; Maghsoudi, A. Location optimization of solar plants by an integrated hierarchical DEA PCA approach. Energy Policy 2008, 36, 3993–4004. [Google Scholar] [CrossRef]
- Ismaen, R.; ElMekkawy, T.Y.; Pokharel, S.; Elomri, A.; Al-Salem, M. Solar Technology and District Cooling System in a Hot Climate Regions: Optimal Configuration and Technology Selection. Energies 2022, 15, 2657. [Google Scholar] [CrossRef]
- Allouhi, H.; Allouhi, A.; Jamil, A. Multi-objective optimization of a CSP-based dish Stirling field layout using Genetic Algorithm and TOPSIS method: Case studies in Ouarzazate and Madrid. Energy Convers. Manag. 2022, 254, 115220. [Google Scholar] [CrossRef]
- Bilal Awan, A.; Khan, M.N.; Zubair, M.; Bellos, E. Commercial parabolic trough CSP plants: Research trends and technological advancements. Sol. Energy 2020, 211, 1422–1458. [Google Scholar] [CrossRef]
- Kamel, S.; Agyekum, E.B.; Adebayo, T.S.; Taha, I.B.M.; Gyamfi, B.A.; Yaqoob, S.J. Comparative Analysis of Rankine Cycle Linear Fresnel Reflector and Solar Tower Plant Technologies: Techno-Economic Analysis for Ethiopia. Sustainability 2022, 14, 1677. [Google Scholar] [CrossRef]
- Home—System Advisor Model (SAM) n.d. Available online: https://sam.nrel.gov/ (accessed on 5 January 2022).
- Sultan, A.J.; Hughes, K.J.; Ingham, D.B.; Ma, L.; Pourkashanian, M. Techno-economic competitiveness of 50 MW concentrating solar power plants for electricity generation under Kuwait climatic conditions. Renew. Sustain. Energy Rev. 2020, 134, 110342. [Google Scholar] [CrossRef]
- Soomro, M.I.; Kim, W.S. Parabolic-trough plant integrated with direct-contact membrane distillation system: Concept, simulation, performance, and economic evaluation. Sol. Energy 2018, 173, 348–361. [Google Scholar] [CrossRef]
- Ouali, H.A.L.; Raillani, B.; Amraqui, S.; Moussaoui, M.A.; Mezrhab, A.; Mezrhab, A. Analysis and optimization of sm and tes hours of central receiver concentrated solar thermal with two-tank molten salt thermal storage. Lect. Notes Electr. Eng. 2020, 684, 666–673. [Google Scholar] [CrossRef]
- Goyal, N.; Aggarwal, A.; Kumar, A. Financial feasibility of concentrated solar power with and without sensible heat storage in hot and dry Indian climate. J. Energy Storage 2022, 52, 105002. [Google Scholar] [CrossRef]
- Price, H. A Parabolic Trough Solar Power Plant Simulation Model. Int. Sol. Energy Conf. 2009, 665–673. [Google Scholar] [CrossRef] [Green Version]
- Wagner, M.J.; Gilman, P. Technical Manual for the SAM Physical trough Model; No. NREL/TP-5500-51825; National Renewable Energy Lab. (NREL): Golden, CO, USA, 2011. [CrossRef] [Green Version]
- Bousselamti, L.; Cherkaoui, M. Modelling and Assessing the Performance of Hybrid PV-CSP Plants in Morocco: A Parametric Study. Int. J. Photoenergy 2019, 2019, 5783927. [Google Scholar] [CrossRef] [Green Version]
- Forristal, R. Heat Transfer Analysis and Modelling of a Parabolic trough Solar Receiver Implemented in Engineering Solver Equation, No. NREL/TP-550-34169; National Renewable Energy Laboratory: Golden, CO, USA, 2003. [CrossRef] [Green Version]
- Bellos, E.; Tzivanidis, C. Enhancing the Performance of Evacuated and Non-Evacuated Parabolic Trough Collectors Using Twisted Tape Inserts, Perforated Plate Inserts and Internally Finned Absorber. Energies 2018, 11, 1129. [Google Scholar] [CrossRef]
- Swinbank, W.C. Long-wave radiation from clear skies. Q. J. R. Meteorol. Soc. 1963, 89, 339–348. [Google Scholar] [CrossRef]
- Liaqat, K.; Anss, M.; Ali, A.; Mengal, A.N. Modeling and Simulation of a 100 MW Concentrated Solar Thermal Power Plant Using Parabolic Trough Collectors in Pakistan. IOP Conf. Ser. Mater. Sci. Eng. 2018, 414, 012032. [Google Scholar] [CrossRef]
- Cavallaro, F. Fuzzy TOPSIS approach for assessing thermal-energy storage in concentrated solar power (CSP) systems. Appl. Energy 2010, 87, 496–503. [Google Scholar] [CrossRef]
- Moukhtar, I.; Elbaset, A.A.; Dein, A.Z.E.; Qudaih, Y.; Blagin, E.; Uglanov, D.; Mitani, Y. Electric power regulation and modeling of a central tower receiver power plant based on artificial neural network technique. J. Renew. Sustain. Energy 2018, 10, 043706. [Google Scholar] [CrossRef]
- García, I.L.; Álvarez, J.L.; Blanco, D. Performance model for parabolic trough solar thermal power plants with thermal storage: Comparison to operating plant data. Sol. Energy 2011, 85, 2443–2460. [Google Scholar] [CrossRef]
- Montes, M.J.; Abánades, A.; Martínez-Val, J.M.; Valdés, M. Solar multiple optimization for a solar-only thermal power plant, using oil as heat transfer fluid in the parabolic trough collectors. Sol. Energy 2009, 83, 2165–2176. [Google Scholar] [CrossRef] [Green Version]
- Awan, A.B.; Zubair, M.; Memon, Z.A.; Ghalleb, N.; Tlili, I. Comparative analysis of dish Stirling engine and photovoltaic technologies: Energy and economic perspective. Sustain. Energy Technol. Assess. 2021, 44, 101028. [Google Scholar] [CrossRef]
- Darling, S.B.; You, F.; Veselka, T.; Velosa, A. Energy& Environmental Science Enhanced oxygen reduction activity on surface-decorated perovskite thin fi lms for solid oxide fuel cells Title: Light scattering by nanostructured anti-refl ection coatings Assumptions and the levelized cost of energy for photovoltaics. Energy Environ. Sci. 2011, 4, 3689–3696. [Google Scholar] [CrossRef]
- Ouali, H.A.L.; Khouya, A.; Merrouni, A.A. Numerical investigation of high concentrated photovoltaic (HCPV) plants in MENA region: Techno-Economic assessment, parametric study and sensitivity analysis. Sustain. Energy Technol. Assess. 2022, 53, 102510. [Google Scholar] [CrossRef]
- Intro—Meteonorm (en) n.d. Available online: https://meteonorm.com/en/ (accessed on 3 August 2022).
- Boukelia, T.E.; Mecibah, M.S.; Kumar, B.N.; Reddy, K.S. Investigation of solar parabolic trough power plants with and without integrated TES (thermal energy storage) and FBS (fuel backup system) using thermic oil and solar salt. Energy 2015, 88, 292–303. [Google Scholar] [CrossRef]
- Abbas, M.; Belgroun, Z.; Aburidah, H.; Merzouk, N.K. Assessment of a Solar Parabolic Trough Power Plant for Electricity Generation under Mediterranean and Arid Climate Conditions in Algeria. Energy Procedia 2013, 42, 93–102. [Google Scholar] [CrossRef] [Green Version]
- Bishoyi, D.; Sudhakar, K. Modeling and performance simulation of 100 MW PTC based solar thermal power plant in Udaipur India. Case Stud. Therm. Eng. 2017, 10, 216–226. [Google Scholar] [CrossRef]
- Ikhlef, K.; Larbi, S. Techno-economic optimization for implantation of parabolic trough power plant: Case study of Algeria. J. Renew. Sustain. Energy 2020, 12, 063704. [Google Scholar] [CrossRef]
- Praveen, R.P.; Baseer, M.A.; Awan, A.B.; Zubair, M. Performance Analysis and Optimization of a Parabolic Trough Solar Power Plant in the Middle East Region. Energies 2018, 11, 741. [Google Scholar] [CrossRef] [Green Version]
- Tahir, S.; Ahmad, M.; Abd-ur-Rehman, H.M.; Shakir, S. Techno-economic assessment of concentrated solar thermal power generation and potential barriers in its deployment in Pakistan. J. Clean. Prod. 2021, 293, 126125. [Google Scholar] [CrossRef]
- Bhuiyan, N.; Ullah, W.; Islam, R.; Ahmed, T.; Mohammad, N. Performance optimisation of parabolic trough solar thermal power plants–a case study in Bangladesh. Int. J. Sustain. Energy 2020, 39, 113–131. [Google Scholar] [CrossRef]
- Sharma, A. A comprehensive study of solar power in India and World. Renew. Sustain. Energy Rev. 2011, 15, 1767–1776. [Google Scholar] [CrossRef]


| Reflective Aperture Area (m2) | Aperture Width—Total Structure (m) | Length of Collector Assembly (m) | Length of a Single Module (m) | Number of Modules Per Assembly | Reflector Coating | |
|---|---|---|---|---|---|---|
| ET150 | 817.5 | 5.75 | 150 | 12.5 | 12 | Back silver-coated |
| Luz LS-2 | 235 | 5 | 49 | 8.16 | 6 | Back silver-coated |
| Luz LS-3 | 545 | 5.75 | 100 | 8.33 | 12 | Back silver-coated |
| SGX-1 | 470.3 | 5 | 100 | 8.33 | 12 | Back silver-coated |
| AT150 | 817.5 | 5.774 | 150 | 12.5 | 12 | Back silver-coated |
| Siemens Sunfield 6 | 545 | 5.776 | 95.2 | 11.9 | 8 | - |
| SkyFuel SkyTrough | 656 | 6 | 115 | 14.37 | 8 | RelecTech Plus polymer film |
| FLABEG Ultimate Trough RP6 | 1720 | 7.53 | 247 | 24.7 | 10 | Back silver-coated |
| Absorber Flow Pattern | Absorber Tube Inner Diameter (m) | Absorber Tube Outer Diameter (m) | Glass Envelope Inner Diameter (m) | Glass Envelope Outer Diameter (m) | |
|---|---|---|---|---|---|
| Schott PTR70 | 304 L | 0.066 | 0.07 | 0.115 | 0.12 |
| Schott PTR70-2008 | 304 L | 0.066 | 0.07 | 0.115 | 0.12 |
| Solel UVAC 3 | 304 L | 0.066 | 0.07 | 0.115 | 0.121 |
| Siemens UVAC 2010 | 216 L | 0.066 | 0.07 | 0.109 | 0.115 |
| Schott PTR80 | 304 L | 0.076 | 0.08 | 0.115 | 0.12 |
| Royal Tech CSP RTUVR 2014 | 321 H | 0.066 | 0.07 | 0.119 | 0.125 |
| TRX70-125 | 321 H | 0.066 | 0.07 | 0.119 | 0.125 |
| Chemical Composition (%wt) | Field HTF Min Operating Temp | Field HTF Max Operating Temp | Min Field Flow Velocity | Max Field Flow Velocity | Ensity (kg m3) vs. Temperature (°C) | |
|---|---|---|---|---|---|---|
| Hitec solar salt | NaNO3 (60%)/KNO3 (40%) | 238 | 593 | 0.153546 | 1.90492 | ρ = 2090 − 0.63·T |
| Caloria HT 43 | −12 | 315 | 0.429685 | 5.77916 | ||
| Hitec XL | NaNO3 (15%)/KNO3 (43%)/Ca (NO3)2 (42%) | 120 | 500 | 0.14631 | 1.82992 | ρ = 2240 − 0.827·T |
| Therminol VP1 | Eutectic mixture of diphenyl oxide (DPO) and bipheny | 12 | 400 | 0.356109 | 4.96554 | |
| Hitec | NaNO3/KNO3/NaNO2 (7/53/40) | 142 | 538 | 0.156709 | 1.95583 | ρ = −0.9·T + 2269.4 |
| Dowtherm Q | Mixture of diphenylethane and alkylated aromatics | −35 | 330 | 0.385166 | 5.12302 | |
| Therminol 59 | −45 | 315 | 0.385278 | 5.23268 |
| Parameter | Wet Cooling | Dry Cooling | Diff. (%) |
|---|---|---|---|
| Annual energy (GWh) | 170.4 | 158.35 | +7 |
| Gross-to-net conversion (%) | 93.3 | 90.3 | +3.2 |
| Capacity factor (%) | 43.2 | 40.2 | +6.9 |
| Annual water usage (m3) | 607,215 | 33,701 | +94 |
| Real LCOE (USD/kWh) | 0.1139 | 0.1223 | −0.73 |
| Nominal LCOE (USD/kWh) | 0.1435 | 0.1541 | −0.73 |
| Internal rate of return (%) | 11 | 11 | - |
| Metric | Value |
|---|---|
| Annual energy | 189 GWh |
| Gross-to-net conversion | 93.5% |
| Capacity factor | 47.9% |
| PPA price | 0.1141 USD/kWh |
| Annual total water consumption | 668,465 m3 |
| Internal rate of return (IRR) | 11% |
| NPV | USD 20,321,670 |
| Authors, Reference | PTC Plant Capacity (MWe) | Annual Energy (GWh) | Capacity Factor (%) |
|---|---|---|---|
| Our work | 50 | 189 | 47.9 |
| Boukelia et al. [43] | 50 | 118.45 | 27.30 |
| Abbas et al. [44] | 100 | 237 | 21.1 |
| Bishoyi [45] | 100 | 285.28 | 32.6 |
| Ikhlefet al. [46] | 25 | 82.46 | 41.8 |
| Praveen et al. [47] | 100 | 369.26 | 42.19 |
| Tahir et al. [48] | 100 | 294 | 33.6 |
| Andasol 1 [49] | 50 | 179.1 | 41.5 |
| SEGS VI [50] | 30 | 71.40 | 22.2 |
Publisher’s Note: MDPI stays neutral with regard to jurisdictional claims in published maps and institutional affiliations. |
© 2022 by the authors. Licensee MDPI, Basel, Switzerland. This article is an open access article distributed under the terms and conditions of the Creative Commons Attribution (CC BY) license (https://creativecommons.org/licenses/by/4.0/).
Share and Cite
Ait Lahoussine Ouali, H.; Alami Merrouni, A.; Chowdhury, S.; Techato, K.; Channumsin, S.; Ullah, N. Optimization and Techno-Economic Appraisal of Parabolic Trough Solar Power Plant under Different Scenarios: A Case Study of Morocco. Energies 2022, 15, 8485. https://doi.org/10.3390/en15228485
Ait Lahoussine Ouali H, Alami Merrouni A, Chowdhury S, Techato K, Channumsin S, Ullah N. Optimization and Techno-Economic Appraisal of Parabolic Trough Solar Power Plant under Different Scenarios: A Case Study of Morocco. Energies. 2022; 15(22):8485. https://doi.org/10.3390/en15228485
Chicago/Turabian StyleAit Lahoussine Ouali, Hanane, Ahmed Alami Merrouni, Shahariar Chowdhury, Kuaanan Techato, Sittiporn Channumsin, and Nasim Ullah. 2022. "Optimization and Techno-Economic Appraisal of Parabolic Trough Solar Power Plant under Different Scenarios: A Case Study of Morocco" Energies 15, no. 22: 8485. https://doi.org/10.3390/en15228485