Article

WSPRT Methods for Improving Power System Automation Devices in the Conditions of Distributed Generation Sources Operation

1
Department of Electroenergetics, Power Supply and Power Electronics, Nizhny Novgorod State Technical University n.a. R.E. Alekseev, 603950 Nizhny Novgorod, Russia
2
Department of Research on the Relationship between Energy and the Economy, Energy Research Institute of the Russian Academy of Sciences, 117186 Moscow, Russia
3
Department of Hydropower and Renewable Energy, National Research University “Moscow Power Engineering Institute”, 111250 Moscow, Russia
*
Author to whom correspondence should be addressed.
Energies 2022, 15(22), 8448; https://doi.org/10.3390/en15228448
Submission received: 14 October 2022 / Revised: 7 November 2022 / Accepted: 10 November 2022 / Published: 11 November 2022
(This article belongs to the Special Issue Optimal Design of Off-Grid Power Systems)

Abstract

:
The trend towards the decentralization and decarbonization of the energy sector stimulates the adoption of generation facilities based on renewable energy sources (RES) and distributed generation (DG) facilities that utilize secondary energy resources. Operation features of DG facilities, such as a high speed of electromechanical transient processes and significant deviations of power quality indicators from standard values, require improvement and an increase in the speed of automation devices. Modern electroautomatic devices must determine the operating regions (normal and emergency) and adapt the operation algorithms to the conditions of the current mode. The study presented proposes methods developed to use the Wald Sequential Probability Ratio Test (WSPRT) to improve the reliability and efficiency of the power system automation devices. The paper provides examples of using WSPRT in the devices of automatic frequency load shedding, automatic transformer disconnection, and power quality control. The results of mathematical modeling confirm the high performance of WSPRT in power system automation devices owing to an increase in the reliability of operating regions identification and speed of response. For example, in the automatic frequency load shedding (AFLS) algorithm for a network with DG facilities at a sampling rate that meets the requirements of the IEC 61850 (80 samples per period), the acceptance time does not exceed 1 ms. The study substantiates the need to use WSPRT in the logic blocks of automation devices employed in active distribution networks.

1. Introduction

Many countries plan to achieve carbon neutrality by 2035–2050, which means a reduction in carbon dioxide emissions to zero [1]. This requires maintaining a balance between carbon emissions and their removal by both offsetting and minimizing emissions from economic activities.
The set goals can be achieved through a radical transformation of technological processes based on innovative developments in energy sector, industry, transport, and agriculture, which are the main carbon dioxide producers. Innovative solutions are needed in the energy sector to create new types of equipment and automation systems and in the sphere related to the new types of services and models of electricity, heat, and cooling markets [2,3].
Some countries have quite large electrical and thermal energy transmission losses, which exceed the value of 10–12%. This is due to the long length of power lines and heat networks. The decentralization of generation capacities and their proximity to consumers can significantly reduce transmission losses to 1–2.5%, which contributes to both energy-saving and the minimization of carbon dioxide emissions [4,5].
The trend towards decentralization also makes it possible to fully meet the needs of society for the necessary types of energy in the required volumes and at affordable prices and to ensure the reliability, availability and security of energy delivery to various categories of consumers [6].
In the last decade, there has been a steady global trend towards a reduction in the use of non-renewable energy resources (coal, peat, oil, natural gas, etc.) in the energy sector. The listed energy resources are gradually replaced by renewable ones, which is why the new generation capacities are mainly commissioned in the sectors of wind and solar energy [7,8].
The integration of RES-based generation and DG fuel facilities requires a significant transformation of distribution networks. DG fuel facilities make it possible to effectively utilize secondary energy resources, such as coalmine methane, blast furnace and converter gas, biogas at treatment facilities, timber processing and agricultural waste. The need for transformation is also explained by the fact that RES-based generation, as well as DG fuel facilities, are integrated into medium- and high-voltage distribution networks. As a result, the networks become active, and the power flows in them can change their direction and magnitude from maximum to minimum several times during the day, depending on the generation and consumption conditions. In this case, distribution networks become complex heterogeneous objects, which normally have decentralized (multi-agent) control, including active consumers with controlled load and electric energy storage systems [9,10,11].
According to the International Renewable Energy Agency, the installed capacity of renewable energy generation has increased over the past ten years from 1311 to 2537 GW. Such a growth required revising most of the existing regulatory legal acts and building completely new control models to ensure the stability of RES-based generation functioning as a part of power systems under various topology and operating conditions [12].
Modern solar and wind power plants are connected to the distribution networks through inverters, in which power output and protection control algorithms are implemented. The networks with a large share of RES-based generation encounter significant deviations of power quality indices (PQIs) from the standard values due to the stochastic nature of electricity generation. In low-load conditions of inverters, at low values of solar radiation and small wind pressure, the PQI deviations are even more significant. PQI control devices record both short-term (from fractions of seconds to units of minutes) and long-term (from tens of minutes to hours) PQI deviations [13,14].
Moreover, the distribution networks have electrical loads of industrial enterprises for which PQI deviations are critical. The simultaneous deviation of several PQIs leads to the tripping of electrical loads by protection devices with a subsequent shutdown of production processes. This results in losses due to rejected products and the undersupply of products [15,16].
The decentralization of generation capacities with the massive introduction of RES-based generation operating in the distribution network causes a variety of possible topology and operating conditions. Under these conditions, it is impossible to provide manual control of power flows based on their visual identification and evaluation [17,18].
Therefore, the emergency control, power flow control, and electric automation devices are widely used in power systems. These devices must accurately identify many different operating regions since this affects the correct choice of types and sizes of control actions [19,20].
This study aims to develop methods for using the Wald Sequential Probability Ratio Test (WSPRT) in logic blocks of power system automation devices to improve their efficiency and response time. This paper provides examples of the WSPRT uses in devices for automatic frequency load shedding, automatic transformer disconnection, and automatic PQI control.

2. An Overview of the Wald Sequential Probability Ratio Test Uses

There are various known probabilistic–statistical methods widely used in industry, for example, in the input control of incoming materials, the analysis of production processes, the technical diagnostics of equipment, and the output control of manufactured products, as well as in decision-making at various production stages [21,22].
An overview of the literature on known use cases of WSPRT in various fields of knowledge is given in Table 1. It should be noted that WSPRT is not used in typical power system automation devices manufactured by various manufacturers.
Here are the main factors that affect the parameters of power flows and generate the need to use WSPRT in automation devices of power systems:
  • a significant increase in the time of electromechanical transients in active distribution networks due to small values of mechanical inertia constants of generating units (GUs) used at DG fuel facilities;
  • the emergence of different operating regions due to a decrease in mutual resistance between electric motors in the load and GUs in active distribution networks;
  • the use of high-performance fuel generators with smaller weight and size characteristics at DG facilities, which leads to their tripping by protection devices even in the case of short-term deviations of operating parameters (current, voltage, frequency) from the nominal values;
  • the use of modern industrial process lines that are sensitive to the PQI deviation, which leads to their shutdown by process protection when the PQIs deviate from the nominal values;
  • the use of automation devices in power systems with response time delays in the case of short-term deviations of operating parameters; for example, 0.15–0.3 s—for automatic frequency load shedding devices, 1–6 s—for automatic undervoltage protection devices.
It is worth noting that response delays in the control devices are normally not critical in distribution networks that have no RES-based generation facilities and DG fuel facilities. However, in the context of the mass decentralization of generating capacities, it is necessary to timely address the issue of increasing the speed of response for automation devices.
Let us give an example of a part of an active distribution network, to which a RES-based generation facility and a DG fuel facility with four gas-reciprocating units (GRU) are connected (Figure 1).
The power consumption of the distribution network portion is 20 MW; the total capacity of the DG fuel facility based on gas-reciprocating units is 10 MW, and the installed RES-based generation capacity (a photovoltaic power plant (PVP)) is 15 MW. The load structure in terms of the total consumed active power is as follows: the share of induction motors (IMs), depending on the mix of the process equipment at an industrial enterprise, ranges from 10 to 90%, and the rest of the load is static. The technical characteristics of equivalent IMs differ: Mstat/Mnom = 0.2 (for IMs that make up 20% of the total consumption), 0.4 (for 70%) and 0.8 (for 10%), respectively. The calculations of electromechanical transient processes assume that there is no change in the PVP power output due to a change in insolation and that PVP continues to generate the initial power (before the disturbance) in the quasi-steady state during the considered period (up to 10 s) at a frequency of the current operating state of the distribution network portion.
Using the example of automatic frequency load shedding (AFLS) devices (one for each section of 6 kV busbar) located in some part of the active distribution network (Figure 1) switched to an islanded mode of operation (breaker Q is off), we will show the presence of several operating regions and describe their features. The factors that determine the nature of electromechanical transient processes in this case will be the value of the initial active power shortage DP = 1 − Pnom.GUΣ/PloadΣ (%) and the share of IMs in the load d = PIMΣ/PloadΣ (%). There appear four operating regions, A, B, C, D, as shown in Figure 2.
In region A, there is a steady state, at which U > 0.8Unom, f > 49 Hz. The operating conditions in this region are explained by an overload capacity of the GUs of the DG facility, forced excitation in synchronous generators, and by the load regulation effects. The latter depends linearly on the value of d (at d = 0, the regulation effects KPU 2, KPf = 0; if d = 100%, KPU 0, KPf 1.8).
In region B, the GUs of the DG facility keep the voltage above the critical value, while the IMs continue to work, but the available power of the GUs is not enough, which leads to a decrease in frequency. Since the value of d is not large in this case, the IMs cannot provoke a voltage avalanche. Standard AFLS devices manufactured by various manufacturers can function reliably only in this operating region.
In region C, the value of d is greater than that in region B; therefore, the reactive power consumption by IMs goes up as the frequency decreases. This results in a significant voltage drop.
In region D, the magnitude of the initial power shortage is large, which causes the rapid occurrence of a voltage avalanche. In this case, all IMs are braked and tripped by undervoltage protection devices. The voltage in the network is set to 0.4 Unom, which, at low load, enables the GU speed control devices to raise the frequency to the nominal value [43].
The calculation results for electromechanical transients are given for the cases with no significant voltage dip at the initial stage. If the emergency conditions begin with a short circuit, then the rapid braking of the IMs results in a sharp increase in the value of reactive load consumed and a voltage decrease. In this case, the requirements for the speed of AFLS devices increase significantly, since the response time delays will lead to a voltage avalanche.
In the context of the decentralization of generation capacities with the massive adoption of RES-based generation and DG fuel facilities, the use of WSPRT in power system automation devices is justified and necessary. It will boost the speed of the automation devices and ensure the correct choice of types and sizes of control actions that are adequate to the operating region.

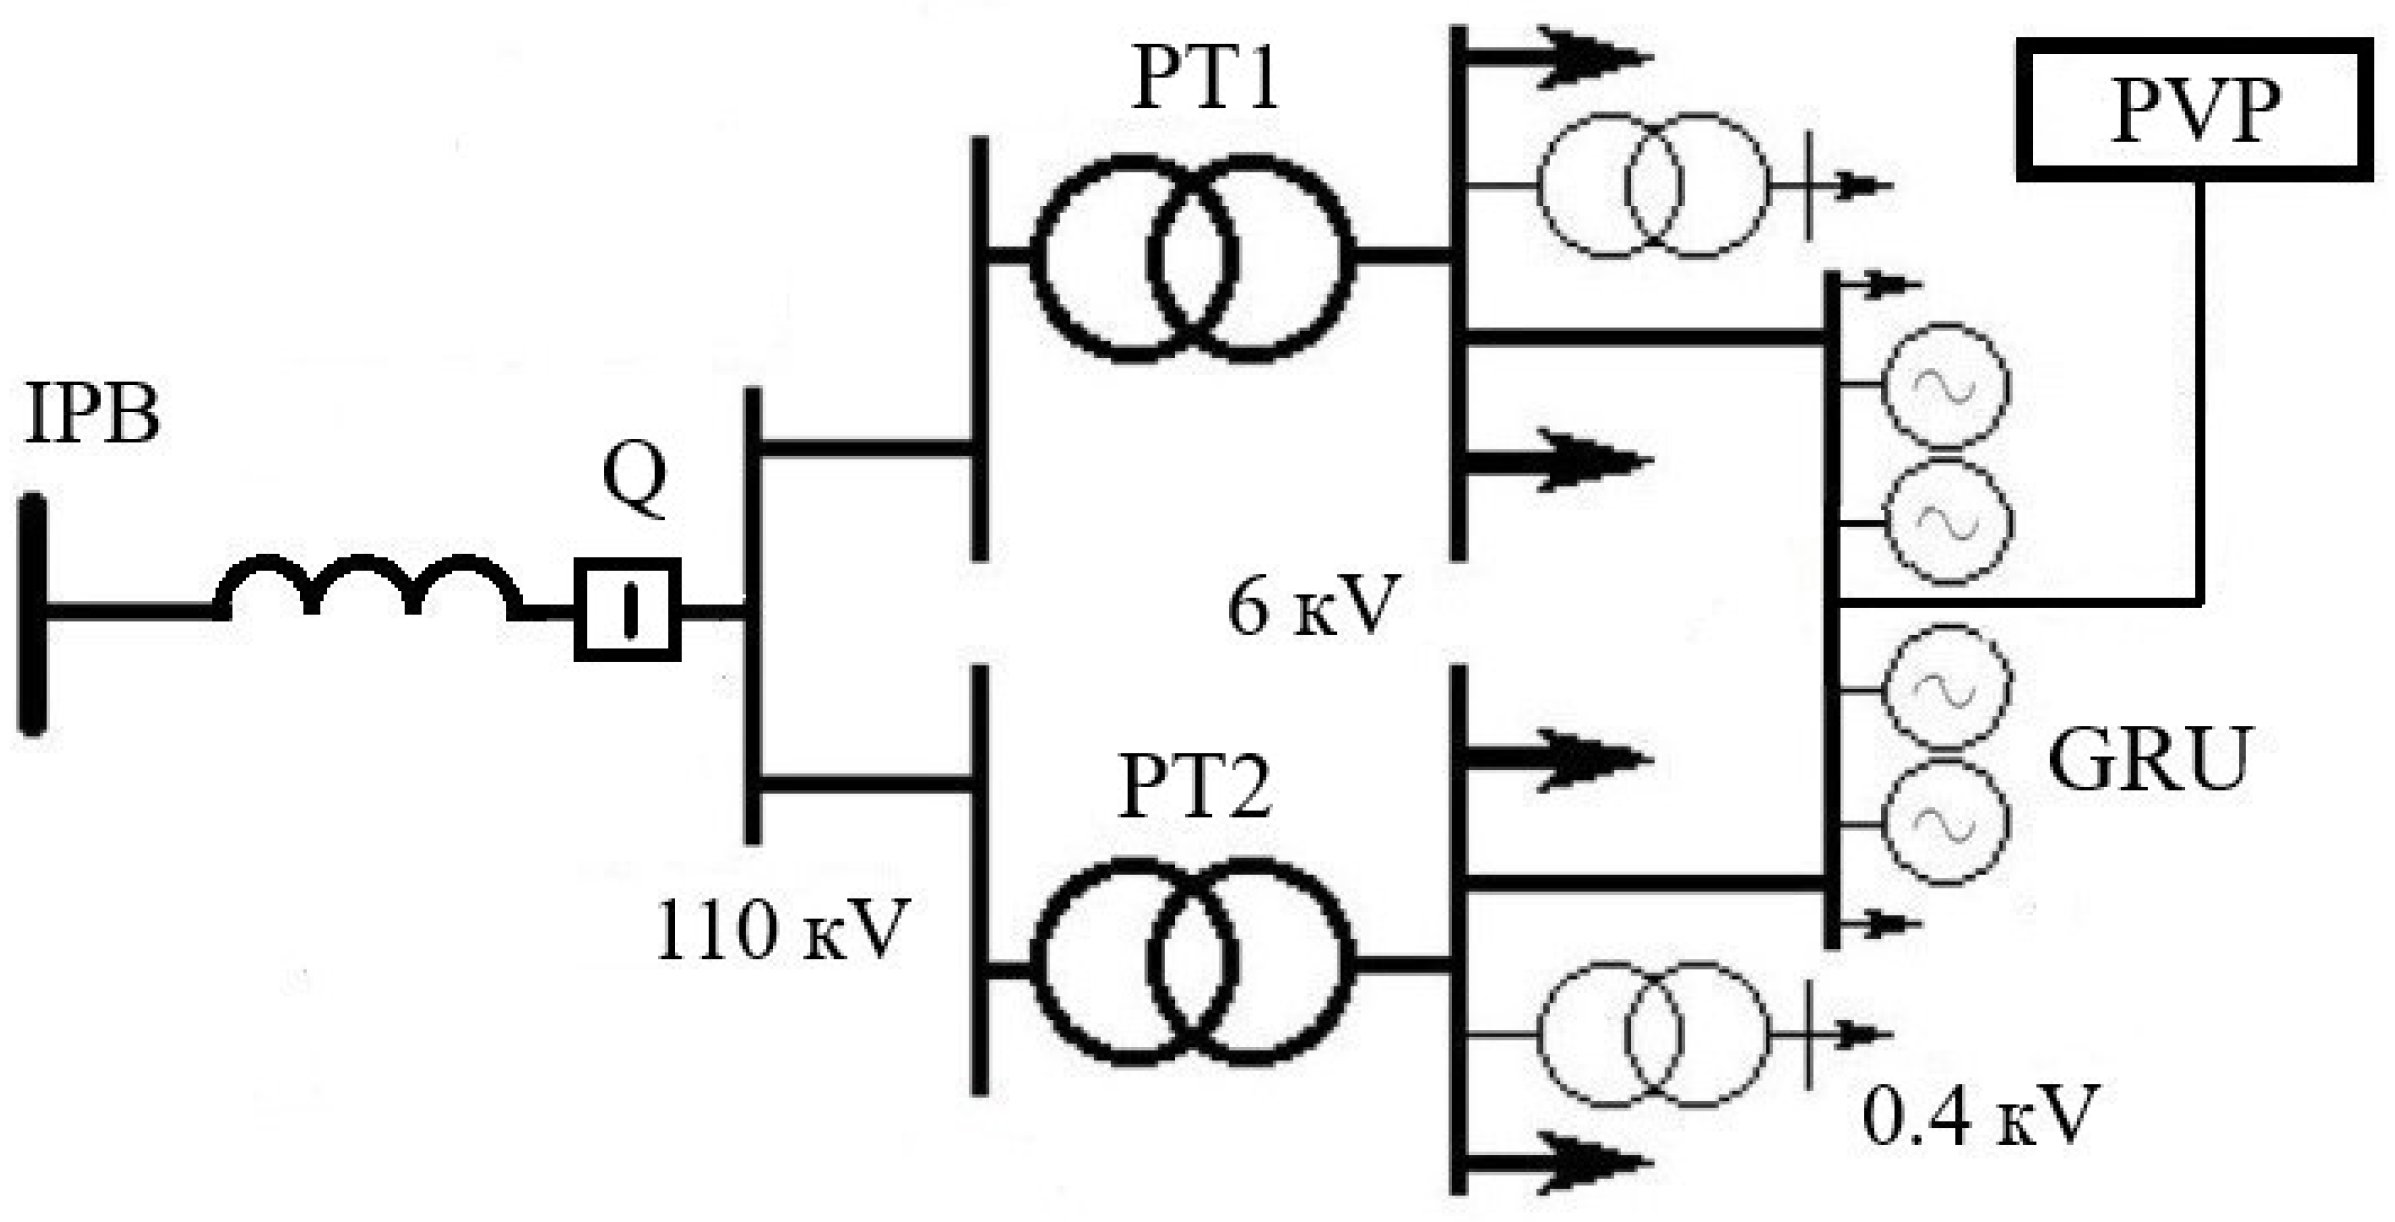
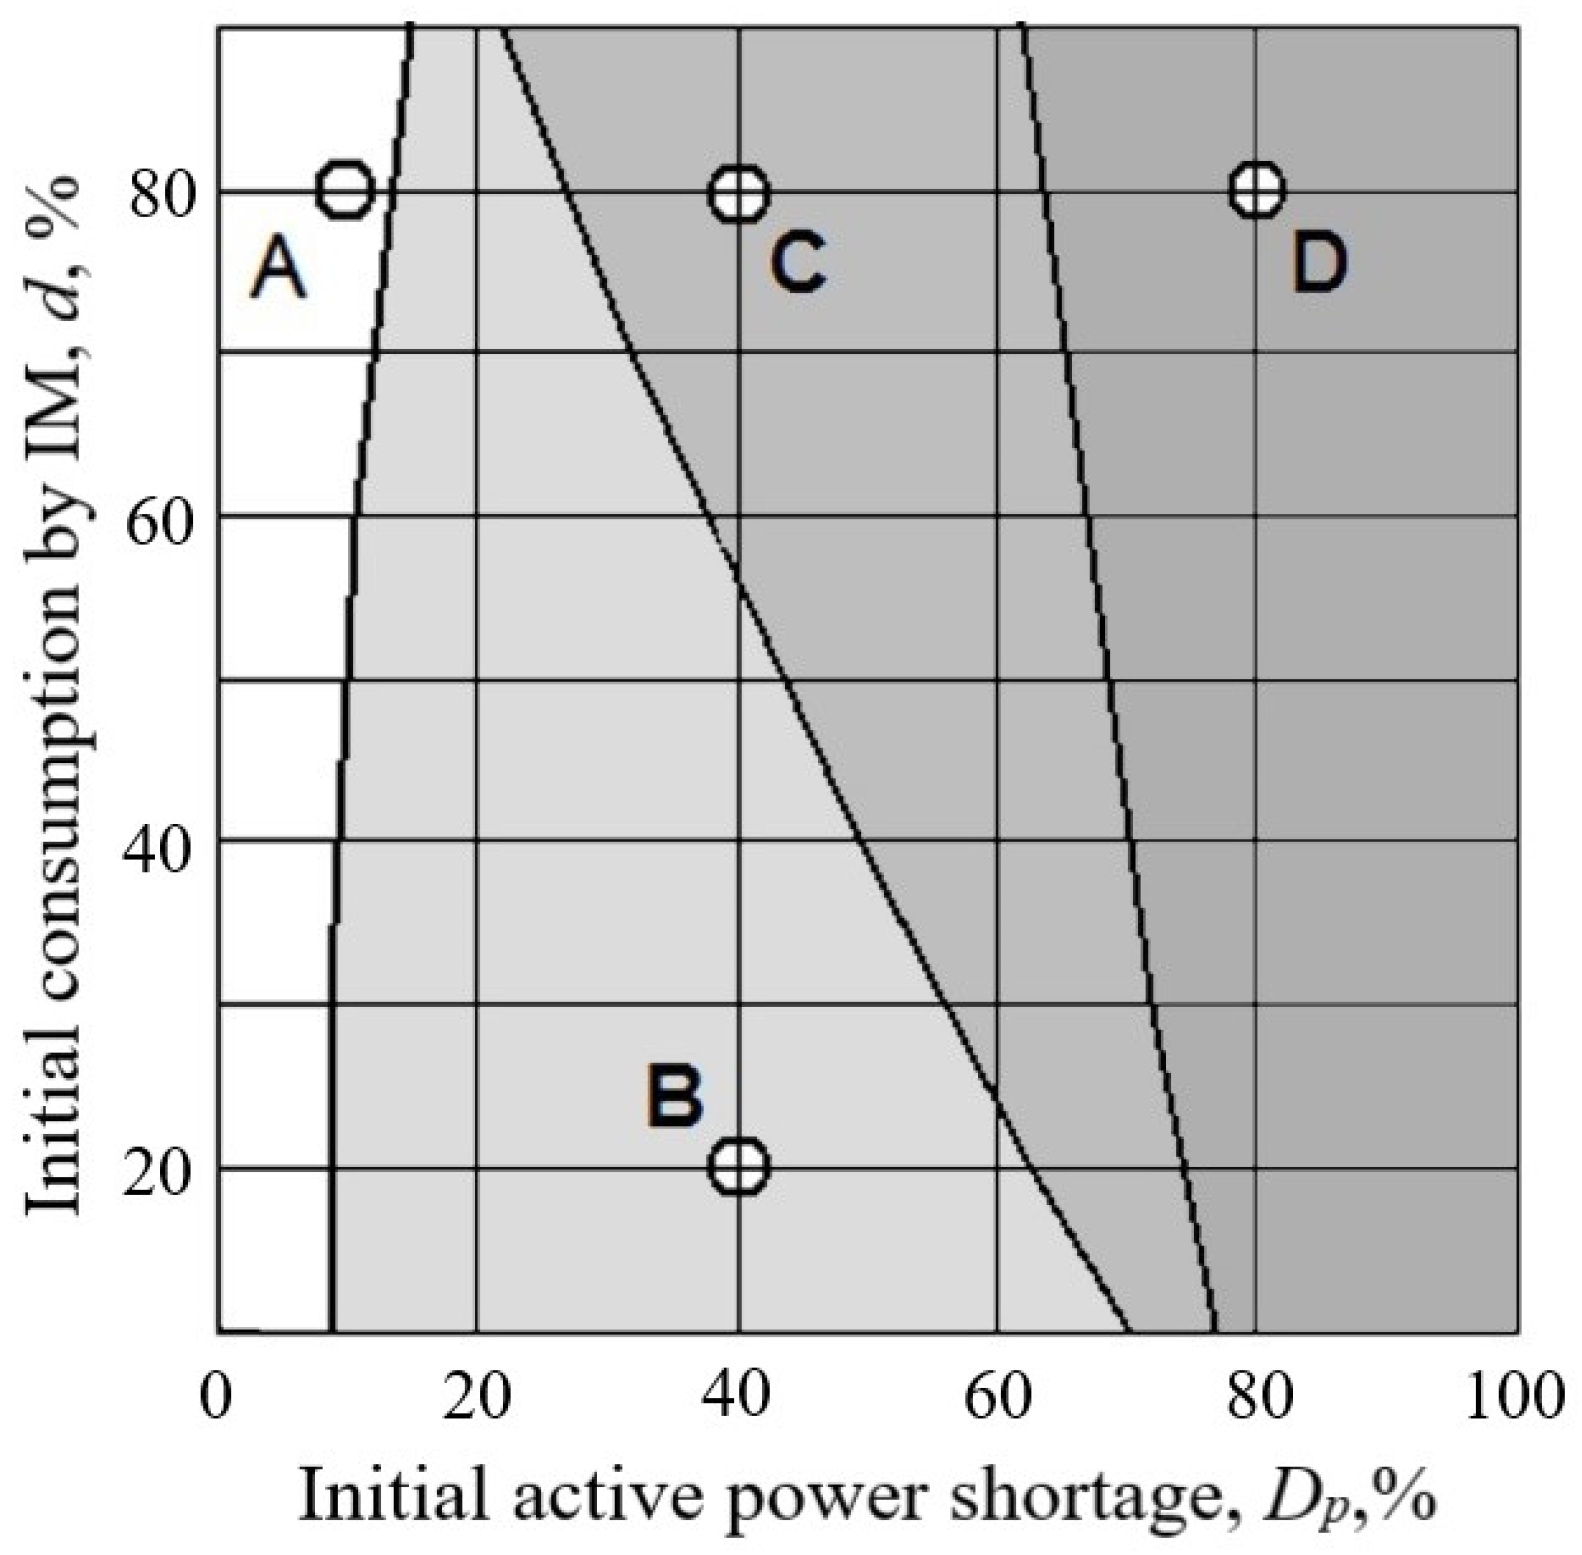
3. Simulation and Types of Calculations for the Formation of Operating Regions

The simulation was carried out to identify the operating regions and obtain statistical frequency distributions for normal and emergency conditions in the PowerFactory DIgSILENT GmbH software.
An islanded mode of a portion of an active distribution network with a DG fuel facility and a RES-based generation facility was considered in simulation. This is because, in the islanded mode of operation, when there is no power flow from the power system, one can clearly identify possible operating regions and determine their boundaries. In this case, the following types of power flow calculations were performed:
  • calculations of steady states for the normal and repair conditions of a portion of the distribution network with different load compositions;
  • calculations of electromechanical transients for various disturbances in the portion of the distribution network.
A change in the load composition is understood as a change in the share of active power consumed by IMs in the total consumption of active power in the portion of the active distribution network. In the calculations, the proportion of IMs varied from 10 to 90%, while the rest of the load was static.
The calculations of electromechanical transients factored in the following disturbances:
  • direct start-up of a large 2 MW IM on 6 kV busbar;
  • shutdown of one of the four GUs at the DG facility;
  • shutdown of two out of four GUs at the DG facility;
  • shutdown of three out of four GUs at the DG facility.
The calculation results were employed to construct a graph of operating regions (Figure 2) and to obtain statistical frequency distributions for normal and emergency conditions (Details show up in figure of Section 4).

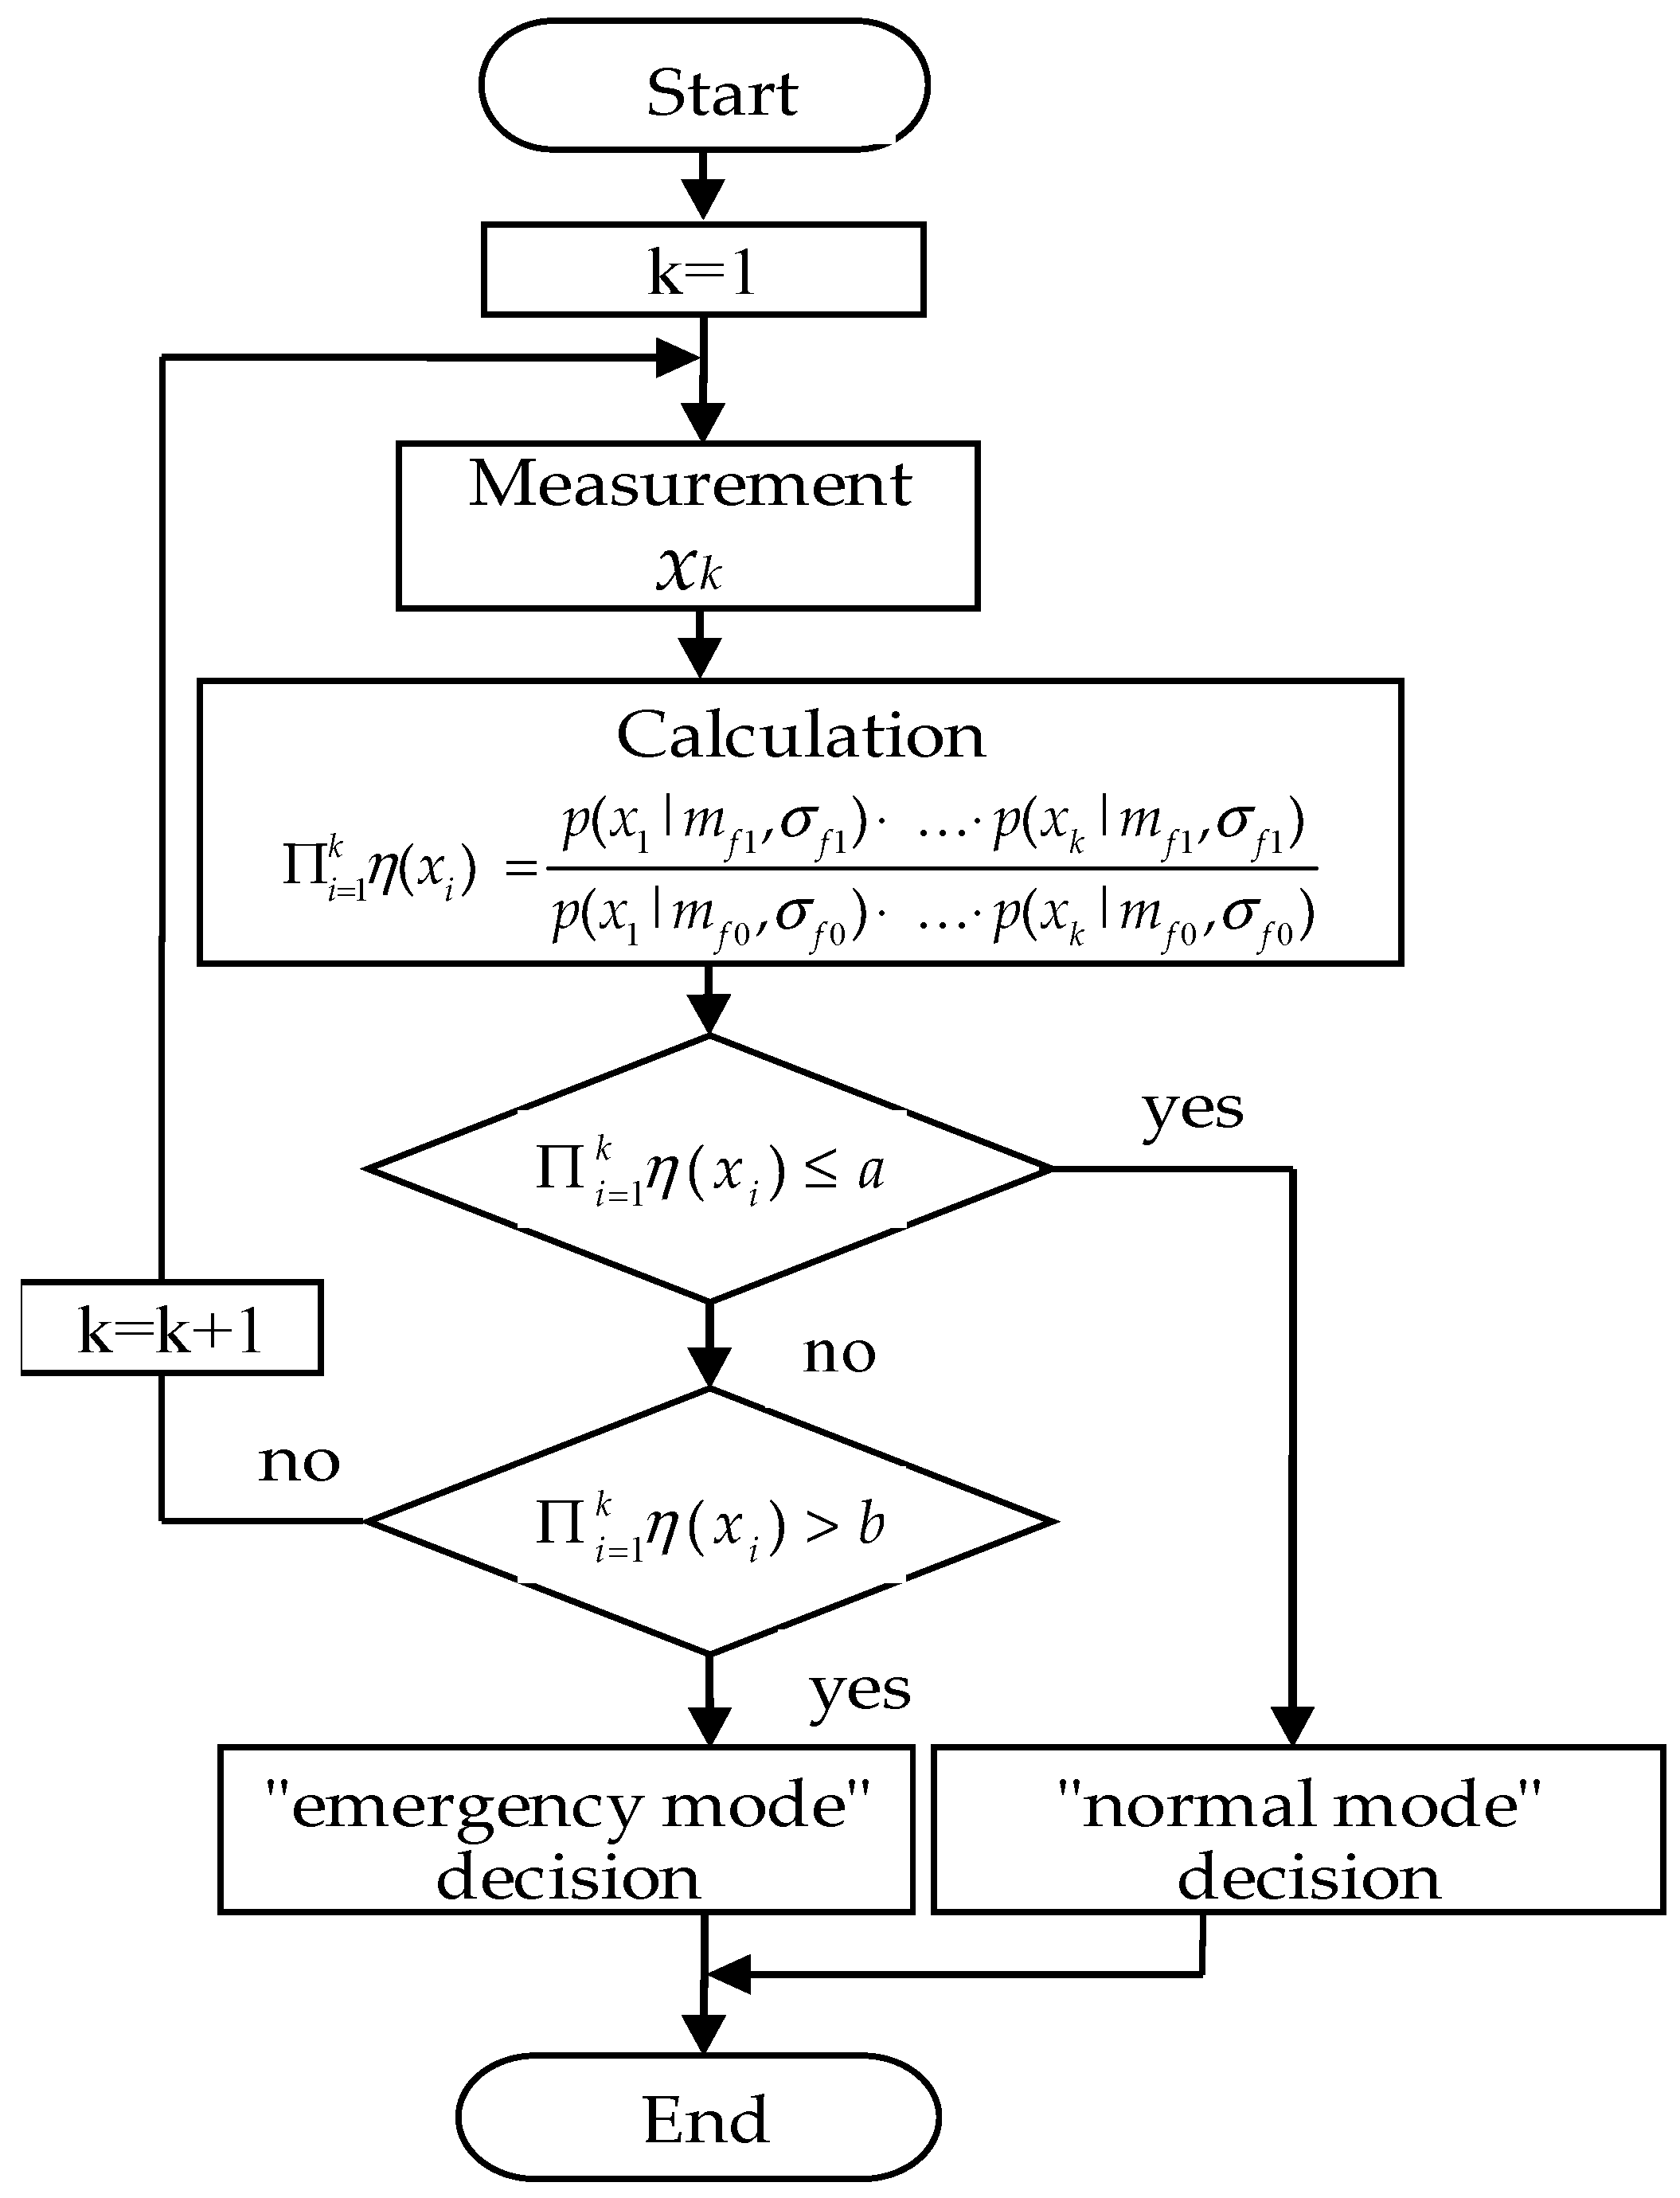
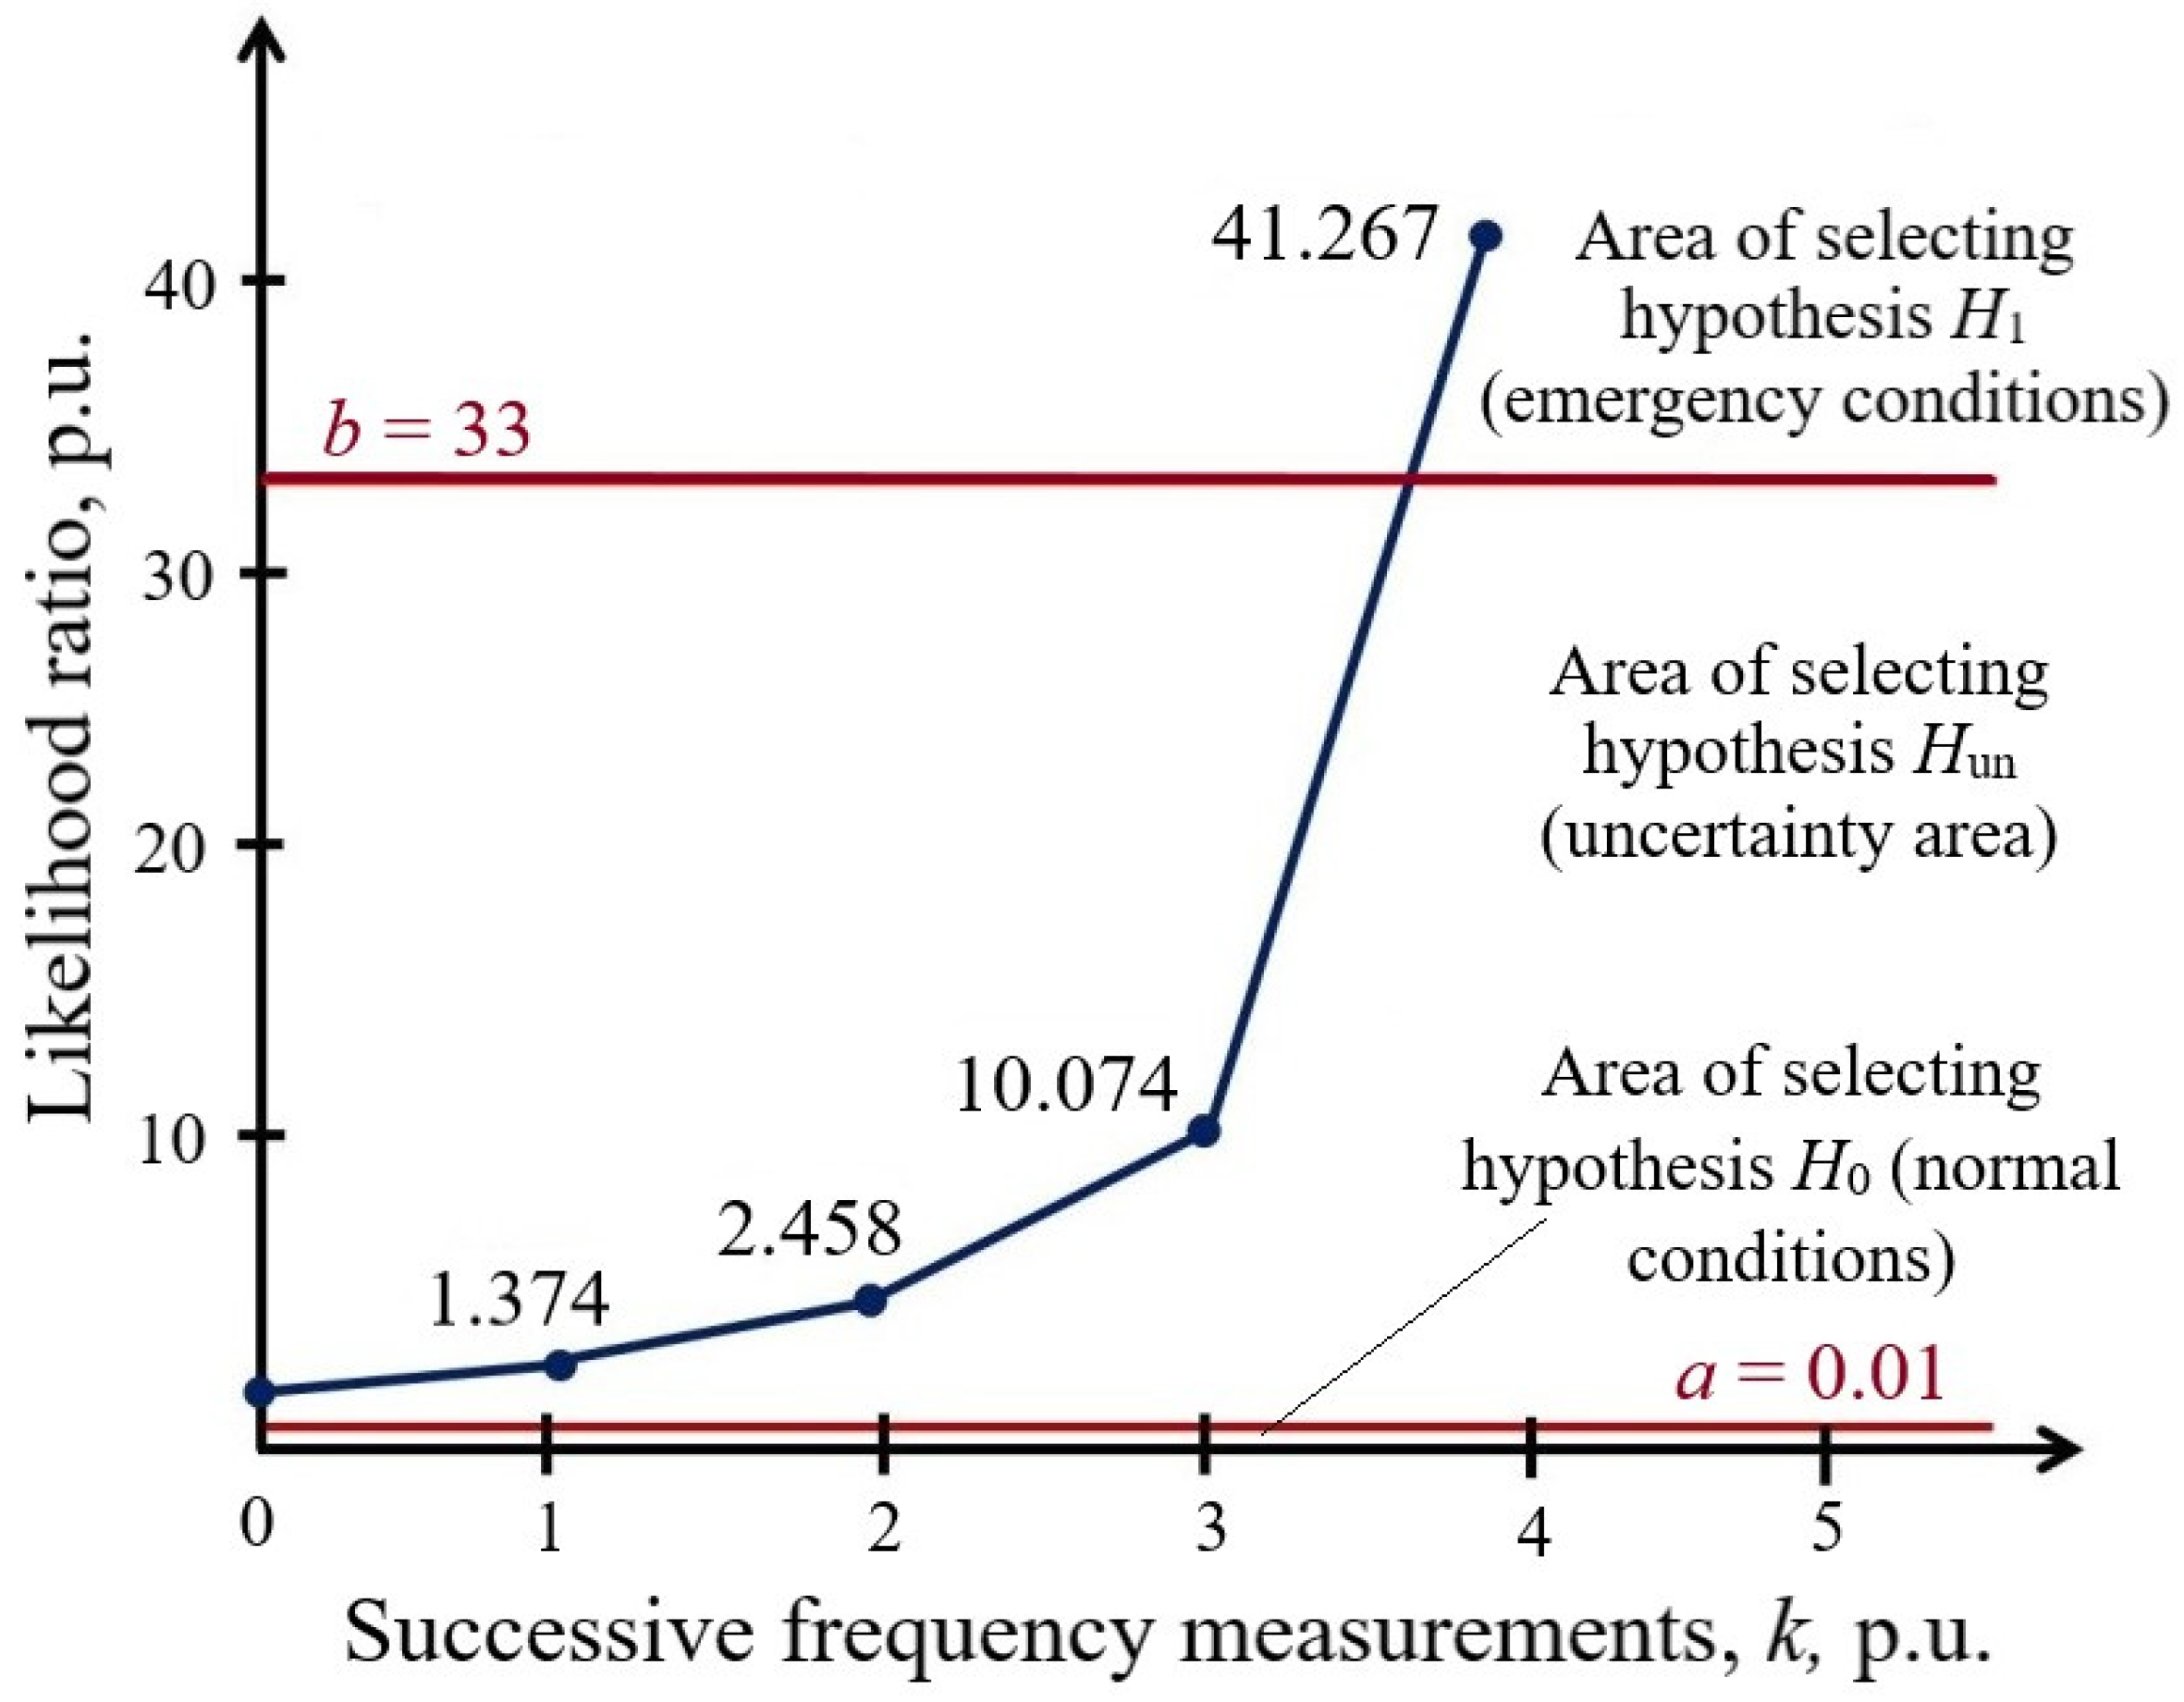
4. The Use of WSPRT in Automatic Frequency Load Shedding Devices

AFLS devices are known to be designed to prevent the occurrence and development of a frequency and voltage avalanche in power systems and to accelerate the process of restoring operating parameters to normal values acceptable for post-accident conditions.
The AFLS devices are the most widely used devices in power systems, including active distribution networks. The connection of DG facilities can cause the malfunction of these devices, since typical devices do not have the technical capabilities to identify operating regions and adapt the operation algorithm to the current operating conditions [43].
The adaptation of the operation algorithm to the current operating conditions involves choosing the types and sizes of control actions to be implemented by the control device in an active distribution network. The incorrect identification of the operating regions by the AFLS device will lead to the wrong choice of types and sizes of control actions. As a result, the conditions for the existence of the operating state will be violated, which will cause the shutdown of all GUs at the DG fuel facility, the RES-based generation facility, and all electrical loads. Thus, standard AFLS devices will not only fail to prevent the development of accidents but will also aggravate their consequences.
With a decrease in frequency in electromechanical transients, large errors in frequency estimation are observed due to the non-sinusoidal currents and voltages. This can lead to the misoperation of the AFLS device and excessive load shedding. To prevent such a development, it is important to design a high-speed AFLS algorithm capable of making decisions with minimal errors about load disconnection in the case of considerable errors in frequency estimation. We will implement the decision-making algorithm of the AFLS device using WSPRT.
Let us consider the simplest option of solving the problem of operating region identification by successively testing hypotheses of frequency values in a portion of an active distribution network. One of three hypotheses will be accepted for each measured frequency value:
  • H0—frequency corresponds to the normal operating conditions;
  • H1—frequency corresponds to the emergency operating conditions;
  • Hun—it is not possible to unambiguously determine whether the frequency belongs to emergency or normal operating conditions, frequency measurements are continued, and additional identification is performed based on the measurements.
The hypotheses are evaluated sequentially. Based on the results of the first observation, one of the three indicated decisions is made. If the first or second decision is made, the evaluation ends. The experiment continues if the third decision is made. Then, based on the two observations obtained, one of the three decisions is made likewise. If the third decision is made again, the test continues further.
The operation of the algorithm requires that the preliminary calculations of electromechanical transients be implemented based on the results of frequency measurements in all operating conditions of the part of the considered active distribution network. The calculation results are used to build the corresponding statistical frequency distributions (Figure 3), where the curve located on the right (red color) corresponds to the distribution for the normal conditions (hypothesis H0), and that on the left (blue color) corresponds to the distribution for the emergency conditions (H1).
For the example presented in Figure 3, we assume that the mathematical mean (expectation) of the frequency in the normal operating conditions is mf0 = 50 Hz and in emergency conditions, mf1 = 48.5 Hz. The laws of frequency distributions (Figure 3) will be considered Gaussian with standard deviations σf0 and σf1. Numerical values of σf0 and σf1 are determined by simulation data. Based on the first frequency value obtained, the likelihood ratio is calculated:
η x 1 = p x 1 | m f 1 , σ f 1   p x 1 | m f 0 ,   σ f 0 = e x 1 m f 1 2 / 2 σ f 1 2 e x 1 m f 0 2 / 2 σ f 0 2 = e 0.5 x 1 m f 1 2 / σ f 1 2 + x 1 m f 0 2 / σ f 0 2 .
At k frequency measurements, the likelihood ratio takes the form:
i = 1 k ŋ x i = p x 1 | m f 1 , σ f 1   p x k | m f 1 , σ f 1 p x 1 | m f 0 , σ f 0   p x k | m f 0 , σ f 0 = i = 1 k e 0.5 x i m f 1 2 σ f 1 2 + x i m f 0 2 σ f 0 2 .
Since the required number of frequency measurements depends on the nature of the electromechanical transient process and corresponding errors in the frequency estimates, this number is generally a random variable. The operating conditions are identified by the likelihood ratio with the following hypotheses accepted:
H 1 ,   if   i = 1 k ŋ x i > b ;  
H 0 ,   if   i = 1 k ŋ x i a ;    
H un ,   if   a i = 1 k ŋ x i < b .    
To set the setpoints a and b when using WSPRT, we determine the errors of the first α second β kind. Herein, α is the probability of a wrong choice for hypothesis H0, and β is the probability of a wrong choice for hypothesis H1. The values of setpoints a and b for the selection of hypotheses are calculated using the expressions:
a = α 1 β   , b = 1 α β .  
Assume the values of errors of the first and second kind are equal to α = 0.01; β = 0.03 based on expert estimates. Then the values of setpoints a and b will have the following values:
a = 0.01 1 0.03 = 0.01 , b = 1 0.01 0.03 = 33 .
For the AFLS device, a block diagram was developed for the logic block to determine frequency deviations (Figure 4).
Let there be several successive frequency measurements corresponding to the simulated topology and operating conditions: x1 = 48.9 Hz; x2 = 48.8 Hz; x3 = 48.5 Hz; x4 = 48.5 Hz. According to the indicated successive samples, a decision is made about the existence of normal or emergency operating conditions.
Calculate the likelihood ratio for the first value of frequency x1 = 48.9 Hz using expressions (1) and (2):
η x 1 = 1.374 ;   i = 1 1 ŋ x i = 1.374
Since the likelihood ratio is in the area of uncertainty
a = 0.01 < i = 1 1 ŋ x i = 1.374 < b = 33 ,
we assume hypothesis Hun and the frequency measurement process continues.
For the second value of frequency x2 = 48.8 Hz, we obtain:
η x 2 = 1.789 ;   i = 1 2 ŋ x i = 2.458 .
For the second sequential measurement, the likelihood ratio is also in the uncertainty area
a = 0.01 < i = 1 2 ŋ x i = 2.458 < b = 33 ,
therefore, further frequency measurements are required to use WSPRT.
Calculations for the third frequency value x3 = 48.5 Hz yield the following values:
η x 3 = 4.098 ;   i = 1 3 ŋ x i = 10.074 .
The results obtained also generate the need to continue calculations, since
a = 0.01 < i = 1 3 ŋ x i = 10.074 < b = 33 .
The final decision is formed in the fourth step of the WSPRT, which corresponds to the frequency measurement x4 = 48.5 Hz, where:
η x 4 = 4.098 ;   i = 1 4 ŋ x i = 41.267 ;
a = 0.01 < i = 1 4 ŋ x i = 41.267 < b = 33 .
Since the product of the likelihood ratios exceeds the trip setting i = 1 4 ŋ x i = 41.267 < b = 33 ,   then the logic unit of the AFLS device makes a decision about the emergency conditions in the considered portion of the distribution network.
The block diagram of the step-by-step decision-making algorithm in the logical block of the AFLS based on the WSPRT is shown in Figure 5.
The decision-making process in the logic block for determining frequency deviations of the AFLS device with the aid of WSPRT is illustrated in Figure 6.
Analysis of Figure 6 indicates that four frequency measurements and, accordingly, four calculated values of the likelihood ratio were required for the logic block of the AFLS device to make a decision. To implement the developed method using WSPRT, the logic block for identifying frequency deviations of the AFLS device requires only simulation data expressed in statistical frequency distributions for normal and emergency conditions and current sequential frequency measurements.
The negligible decision-making delay needed to implement the WSPRT has little to no effect on the overall performance of the AFLS device. This is caused by the high sampling rate of current and voltage signals and is generally determined by the given errors of the first α and second β kind. With a sampling rate that complies with the IEC 61850 standard, this delay is typically less than 1 ms.
The modified WSPRT can be implemented in the logic block for determining frequency deviations of the AFLS device to further improve the response speed [44,45,46].

5. The Use of WSPRT in Automatic Transformer Disconnect Switches

In the case of power transformers operating with a low load factor, the total no-load losses increase. To reduce the losses, it is necessary to increase the load factor of power transformers by tripping one of the two underloaded ones. This problem is solved by using automatic transformer disconnect switches (ATDSs), which monitor and identify the load curve trends [47].
As operating experience shows, in some periods of time it is advisable to switch power transformers to reduce active power losses, provided the requirements for the reliability of power supply to consumers are met [48].
To identify the load curve trends, it is appropriate to use WSPRT in ATDSs. The main components of the simplest system for load curve trend identification are shown in Figure 7 [49].
At any arbitrary monitoring time t for the load curve R(t), there are three hypotheses for the state estimation of this load:
Hypothesis H1 is the event wherein the load R(t) belongs to a downtrend during the next specified period of time τ;
Hypothesis H0 is the event wherein the load R(t) belongs to an uptrend during the nearest specified period of time τ;
Hypothesis Hun is an event of uncertainty (“I don’t know”), i.e., according to the observed conditions R(t), it is impossible to determine whether it belongs to either a downward trend or an upward trend of the load curve during the next specified period of time τ. It is necessary to perform at least one more observation R(t+Δt) to choose one of the hypotheses H1 or H0.
The decision-making procedure consists of a certain random number of steps, N, and requires the time (NΔt). One out of the three hypotheses is selected at each i-th step according to the rule:
Hypothesis   H 1   is   selected   if   n = 1 , i Λ R n > b Hypothesis   H 0   is   selected   if   n = 1 , i Λ R n a Hypothesis   H un   is   selected   if   a < n = 1 , i Λ R n b
where Λ(R) is the likelihood ratio, which is determined by the equality:
Λ R = p H 1 ( R | H 1 )   p H 0 ( R | H 0 ) ,  
where pH0(R|H0) is the given density of the probability that the observation R matches hypothesis H0, and pH1(R|H1) is the given density of the probability that the observation R matches hypothesis H1, and
Z p H 0 R | H 0 d R = 1 ;   Z p H 1 R | H 1 d R = 1
The thresholds in the comparison procedure (4) are set as follows: a is the lower threshold, and b is the upper threshold.
a = P M 1 P F ;   b = 1 P M P F
where PM is the given probability of the wrong selection of hypothesis H0, and PF is the given probability of the wrong selection of hypothesis H1.
After either hypothesis, H0 or H1 is selected, and the i-th step becomes the last one: N = i.
The initial information here is only the error probabilities PM, PF and the probability density functions pH0(R|H0) and pH1(R|H1). Neither costs, nor prior probabilities, nor any other information is involved in the decision-making. This markedly simplifies the practical use of WSPRT and is its important advantage.
Consider an example of using WSPRT for the simplest case of one-dimensional observation space Z (Figure 8a). Let the necessary initial data be given:
  • distribution density function pH0(R|H0) on the interval [0; 0.6] and distribution density function pH1(R|H1) on the interval [0.5; 1.2];
  • the error probability PM = 0.1 and the error probability PF = 0.01 (probability values are taken based on expert estimates).
Then the thresholds a and b, according to (7), will take the values:
a = P M 1 P F = 0.1 1 0.01 = 0.101 ;   b = 1 P M P F = 1 0.1 0.01 = 90 .
Let a series of three consecutive observations of the operating conditions (Figure 7a) look like this: R1 = R(t) = 0.52 p.u.; R2 = R(t + Δt) = 0.55 p.u.; R3 = R(t +t) = 0.57 p.u.
Let us make the first step of selecting hypotheses for observation R1 = R(t) = 0.52 p.u.: i = 1.
n = 1 , i Λ R n = Λ R 1 = p H 1 R | H 1   p H 0 R | H 0 = 0.85 1.7 = 0.5 .
According to condition (4), hypothesis Hun (“do not know”) is chosen:
a = 0.101 < n = 1 , i Λ R n = 0.5 b = 90 .
Let us perform the second step of selecting hypotheses for observation R2 = R(t + Δt) = 0.55 p.u.:
Λ R 2 = p H 1 R | H 1 p H 0 R | H 0 = 0.7 1.5 = 0.466 ;   n = 1 , i Λ R n = Λ R 1 Λ R 2 = 0.5 · 0.466 = 0.233 .
According to condition (4), hypothesis Hun is re-selected:
a = 0.101 < n = 1 , i Λ R n = 0.233 b = 90 .
Let us make the third step of selecting the hypotheses for observation R3 = R(t + 2Δt) = 0.57 p.u.:
Λ R 3 = p H 1 R | H 1 p H 0 R | H 0 = 0.35 1.6 = 0.218 ,  
n = 1 , i Λ R n = Λ R 1 Λ R 2 Λ R 3 = 0.233 · 0.218 = 0.051 .
According to condition (4), hypothesis H0 is chosen (the event belongs to an uptrend):
n = 1 , i Λ R n = 0.051 a = 0.101 .
The selection of hypotheses and decision-making are completed in the third step—N = 3 (Figure 8b).
If at least one observation Ri appeared not in the area of intersection of distribution laws [0.5; 0.6], then this would lead to an unambiguous completion of the decision making:
  • if Ri < 0.5, then Λ(Ri) = 0, and the hypothesis H0 is selected unambiguously (an increase in the load of the power transformer),
  • if Ri > 0.6, then Λ(Ri) = ∞, and the hypothesis H1 is selected unambiguously (a reduction in the load of the power transformer).
The principle of using WSPRT for multidimensional observations is totally similar to the example given for one-dimensional observation.
The developed algorithm for identifying the load curve trend with the help of WSPRT, which is employed to reduce losses in power transformers, can be implemented in any intelligent electronic device with freely programmable logic. This device must be equipped with data communication system complying with the IEC 61850 standard.

6. The Use of WSPRT in Devices for Automatic Control of Power Quality Indices

As noted earlier, along with RES-based generation, process lines of industrial enterprises are connected to distribution networks, which are sensitive to deviations of power quality indices (PQIs) from the standard values [50]. A simultaneous deviation of several PQIs, which is often observed, can lead to irreversible deviations in process parameters and the disruption of the production process. This causes losses due to rejected products and underproduction. It takes a lot of time for some industrial enterprises to remove the defected products, prepare production lines for restart, switch electrical loads in series, and control and regulate process parameters [51].
In order to bring legal claims against the owners of distribution networks, that are responsible to industrial consumers for power quality on the buses, the latter adopt cutting-edge PQI monitoring systems, which integrate several PQI monitoring devices.
Depending on the power supply diagram of an industrial enterprise and its financial capabilities, both continuous and selective PQI control systems are introduced. With continuous monitoring based on the measurements, all PQIs are calculated at each moment of time at all points of connection of the industrial enterprise to the distribution network. In the case of selective control in predetermined time intervals and at selected control points, only the PQIs that are critical for the process lines of the industrial enterprise are calculated [46].
We propose using WSPRT to implement the PQI control. PQIs will be controlled on an interval, which includes N samples of current (voltage) signals. Denote by mj (0 ≤ mjN, j = 1, 2, …, k) the number of deviations for the j-th PQI and set a random k—dimensional vector m = (m1, ..., mj, …, mk). Let component mj be distributed according to the binomial law with parameters n and qj, where qj is the probability of a deviation of the power quality index mj from the normalized value based on an expert estimate. The provided individual PQIs are independent from each other, and the law of distribution of vector m takes the form
P n m = j = 1 k C n m j q j m j 1 q j n m j .
Probability assessment qj for a specific industrial enterprise can be obtained relying on the results of simulation modeling or monitoring of the PQIs in various topology and operating conditions of the distribution network over a long time interval.
Let us introduce a generalized PQI in the form
ξ = j = 1 k c j m j ,
where c = (c1, ..., cj, ..., ck)T is a column vector of weighting coefficients, which determines the relationship between losses and power quality violation in the case of individual PQI deviation.
The simultaneous deviation of several PQIs from the standard values is recorded according to the estimate of the mathematical mean mξ of a random value ξ [52]. In the general case, the values of the random variable ξ can differ from each other at each moment of time, but the variance of deviations σξ2 is a known value, and the mathematical mean mξ on the analyzed time interval is unknown.
For the WSPRT-based control of a generalized PQI, we set such values of mξ0 and mξ1 (mξ0 < mξsp и mξ1 > mξsp) at which the decision on the compliance of the PQI with the normative values is taken in terms of risk (losses). If mξmξ0, then an erroneous decision on the non-compliance of power quality is related to the so-called “risk of supplier” (owner of distribution networks), whereas making a decision on the compliance of the power quality, if mξ > mξ1, is associated with the “risk of the industrial consumer.” The area for which mξ [mξ0; mξ1] is an uncertainty area.
Let ξ1, ξ2, … be a sequence of the instantaneous values of an observed magnitude ξ, characterizing the power quality on the busbars of an industrial enterprise. The probability density of sampling ξ1, ξ2, …, ξm, if mξ = mξ0, corresponds to the expression:
p 0   m = 2 π σ 2 m 2 e i = 1 m ξ i m ξ 0 2 / 2 σ 2 .
and, if mξ = mξ1, to the expression:
p 1   m = 2 π σ 2 m 2 e i = 1 m ξ i m ξ 1 2 / 2 σ 2 .  
The WSPRT-based control of a generalized PQI involves the calculation of the likelihood ratio at each step by the equality:
ŋ m = p 1 m p 0 m
Step-by-step calculations are implemented as long as the conditions are met
B < ŋ m = e i = 1 m ξ i m ξ 1 2 / 2 σ 2 e i = 1 m ξ i m ξ 0 2 / 2 σ 2 < A ,
where A and B are the values of setpoints like Equation (3) and are calculated by Equation (16).
The WSPRT-based control of a generalized PQI ends with a decision on its deviation from the normalized value if:
ŋ m = e i = 1 m ξ i m ξ 1 2 / 2 σ 2 e i = 1 m ξ i m ξ 0 2 / 2 σ 2 A
and on the belonging of the generalized PQI value to the permissible range of deviations in the event that:
ŋ m = e i = 1 m ξ i m ξ 1 2 / 2 σ 2 e i = 1 m ξ i m ξ 0 2 / 2 σ 2 B
Setpoints A and B are determined by the expressions
A = 1 β α ;   B = β 1 α
A = 1 β α ; B = β 1 α . By finding the logarithm of expressions (13)—(15) and transforming them, we obtain:
ln β 1 α < m ξ 1 m ξ 0 σ 2 · i = 1 m ξ i + m · m ξ 0 2 m ξ 1 2 2 σ 2 < ln 1 β α
m ξ 1 m ξ 0 σ 2 · i = 1 m ξ i + m · m ξ 0 2 m ξ 1 2 2 σ 2 ln β 1 α
m ξ 1 m ξ 0 σ 2 · i = 1 m ξ i + m · m ξ 0 2 m ξ 1 2 2 σ 2 ln 1 β α
Adding the term m · m ξ 0 2 m ξ 1 2 2 σ 2 to both sides of the inequalities and dividing by m ξ 1 m ξ 0 σ 2 , we obtain the relations:
σ 2 m ξ 1 m ξ 0   l n β 1 α + m · m ξ 1 + m ξ 0 2 < i = 1 m ξ i < σ 2 m ξ 1 m ξ 0 ln 1 β α + m · m ξ 1 + m ξ 0 2
i = 1 m ξ i < σ 2 m ξ 1 m ξ 0 ln β 1 α + m · m ξ 1 + m ξ 0 2
i = 1 m ξ i < σ 2 m ξ 1 m ξ 0 ln 1 β α + m · m ξ 1 + m ξ 0 2
Inequalities (20)–(22) make it possible to implement the generalized PQI control using “acceptance” numbers. The “acceptance” number is calculated for each step m of WSPRT by the expression
a m = σ 2 m ξ 1 m ξ 0 ln β 1 α + m · m ξ 1 + m ξ 0 2
and the “rejection” number is calculated using the expression
b m = σ 2 m ξ 1 m ξ 0 ln 1 β α + m · m ξ 1 + m ξ 0 2
The numbers (dependences a(m), b(m)) are calculated in advance and used as setpoints. The WSPRT procedure is executed until the inequalities are satisfied:
a m < i = 1 m ξ i < b m
When the sum i = 1 m ξ i goes beyond the interval [a(m), b(m)], a decision is made regarding the admissibility or inadmissibility of the generalized PQI deviation from the standard value.
Figure 9 illustrates the process of the WSPRT-based control of the generalized PQI. Points (m, i = 1 m ξ i ) characterizing the decision-making process are plotted on the graph. Coefficient s, which determines the angle of inclination of the setting limits a(m) and b(m), corresponds to the expression:
s = (mξ1 + mξ0)/2.
An area between the setpoints on the interval [a(m), b(m)] is the area of uncertainty, in which further measurements of operating parameters and the calculation of the generalized PQI are required.
The analysis of Figure 9 indicates that the process of the control of the generalized PQI in the PQI control device ends at step m = 7. At this moment, an unambiguous decision is made about the non-compliance of the generalized PQI with the standard value. The use of WSPRT in the PQI control device boosts the speed of the algorithm of making a decision on the value of the generalized PQI deviation (up to three times) compared to the option of using a fixed sample.

7. Discussion of Results

Separate portions of the distribution network with DG fuel facilities and RES-based generation facilities can be switched to the islanded mode of operation if the power transmission line connecting them with the power system is tripped. Tripping can occur because of a short circuit, a voltage dip, or for any other reason, for example, due to human error.
In the case that there is no voltage dip at the time of changeover to the islanded mode of operation, it is normally possible to provide a balance of active and reactive power in the portion of the distribution network. This is carried out by emergency and operation control devices installed at the DG fuel facilities and in the distribution network.
If, however, some part of the distribution network is switched to the islanded mode of operation as a result of a short circuit, or in the islanded mode, the shutdown of one or more GUs at the DG fuel facility occurs due to a short circuit, then the consequences will be more severe. A short circuit causes a rapid braking of induction motors, which leads to a sharp increase in the reactive load consumed by them and a decrease in voltage.
Given that the speed of electromechanical transient processes in the islanded mode of operation of active distribution networks grows dramatically, due to the small values of the mechanical inertia constants of GUs, the requirements for the speed of power systems automation devices increase. Time delays in the response of AFLS devices lead to the voltage avalanche, with the complete shutdown of part of the distribution network.
Typical automation devices in power systems, which include devices for emergency control and power flow control, as well as electric automation, do not have the technical capabilities to identify operating regions and adapt operation algorithms to the current operating conditions. Passive distribution networks did not require this since there was unambiguous decision-making based on the measured operating parameters. In active distribution networks, this is a necessity, which requires changes in the logic blocks of the typical automation devices used in power systems.
The use of WSPRT in the logic block of automation devices is advisable to correctly identify operating regions. A slight delay in making a decision virtually does not affect the overall performance of the AFLS device (which is due to the high sampling rate of current and voltage signals) and, as a rule, does not exceed 1 ms.
The use of WSPRT in automation devices of power systems allows the following:
  • in AFLS devices, reliable identification of operating regions under large frequency measurement errors and PQI deviations from the standard values; and an increase in the speed of decision-making by eliminating the response delay to provide successful active power balancing in the distribution network;
  • in ATD devices, the reliable identification of a load curve trend based on a minimum amount of initial information to make a decision to disconnect one of the two operating power transformers in order to reduce losses in distribution networks;
  • in PQI control devices, an increase in the speed of the algorithm for making a decision on the generalized PQI deviation (up to three times), compared to the option of a fixed sample, to prevent shutdowns of process lines at industrial enterprises.

8. Conclusions

Typical automation devices employed in power systems do not normally have the technical capabilities to identify operating regions or adapt operation algorithms to the current operating conditions.
Delays in the response of automation devices, when they operate in active distribution networks with DG- and RES-based generation facilities, do not meet the requirements for speed of response. When triggered with delays, the automation devices not only fail to prevent the development of accidents but even exacerbate their consequences.
The developed method of using WSPRT in frequency load shedding devices makes it possible to ensure the reliable identification of operating regions in the case of large frequency measurement errors and PQI deviations from the standard values, as well as to boost the speed of decision-making by eliminating the delay in operation.
The proposed method of using WSPRT in devices for automatic transformer disconnection provides the reliable identification of the load curve trend with a minimum amount of initial information to make a decision to turn off one of the two operating power transformers in order to reduce losses in distribution networks.
The introduced method of using WSPRT in PQI control devices allows boosting the speed of the algorithm of making a decision on the generalized PQI deviation (up to three times) compared to the option of a fixed sample used.
In the context of the decentralization of generating capacities, the use of WSPRT in the logic blocks of automation devices operating in power systems ensures the reliable identification of operating regions and the adaptation of operation algorithms to the current operating conditions. Increasing the response time of the automation devices enables a reliable power supply for the process lines of industrial enterprises.

Author Contributions

Conceptualization, A.K. and P.I.; methodology, S.F. and K.S.; software, A.L.; validation, K.S.; formal analysis, A.L.; investigation, P.I., K.S. and A.L.; resources, S.F.; data curation, K.S. and A.L.; writing—original draft preparation, A.K. and P.I.; writing—review and editing, S.F. and K.S.; visualization, A.L.; supervision, A.K.; project administration, P.I.; funding acquisition, S.F. All authors have read and agreed to the published version of the manuscript.

Funding

This research received no external funding.

Data Availability Statement

Data sharing not applicable. No new data were created or analyzed in this study. Data sharing is not applicable to this article.

Conflicts of Interest

The funders had no role in the design of the study; in the collection, analyses, or interpretation of data; in the writing of the manuscript, or in the decision to publish the results.

Abbreviation

WSPRTWald sequential probability ratio test
DGdistributed generation
GUgenerating unit
RESrenewable energy sources
AFLSautomatic frequency load shedding
GRUgas-reciprocating units
PVPphotovoltaic power plant
IMinduction motor
ATDSautomatic transformer disconnects switches
SSsubstation
PTpower transformer
IPBinfinite power buses
CTcurrent transformer
VTvoltage transformer
PQIspower quality indices
H0hypothesis “normal mode”
H1hypothesis “emergency mode”
Hunhypothesis “ I don’t know “
η x i likelihood ratio
αprobability of wrong choice of hypothesis H0
βprobability of wrong choice of hypothesis H1.
a (or A) and b (or B)setpoints
Λ(R)likelihood ratio
PMgiven probability of wrong selection of hypothesis H0
PFgiven probability of wrong selection of hypothesis H1
qjthe probability of a deviation of the power quality index mj from the normalized value based on expert estimate
ξ generalized PQI
a (m)“acceptance” number
b (m)“rejection” number

References

  1. Dong, F.; Qin, C.; Zhang, X.; Zhao, X.; Pan, Y.; Gao, Y.; Zhu, J.; Li, Y. Towards carbon neutrality: The impact of renewable energy development on carbon emission efficiency. Int. J. Environ. Res. Public Health 2021, 18, 13284. [Google Scholar] [CrossRef]
  2. Zhang, H. Technology innovation, economic growth and carbon emissions in the context of carbon neutrality: Evidence from BRICS. Sustainability 2021, 13, 11138. [Google Scholar] [CrossRef]
  3. Lin, J.; Shen, Y.; Li, X.; Hasnaoui, A. BRICS carbon neutrality target: Measuring the impact of electricity production from renewable energy sources and globalization. J. Environ. Manag. 2021, 298, 113460. [Google Scholar]
  4. Burkov, A.F.; Van Kha, N.; Mikhanoshin, V.V. Energy losses in electrical networks. In Proceedings of the 7th International Conference on Industrial Engineering (ICIE), Sochi, Russia, 18–21 May 2021; pp. 384–393. [Google Scholar]
  5. Syranov, D.V.; Kovalnogov, V.N.; Zolotov, A.N. Modeling, research and optimization of heat losses during transport in energy systems. In Proceedings of the 2nd International Conference on Industrial Engineering, Applications and Manufacturing (ICIEAM), Chelyabinsk, Russia, 19–20 May 2016; p. 7911654. [Google Scholar]
  6. Henckens, M.L.C.M. The Energy Transition and Energy Equity: A Compatible Combination? Sustainability 2022, 14, 4781. [Google Scholar] [CrossRef]
  7. Xu, J.; Liu, T. Technological Paradigm-Based Approaches Towards Challenges and Policy Shifts for Sustainable Wind Energy Development. Energy Policy 2020, 142, 111538. [Google Scholar] [CrossRef]
  8. Senthil, R. Recent Innovations in Solar Energy Education and Research Towards Sustainable Energy Development. Acta Innov. 2022, 42, 27–49. [Google Scholar] [CrossRef]
  9. Praiselin, W.J.; Edward, J.B. A review on impacts of power quality, control and optimization strategies of integration of renewable energy based microgrid operation. Int. J. Intell. Syst. Appl. 2018, 10, 67–81. [Google Scholar] [CrossRef] [Green Version]
  10. Ilyushin, P.; Kulikov, A.; Suslov, K.; Filippov, S. Consideration of Distinguishing Design Features of Gas-Turbine and Gas-Reciprocating Units in Design of Emergency Control Systems. Machines 2021, 9, 47. [Google Scholar] [CrossRef]
  11. Zakharov, A. ORC Plants Application for Secondary Energy Resources Recycling in Oil and Gas Sector Enterprises. In Proceedings of the World Petroleum Congress Proceedings. Cep. “21st World Petroleum Congress 2014: Responsibly Energizing a Growing World, WPC 2014”, Moscow, Russia, 15–19 June 2014; pp. 4197–4207. [Google Scholar]
  12. Abashidze, A.K.; Solntsev, A.M.; Akshalova, R.D. Climate Change Mitigation and Renewable Energy Sources: International Legal Issues. Lect. Notes Netw. Syst. 2020, 129, 1068–1075. [Google Scholar]
  13. Balouji, E.; Salor, O. Classification of Power Quality Events Using Deep Learning on Event Images. In Proceedings of the 3rd International Conference on Pattern Recognition and Image Analysis (IPRIA), Shahrekord, Iran, 19–20 April 2017. [Google Scholar] [CrossRef]
  14. Bagheri, A.; Bollen, M.H.J.; Gu, I.Y.H. Improved characterization of multistage voltage dips based on the space phasor model. Electr. Power Syst. Res. 2018, 154, 319–328. [Google Scholar] [CrossRef]
  15. Willis, K.G.; Garrod, G.D. Electricity Supply Reliability—Estimating the Value of Lost Load. Energy Policy 1997, 25, 97–103. [Google Scholar] [CrossRef]
  16. Khismatullin, A.S.; Bashirov, M.G. Methods of Improving the Power Supply Reliability of Industrial Site. In IOP Conference Series: Materials Science and Engineering, Proceedings of the III International Scientific Conference: Modernization, Innovations, Progress: Advanced Technologies in Material Science, Mechanical and Automation Engineering (MIP-III 2021), Krasnoyarsk, Russia, 29–30 April 2021; IOP Publishing Ltd: Wales, UK, 2021; Volume 1155, p. 012067. [Google Scholar]
  17. Ilyushin, P.V.; Pazderin, A.V. Approaches to organization of emergency control at isolated operation of energy areas with distributed generation. In Proceedings of the International Ural Conference on Green Energy, Chelyabinsk, Russia, 4–6 October 2018. [Google Scholar] [CrossRef]
  18. Gnatyuk, V.I.; Kivchun, O.R.; Lutsenko, D.V. Digital platform for management of the regional power grid consumption. In Proceedings of the IOP Conference Series: Earth and Environmental Science. Cep. «Germany and Russia: Ecosystems Without Borders», Kaliningrad, Russia, 5–10 October 2020; p. 689. [Google Scholar]
  19. Ilyushin, P.V. Emergency and post-emergency control in the formation of micro-grids. In Proceedings of the Methodological Problems in Reliability Study of Large Energy Systems (RSES), E3S Web of Conferences, Bishkek, Kyrgyzstan, 11–15 September 2017; Volume 25, p. 2002. [Google Scholar]
  20. Ilyushin, P.V.; Pazderin, A.V. Requirements for power stations islanding automation an influence of power grid parameters and loads. In Proceedings of the 2018 International Conference on Industrial Engineering, Applications and Manufacturing (ICIEAM), Moscow, Russia, 15–18 May 2018. [Google Scholar]
  21. Wald, A. Sequential Analysis; John Wiley & Sons, Inc.: New York, NY, USA, 1947; p. 224. [Google Scholar]
  22. Orlov, A.I. Theory of Decision–Making: Textbook; Publishing House: "Science of Russia": Moscow, Russia, 2004; p. 656. (In Russian) [Google Scholar]
  23. Labsker, L.G. Geometric solution of the problem of synthesis by the Wald–Savage criterion and application to the optimal choice of the technological method of production. Fundam. Res. 2020, 5, 112–116. (In Russian) [Google Scholar]
  24. Grigoriev, M.A.; Reifeld, M.A. Detection of a seismically active object in the field of the placement of a security system using a sequential Wald criterion. Autometry 2016, 52, 53–61. (In Russian) [Google Scholar]
  25. Illarionov, B.V.; Karavaev, M.A.; Maleev, D.S. Comparative analysis of signal search procedures under conditions of a priori uncertainty of their parameters according to the Neumann-Pearson and Wald criteria. Aerosp. Forces. Theory Pract. 2021, 19, 243–254. (In Russian) [Google Scholar]
  26. Caesarendra, W.; Tjahjowidodo, T.; Kosasih, B.; Tieu, A.K. Integrated Condition Monitoring and Prognosis Method for Incipient Defect Detection and Remaining Life Prediction of Low Speed Slew Bearings. Machines 2017, 5, 11. [Google Scholar] [CrossRef] [Green Version]
  27. Gorbatkov, S.A.; Biryukov, A.N.; Kasimova, L.I. Multistage method of analysis and management adequacy of the neural network model of bankruptcy forecasting based on the consistent Wald principle. Online J. Sci. Stud. 2015, 7, 1–14. (In Russian) [Google Scholar]
  28. Gorsky, M.A. Choosing an investor’s portfolio using the Wald-Savage criterion. In General Question of World Science. Collection of Scientific Papers on Materials VIII International Scientific Conference; Publishing House: "Science of Russia": Moscow, Russia, 2019; pp. 62–70. (In Russian) [Google Scholar]
  29. Labsker, L.G.; Yaschenko, N.A.; Amelina, A.V. Formation of the priority order of lending by the bank to corporate borrowers according to the synthetic Wald-Savage criterion. Financ. Credit. 2012, 38, 31–41. (In Russian) [Google Scholar]
  30. Altman, D.G.; Machin, D.; Bryant, T.N.; Gardner, M.J. Statistics with Confidence, 2nd ed.; BMJ Books: London, UK, 2000; p. 254. [Google Scholar]
  31. Griner, P.F.; Mayewski, R.J.; Mushlin, A.I.; Greenland, P. Selection and interpretation of diagnostic tests and procedures. Ann. Intern. Med. 1981, 94, 555–600. [Google Scholar]
  32. Korneenkov, A.A.; Lilenko, S.V.; Lilenko, A.S.; Vyazemskaya, E.E.; Bakhilin, V.M. Using a modified procedure for sequential recognition of Wald to determine the outcome of surgical treatment in patients with Meniere’s disease. Russ. Otorhinolaryngol. 2018, 3, 4–59. (In Russian) [Google Scholar]
  33. Sagadeeva, E.F.; Filippova, K.O. Application of the Wald criterion in agriculture. In Collection of Scientific Articles of Bashkir State Agrarian University; Publishing House LLC "Polygraph Design": Ufa, Russia, 2018; pp. 58–59. (In Russian) [Google Scholar]
  34. Díaz-Padilla, G.; López-Arroyo, J.; Guajardo-Panes, R. Spatial Distribution and Development of Sequential Sampling Plans for Diaphorina citri Kuwayama (Hemiptera: Liviidae). Agronomy 2021, 11, 1434. [Google Scholar] [CrossRef]
  35. Sakaguchi, T. A statistical decision theoretic approach to digital relaying. IEEE Trans. Power Appar. Syst. 1980, PAS-99, 1918–1926. [Google Scholar] [CrossRef]
  36. Li, X.R.; Wang, L. Fault detection using sequential probability ratio test. In Proceedings of the IEEE Power Engineering Society. 1999 Winter Meeting (Cat. No.99CH36233), New York, NY, USA, 31 January–4 February 1999. [Google Scholar] [CrossRef]
  37. Girgis, A.A. A New Kalman Filtering Based Digital Distance Relay. IEEE Trans. Power Appar. Syst. 1982, PAS-101, 3471–3480. [Google Scholar] [CrossRef]
  38. Rebizant, W.; Szafran, J. Power system fault detection and classification using probabilistic approach. Eur. Trans. Electr. Power 1999, 9, 183–191. [Google Scholar] [CrossRef]
  39. Davarifar, M.; Rabhi, A.; Hajjaji, A.; Daneshifar, Z. Real-time diagnosis of PV system by using the Sequential Probability Ratio Test (SPRT). In Proceedings of the IEEE Trans on PEMC, Antalya, Turkey, 21–24 September 2014; pp. 508–513. [Google Scholar]
  40. Sohn, H.; Allen, D.W.; Worden, K.; Farrar, C.R. Statistical damage classification using sequential probability ratio tests. Struct. Health Monit. 2003, 2, 57–74. [Google Scholar] [CrossRef] [Green Version]
  41. Reynolds, M.R.; Stoumbos, Z.G. The SPRT chart for monitoring a proportion. IIE Trans. 1998, 30, 545–561. [Google Scholar] [CrossRef]
  42. Lee, D.H.; Chang, I.H.; Pham, H. Software Reliability Model with Dependent Failures and SPRT. Mathematics 2020, 8, 1366. [Google Scholar] [CrossRef]
  43. Ilyushin, P.V.; Filippov, S.P. Under-frequency load shedding strategies for power districts with distributed generation. In Proceedings of the 2019 International Conference on Industrial Engineering, Applications and Manufacturing (ICIEAM), Sochi, Russia, 25–29 March 2019. [Google Scholar] [CrossRef]
  44. Ilyushin, P.V.; Kulikov, A.L.; Loskutov, A.A. Application of the Wald Sequential Procedure in Automatic Network Control with Distributed Generation. Adv. Intell. Syst. Comput. 2020, 1295, 104–120. [Google Scholar] [CrossRef]
  45. Kulikov, A.L.; Ilyushin, P.V.; Loskutov, A.A. High-Performance Sequential Analysis in Grid Automated Systems of Distributed-Generation Areas. Russ. Electr. Eng. 2021, 92, 90–96. [Google Scholar] [CrossRef]
  46. Kulikov, A.L.; Ilyushin, P.V.; Loskutov, A.A.; Sevostyanov, A.A. The Wald Sequential Analysis Procedure as a Means of Guaranteeing a High Automatic Under-Frequency Load-Shedding Response Rate at Deviations of Unified Power Quality Indices. Power Technol. Eng. 2021, 55, 467–475. [Google Scholar] [CrossRef]
  47. Kulikov, A.L.; Sharygin, M.V.; Voroshilov, A.A. A method for recognizing the trend of the load graph in the automatic shutdown of power transformers. Electricity 2018, 10, 20–29. (In Russian) [Google Scholar]
  48. Kulikov, A.L.; Sharygin, M.V.; Voroshilov, A.A. Method of Reducing Technical Losses of Electric Power in Transformer Groups by Means of Automatic Switching-Off of Transformers. In Proceedings of the 2018 International Conference on Industrial Engineering, Applications and Manufacturing (ICIEAM), Moscow, Russia, 15–18 May 2018. [Google Scholar] [CrossRef]
  49. Van Trees, H.L. Detection, Estimation, and Modulation Theory, Part I: Detection, Estimation, and Linear Modulation Theory; John Wiley & Sons, Inc: Hobokone, NJ, USA, 2001; p. 697. [Google Scholar]
  50. Rylov, A.V.; Ilyushin, P.V.; Kulikov, A.L.; Suslov, K.V. Testing Photovoltaic Power Plants for Participation in General Primary Frequency Control under Various Topology and Operating Conditions. Energies 2021, 14, 5179. [Google Scholar] [CrossRef]
  51. Suslov, K.; Shushpanov, I.; Buryanina, N.; Ilyushin, P. Flexible power distribution networks: New opportunities and applications. In Proceedings of the 9th International Conference on Smart Cities and Green ICT Systems (SMARTGREENS), Prague, Czech Republic, 2–4 May 2020; pp. 57–64. [Google Scholar] [CrossRef]
  52. ISO 39511:2018; Sequential Sampling Plans for Inspection by Variables for Percent Nonconforming (Known Standard Deviation). International Organization for Standardization: Geneva, Switzerland, 2018.
Figure 1. Simplified single-line diagram of a portion of an active distribution network [17].
Energies 15 08448 g001
Figure 2. Operating regions of an AFLS device for various values of initial active power shortage for various load compositions [43].
Energies 15 08448 g002
Figure 3. Statistical frequency distributions for normal and emergency operating conditions [44].
Energies 15 08448 g003
Figure 4. Block diagram of the logic block for determining frequency deviations in the AFLS device.
Energies 15 08448 g004
Figure 5. Block diagram of the step-by-step decision-making algorithm in the logical block of the AFLS based on the WSPRT.
Energies 15 08448 g005
Figure 6. Illustration of the decision-making process in the logic block of the AFLS device [45].
Energies 15 08448 g006
Figure 7. Components of the two-hypothesis problem of load curve trend identification for the busbar sections fed by the power transformer.
Energies 15 08448 g007
Figure 8. An example of using WSPRT in an ATDS: (a)—functions of distribution laws pH0(R|H0), pH1(R|H1), and likelihood ratios Λ(R) in the one-dimensional space of observations Z; (b)—illustration of the step-by-step operation of the hypothesis selection algorithm.
Energies 15 08448 g008
Figure 9. The process of the WSPRT-based control of the generalized PQI.
Energies 15 08448 g009
Table 1. Literature overview of WSPRT applications.
No.Application AreaCharacteristics of the Tasks to Be SolvedReference
1Manufacturing, industrial systemsInput control of incoming materials, analysis of technological processes, technical diagnostics of equipment, output control of manufactured products[23,24,25,26]
2FinanceForecasting the bankruptcy of borrowers in the banking sector, forming a portfolio of investors, determining the priority of lending to corporate borrowers[27,28,29]
3MedicineImage recognition, selection and interpretation of diagnostic tests and procedures, determining the outcome of surgical treatment in patients with various diseases[30,31,32]
4AgricultureDetermining yields under conditions of uncertainty of natural and climatic conditions (rain, drought, hail, etc.)[33,34]
5Power industryDiagnostics of electrical equipment, determination of the location of damage, classification of accidents in power systems, and regime automation[35,36,37,38,39,40,41]
6SoftwareDetermining the reliability and quality of software[42]
Publisher’s Note: MDPI stays neutral with regard to jurisdictional claims in published maps and institutional affiliations.

