Article

The Environmental Life Cycle Assessment of Electricity Production in New York State from Distributed Solar Photovoltaic Systems

Department of Sustainable Resources Management, State University of New York College of Environmental Science and Forestry, Syracuse, NY 13210, USA
*
Author to whom correspondence should be addressed.
Energies 2022, 15(19), 7278; https://doi.org/10.3390/en15197278
Submission received: 9 September 2022 / Revised: 22 September 2022 / Accepted: 26 September 2022 / Published: 4 October 2022

Abstract

:
New York State’s (NYS) Climate Leadership and Community Protection Act (CLCPA) requires that 100% of the state’s electricity supply be greenhouse gas emissions-free by 2040 and that 6000 megawatts (MW) of solar energy must be installed in NYS by 2025. This study aims to evaluate the environmental impact of electricity generation from New York State distributed solar photovoltaic systems. This cradle-to-grave life cycle assessment (LCA) follows the International Standardization Organization (ISO) framework for LCA, including the goal and scope definition, inventory analysis, impact assessment, and interpretation. The study is based on operational data from 120 existing solar installations. Global Warming Potential varies substantially by site, with the minimum and maximum impact values varying from 25.2 to 88.5 gCO2eq/kWh, and with a mean of 45.6 gCO2eq/kWh. Regression analysis shows this range is attributable to differences in site location, capacity factor, and system design (i.e., monocrystalline and polycrystalline panels, area power ratio). Based on absolute percentage, the inclusion of the end-of-life process reduces the total environmental impact from 2% in Ozone Depletion to 16% in Acidification, indicating a positive impact of engaging in end-of-life management across all categories. This analysis can help policymakers understand the implications of the solar PV installation mandate.

1. Introduction

The four major consumers of electricity are the residential, commercial, industrial, and transportation sectors. The annual Energy Outlook 2022 report provides an overview of the electrical grid till 2050 for the United States and reveals that electricity demand will slowly increase at an average growth rate of about 1% until 2050 [1]. The increase in electricity generation from renewable resources will be more than the increase in electricity demand between 2022 and 2050 because of the motivation to decarbonize the electrical grid. The reliance on natural gas and oil-fired electricity generation during peak hours will be reduced by the deployment of battery storage capacity. The new capacity additions will mostly come from solar and wind as nuclear and coal technologies retire. The electricity generation from onsite solar PV technologies in the residential, industrial, and commercial sectors will be 8% of total generated electricity by 2050, which is twice the onsite electricity generation in 2021, indicating a significant expansion of solar PV technologies. The electricity demand in the transportation sector will grow the fastest as the share of on-road electrical vehicles increases from 1% in 2021 to 7% in 2050 [1]. The installed cumulative capacity of solar photovoltaic (PV) technologies has increased from 1.28 GW in 2000 to 709.67 GW in 2020; this exponential trend continued even during the COVID-19 pandemic by the addition of 125.8 GW and is expected to reach 4500 GW by 2050 [2]. There are different types of solar PV panels, i.e., first generation (monocrystalline and polycrystalline panels); second generation (thin-film panels); and third generation (non-silicon based or organic panels). Currently, more than 90% of the installed solar PV capacity comes from crystalline silicon-based conventional PV panels, and the remaining 10% comprises other solar PV technologies [3,4].
New York State (NYS) enacted the Climate Leadership and Community Protection Act (CLCPA) in 2019, which requires statewide greenhouse gas (GHG) emission reductions of 85% and net-zero economy-wide emissions (i.e., sequestration of the state’s remaining 15% of GHG emissions) by 2050 [5]. In the near term, NYS must produce 70% of its electricity from renewable resources and reduce its economy-wide GHG emissions by 40% (below the 1990 level) by 2030 [6]. Solar photovoltaic (PV) systems will play a critical role in the state’s future electricity mix because of their low GHG emissions compared to coal, natural gas, and other fossil fuel-based resources and solar PV’s substantial price advantage [7]. NYS plans to install 6000 MW of distributed solar by 2025 in the state as per CLCPA’s mandate [6].
Life cycle assessment (LCA) is a cradle-to-grave analysis of the environmental impacts of a system. The life cycle stages that are usually included in solar PV system LCAs include (1) raw materials extraction and their processing and manufacturing into PV modules, (2) transportation of those modules, (3) manufacturing of the balance of system components (BOS) (e.g., systems’ cement footings, stainless-steel supports) and the installation and operation of the PV system (collectively referred to as BOS in this study), and 4) end-of-life (EoL) (i.e., decommissioning, disposal, and recycling of PV components) [8,9,10,11,12,13]. Solar PV emissions mainly come from raw materials extraction and the manufacturing of PV components; however, solar PV installation and usage emit minimal GHG emissions [14]. The environmental impacts of electricity production from PV systems on a per-kWh basis depend on various factors including solar insolation, climate, panel shading and soiling, the geographic location of the PV panels, panel type, panel conversion efficiency, and panel lifetime [8,15]. The geographic location is an important factor during the operation of PV systems because solar insolation varies across regions. For example, the average insolation in NYS is 4.0 to 4.4 kWh/m2/day, whereas it is greater than 7.5 kWh/m2/day in Arizona [16]. Regions with lower annual solar insolation usually have long winters and generate less electricity per installed capacity than regions with high annual solar insolation [16]. Where PV panels are manufactured is also important because the GHG emissions of the electrical grid vary from one region to another, which in turn influences the emissions associated with manufacturing. For example, the average operational GHG emissions from electricity generation in NYS and Arizona are 189.2 gCO2eq/kWh and 438.6 gCO2eq/kWh, respectively [17]. However, the average global GHG emissions from electricity generation in 2018 is reported as 475 gCO2eq/kWh [18]. In addition, the type of panel affects GHG emissions. An analysis of two PV technologies for a 33 kW installation in Ann Arbor, Michigan has found GHG emissions of 34.3 gCO2eq/kWh associated with manufacturing thin-film laminate PV panels and 72.4 gCO2eq/kWh for polycrystalline PV panels [13]. The National Renewable Energy Laboratory (NREL) has harmonized approximately 400 published LCA studies of solar PV systems [19]. These studies are conducted in different parts of the world and use different assumptions and types of solar panels (e.g., monocrystalline, polycrystalline, thin-film, and copper indium gallium diselenide (CIGS)). The harmonization results indicate that average GHG emissions from solar resources are 40 gCO2eq/kWh based on the following assumptions: a 30-year panel life, solar insolation of 4.66 kWh/m2/day, and an efficiency of monocrystalline and polycrystalline panels of 14% and 13%, respectively [19].
The CLCPA identifies solar PV to be zero-emissions systems as they only consider GHG emissions at the point of electricity production from panels instead of using the life cycle assessment (LCA) approach [6]. To fully understand the climate benefits of the expansion of solar capacity within a geographic region and GHG emissions associated with the lifecycle of solar PV, an LCA approach is required. Previous LCA studies of solar PV usually consider only the manufacturing and/or operation of PV systems but ignore the end-of-life (EoL) of PV panels or address only limited environmental impact categories. Often missing from these studies is actual production data from currently operating PV systems. Therefore, they frequently omit important life cycle details and the resulting environmental implications related to the actual operation and electricity production from these systems. For instance, in northern regions where snow cover can last several days, weeks, or months, although the sun is shining and high-efficiency PV panels may be installed, electricity production from these panels may be very small or even zero. Reduced electricity production indicates a higher environmental impact per kWh. One unique component of this study is the use of actual electricity generation data from distributed PV systems within our geographic area of interest—these data allow us to determine the capacity factor and come to some important conclusions later in this study that provide useful information for the aggressive expansion of solar PV that is planned.
This study aims at developing a New York State context-specific LCA of electricity production from distributed solar PV resources. The objectives of this paper are (1) to assess the environmental impacts of distributed solar PV systems; (2) to determine the contribution of major life cycle stages to the overall impacts, namely PV manufacturing, transportation, BOS installation and operation, and the EoL; and (3) to identify key parameters to define the estimated environmental impacts using linear regression. Rather than relying on assumptions about insolation, this study uses recorded electricity generation from 120 operating solar PV sites located in NYS. The environmental impact of the system is defined by using a set of 10 impact categories reported by the Tool for Reduction and Assessment of Chemicals and other Environmental Impacts (TRACI 2.1) [20].

2. Materials and Methods
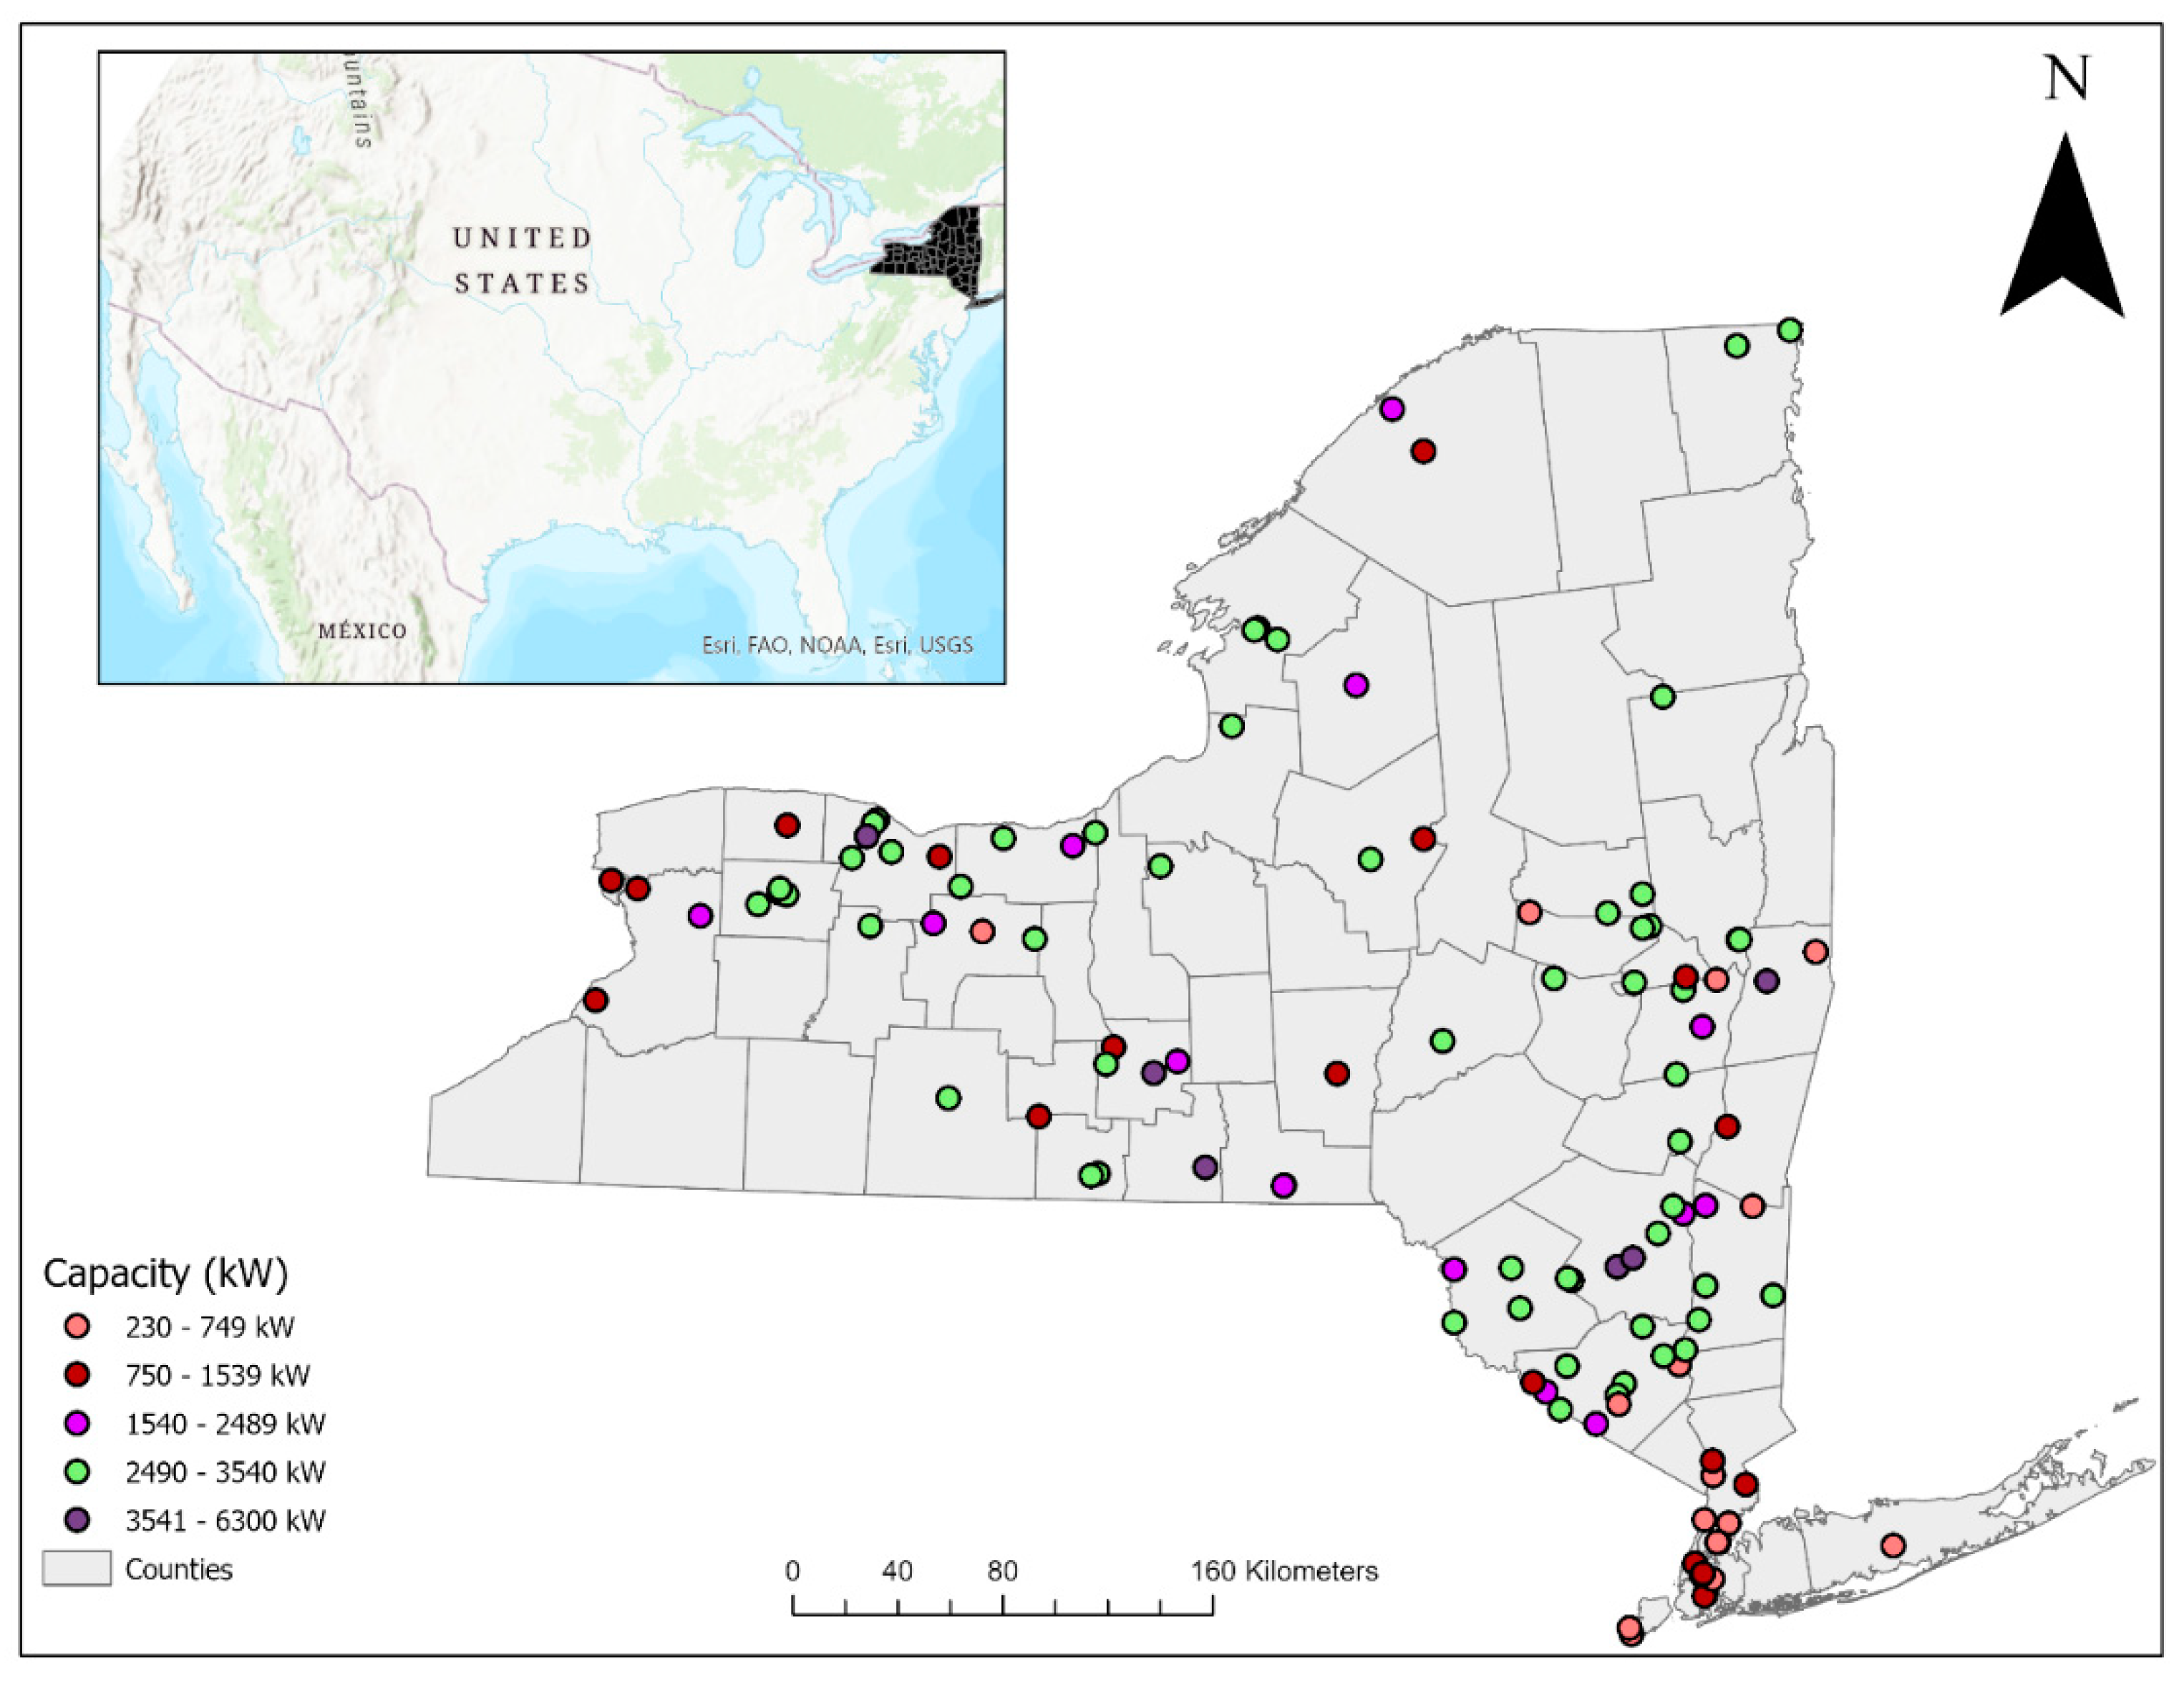
A comprehensive life cycle assessment (LCA) is performed following the framework defined by the ISO 14040 and ISO 14044 standards [21,22] to understand the environmental impacts associated with solar PV systems. This framework includes the goal and scope definition, inventory analysis, impact assessment, and interpretation. The LCA model is developed in SimaPro (V9.1.1.7) software using background inventory data from DATASMART LCI and the Ecoinvent database (V3.6) [20,23,24]. Crystalline-based silicon PV panels’ (monocrystalline and polycrystalline) lifecycle consists of three phases, i.e., upstream, operation, and downstream [10]. The upstream phase consists of different processes, e.g., raw materials extraction, processing of these materials into solar panels, and balance of system (BOS) components. The operational phase includes electricity generation, and the downstream phase includes system decommissioning, disposal, and recycling which occurs at the end of the solar PV system’s life.

2.1. Goal and Scope

This study quantifies the cradle-to-grave environmental impacts of electricity generation from solar PV systems in NYS by using the Tool for Reduction and Assessment of Chemicals and other Environmental Impacts (TRACI 2.1) [20] and data from 120 distributed solar PV sites that have been operating for at least 12 months (Figure 1) [25]. A functional unit of 1 kilowatt-hour (kWh) of net electricity generated is used to scale the environmental impacts. This functional unit is chosen since solar PV panels’ and systems’ main function is to generate electricity and allows for comparison with the existing literature. These sites are installed in NYS as part of the New York State Energy Research and Development Authority’s (NYSERDA) distributed energy resources (DER) program from 2014–2021 [25]. DERs are small-scale (less than 10 MW) electricity generation systems and usually, their electricity is consumed locally [26]. Two types of solar photovoltaic panels, namely monocrystalline (32.5% of sites) and polycrystalline (67.5% of sites), are deployed, and there is a mix of ground-mounted (80% of sites) and roof-mounted (20% of sites) systems. The analysis is based on twelve-month electricity generation data available for each site prior to February 2021. The detailed characteristics of the sites are described in Table 1.
This comprehensive LCA includes all the steps of electricity production via distributed solar photovoltaics, from the extraction of raw materials to the PV panels’ EoL (Figure 2). Based on the panel manufacturers’ datasheets, it is assumed that the manufacturing of PV panels took place in China; this stage consists of raw materials extraction, cell production, and module assembly. The panels are assumed to be transported by ocean freighter from China to the Port of New York and then delivered by truck to the installation sites. Balance of System (BOS) components and PV operation process is comprised of manufactured inverters, the mounting system components (i.e., cement footings, stainless-steel supports, and the aluminum rails that hold the modules’ components), and the installation and operation of the PV systems. BOS components are assumed to be manufactured in the United States. The EoL of PV panels scenario entails (1) incineration (producing electricity and heat), (2) recycling of recoverable materials (i.e., glass, copper, metallurgical grade silicon, aluminum, silver), and (3) landfilling of nonrecoverable materials.

2.2. Inventory Data and Modelling

Data for this analysis are collected from various sources including NYSERDA’s DER database [25], the Ecoinvent database (V 3.6), manufacturers’ datasheets for PV panel characteristics (i.e., dimension, weight, and efficiency), and other published literature [11,23,27] (Table 1). The publicly accessible NYSERDA DER database reports the location, power capacity, electricity generation, and capacity factor values for solar PV sites in NYS. Its records include hundreds of distributed solar PV systems installed across NYS between 2014 and 2021. However, for this study, only 120 of these sites that are located throughout NYS with operational data for at least one year of operation before February 2021 are selected for the analysis.

2.2.1. Manufacturing of PV Panels

PV panel manufacturing is a multistep process that includes raw materials extraction, cell production, and module assembly. All these processes are already built-in in the Ecoinvent database. For this reason, the details of panel manufacturing are skipped here. It is worth noting that because there are installations with monocrystalline silicon panels and others with polycrystalline silicon panels, separate inventories are used for each individual site according to the type of installed panels to better reflect reality. The inventory data used for monocrystalline and polycrystalline panels are scaled by default to 1 square meter of solar panel. To scale the calculated impacts to the functional unit (1 kWh) of this study, they are divided by the lifetime electricity production per square meter.

2.2.2. Transportation

The transportation process is modeled based on the weight of the object to be transported (i.e., PV panel, waste) and the transportation distance. It is assumed that the manufactured PV modules are transported from China to the Port of New York via ocean freighter and delivered to the installation sites by single-unit trucks. The average distance from Shenzhen, China to the Port of NY is 24,113 km [28]. The transportation distance from the Port of NY to each site is determined by using the network analysis tool in ArcGIS. The average road transportation distance to these sites is 280 km (ranging from 11 km to 585 km). The impacts of transportation for BOS components and end-of-life waste are included exclusively in their respective processes and not incorporated in this process.
The main inputs and outputs of materials and energy are summarized in Table 2.

2.2.3. BOS Components Manufacturing, Installation, and Operation of PV System

Balance of system (BOS) components include mounting (roof or ground mounting), aluminium frame, inverters, and operation of the PV system. BOS components are assumed to be manufactured locally. Impacts for installation and balance of system components for ground-mounted systems are estimated based on [11] and modified based on the emissions associated with the upstate New York power grid [17] and inventory data from DATASMART LCI [24]. It is assumed there is no need for structural concrete in roof-mounted panels; therefore, concrete is excluded from the inventory and a modified inventory is used for roof-mounted systems. A system lifespan of 30 years is assumed to determine the total system output in kWh. The efficiency of a PV panel is expected to decrease over time; this decrease is referred to as degradation rate which occurs due to factors such as panel age and climatic conditions. A systematic review of panel degradation rates from PV sites located in different parts of the world (e.g., North America, Asia, Europe) was conducted by [29] and found that the panel efficiency reduces at an annual degradation rate of 0.5%. The net electricity generation data for 12 consecutive months of PV site operation is used so any loss of efficiency up until this year of data collection is accounted for. The available data help to account for the seasonal variations of electric energy output due mainly to weather conditions (e.g., cloudy days, rain, snow) (Figure 3). This actual data in conjunction with the degradation rate over the expected lifetime of the panel should account for changes in panel efficiency.
A PV system’s capacity factor (CF) indicates its operational performance and is defined as the ratio of a system’s actual electric energy output compared with the system’s potential output if it operated at full nameplate capacity continuously during a given time [30]. Monthly, seasonal, and yearly CFs vary, and sites with higher CFs generate more electricity per unit of installed capacity than those with lower CFs. The 120 sites analyzed in this study were installed between 2014 and 2021 and have an overall CF of 12.2% (Figure 3). Generally, PV systems’ CF is below average during winter months and is above average during summer months when it can reach up to 30% for well-performing sites during the months of the year with the longest day length.

2.2.4. End-of-Life (EoL)

This study’s EoL scenario is based on the Full Recovery End of Life Photovoltaic (FRELP) process as described by [27]. This innovative process for the recycling of PV panels incorporates a sequence of physical (mechanical and thermal) treatments followed by acid leaching and electrolysis process. Glass and metal (e.g., silicon, silver, copper, and aluminum) scraps and energy can be recovered to provide additional credits to the system. It is assumed that PV panel waste will be collected at the end of its life and transported to a distance of 100 km by trucks of different weight capacities (different transportation inventories are used in modeling), as suggested by [27], to a recycling facility. It is assumed that PV wastes would be treated in NYS; therefore, the process is adapted to use electricity from the grid in NYS. To scale the inventory data for the EoL process to the functional unit of 1 kWh used in this study, the calculated impact per square meter is divided by the lifetime electricity produced per square meter of a used PV panel.

2.3. Life Cycle Impact Assessment

The environmental impacts of materials, energy, and processes associated with the solar PV systems are determined in SimaPro (V9.1.1.7) by using the TRACI 2.1 method [20]. TRACI 2.1 provides characterization factors to quantify the potential impacts that inputs and releases have on the environment based on various impact categories including ozone depletion, climate change, acidification, eutrophication, smog formation, human health impacts, and ecotoxicity [20]. The impacts for each site, scaled to the functional unit of 1 kWh of net electricity generated, are calculated in Excel according to Equation (1) through Equation (4). For each impact category, the net lifecycle impact represents the sum of the impact of all the individual processes.
P V   m a n u f a c t u r i n g ( k g C O 2 e q k W h ) = [ P a n e l   i m p a c t   L C I   ( k g C O 2 e q m 2 )   ×   P a n e l   A r e a   ( m 2 )   ×   n u m b e r   o f   p a n e l s   ] E l e c t r i c i t y   P r o d u c t i o n   ( k W h y r )   ×   30   ( y r )
B O S ( k g C O 2 e q k W h ) = [ B O S   i m p a c t   L C I   ( k g C O 2 e q m 2 )   ×   P a n e l   A r e a   ( m 2 )   ×   n u m b e r   o f   p a n e l s ] E l e c t r i c i t y   P r o d u c t i o n   ( k W h y r )   ×   30   ( y r )
T r a n s p o r t a t i o n   ( k g C O 2 e q k W h ) = [ ( L C I   r o a d   t r a n s p o r t   ( k g C O 2 e q t k m   )   ×   m a s s   o f   p a n e l s   ( k g )   ×   r o a d   d i s t a n c e   ( k m ) ) + ( L C I   o c e a n   t r a n s p o r t   ( k g C O 2 e q t k m )   ×   m a s s   o f   p a n e l s   ( k g )   ×   o c e a n   d i s t a n c e   ( k m ) ) ] E l e c t r i c i t y   P r o d u c t i o n   ( k W h y r )   ×   30   ( y r )   ×   1000   k g
E n d   o f   L i f e   ( k g C O 2 e q k W h ) = [ R e c y c l i n g   I m p a c t   ( k g C O 2 e q m 2 )   ×   P a n e l   a r e a   ( m 2 p a n e l ) ] E l e c t r i c i t y   p r o d u c t i o n   ( k W h / p a n e l )

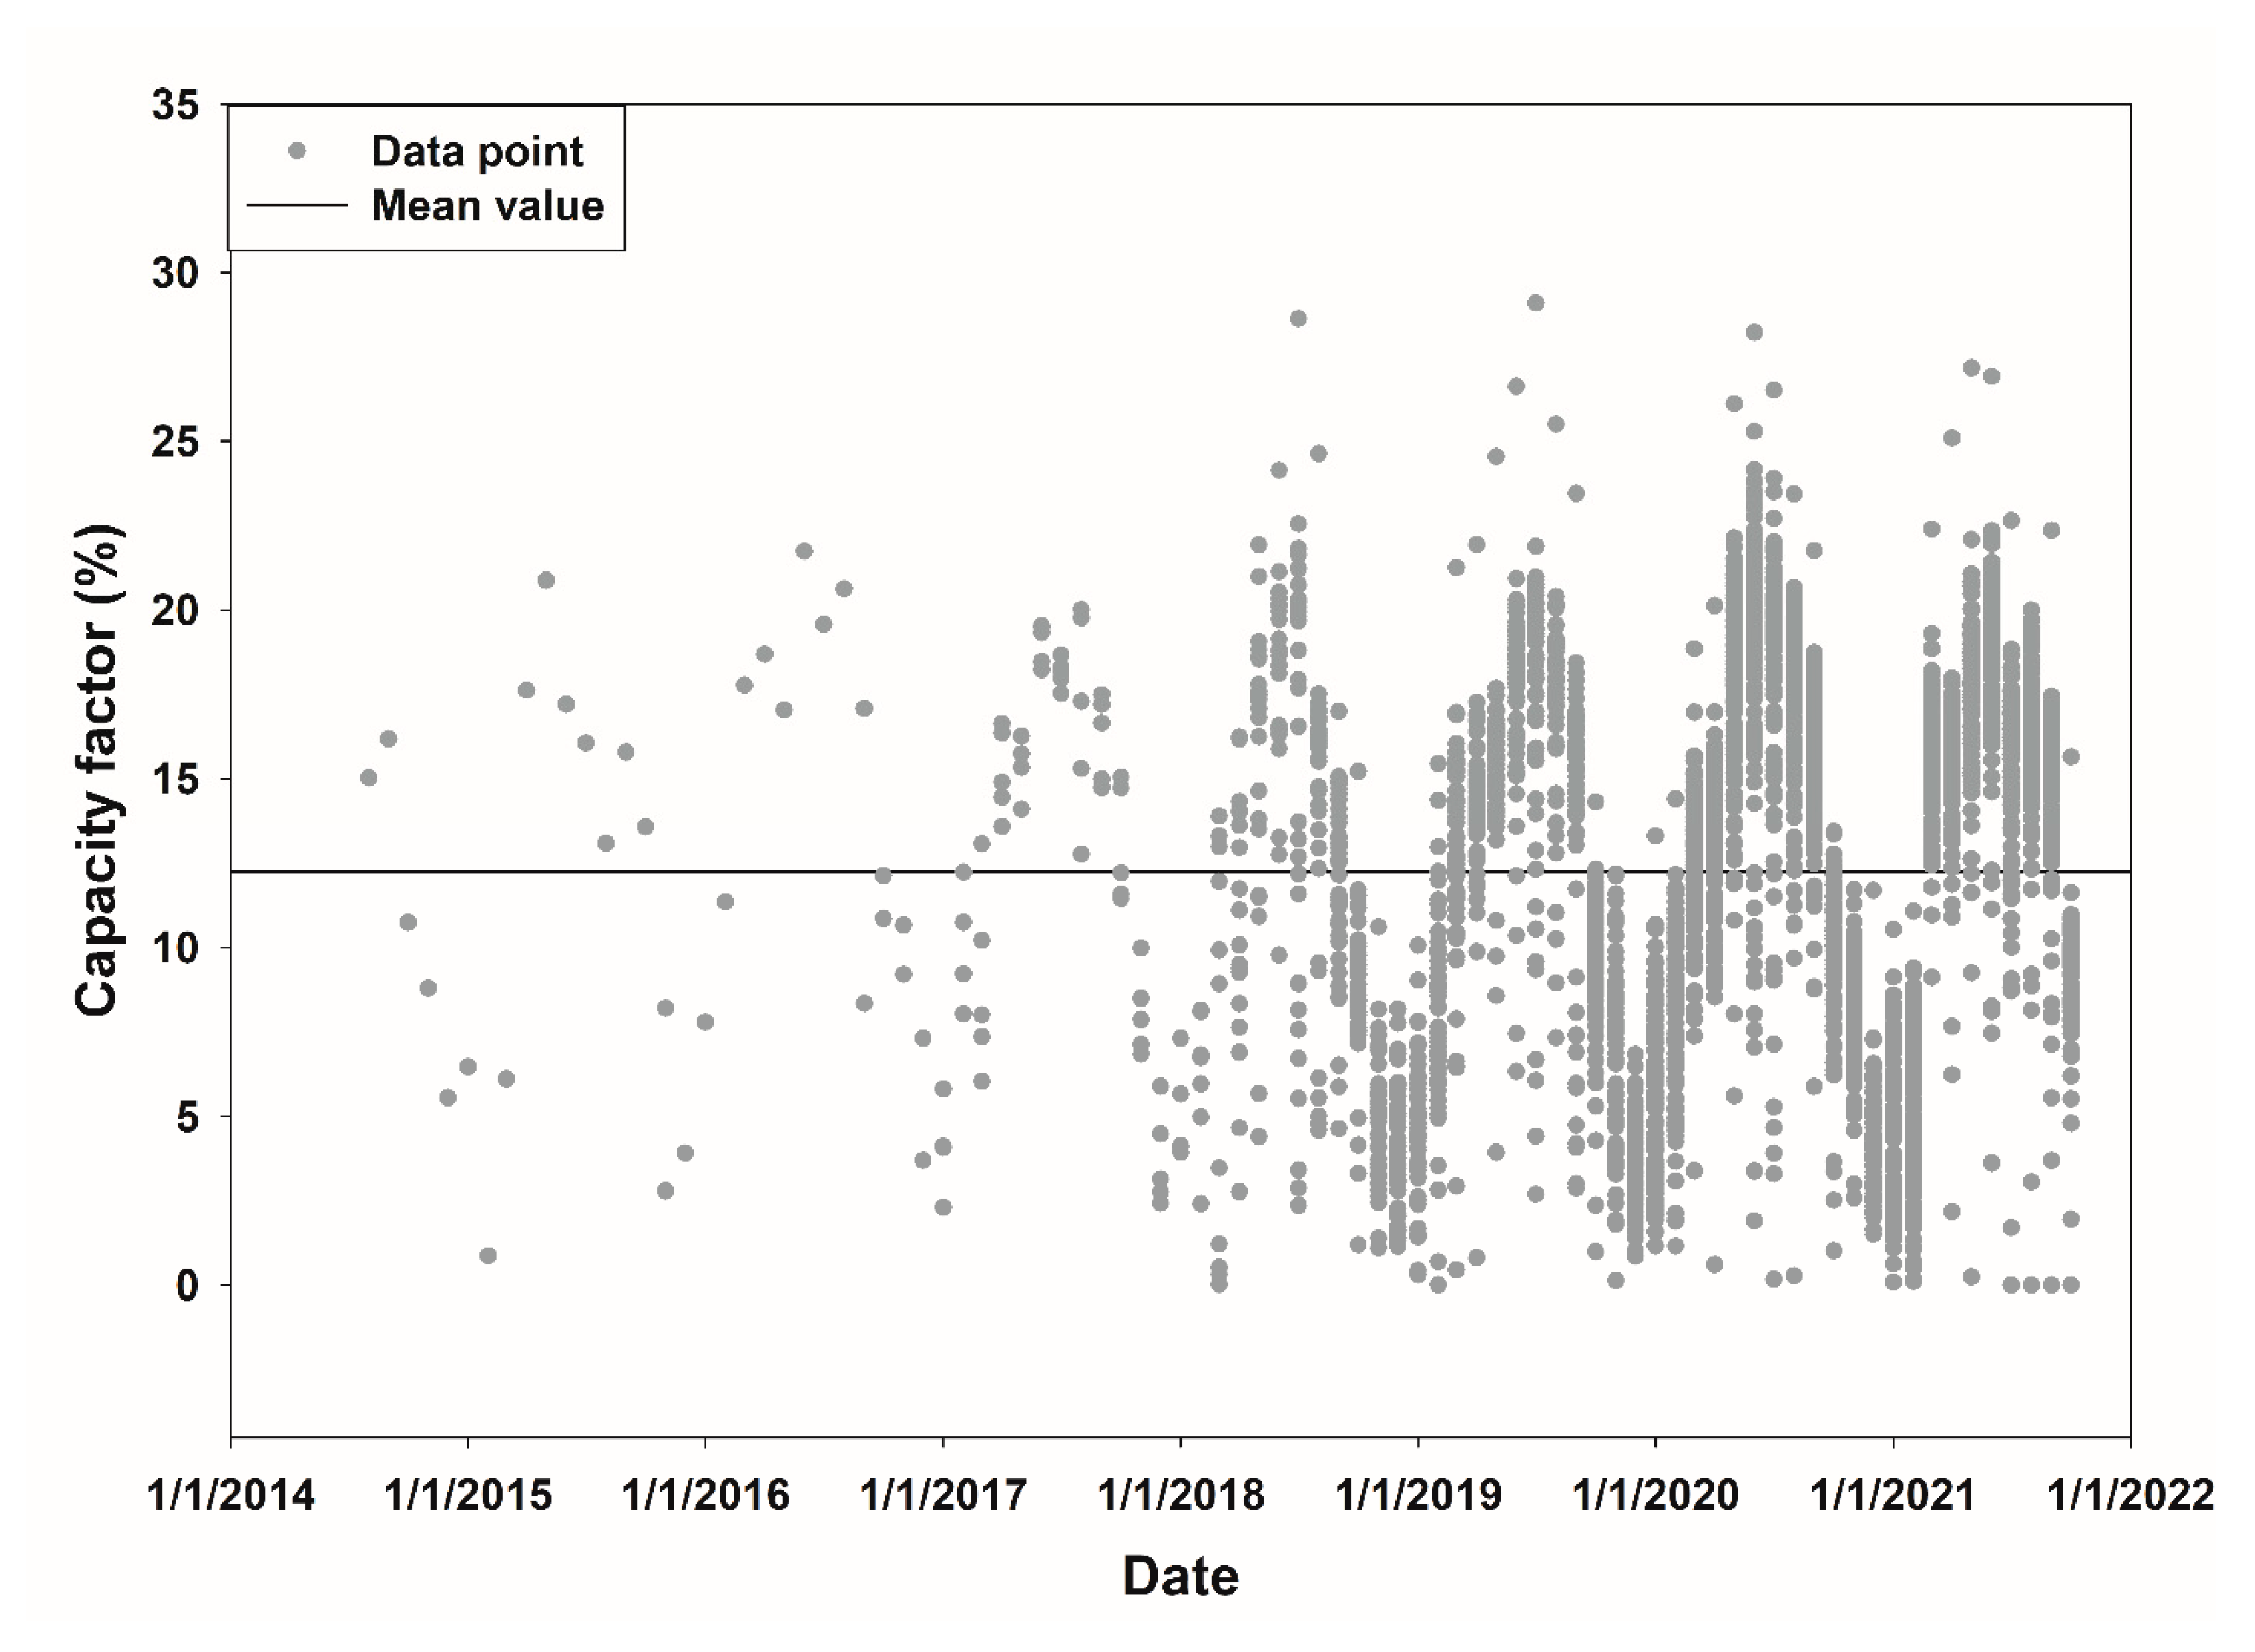
2.4. Statistical Analysis

Multiple linear regression analysis is conducted in SAS software (V9.3) [31] using the REG procedure to explain the variation in GHG emission results across the sites. A candidate model that consists of four continuous variables, two dummy variables, and their interactions (Equation (5)) is selected by using model selection procedures in SAS. The Mallows Cp statistic and R2 serve as the primary criterion for model performance [32]. Model parameters are evaluated at the 0.05 alpha level (p = 0.05). Potential outliers and transformations are assessed using methods described by [33]. Based on the assessments of the Studentized residuals, Cook’s Distance, and other leverage and outlier metrics, filters are created to limit the inference space to the main body of observations. The decision rules (cut-off criteria) are global warming potential (GWP) < 67 gCO2eq/kWh, average capacity factor (ACF) < 16%, and area power ratio (AP) > 3.2 (m2/kW). Filters remove 10 of the 120 observations. Collinearity of main effects is evaluated using the Variance Inflation (VIF) statistic.
G W P = β 0 + A C F β 1 + E β 2 + W P β 3 + A P β 4 + I β 5 + M β 6 + G β 7 + M ( A C F β 8 + E β 9 + W P β 10 + A P β 11 + I β 12 ) + G ( A C F β 13 + E β 14 + W P β 15 + A P β 16 + I β 17 )
where:
GWP = Global Warming Potential or greenhouse gas emissions(gCO2eq/kWh)
E = Efficiency of Solar Panel (%)
W = Weight of Solar Panel (kg)
A = Area of Solar Panel (m2)
I = Insolation (kWh/m2/day)
M = Monocrystalline (1), Polycrystalline (0)
G = Ground installation (1), Roof mount (0)
AP = Area power ratio (m2/kW)
WP = Weight and power ratio (kg/kW)
ACF = Average Capacity Factor (%)

2.5. Estimation of Future Land Requirements

Based on the collected data from NYSERDA and panel manufacturers, the area power ratio (AP) is calculated. This parameter determines the PV area required for 1 kW of installed capacity (AP in m2/kW). Average AP ratio is 5.6 m2/kW (ranging between 2.6 and 9.1 m2/kW). New York State plans to install 6 GW, i.e., 6000 MW (referred to as planned power Pp) of distributed solar PV by 2025. Equation (6) is used to calculate how much area (ha) would be required to install panels to generate the planned power in NYS. These calculations do not incorporate the complexity of timing PV installation and future improvements in module efficiency. They provide an estimation of the surface area required without considering the spacing between the panels, i.e., the total panel area required to install those panels, and represent a conservative estimate.
A r e a   ( h a ) = P p   ·   A P 10  
where:
Pp = Power planned (MW)
AP = Area Power Ration (m2/kW)

3. Results

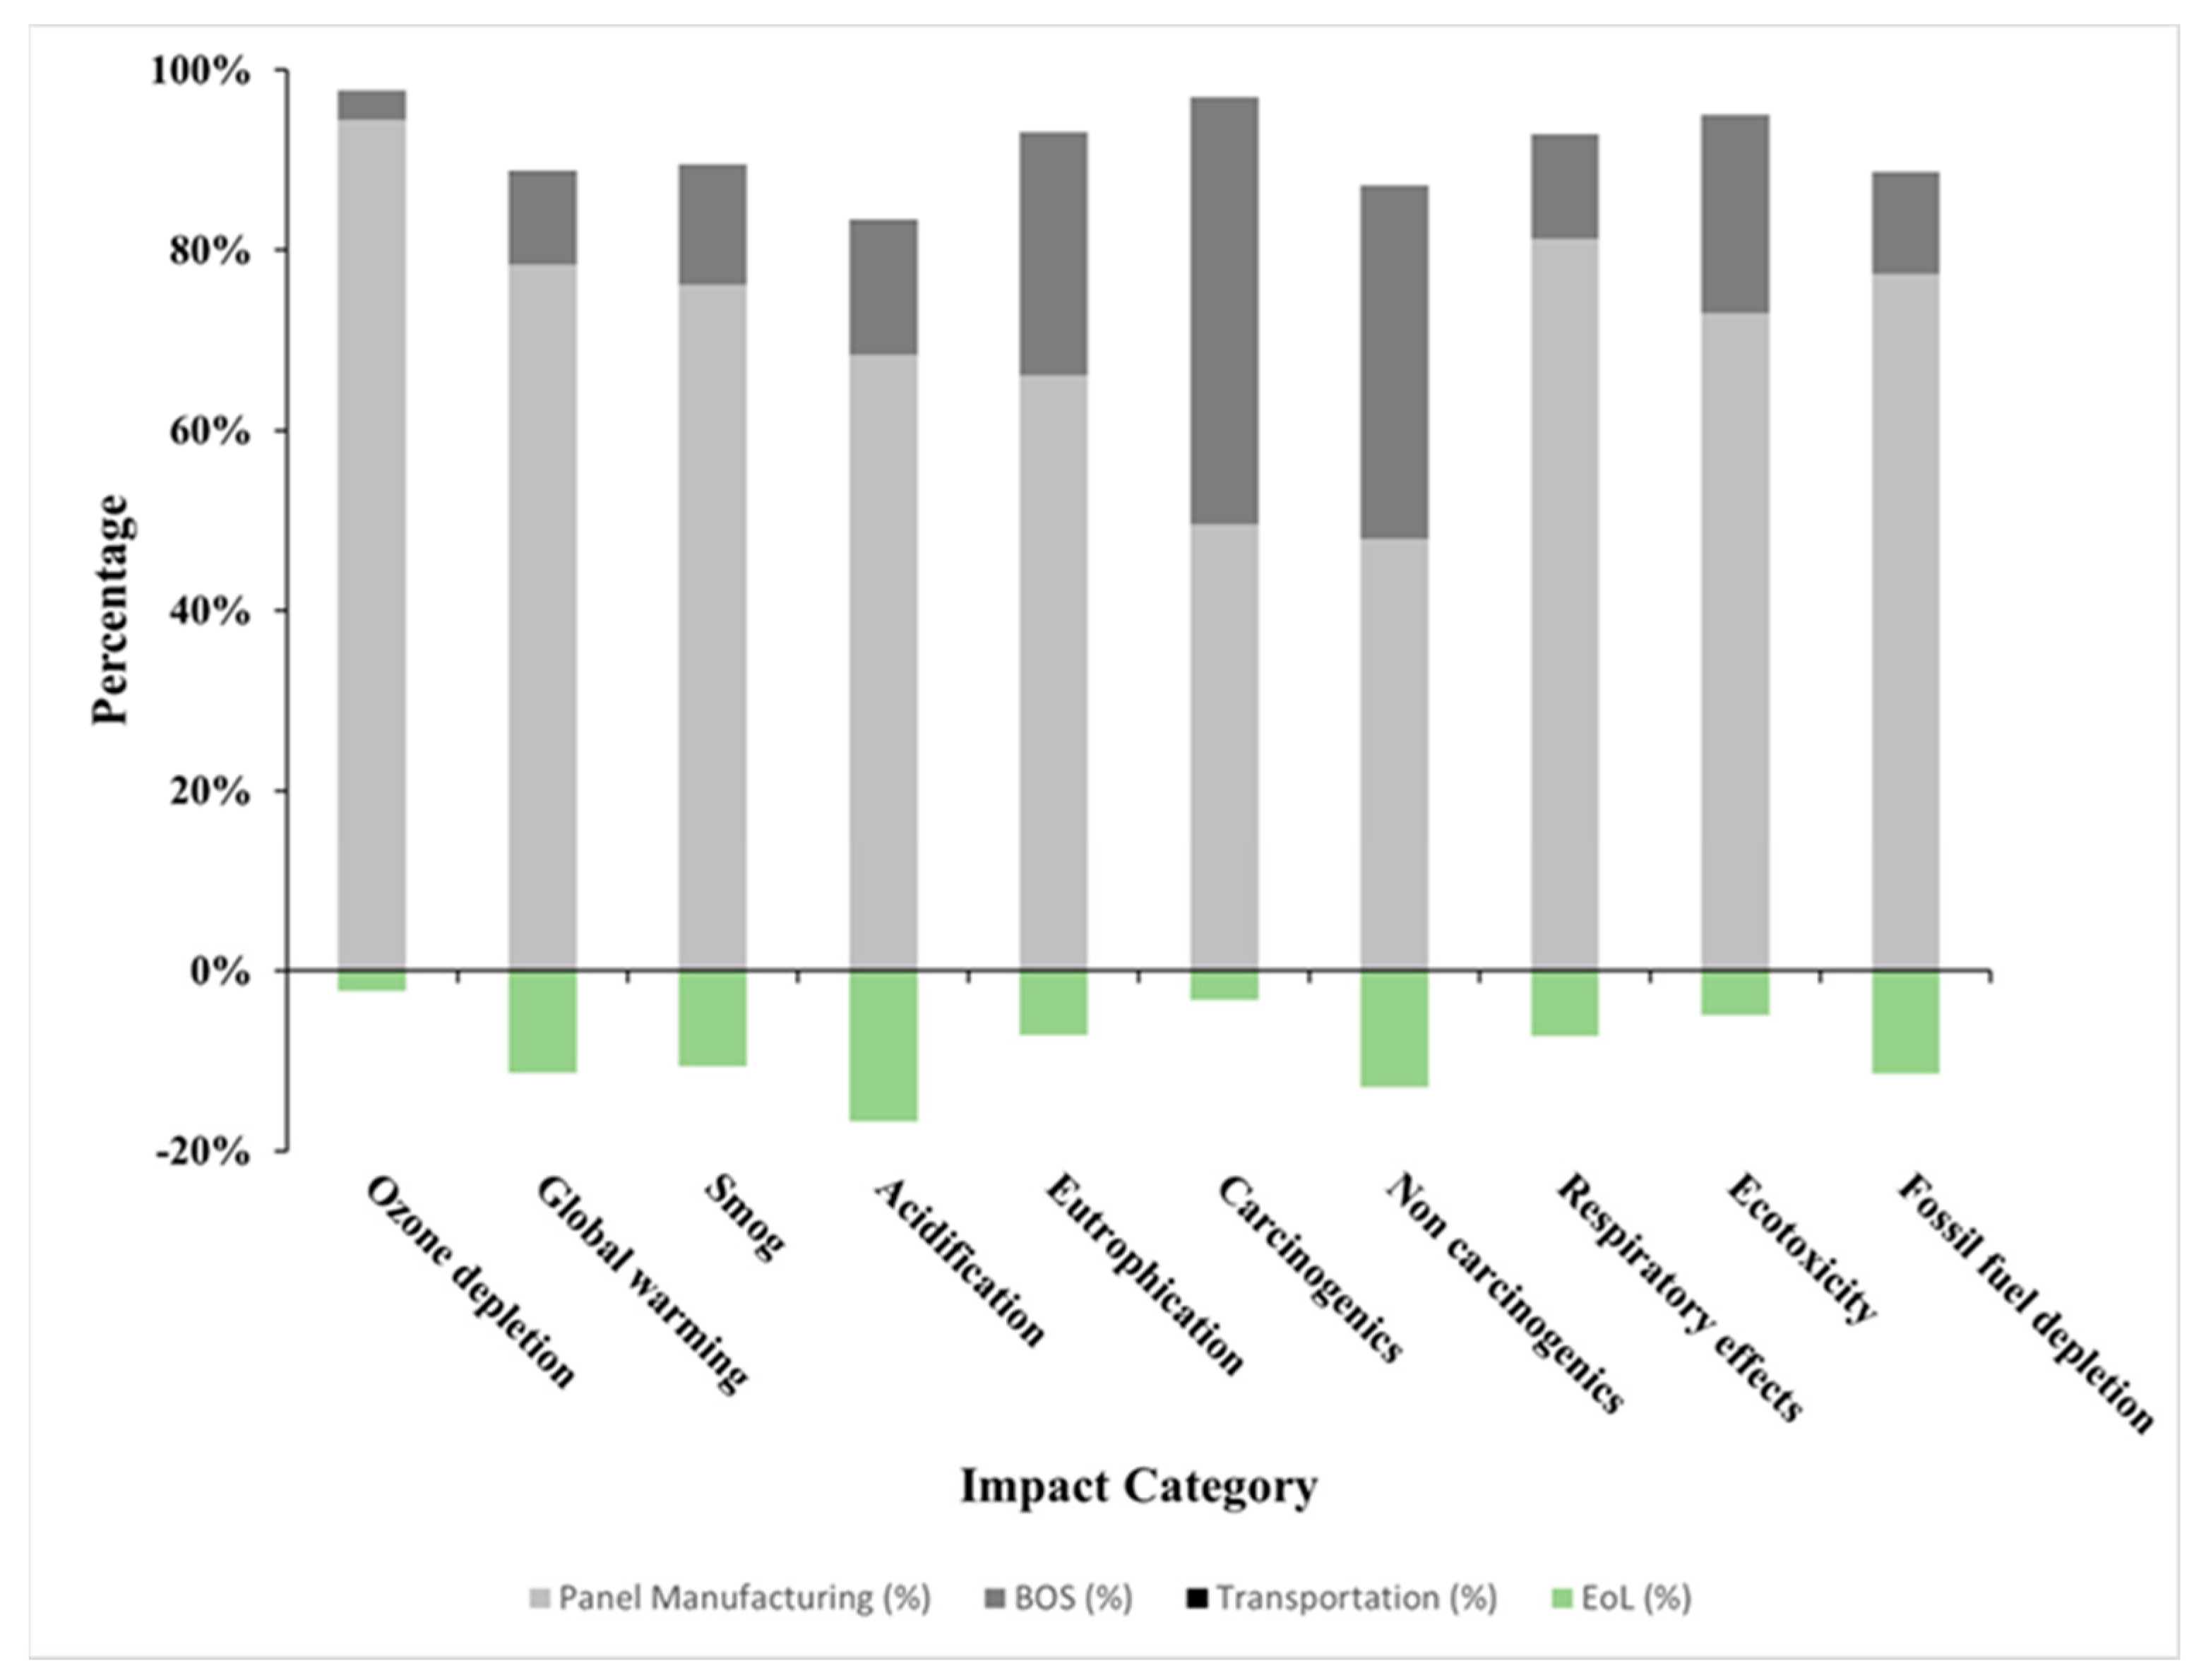
3.1. Environmental Life Cycle Results

The results of this study encompass all the major phases of a solar photovoltaic system, including the production of the PV modules, transportation to installation sites, the balance of systems components (i.e., inverters, mounting system) manufacturing, installation and operation of the PV system (collectively referred to as BOS), and the EoL of the PV modules. The average GHG is 45.6 gCO2eq/kWh (Table 3), with impacts calculated for individual sites ranging from 25.2 gCO2eq/kWh to 88.5 gCO2eq/kWh. The average ecotoxicity impact is 1.87 CTUe/kWh, and the average fossil fuel depletion impact is 4.76 × 10⁻² MJ surplus/kWh. PV panel manufacturing has the greatest environmental impact with its contribution ranging from 61% in eutrophication impact to 94% in ozone depletion (Figure 4). BOS components manufacturing, including installation and operation of the PV system, has the second-largest contribution to the environmental impact, with BOS components having the largest relative contribution to human health impacts (49% for carcinogenics and 48% for non-carcinogenics). The transportation process has the lowest contribution to total environmental impact <1% for all impact categories. Based on absolute percentage, the EoL process reduces the total environmental impact from 2% in Ozone Depletion to 16% in Acidification, indicating a positive impact of engaging in end-of-life management across all categories. For example, GHG for the EoL process is −6.4 gCO2eq/kWh (12% of total impact), which indicates the GHG benefits obtained for recovered materials (e.g., copper, aluminum, and silicon) that will replace virgin materials on the market. The environmental impacts (Table 3) include the reduction from the EoL process for each impact category. For example, the total GHG without EoL is 52 gCO2eq/kWh but with the EoL process, GHG reduces to 45.6 gCO2eq/kWh.

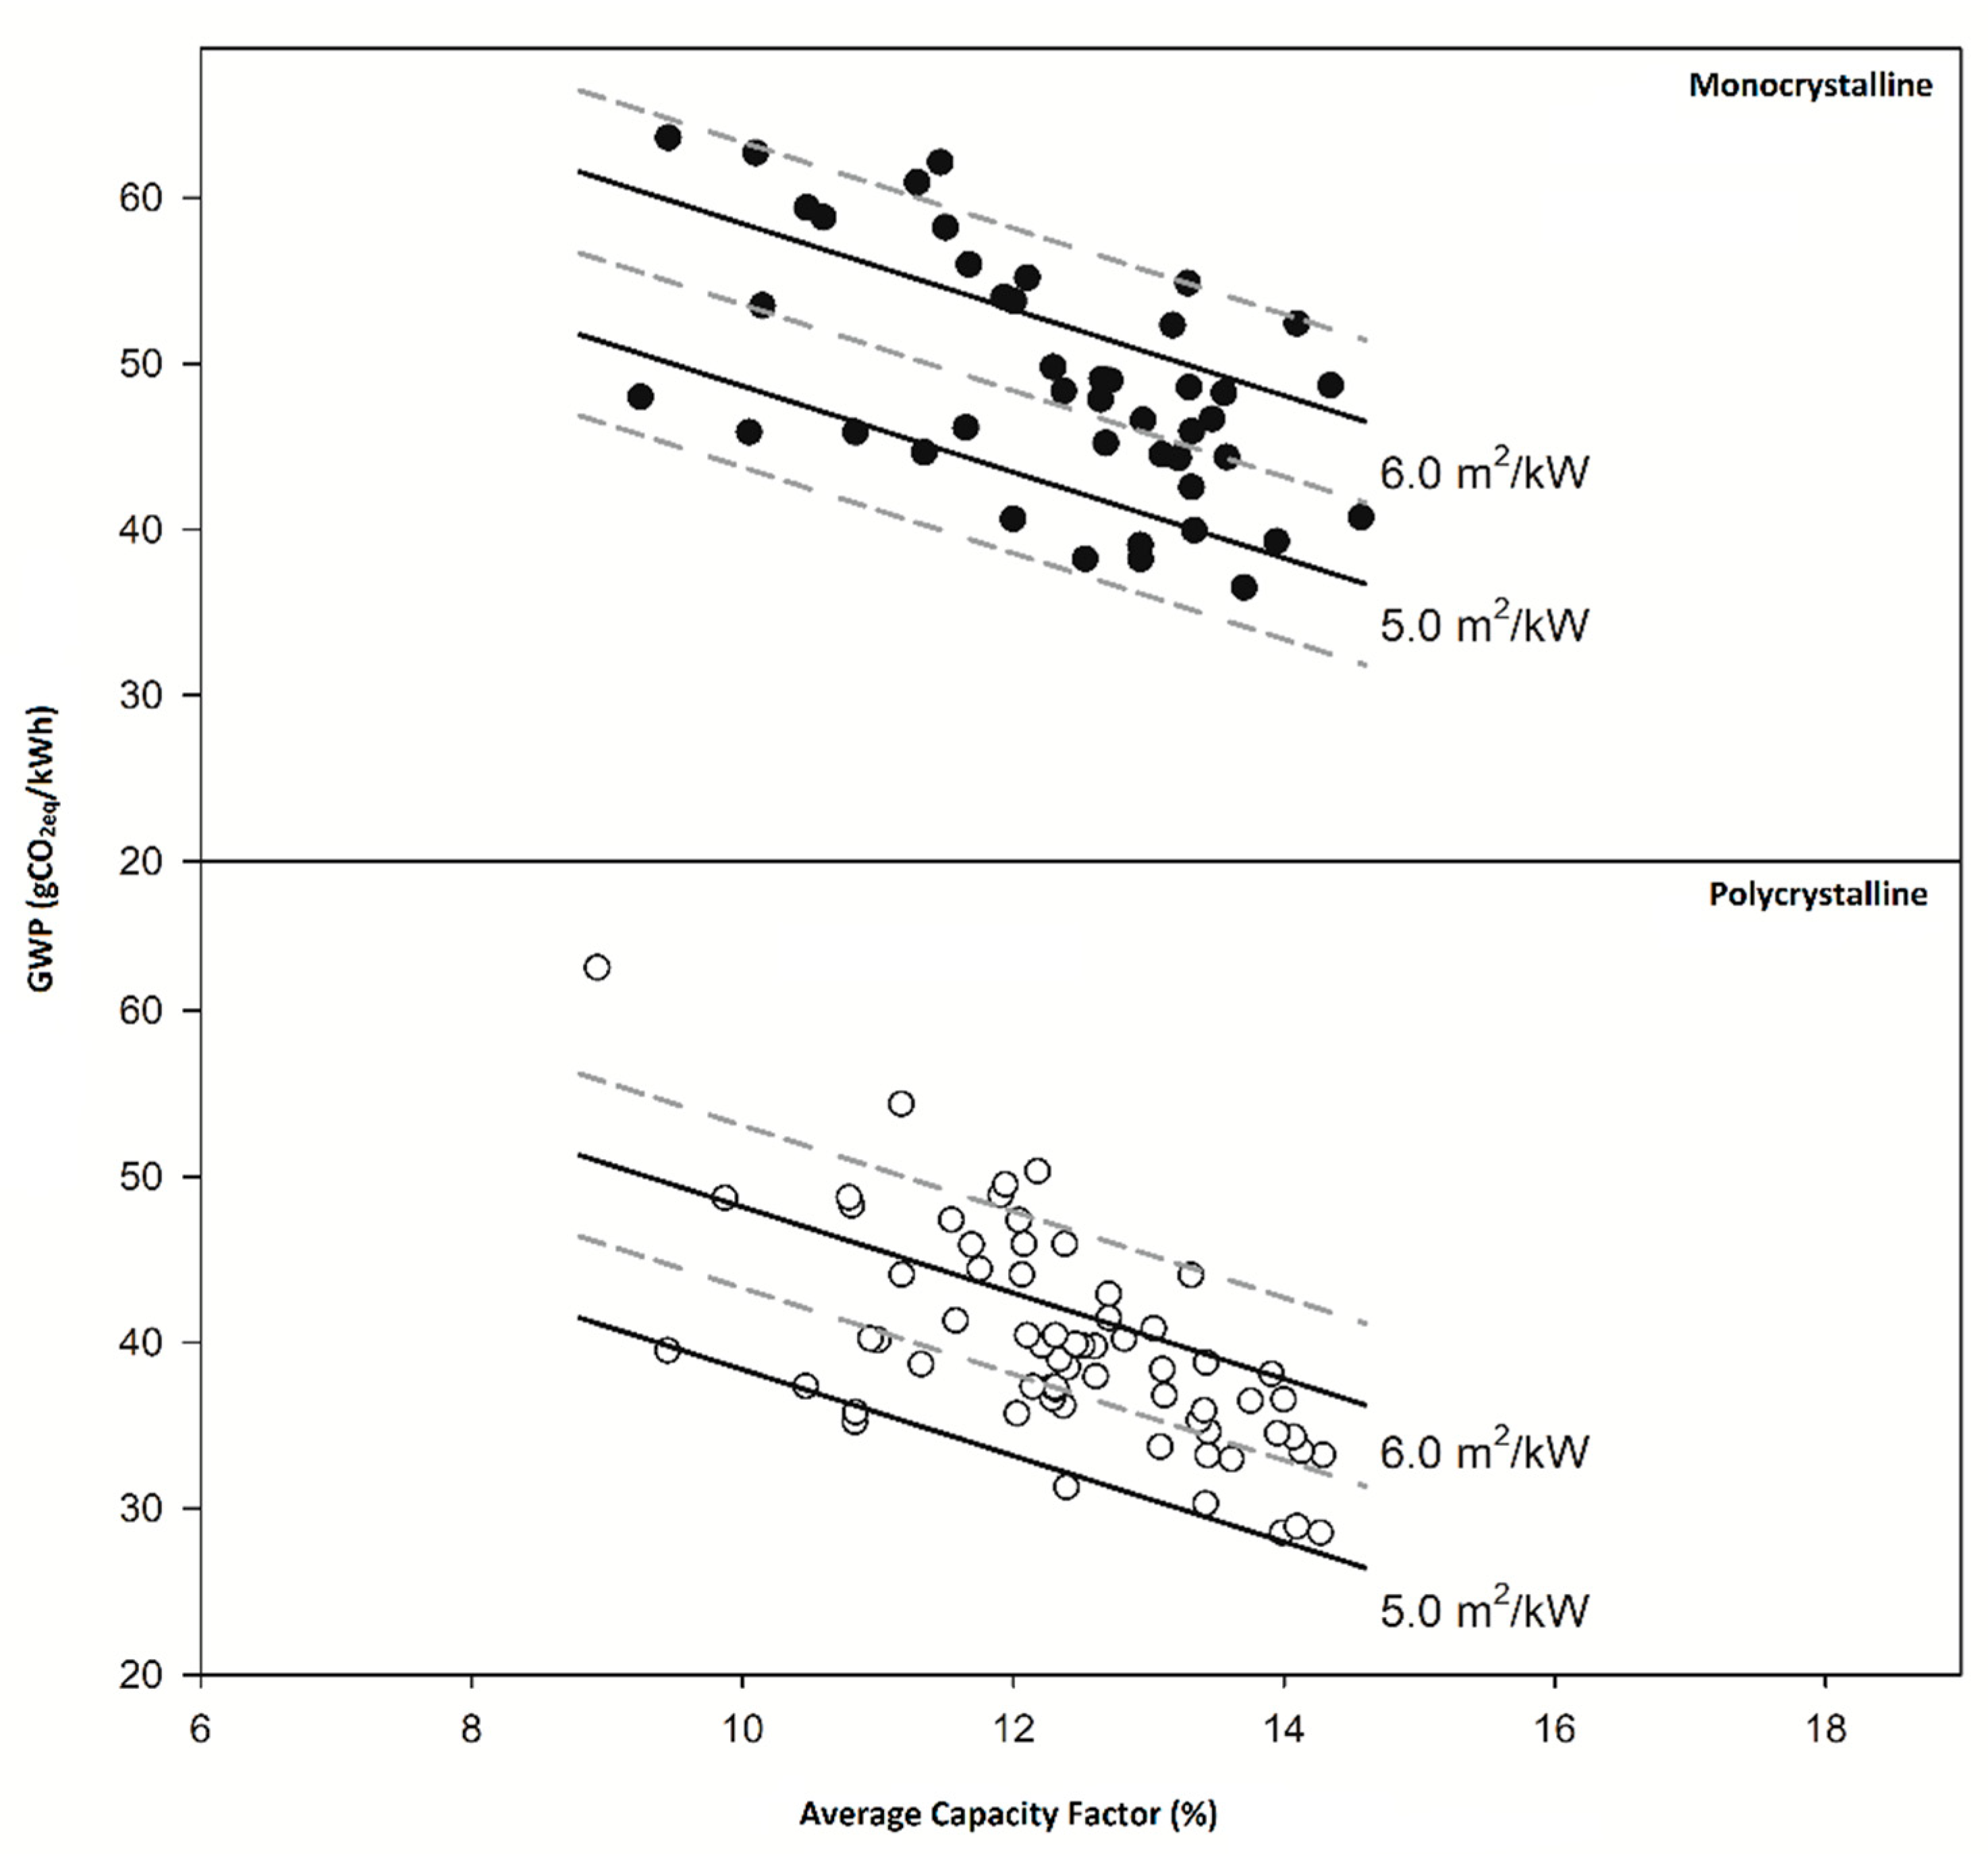
3.2. Statistical Analysis Findings

Model selection identifies a variety of usable models with similar performance. The highest performing model based on the Mallows CP statistic and R2 is a three-component model that contrasted monocrystalline and polycrystalline panels, average capacity factor, and the panels’ area power (AP) ratio (Table 4, Equation (7)). This model has an adjusted R2 of 0.817 and a coefficient of variation of 7.89%. Mean GWP for monocrystalline panels (48.9 gCO2eq/kWh) is 20.7% higher than for polycrystalline panels (39.7 gCO2eq/kWh). GWP is greater for monocrystalline panels, decreases with increasing ACF, and increases with the panel’s AP ratio.
The cut-off criteria exclude ten observations with high GWP from this model so the inference is limited to panels with GWP below 67 gCO2eq/kWh, instead of 88.5 gCO2eq/kWh due to limited data points with GWP higher than 67 gCO2eq/kWh. The average panel output (kWh/panel) for the excluded observations is well below the average of all sites, which indicates these sites produce much less electricity than the rest of the sites, resulting in a much higher GWP. AP ratio (m2/kW) indicates the ratio of square meters of panel to power; its cut-off is set at 3.2 m2/kW to remove sites where panels have abnormally low production. As noted previously, this study calculates ACF for these 120 NYS solar PV systems at 12.2% (ranging from 8.93 to 18.74% with 89% sites within 8.93–13.93%). The ACF cut-off is set at 16% (i.e., sites with ACF of 16% or less are included in the model; there is only one site with ACF > 16%) to better reflect NYS weather conditions throughout the year. Figure 5 illustrates that GWP is higher when monocrystalline panels are used compared to polycrystalline panels. The lines in Figure 5 indicate differences in AP ratio (m2/kW) for monocrystalline and polycrystalline panels. Monocrystalline panels are more energy-intensive and complex to manufacture than polycrystalline (i.e., the manufacturing impact of monocrystalline and polycrystalline panels is 271 and 207 kgCO2eq/m2, respectively) which explains why GWP increases with monocrystalline panels. The average GWP difference observed between monocrystalline and polycrystalline panels is 9.2 gCO2eq/kWh. Out of the three variables (i.e., panel type, area power ratio, and average capacity factor), panel type has almost 50% of the influence on GWP, whereas the other two variables have a 50% influence combined (Table 4). The regression results for other impact categories are provided in the Supplementary Materials (Tables S3–S11).
G W P = 15.31 + 10.27 M + 9.79 A P 2.59 A C F

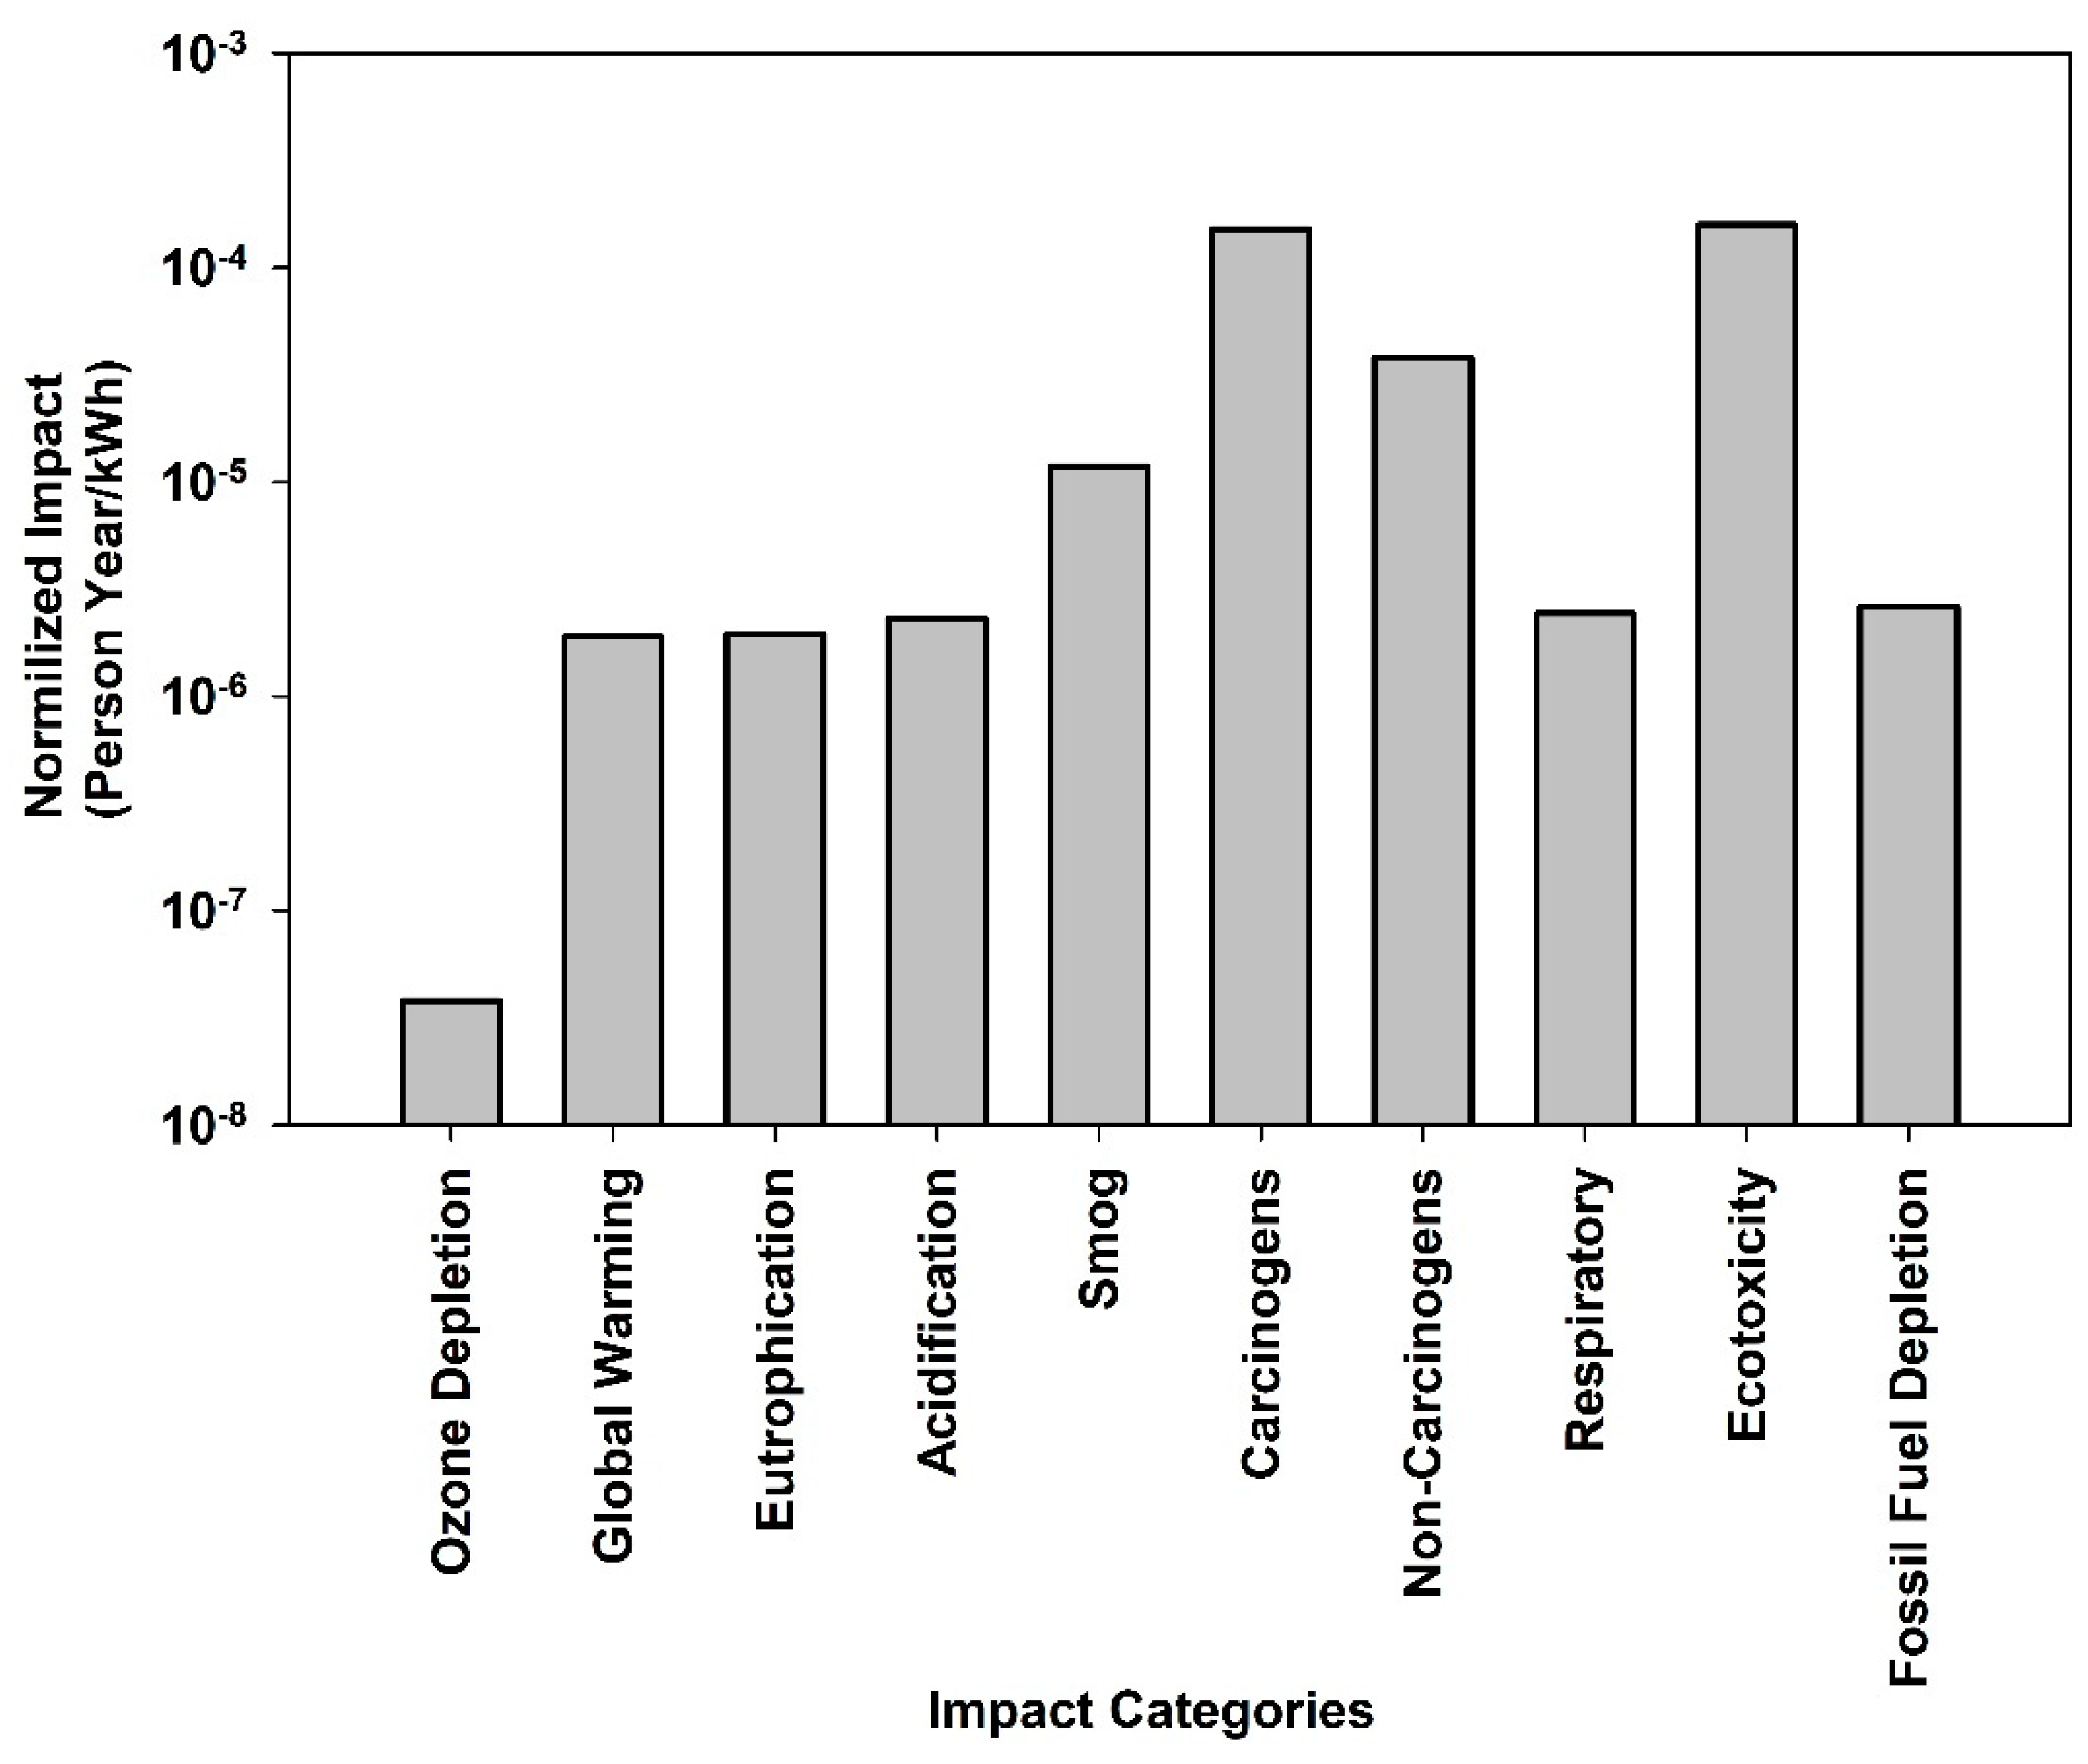
3.3. Environmental Normalization Results

To allow comparison between different impact categories, the normalized impact per person-year/kWh (i.e., to generate one kWh of electricity from a solar PV system and how much impact it will have on each person living in the United States in 2008) is calculated based on [34] and illustrated (Figure 6). Ozone depletion has the lowest impact per person-year, followed by global warming, eutrophication, acidification, respiratory effects, and fossil fuel depletion. The highest impact to generate 1 kWh of electricity from solar PV comes from ecotoxicity and carcinogenics. The higher impact of ecotoxicity and carcinogenics is attributed to materials such as silicon, aluminium, gold, silver, copper, and steel that are used to manufacture solar PV panels and BOS components.

4. Discussion

4.1. Comparisons with Other Solar PV LCAs

The variation in GHG across sites (i.e., 25.2 gCO2eq/kWh to 88.5 gCO2eq/kWh; 88% of sites within the range of 25.2–50.7 gCO2eq/kWh) is mainly attributed to differences in panel types and characteristics and the variation of capacity factor by site. GHG is lower when polycrystalline panels are used compared to monocrystalline panels and decreases with higher capacity factors. This study’s average GHG is within the same range of values reported in the literature for crystalline solar PV systems [8,9,10,19,35]. The differences with the reported values in the literature are due to those studies’ different panel efficiency and capacity factors. The US average solar PV GHG is 40 gCO2eq/kWh [19], whereas the average GHG that is found in this study is 45.6 gCO2eq/kWh even though the capacity factor for NYS (12.2%) is nearly half of the US average (24%). This is because [19] used low panel efficiencies (13% and 14%) and this study analyzed modern solar panels, which have efficiencies of 15.48% to 22.2%. The current study integrates an innovative EoL scenario that provides additional benefits (12.2% impact is reduced). Moreover, the panels analyzed in their study are a mix of first, second, and third-generation PV panels. Second and third-generation PV panels have lower GHG, which reduced their overall GHG, but this study only analyzed first-generation PV systems, which normally have higher GHG.
The relative contribution of PV module manufacturing, BOS, and EoL to the total GHG of the solar PV system is 84.1%, 10.4%, and −12.2%, respectively (Figure 4), indicating that the manufacturing of PV panels contributed most to the GHG of PV system. If these panels are to be produced in a location with an electric grid with lower GHG emissions (e.g., the NYS grid with an average operational GHG of 189.2 gCO2eq/kWh) or used lower energy consumption methods, the environmental impact of manufacturing the panels would be reduced. The PV panels in this study are modeled according to a global supply chain (with most of the background processes occurring in China which has an electricity mix that is based heavily on fossil fuels that cause higher GHG emissions) during the panels’ production process. The manufacturing of PV panels is a dominant factor in all impact categories except carcinogenics and non-carcinogenics. Carcinogenics impact on PV panel manufacturing, and BOS is caused by the use of steel (which contributes 67%), copper (18%), aluminum (6.8%), and electricity inverters (6.4%). Copper contributes 78% of the non-carcinogenics impact, steel 9.2%, and inverters 8.5%. For GHG, steel contributes 38%, aluminum 16%, inverters 10%, copper 5.8%, and concrete 2.8%. These results indicate that steel and copper have high impacts on human health (i.e., carcinogenics and non-carcinogenics) but lower impacts on the environment (i.e., global warming in BOS components). This leads to a higher contribution of carcinogenics and non-carcinogenics in BOS processes relative to the other processes. The emissions from the transportation of panels from China to New York are very low and can be omitted without significantly affecting the study’s findings. The BOS components’ production, installation, and operation of PV systems do not contribute substantially to GHG. The EoL treatment process reduces the overall global warming impact since the recycled materials can be refined and used to produce new PV panels instead of mining virgin materials. The average GHG difference between monocrystalline and polycrystalline PV panels is 9.2 gCO2eq/kWh (i.e., for every kWh electricity generated in NYS from these installed solar PV panels, monocrystalline panels emit 9.2 g of additional GHGs compared to polycrystalline panels). For a PV solar system with a lifespan of 30 years, based on this study, monocrystalline panels would emit 618 metric tons of CO2eq more than polycrystalline panels.
These results can also be compared with first-generation solar panels (i.e., monocrystalline and polycrystalline panels from the literature). A study of solar PV with a power conditioning system (PCS) analyzed the impact of monocrystalline and polycrystalline panels located in South Korea with an efficiency of 15.95% and 14.91%, respectively [35]. They have included pre-manufacturing, manufacturing, and panels’ use and disposal stages in their analysis and reported GHG of 41.8 gCO2eq/kWh and 31.5 gCO2eq/kWh for monocrystalline and polycrystalline panels, respectively. Their lower GHG is due to the high amount of electricity produced from PV systems since they do not use operational data but theoretical electricity generation data from the panel’s efficiency. A cradle-to-use LCA (from raw material extraction to use) for polycrystalline panels with an efficiency of 14% has a GHG impact of 58.8 gCO2eq/kWh [36]. Their GHG (58.8 gCO2eq/kWh) is higher than in this study because they do not include an EoL analysis and used higher efficiency panels so system boundaries and input values matter. A cradle-to-gate (i.e., from raw material extraction to PV panel manufacturing) LCA for polycrystalline panels with a 16% efficiency has reported a GHG of 50.9 gCO2eq/kWh [9]. GHG is higher than this study’s GHG for manufacturing PV panels (44.2 gCO2eq/kWh), which is likely because they used a lower PV panel efficiency. The other environmental impacts that are reported in their study are acidification (4.27 × 10⁻⁴ kgSO2eq/kWh, with 73.4% due to sulfur dioxide caused by electricity consumption) and eutrophication (4.23 × 10⁻⁵ kgPO43-eq/kWh, which is mainly due to emissions of nitrogen oxides and phosphate) [9]. A cradle-to-gate (excluding EoL stage) LCA of ground-mounted and roof-mounted PV systems located in Greece has reported GHG of 42.7 gCO2eq/kWh and 54.3 gCO2eq/kWh from these systems, respectively [37]. They further found that the environmental impacts of ground-mounted systems become more than roof-mounted systems if these systems are located at a distance greater than 10.22 km from the grid connection.
For second-generation PV panels, a cradle-to-gate analysis (raw material extraction to panel manufacturing) for two new thin-film solar PV technologies, copper zinc tin sulfide (CZTS or CuZnSnS4) and zinc phosphide (Zn3P2), was performed [38]. They assumed the electricity grid to produce these panels would have GHG emissions equal to the US average electricity grid and a panel efficiency of 10%. The GHG and ecotoxicity impact for CZTS and Zn3P2 is 38 gCO2eq/kWh and 30 gCO2eq/kWh, and 2 × 10⁻⁵ CTU/kWh and 9.1 × 10⁻⁶ CTU/kWh, respectively. Their GHG is lower than this study’s manufacturing of PV monocrystalline and polycrystalline panels (44.2 gCO2eq/kWh), which could be due to the fact their model assumed panel manufacturing occurred in the US, so their analysis used the GHG emissions from the US electricity grid (429.6 gCO2eq/kWh) rather than the global electricity mix (475 gCO2eq/kWh). The ecotoxicity impact in their study is lower than what is reported here (1.87 CTU/kWh) because they analyzed the extraction of different materials to manufacture different types of panels. This puts monocrystalline and polycrystalline panels at disadvantage since the materials required to manufacture these panels have a higher ecotoxicity impact. A cradle-to-grave (i.e., raw material extraction to EoL) LCA was performed [39] for Copper Indium Gallium Selenide (CIGS) and Cadmium Telluride (CdTe) solar PV panels manufactured using the US average electricity grid and the efficiency of 12% and 11.6 %, respectively. They have reported GHG impact for CIGS and CdTe as 22 gCO2eq/kWh and 20 gCO2eq/kWh. This lower impact puts thin-film PV at an advantage compared to silicon (Si) PV. A cradle-to-grave (raw material extraction to EoL) LCA for CIGS/Si, CZTS/Si, and AZTS/Si tandem solar modules compared with Si panels and have found that GHG for CIGS/Si, CZTS/Si, and AZTS/Si is 29 gCO2eq/kWh, 26 gCO2eq/kWh, 25 gCO2eq/kWh, respectively [40]. This shows that tandem solar modules tend to have a lower climate change impact than silicon-based solar modules.
The third generation of PV systems (i.e., non-silicon-based panels) is quite new, and many of these systems are still in either laboratory or prototype scale [12]. A cradle-to-gate LCA for laboratory-scale manufacturing of heterojunction organic cells with an efficiency of 10% to produce electricity from this type of panel was performed [34] and they reported a GHG of 54.9 gCO2eq/kWh. A cradle-to-gate (i.e., raw material extraction to use phase) LCA of quantum dot photovoltaics (QDPV) with an efficiency of 14%, reported a GHG of 5 gCO2eq/kWh which is the lowest described emissions from any solar PV system [41]. A cradle-to-gate (i.e., raw material extraction to use phase) LCA of dye-sensitized solar devices (DSSD) roof-mounted system with cell efficiency of 8% has reported a GHG of 22.3 gCO2eq/kWh [36]. It is important to note that third-generation PV systems are still not commercially available; however, they are expected to reduce the environmental impact of PV systems substantially in the future. The comparison of this study’s results with first, second, and third-generation solar panels is summarized in Table 5.

4.2. Comparisons with Other Electricity Generation Systems’ LCAs

This study’s LCA analysis indicates that solar PV has a lower GHG than fossil fuel-based electricity generation systems but a higher GHG than electricity from wind, geothermal, hydropower, concentrated solar power, nuclear, and ocean energy systems (Table 6). Of course, all electricity generation systems have their limitations; for example, wind turbine production varies based on wind dynamics and therefore is not suitable for every region. The system cost and public social perception of those systems (e.g., public support for nuclear energy varies greatly temporally and spatially) are also important.

4.3. Implications for NYS’s CLCPA

The US electricity grid’s average operational emissions (i.e., not LCA-based values) are 429.6 gCO2eq/kWh [17]. The EPA has reported that the average operational GHG emissions to produce electricity in NYS are 189.2 gCO2eq/kWh, which is less than the average US electricity GHG emissions [17]. Even with these low emissions, NYS will need to deeply decarbonize its electricity grid to achieve the CLCPA’s mandates. As noted above, to do so, the CLCPA requires NYS to have 6000 MW of solar energy installed by 2025. Key findings of this study include: (1) panel manufacturing contributes 84.1% to GHG; (2) transportation contributes <1% to GHG and is negligible; (3) BOS components manufacturing, installation, and operation contribute 10.4% to GHG; (4) EoL treatment reduces total GHG by 12.2%; (5) GHG decreases with an increase in capacity factor and increases with an increase in area power ratio; and, (6) monocrystalline panels emit 9.2 gCO2eq more for every kWh produced in comparison with polycrystalline panels.
Based on this study, nearly 3400 ha are required just to meet the solar PV panel area needs represented by the CLCPA’s 2025 mandate of 6000 MW of distributed solar. However, this is the land required if the panels are installed with no spacing between them, i.e., the required panel area estimate. Using an estimate of 2.4 ha required to install 1 MW of solar PV [53], approximately 14,400 ha (i.e., nearly 56 square miles) of land will be required to meet the 6000 MW mandate. Where the 14,400 ha of solar PV are located in NYS will have important land-use implications. Currently, NYS does not prohibit solar PV installations on farmland or forestlands or even limit siting such systems on the state’s prime agricultural lands or in its forests with high carbon stocks. Although this study did not analyze the environmental impacts associated with installing solar PV systems on such lands, an LCA that accounted for land-use change would find that solar PV’s environmental impacts, including GHG emissions, would vary more widely than this study has found. Deforestation would reduce NYS’s future carbon sequestration potential, for example, while the conversion of prime agricultural lands could lead to increased GHG emissions via indirect land-use change. As NYS policymakers implement the CLCPA, they should prioritize those solar PV installations that result in the lowest lifecycle GHG emissions and impacts on other environmental factors. For example, EPA’s RE-Powering project (2022) identified more than 241,918 ha (934 sq. miles) of current and formerly contaminated lands, landfills, and mine sites in NYS that could potentially be used for solar PV systems [54]. Soil carbon levels are often low on many of these disturbed sites and the addition of 551 Mg C/ha over the 30-year life of the solar systems (i.e., 18.4 Mg C/ha-yr, based on the capacity factor of 12.2% and 14,400 ha required to install 6000 MW solar PV by 2025 in NYS) would make the life cycle GHG emissions of solar systems neutral in NYS. Additional carbon sequestration in soils could turn solar systems into carbon-sequestering systems.
A study of the greenhouse gas emissions associated with electricity generation from converting a forest to a solar farm was performed [55]. They have reported 36 gCO2eq/kWh emissions due to the initial removal of vegetation in the forest land, 2 gCO2eq/kWh for 10 years following deforestation due to land-use change effect, 9 gCO2eq/kWh due to loss of forest natural sequestration, and 16–40 gCO2eq/kWh emissions for the life cycle of solar system excluding vegetation considerations. Total emissions from this solar farm are estimated to be 16–87 gCO2eq/kWh, two to four times higher than a solar farm installed on deserted land because no vegetation removal would take place [55]. This shows that clearing forest and converting it into a solar farm can have higher GHG implications than anticipated. A suitable option could be converting degraded lands into solar farms (i.e., installing solar panels and vegetation) which will ensure land management practices to grow vegetation to increase carbon sequestration, but this needs to be researched further. There is little data available to quantify the non-emissions environmental impacts of electricity production from solar farms installed on agricultural land, farmland, or forestland. Direct and indirect land-use change (LUC and iLUC) can affect not just greenhouse gas emissions but also biodiversity and ecosystem health. Of the solar PV systems analyzed in this study, 80% are ground-mounted and 20% roof-mounted. For ground-mounted systems, it is possible that land transformation took place, but this aspect is not considered due to data unavailability. Roof-mounted systems, in contrast, are installed on already existing buildings, so no land conversions are needed. Further investigation is needed to quantify the environmental impacts associated with the land-use change of solar PV installations.
This analysis has determined an average capacity factor across the 120 sites operating in NYS of 12.2% (with 89% sites within 8.93–13.93%), which has important implications for the energy generation available from solar PV installations in the state. At a 12.2% capacity factor, the PV projects called for by the CLCPA 6000 MW (6 GW) mandate would provide approximately 6400 GWh annually. For comparison, Units 2 & 3 at Indian Point Energy Center have a combined capacity of 2.06 GW and an average capacity factor over a decade of 93% [56], representing an approximate 16,800 GWh of production annually. The expected electricity demand in 2025 is 150 TWh [53]; if the CLCPA target of distributed solar is met then based on the CF of this study, distributed solar can provide 4.27% of total electricity demand in 2025. As capacity factors for solar PV systems can vary widely based on geographic region and other factors, this type of analysis using operational data is important to determine accurately the environmental impact of solar PV systems.
Another important implication of this study for the CLCPA implementation in NYS is that end-of-life management of solar panels is found to be important in reducing the environmental impact of solar PV systems. As projects are approved and installed, the state should consider what the end-of-life will look like for these projects. Solar PV panel recycling is currently not done within the state, and panels would likely need to be transported elsewhere for end-of-life management. While transportation emissions are likely to be negligible, how the panels are disposed of and the extent to which materials are recovered affects the life cycle GHG and other environmental impacts.

4.4. Limitations

As is the case for most LCA studies, this analysis has its own limitations related to data availability, assumptions, and methodological choices. First, although operational data were used, the number of years of operational data is not sufficient to accurately determine the panel degradation rate. Therefore, this study relies on an estimated degradation rate commonly agreed upon by experts in the field and supported by the peer-reviewed literature. Second, the environmental impacts arising from the maintenance of faulty components of the PV systems have been omitted. It is understood that these impacts would have a small contribution to the overall impact of the entire system and the incorporation of a degradation fraction already accounts for a decrease in power output over the lifetime of the system. Third, the impact of land use and land transformation is not directly included in the LCA model. Finally, it is assumed that EoL management of PV panels would be carried out in NYS but there is currently no such facility within the state. Used panels may need to be transported to other regions in the event such waste treatment facilities are not deployed in the state when these systems will be decommissioned. Therefore, additional impacts may be added for transportation which would not be substantial as it was shown for panel transportation from the manufacturer to the sites. Despite these limitations, this is the first comprehensive cradle-to-grave LCA study, not only for NYS but for the Northeast US, to present the latest update on the environmental sustainability of solar PV systems based on operational data specific to this geographic region.

5. Conclusions

This study provides an assessment of the environmental impacts of distributed solar photovoltaic energy based on installed solar PV projects throughout the New York state. The net climate change impact varies substantially by site, with a mean of 45.6 gCO2eq/kWh and a standard deviation of 11.9 gCO2eq/kWh. Despite significant snow cover that reduces electricity production during winter seasons in the region and low insolation levels, our analysis shows that mean GHG emissions of solar PV are only 13% higher than the commonly referenced average emissions of PV systems in the U.S. when EoL process is included and 26% higher when EoL process is not included; this is mainly attributed to the efficiency gain of more recent PV systems and the benefits of recovering the materials at the EoL of the panels, which was not typically included in previous studies. Estimates of NYS’s average life cycle GHG emissions for fossil fuels (i.e., a mix of 99% natural gas, 0.7% oil, and 0.3% coal) electricity are 763 gCO2eq/kWh. The installation of 6000 MW of solar PV in the state by 2025 would provide approximately 6400 GWh annually and reduce the state life cycle GHG emissions by more than 4.61 million tonnes of carbon dioxide equivalent per year, assuming that the new solar PV installations displace existing fossil fuel facilities. This analysis can help policymakers, stakeholders, and the public concerned citizens better understand the implications of solar PV requirements in the CLCPA and similar legislative or administrative mandates.

Supplementary Materials

The following supporting information can be downloaded at: https://www.mdpi.com/article/10.3390/en15197278/s1, Table S1: Panel characteristics data of installed panels in NYS; Table S2: List of inventories used for the modeling; Table S3: Analysis of variance for the optimal regression model for estimating the ozone depletion of solar panels; Table S4: Analysis of variance for the optimal regression model for estimating the smog potential of solar panels; Table S5: Analysis of variance for the optimal regression model for estimating the acidification potential of solar panels; Table S6: Analysis of variance for the optimal regression model for estimating the eutrophication potential of solar panels; Table S7: Analysis of variance for the optimal regression model for estimating the carcinogenics potential of solar panels; Table S8: Analysis of variance for the optimal regression model for estimating the non-carcinogenics potential of solar panels; Table S9: Analysis of variance for the optimal regression model for estimating the respiratory effects potential of solar panels; Table S10: Analysis of variance for the optimal regression model for estimating the fossil fuel depletion potential of solar panels; Table S11: Analysis of variance for the optimal regression model for estimating the ecotoxicity potential of solar panels.

Author Contributions

A.A.: Data curation, Software, formal analysis, Writing—original draft. T.W.K.: Data curation, formal analysis. T.A.V.: Conceptualization, Writing—review & editing. R.W.M.: Conceptualization, Writing—review & editing. M.H.E.: Formal analysis, Writing—review & editing. D.K.: Writing—review & editing. T.R.B.: Writing—review & editing. N.N.: Writing—review & editing. O.T.: Conceptualization, Supervision, Writing—review & editing. All authors have read and agreed to the published version of the manuscript.

Funding

This research received no external funding.

Data Availability Statement

The data presented in this study are available within this article and the Supplementary Materials.

Acknowledgments

Both Atif Ali and Theodore Koch are grateful for the graduate assistantships received from the Sustainable Resources Management department at SUNY ESF during their graduate program while they were working on this research project.

Conflicts of Interest

The authors declare no conflict of interest.

References

  1. EIA. Annual Energy Outlook 2022 with Projections to 2050; EIA: Washington, DC, USA, 2022. [Google Scholar]
  2. Sah, D.; Chitra; Kumar, S. Recovery and Analysis of Valuable Materials from a Discarded Crystalline Silicon Solar Module. Sol. Energy Mater. Sol. Cells 2022, 246, 111908. [Google Scholar] [CrossRef]
  3. Fields, J.D.; Ahmad, M.I.; Pool, V.L.; Yu, J.; Van Campen, D.G.; Parilla, P.A.; Toney, M.F.; van Hest, M.F.A.M. The Formation Mechanism for Printed Silver-Contacts for Silicon Solar Cells. Nat. Commun. 2016, 7, 11143. [Google Scholar] [CrossRef] [PubMed] [Green Version]
  4. Azeumo, M.F.; Germana, C.; Ippolito, N.M.; Franco, M.; Luigi, P.; Settimio, S. Photovoltaic Module Recycling, a Physical and a Chemical Recovery Process. Sol. Energy Mater. Sol. Cells 2019, 193, 314–319. [Google Scholar] [CrossRef]
  5. Kaminsky, T. Senate Bill S6599. 2019. Available online: https://www.nysenate.gov/legislation/bills/2019/s6599 (accessed on 20 July 2022).
  6. EEE Inc. Pathways to Deep Decarbonization in New York State; Energy and Environmental Economics, Inc.: San Francisco, CA, USA, 2020. [Google Scholar]
  7. IRENA. Renewable Power Generation Costs in 2019, International Renewable Energy Agency, Abu Dhabi; IRENA: Abu Dhabi, United Arab Emirates, 2020. [Google Scholar]
  8. Fthenakis, V.M.; Kim, H.C. Photovoltaics: Life-Cycle Analyses. Sol. Energy 2011, 85, 1609–1628. [Google Scholar] [CrossRef]
  9. Fu, Y.; Liu, X.; Yuan, Z. Life-Cycle Assessment of Multi-Crystalline Photovoltaic (PV) Systems in China. J. Clean. Prod. 2015, 86, 180–190. [Google Scholar] [CrossRef]
  10. Hsu, D.D.; O’Donoughue, P.; Fthenakis, V.; Heath, G.A.; Kim, H.C.; Sawyer, P.; Choi, J.-K.; Turney, D.E. Life Cycle Greenhouse Gas Emissions of Crystalline Silicon Photovoltaic Electricity Generation. J. Ind. Ecol. 2012, 16, S122–S135. [Google Scholar] [CrossRef]
  11. Mason, J.E.; Fthenakis, V.M.; Hansen, T.; Kim, H.C. Energy Payback and Life-Cycle CO2 Emissions of the BOS in an Optimized 3·5 MW PV Installation. Prog. Photovolt. Res. Appl. 2006, 14, 179–190. [Google Scholar] [CrossRef]
  12. Muteri, V.; Cellura, M.; Curto, D.; Franzitta, V.; Longo, S.; Mistretta, M.; Parisi, M.L. Review on Life Cycle Assessment of Solar Photovoltaic Panels. Energies 2020, 13, 252. [Google Scholar] [CrossRef] [Green Version]
  13. Pacca, S.; Sivaraman, D.; Keoleian, G.A. Parameters Affecting the Life Cycle Performance of PV Technologies and Systems. Energy Policy 2007, 35, 3316–3326. [Google Scholar] [CrossRef]
  14. Grant, C.; Garcia, J.; Hicks, A. Environmental Payback Periods of Multi-Crystalline Silicon Photovoltaics in the United States—How Prioritizing Based on Environmental Impact Compares to Solar Intensity. Sustain. Energy Technol. Assess. 2020, 39, 100723. [Google Scholar] [CrossRef]
  15. Mustafa, R.J.; Gomaa, M.R.; Al-Dhaifallah, M.; Rezk, H. Environmental Impacts on the Performance of Solar Photovoltaic Systems. Sustainability 2020, 12, 608. [Google Scholar] [CrossRef] [Green Version]
  16. Sengupta, M.; Xie, Y.; Lopez, A.; Habte, A.; Maclaurin, G.; Shelby, J. The National Solar Radiation Data Base (NSRDB). Renew. Sustain. Energy Rev. 2018, 89, 51–60. [Google Scholar] [CrossRef]
  17. EPA. EGRID Summary Table; EPA: Washington, DC, USA, 2020.
  18. IEA. Global Energy and CO2 Status Report 2019; IEA: Paris, France, 2019. [Google Scholar]
  19. NREL. Life Cycle Greenhouse Gas Emissions from Solar Photovoltaics; NREL: Golden, CO, USA, 2012.
  20. EPA. Tool for the Reduction and Assessment of Chemical and Other Environmental Impacts (TRACI) TRACI Version 2.1; EPA/600/R-12/554 2012 2012; EPA: Washington, DC, USA, 2012.
  21. ISO 14040; Environmental Management: Life Cycle Assessment; Principles and Framework. ISO: Geneva, Switzerland, 2006.
  22. ISO 14044; Environmental Management—Life Cycle Assessment—Requirements and Guidelines. ISO: Geneva, Switzerland, 2006.
  23. PRé Sustainability Inc. Introduction to LCA with SimaPro 2016; PRé: Amersfoort, The Netherlands, 2016. [Google Scholar]
  24. LTS. DATASMART LCI Package; LTS: Huntington, VT, USA, 2021; Available online: https://ltsexperts.com/wp-content/uploads/2021/12/LTS-DATASMART-Whats-New_2021.pdf (accessed on 20 July 2022).
  25. NYSERDA DER Search DER Facilities in New York State. Available online: https://der.nyserda.ny.gov/search/ (accessed on 15 April 2021).
  26. NERC. Distributed Energy Resources: Connection Modeling and Reliability Considerations 2017; NERC: Atlanta, GA, USA, 2017. [Google Scholar]
  27. Latunussa, C.E.L.; Ardente, F.; Blengini, G.A.; Mancini, L. Life Cycle Assessment of an Innovative Recycling Process for Crystalline Silicon Photovoltaic Panels. Sol. Energy Mater. Sol. Cells 2016, 156, 101–111. [Google Scholar] [CrossRef]
  28. Ports.com Port of Shenzhen, China to Port of New York, United States Distance. Available online: http://ports.com/sea-route/port-of-shenzhen,china/port-of-new-york,united-states/ (accessed on 8 March 2022).
  29. Jordan, D.C.; Kurtz, S.R. Photovoltaic Degradation Rates—an Analytical Review. Prog. Photovolt. Res. Appl. 2013, 21, 12–29. [Google Scholar] [CrossRef] [Green Version]
  30. Boretti, A.; Castelletto, S.; Al-Kouz, W.; Nayfeh, J. Capacity Factors of Solar Photovoltaic Energy Facilities in California, Annual Mean and Variability. E3S Web Conf. 2020, 181, 02004. [Google Scholar] [CrossRef]
  31. SAS Institute Inc. SAS Documentation for SAS 9.3 and Earlier 2011; SAS Institute Inc.: Cary, NC, USA, 2011. [Google Scholar]
  32. Mallows, C.L. Some Comments on C p. Technometrics 1973, 15, 661–675. [Google Scholar] [CrossRef]
  33. Wisnowski, J.W.; Montgomery, D.C.; Simpson, J.R. A Comparative Analysis of Multiple Outlier Detection Procedures in the Linear Regression Model. Comput. Stat. Data Anal. 2001, 36, 351–382. [Google Scholar] [CrossRef]
  34. Ryberg, M.; Vieira, M.D.M.; Zgola, M.; Bare, J.; Rosenbaum, R.K. Updated US and Canadian Normalization Factors for TRACI 2.1. Clean Technol. Environ. Policy 2014, 16, 329–339. [Google Scholar] [CrossRef]
  35. Kim, B.; Lee, J.; Kim, K.; Hur, T. Evaluation of the Environmental Performance of Sc-Si and Mc-Si PV Systems in Korea. Sol. Energy 2014, 99, 100–114. [Google Scholar] [CrossRef]
  36. Stylos, N.; Koroneos, C. Carbon Footprint of Polycrystalline Photovoltaic Systems. J. Clean. Prod. 2014, 64, 639–645. [Google Scholar] [CrossRef]
  37. Kouloumpis, V.; Kalogerakis, A.; Pavlidou, A.; Tsinarakis, G.; Arampatzis, G. Should Photovoltaics Stay at Home? Comparative Life Cycle Environmental Assessment on Roof-Mounted and Ground-Mounted Photovoltaics. Sustainability 2020, 12, 9120. [Google Scholar] [CrossRef]
  38. Collier, J.; Wu, S.; Apul, D. Life Cycle Environmental Impacts from CZTS (Copper Zinc Tin Sulfide) and Zn3P2 (Zinc Phosphide) Thin Film PV (Photovoltaic) Cells. Energy 2014, 74, 314–321. [Google Scholar] [CrossRef]
  39. Bergesen, J.D.; Heath, G.A.; Gibon, T.; Suh, S. Thin-Film Photovoltaic Power Generation Offers Decreasing Greenhouse Gas Emissions and Increasing Environmental Co-Benefits in the Long Term. Environ. Sci. Technol. 2014, 48, 9834–9843. [Google Scholar] [CrossRef]
  40. Lunardi, M.M.; Moore, S.; Alvarez-Gaitan, J.P.; Yan, C.; Hao, X.; Corkish, R. A Comparative Life Cycle Assessment of Chalcogenide/Si Tandem Solar Modules. Energy 2018, 145, 700–709. [Google Scholar] [CrossRef]
  41. Şengül, H.; Theis, T.L. An Environmental Impact Assessment of Quantum Dot Photovoltaics (QDPV) from Raw Material Acquisition through Use. J. Clean. Prod. 2011, 19, 21–31. [Google Scholar] [CrossRef]
  42. García-Valverde, R.; Cherni, J.A.; Urbina, A. Life Cycle Analysis of Organic Photovoltaic Technologies. Prog. Photovolt. Res. Appl. 2010, 18, 535–558. [Google Scholar] [CrossRef]
  43. Parisi, M.L.; Basosi, R. Environmental Life Cycle Analysis of Nonconventional Thin-Film Photovoltaics: The Case of Dye-Sensitized Solar Devices. In Energy Security and Development: The Global Context and Indian Perspectives; Reddy, B.S., Ulgiati, S., Eds.; Springer: New Delhi, India, 2015; pp. 195–210. ISBN 978-81-322-2065-7. [Google Scholar]
  44. EPRI EPRI (Electric Power Research Institute). Literature Review and Sensitivity Analysis of Biopower Life-Cycle Assessments and Greenhouse Gas Emission; Electric Power Research Institute: Palo Alto, CA, USA, 2013; p. 1026852. [Google Scholar]
  45. Burkhardt, J.J., III; Heath, G.; Cohen, E. Life Cycle Greenhouse Gas Emissions of Trough and Tower Concentrating Solar Power Electricity Generation. J. Ind. Ecol. 2012, 16, S93–S109. [Google Scholar] [CrossRef]
  46. DOE U.S. Department of Energy. Wind Vision: A New Era for Wind Power in the United States; US Department of Energy: Washington, DC, USA, 2015.
  47. Eberle, A.; Heath, G.A.; Petri, A.C.C.; Nicholson, S.R. Systematic Review of Life Cycle Greenhouse Gas Emissions from Geothermal Electricity; National Renewable Energy Lab. (NREL): Golden, CO, USA, 2017. [CrossRef]
  48. DOE. Hydropower Vision: A New Chapter for America’s First Renewable Electricity Source; Appendix G; U.S. Department of Energy: Washington, DC, USA, 2016.
  49. IPCC. Renewable Energy Sources and Climate Change Mitigation; IPCC: Geneva, Switzerland, 2011. [Google Scholar]
  50. Whitaker, M.; Heath, G.A.; O’Donoughue, P.; Vorum, M. Life Cycle Greenhouse Gas Emissions of Coal-Fired Electricity Generation. J. Ind. Ecol. 2012, 16, S53–S72. [Google Scholar] [CrossRef]
  51. O’Donoughue, P.R.; Heath, G.A.; Dolan, S.L.; Vorum, M. Life Cycle Greenhouse Gas Emissions of Electricity Generated from Conventionally Produced Natural Gas. J. Ind. Ecol. 2014, 18, 125–144. [Google Scholar] [CrossRef]
  52. Warner, E.S.; Heath, G.A. Life Cycle Greenhouse Gas Emissions of Nuclear Electricity Generation. J. Ind. Ecol. 2012, 16, S73–S92. [Google Scholar] [CrossRef]
  53. NYSERDA. Toward a Clean Energy Future: A Strategic Outlook through 2022–2025; NYSERDA: Albany, NY, USA, 2022. [Google Scholar]
  54. EPA. What Is RE-Powering. Available online: https://www.epa.gov/re-powering/what-re-powering (accessed on 29 March 2022).
  55. Turney, D.; Fthenakis, V. Environmental Impacts from the Installation and Operation of Large-Scale Solar Power Plants. Renew. Sustain. Energy Rev. 2011, 15, 3261–3270. [Google Scholar] [CrossRef]
  56. NEI. Economic Impacts of The Indian Point Energy Center. An Analysis by the Nuclear Energy Institute; NEI: Washington, DC, USA, 2015. [Google Scholar]
Figure 1. Location of the 120 solar photovoltaic sites in New York State, USA analyzed by this study [25]. Only sites with more than one year of available electricity output data were used.
Energies 15 07278 g001
Figure 2. Simplified system diagram showing analysis boundaries, which includes all steps from the extraction of raw materials to manufacturing the panels through transportation, the balance of system components installation and operation of the PV system (collectively referred to as BOS), and end of life of panels.
Energies 15 07278 g002
Figure 3. Monthly capacity factor values from 2014 to 2021 for 120 NYS-based solar PV systems, data collected from [25].
Energies 15 07278 g003
Figure 4. Contribution of panel manufacturing, the balance of system components manufacturing and installation (BOS), transportation, and end-of-life (EoL) to the total impact of solar photovoltaic systems in NYS.
Energies 15 07278 g004
Figure 5. Change in Global Warming Potential (GWP) for polycrystalline and monocrystalline solar panels as a function of average capacity factor and area power ratio.
Energies 15 07278 g005
Figure 6. Normalized Impact plot based on US 2008 impact per person-year.
Energies 15 07278 g006
Table 1. Summary of 120 solar PV systems’ characteristics, installation systems, and system parameters that were used in LCA of solar systems in NYS.
ParameterMeanRangeUnitSources
Panel Characteristics
Panel area1.961.62–2.25m2Panel manufacturers
Panel weight23.4018.6–27.7kgPanel manufacturers
Efficiency17.6615.48–22.2%Panel manufacturers
Installation System
Ground mounting80-%[25]
Roof mounting20-%[25]
Monocrystalline panel32.5-%Panel manufacturers
Polycrystalline panels67.5-%Panel manufacturers
Electricity Production Parameters by Site
Average power capacity2256230–6300kW[25]
Average number of panels6486720–17,472-[25]
Average capacity factor (monthly)12.28.93–18.74%[25]
Average Annual Electricity Production2406213–7105MWh[25]
Table 2. Summary of major flows of materials and energy per functional unit (1 kWh) averaged over the 120 sites for solar panel manufacturing, transportation, balance of systems, and end-of-life processes.
ProcessInput/OutputFlowsQuantity Unit
PV panels manufacturingOutputPV panel
–Mono1.81 × 10−4m2
–Poly1.87 × 10−4
Transportation of PV panels InputTransport (road)6.24 × 10⁻⁴tkm
Transport (ocean)5.29 × 10⁻²tkm
Balance of system components, installation, and operationInputHeat1.23 × 10−3MJ
Electricity1.2 × 10−4kWh
Diesel3.35 × 10−5Liters
Steel1.27 × 10−3kg
Aluminum2.96 × 10−4kg
Transport (road)9.1 × 10⁻³tkm
Concrete (only ground mounting)1.49 × 10⁻³kg
Oil (vegetable)6.83 × 10⁻⁶kg
Plywood2.39 × 10−4kg
Water1.37 × 10−3kg
Plastics1.33 × 10−4kg
Inverters1.15 × 10−4kg
Copper1.71 × 10−4kg
Output Electricity (main product)1kWh
End-of-life—
materials recovery,
landfilling, and incineration
InputTransport (road)6.41 × 10⁻⁴tkm
Net electricity 1.12 × 10⁻⁴kWh
Diesel1.1 × 10−4MJ
Water7.81 × 10−4kg
Nitric acid1.78 × 10−5kg
Lime9.2 × 10−5kg
OutputHeat1.27 × 10−3MJ
Aluminum4.6 × 10−4kg
Glass1.73 × 10−3kg
Copper1.1 × 10−5kg
Silicon8.74 × 10−5kg
Silver1.26 × 10−6kg
Nitrogen oxides5.04 × 10−6kg
Fly ash, contaminated glass, and sludge for Landfilling9.39 × 10−4kg
Ethylene vinyl acetate, poly vinyl fluoride, and plastics from cable for incineration2.18 × 10−4kg
Table 3. Environmental profile of 1 kWh of electricity generation from 120 solar photovoltaic systems in NYS based on a cradle-to-grave life cycle analysis.
Impact CategoryUnitsMean Value
n = 120
Standard Deviation
Global WarmingkgCO2eq/kWh4.56 × 10−21.19 × 10⁻²
Ozone DepletionkgCFC-11eq/kWh6.52 × 10−91.55 × 10⁻⁹
SmogkgO3eq/kWh2.92 × 10−37.49 × 10⁻⁴
AcidificationkgSO2eq/kWh2.25 × 10−45.74 × 10⁻⁵
EutrophicationkgNeq/kWh2.81 × 10−46.88 × 10⁻⁵
CarcinogenicsCTUh/kWh7.32 × 10−91.73 × 10⁻⁹
Non-carcinogenicsCTUh/kWh4.07 × 10−89.62 × 10⁻⁹
Respiratory EffectskgPM2.5eq/kWh6.29 × 10−51.68 × 10⁻⁵
EcotoxicityCTUe/kWh1.870.44
Fossil Fuel DepletionMJ surplus/kWh4.76 × 10−21.18 × 10⁻²
Table 4. Analysis of variance for the optimal regression model (R2 of 0.817) for estimating the global warming potential of solar panels.
VariableParameter
Estimate
Standard
Error
F ValuePr > |t|
Intercept15.316.186.130.0149
Monocrystalline 10.270.67231.77˂0.0001
Area Power Ratio9.790.79153.01˂0.0001
Average Capacity Factor−2.590.2791.95˂0.0001
Table 5. Life cycle greenhouse (GHG) emissions comparison of first, second, and third-generation solar photovoltaic systems.
Studied Solar PanelsGHG
(gCO2eq/kWh)
LocationSource
First Generation
Monocrystalline and polycrystalline (cradle-to-grave)45.6New York StateThis study
Monocrystalline and Polycrystalline (cradle-to-grave) 40Global [19]
Monocrystalline with PCS (cradle-to-grave)41.8Korea[35]
Polycrystalline with PCS (cradle-to-grave)31.5
Polycrystalline (cradle-to-use)58.8Greece[36]
Polycrystalline (cradle-to-gate) 50.9China[9]
Ground mounted Polycrystalline(cradle-to-gate)42.7Greece[37]
Roof mounted Monocrystalline(cradle-to-gate)54.3Greece[37]
Second Generation
Copper Zinc Tin Sulfide (CZTS) (cradle-to-gate)38Laboratory scale[38]
Zinc Phosphide (ZN3P2) (cradle-to-gate)30
Copper Indium Gallium Selenide (CIGS) (cradle-to-grave)22United States[39]
Cadmium Telluride (CdTe) (cradle-to-grave)20
CIGS/Si (cradle-to-grave)29China[40]
CZTS/Si (cradle-to-grave)26
AZTS/Si (cradle-to-grave)25
Third Generation
Heterojunction Organic Cell (cradle-to-gate)54.9Laboratory scale[42]
Quantum Dot PV (QDPV) (cradle-to-gate)5Laboratory scale[41]
Dye-Sensitized Solar Devices (DSSD) (cradle-to-gate)22.3Laboratory scale[43]
Table 6. Comparison of this study’s life cycle greenhouse gas (GHG) emissions with other renewable and non-renewable electricity generation systems.
TechnologyGHG (gCO2eq/kWh)Source
Renewable Energy SystemsSolar PV (crystalline based)45.6This study
Biomass52[44]
Photovoltaic (thin film and Si-based)43[10]
Concentrated Solar Power -CSP (tower and trough)28[45]
Wind (land-based and offshore)13[46]
Geothermal37[47]
Hydropower21[48]
Ocean 8[49]
Fossil Fuel-based and Non-renewable Energy SystemsOil840[49]
Coal1001[50]
Natural Gas486[51]
Nuclear13[52]
Publisher’s Note: MDPI stays neutral with regard to jurisdictional claims in published maps and institutional affiliations.

