Article

Heat Transfer and Structural Characteristics of Dissimilar Joints Joining Ti-64 and NiTi via Laser Welding

Mechanical Engineering, Youngstown State University, Youngstown, OH 44555, USA
*
Author to whom correspondence should be addressed.
Energies 2022, 15(19), 6949; https://doi.org/10.3390/en15196949
Submission received: 7 September 2022 / Revised: 16 September 2022 / Accepted: 20 September 2022 / Published: 22 September 2022
(This article belongs to the Section J: Thermal Management)

Abstract

:
This study investigates the thermal-stress characteristics of a bi-metallic Ti-6Al-4V-Nitinol butt joints manufactured via laser welding. Particularly, the thermal profile along the weld interface and the deformation profile of the finished welded workpiece. A decoupled transient thermomechanical simulation model was constructed to recreate the welding process. This decoupled thermomechanical simulation model consisted of two transient simulation models. A transient thermal simulation model and a transient structural simulation model, with the thermal history of the transient thermal model being fed into the transient structural model. Both the thermal and structural portions of the model utilized temperature-dependent thermal and structural properties of Ti-6Al-4V and Nitinol. The temperature profile of the transient thermal-stress model aligns with the experimental thermal profile within 5% error. The deformation profile also matches the experimental results within 5% error. This approach to modeling laser welding can stand as a guide to predict both thermal and deformation profiles generated during the laser welding process.

1. Introduction

Laser welding (LW) is a popular fusion bonding process [1]. LW is a commonly used in the automotive industry as it has significant advantages over more traditional welding techniques such as resistance spot welding (RSW) [1,2]. LW allows for a wide range of material combinations, in addition to being a noncontact process [3]. The wide range of material selection and virtually no tool wear make LW an industry standard for automated manufacturing processes especially assembly line production. The primary limitation of LW is that the workpieces to be joined must remain fixed relative to the laser’s focal point during the process [1,4].
The LW process can be broken into 4 steps, which are initial contact, heat diffusion, melting, and resolidification [5]. Step 1 consists of the laser’s initial point of contact, where the workpiece materials begin absorbing the laser energy. Step 2 begins instantaneously once step 1 occurs. During step 2 the absorbed laser energy is diffused into the bulk material via conduction. Once the material at the point of contact reaches its melting temperature step 3 occurs. In step 3 a melting pool forms. When the melting pool has formed step 4 occurs, in which the laser’s point of contact moves forward along the weld interface. This allows the melting pool to resolidify and steps 1 through 3 occur at the new location along the weld interface. This results in a moving melting pool which is followed by a moving resolidification front. The welding process is complete once the resolidification front reached the end of the weld interface. A diagram illustrating this process can be seen in Figure 1.
Thermal modeling of LW has been explored in [6] as part of a thermomechanical simulation study whose focus was determining the effect of thermal strain and strain caused by phase transformation on the residual stress on the welded component. The parameters under consideration in this study were weld power, velocity, shielding gas flow rate, laser radius of the sphere of influence, laser radius of the cone of influence, and plate thickness. The ability to predict the temperature profile of the weld interface during the welding process can allow for temperature optimization. The temperature profiles at different distances were then compared to experimental values. From the simulated thermal history, the phase transformation and residual stress were calculated for the welded part.
Thermomechanical analysis of keyhole LW was also performed in [7]. In a similar manner to [6], this study focused on thermal modeling to determine what phase transformation occurred to how both of those influenced the residual stress of the welding keyhole area. This study also sought to compare the simulated material hardness to experimental data. In addition, this study did not investigate the deformation profile along the welded area. Instead focusing on directional and residual stress.
However, these studies looked at model geometries with large thicknesses. With [6] having a plate thickness of 4.24 mm and [7] having a plate thickness of 6 mm. In addition, these studies focused primarily on residual stress while not noting the deformation profiles generated from said stress.
The study in [8] focused on the experimental joining of dissimilar metals via LW and a thermal simulation of the welding process. A summary of the process parameters used for that study can be seen in Table 1. Note that the disparity between the measured weld time and the theoretical weld time arose from the time required for the LW machine to align the laser head at the beginning and end of the LW process.
The materials used were Ti-6Al-4V (Ti-64) [9], and Nitinol (NiTi) [10]. Ti-64 is the material of choice for the creation of Blisks [11], but Ti-64 is also used in the medical industry as an implant material for artificial knees, hip, shoulder joints, and bone fixators [12]. Ti-64 is so highly favored for use in implants because it has excellent biocompatibility, especially with bone tissue [13].
The thermal model in [8] was a two-dimensional model for the transient thermal analysis, which was capable of simulating the moving heat input which simulated the movement of the laser along the intended weld interface. While this was successful in predicting the maximum temperature during the welding process compared to the experimental results, it could not accurately predict the temperature profile along the weld interface. In addition, it was not coupled to a structural simulation to determine the weld deformation created at the end of the LW process. The work detailed herein improves upon simulation work in [8] by developing a decoupled transient thermomechanical simulation model to determine the temperature profile and deformation profile at the end of the LW process.
The main goal of this work is to simulate the LW process thermally and structurally to determine how the temperature profile changes during the welding process and how the structure distorts at the weld of the welding process. The simulation primarily focuses on comparing the thermal profile at the end of the welding process and the final deformation profile across the weld interface at the end of the welding process. Understanding the thermal and structural characteristics of the weld interface during the LW process makes it possible to determine what process parameters will not produce a successful weld. Thus, through the use of simulations the necessary weld parameters can be determined without sacrificing materials and time.
To summarize, the current work aims to:
  • create a simulation model to continue further evaluating the work completed in [8];
  • develop a thermal-stress model to compare against an experimental welding specimen.
  • determine the effect of reduced weld speed has on heat retention, and deformation profiles along the weld interface.
This work created a model that allows for identifying heat retention and weld distortion. In addition, this work seeks to detail methods, assumptions, and modeling to better predict temperature profiles and structural characteristics.

2. Materials and Methods

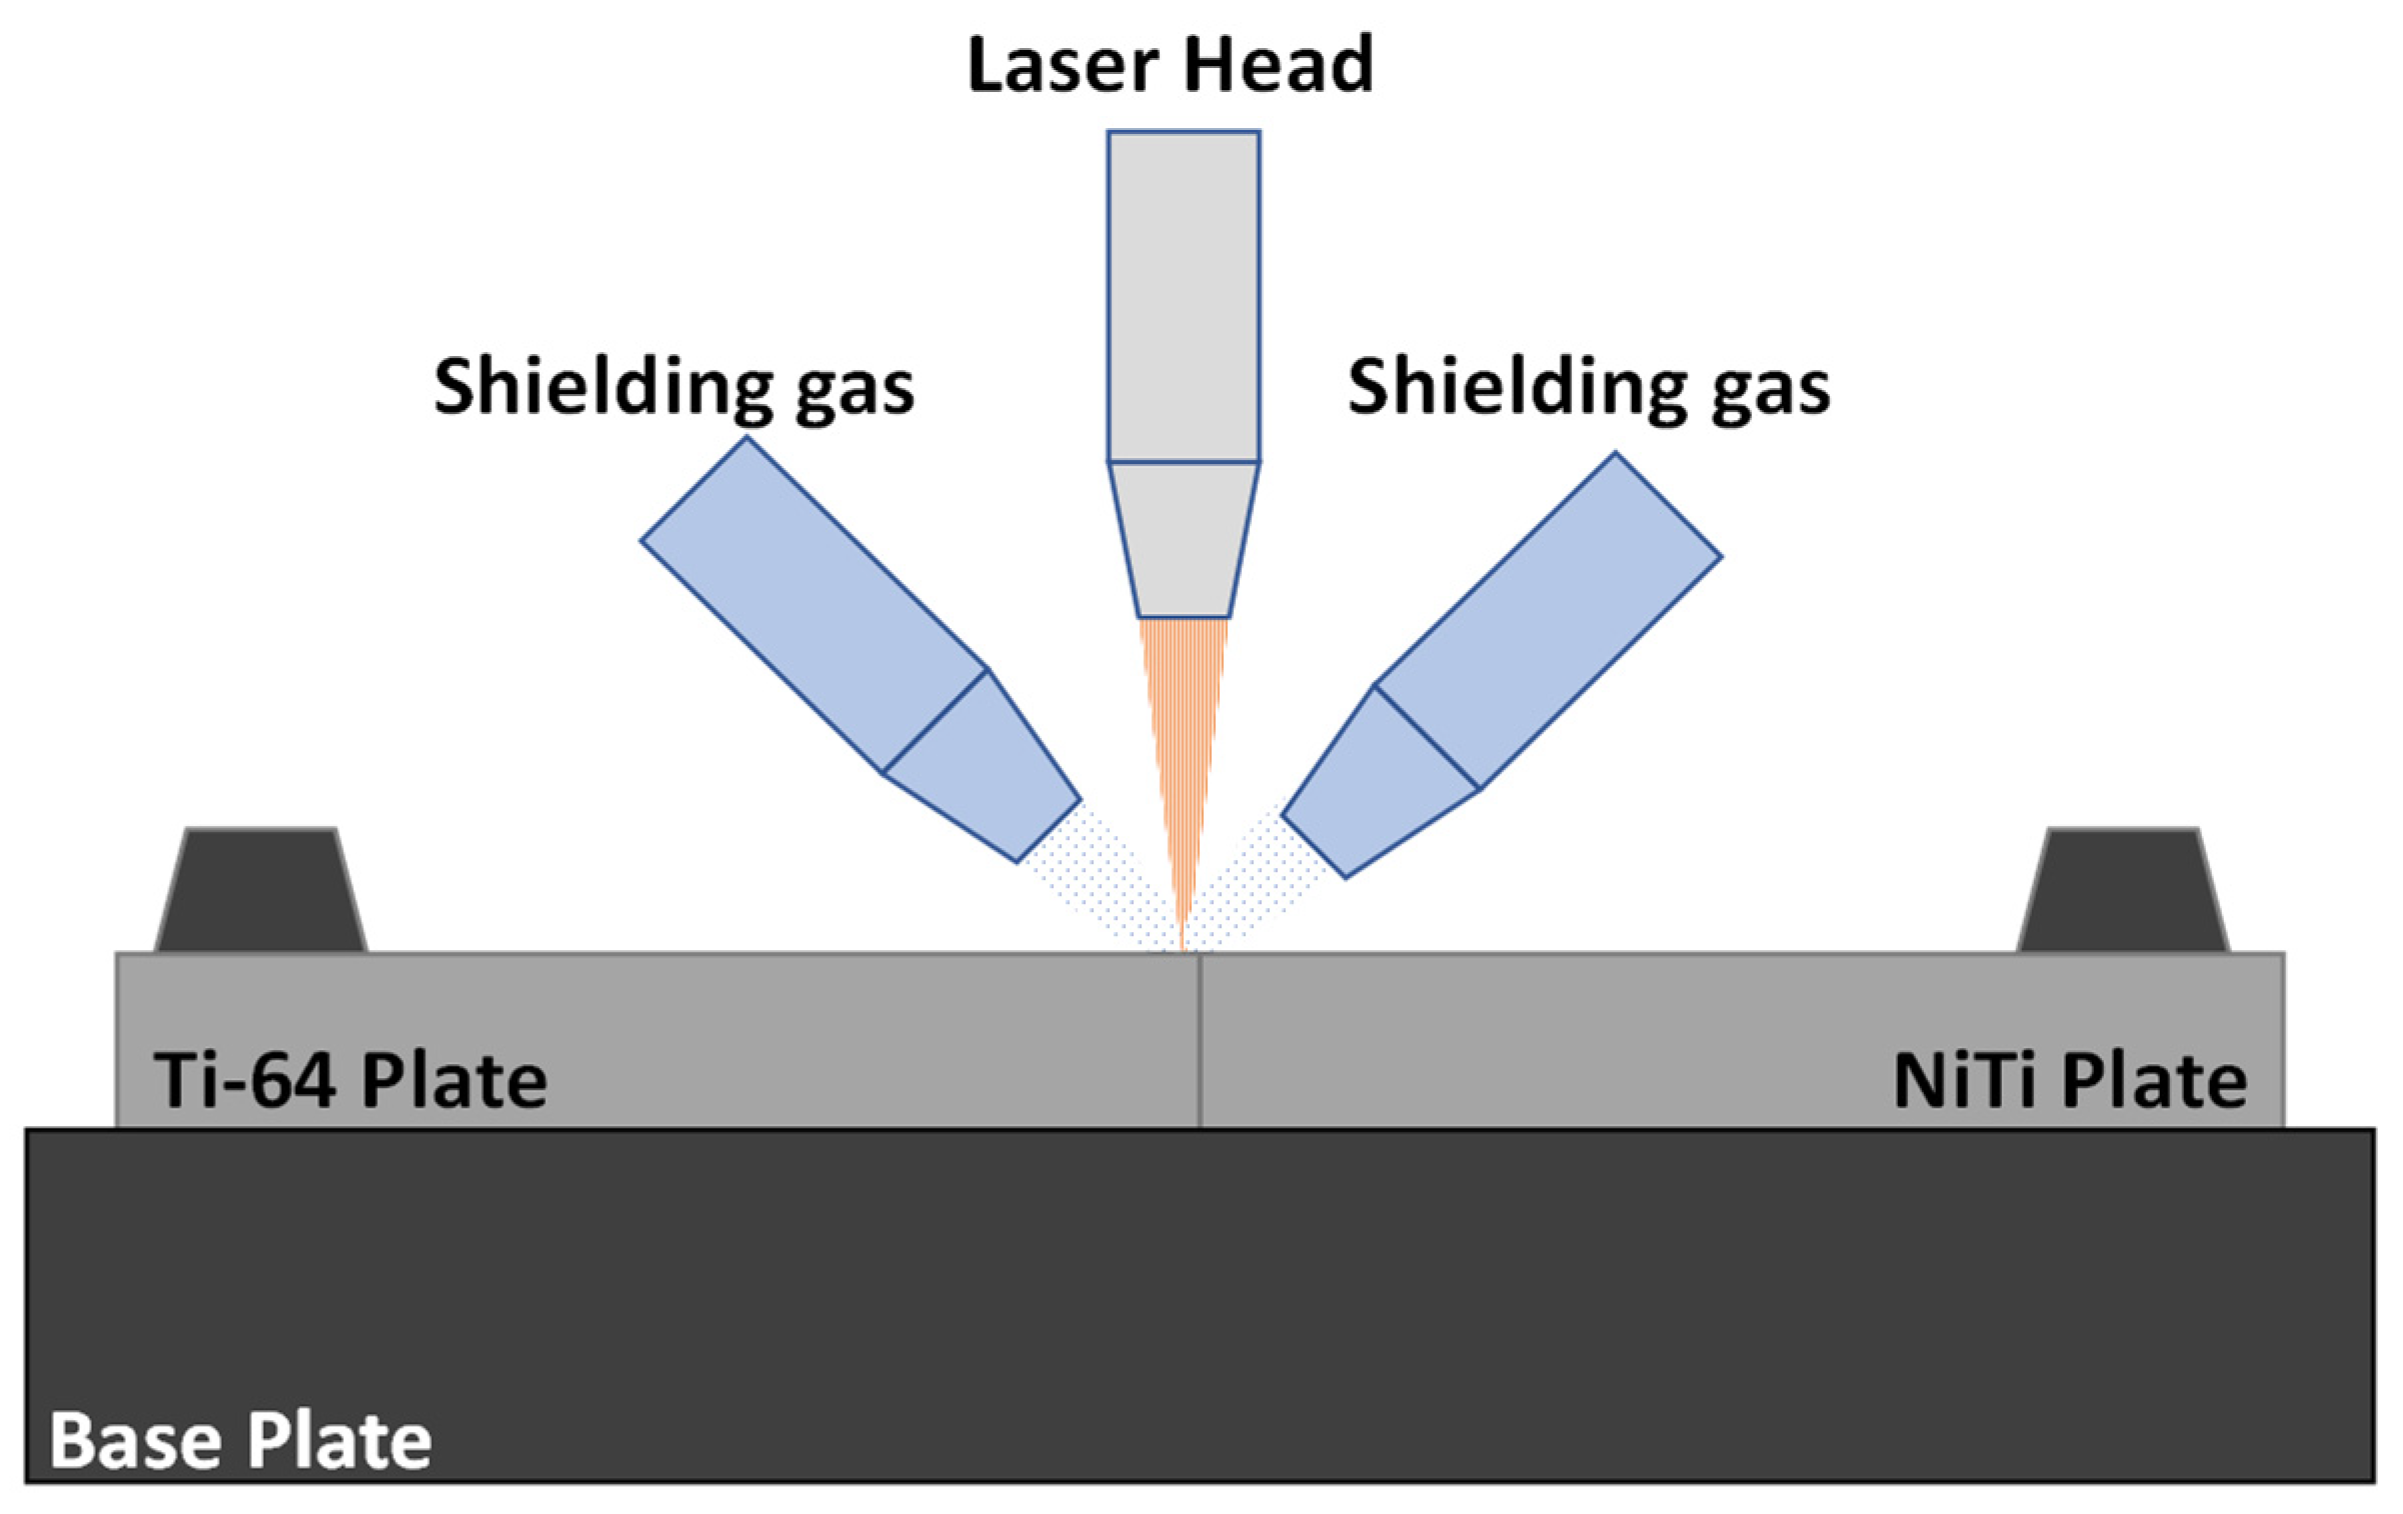
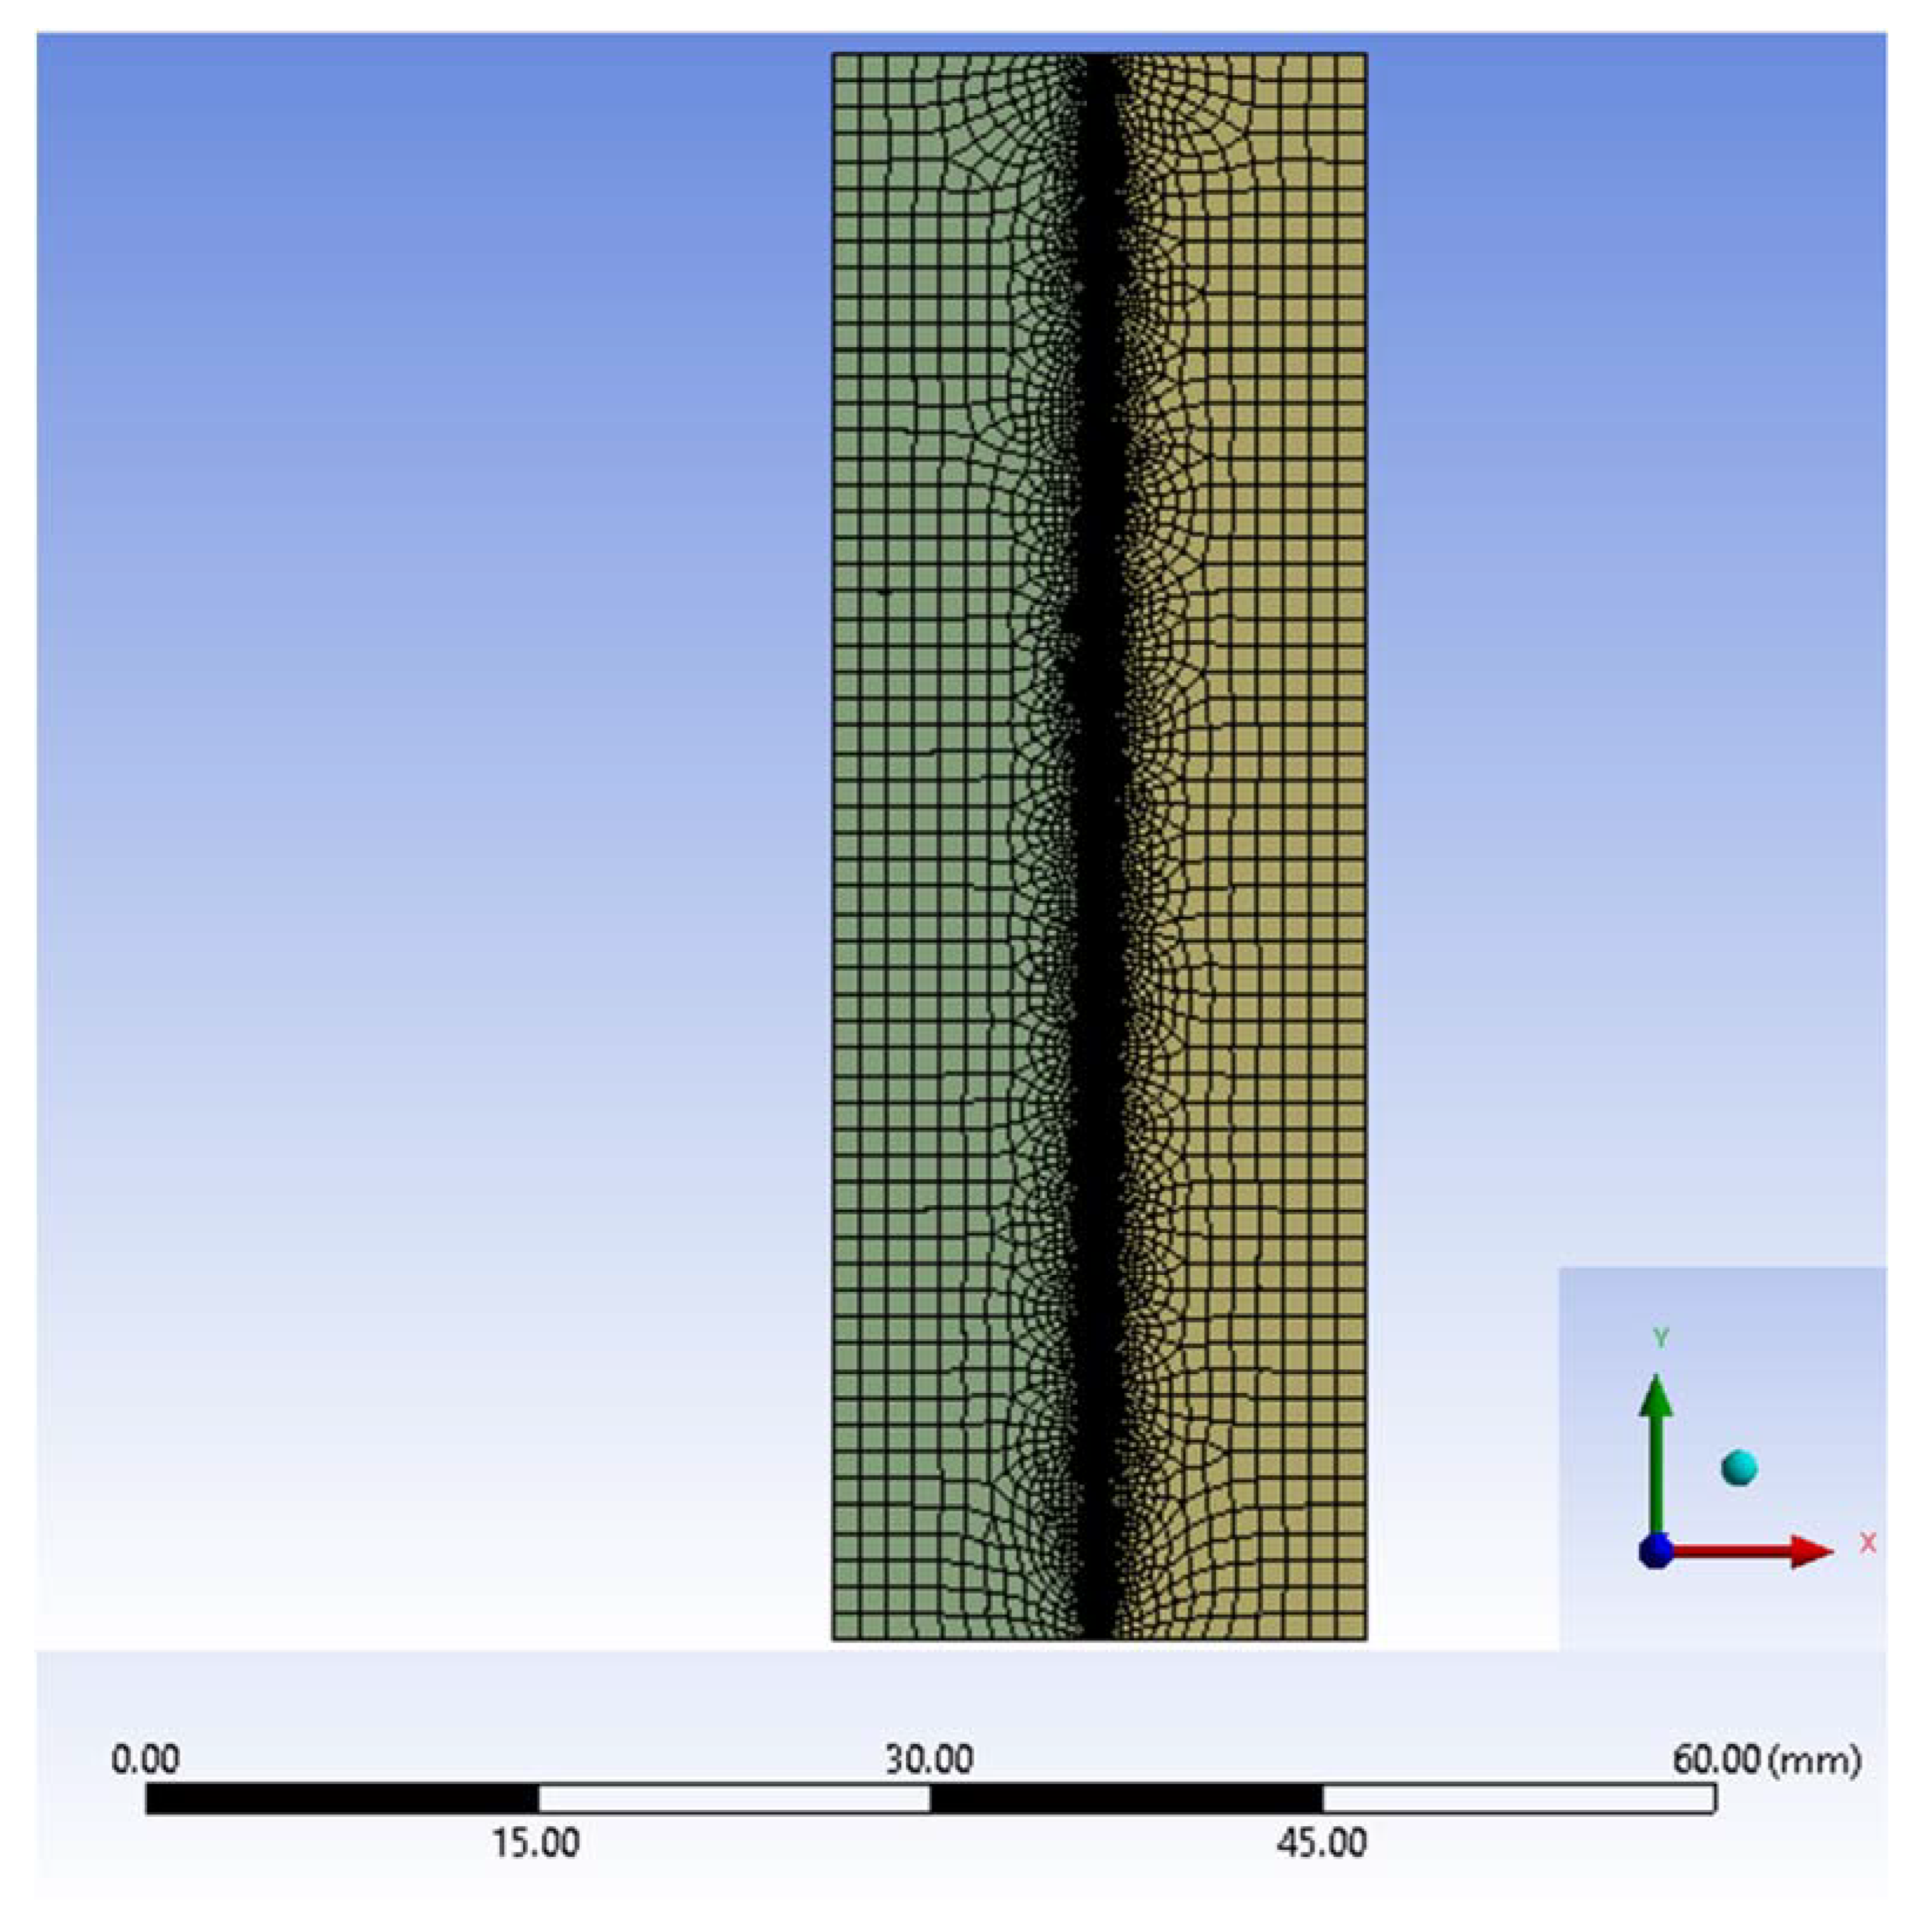
2.1. Simulation Structure
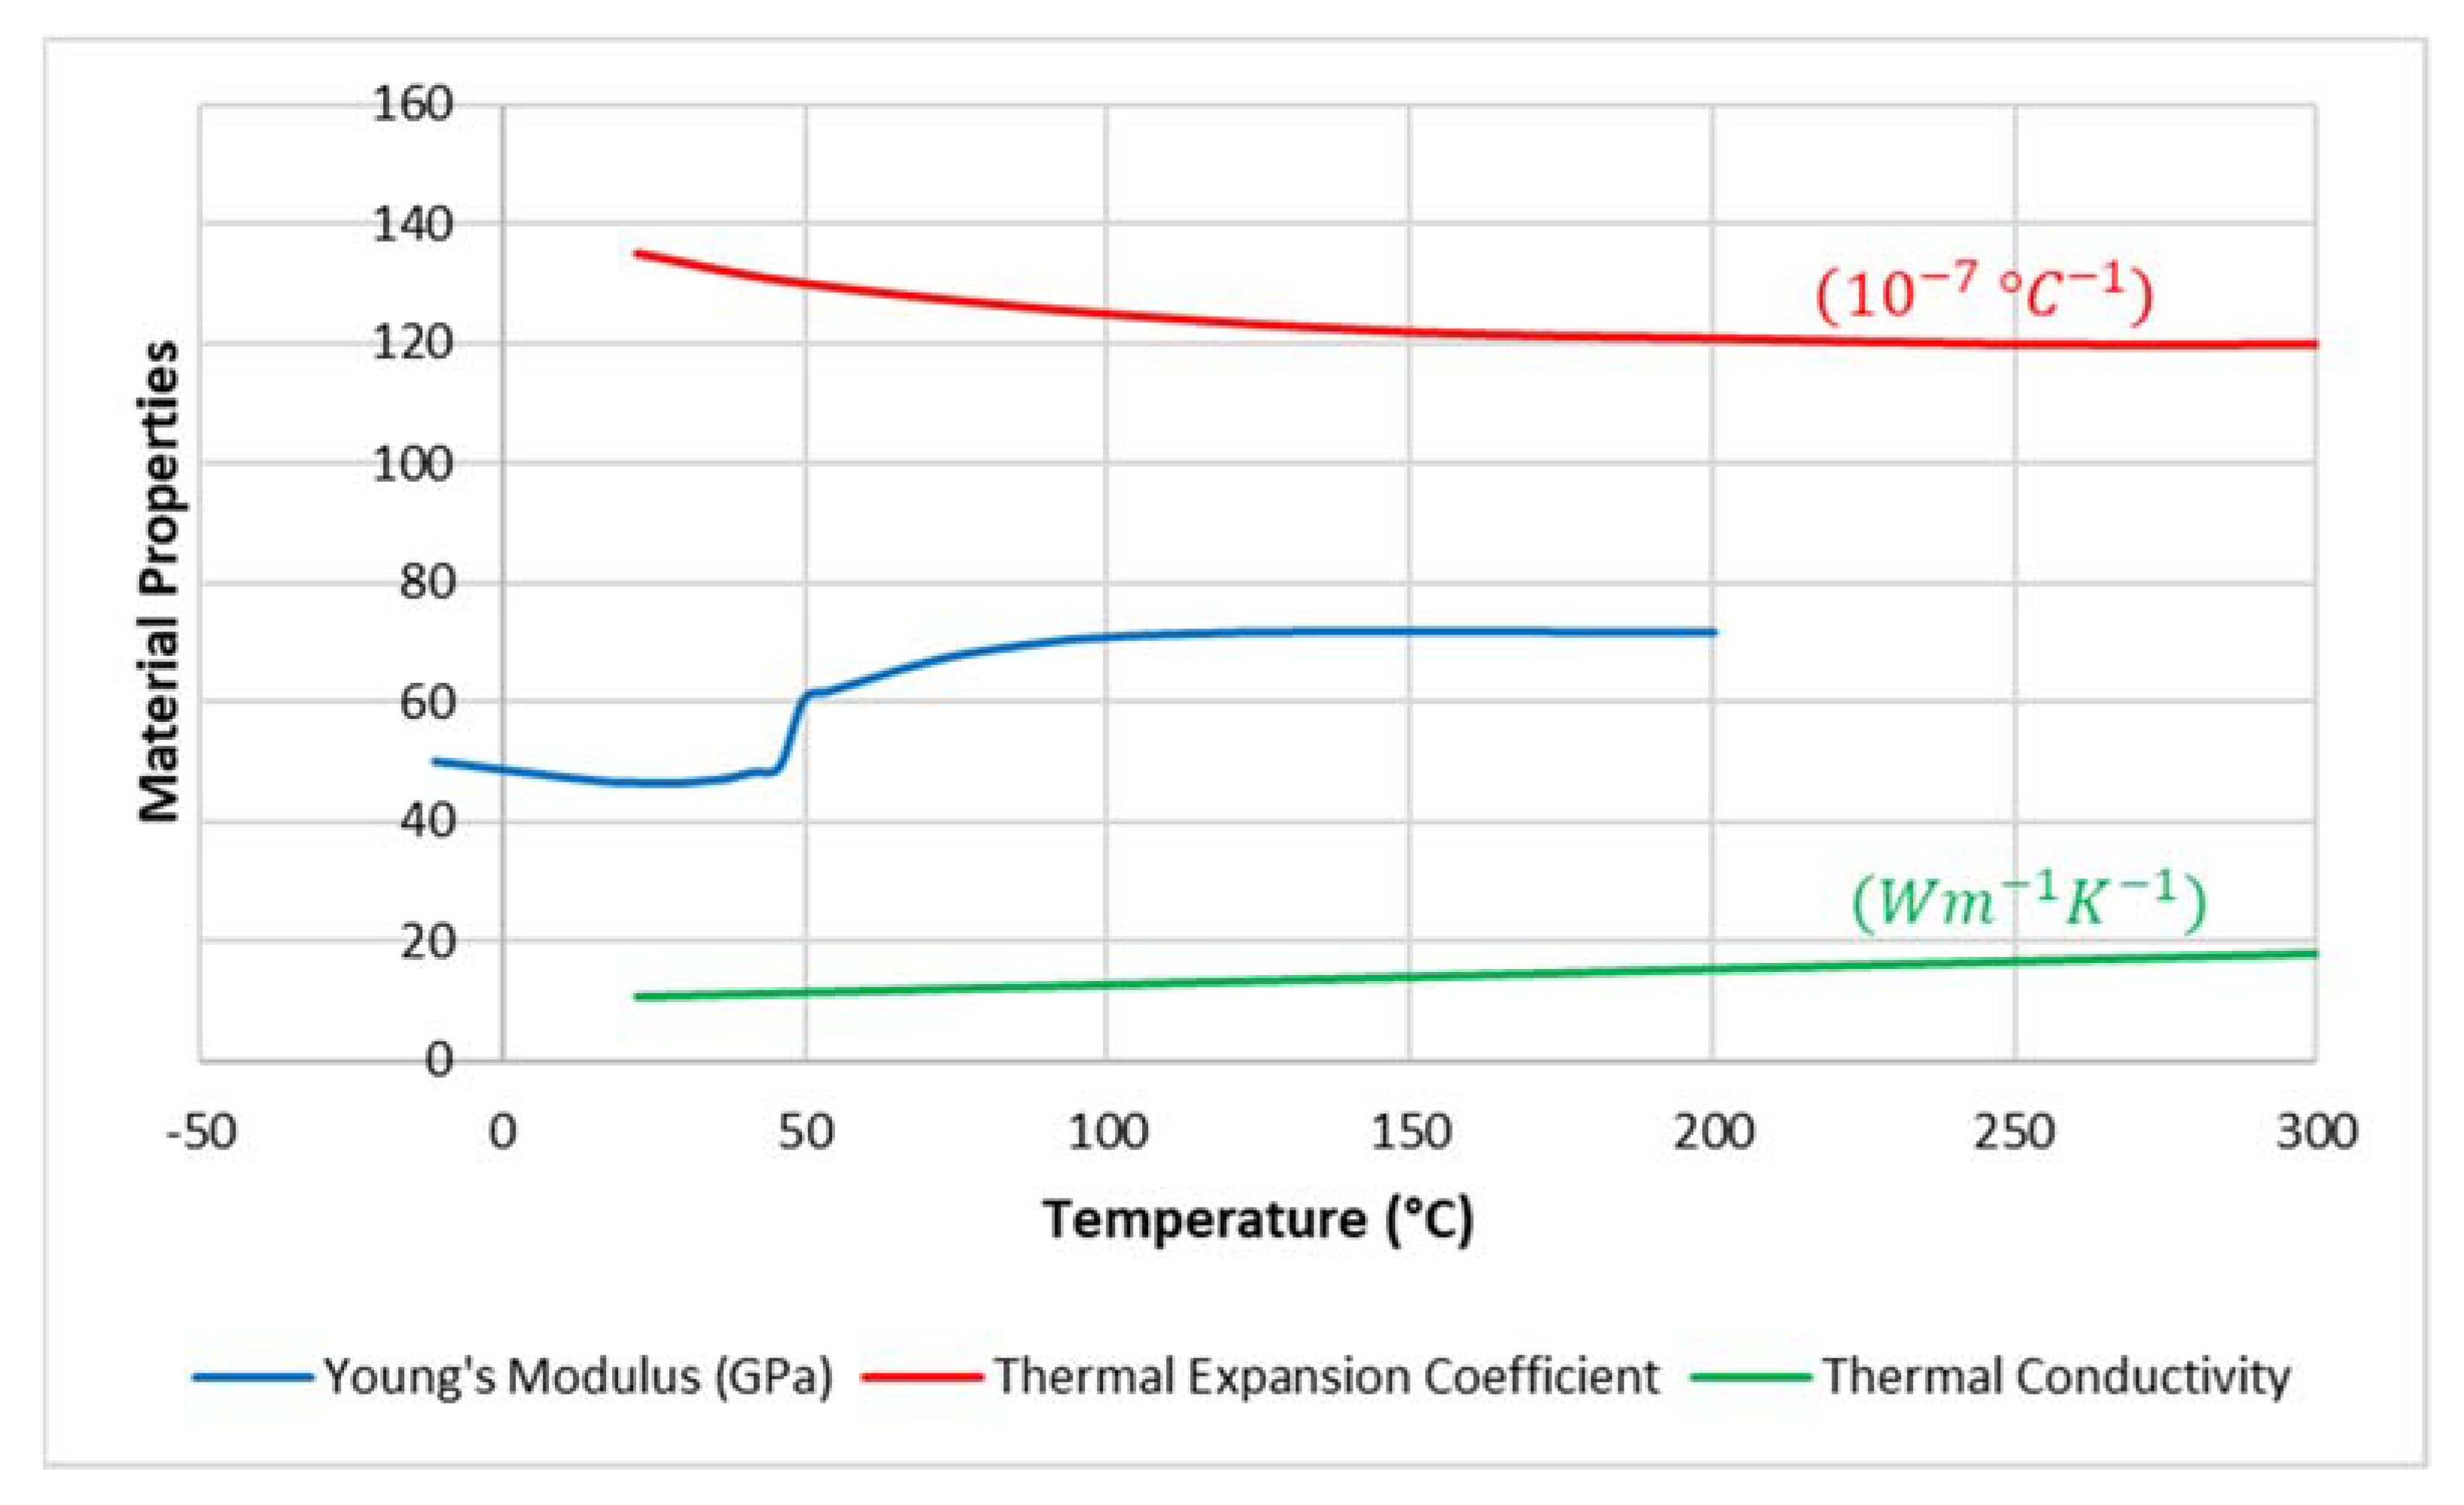
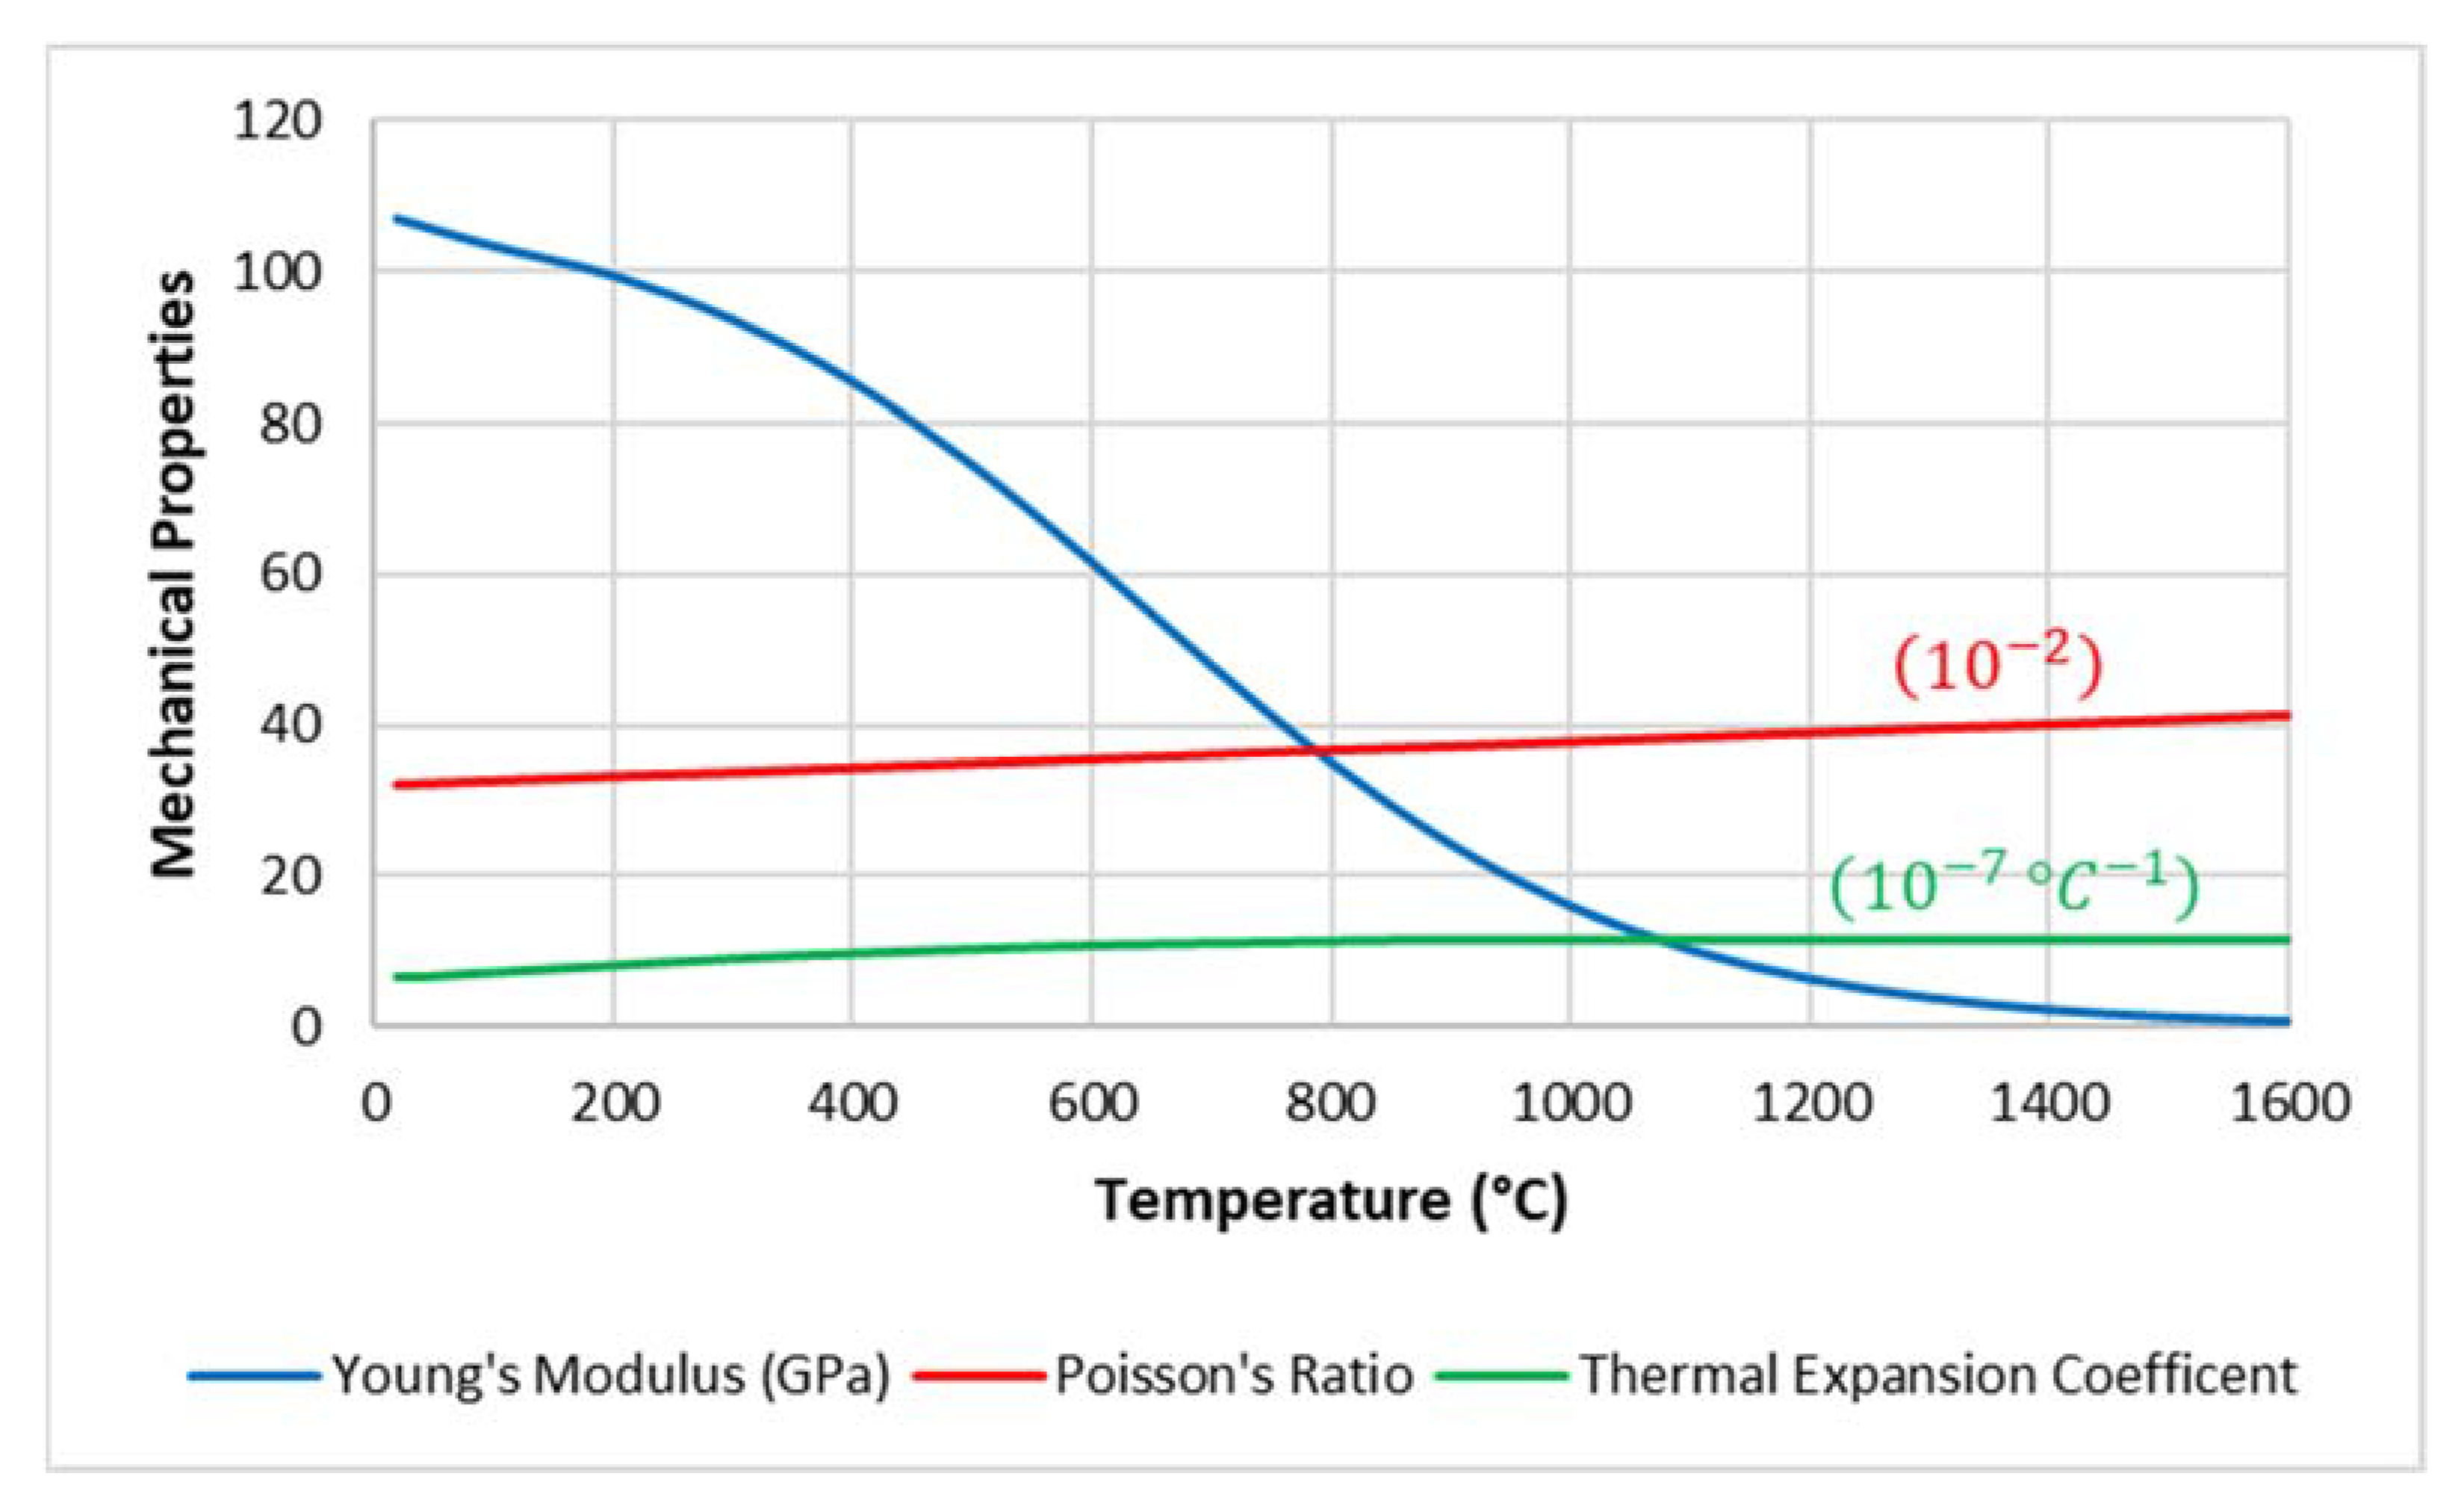
To predict the thermal profile and model distortion of two simple rectangular prisms, a model of the LW process was created in ANSYS Workbench. The choice to use of a commercially available software for this study made as the software offered the ability to easily adjust parameters, and the ability to apply both thermal loads and structural constraints to 3D geometries.
The model was designed to match the experimental build from [8], where the welding process was thermally recorded using an IR camera. The camera captured the top view of the thermographic profile for both workpieces during the LW process. From the IR data, a thermograph displaying the temperature field at the end of the welding process was selected. The thermal profile along the weld interface was extracted from the thermograph and depicted temperature as a function of pixel length. This profile was then converted to display the temperature as a function of workpiece length.

Material Properties

The general properties of NiTi were primarily used. A summary of the general properties can be found in Table 2.
To supplement the general properties, several temperature-dependent thermal and structural properties were added. These properties came from open literature sources [14] and [15]. The temperature-dependent properties of NiTi can be seen in Figure 2. The emissivity of NiTi was approximated to be that of Nickel under high thermal load [16].
The ANSYS model utilized temperature-dependent thermal and structural properties for Ti-64. These transient properties for Ti-64 were based on open literature sources [17,18]. The temperature-dependent thermal properties can be seen in Figure 3, while the temperature-dependent mechanical properties are shown in Figure 4. To account for Ti-64’s stress hardening at high temperatures, bilinear hardening based on open literature [17] was also added to the model. Figure 5 displays the bilinear hardening profiles of Ti-64 at varying temperatures. The emissivity of Ti-64 was approximated to 0.30 [19].
Note that in Figure 4 the thermal properties each have a different temperature range for which they are considered functions of temperature. For each thermal property it is assumed that for temperature values outside the given thermal range the thermal property is a constant value.

2.2. Simulation Model

The model created in ANSYS was divided into two interlinked models. A two-dimensional transient thermal model and a three-dimensional transient structural model. This was done to save computation time as both workpieces had identical dimensions and their thicknesses were far less than their lengths d / L 0.033 0.1 . Thusly, the temperature gradient through the thickness of the workpieces can be assumed to be constant. This allowed for a quick thermal simulation whose thermal history would then be imported into a structural simulation with a finer mesh. The model geometry of the transient thermal model can be in Figure 6.
Note that the three-dimensional structural model has the same two-dimensional surface dimensions as the thermal model, thus Figure 6 also illustrates the top view model geometry of the structural simulation model.
The thermal model utilized a combination of triangular and quadrilateral mesh elements. The weld interface was divided into 12 segments each having 60 divisions, while the left and rightmost edges of the geometry each had 40 divisions. Along with this, smoothing was set to high, and element edges were set to be straight. The mesh across the entire model geometry can be seen in Figure 7. The element size and all other mesh settings were left to their default values. The structural model utilized hex-type elements with a total of 65,351 nodes and 20,869 elements. Again, smoothing was set to high, and the element edges were set to be straight. In addition to this, the element size was set to 1 mm. All other mesh settings were left to their default values. The choice of mesh sizing for both the thermal and structural models was made so that the number of nodes generated would not exceed the limit allowed by the FEA software, while still having a dense mesh along the weld interface along with an average mesh quality above 0.75.

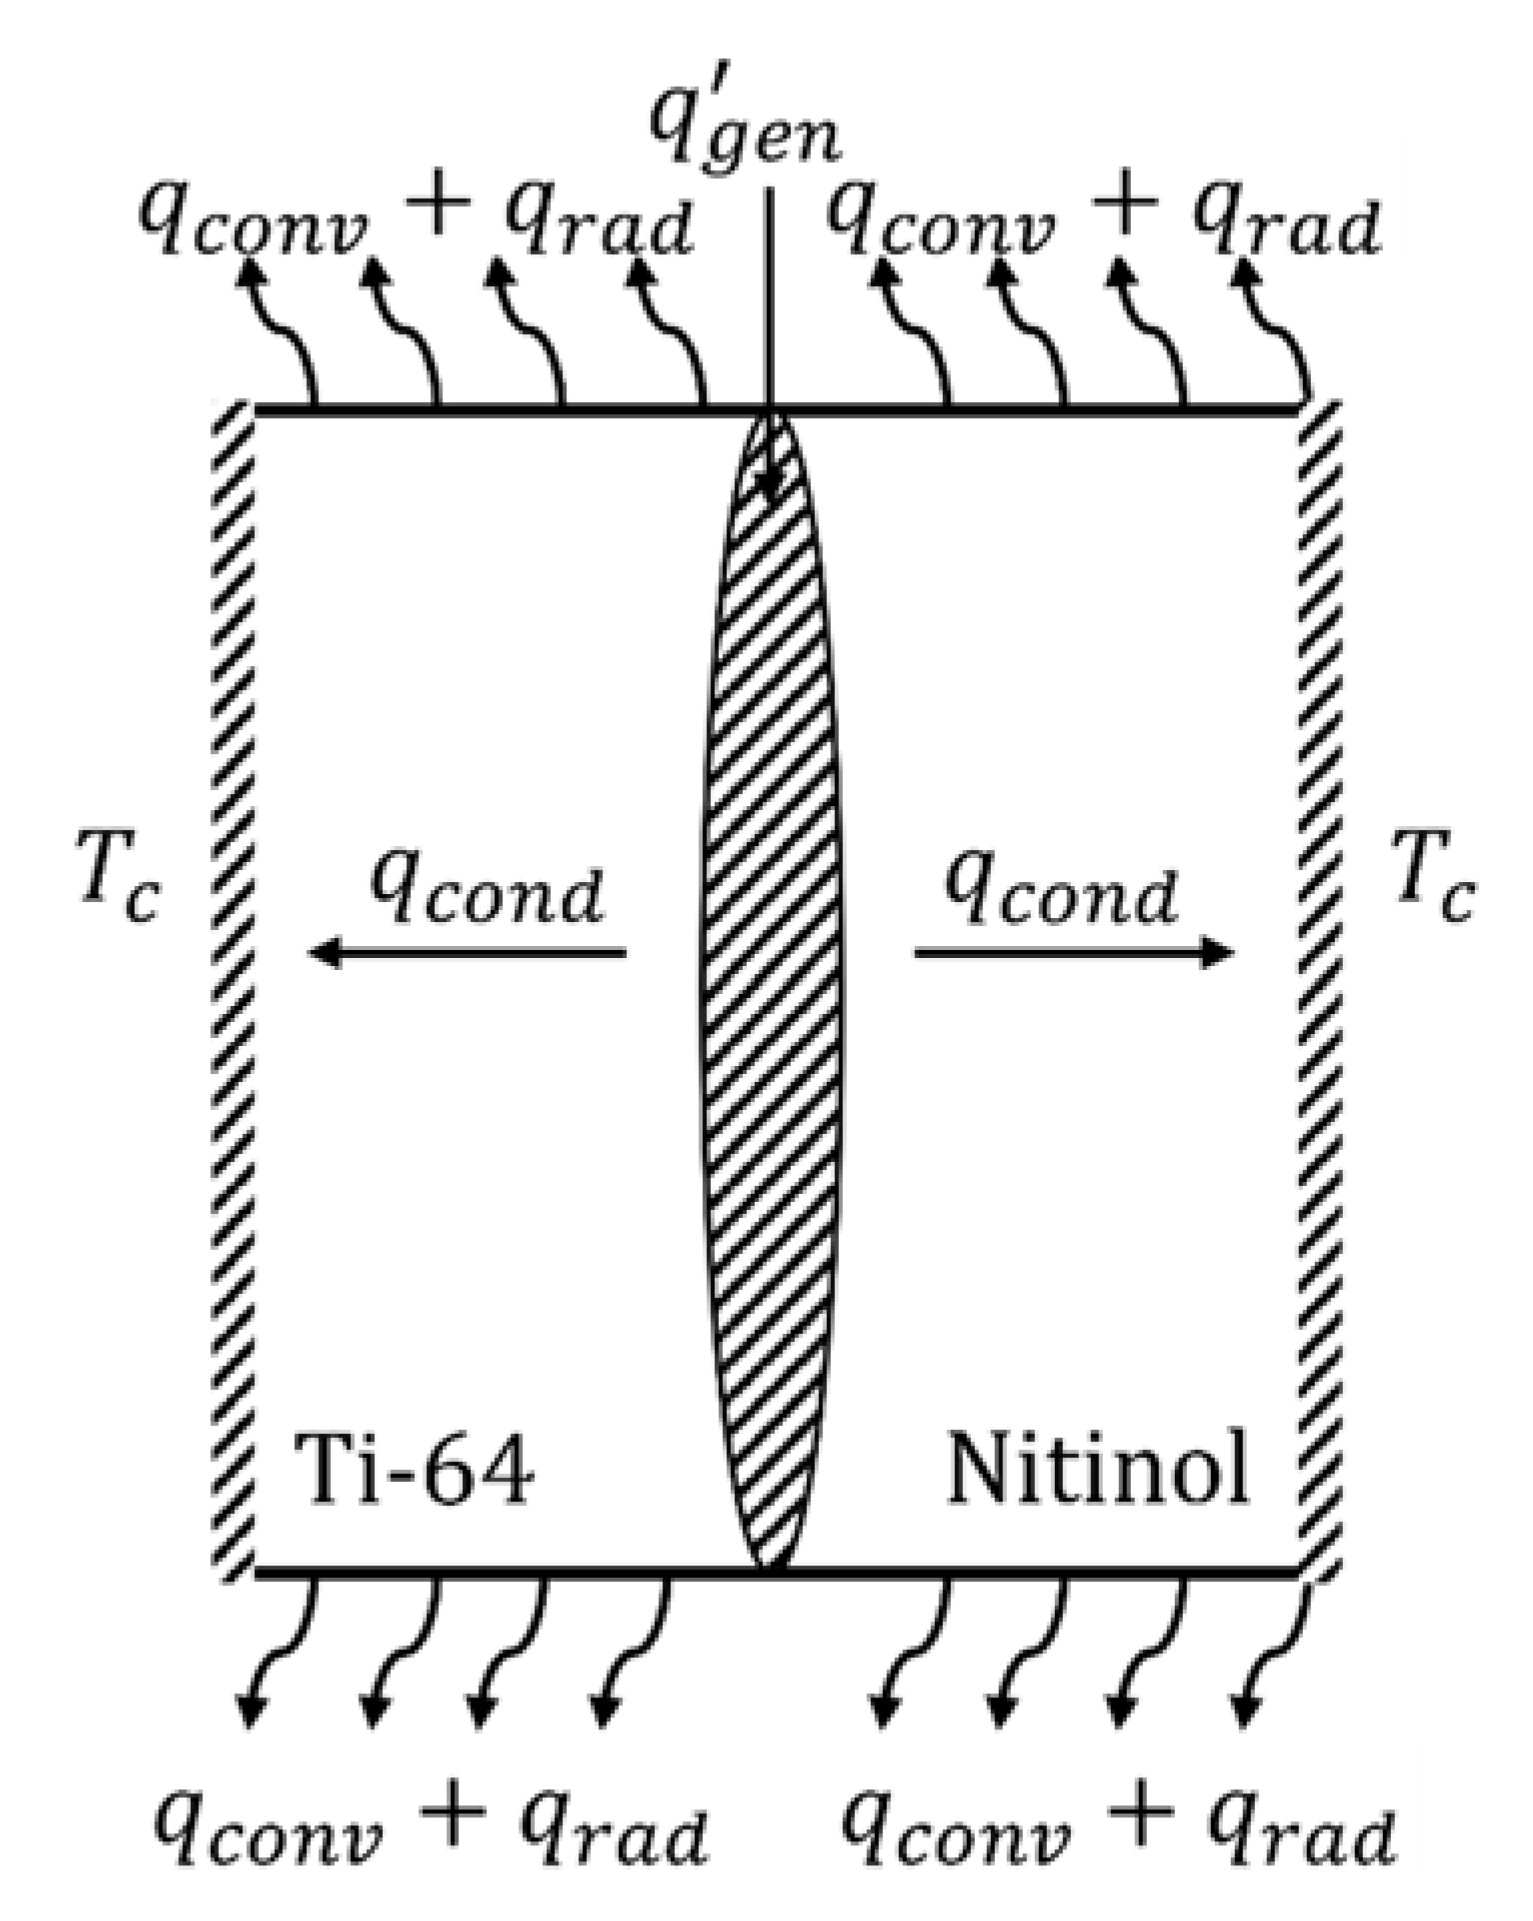
2.2.1. Thermal Model

The transient thermal model considers conduction, convection, and radiation as heat transfer mechanisms. The governing equation used in the transient thermal simulation is the energy balance for heat conduction through a solid body, shown in Equation (1). This shows mathematically how the mechanisms relate to the changing temperature as a function of weld time. Since both the surrounding air and the workpieces are completely stagnate during the LW process, the convection coefficient of air over a flat plate was used. The governing equation utilized by ANSYS Transient Thermal can be seen in Equation (1):
ρ C p d T d t = k δ T x + δ T y + h A s T T a m b + ε σ A s T 4 T s u r r 4 + z q
where ρ is the density (kg/m3), t is the time (s), k is the thermal conductivity (W/m·K), C p is the heat capacity of the plate material (J/kg·K), T is the plate temperature (°C), T a m b is the temperature of the ambient air, T s u r r is the temperature of the surroundings to which the element radiates (°C), h is the heat transfer coefficient (W/m2·K), ε is the emissivity of the material, A s is the surface area (m2), σ is the Stefan-Boltzmann constant (W/m2·K4), q is the heat flux (W/m), and x , y , and z values represent distances along the element (m).
Figure 8 illustrates the both the thermal boundary conditions and loads applied to the thermal model. In addition, constant emissivity values for both materials were used to account for radiation effects on the outer edges of the workpieces. The ambient temperature of the model was set at 22 °C. The temperature-dependent material properties of Ti-64 and NiTi were added into ANSYS to allow for greater model accuracy.

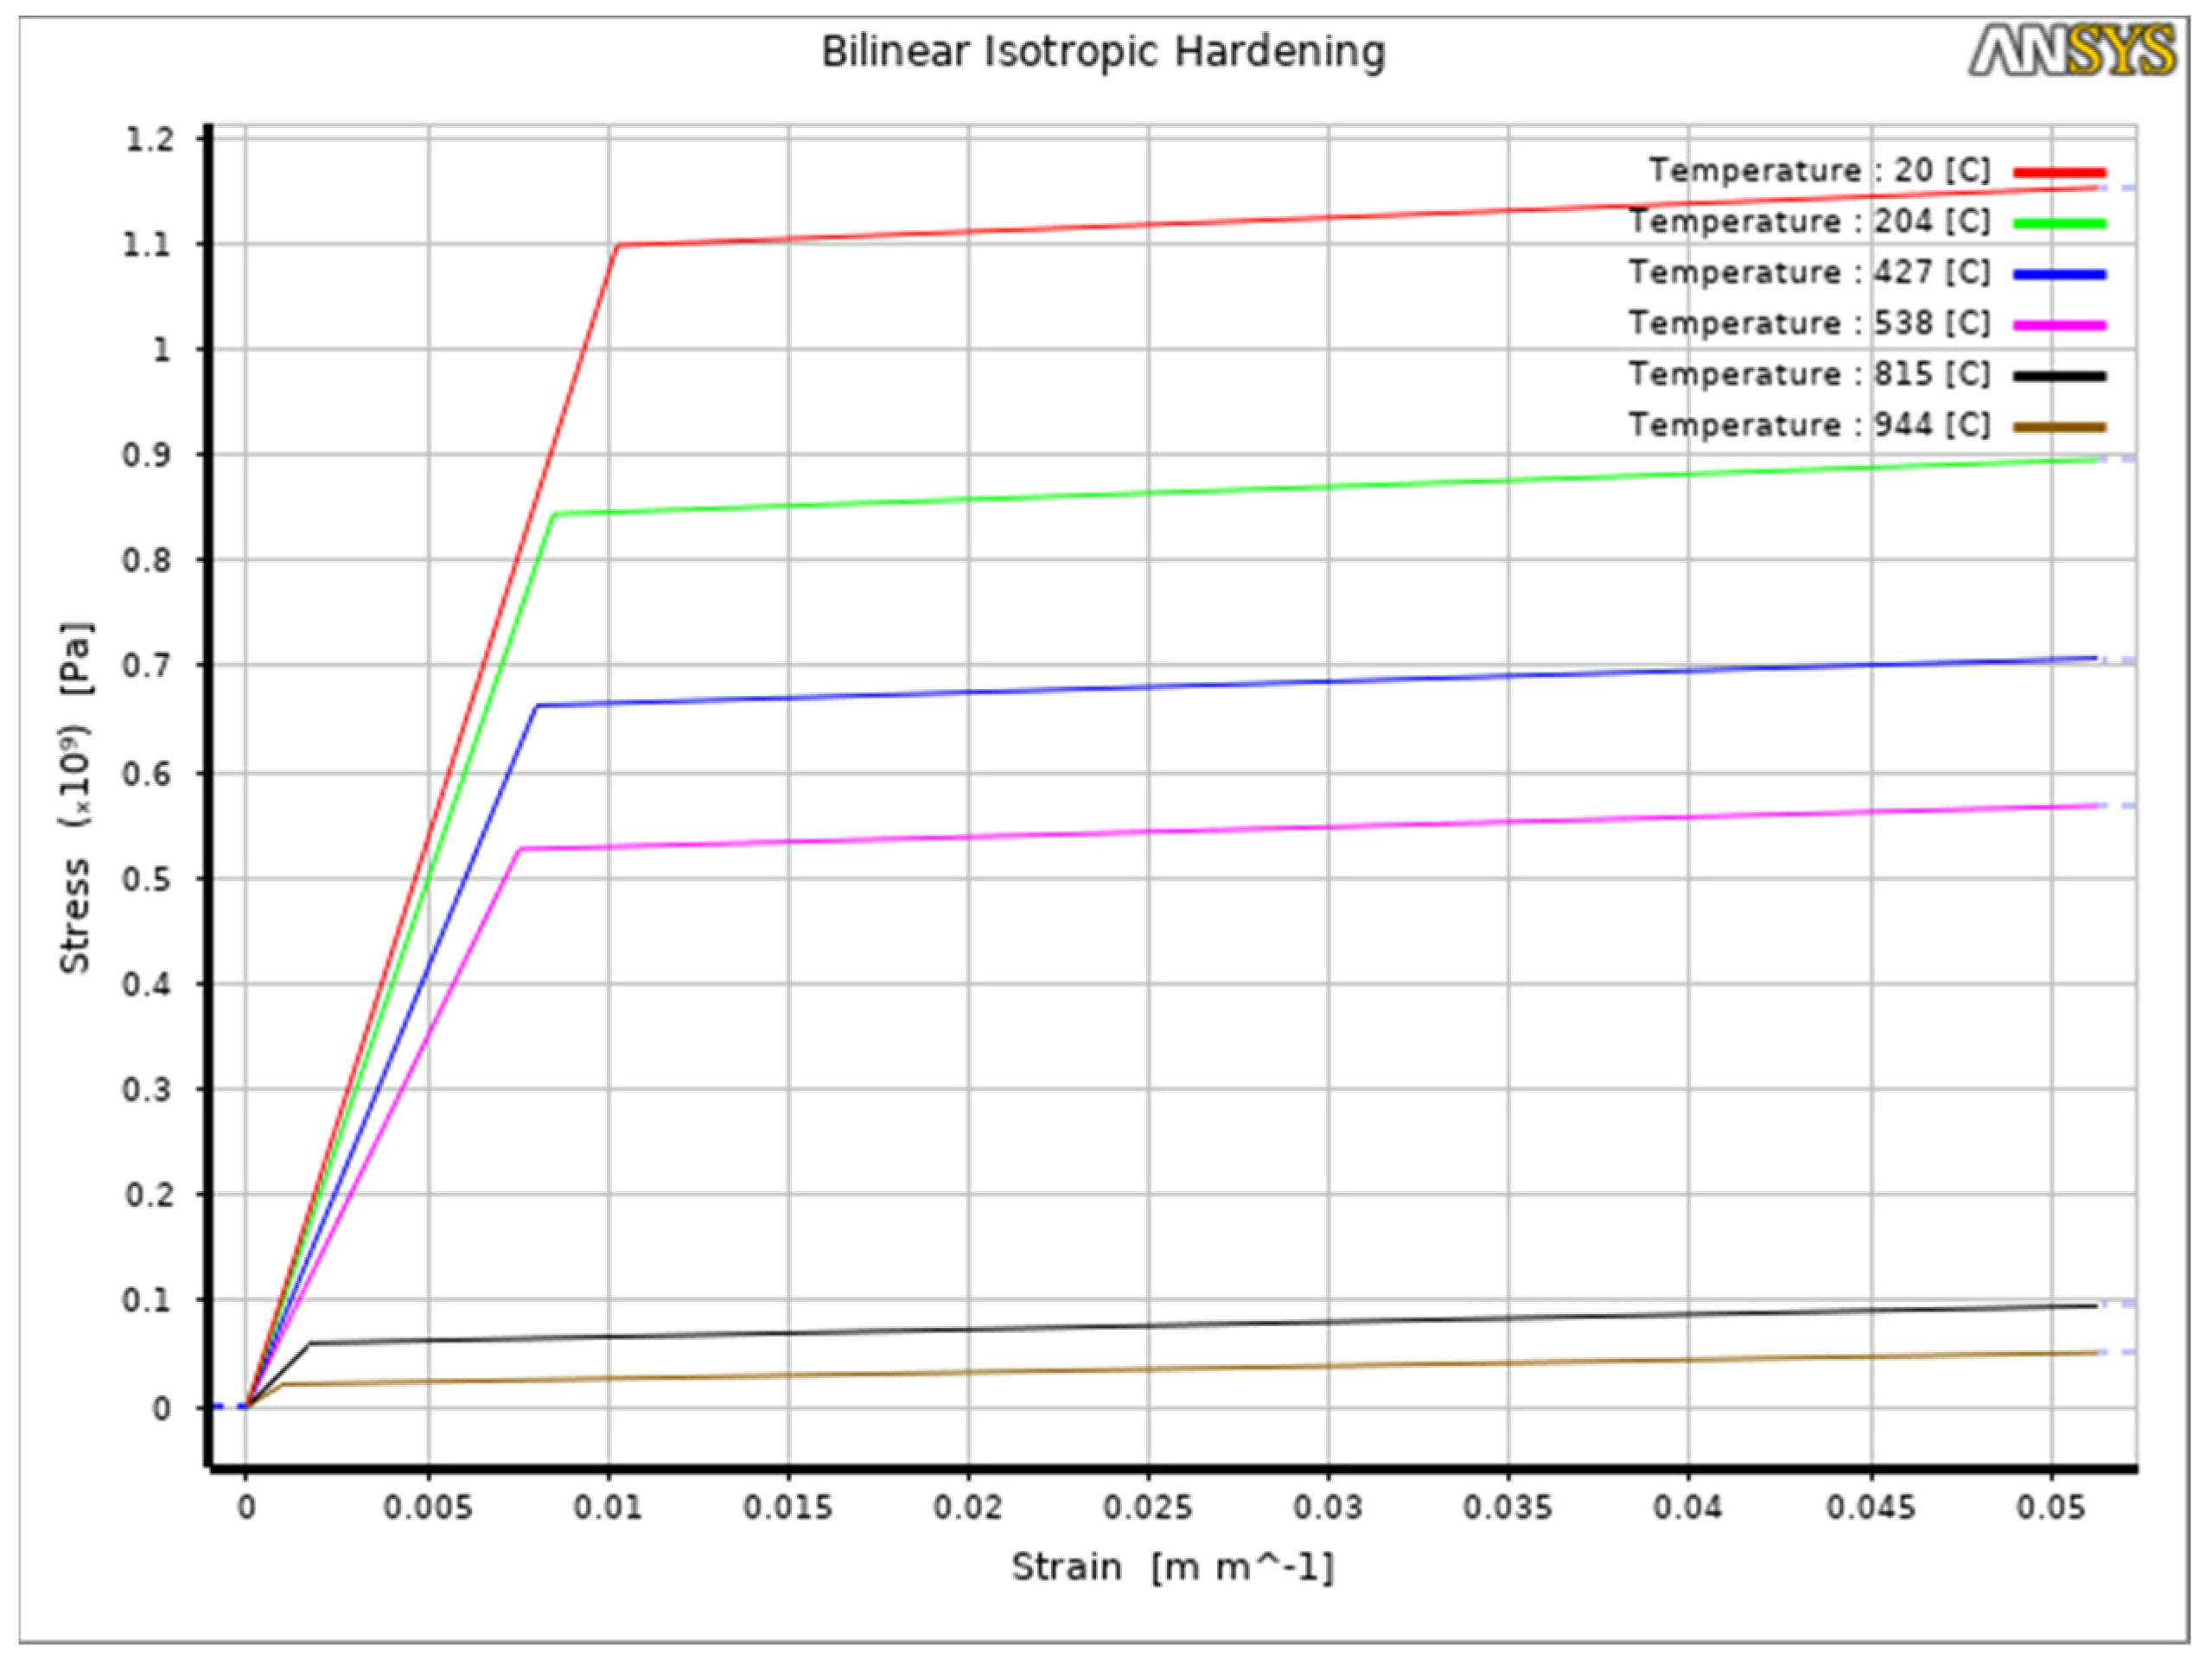
2.2.2. Structural Model

Additional boundary conditions were required to couple the structural simulation with the thermal results. The top surfaces of both workpieces were free to deform while all other faces of the workpieces were held in place to account for the workpieces being clamped in place during the welding process. Along with this, the transient thermal values were applied to the structural model. As with the transient thermal model, the temperature-dependent material properties of Ti-64 and NiTi were added into ANSYS to allow for greater model accuracy.

3. Results and Discussions

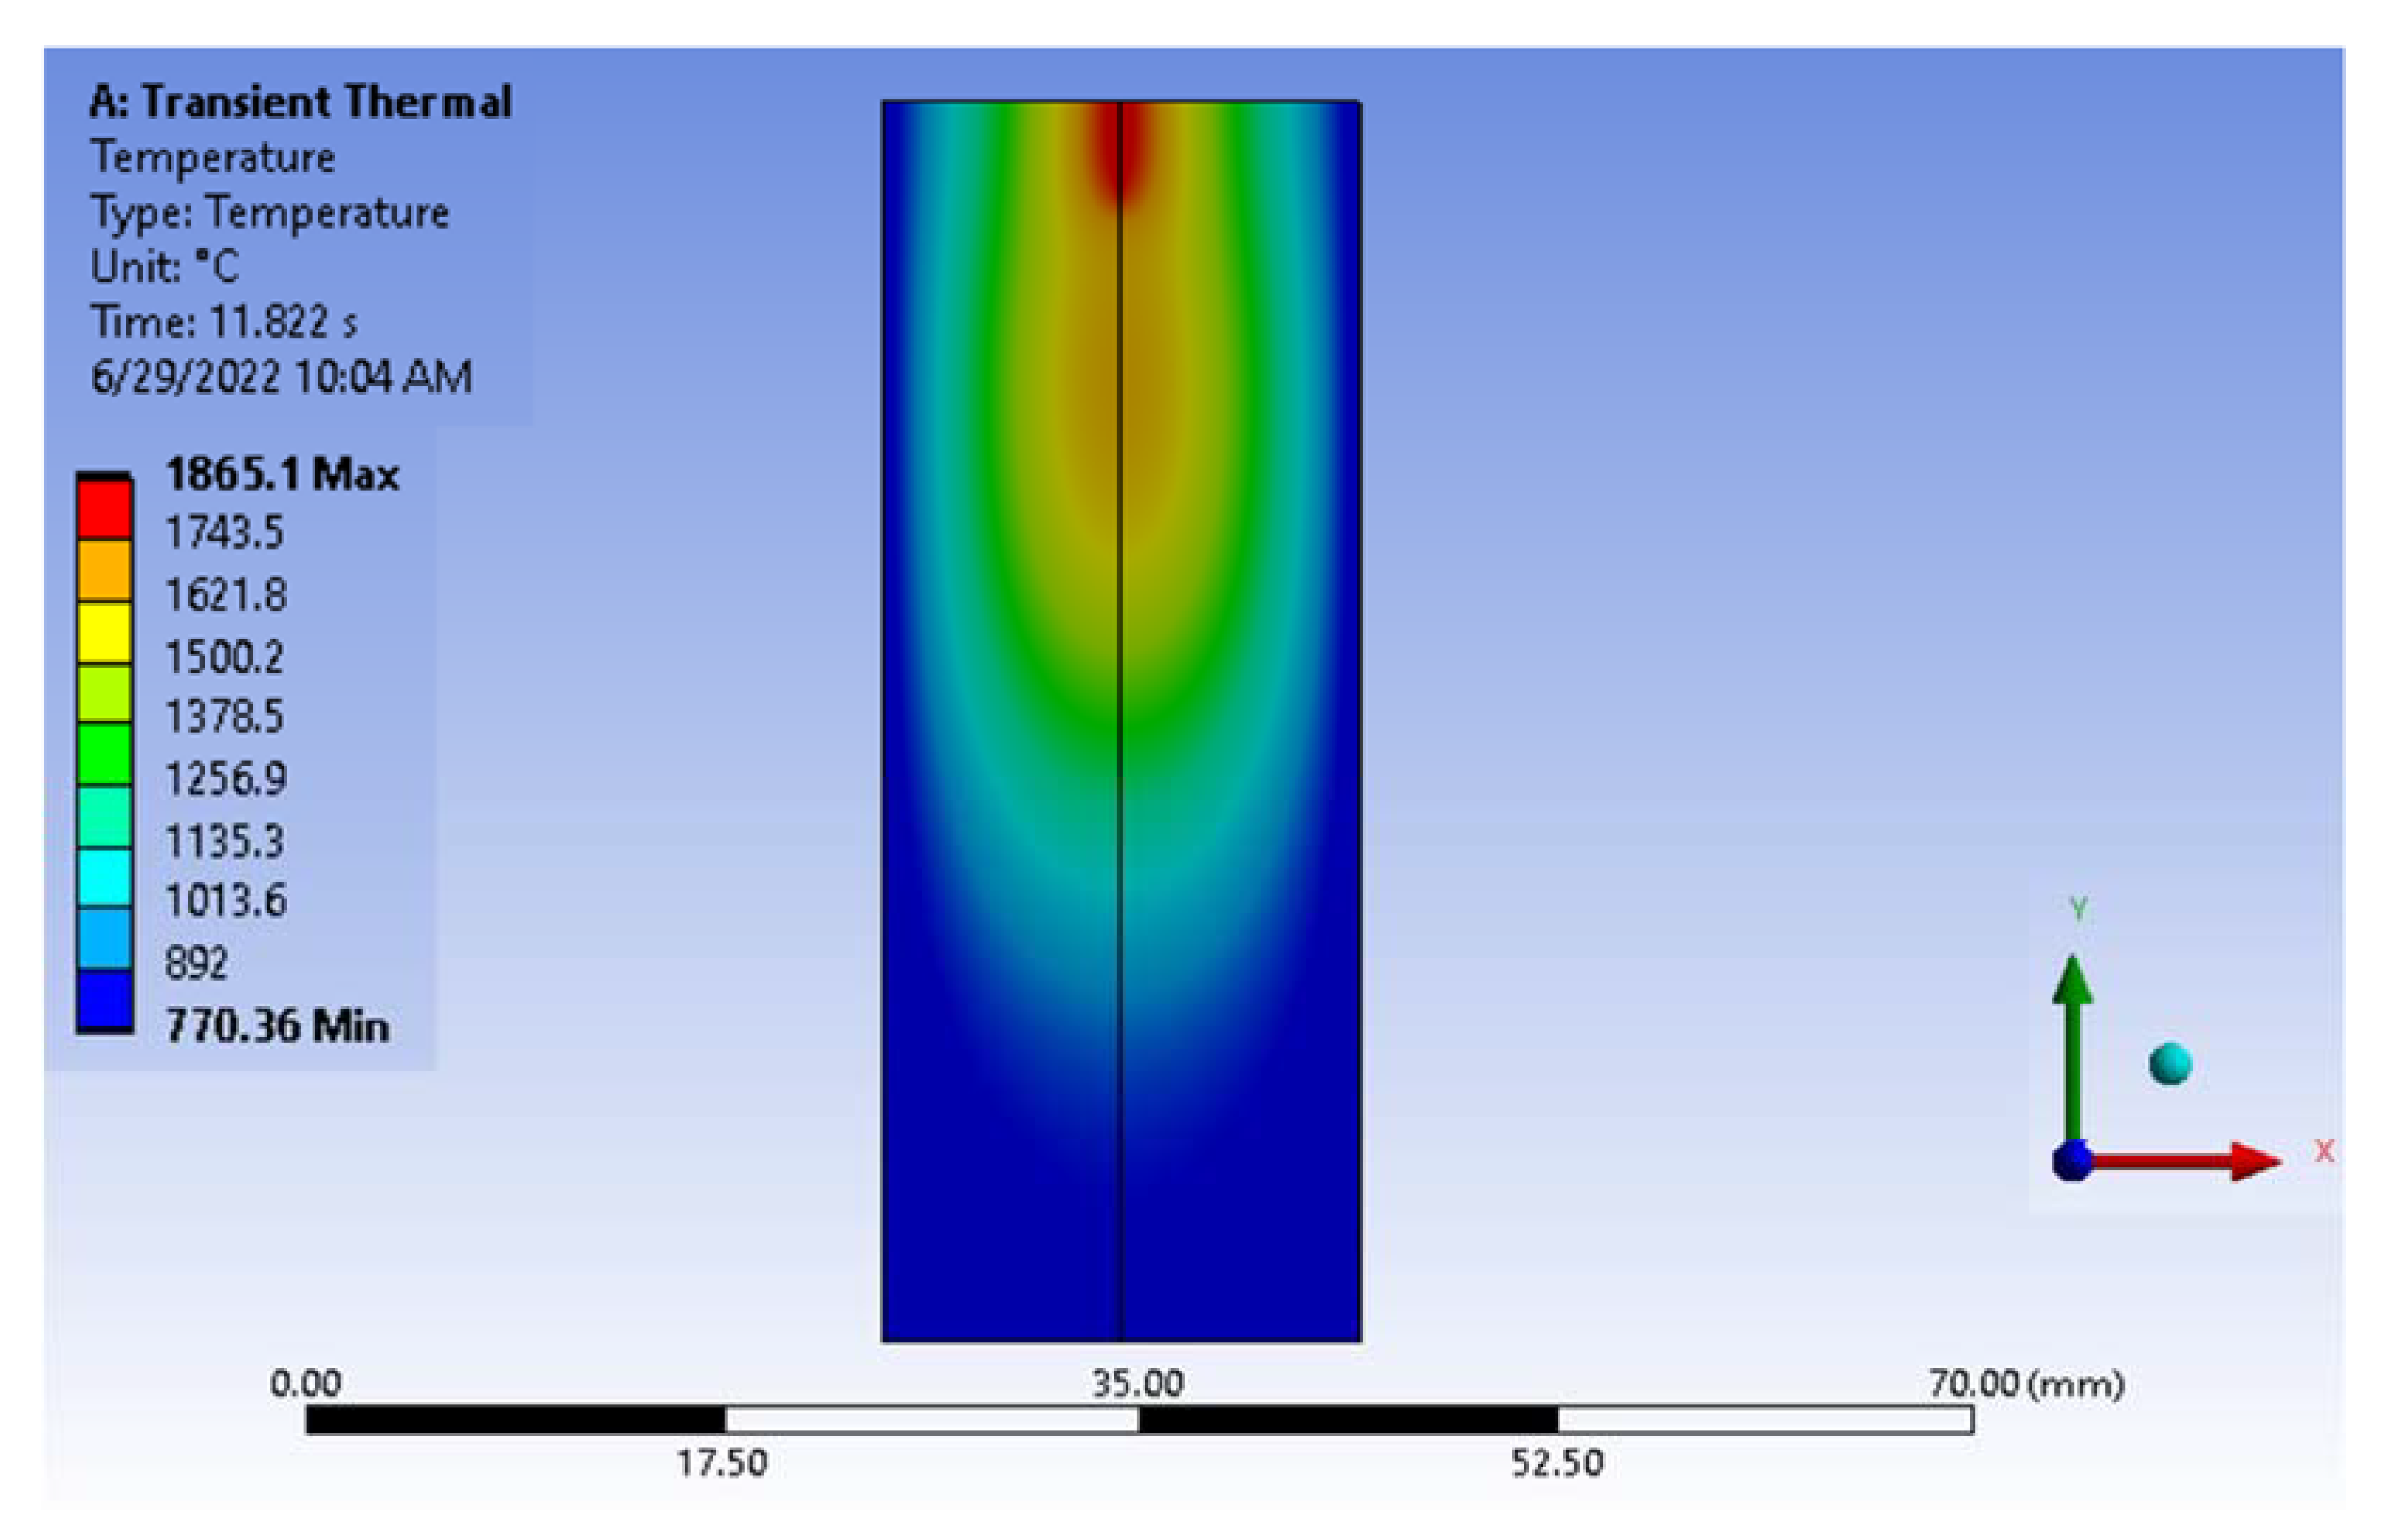
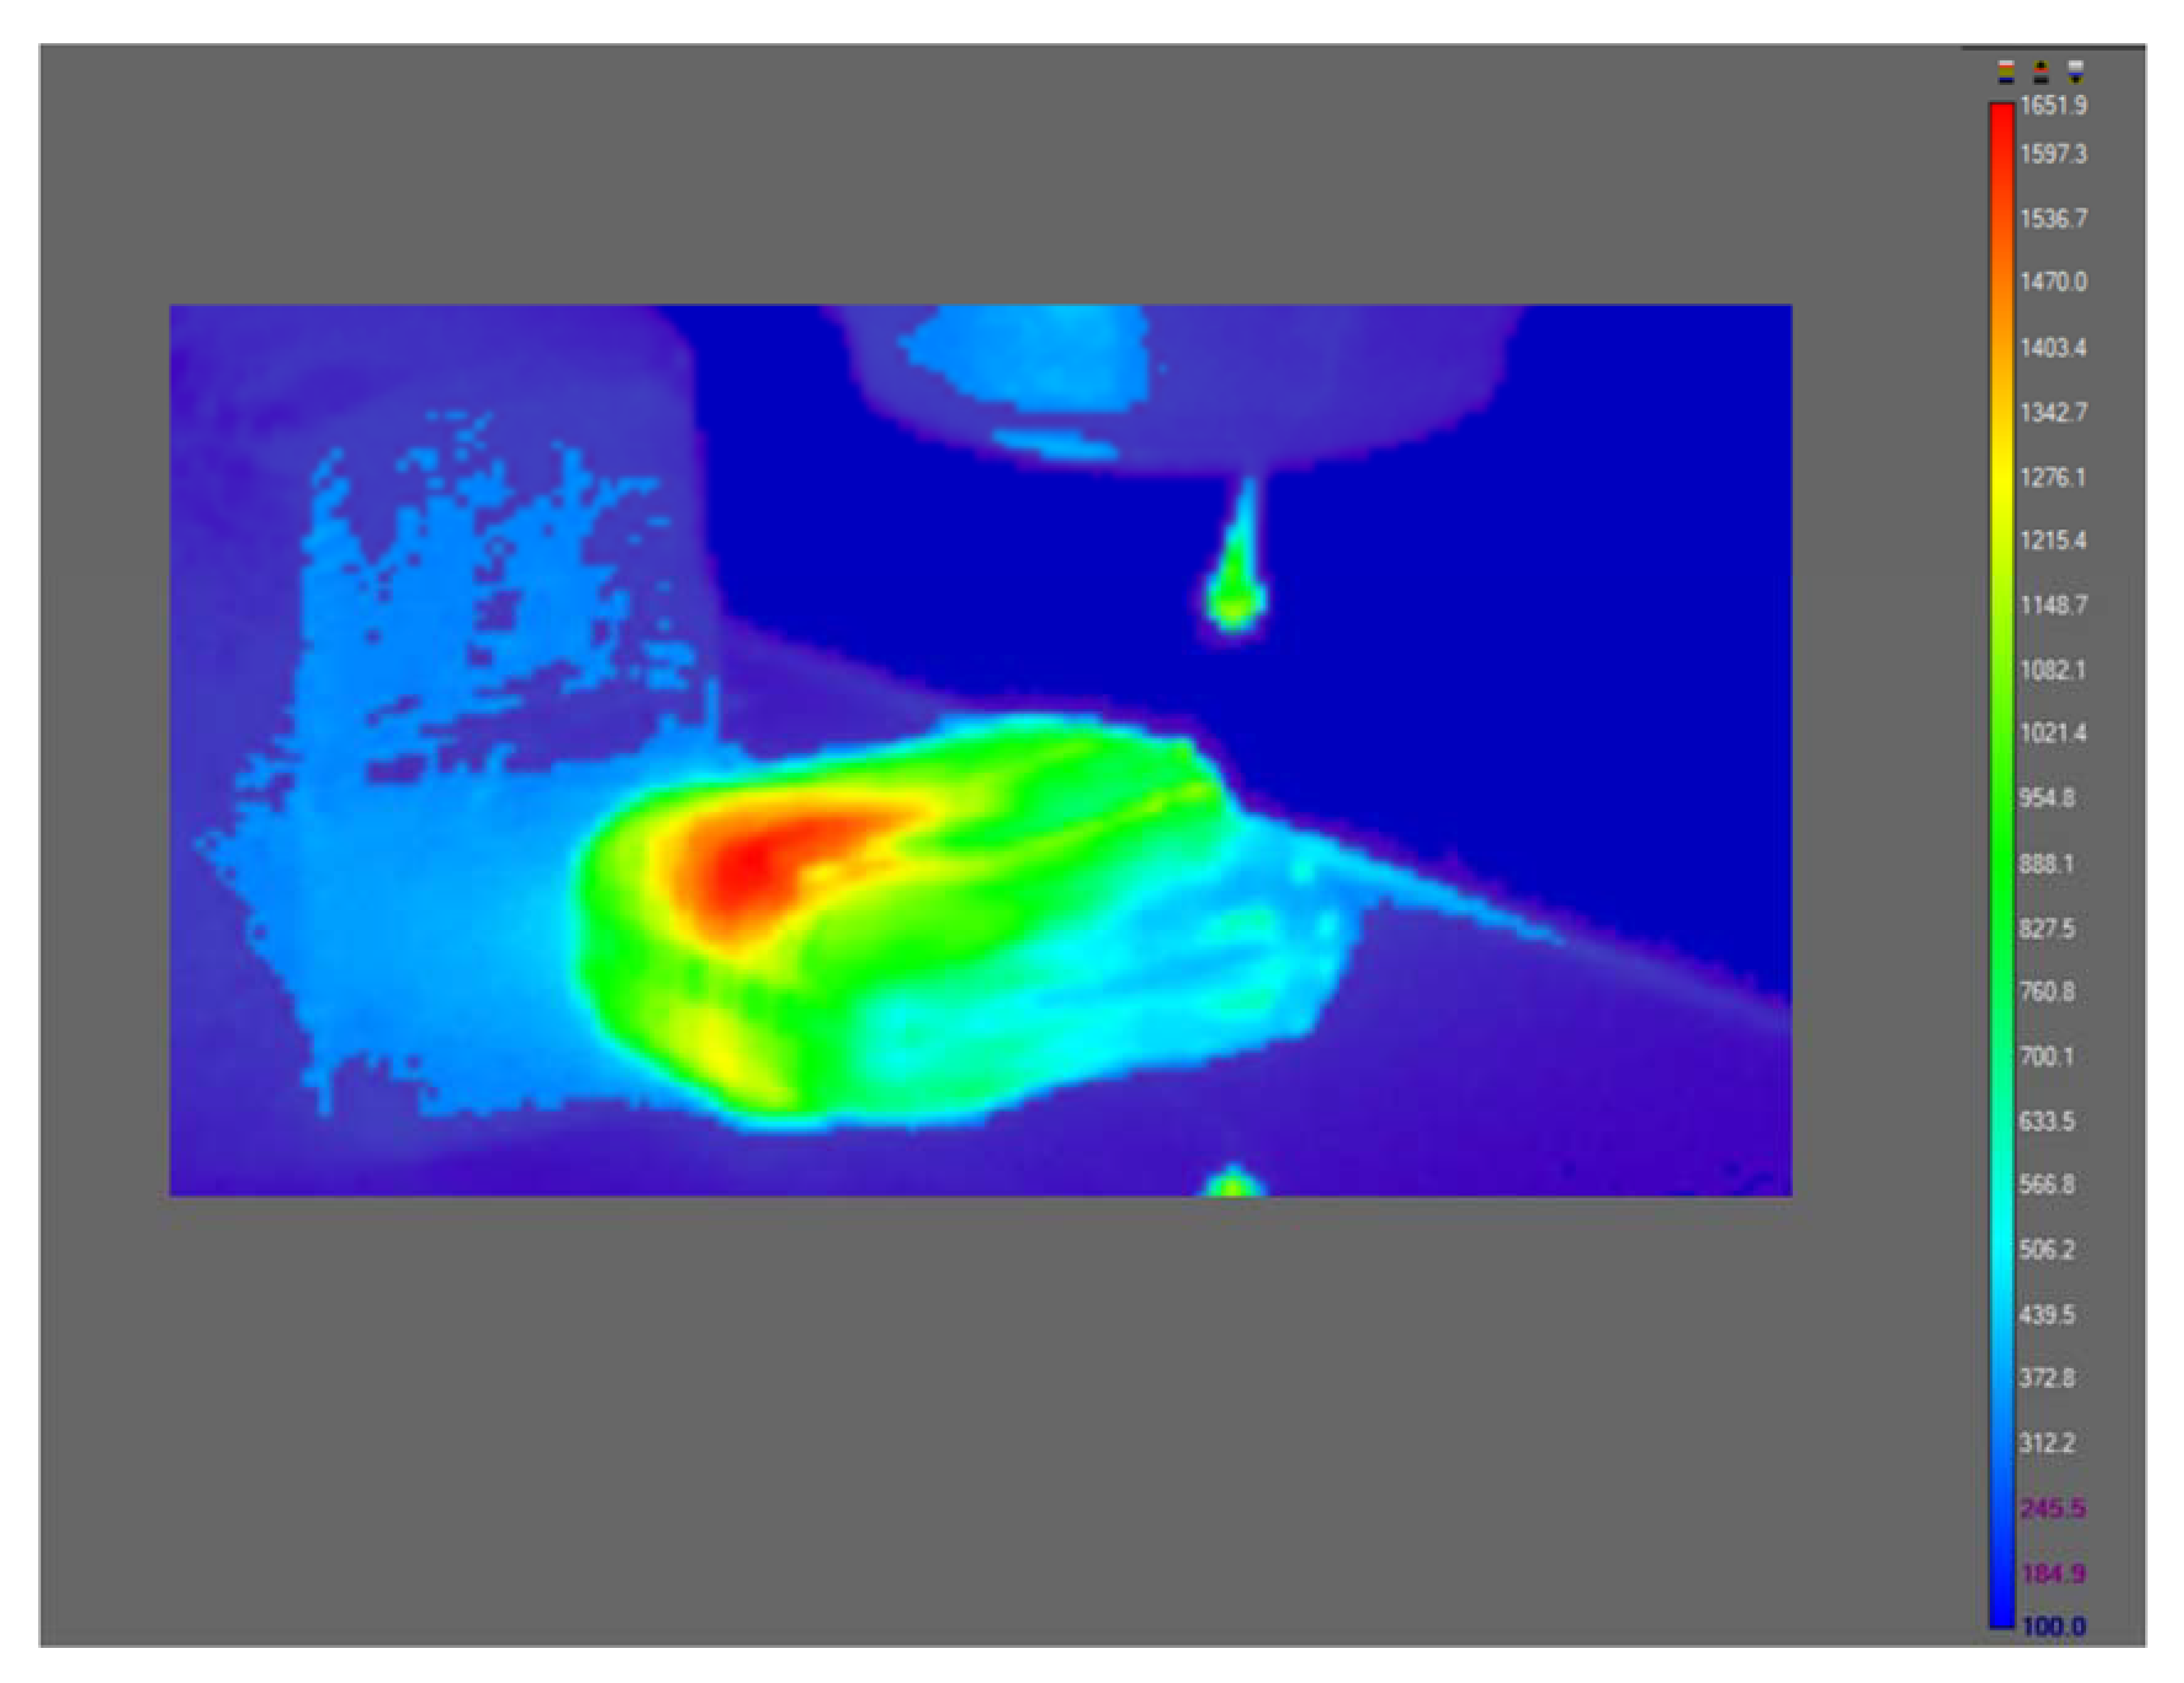
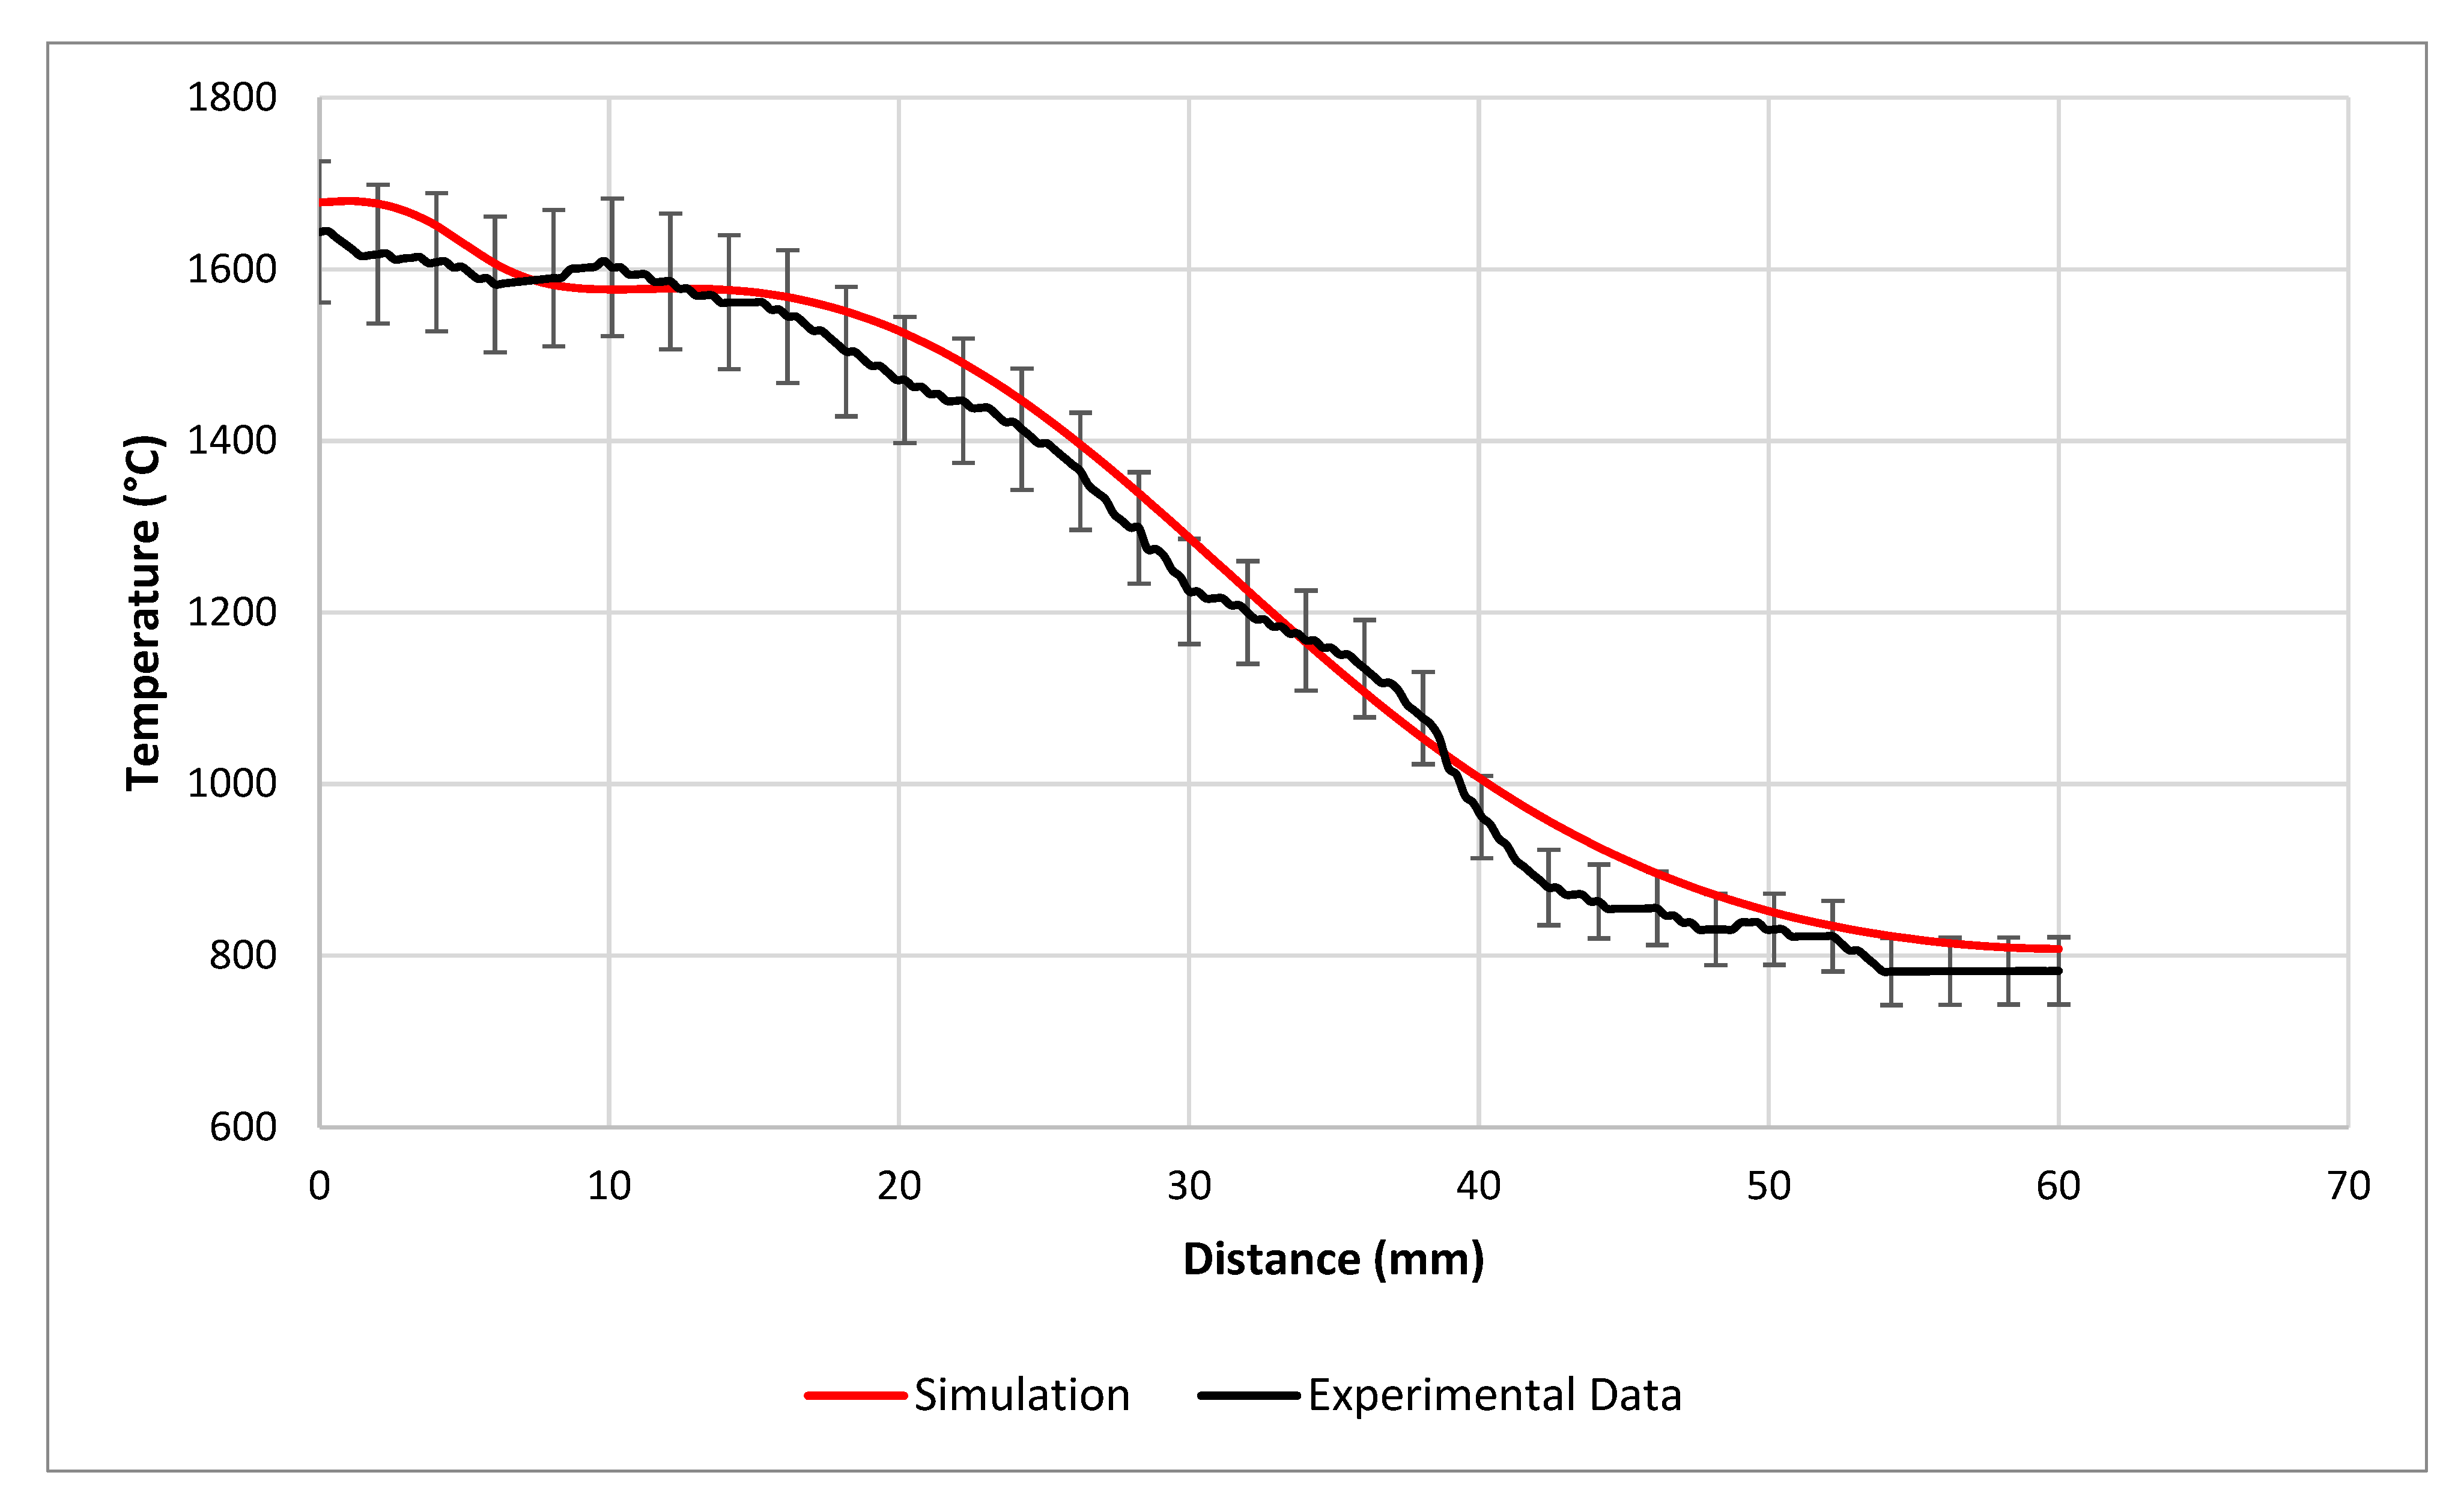
3.1. Thermal Simulation Results

The thermal simulation was able to successfully determine the thermal profile along the weld interfaced. Figure 9 shows the temperature field across both workpieces at the end of the simulation. Figure 9 clearly shows that temperature decreases exponentially as the distance from the weld interface increases.
From Figure 9, the thermal profile along the weld interface was extracted. This thermal profile was compared to the IR thermal profile. The thermograph taken at the end of the welding process and the converted thermal profile can be seen in Figure 10.
As the IR data showed that after distances greater than 10 mm away from the weld interface the temperature became constant, the dimensions of the simulation model were reduced to 2 mm by 10 mm by 60 mm. This is greatly reduced compared to the dimensions of the experimental workpieces which are 2 mm by 120 mm by 60 mm. The comparison between them can be seen in Figure 11, where it can be seen that the simulated profile is well within 5% error of the experimental profile. In addition, it also shows that the simulated thermal profile also follows the same general trend and shape as the experiment profile.

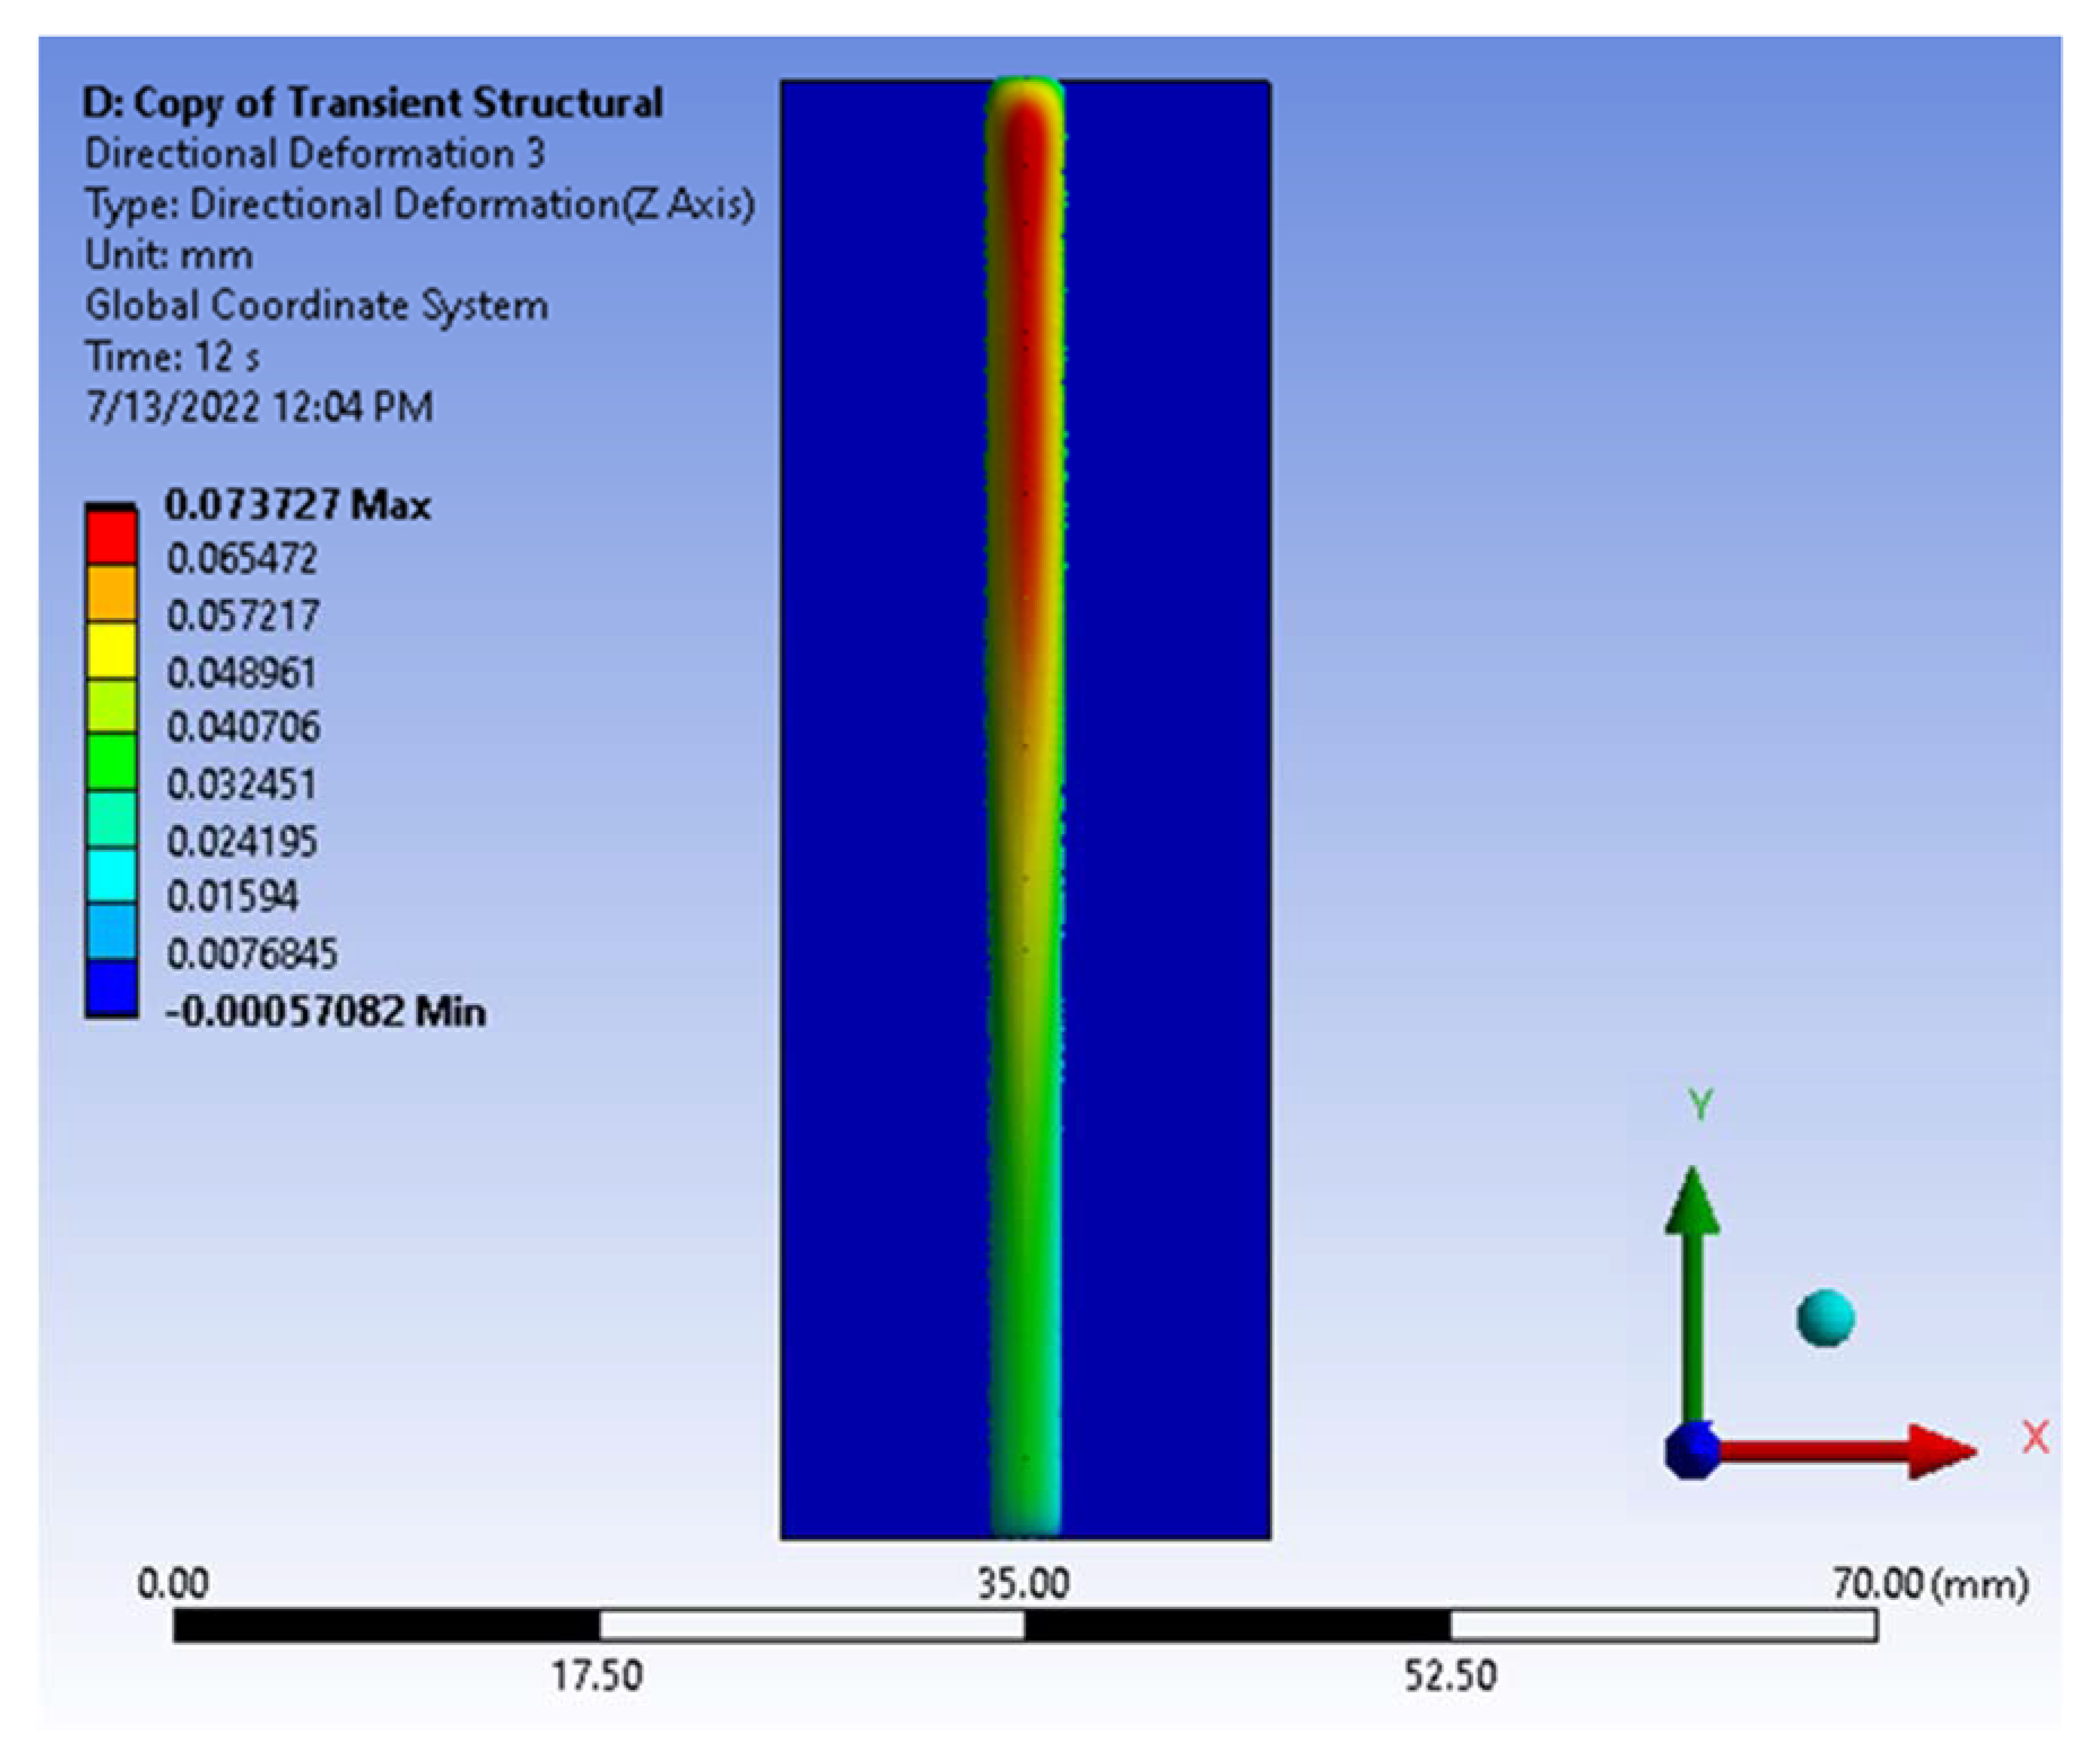
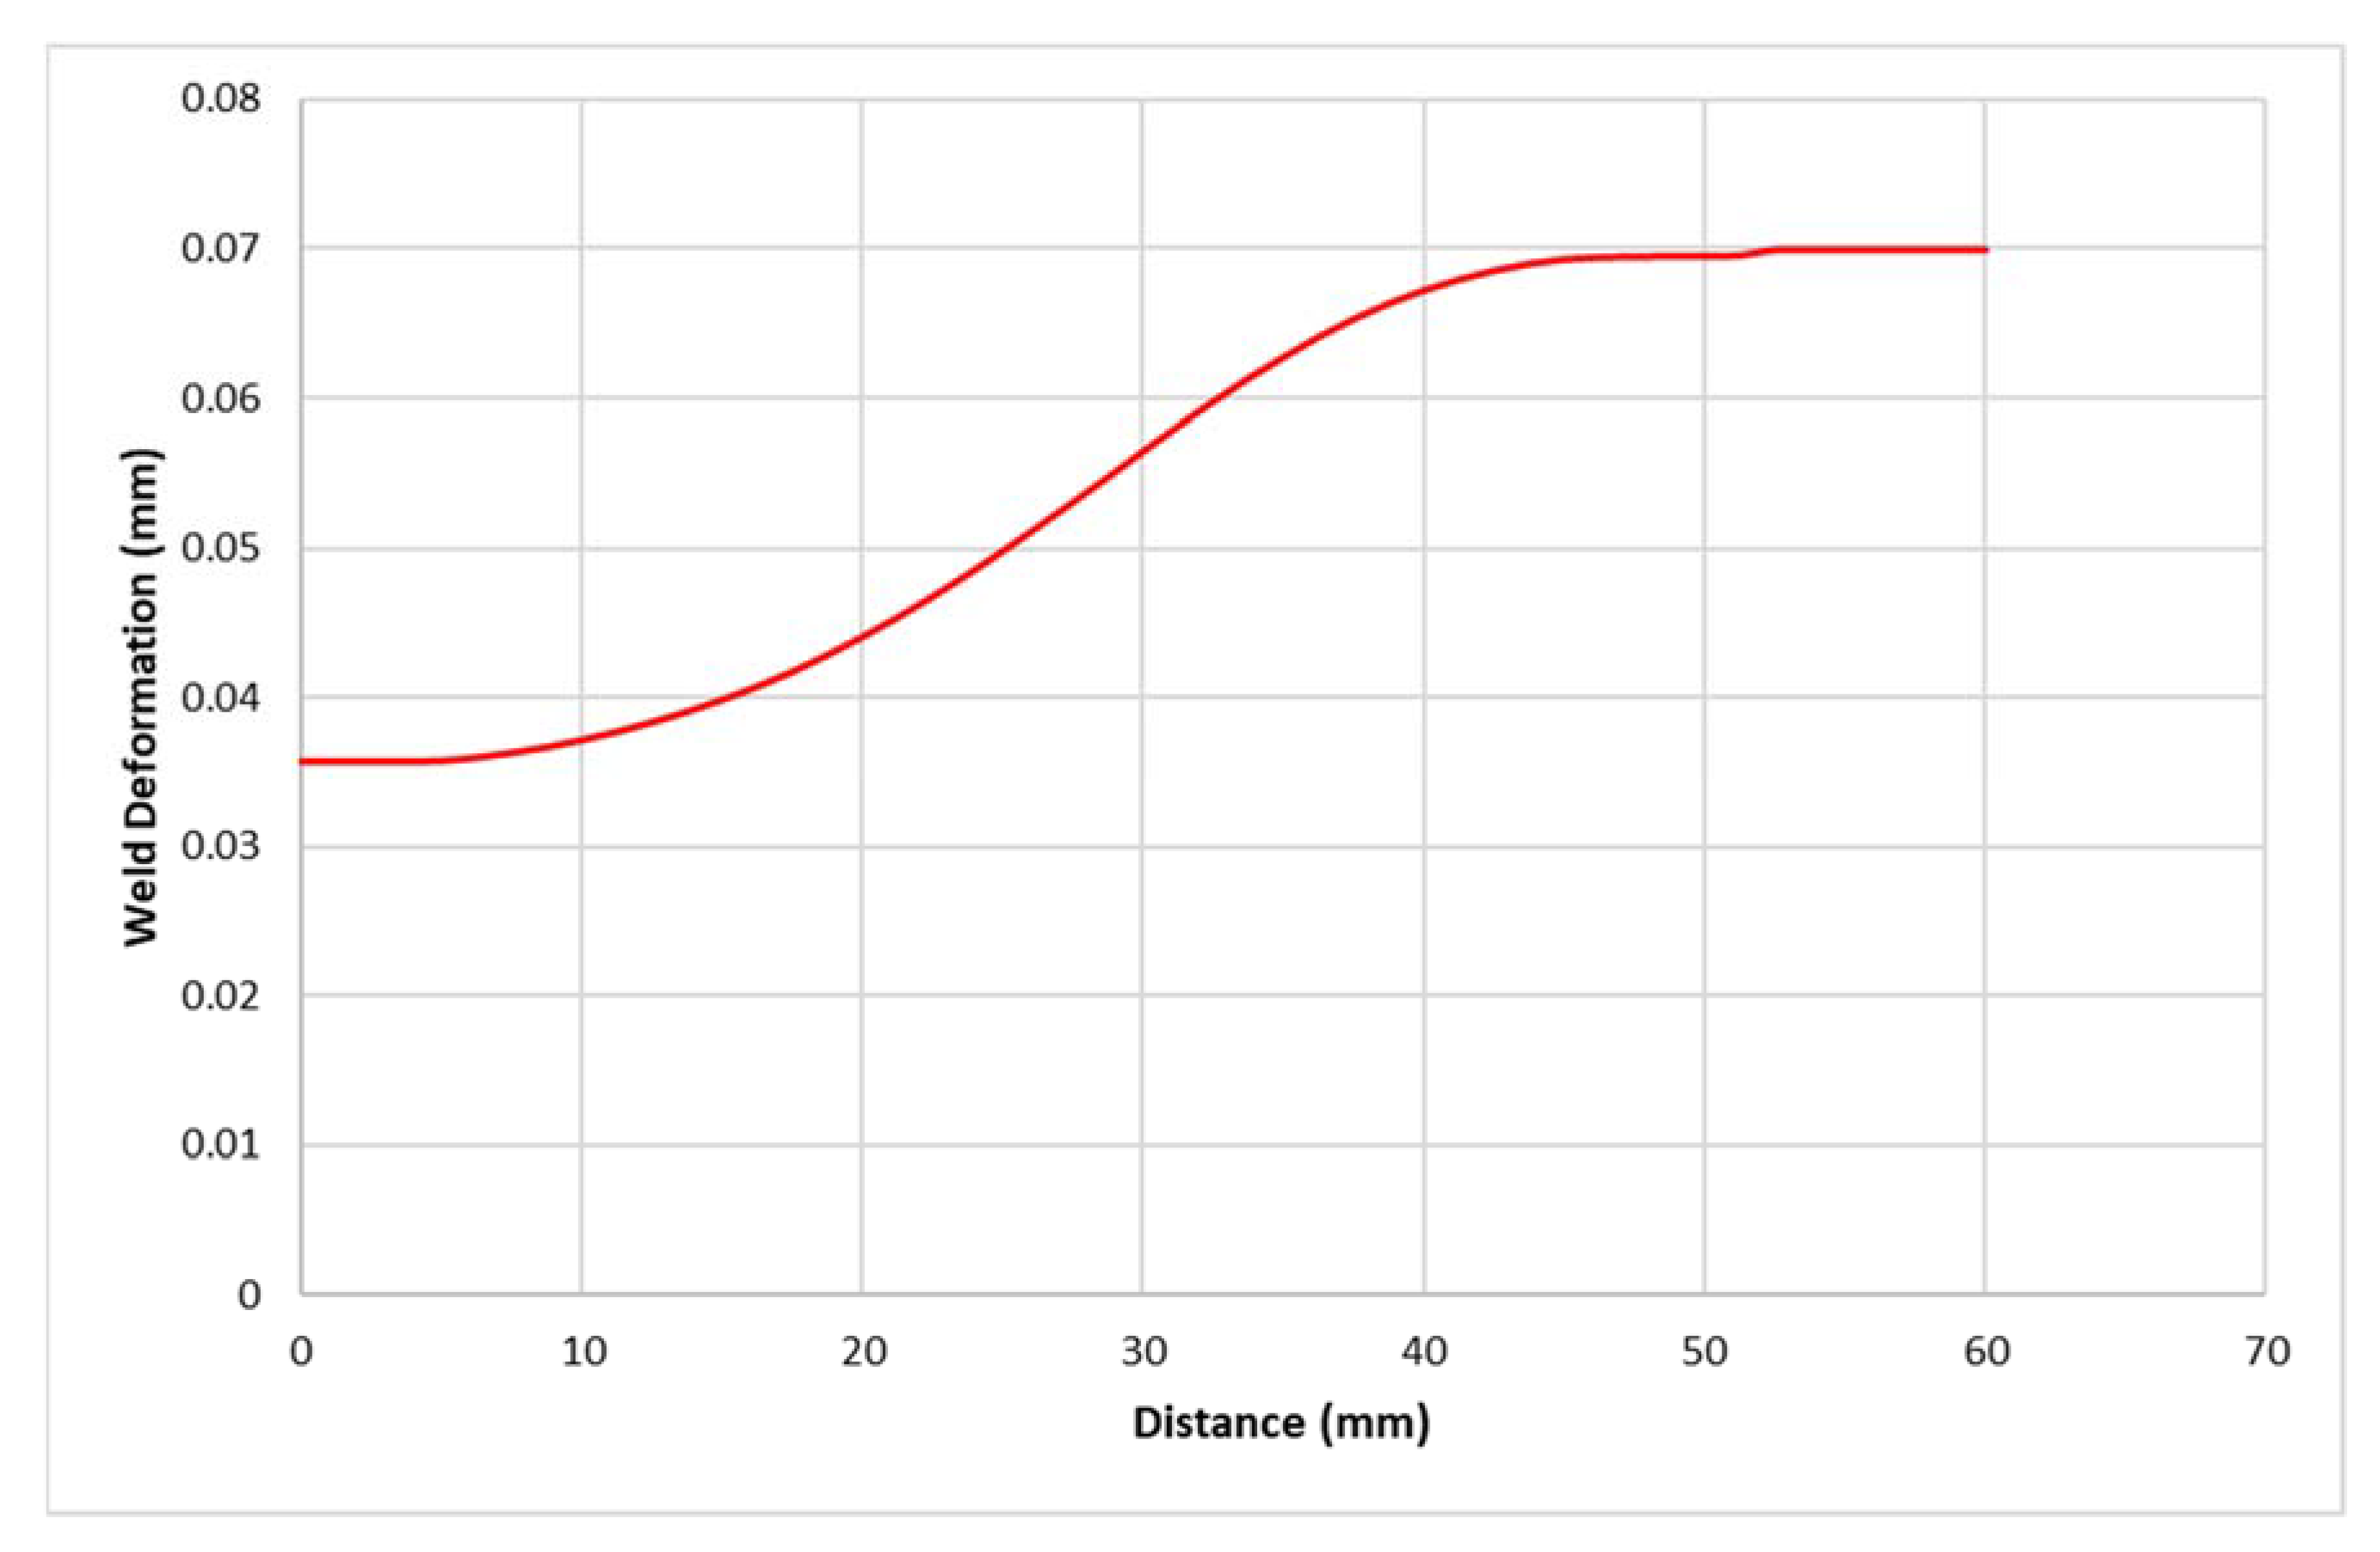
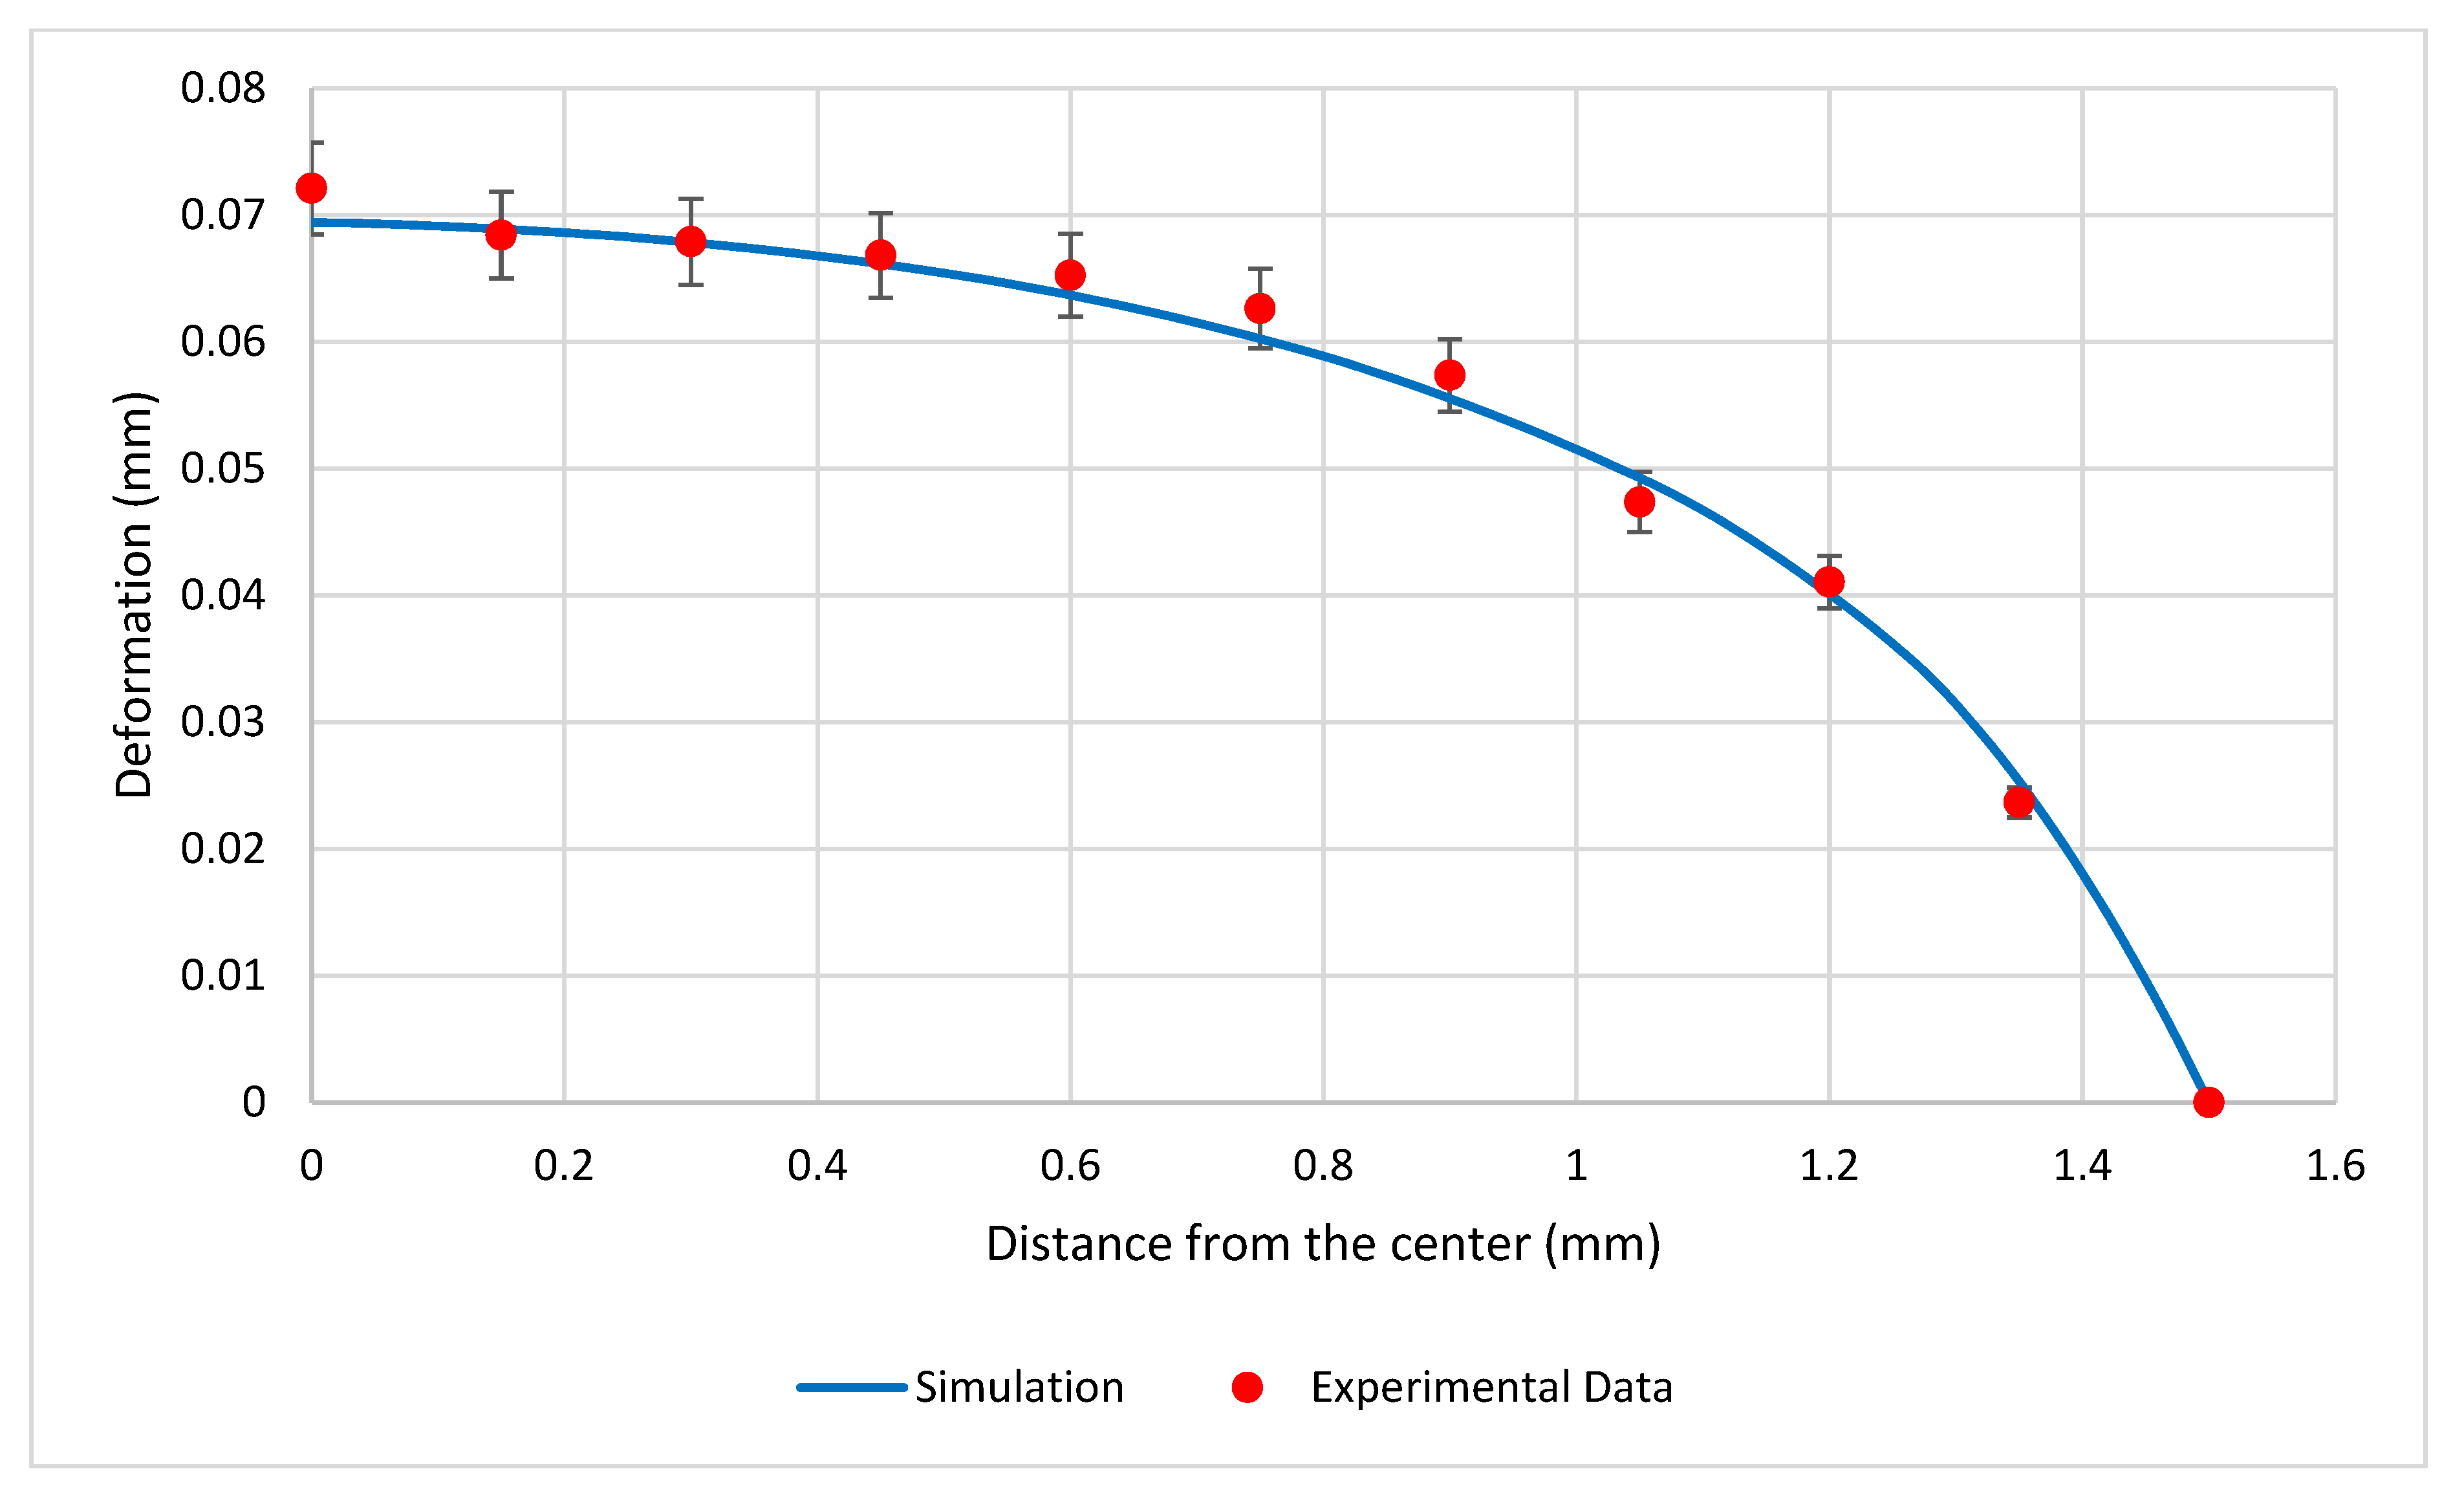
3.2. Structural Simulation Results

The structural analysis was completed to determine the deformation created during the LW process. The only load applied to the model is the time-history thermal profile created during the transient thermal analysis. The model had fixed constraints on its top, bottom, left, and rightmost surfaces. A fixed constraint was also applied to the bottom surfaces. In addition, the weld interface surfaces were set to be joined with no separation. Finally, the top surfaces were left unconstrained. This was done to help ensure the accuracy of what occurred experimentally. The top view of the simulated deformation field is shown in Figure 12. From Figure 12, the longitudinal deformation profile along the weld interface was extracted as a function of length. The simulated longitudinal deformation profile is shown in Figure 13. As it would have been too difficult to measure transient longitudinal deformation profiles experimentally, it was decided that transverse deformation profiles would be examined. The transverse deformation profile of the experimental results could be easily measured without destroying the samples. Figure 14a–c display the top view of the deformation along the weld interface for trial 2’s specimens at 5 mm/s, 20 mm/s, and 100 mm/s, respectively.
The comparison between the simulated and experimental transverse deformation profiles is shown in Figure 15. From it, it is clear that the simulated and experimental profiles are in good agreement, with the simulation results being within 5% error of the experimental data.

3.3. Considerations for Other Phenomena

This study focuses on the thermal-stress characteristics along the weld interface, but other physical phenomena can be explored further to determine how further explored to determine how the melting and resolidification affect the thermal field across the workpieces. The effect of the melting and resolidification fronts could be explored utilizing a specifically designed analysis focusing on the change in temperatures in the bulk material as the melting and resolidification fronts pass by. Along with this, an examination of the effect residual stress caused by resolidification has on the weldability could be done as well. This could be done through the use of a program designed to simulate melt flow to determine the changes in stress caused by the resolidification front, crystallization, weldability.

4. Conclusions

This study produced a simulation model to predict a butt jointed workpiece’s temperature profile and distortion in terms of weld time, in addition the simulated deflection was in good agreement with experimental data collected.
  • The thermal model accounted for conduction, convection, and radiation.
  • The thermal simulation results show that the temperature profile is within 5% error of the experimental data collected.
  • The results also showed that the heat loss increased exponentially as the distance away from the weld interface increases.
In conclusion, this work can be used as a guide for modeling and creating a decoupled thermomechanical simulation for LW to predict the thermal values during welding and the resulting distortion along the weld interface. This guide can be used for both same material and similar joining via LW. In addition, the model can be utilizing to reduce the probability of weld failure by simulating results beforehand.

Author Contributions

K.C. and J.J.R.: Conceptualization; Data curation; Project administration; Investigation; Supervision. A.G.: Formal analysis; Investigation; Software; Visualization; Validation; Writing—original draft; Writing—review and editing. J.A.D.D.l.P.: Software; Visualization; Validation. S.D. and S.N.: Data curation; Investigation; Methodology; Resources. All authors have read and agreed to the published version of the manuscript.

Funding

This research received no external funding.

Institutional Review Board Statement

Not applicable.

Informed Consent Statement

Not applicable.

Data Availability Statement

Data sharing is not applicable to this article.

Acknowledgments

The authors would like to offer their sincerest gratitude to Frank Deley and Michael Gaskill from Taylor-Winfield (Youngstown, OH, USA), for providing technical support and specimen preparation. The authors also express their sincere gratitude and appreciation to Center for Excellence program (Youngstown State University), for providing financial support.

Conflicts of Interest

The authors declare no conflict of interest.

References

  1. American Welding Society. Welding Handbook, 8th ed.; Connor, L.P., Ed.; American Welding Society: Miami, FL, USA, 1987; Volume 1. [Google Scholar]
  2. Walsh, C.A. Laser Welding-Literature Review; Materials Science and Metallurgy Department, University of Cambridge: Cambridge, UK, 2002. [Google Scholar]
  3. Bhuvaneshwaran, A.; Anandavel, B.; Noorullah, D. A Literature Review on Laser Beam Welding Processes. Int. J. Sci. Adv. Res. Technol. 2020, 6, 56–62. [Google Scholar]
  4. Mazmudar, C.P.; Patel, K. A Literature Review on Effect of Laser Welding Parameters on. Int. J. Sci. Res. Dev. 2013, 1, 2102–2105. [Google Scholar]
  5. Soni, D.K. A Review of Laser Welding Process for Thin Steel Sheets. Int. J. Res. Mod. Eng. Emerg. Technol. 2013, 1, 94–100. [Google Scholar]
  6. Murthy, K.R.K.; Akyel, F.; Reisgen, U.; Olschok, S. Simulation of transient heat transfer and phase transformation in laser beam welding for low alloy steel and studying its influences on residual stresses. J. Adv. Join. Process. 2022, 5, 100080. [Google Scholar] [CrossRef]
  7. Han, S.-W.; Cho, W.-I.; Zhang, L.-J.; Na, S.-J. Coupled simulation of thermal-metallurgical-mechanical behavior in laser keyhole welding of AH36 steel. Mater. Des. 2021, 212, 110275. [Google Scholar] [CrossRef]
  8. Glaspell, A.; Ryu, J.J.; Choo, K. Thermal Stress Simulation Model of Ti6Al4V-NITI DIssimilar Laser Welding Process. In Proceedings of the ASME International Manufacturing Science and Engineering Conference, Cincinnati, OH, USA, 25–21 June 2021. [Google Scholar]
  9. Sneddon, S.; Xu, Y.; Dixon, M.; Rugg, D.; Li, P.; Mulvihill, D.M. Sensitivity of material failure to surface roughness: A study on titanium alloys Ti64 and Ti407. Mater. Des. 2021, 200, 109438. [Google Scholar] [CrossRef]
  10. Rigberg, A.; Tulloch, A.; Chun, Y.; Mohanchandra, K.P.; Carman, G.; Lawrence, P. Thin-film nitinol (NiTi): A feasibility study for a novel aortic stent graft material. J. Vasc. Surg. 2009, 50, 375–380. [Google Scholar] [CrossRef] [PubMed]
  11. Lang, B.; Zhang, T.C.; Li, X.H.; Guo, D.L. Microstructural evolution of a TC11 titanium alloy during linear friction welding. J. Mater. Sci. 2010, 45, 6218–6224. [Google Scholar] [CrossRef]
  12. Kunčická, L.; Radim, K.; Terry, C.L. Advances in metals and alloys for joint replacement. Prog. Mater. Sci. 2017, 88, 232–280. [Google Scholar] [CrossRef]
  13. Semlitsch, M. Titanium alloys for hip joint replacements. Clin. Mater. 1987, 2, 1–13. [Google Scholar] [CrossRef]
  14. Mizar, S.P. Thermomechanical Characterization of NiTiNOL and NiTiNOL Based Structures Using ACES Methodology. Ph.D. Thesis, Worcester Polytechnic Institute, Worcester, MA, USA, 2005. [Google Scholar]
  15. Stanford, M.K. Thermophysical Properties of 60-NITINOL for Mechanical Component Applications; No. GRC-E-DAA-TN-6187; NASA: Cleveland, OH, USA, 2012.
  16. Teodorescu, G.; Jones, P.D.; Overfelt, A.; Guo, B. Normal emissivity of high-purity nickel at temperatures between 1440 and 1605 K. J. Phys. Chem. Solids 2008, 69, 133–138. [Google Scholar] [CrossRef]
  17. ANSYS. Ti-6AL-4V Material Properties; ANSYS, Inc.: Canonsburg, PA, USA, 2021. [Google Scholar]
  18. Boivineau, M.; Cagran, C.; Doytier, D.; Eyraud, V.; Nadal, M.-H.; Wilthan, B.; Pottlacher, G. Thermophysical Properties of Solid and Liquid Ti-6Al-4V (TA6V) Alloy. Int. J. Thermophys. 2006, 27, 507–529. [Google Scholar] [CrossRef]
  19. González-Fernández, L.; Risueño, E.; Pérez-Sáez, R.B.; Tello, M.J. Infrared normal spectral emissivity of Ti–6Al–4V alloy in the 500–1150 K temperature range. J. Alloy. Compd. 2012, 541, 144–149. [Google Scholar] [CrossRef]
Figure 1. Diagram illustrating the process of LW of dissimilar components.
Energies 15 06949 g001
Figure 2. Chart displaying the following material properties as functions of temperature for NiTi; Young’s Modulus [14], coefficient of linear thermal expansion [15], and thermal conductivity [15].
Energies 15 06949 g002
Figure 3. Chart displaying the following thermal properties as functions of temperature for Ti-64; thermal conductivity [18], specific heat capacity [18], and density [17].
Energies 15 06949 g003
Figure 4. Chart displaying the following mechanical properties as functions of temperature for Ti-64; Young’s Modulus [17], Poisson’s Ratio [17], and the coefficient of linear thermal expansion [17].
Energies 15 06949 g004
Figure 5. Bilinear hardening as a function of temperature for Ti-64 [17].
Energies 15 06949 g005
Figure 6. Model geometry for both the transient thermal and the transient structural simulations.
Energies 15 06949 g006
Figure 7. Mesh distribution for the LW FEA model.
Energies 15 06949 g007
Figure 8. Heat transfer paths of the LW specimen.
Energies 15 06949 g008
Figure 9. Top view of the temperature filed across the workpieces at the end of the simulation.
Energies 15 06949 g009
Figure 10. IR image taken at the end of the welding process.
Energies 15 06949 g010
Figure 11. Comparison of the simulation’s thermal profile along the weld interface to the experimental thermal profile.
Energies 15 06949 g011
Figure 12. Two dimensional deformation profile of the specimen.
Energies 15 06949 g012
Figure 13. Weld deformation profile along the Y-axis.
Energies 15 06949 g013
Figure 14. Photos displaying the top views of the deformation along the weld interface for trial 2′s specimens; (a) at 5 mm/s, (b) at 20 mm/s, and (c) at 100 mm/s.
Energies 15 06949 g014
Figure 15. Comparison of the simulated transverse deformation profile to experimental results.
Energies 15 06949 g015
Table 1. Process parameters used for the LW experiment.
TrialSpecimens Laser Power (W)Heat Input (J/cm)Weld Speed (mm/s)Measured Weld Time (s)Theoretical Weld Time (s)
117501500512.0712
2375203.023
3751000.60.6
2415003000512.0712
5750203.023
61501000.60.6
Table 2. Constant material properties of NiTi used for simulation.
MaterialNiTi
ρ (kg∙m−3)6450
Tm (°C)1300
Cp (J∙kg−1∙K−1)836.8
σT (MPa)895
ν (unitless)0.33
Publisher’s Note: MDPI stays neutral with regard to jurisdictional claims in published maps and institutional affiliations.

