

An Offline and Online Approach to the OLTC Condition Monitoring: A Review
by
 , , and
Firas B. Ismail
1,*,
Maisarah Mazwan
1,
Hussein Al-Faiz
1,
Marayati Marsadek
1,
Hasril Hasini
1,
Ammar Al-Bazi
2 and
Young Zaidey Yang Ghazali
3 
1
Power Generation Unit, Institute of Power Engineering (IPE), Universiti Tenaga Nasional, Kajang 43000, Malaysia
2
School of Mechanical, Aerospace and Automotive Engineering, Coventry University, Coventry CV1 5FB, UK
3
Asset Management Department, Tenaga Nasional Berhad, Kuala Lumpur 59200, Malaysia
*
Author to whom correspondence should be addressed.
Energies 2022, 15(17), 6435; https://doi.org/10.3390/en15176435
Submission received: 12 July 2022
/
Revised: 9 August 2022
/
Accepted: 16 August 2022
/
Published: 2 September 2022
(This article belongs to the Topic Advances in Energy Market and Power System Modelling and Optimization)
Abstract
:Transformer failures have a significant cost impact on the operation of an electrical network. In many utilities, transformers have been operating for many years past their expected usable life. As power demand has surged, transformers in some areas are being loaded beyond their rated capacity to meet the demand. One of the vital components in a transformer is the on-load tap changer (OLTC), which regulates the voltage in the distribution network. This study aims to review several condition-monitoring techniques (online and offline) that can monitor the health of the OLTC and assure the safety of the transformer’s OLTC from irreparable damage by detecting the defect at an earlier stage, which is preceded by the specification of typical faults. This paper also discussed the common faults of the OLTC and the root causes of these faults. The OLTC is prone to mechanical faults due to its frequently changing mechanism in the tap operation. The OLTC are also prone to oil as well as thermal faults. As a result, it is critical to monitor OLTC conditions while they are in use. Proper management of condition monitoring (CM) for the OLTC is useful and necessary to increase availability and achieve optimised operating. Condition monitoring (CM) and diagnostics methods (DM) have been developing since the 1950s. CM and DM have been implemented to diagnose and detect an incipient fault, especially for the OLTC. Many techniques, online and offline, are being used to monitor the condition of the OLTC to prevent failure and minimize outages. These DM and CM will prolong the operational cycle and avoid a major disaster for the OLTC, which is an unfavorable scenario.
1. Introduction of Condition Monitoring for the OLTC
An on-load tap changer (OLTC) is a critical component as it adjusts the tap positions to regulate the transformer’s output voltage in response to changes in power generation and consumption. When the OLTC transitions from one tap position to another during operation, the switching contacts are subjected to a high load current, which can eventually lead to a considerable decrease in the conductivity of the contacts and may cause damage to these contacts. Damage to switching contacts and other components can cause the OLTC to malfunction and fail, reducing the transformer’s reliability. Several surveys have found that OLTC faults account for a significant portion of transformer failures [1,2,3,4,5]. As a result, utilities would benefit substantially from establishing robust OLTC CM strategies.
Studies, as in Figure 1, show that about 30% of substation power transformer reported outages are related to the ageing effects on OLTCs. Due to this high failure rate, closely monitoring the power transformer’s OLTC condition is critical. Unlike other more static components in a transformer, the OLTC consists of numerous moving parts. Manufacturers typically recommend a maintenance cycle that mostly depends on the total number of switching operations. In the following sub-sections, offline and online CM techniques will be described and summarized accordingly.
CM is concerned with the application and development of special-purpose equipment with the role of capturing data, as well as the creation of new ways to analyse these data to forecast the monitored equipment’s trends to evaluate its current performance.
The CM has many advantages, one of which is that it can realize maintenance costs by detecting incipient flaws and preventing them from growing into significant problems that require much money to fix during maintenance. Following that, it reduces the likelihood of disastrous failure, which impacts the quality of supply and the safety of people. It also lowers the severity of any damage sustained and eliminates or lessens the need for subsequent repair actions. Aside from that, it can discover the fundamental reasons for the failure and gives an excellent fault diagnosis system. Finally, it can provide information on the plant’s life cycle through integrated condition monitoring of all of its critical equipment [7].
On the other hand, there are some challenges to implementing CM strategies. One of these challenges is the additional expense to the system due to the additional monitoring sensors, circuitry, and control system. One of the hurdles and problems of CM approaches is the increased complexity of the protection and overall monitoring system [8].
The CM system should be capable of ensuring that the equipment can perform all of their functions; yet, its cost should be modest in comparison to the costs of maintenance and failure. Furthermore, the CM should not be overly complex in order to be easily realized. In most circumstances, the cost of additional features needed by the CM system is a fraction of the cost of maintenance and supply loss [7].
Condition-based maintenance (CBM) is served by CM (or named predictive maintenance). For a long period, time-based maintenance was the primary maintenance technique. Time-based maintenance may avert many failures, but it may also result in many unnecessary shutdowns, and unanticipated failures may occur between any two maintenance cycles. CBM is an optimal maintenance service that, with the assistance of a CM system, will provide accurate and valuable information about the machine’s condition. A CM system should be capable of monitoring running machines in the presence of electrical interference, forecasting the need for maintenance before significant deterioration or breakdown occurs, identifying the needed maintenance and locating problems, and even estimating machine life. Therefore, applying the CM technique is crucial as it offers various benefits, not only to the health of the electrical equipment but also to the development of technologies.
2. Types of OLTC Fault
Concerning the main faults coming from the OLTC, OLTC faults can be categorized into three types: the oil fault (due to the generation of gasses), mechanical faults (mainly coming from tap changers contacts, mechanical wear of the springs, and loosed fasteners) and electrical faults (decrease of dielectric strength due to degradation of insulation oil and paper) [2,9,10]. In the following sub-section, different types of OLTC faults will be explained.
2.1. Oil Faults in OLTCs
The insulation oil plays a significant role in electrical insulation between the energized tap changing parts during the changing tap process. Nevertheless, preventing arcing from occurring is still impossible and leads to several oil faults. The purpose of this section is to get to know further the types of oil faults. After hundreds of physical inspections of faulty OLTCs by professional transformer inspectors and researchers, different oil faults in OLTCs are identified and can be classified by visual inspections as shown in Table 1. A proper defect diagnosis will provide warnings for any gases whose concentrations, increments, rates of change, or gas ratios exceed the specified limits, as well as brief interpretive remarks and recommendations based on the findings.
The concentrations and composition of hydrogen (), carbon monoxide (CO), carbon dioxide (), methane (), acetylene (), ethylene (), ethane (), oxygen (), and water () can be used to determine the type of fault and its severity, as shown in Table 2. Diagnostic procedures that detect many gases and account for the whole gassing picture are more accurate since all types of oil faults produce a range of gases rather than just one. From Table 2, the generation of hydrogen () is everywhere related to thermal, and this gas increases over time. The significant presence of acetylene () is generated when the thermal faults reach more than 700 °C.
As the insulation oil temperature increases, several hydrocarbon gases, which are methane (), acetylene (), ethylene (), ethane (), will be produced. These gases will carbonize insulation oil, insulation paper, as well the oil immersed in mechanical parts of the OLTC. Figure 2 shows a carbonized tap changer during maintenance of the OLTC. If the OLTC are not properly maintained or left unattended, the chances for it to explode is high as sparks during the tap changing process will ignite the highly flammable gas such as acetylene [3].
2.2. Mechanical Faults in OLTCs
There are several mechanical moving parts in the OLTC for the changing tap process. These parts are the diverters, the selector switches, the accumulator springs, and the contact springs. Thus, the OLTC are susceptible to mechanical faults over time [12]. The most common mechanical faults in the OLTC are loose fasteners, abnormal torque, fatigue damage, motion jamming, and abnormal mechanical wear. Continuous operation of the OLTC with a mechanical fault will result in an electrical failure. Vibro-acoustic analysis (VBA), dynamic resistance measurements (DRM), and static winding resistance measurements (SWRM) can all be used to identify these faults.
These mechanical faults can be categorized into four types of problems [10]. The first one is the mechanical vibration when switching. This happens when there is electrical corrosion at fasteners connected to conductive parts such as transition resistance lead. Due to electrical corrosion, the fastener’s threads will become loose, thus causing poor contact, and in the worst case, the fasteners will fall off.
The following mechanical fault is contact failure. The root cause of this is wear and electrical corrosion of moving and fixed contact terminals. As shown in Figure 4, the contact terminal springs experienced fatigue failure after numerous operating cycles. Figure 5 shows a clear example of a broken energy accumulator spring. The energy accumulator springs, charge, and energizes the Geneva gear, which operates the tap changer at a very fast speed, usually around 50–60 milliseconds. As a result, this causes arcing on the contact terminals and an abnormal sequence of OLTC contacts.
Another mechanical fault is a failure in the switching mechanism due to mechanical fatigue of the switching mechanism. The consequences are that the transition resistance and contact system of the OLTC will be burned down. Figure 6 below shows an example of burned contact on the stationary and movable parts [14]. Further operation of these contacts will decrease the contact area and increase contact resistance. Additionally, arcing and heat increase during the switching process and eventually cause further burning of the contacts.
The last one is an abnormal motion of the motor driver unit whereby it is suspected there is mechanical wear on the gear drive and the presence of heavy coking on the tap changer surface. Due to this fault, the motor drive unit cannot perform tap changing correctly, leading to an incipient fault in the OLTC. Figure 7 shows an example of a coked reversal contact.
2.3. Electrical Faults in OLTCs
The effectiveness of the insulation oil to insulate against arcing during the tap changing operation is considerably reduced when moisture is present. Inadequate contact of contact terminals, local overheating and discharge induced by an external short circuit, arc discharge caused by switching hysteresis or failure, and discharge caused by insulation oil deterioration or inadequate insulating materials are examples of electrical failures. Table 3 explains the two types of electrical faults on the OLTC.
3. OLTC Condition Monitoring Techniques
The failure of any transformer can be disastrous, particularly for critical and high-rated power transformers that feed a vast number of loads. Faults in transformers are frequently challenging to diagnose or find due to intricate winding structures, but a multi-parameter CM technique provides valuable data to diagnose the fault and identify its location. Downtime and costs can be considerably reduced if internal repairs can be completed. Unplanned outages of transformers and catastrophic failures caused by faults can be minimized with CM. CM enables the plants ageing to be monitored and hence regulated, as well as forecasted and prolonged. Figure 10 shows two main categories of OLTC condition-monitoring techniques.
Several OLTC condition-monitoring techniques have been developed during the last few decades. Typical techniques include: (1) online and offline dissolved gas analysis (DGA) [11,20,21,22,23,24,25,26], (2) static and dynamic resistance measurement for evaluating the conductivity of switch contacts [5], (3) vibro-acoustic analysis [4,10,27,28,29,30,31,32,33,34,35] and (4) infrared thermography [36].
3.1. Offline Condition Monitoring
Offline OLTC condition monitoring is considered invasive as the transformer has to de-energize the OLTC beforehand. We will explain a diagnosis method based on the oil called dissolved gas analysis. Next, the common standard offline methods based on resistance measurements, which evaluate the surface condition of the OLTC switch’s contacts, will be discussed. A visual inspection was conducted to identify whether the OLTC switch’s contact was carbonized, or another term, “coked”, based on the current variation. Static winding resistance measurement and dynamic resistance measurement are the types of resistance measurement.
3.1.1. Offline Dissolved Gas Analysis (DGA)
One of the most prevalent methods for detecting incipient problems in oil-filled power transformers and OLTCs is dissolved gas analysis (DGA). Several essential gases can be detected in the OLTC oil; these gases are hydrogen (), methane (), ethane (), ethylene (), acetylene (), carbon monoxide (CO), and carbon dioxide (), and their concentrations are expressed in parts per million (ppm) [37]. The OLTC must be de-energized for offline DGA, and an oil sample tube is used to extract, retain, and transport a sample of transformer oil in the same condition as it is inside a transformer, complete with any fault gases dissolved in it.
On-load tap-changers (OLTCs) have an oil compartment that houses the diverter switch or selector switch and keeps the tap-changer oil separate from the transformer oil. This stringent isolation is required for typical diverter and selector switches because the arc-breaking process significantly degrades the oil in the tap-changer compartment and creates massive volumes of particulates, soot, and fumes. It must be guaranteed that the transformer oil is not contaminated by these degradation products [38].
There are several commonly used methods for incipient fault diagnosis in the OLTC’s oil [39,40]. Their pros and cons are summarized in Table 4. However, as shown in Table 4, all these methods have some flaws. These flaws will undoubtedly jeopardize the diagnosis of latent faults in the OLTC. As a result, conventional methods cannot precisely determine the location of the fault. Furthermore, when using conventional methods, it is easy to misjudge the different types of faults with the same gas feature.
The Duval triangle method (DTM) has been proven to be the best method for fault identification in the transformer insulation. This can be justified, as several studies were conducted and found that among all the methods that are mentioned in Table 4, DTM has the highest accuracy when compared with the actual fault [11,22,23,41]. Figure 11 shows an example of a Duval Triangle used to assess the OLTC.

Table 4.
A comprehensive comparison of the traditional DGA based on ratio methods in actual transformer fault diagnosis.
Table 4.
A comprehensive comparison of the traditional DGA based on ratio methods in actual transformer fault diagnosis.
| Types of DGA Method | Advantage | Disadvantage |
|---|---|---|
| Doernenburg Ratio Method (DRM) | Determines the fault types according to the area in which the ratio is in a graph. A higher rate of accurately judging overheating faults. | All the ratios have to be in a given range in order to detect the faults. |
| Rogers Ratio Method (RRM) | Compound fault can be judged, and the accuracy is satisfactory. | Ratios which may not fit with any particular fault type. Requires other methods. |
| IEC Ratio Method (IRM) | The sequence of known faults is arranged more reasonably from incipient fault to severe fault based on the ratios; | Incomplete coding, some cases cannot be diagnosed; fails to identify the fault type accurately; |
| Duval Triangle Method (DTM) [42,43] | Capable of producing the highest accuracy and repeatability. More efficient compared to other traditional methods as it clarifies a wide range of faults. | Does not explain the normal aging of the transformer. Chances of mixing between electrical and thermal faults. |
Although offline DGA is widely used, there are some drawbacks to it. Firstly, the presence of sample contamination during and/or after on-site sampling can create problems. To perform offline DGA, allocations of time, cost, and resources are involved to manually obtain samples, especially in remote locations. Lastly, degradation of the sample between the time of analysis and the time of sampling can also create issues.
3.1.2. Static Winding Resistance Measurement (SWRM)
To perform a static winding resistance measurement (SWRM), the OLTC has to be in an idle condition [44]. With this method, it is possible to identify whether the contact surface of the OLTC’s switches is coked or other condition changes exist on the contact surface. A normal OLTC should be in a linear relationship when plotting the winding resistance and the number of taps, as shown in Figure 12 [45,46]. The higher the number of taps, the lower the resistance is. The downside of this method is that it does not measure the switching process of the diverter switch. This issue can be resolved by performing a dynamic resistance measurement [6].
3.1.3. Dynamic Resistance Measurement (DRM)
DRM can be executed when the OLTC switches are moving. As it can evaluate either transitional or stationery resistance when a tap’s position is moving, any relevant resistances of the switches can be measured as well as the transition impedances [48,49,50]. The tap changer operation can be identified based on sudden current changes called ripples. Typically, the ripples formed should be consistent and clean straight lines without bouncing marks [48]. This method can also be used for the tap selector contact, transition switch, diverter switch contact, and the main switch. Based on a case study [51], the researcher suspected a faulty selector contact after performing a DRM analysis, as shown in Figure 13.
It was found that the root cause of this problem was a loose bolted-on selector contact located at tap position 9, as shown in Figure 14. This leads to an increased resistance which heats the OLTC when operating tap changing at tap position 9.
The drawback of using DRM is that as the tap positions are switched every few seconds, the interval between steps may be insufficient for the current to stabilize due to inductance (e.g., transformer winding). This makes the DRM less accurate than the SWRM [49]. Nevertheless, DRM has its perks, as it can interpret the condition of contacts by plotting the resistance profile’s overall steps. On top of that, the deviation of the switching time between operational sequences caused by mechanical defects can be detected [49].
The DRM and SWRM measurements have a similar problem which is that the measurements can be inaccurate due to the deviation of temperature and the condition of the transformer’s winding. As this method applies DC voltage to the OLTC, extreme caution should be taken as it can damage the transformer winding and might affect the OLTC’s surface contacts. The resistance measurement sensitivity can be enhanced by using a lower DC voltage but interpreting the results can be difficult due to the signal fluctuation by the low DC input voltage. Based on experimentation, they found that 1A–1.5A with a minimum circuit resistance is the most appropriate level, and a lower current can be quite sensitive for a medium-aged OLTC [50]. Table 5 explains a summary of the offline condition monitoring that we have discussed before.
3.2. Online Condition Monitoring
One condition monitoring that stresses the ongoing monitoring of a machine or any industrial process is online condition monitoring. The procedure of online condition monitoring is uninterrupted. In online condition monitoring, there is no such thing as a shutdown. This aids in cost-cutting and avoids unforeseen expenses. In today’s competitive age, we cannot afford to lose production or have equipment break due to increased demand. Online condition monitoring and diagnostics is a useful tool to help operators to manage their assets and make decisions on continuing operation, maintenance, or replacement [19,49,50].
3.2.1. Online Dissolved Gas Analysis (DGA)
As a well-established method of transformer diagnostics, DGA is at the heart of online monitoring. Studies have shown that DGA can detect and provide an early warning of most prevalent failures in power transformers [11,22]. DGA detects partial discharge (PD) in the insulation system, commonly known as the corona, arcing (discharges), and high temperature (thermal) concerns. Each of these problems creates various critical gases and gas ratios and may thus be easily detected.
DGA has traditionally been performed by removing a sample of oil from the transformer. The measurement process generally begins with sampling and extracting the dissolved gases in the oil. There is a distinction between the various extraction methods, with vacuum extraction being the most accurate and headspace extraction being the most used. A gas phase consisting of carrier gas is located above the mineral oil to be analyzed in the headspace method, into which the dissolved gases diffuse. The composition of the gases is determined after extraction.
In most cases, this is accomplished using gas chromatography. The gas mixture (carrier gas + key gases) is forced through a tube system and detected on a thermal detector. Depending on the physical and chemical properties of the gas molecules, they migrate at different speeds through the columns of the GC tube and then hit the detector at a specific point in time. Unless there is a suspicion of a problem with the transformer, samples might be obtained at intervals of up to a year, depending on the operator’s maintenance programme. This means that a fault that develops in less time than the sampling interval may be undetected, potentially leading to the transformer’s catastrophic failure.
DGA online monitors have been developed that employ various technologies, including photo-acoustic emission spectroscopy (PAS) and gas chromatography (GC). PAS and GC can provide continuous monitoring for essential power transformers, alerting the client depending on gas concentrations, rates of concentration change, or gas ratios, as shown in Figure 15 [52].
The essential feature of these monitors is that their outputs are reliable and repeatable, allowing trending analysis to be conducted. The systems also include built-in alarms that may warn the user of excessive levels of gas concentrations, high rates of concentration change, and changes in essential ratios.
3.2.2. Vibro-Acoustic Analysis
One of the characteristics that may be checked online to provide an indicator of the OLTC state is vibro-acoustic analysis. Vibrations are produced by the mechanical movement of the tap changer, which can be easily detected using appropriate sensors attached to the OLTC tank walls. The acoustic signature can be recorded and compared to previous data on the assumption that the acoustic signature is well reproducible in time for defect-free tap changers. Anomalies should be highlighted by differences in the acoustic profile over time. The acoustic signal can be divided into two frequency bands: one in the few tens of kHz range targeted at identifying mechanical problems (e.g., excessive wear or ruptured springs) and one in the range of 100 kHz aimed at detecting electrical problems (arcing when there should not be any) [57].
3.2.3. Infra-Red (IR) Thermography
An infrared thermal imager is used to check the condition of electrical equipment. The infrared thermal imager creates a thermal profile of electrical equipment without interfering with the equipment’s operation. These thermal profiles include a thermal image as well as a temperature scale. This appears in a different colour, indicating the location of the equipment [36]. Although infrared radiation (IR) is not visible to the naked eye, an IR camera may convert it into a visual image illustrating the thermal fluctuations over an object scene. IR encompasses a section of the electromagnetic spectrum ranging from around 900 to 14,000 nanometers (0.9–14 μm). All objects emit infrared radiation at temperatures above absolute zero, and the amount of radiation increases with temperature. Thermographic monitoring measurement techniques in the transformer is a method used to measure temperature in transformer components that provides a visual image, which is used to analyse the condition of the transformer parts and determine if the parts are in good condition or otherwise.
The requirement for electrical utilities to decrease operating costs while improving the availability and dependability of their equipment drives the reason for online power transformers. The analysis of data collected by an online monitoring system demonstrates the ability to detect impending failures in active parts, bushings, on-load tap changers, and cooling units. It is critical to consider online monitoring because it will help to avoid substantial failure costs for outages, repairs, and collateral effects. Table 7 explains a summary of the online condition monitoring that we have discussed before.
4. Conclusions
Condition monitoring is an effective monitoring strategy for detecting potential defects within the transformer’s OLTC. The OLTC is a vital component of the electrical power supply. It is critical to be aware of such flaws and to understand how to avoid them. The goal of this study is to review several condition-monitoring techniques (online and offline) that can continuously monitor the health of the OLTC and assure the safety of the transformer’s OLTC from irreparable damage by detecting the defect at an earlier stage.
In this paper, we have covered the types of faults that can occur in the OLTC, discussing oil, mechanical, and electrical faults. Arc switching during the tap changing is unavoidable regardless of how well it is serviced. This branches out to increase the temperature in the insulation oil and the generation of multiple hot gases, which can cause severe carbonization of the parts, mechanical fatigue on the mechanical parts, especially the tap changers, and reduces the dielectric strength of the insulation oil. As the highly combustible gas concentration increases over time, the OLTC will soon be a ticking bomb waiting to explode at any time if not monitored and appropriately maintained. Based on our findings, arcing is notorious as it leads to all kinds of OLTC faults. However, there is still room for development on improving the tap changing process and minimizing the occurrence of arcing. Additionally, the dielectric breakdown strength of the insulation oil plays a vital role in electrical insulation between the energized tap changing parts. The presence of water (which can be detected using DGA) can lead to poor quality of the insulation oil or, in simple terms, reduces the dielectric strength [16]. The lower the dielectric strength of the insulation oil, the more arcing will occur and cause many problems in the future.
Next, various techniques for detecting these faults for both online and offline condition monitoring have been elaborated. Clearly, online condition monitoring is the better choice as de-energizing of the OLTC is not required. At the same time, it is also capable of real-time monitoring. On the negative side, devices for online monitoring are expensive due to the complexity of the system required. Offline condition monitoring has its perks as it is not as costly compared to online condition monitoring and is quite reliable.
It is worth mentioning that one must not depend on a single diagnostic technique in determining the incipient fault but validate the outcome with other known techniques as well. Furthermore, integrating the current techniques with artificial intelligence to detect the fault more accurately would be a promising future of condition monitoring for the OLTC.
Author Contributions
All authors have made an important contribution to the creation of this paper. F.B.I.; conceptualization, M.M. (Maisarah Mazwan) and H.A.-F.; conceptualization and writing—original draft preparation, M.M. (Marayati Marsadek), H.H. and A.A.-B.; writing—review and editing, Y.Z.Y.G.; review. All authors have read and agreed to the published version of the manuscript.
Funding
The authors would like to acknowledge the financial support provided by Tenaga Nasional Berhad Seeding Fund with the project code: U-TD-RD-21-07, that is managed by UNITEN R&D Sdn. Bhd.
Institutional Review Board Statement
Not applicable.
Informed Consent Statement
Not applicable.
Data Availability Statement
Not applicable.
Acknowledgments
The authors would like to acknowledge the publication support through TNB Seeding Fund provided by Tenaga Nasional Berhad (TNB), Project No. U-TD-RD-21-07.
Conflicts of Interest
The authors declare no conflict of interest.
References
- Seo, J.; Ma, H.; Saha, T.K. A Joint Vibration and Arcing Measurement System for Online Condition Monitoring of Onload Tap Changer of the Power Transformer. IEEE Trans. Power Deliv. 2017, 32, 1031–1038. [Google Scholar] [CrossRef]
- Gray, I.A.R. Condition-Based Assessment of On-Load Tap Changers. 2018. Available online: https://www.wearcheck.co.za/shared/TB66.pdf (accessed on 11 July 2022).
- Ghoneim, S.S.M.; Dessouky, S.S.; Taha, I.B.M.; Shaaban, M.; Abdelwahab, S.A.M. A new approach of tap changer maintenance incorporating nanoparticle insulating oil. Electr. Eng. 2021, 103, 931–944. [Google Scholar] [CrossRef]
- Duan, R.; Zuo, Y.; Zheng, H.; Yao, R.; Deng, M.; Sun, Z. Condition monitoring of on-load tap-changers in converter transformers based on vibration method. In Proceedings of the 2nd IEEE Conference on Energy Internet and Energy System Integration, EI2 2018, Beijing, China, 20–22 October 2018. [Google Scholar] [CrossRef]
- Erbrink, J.J.; Gulski, E.; Smit, J.J.; Seitz, P.P.; Quak, B.; Leich, R.; Malewski, R.A. On-load tap changer diagnosis—An off-line method for detecting degradation and defects: Part 1. IEEE Electr. Insul. Mag. 2010, 26, 49–59. [Google Scholar] [CrossRef]
- Plath, C.; Pütter, M. Dynamic analysis and testing of On-Load Tap Changer with dynamic resistance measurement. Transform. Mag. 2016, 3, 104–109. [Google Scholar]
- Abu Elanien, A.; Salama, M.M.A. Survey on the transformer condition monitoring. In Proceedings of the LESCOPE’07—2007 Large Engineering Systems Conference on Power Engineering, Montreal, QC, Canada, 10–12 October 2007; pp. 187–191. [Google Scholar] [CrossRef]
- Bustamante, S.; Manana, M.; Arroyo, A.; Laso, A.; Martinez, R. Determination of Transformer Oil Contamination from the OLTC Gases in the Power Transformers of a Distribution System Operator. Appl. Sci. 2020, 10, 8897. [Google Scholar] [CrossRef]
- Liu, Z.; Xia, X.; Ji, S.; Shi, Y.; Zhang, F.; Fu, Y.; Jiang, Z. Fault diagnosis of OLTC based on time-frequency image analysis of vibration signal. In Proceedings of the 2018 Condition Monitoring and Diagnosis (CMD), Perth, Australia, 23–26 September 2018. [Google Scholar] [CrossRef]
- Cao, H.; Wu, X.; Zhou, J.; Zhao, X.; Zhou, J. Research progress on mechanical fault diagnosis of on-load tap changer based on vibration analysis. In Proceedings of the 2021 IEEE International Conference on Power Electronics, Computer Applications, ICPECA 2021, Shenyang, China, 22–24 January 2021; pp. 948–951. [Google Scholar] [CrossRef]
- Golarz, J. Understanding dissolved gas analysis (DGA) techniques and interpretations. In Proceedings of the IEEE Power Engineering Society Transmission and Distribution Conference, Dallas, TX, USA, 3–5 May 2016. [Google Scholar] [CrossRef]
- Metwally, I.A. Failures, Monitoring and New Trends of Power Transformers. IEEE Potentials 2011, 30, 36–43. [Google Scholar] [CrossRef]
- Peimankar, A.; Lapthorn, A.C. Condition assessment of transformers load tap changers using support vector machine. In Proceedings of the 19th International Symposium on High Voltage Engineering, Pilsen, Czech Republic, 23–28 August 2015. [Google Scholar]
- Tremaine, C.; Milojevic, G.; Levi, R. Findings and repair of westinghouse UTT and McGraw 550 tap Changers|DV power. In Proceedings of the 84th International Conference of Doble Clients, Boston, MA, USA, 6–11 March 2017; pp. 3–6. Available online: https://www.dv-power.com/download/c-tremaine-g-milojevic-r-levi-findings-and-repair-of-westinghouse-utt-and-mcgraw-550-tap-changers-84th-international-conference-of-doble-clients-2017/ (accessed on 11 July 2022).
- Using Tap Changer Dual Assessment on Transformers|Credible Carbon. Available online: https://www.crediblecarbon.com/news-and-info/news/using-tap-changer-dual-assessment-on-transformers/ (accessed on 11 July 2022).
- Ab Ghani, S.; Khiar, M.S.A.; Chairul, I.S.; Zamir, M.I. Effects of Moisture Content and Temperature on the Dielectric Strength of Transformer Insulating Oil. J. Adv. Res. Fluid Mech. Therm. Sci. J. Homepage 2019, 63, 107–116. Available online: www.akademiabaru.com/arfmts.html (accessed on 11 July 2022).
- Samarasinghe, S.; Ekanayake, C.; Ma, H.; Saha, T.K.; Baniya, J.; Allan, D.; Russell, G. A Risk Assessment for Utilities to Prevent Transformer OLTC Failures Caused by Silver Sulphide Corrosion. IEEE Trans. Power Deliv. 2022, 37, 2394–2402. [Google Scholar] [CrossRef]
- Samarasinghe, S.; Naranpanawe, L.; Martin, D.; Me, H.; Saha, T.K. Finite element analysis on on-load tap changer (OLTC) Tap selector electrical breakdown mechanism caused by silver sulphide corrosion. In Proceedings of the IEEE Power and Energy Society General Meeting, Atlanta, GA, USA, 4–8 August 2019. [Google Scholar] [CrossRef]
- Khiar, M.S.B.A.; Thayoob, Y.H.; Ghazali, Y.Z.Y.; Ab Ghani, S.; Chairul, I.S. Diagnosis of OLTC via duval triangle method and dynamic current measurement. Procedia Eng. 2013, 68, 477–483. [Google Scholar] [CrossRef]
- Irungu, G.K.; Akumu, A.O.; Munda, J.L. Transformer condition assessment using dissolved gas analysis, oil testing and evidential reasoning approach. In Proceedings of the 33rd Electrical Insulation Conference, EIC 2015, Seattle, WA, USA, 7–10 June 2015; pp. 145–149. [Google Scholar] [CrossRef]
- Sun, H.-C.; Huang, Y.-C.; Huang, C.-M. A review of dissolved gas analysis in power transformers. Energy Procedia 2012, 14, 1220–1225. [Google Scholar] [CrossRef]
- Bustamante, S.; Manana, M.; Arroyo, A.; Castro, P.; Laso, A.; Martinez, R. Dissolved gas analysis equipment for online monitoring of transformer oil: A review. Sensors 2019, 19, 4057. [Google Scholar] [CrossRef] [PubMed]
- Wattakapaiboon, W.; Pattanadech, N. The state of the art for dissolved gas analysis based on interpretation techniques. In Proceedings of the CMD 2016—International Conference on Condition Monitoring and Diagnosis, Xi’an, China, 25–28 September 2016; pp. 60–63. [Google Scholar] [CrossRef]
- Al, A.E. A review on fault detection and condition monitoring of power transformer. Int. J. Adv. Appl. Sci. 2019, 6, 100–110. [Google Scholar] [CrossRef]
- Wani, S.A.; Rana, A.S.; Sohail, S.; Rahman, O.; Parveen, S.; Khan, S.A. Advances in DGA based condition monitoring of transformers: A review. Renew. Sustain. Energy Rev. 2021, 149, 111347. [Google Scholar] [CrossRef]
- Shamsudin, M.S.; Yakub, F.; Shapiai, M.I.; Mohmad, A.; Hamid, N.A.A. Investigation on Online DGA Monitoring to Determine Transformer Health Index Using Machine Learning. J. Phys. Conf. Ser. 2021, 2128, 012024. [Google Scholar] [CrossRef]
- Wegelin, F.; Magalhaes, R.; de Almeida, L.; Fontana, M. Condition Monitoring of Power Transformers Using Acoustic Signal Prony’s Analysis. In Proceedings of the 2005 IEEE Instrumentationand Measurement Technology Conference Proceedings, Ottawa, ON, Canada, 16–19 May 2006; Volume 2, pp. 1384–1387. [Google Scholar] [CrossRef]
- Kweon, D.-J.; Chin, S.-B.; Kwak, H.-R.; Kim, J.-C.; Song, K.-B. The Analysis of Ultrasonic Signals by Partial Discharge and Noise from the Transformer. IEEE Trans. Power Deliv. 2005, 20, 1976–1983. [Google Scholar] [CrossRef]
- Brikci, F.; Giguère, P.A.; Soares, M.; Tardif, C.; Québec, H. The vibro-acoustic method as fast diagnostic tool on load tap changers through the simultaneous analysis of vibration, dynamic resistance and high speed camera recordings. In Proceedings of the CMDM 2015 Condition Monitoring, Diagnosis and Maintenance, CIGRÉ, Bucharest, Romania, 5–8 October 2015; pp. 5–6. [Google Scholar]
- Rivas, E.; Burgos, J.C.; Garcia-Prada, J.C. Vibration Analysis Using Envelope Wavelet for Detecting Faults in the OLTC Tap Selector. IEEE Trans. Power Deliv. 2010, 25, 1629–1636. [Google Scholar] [CrossRef]
- Duan, R.; Wang, F. Fault Diagnosis of On-Load Tap-Changer in Converter Transformer Based on Time–Frequency Vibration Analysis. IEEE Trans. Ind. Electron. 2016, 63, 3815–3823. [Google Scholar] [CrossRef]
- Aciu, A.-M.; Nicola, C.-I.; Nicola, M.; Nițu, M.-C. Complementary Analysis for DGA Based on Duval Methods and Furan Compounds Using Artificial Neural Networks. Energies 2021, 14, 588. [Google Scholar] [CrossRef]
- Pan, Z.; Zhang, J.; Zhou, H.; Deng, J.; Liang, C.; Li, D. Mechanical condition assessment of vacuum on-load tap-changer for converter transformer based on time-frequency domain characteristics of vibration signal. In Proceedings of the 2020 IEEE International Conference on High Voltage Engineering and Application (ICHVE), Beijing, China, 6–10 September 2020. [Google Scholar] [CrossRef]
- Zhang, Z.; Chen, W.; Lei, J.; Gu, H. Vibration signal processing and state analysis technology for on-load tap-changer. In Proceedings of the 2020 International Conference on Diagnostics in Electrical Engineering (Diagnostika), Pilsen, Czech Republic, 1–4 September 2020. [Google Scholar] [CrossRef]
- Shang, R.; Peng, C.; Fang, R. A segmented preprocessing method for the vibration signal of an on-load tap changer. Electronics 2021, 10, 131. [Google Scholar] [CrossRef]
- Mariprasath, T.; Kirubakaran, V. A real time study on condition monitoring of distribution transformer using thermal imager. Infrared Phys. Technol. 2018, 90, 78–86. [Google Scholar] [CrossRef]
- IEEE Guide for Dissolved Gas Analysis in Transformer Load Tap Changers. 2016. Available online: https://ieeexplore.ieee.org/stamp/stamp.jsp?tp=&arnumber=7464235&isnumber=7464234 (accessed on 11 July 2022).
- Frotscher, R.; Reinhausen, M. Common Oil Expansion Tank for Transformers and Tap-Changers. Transform. Mag. 2017, 4, 20–25. Available online: www.transformers-magazine.com (accessed on 11 July 2022).
- Abu-Siada, A.; Islam, S. A new approach to identify power transformer criticality and asset management decision based on dissolved gas-in-oil analysis. IEEE Trans. Dielectr. Electr. Insul. 2012, 19, 1007–1012. [Google Scholar] [CrossRef]
- Krishnan, R. A Review of the Monitoring Diagnostic Methods of Oil Immersed Transformers. Int. J. Eng. Res. Technol. 2018, 7, 304–310. [Google Scholar] [CrossRef]
- Norazhar, A.B.; Abu-Siada, A.; Huize, C.; Shengtao, L. Improvement of DGA Interpretation using Scoring Index Method. In Proceedings of the 1st International Conference on Electrical Materials and Power Equipment, Xi’an, China, 14–17 May 2017; pp. 1–5. [Google Scholar]
- Khiar, M.S.A.; Ghani, S.A.; Chairul, I.S.; Thayoob, Y.H.M.; Ghazali, Y.Z.Y. On-site OLTC monitoring using Duval triangle and DWRM. In Proceedings of the 2nd International Conference on Technology, Informatics, Management, Engineering and Environment, TIME-E 2014, Bandung, Indonesia, 19–21 August 2014; Volume 1, pp. 216–221. [Google Scholar] [CrossRef]
- Angkapiyasiri, M.; Fuangpian, P.; Suwanasri, T.; Suwanasri, C. Condition evaluation of power transformer by analysis of insulating oil tests. In Proceedings of the 15th International Conference on Electrical Engineering/Electronics, Computer, Telecommunications and Information Technology, Chiang Rai, Thailand, 18–21 July 2018; p. 4. [Google Scholar]
- Erbrink, J.J.; Gulski, E.; Smit, J.J.; Seitz, P.P.; Quak, B.; Leich, R.; Malewski, R. Diagnosis of Onload Tap Changer Contact Degradation by Dynamic Resistance Measurements. IEEE Trans. Power Deliv. 2010, 25, 2121–2131. [Google Scholar] [CrossRef]
- Khiar, M.S.A.; Thayoob, Y.H.M.; Ghazali, Y.Z.Y.; Ghani, S.A.; Chairul, I.S. Diagnosis of Oltc using Dga and static winding resistance test. In Proceedings of the 3rd International Conference on Engineering and ICT (ICEI2012), Melaka, Malaysia, 4–5 April 2012; pp. 1–4. Available online: https://www.researchgate.net/publication/272944065 (accessed on 11 July 2022).
- Krüger, M.; Dierks, A. Static and Dynamic Testing of Onload Tapchangers of Power Transformers. March 2008. pp. 16–18. Available online: https://www.ee.co.za/wp-content/uploads/legacy/Energize%20Alectrix%20Static.pdf (accessed on 11 July 2022).
- Carreno, D.; Chhajer, D. Transformer Winding Resistance Measurement: Field Challenges the Premiere Electrical Maintenance and Safety Event Transformer Winding Resistance Measurement: Field Challenges 2. Available online: https://control-protection.be/media/2121/Transformer-winding-resistance.pdf (accessed on 11 July 2022).
- Soni, J.M.; Suthar, D.P. An Experimental Analysis to Check Accuracy of DGA Using Duval Pentagonal Method in Power Transformer. Pap. Eng. 2017, 1, 394–401. [Google Scholar]
- Farooque, M.U.; Wani, S.A.; Khan, S.A. Artificial neural network (ANN) based implementation of Duval pentagon. In Proceedings of the 2015 International Conference on Condition Assessment Techniques in Electrical Systems, CATCON 2015, Bangalore, India, 10–12 December 2015; pp. 46–50. [Google Scholar] [CrossRef]
- Cheim, L.; Duval, M.; Haider, S. Combined Duval pentagons: A simplified approach. Energies 2020, 13, 2859. [Google Scholar] [CrossRef]
- Osmanbasic, E.; Skelo, G. Tap Changer Condition Assessment Using Dynamic Resistance Measurement. Procedia Eng. 2017, 202, 52–64. [Google Scholar] [CrossRef]
- Mackenzie, E.A.; Crossey, J.; Depablo, A.; Ferguson, W. On-line monitoring and diagnostics for power transformers: Application to on-load tap-changers. In Proceedings of the 2010 IEEE International Symposium on Electrical Insulation, San Diego, CA, USA, 6–9 June 2010. [Google Scholar] [CrossRef]
- Abu Bakar, N.; Abu-Siada, A.; Islam, S. A review of dissolved gas analysis measurement and interpretation techniques. IEEE Electr. Insul. Mag. 2014, 30, 39–49. [Google Scholar] [CrossRef]
- Zainab, Y.; Nizar, M.H.; Ahsanul, K.; Zaiki, A. (PDF) Gas Sensors: A Review. Sens. Transducers 2014, 168, 61–75. [Google Scholar]
- Hübert, T.; Boon-Brett, L.; Black, G.; Banach, U. Hydrogen sensors—A review. Sens. Actuators B Chem. 2011, 157, 329–352. [Google Scholar] [CrossRef]
- Chauhan, P.S.; Bhattacharya, S. Hydrogen gas sensing methods, materials, and approach to achieve parts per billion level detection: A review. Int. J. Hydrogen Energy 2019, 44, 26076–26099. [Google Scholar] [CrossRef]
- Secic, A.; Krpan, M.; Kuzle, I. Vibro-Acoustic Methods in the Condition Assessment of Power Transformers: A Survey. IEEE Access 2019, 7, 83915–83931. [Google Scholar] [CrossRef]
Figure 1.
Failure location of substation transformers based on 536 failures [6].
Figure 1.
Failure location of substation transformers based on 536 failures [6].

Figure 2.
Carbonized tap changer [5].
Figure 2.
Carbonized tap changer [5].
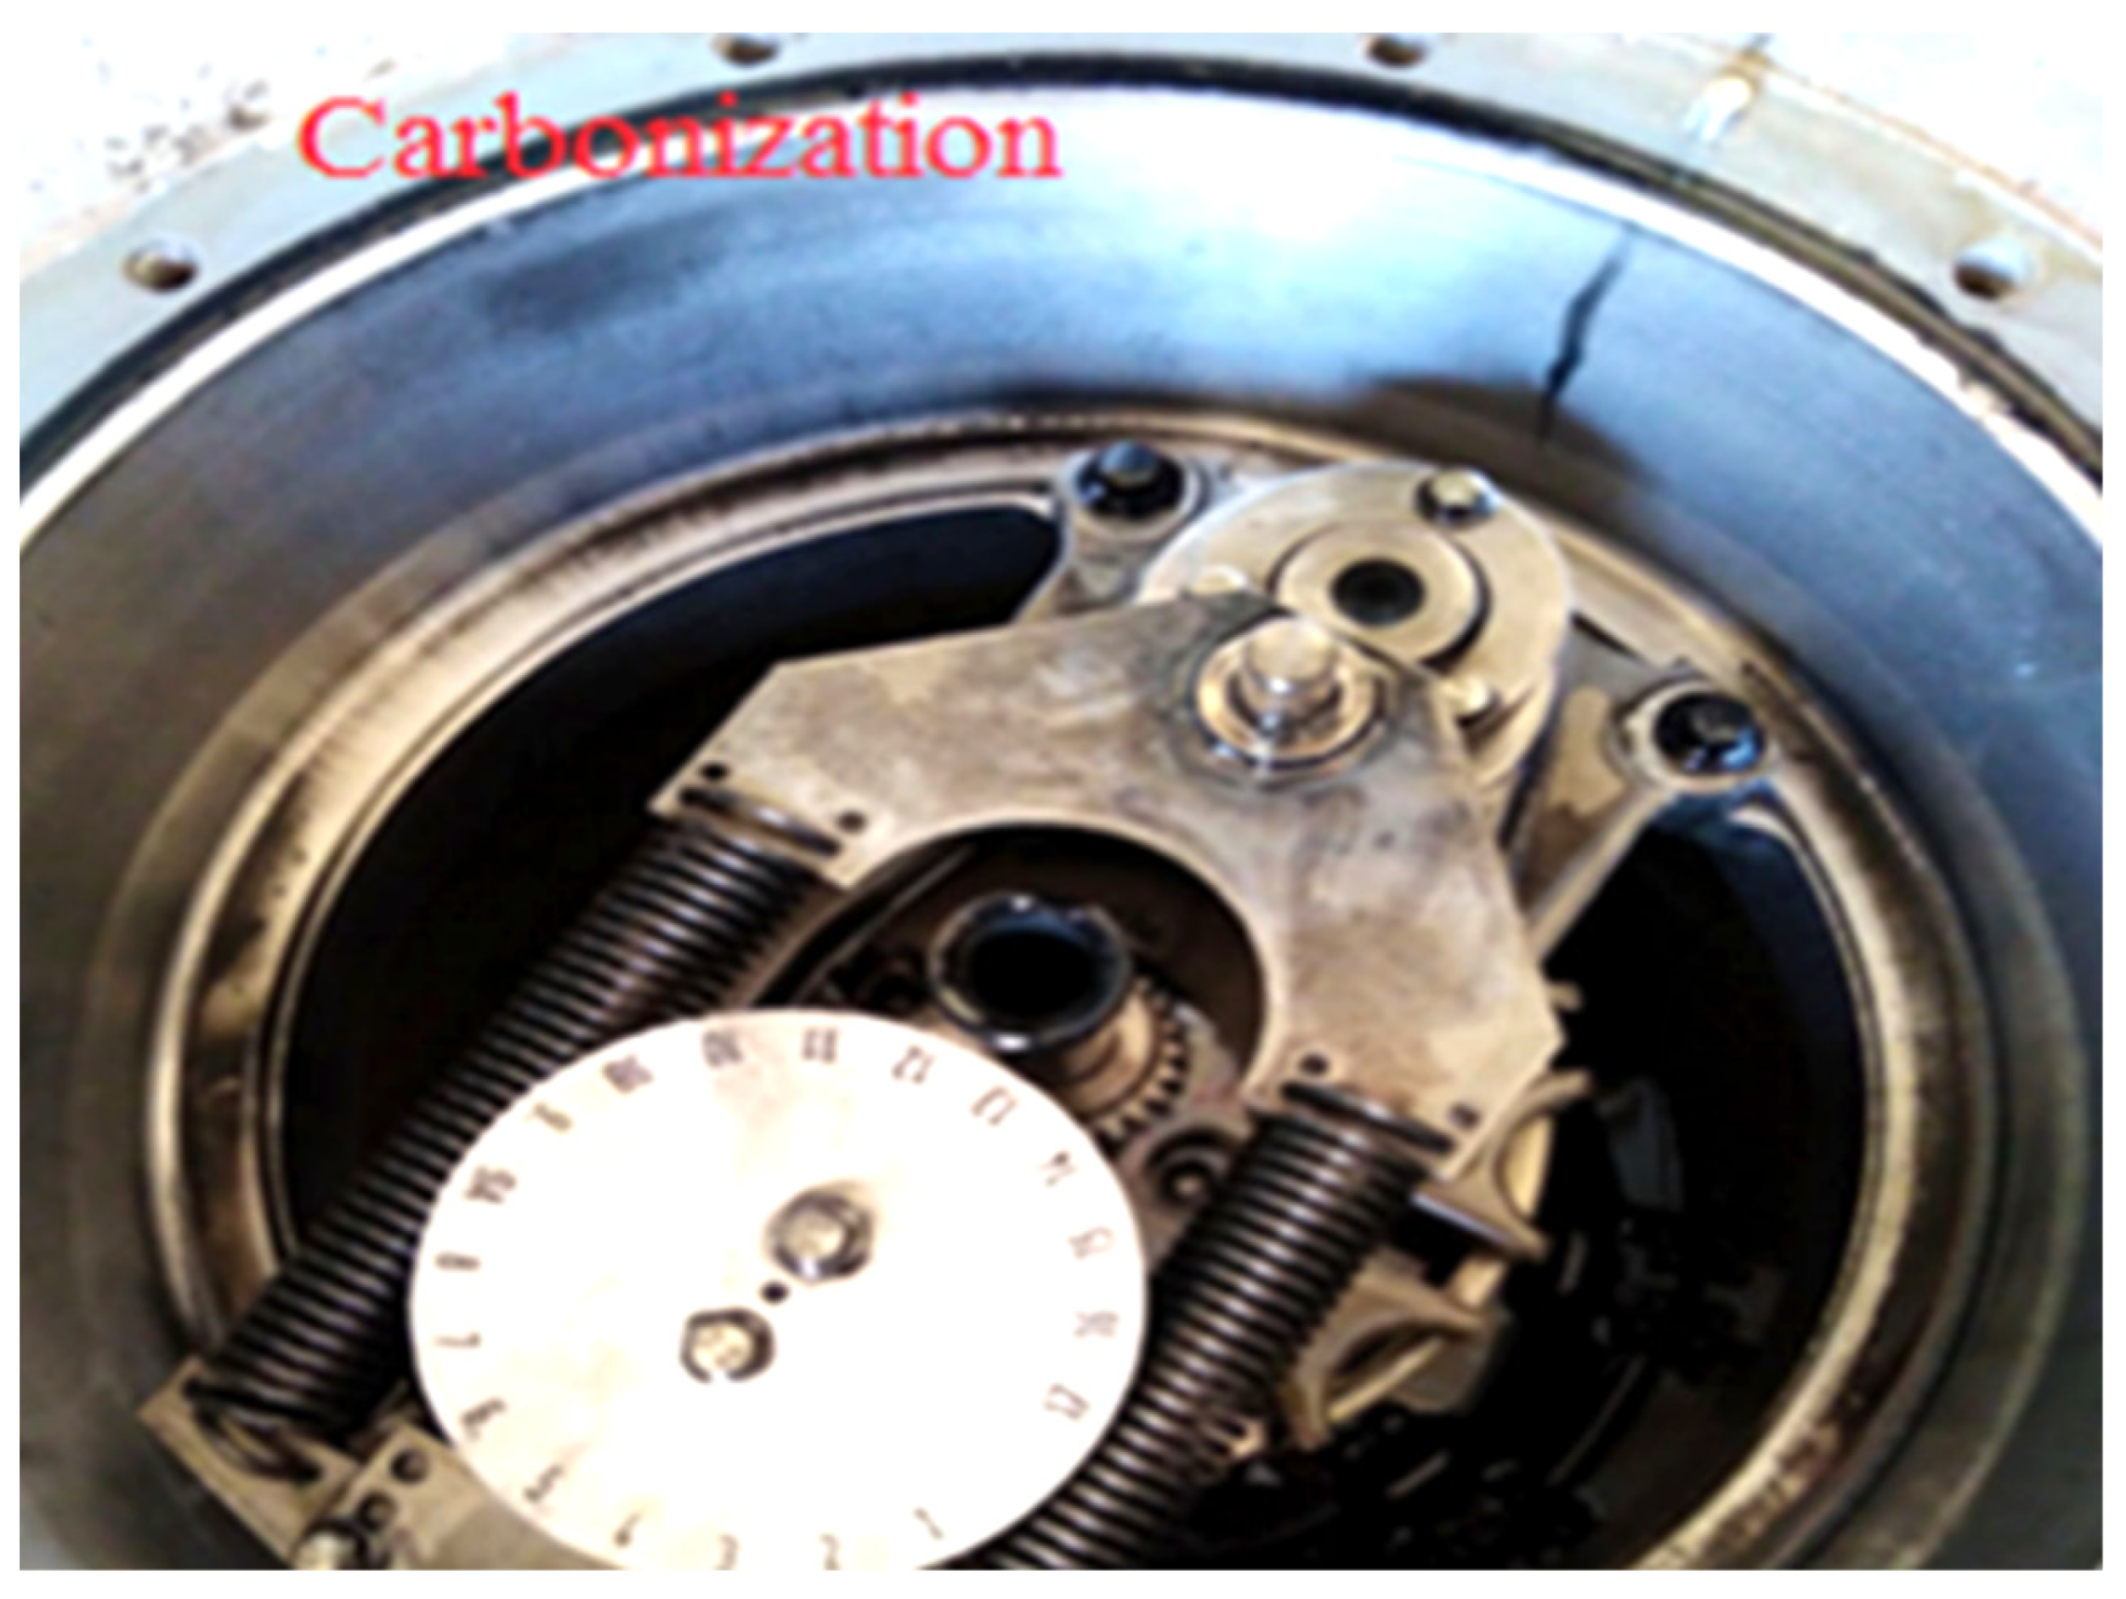
Figure 3.
Severe burning of the arm contacts and springs [2].
Figure 3.
Severe burning of the arm contacts and springs [2].
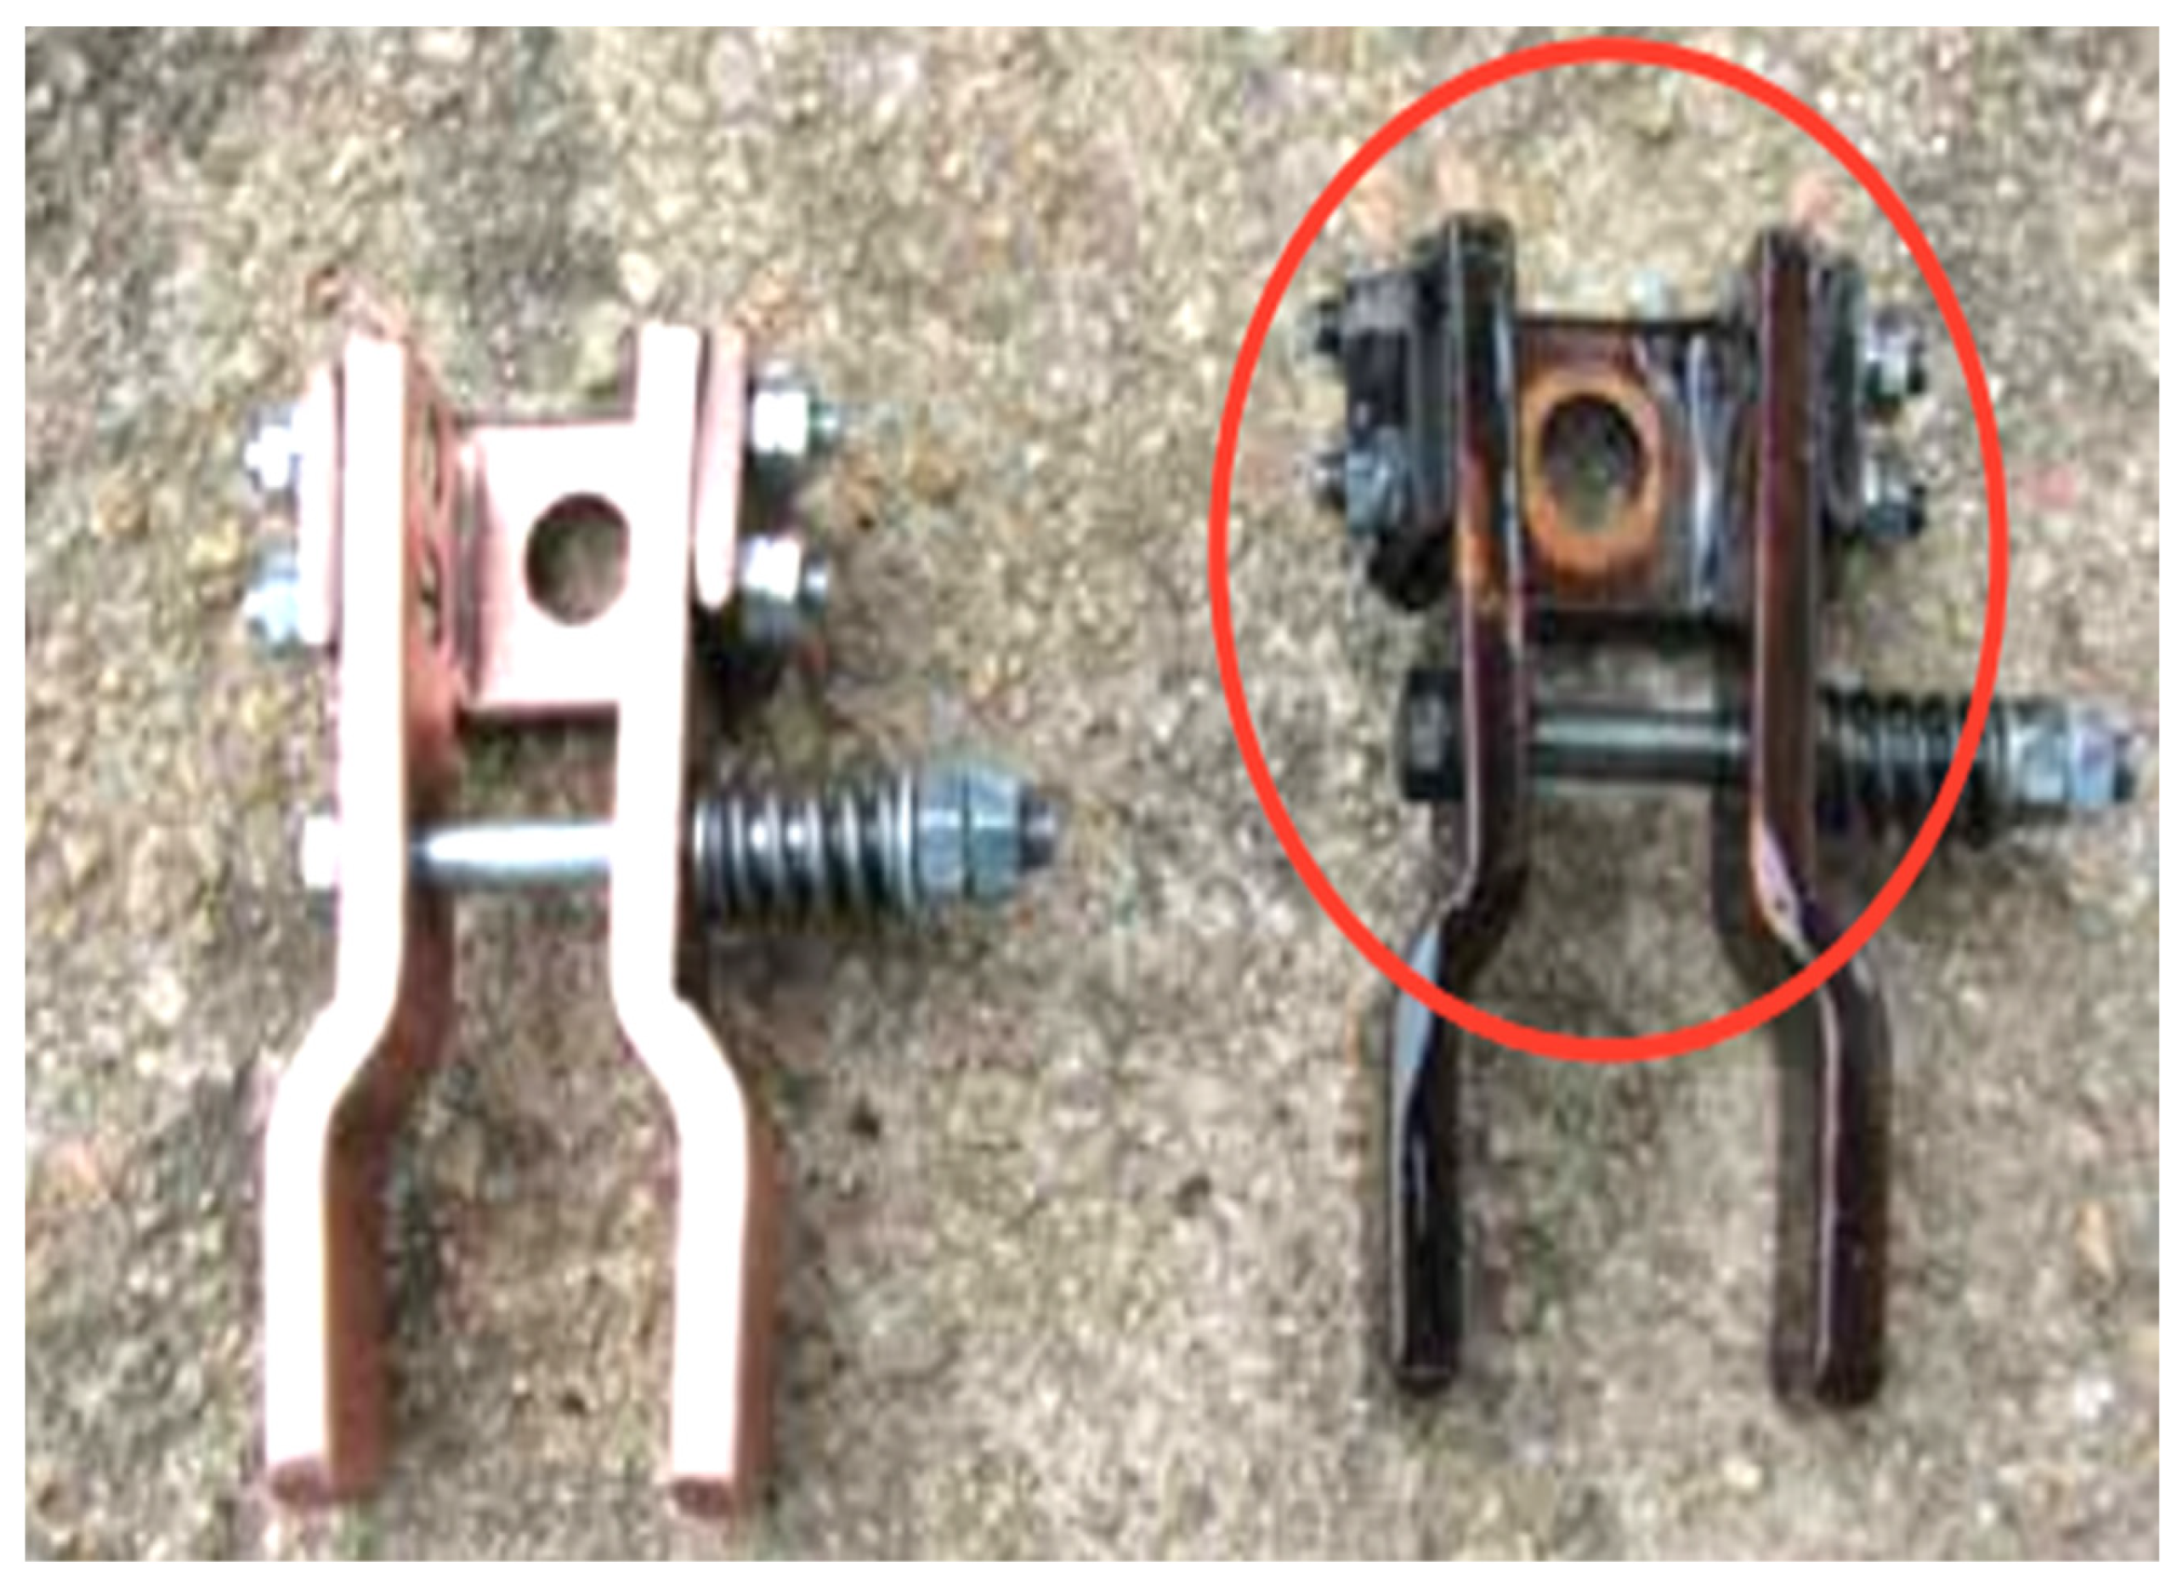
Figure 4.
Broken contact springs [13].
Figure 4.
Broken contact springs [13].

Figure 5.
Broken energy accumulator spring [13].
Figure 5.
Broken energy accumulator spring [13].
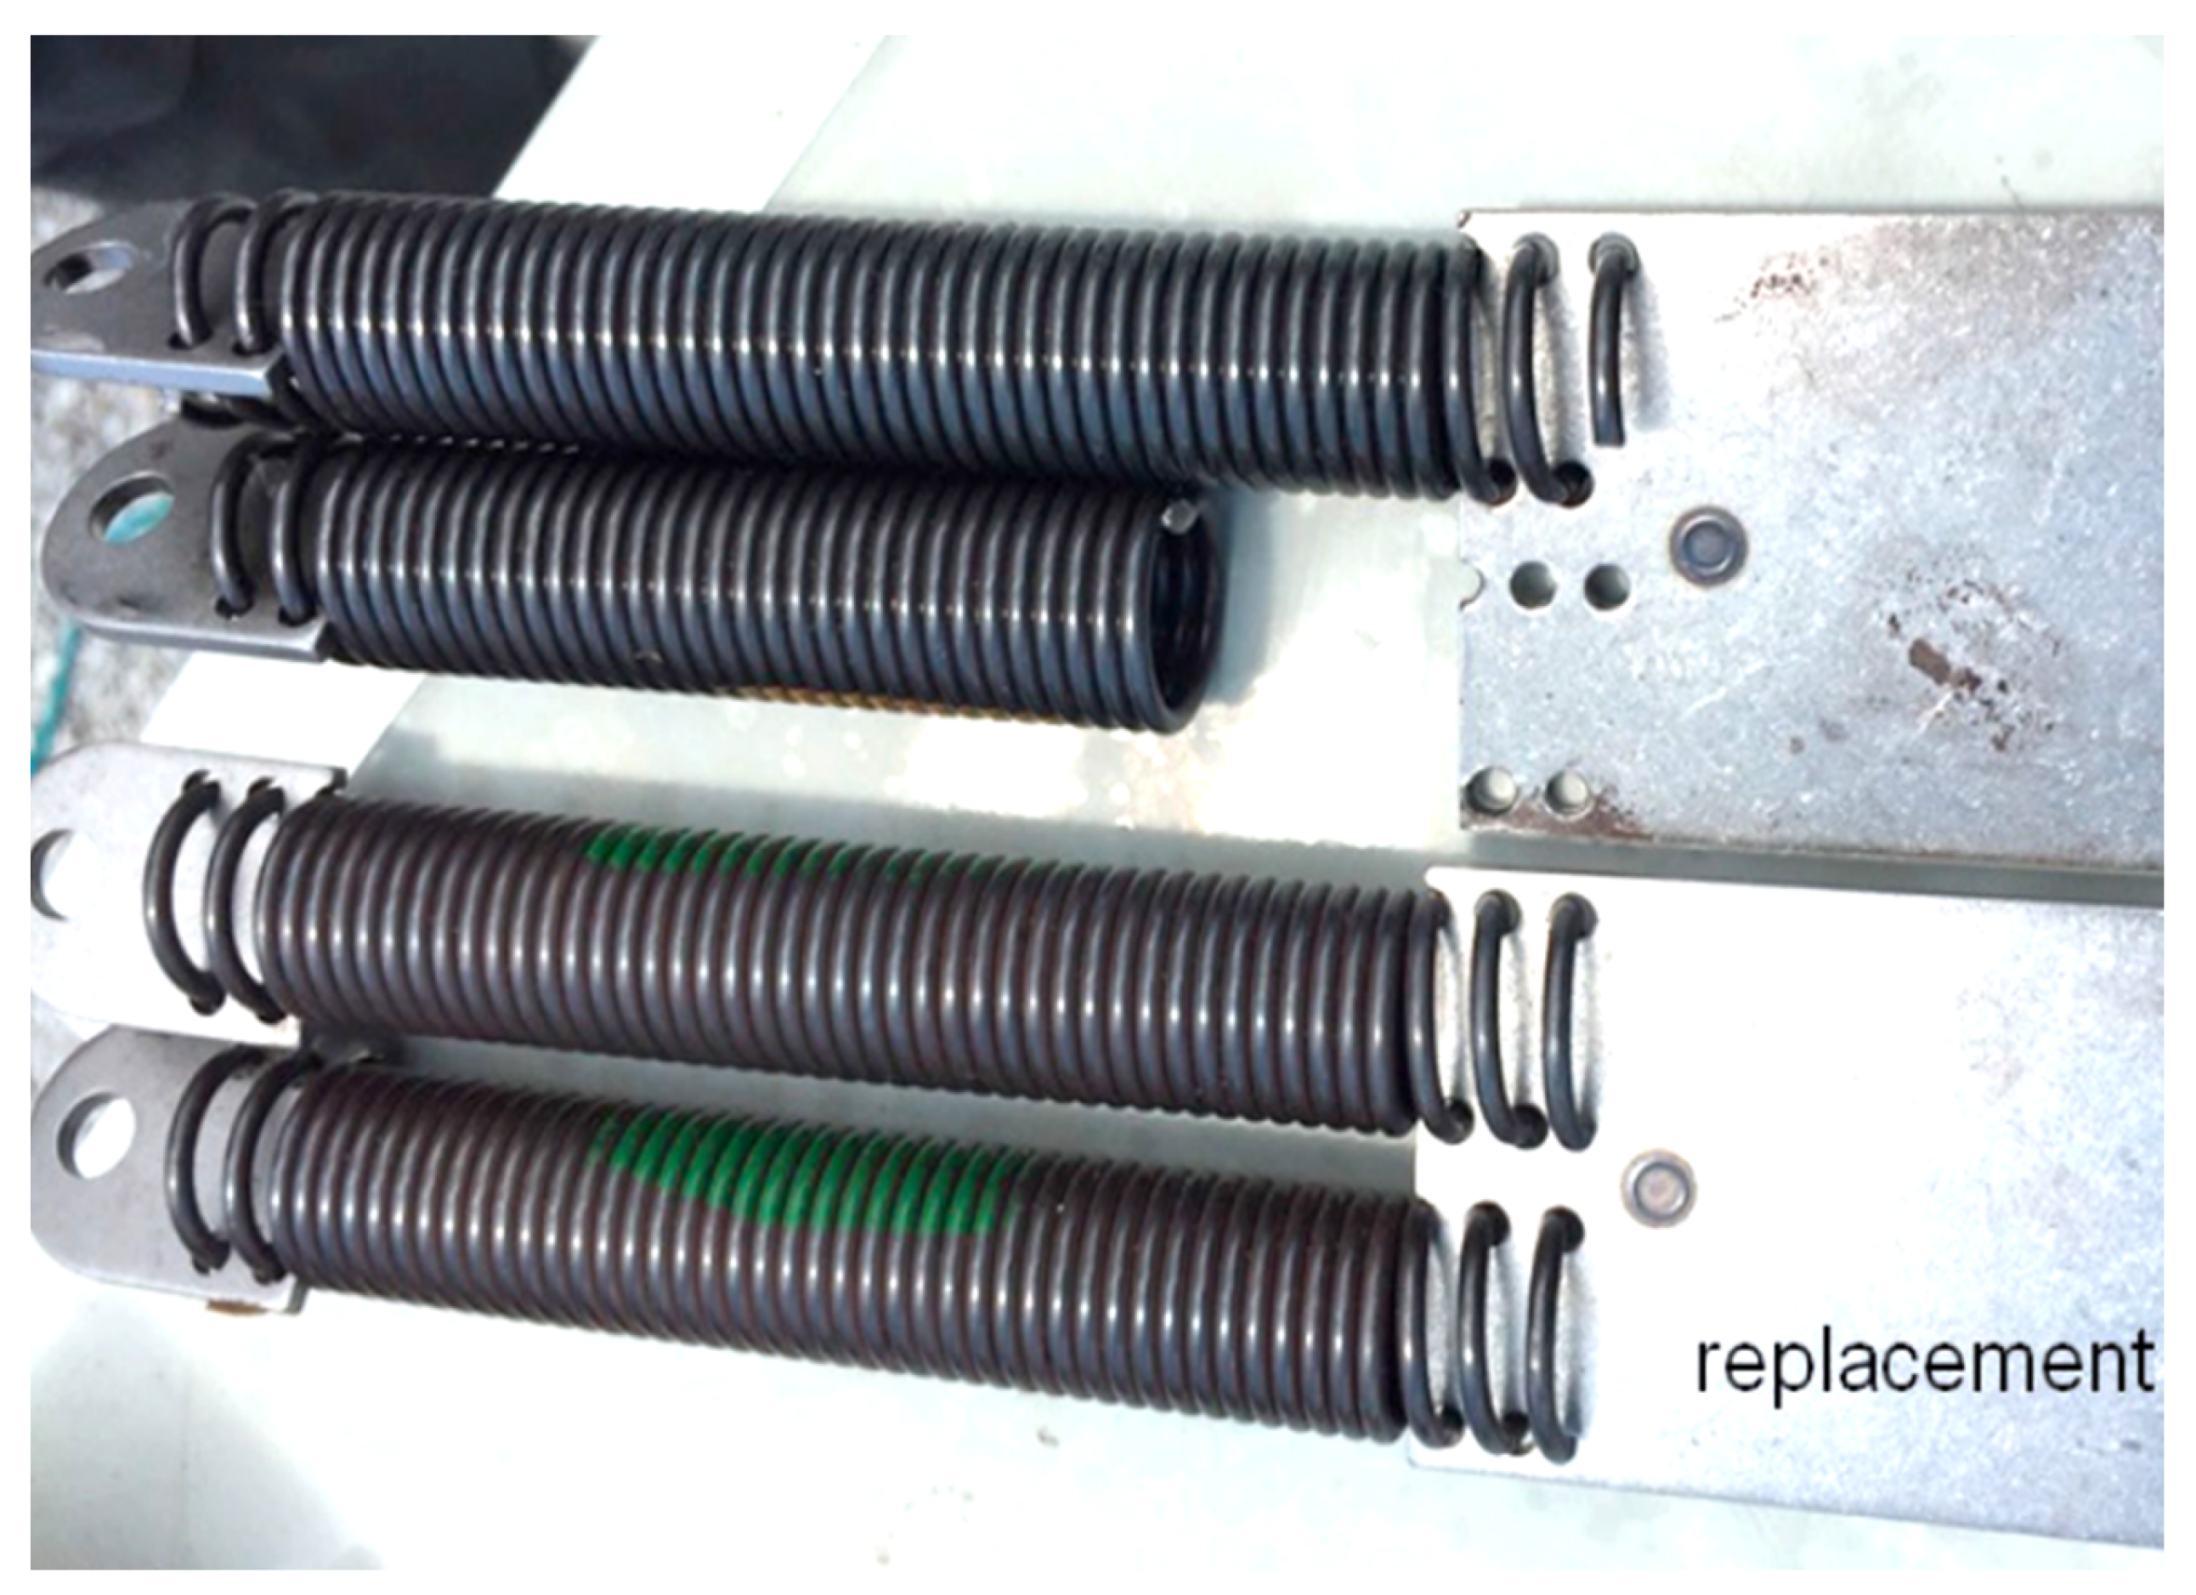
Figure 6.
Burned contacts on stationary and movable contacts [14].
Figure 6.
Burned contacts on stationary and movable contacts [14].
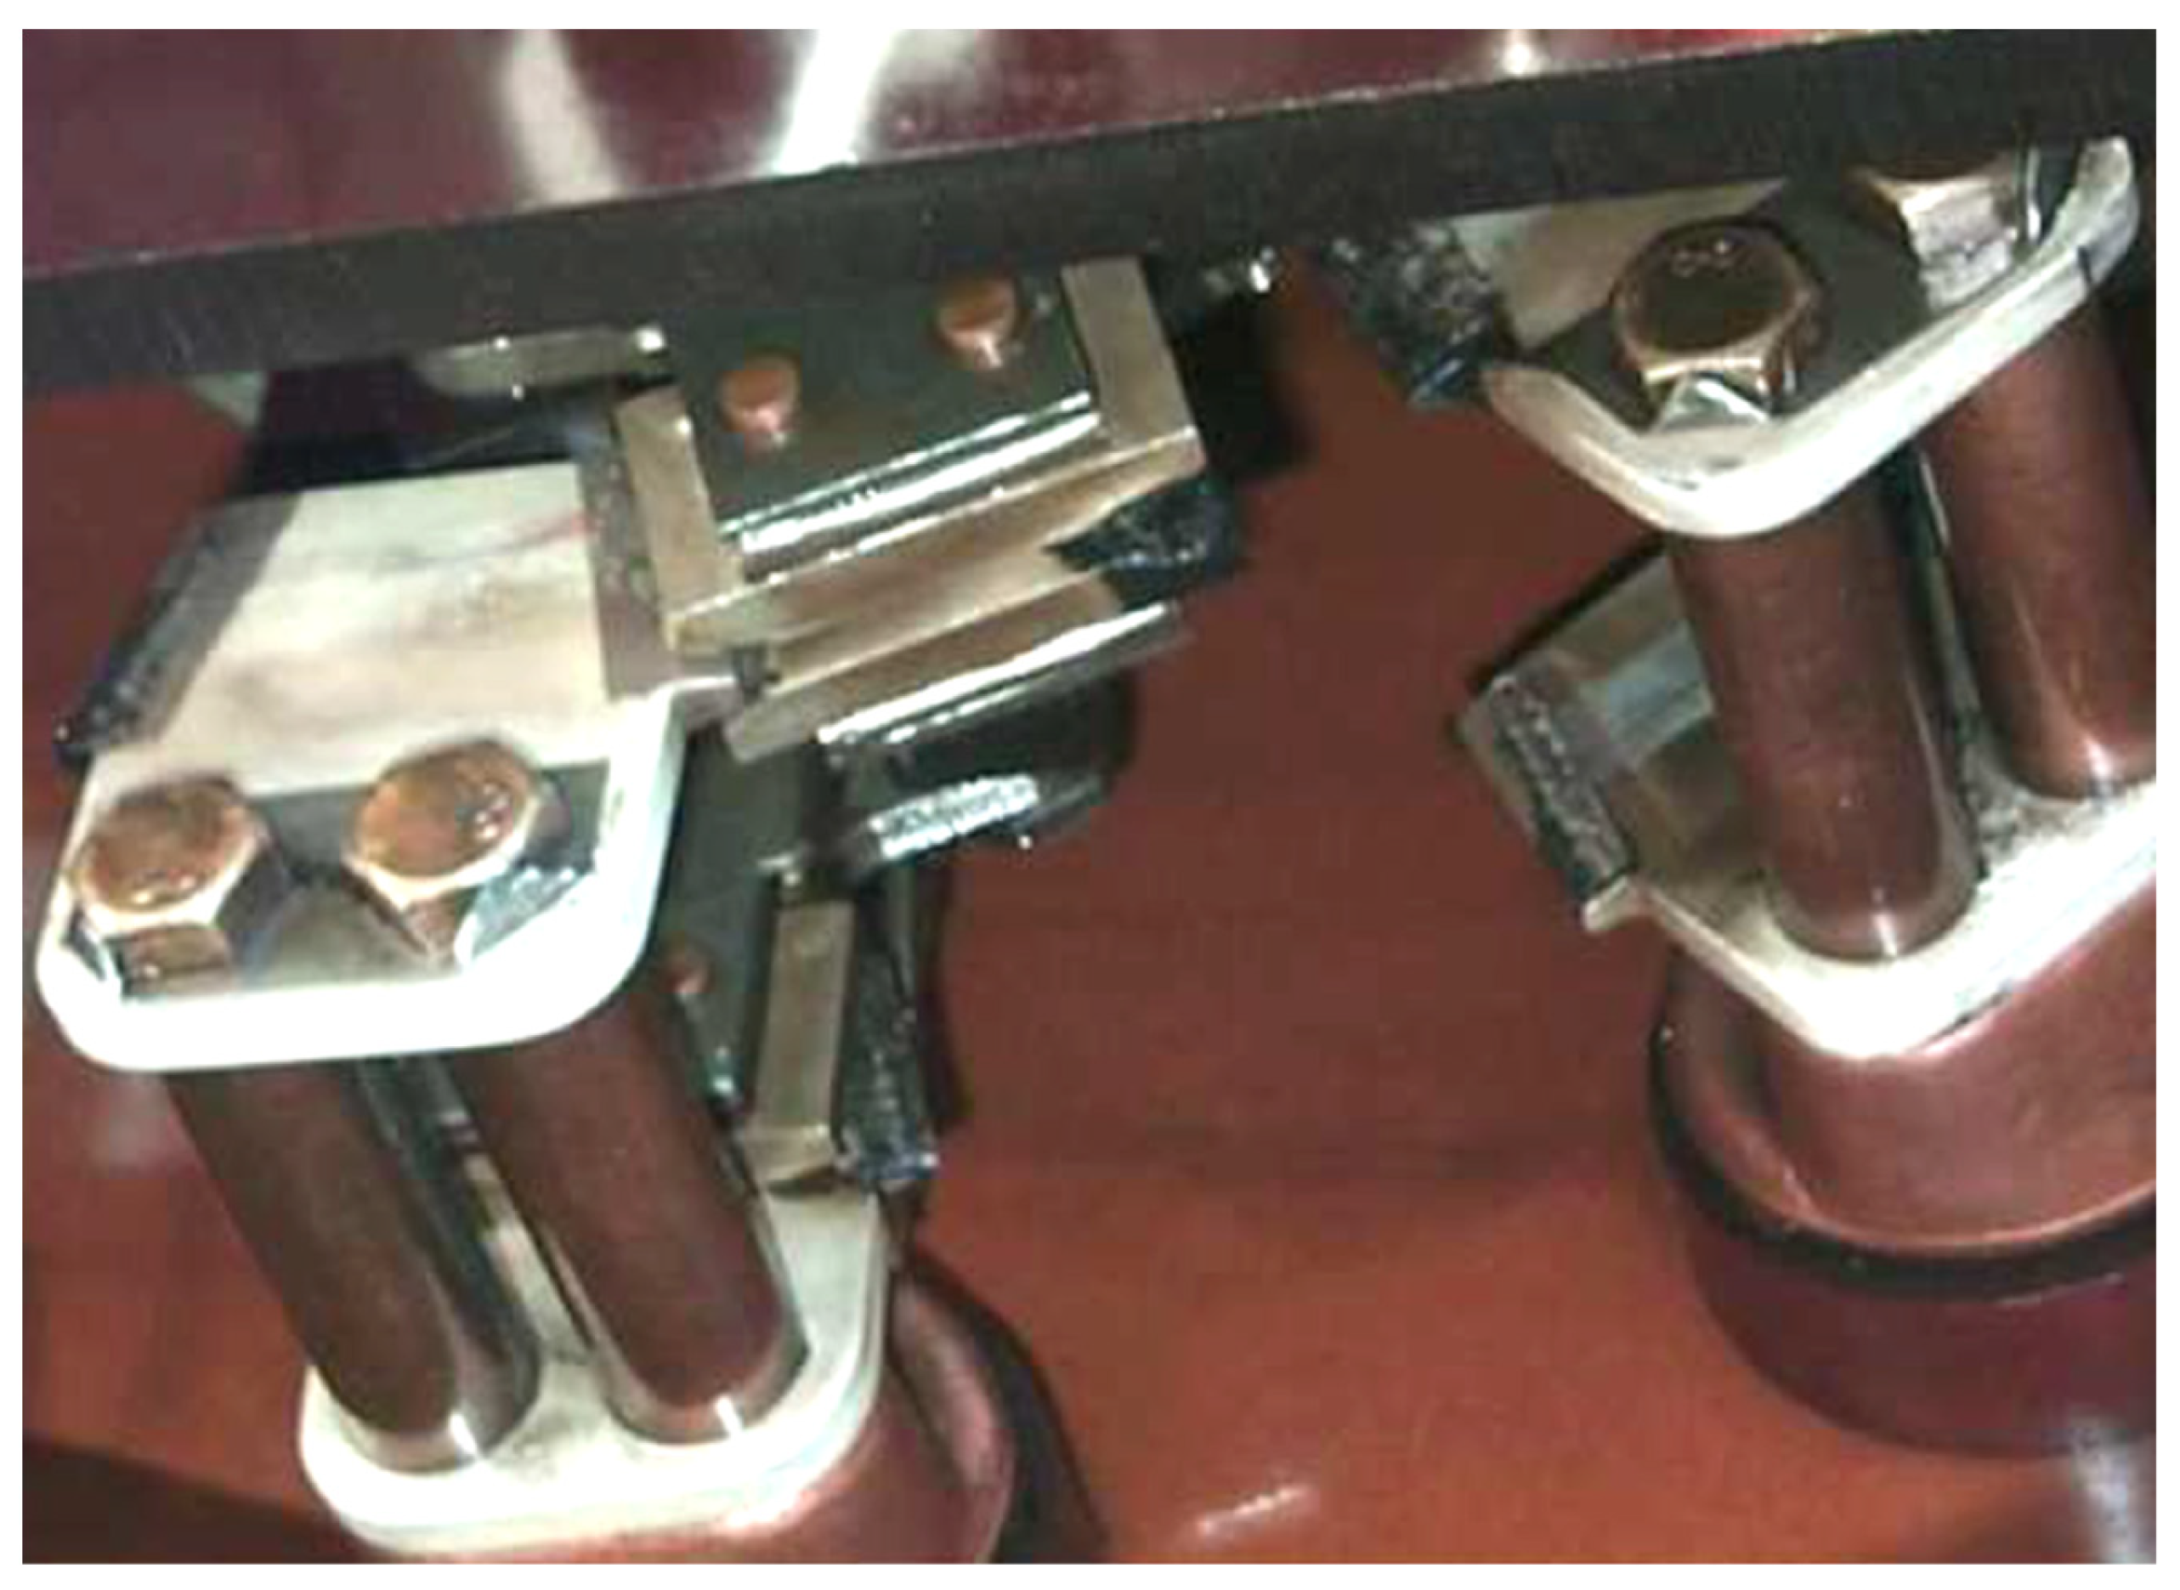
Figure 7.
Coked reversal contact [15].
Figure 7.
Coked reversal contact [15].
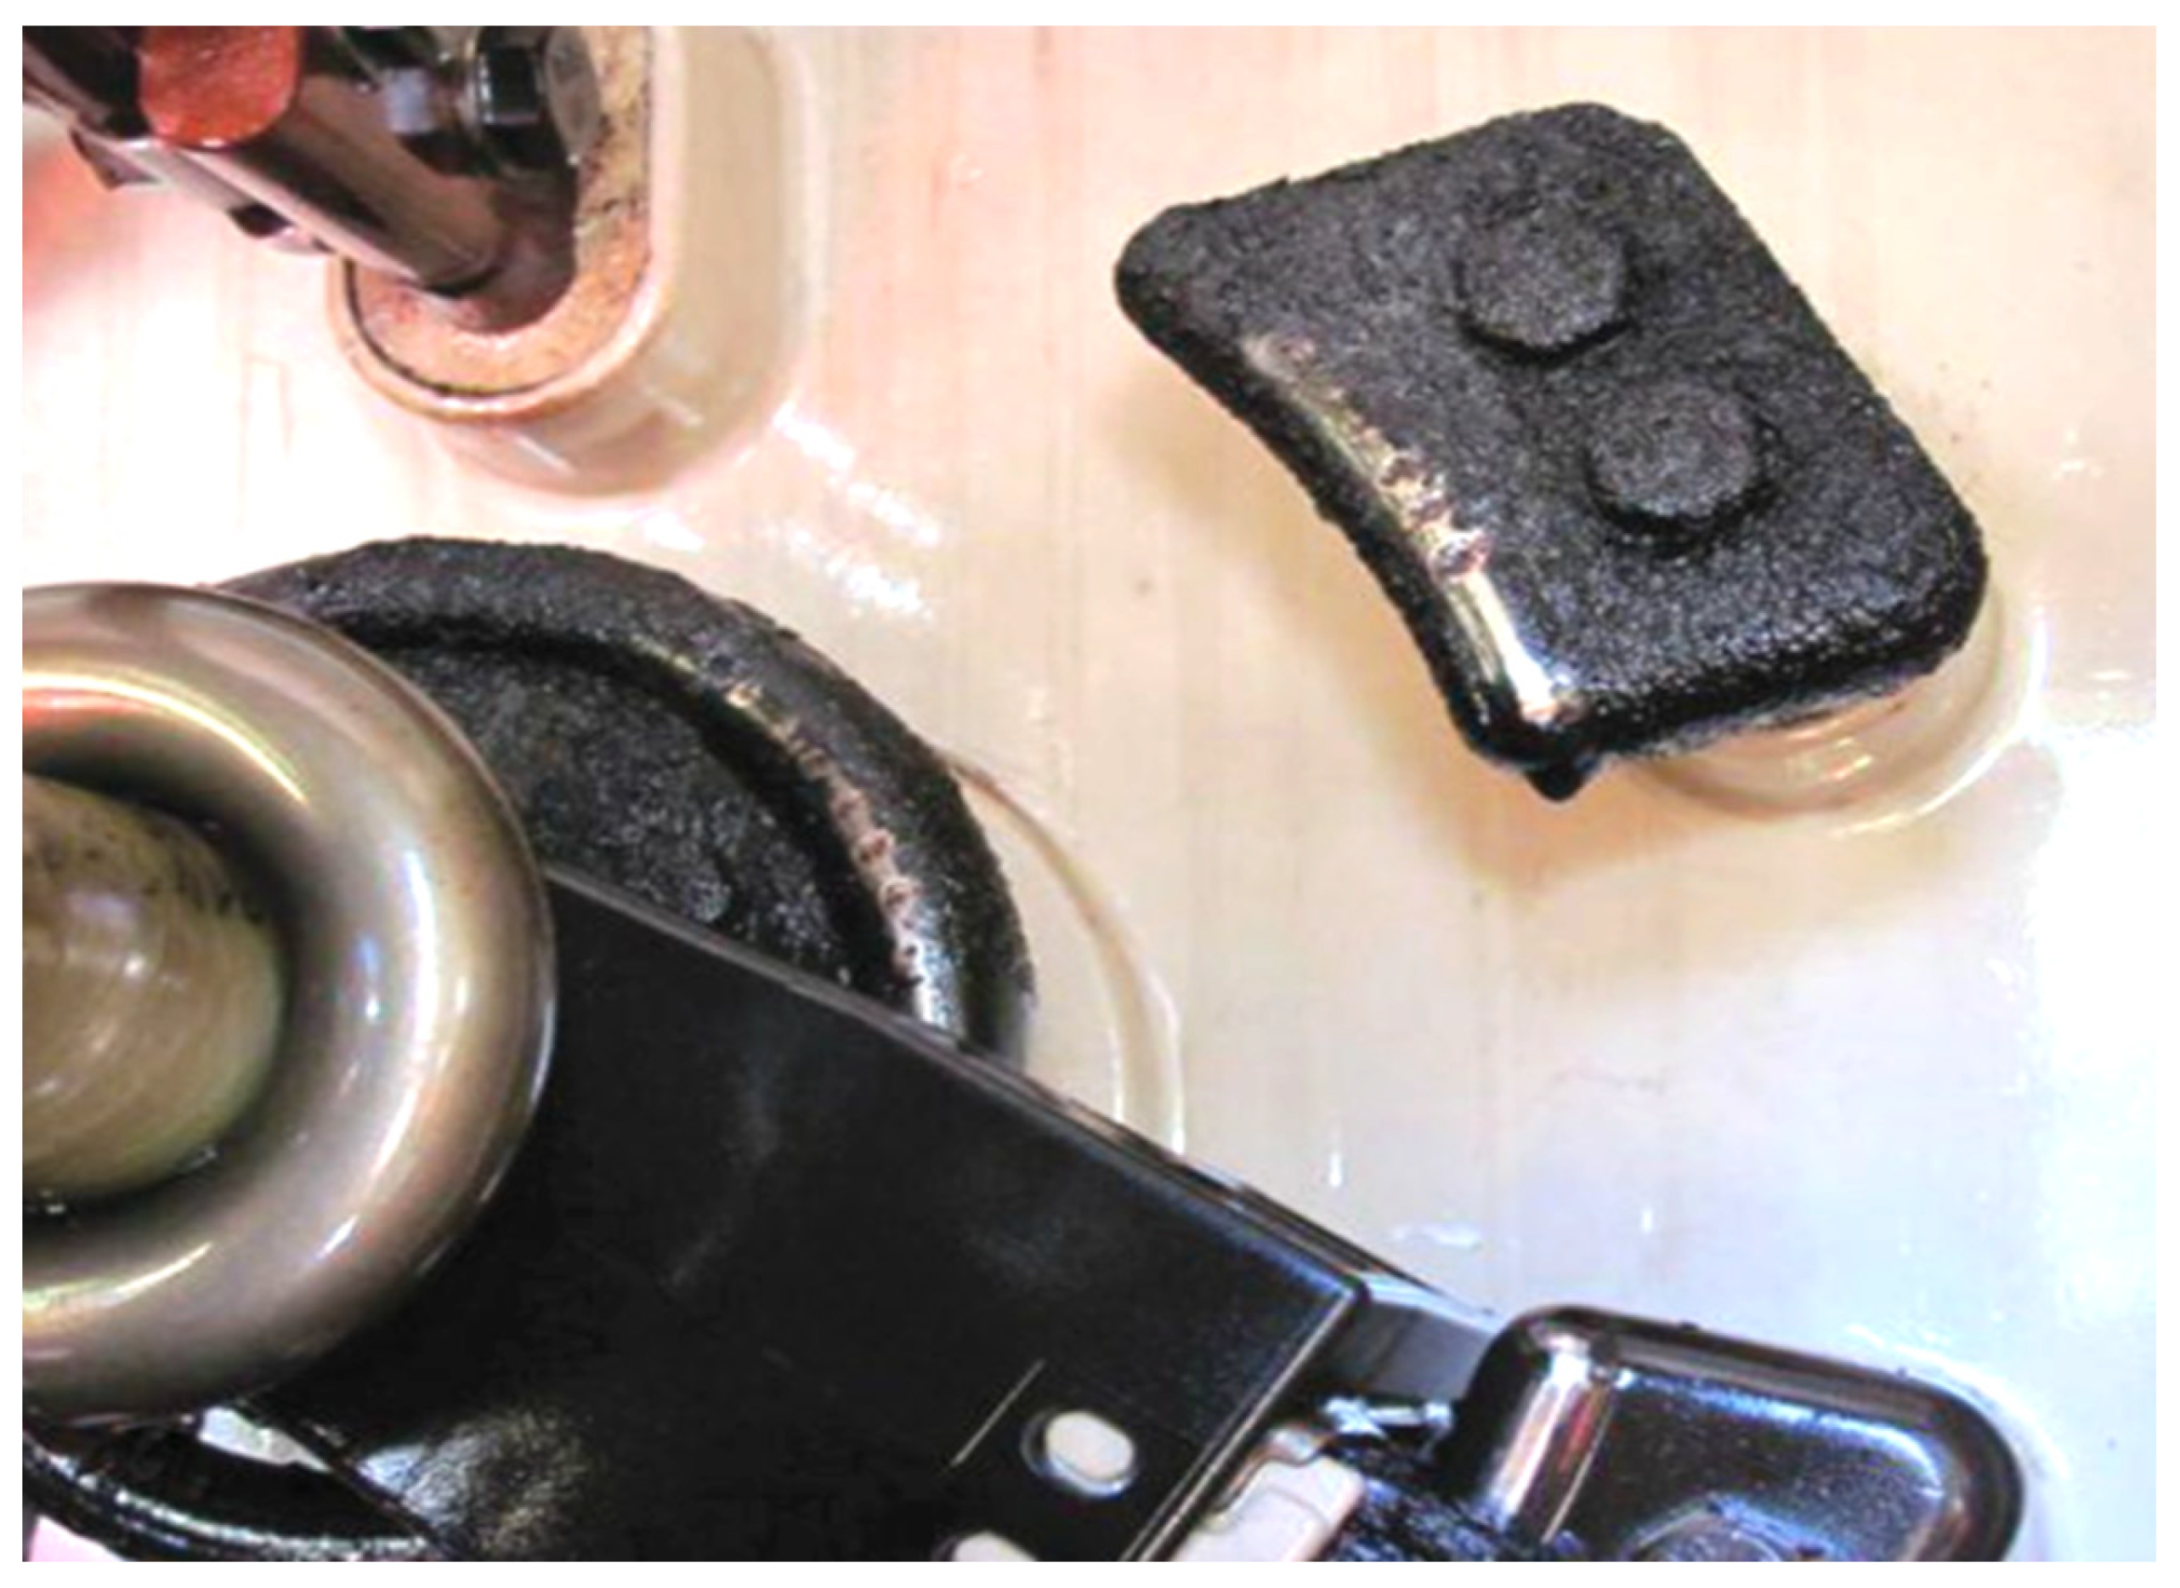
Figure 8.
Fixed contacts at tap 6 and tap 7 experiencing high arcing at the red phase [19].
Figure 8.
Fixed contacts at tap 6 and tap 7 experiencing high arcing at the red phase [19].

Figure 9.
Erosion marks at the OLTC’s main transition contact (M) and two other transition contacts (T1 and T2) for the red phase [19].
Figure 9.
Erosion marks at the OLTC’s main transition contact (M) and two other transition contacts (T1 and T2) for the red phase [19].
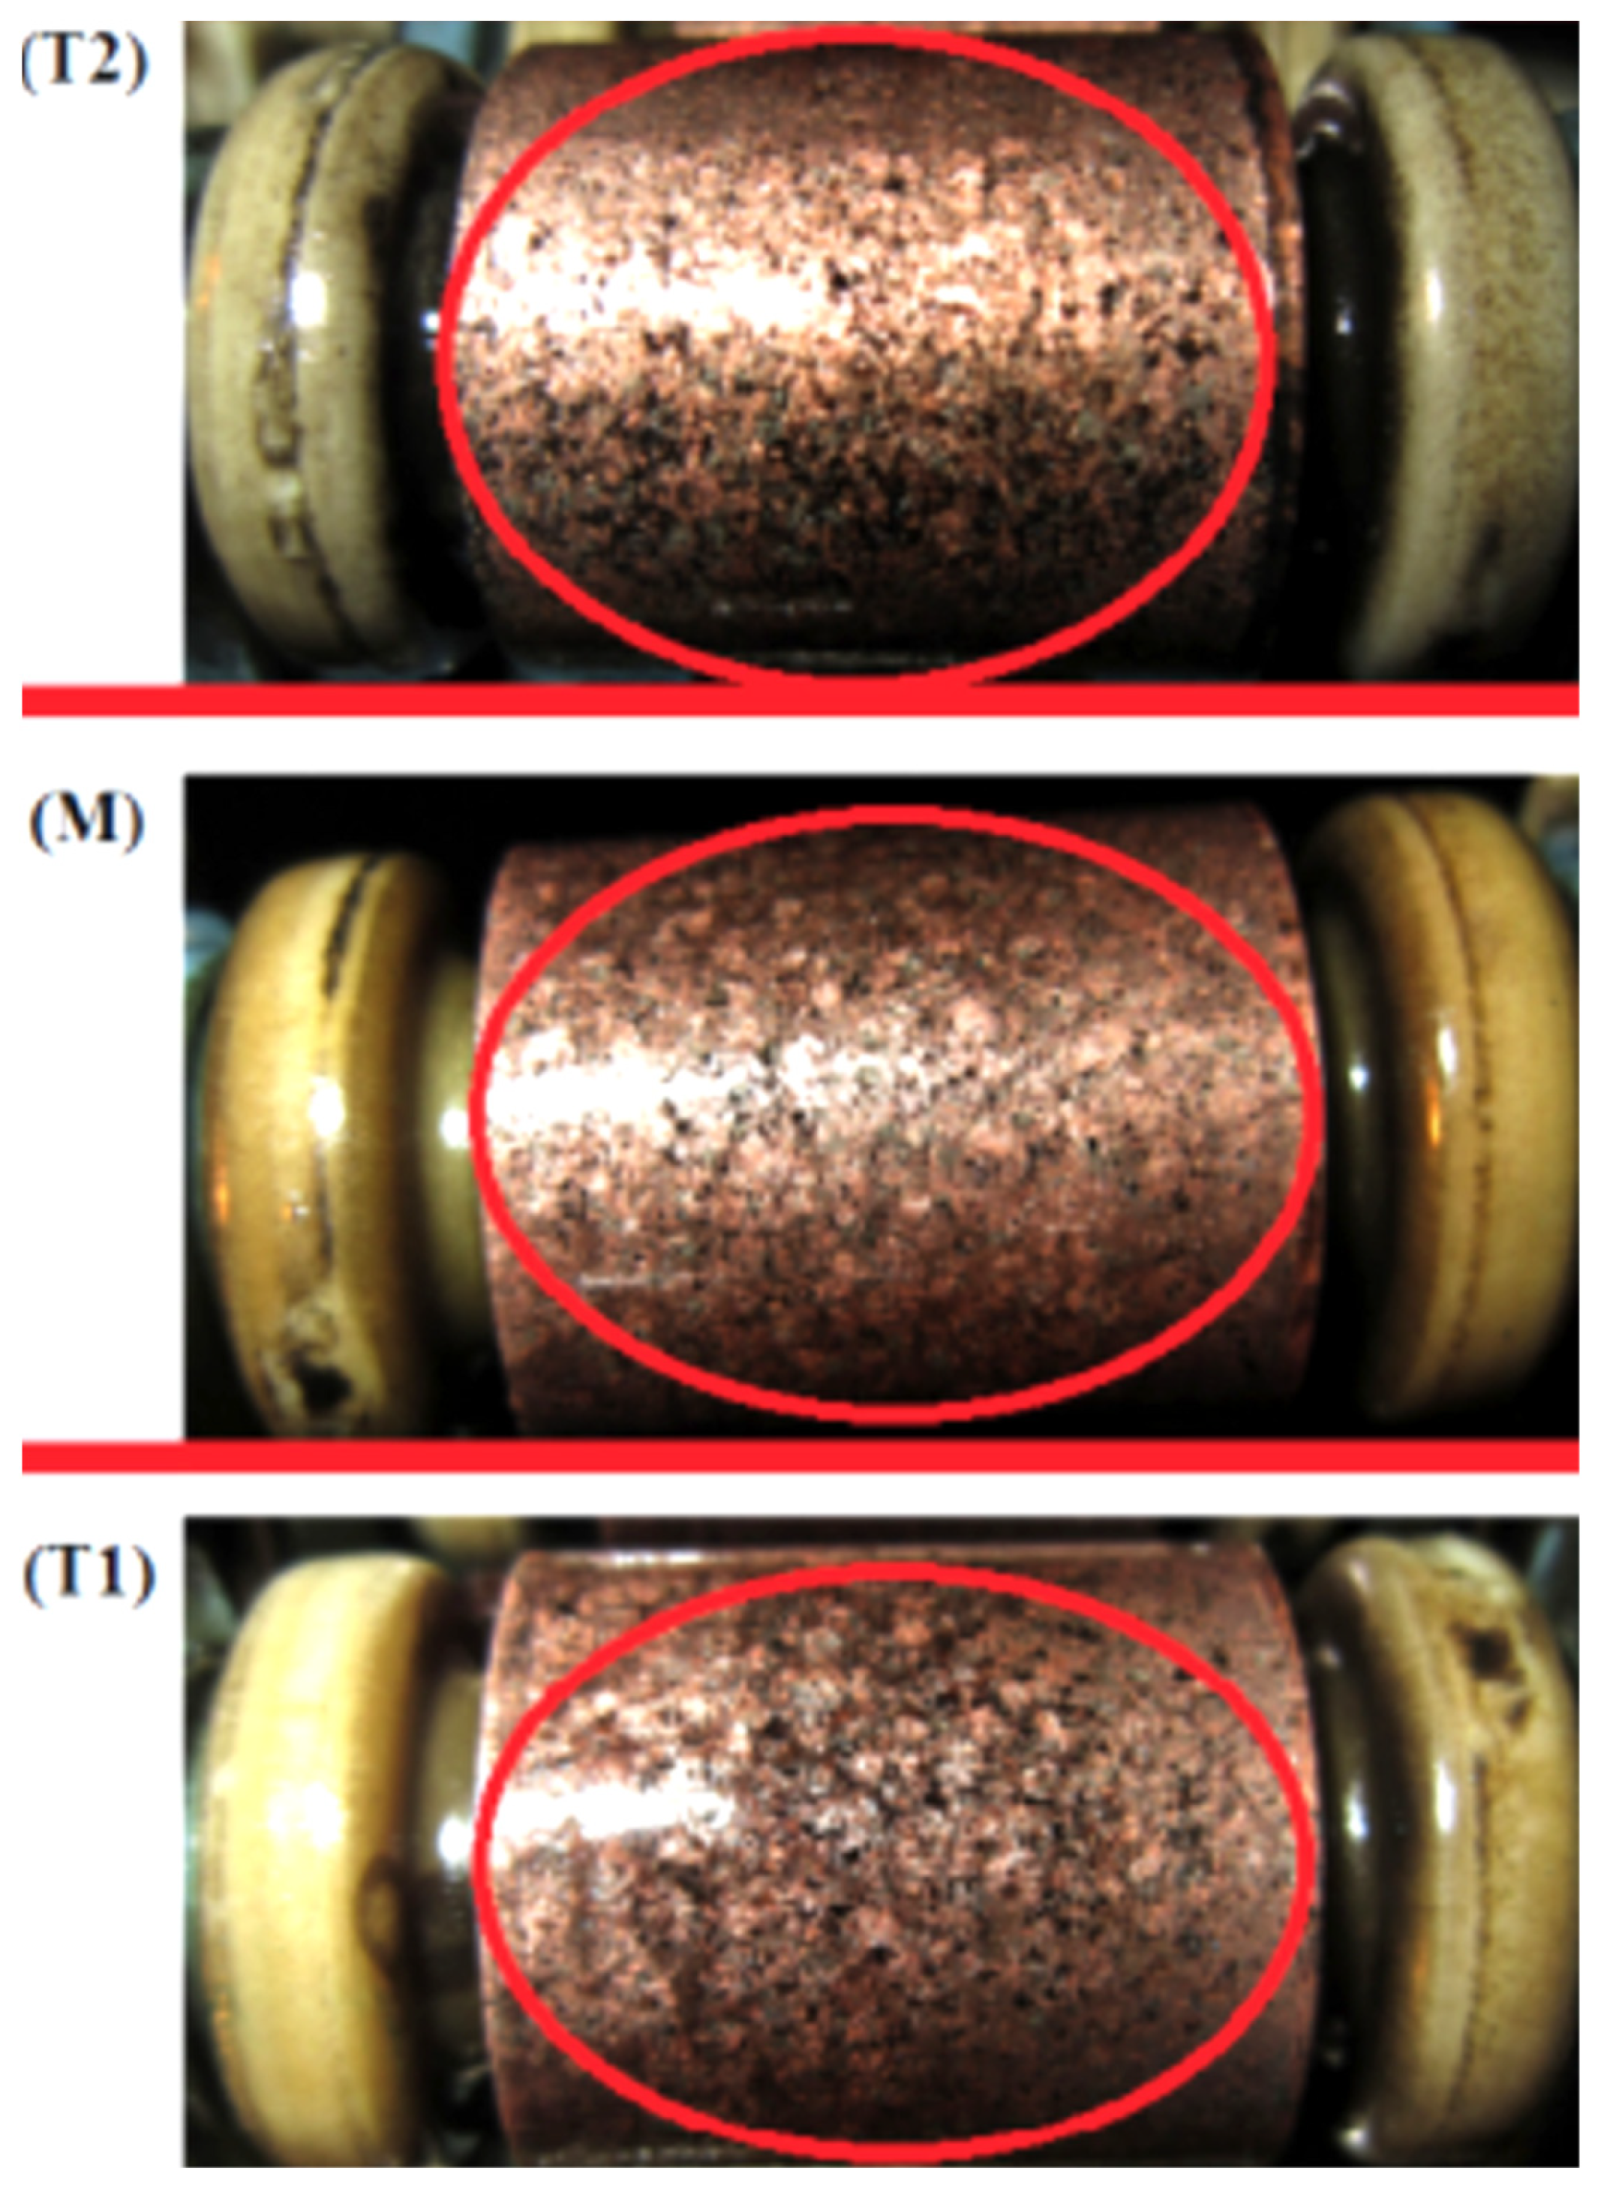
Figure 10.
On-load tap changer (OLTC) monitoring techniques.
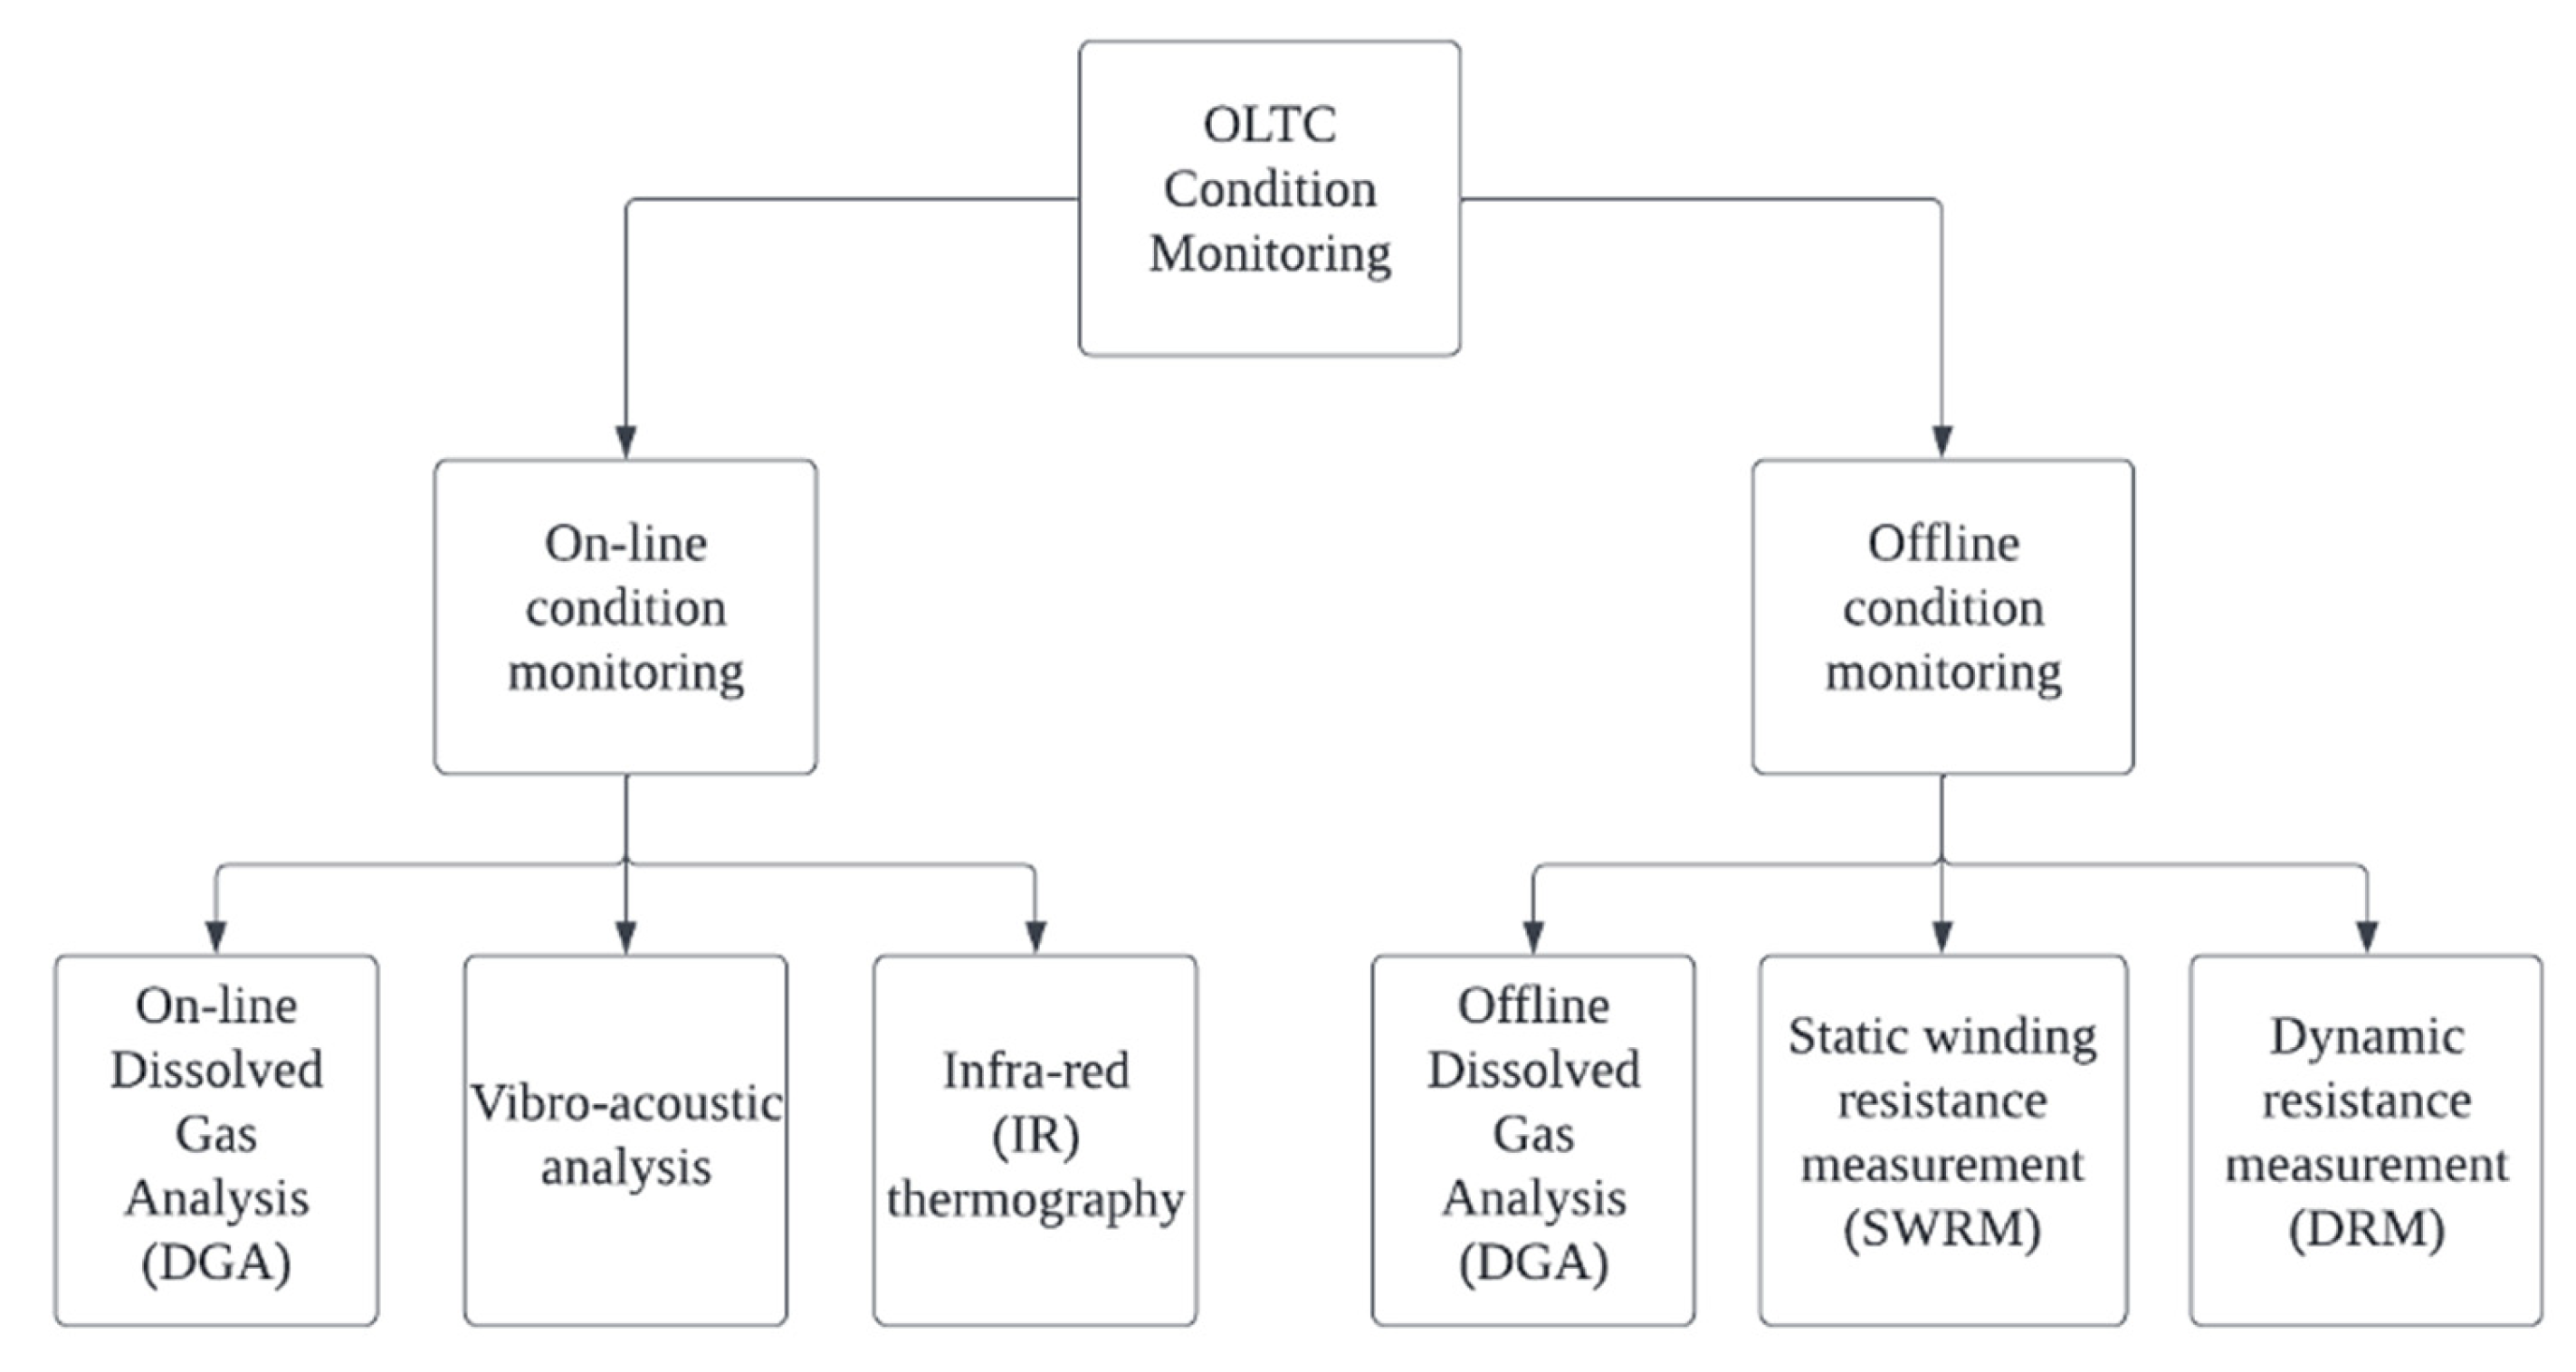
Figure 11.
Duval Triangle for the OLTC.

Figure 12.
A typical graph of a 21-tap OLTC with a reversing switch and selector switch winding resistance against the tap number result [47].
Figure 12.
A typical graph of a 21-tap OLTC with a reversing switch and selector switch winding resistance against the tap number result [47].
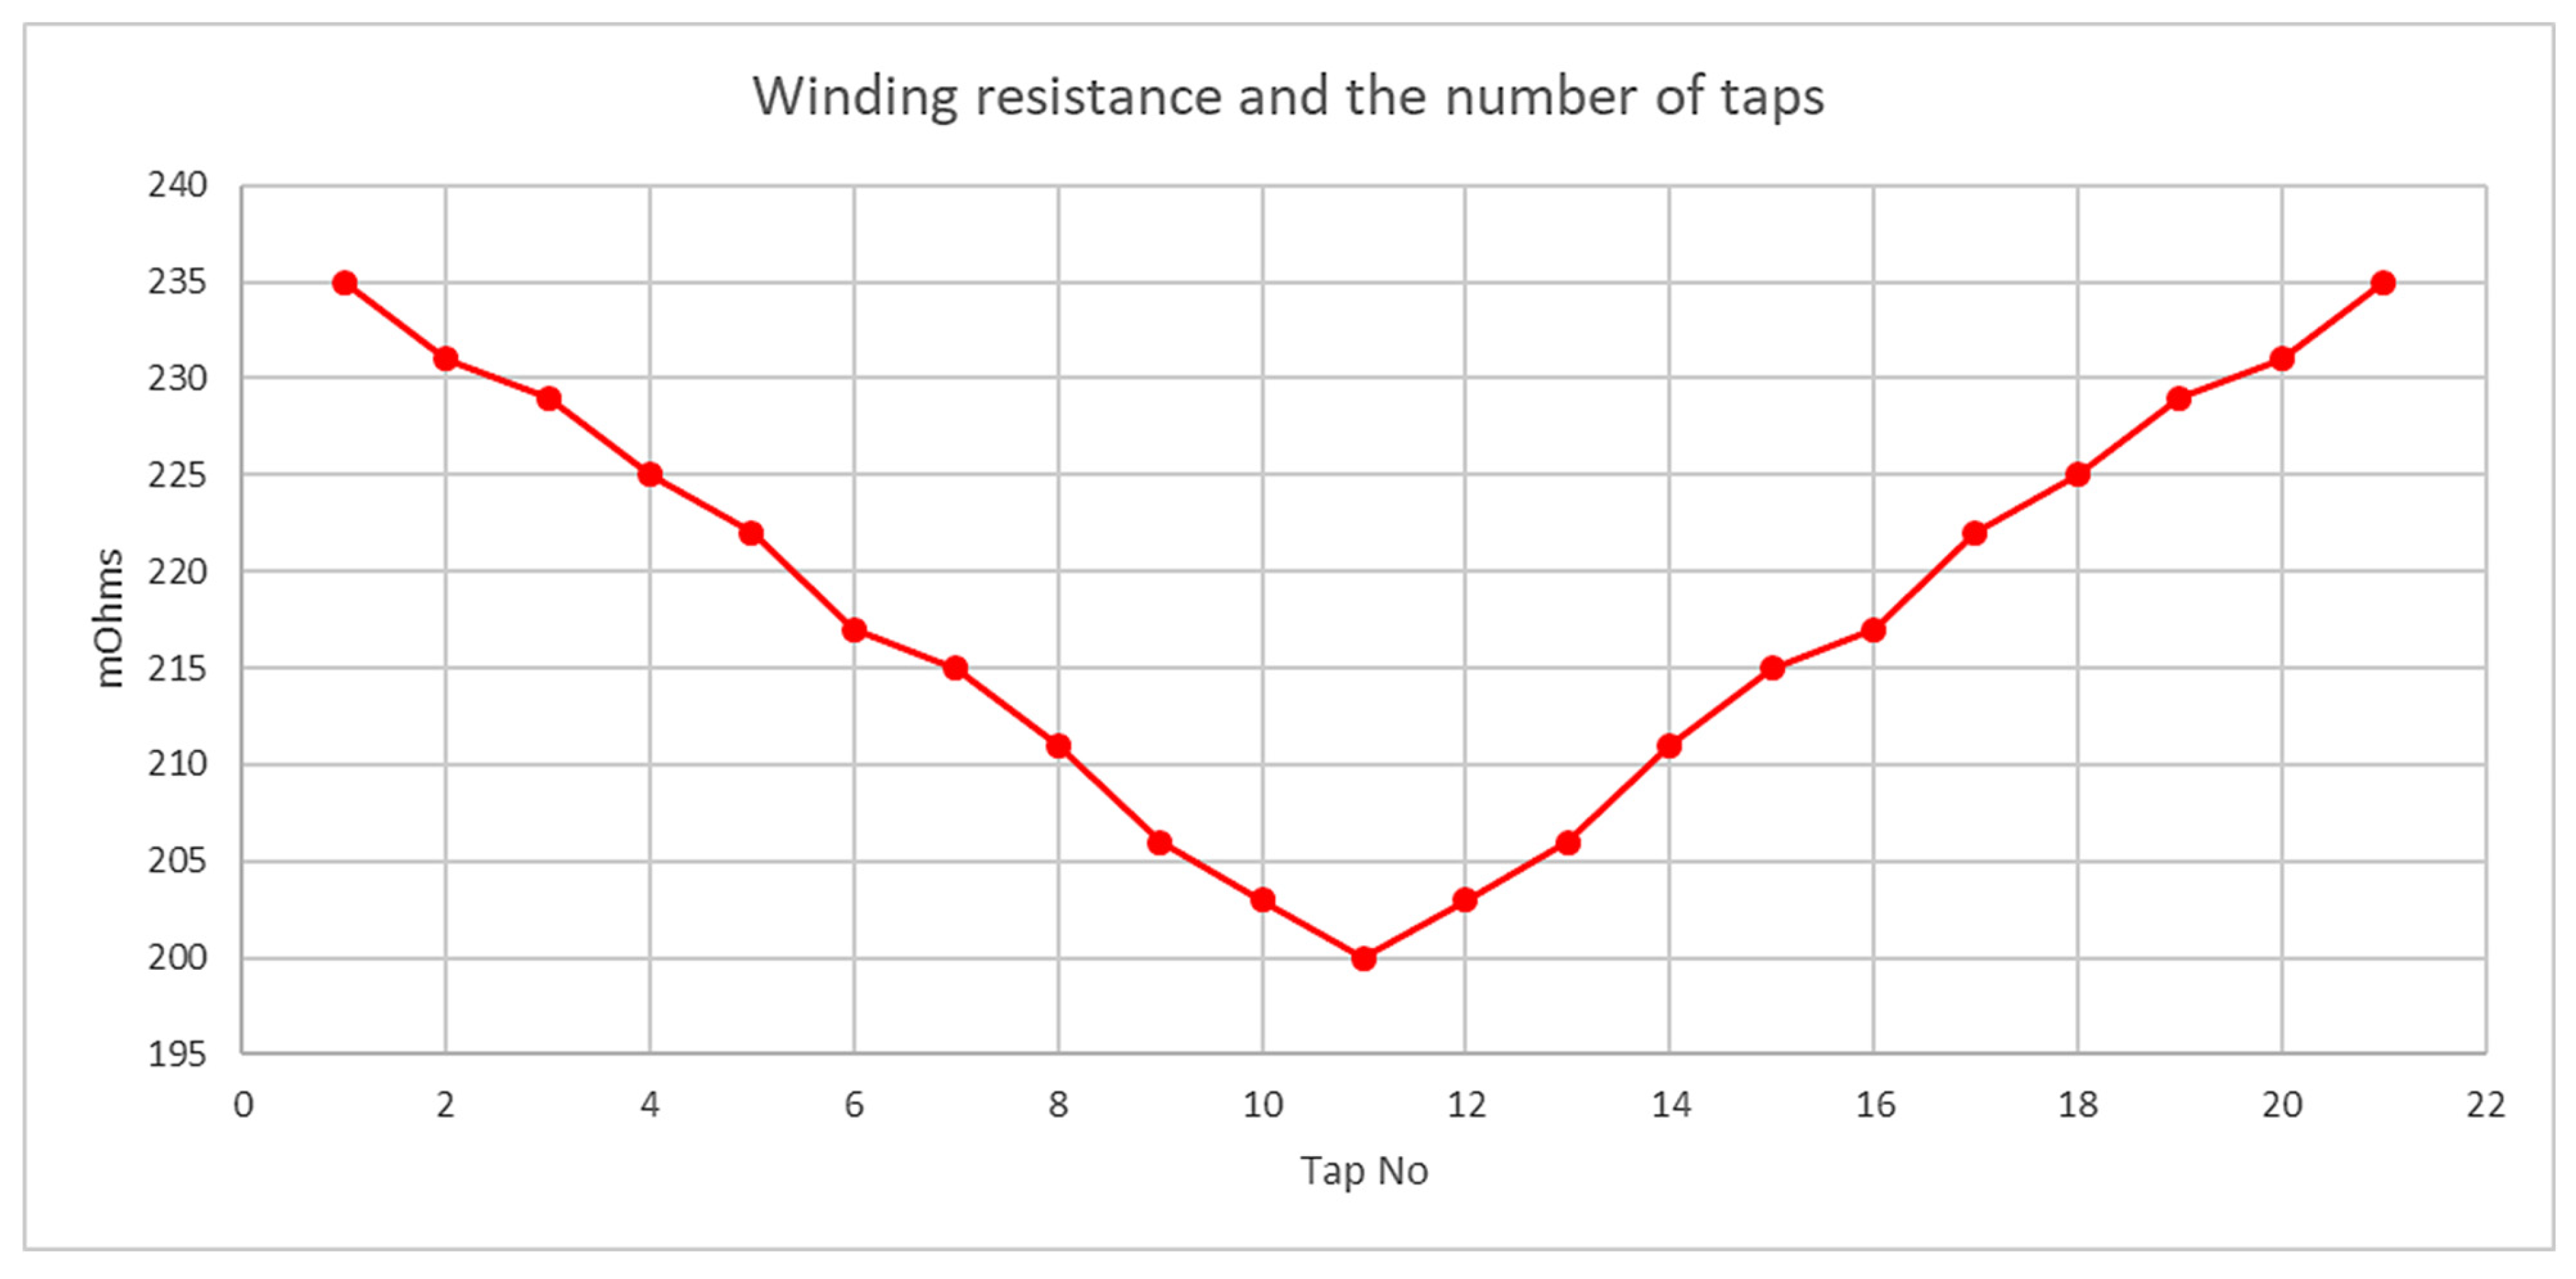
Figure 13.
Example of an abnormality of the Dvtest graph linearity [51].
Figure 13.
Example of an abnormality of the Dvtest graph linearity [51].
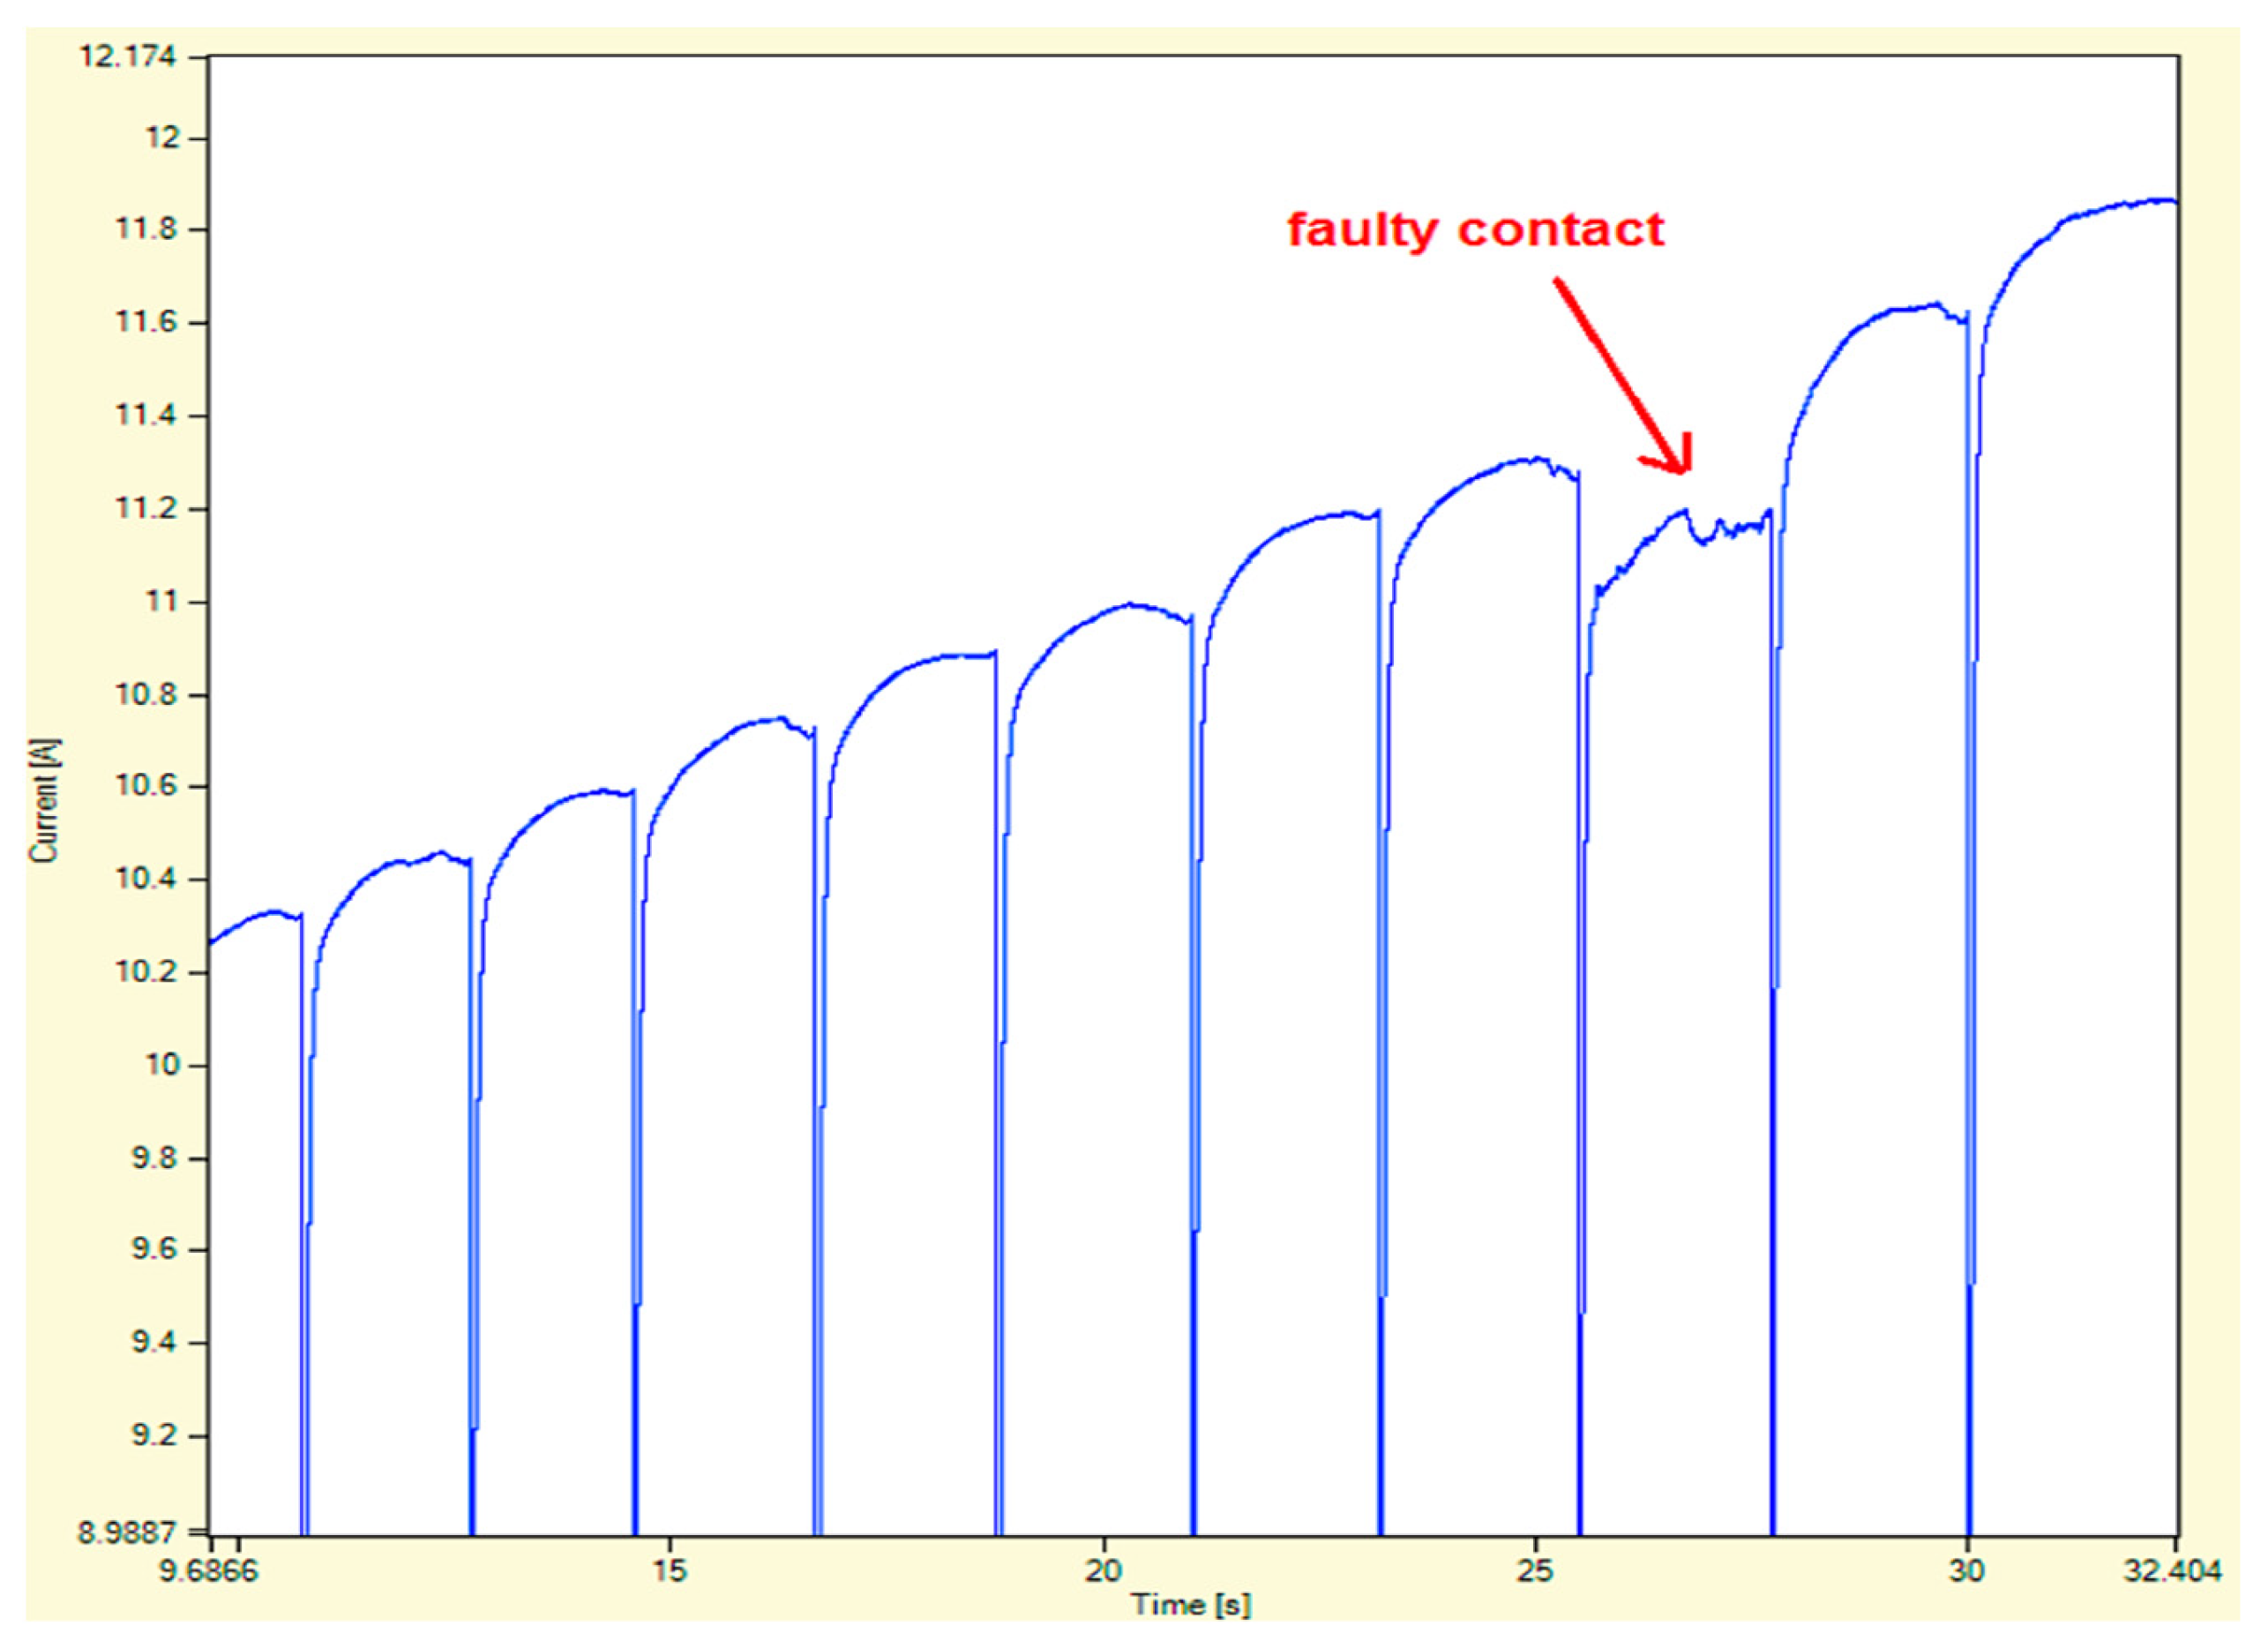
Figure 14.
A loose bolt on the selector contact at tap position 9 [51].
Figure 14.
A loose bolt on the selector contact at tap position 9 [51].

Figure 15.
Typical output from an online DGA monitoring system [52].
Figure 15.
Typical output from an online DGA monitoring system [52].
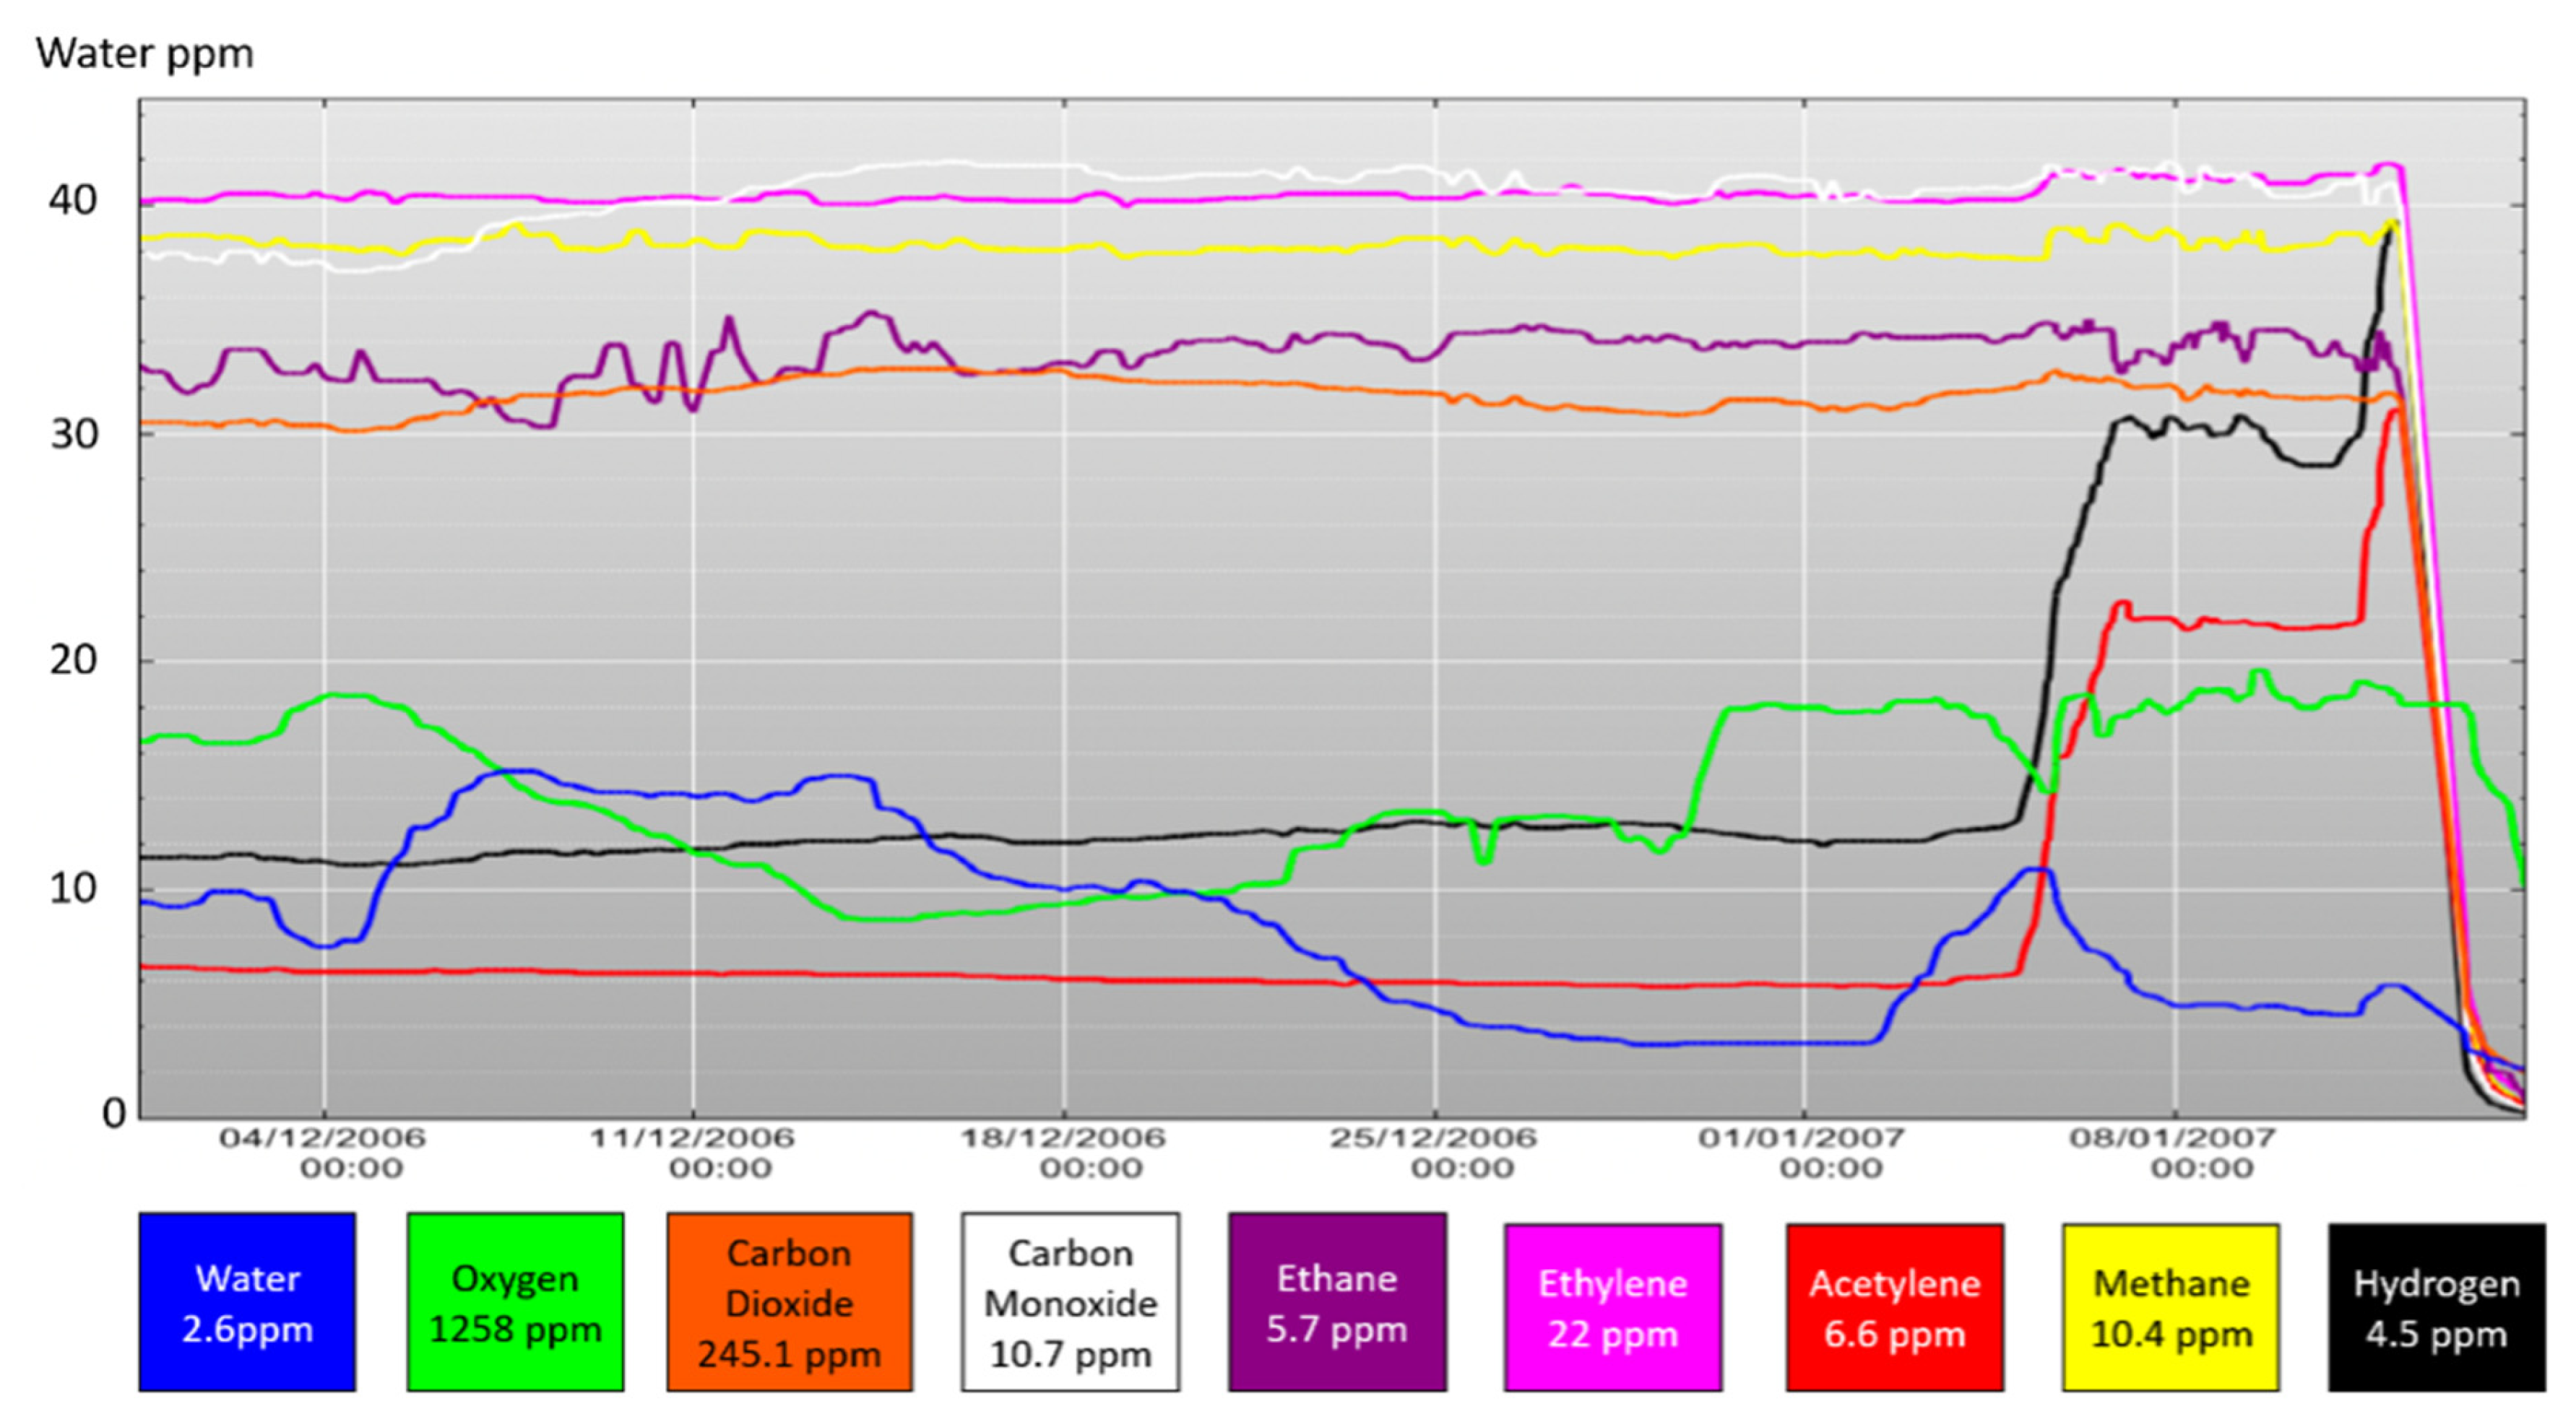
Table 1.
Type of oil faults and visual inspections of them [8].
Table 1.
Type of oil faults and visual inspections of them [8].
| Type of Incipient Fault | Visual Inspection |
|---|---|
| Partial discharge (PD) | Deposits of “X-wax” on paper insulation due to corona type or carbonized punctures in the paper caused by sparking, which could be challenging to detect. |
| Discharge of low energy (D1) | Carbonized punctures in the paper (pinholes), a trace of carbon particles in the oil, or surface of the paper is carbonized. |
| Discharges of high energy (D2) | Continuous destruction and severe carbonization of paper or metal fusion, severe carbonization in oil or tripping of the equipment indicate a large current follow-through. |
| Thermal fault, t < 300 °C (T1) | At below 300 °C, the insulation paper looks brownish. |
| Thermal fault, 300 °C < t < 700 °C (T2) | Between 300 °C and below 700 °C, insulation paper is carbonized. |
| Thermal fault, t > 700 °C (T3) | At above 700 °C, oil is severely carbonized, metal coloration (at 800 °C), or metal fusion (below 1000 °C). |
Table 2.
Oil fault-based gas composition [11].
Table 2.
Oil fault-based gas composition [11].
| Indication/Faults | Key Gasses | Other Traces of Gas |
|---|---|---|
| Cellulose ageing | CO, CO2, H2O | |
| Insulation oil decomposition | H2, CH4, C2H2, C2H4, C2H6 | |
| Leaks in gaskets, welds, etc. | CO2, O2, H2O | |
| Thermal faults-cellulose | H2, CO, CO2, CH4, O2 | |
| Thermal fault, t < 300 °C | H2, CH4, C2H6 | C2H4 |
| Thermal fault, 300 °C < t < 700 °C | H2, CH4, C2H4, C2H6 | C2H2 |
| Thermal fault, t > 700 °C | H2, CH4, C2H2, C2H4 | |
| Partial discharge | H2, CH4 | C2H2 |
| Arcing | H2, CH4, C2H2, C2H4 |
Table 3.
Common electrical faults in OLTCs [10].
Table 3.
Common electrical faults in OLTCs [10].
| Types of Electrical Fault | Root Cause | Consequences |
|---|---|---|
| Overheating | Electrical corrosion, wear, fatigue in spring mechanism, and mechanical failure of the rapid mechanism. | An increase of contact resistance which makes it hot and burned out. |
| Discharge faults | Presence of moisture content in the insulation oil due to leaky gaskets. A loose short circuit of the fastener will make the switch burn down or even explode. | The dielectric strength of insulation oil due to moisture becomes low, thus producing arcing and an increase in oil temperature [16]. The presence of silver sulphide also reduces the dielectric strength [17,18]. |
Table 5.
Summary of offline monitoring techniques.
| Diagnostic Methods | Application/ Purpose | Problems | Advantage | Disadvantage |
|---|---|---|---|---|
| Offline dissolved gas analysis (DGA) | Detects higher concentrations of gases in the tap changer compartment | Arcing, overheating/coking | Great method for detecting an incipient fault | Needs to de-energize the OLTC. Cannot detect the actual location of the fault. Requires additional diagnosis to determine it. |
| Static winding resistance measurement (SWRM) | Checks the windings as well as the internal connections | Contacts alignment, contact wear | Easy to interpret | Needs to de-energize the OLTC. Does not measure the switching process of the diverter switch. Requires DRM. |
| Dynamic resistance measurement (DRM) | Measure the fast switching process of the diverter switch | Timing/sequence, contact wear, transition | Supplementary diagnosis for static winding resistance. Easy to diagnose and can be applied to any type of tap changer. | Needs to de-energize the OLTC. |
Table 6.
Advantages and disadvantages of gas detection technologies [52].
Table 6.
Advantages and disadvantages of gas detection technologies [52].
| Technology | Advantage | Disadvantage |
|---|---|---|
| Gas chromatography (GC) | Wide range of fault gases Highest accuracy and repeatability | Time-consuming Expensive Frequent calibrations needed |
| Photo-acoustic spectroscopy (PAS) | Wide range of fault gases Low maintenance | Results are sensitive to the wave Accuracy is influenced by temperature, pressure, and vibration Limited ability to measure high gas concentrations |
| Solid-state (IC) | Operates under extreme temperatures, vibration, or in corrosive atmospheres | Limited ability to detect very low gas concentrations |
| Thermal conductivity detector (TCD) | Fast response Stable Wide measuring range Simple construction Robust | Sensitive to interfering gases Reaction due to heating wire Heating element reacts with gas |
| Non-dispersive infrared (NDIR) | Simultaneous multi-gas measurement No required calibrations Low maintenance Fast gas measurement time | Limited ability to detect very low gas concentrations Interfering gases can affect the accuracy |
| Non-dispersive infrared (NDIR) | Uses only physical technique Can be used in an inert atmosphere | Not all gases have IR absorption More user’s expertise required |
Table 7.
Summary of online condition monitoring techniques.
| Diagnostic Methods | Application/ Purpose | Problems | Advantage(s)/Disadvantage(s) |
|---|---|---|---|
| Online dissolved gas analysis (DGA) | Detects higher concentrations of gases in the tap changer compartment | Arcing, overheating/coking | Heart of online fault detection system High-cost, non-destructive diagnostic tool |
| Vibro-acoustic analysis | Detects mechanical problems and ageing of the drive mechanism | Linkage/gears, timing/sequence, contacts alignment, arcing, overheating/coking, contact wear, transition | Complex nature of the acoustic propagation pathways Limited distance Ageing factors deteriorate the sensor |
| Infrared (IR) thermography | Detects temperature in parts of transformer | Abnormal heating of degraded contacts (coking, low pressure) | Images are difficult to interpret and specific objects having erratic temperatures |
Publisher’s Note: MDPI stays neutral with regard to jurisdictional claims in published maps and institutional affiliations. |
© 2022 by the authors. Licensee MDPI, Basel, Switzerland. This article is an open access article distributed under the terms and conditions of the Creative Commons Attribution (CC BY) license (https://creativecommons.org/licenses/by/4.0/).
Share and Cite
MDPI and ACS Style
Ismail, F.B.; Mazwan, M.; Al-Faiz, H.; Marsadek, M.; Hasini, H.; Al-Bazi, A.; Yang Ghazali, Y.Z. An Offline and Online Approach to the OLTC Condition Monitoring: A Review. Energies 2022, 15, 6435. https://doi.org/10.3390/en15176435
AMA Style
Ismail FB, Mazwan M, Al-Faiz H, Marsadek M, Hasini H, Al-Bazi A, Yang Ghazali YZ. An Offline and Online Approach to the OLTC Condition Monitoring: A Review. Energies. 2022; 15(17):6435. https://doi.org/10.3390/en15176435
Chicago/Turabian StyleIsmail, Firas B., Maisarah Mazwan, Hussein Al-Faiz, Marayati Marsadek, Hasril Hasini, Ammar Al-Bazi, and Young Zaidey Yang Ghazali. 2022. "An Offline and Online Approach to the OLTC Condition Monitoring: A Review" Energies 15, no. 17: 6435. https://doi.org/10.3390/en15176435
Note that from the first issue of 2016, this journal uses article numbers instead of page numbers. See further details here.