
Review and Techno-Economic Analysis of Emerging Thermo-Mechanical Energy Storage Technologies

1
Vestas aircoil A/S, Smed Hansens Vej 13, 6940 Lem, Denmark
2
Department of Mechanical Engineering, Aarhus University, 8000 Aarhus, Denmark
*
Author to whom correspondence should be addressed.
†
These authors contributed equally to this work.
‡
Also associated with iCLIMATE Interdisciplinary Centre for Climate Change, Aarhus University, 8000 Aarhus, Denmark.
Energies 2022, 15(17), 6328; https://doi.org/10.3390/en15176328
Submission received: 10 August 2022
/
Revised: 24 August 2022
/
Accepted: 26 August 2022
/
Published: 30 August 2022
(This article belongs to the Topic Thermal Energy Transfer and Storage)
Abstract
:Thermo-mechanical energy storage can be a cost-effective solution to provide flexibility and balance highly renewable energy systems. Here, we present a concise review of emerging thermo-mechanical energy storage solutions focusing on their commercial development. Under a unified framework, we review technologies that have proven to work conceptually through project demonstration at a scale above 1 MW by describing the current state of commercial development, quantifying techno-economic parameters, outlining the challenges, and assessing each technology’s potential for commercial viability. The levelized cost of storage for thermo-mechanical energy storage at storage duration between 8 h and 1 week is cheaper than that of lithium-ion batteries and hydrogen storage; however, energy storage for such duration does not pay for itself at the current renewable penetration levels. For medium-term energy storage to be viable, at the realistic storage cost of 15 USD/kWh to 40 USD/kWh, the investment cost for power components should decrease to one-fifth of the current costs. Thermo-mechanical energy storage can be economically viable at the current investment costs in off-grid systems only when the marginal cost of alternative fuel exceeds 100 USD/MWh. We identified the cost ratio (charge power cost/discharge power cost) and the discharge efficiency as the critical technology-related performance parameters. Other external factors such as wind and solar fractions, demand, interconnections, sector coupling, and market structure play an important role in determining the economic feasibility of thermo-mechanical energy storage.
1. Introduction
The higher share of the generation from fluctuating renewable energy sources demands cost-effective strategies to provide flexibility to balance the supply and demand of electricity. Scheduling conventional power plants with good weather forecasting, managing flexible loads, and curtailing excess renewable energy can help handle the flexible variable renewable energy deployments; however, these strategies alone are insufficient. Increased interconnections, proper sector coupling, and a large amount of storage are required when the renewable penetration levels increase beyond today’s level. Earlier studies [1,2,3,4] show that cheap medium- to long-term energy storage is critical when the renewable penetration levels approach 100%.
Energy storage works by moving energy through time to maintain balance. It can offset peak load hours on the system using energy stored at low demand times and provide ancillary services to the electricity grid to ensure power quality, reliability, and stability. Based on the response characteristic, energy storage capacity, and storage cost, a particular storage technology may be well suited to one application or the other. Storage for <1 h is enough to provide ancillary services to the grid. Storage duration between seconds to a few hours provides service continuity when switching from one source of electricity to another. Technologies well suited for ancillary services are not suitable for long-term storage because of the high self-discharge and large capital expenditure [3].
Large grid-scale stationary batteries are considered an integral part of future electricity networks [5,6]. The cost, especially of lithium-ion batteries, has been significantly reduced in the past decade. The largest batteries in operation today have a range of no more than 100 MW/MWh. Batteries have a limited ability to decouple power and energy capacity costs. Because of the high energy storage costs, batteries are unlikely to provide bulk storage for more than a day, even if the storage cost is reduced to 150 $/kWh [7].
Pumped hydro storage is a reliable and proven bulk storage technology with high round-trip efficiency (>75%) and a discharge duration in the range of a few hours to days. According to the latest Global Energy Storage Database published by Sandia National Laboratories [8], pumped hydro storage represents 94.7% of all electrical storage technologies in operation today with a storage capacity of 181.9 GWh. The main drawback of pumped hydro storage is that the potential for expansion in the industrial world is low, as most convenient locations are already exploited [9].
Thermo-Mechanical Energy Storage (TMES) can be directly compared with pumped hydro storage because they have similar discharge characteristics and capacity (order of 100 s of MW). These technologies can cover both the 8 h to 18 h duration required for day-to-day smoothing of solar PV and the 3 day to 7 day duration required for smoothing wind power gaps caused by low wind periods. TMESs use mechanical energy to drive thermodynamic cycles and store electricity in the form of thermal energy. TMES concepts can be broadly divided into four categories based on operation principles, as shown in Figure 1.
- Thermal Energy Storage (TES) systems use excess power to increase the temperature of a storage medium and store heat, which can be converted back to power. Further classification is based on the storage mediums.
- Compressed Air Energy Storage (CEAS) systems compress air and store air at high pressures. The thermal energy of compression may or may not be utilized depending on the configuration of the CEAS system.
- Pumped Thermal Energy Storage (PTES) systems use electrical energy to power a heat pump during charging and store energy as the temperature difference between two heat reservoirs. Further classification is based on the thermodynamics cycles used during the process.
- Liquid Air Energy Storage (LAES) systems store potential energy in the form of low-pressure liquefied air. Further classification is made based on their interaction with energy sources.
The future role of bulk electricity storage is uncertain. Models with projected future costs show that lithium-ion batteries will be the most cost-efficient for storage applications for <8 h, and hydrogen storage will be the most cost-efficient technology for seasonal storage [11]. Lithium-ion batteries and hydrogen storage still require extensive research and development to meet the projected cost reduction to be commercially viable for bulk electricity storage. TMESs can provide an alternative to uncertain cost projection for lithium-ion batteries and hydrogen storage. TMES relies on well-established components. Thus, technological advancement and commercial deployment might be much faster than technologies dependent on new components and processes.
This work focuses on reviewing TMES technologies, emphasizing commercial applications. The current technical and economic parameters, commercial maturity levels, future research perspectives, and advantages/disadvantages of each technology are presented in a unified framework for the technologies already commercialized or proven to work through demonstration. We use electricity market data to show the gap between techno-economic state-of-the-art and profit generation potential in the current market. We critically analyze the revenue generation potential of TMES and quantify the power, energy storage investment costs, and the marginal cost of alternative electricity generation required for them to be market competitive. Finally, we identify the critical techno-economic parameters that can improve the performance of the TMES technologies.
2. Materials and Methods
We focus on the emerging technologies proven to work conceptually—at least through a few demonstration projects (at a scale of 1 MW or higher)—with the potential to be commercially viable soon. For each technology that passes our filtering criteria, the review of technologies is arranged to cover the following:
- Brief technological description: charging, storage, and discharging.
- The history of the technology: Includes origin of the idea and any successful demonstration afterward.
- Description of relevant research that widens the understanding of the technology.
- Detail of commercial facilities built up to date: If the technology is relatively mature, a description of the largest projects is provided. Projects planned on the near horizon are mentioned.
- Quantitative description of efficiency, storage characteristics, and capacities.
- Research and development perspectives.
- Advantages and disadvantages.
2.1. Collection of Techno-Economic Data and Uncertainty
Cost and performance data for TES, PTES, and adiabatic CAES were originally collected/estimated based on data from trusted international sources and correspondences with companies working on the concepts and further verified with the published literature. Since different data sources provide cost values based on various assumptions, the reported data are adjusted uniformly. Cost and most of the performance data for pumped hydro, lithium-ion batteries, and hydrogen storage were obtained directly from [11], as they were collected using industry-validated sources. Cost and technological data for LAES were estimated based on a recent review paper [12], the data published by the only manufacturer of LAES technology, High-view Power, and other relevant research papers. While reporting cost and performance, we avoided relying on data from a single source, emphasized recent data (not older than 2015), and avoided obtaining data even from recent publications if the original sources were older.
The estimated investment costs are only valid for systems with discharge ratings >1 MW. Operation and Maintenance (O&M) cost is considered fixed per MWh stored energy and MW rated power per year. Cost data are expressed as USD/kW (discharged electricity) or USD/kWh (storage), fixed prices, excluding Value Added Tax and other taxes. The investment cost includes the costs associated with purchasing equipment, installation, and balance of plant but does not include the owners’ pre-development costs and interest accrued during construction. Factors such as rent of land, tax-related expenses, decommissioning costs, etc., are not included either. The cost of conventional power generation units tends to differ in the USA, Europe, and other places, but this factor is not accounted for in the assumptions. Most of the original data were obtained from European sources; the conversion factor of USD 1 = EUR 0.82 expressed cost uniformly in USD terms. Additional costs such as the costs of grid expansion are not included in the presented data.
The investment cost—power—in the literature is often reported as power cost per discharged electrical unit, where the capacity of the charging component is related to the reported round-trip efficiencies. The investment cost—power—mentioned in this paper uses the same definition. It is, however, desirable to break out charging and discharging power costs for TMES because charging and discharging components can be independently sized for either slow or fast charging. We define the cost ratio as shown in Equation (1) to decompose investment cost into charging and discharging investment power costs. The charging investment cost is the cost of extending the electrical charging capacity by 1 kW grid energy. The discharge investment cost is the cost of extending discharged electricity by 1 kW.
The technical lifetime is the expected time when the technology is operated close to its original performance when the expected regular operation and maintenance is performed. The cost of such regular operations and maintenance is included in the O&M specification.
2.1.1. Efficiency
The efficiencies described in the paper are energy efficiencies. Round-trip efficiencies are expressed in terms of electric-to-electric efficiencies and are defined by Equations (2)–(4).
Most TMESs operate in cycles; separating charging and discharging efficiency is not straightforward. Still, expressing efficiencies in terms of charging and discharging efficiencies is useful for modeling future capacity expansion and grid dispatch optimization models. We defined charging efficiency as the ratio of thermal and mechanical energy available for further work for the given amount of net electrical work input. If the charging cycle uses stored thermo-mechanical energy from the discharge cycle, this input is considered free energy. The discharge efficiency is the ratio of the net electrical energy produced and the available thermo-mechanical energy stored during the charge cycle. We defined an efficiency ratio (), as shown in (5), in order to show the impact of charge and discharge efficiencies.
2.1.2. Uncertainty
Local conditions widely determine the cost of renewable energy technologies. It is impossible to predict the generalized cost for all locations. For emerging technologies, the uncertainty is even higher because the path of technological advancement is difficult to predict. TMES use components that are already available on an industrial scale. For example, the cost of power equipment such as turbines, compressors, and steam generators is not likely to change much because of the benefits of economy of scale and automated production.
Despite the methodological consistency of data collection, we expect the cost and performance predictions for the emerging technologies to be highly uncertain. Therefore, we conducted most of the analysis on this paper not based on the analysis of technologies on predicted cost but rather tried to answer at what realistic and achievable cost and performance parameters the particular technology will have relevance. We compared each technology with each other and with lithium-ion battery and hydrogen storage using the levelized cost of storage (LCOS) and by conducting energy system simulations. The details of those studies are included in Section 5.
3. Description of Technologies
3.1. Thermal Energy Storage (TES)
Thermal energy can be stored in the form of sensible, latent, and thermo-chemical heat. Although the concept of using latent heat for temperatures above 500 °C is discussed in the literature [13,14], these kinds of technologies are in the conceptual phase. Thermo-chemical heat storage technologies are not developed enough for the high-temperature thermal storage required for storing heat to produce electricity [15]. Sensible heat storage is the simplest and only mature technology to store heat at the high temperatures required for bulk electricity storage.
Sensible heat storage systems store heat by increasing the single-phase storage medium’s temperature. The stored high-temperature heat is converted to electricity by using different cycles such as the Rankine, Brayton, and Air-Brayton cycles. The overall efficiency of the discharge cycle can be improved by the co-generation of heat.
Molten salts, oil, ceramics, and rocks are used as the typical storage medium, but other storage materials can be used as well [16] for using desert sand as high-temperature thermal storage material. Figure 2 shows a general outline of the high-temperature sensible heat storage system. The charging configuration may be different depending on the charging method. Based on the screening of the technologies that fit the selection criteria described in Section 2, high-temperature sensible heat storage based on liquid (molten salts) and solids (rocks) that operate with the Rankine cycle is discussed further.
3.1.1. Liquid-Molten Salt-Based Systems
Molten salts have unique thermo-physical properties that make them an ideal storage medium. They have a high boiling point, low vapor pressure, low viscosity, and high specific heat capacity. By changing the chemical composition of salts, the thermophysical properties of the salt can be adjusted.
Two distinct configurations for molten salt storage exist. The two-tank system uses molten salts as heat transfer fluid and storage medium by storing cold and hot salts in two separate tanks. The thermocline system uses a single storage tank where hot and cold salt is separated naturally by a temperature gradient. The dual tank configuration (about 30% more costly than the single tank) is exclusively used for modern large-scale CSP plants with a power rating above 10 MW because they can constantly supply high-temperature heat and have lower storage loss compared to single-tank systems [17].
During charging, electric power is converted into heat using electrical heaters. If high-grade heat is available, such as from a concentrated solar, gas burner, or nuclear reactor, the high-grade is used directly to charge the system. The heat from the molten salt storage is used to discharge energy, typically in steam-based Rankine cycles.
The use of molten salts dates back to 1960, when they were used as thermally stable fuel to develop a new generation of nuclear reactors [18]. The first use of molten salt as a heat storage medium started only in the early 1990s as a heat storage medium for a CSP plant on the Mojave desert in California [19]. The success of the 10 MW pilot power plant on the Mojave desert helped the commercial development of molten salts as a storage medium for CSP, making it the most widespread storage material in CSP applications today.
More than 95% of global thermal energy storage operation in CSP plants is based on molten salt technology. It is estimated to have a total storage capacity of 21 GWh at the end of 2019 [20,21]. Molten salt storage is a matured technology for CSP application marketed by several multi-national companies, including MOSAS from MAN, eTES from Flagsol, Pintailpower, Yara international, Aalborg CSP, and Alpha Laval.
The standard CSP technology uses solar towers to heat the molten salt and store the hot salt in pressurized flat bottom tanks at a temperature of 565 °C. Cold storage is maintained at a temperature of 270 °C. The discharge cycle uses the layout of a typical steam-based power plant. For example, the Gemasolar plant in Spain, built-in 2011, uses three pressure level steam turbines to generate 20 MW of power. Ouarzazate Solar Power Station in Morocco is the largest CSP plant globally, with a power capacity of 510 MW [22]. The DEWA project in Dubai, expected to be completed in a few years, will dethrone the Ouarzazate for the title of the largest CSP plant with a power capacity of 700 MW [23].
Although molten salt storage is mainly associated with CSP, it can be used in areas with abundant wind resources by replacing solar fields and towers with electrical heaters. In a typical CSP application, the investment cost and space required for installing a solar field are substantial; in comparison, electric heaters are significantly cheaper. Electric heaters provide greater flexibility of using excess electricity by scaling up the charging power and storing a relatively large amount of energy in a short duration. However, the Rankine-based discharge cycle is relatively costly.
3.1.2. Solid-Rocks-Based Systems
Rocks are thermally and chemically stable in a wide temperature range. They are non-toxic and non-flammable, and they have good thermal properties: high specific heat, good thermal conductivity, low thermal expansion coefficient, and high mechanical resistance to thermal cycling. Some types of rocks can efficiently be heated up to 1000 °C and transfer heat effectively with air. These properties make solid rocks an excellent storage medium for high-temperature energy storage. It is worth mentioning that concrete also offers low cost, stable thermal properties, and simple industrial production. The use of concrete for temperatures <400 °C is well-documented [24,25,26]. The use of concrete for temperatures >500 °C, generally required for good thermal-electrical efficiencies, is not commercially developed yet.
During charging, electric power is converted into heat either using electrical heaters or a heat pump. Air is used as the heat transfer fluid to transfer heat to the rock bed, recover heat, and produce steam in a heat recovery steam generator that discharges the system and produces electricity and possibly heat for district heating.
Zurich Utility built the first known high-temperature rock bed storage in Switzerland in 1984. This 5 MW solar plant was used as a reference system to study the potential of such systems theoretically and experimentally in 1991 [27]. At that time, the pressure drop across the rock bed was a serious problem. Many theoretical and demonstration studies [28,29,30,31,32] contributed vastly to understanding and designing effective rock storage for commercialization of the technology.
Siemens Gamesa started model development of electric thermal energy storage with rocks in 2002. In 2004, the first test site with 5 MWh capacity was built. Under the support of the Federal German Ministry of Economic Affairs and Energy, a real-scale pilot demonstration plant was commissioned in 2019. The pilot plant located in Hamburg, Germany, uses over 1000 tons of rock and has a thermal storage capacity of 130 MWh. Based on these demonstrations and research projects, Siemens Gamesa has commercialized the technology as scalable and modular units at different capacities.
In Denmark, the HT-TES (High-Temperature Thermal Energy Storage) demonstration project (2016–2019) analyzed the potential of using various types of rocks under cyclic thermal loading. The project found that the rock storage is technically sound and has socio-economical feasibility in the long term. The project also concluded that the current tariff structure might not support the corporate feasibility of rock storage.
At the point of writing, only a few rock-based TES demonstration plants operate at a scale > 1 MW, and temperatures higher than 500 °C. Siemens Gemesa’s Electric Thermal Energy Storage demonstration plant in Germany has a rated discharge power of 1.5 MW and uses 1000 tons of volcanic rocks to store 130 MWh of electric energy. The plant has a charging efficiency of 99%, discharge efficiency of 45%, and storage losses of <1% of the stored energy per day.
3.1.3. Energy Efficiency and Losses
Molten salt-based TESs that use the electric heater for charging achieve a charging efficiency close to 99%. Small rock sizes and effective flow rates are required for a comparable charging efficiency [33] in rock-based systems.
The discharge efficiency depends on the design of the discharge system and the temperature of the storage. Typical sensible storage uses the Rankine cycle for discharge. Overall, the round-trip efficiency of the best-known Rankine cycle-based system for power generation working with the highest temperature of 565 °C, is around 40% [34,35].
If sensible heat is stored at a temperatures higher than 600 °C, supercritical steam generators can be used, and such systems’ practical round-trip efficiency can be around 45%. Research on discharge cycle based on supercritical CO2 Brayton cycle at temperatures higher than 600 °C is ongoing, and it is expected to increase efficiency and reduce the cost of TES even further [36,37].
The storage tank’s temperatures, size, and height/diameter factor and insulation influence the heat losses during storage. Annual storage losses in a commercial CSP plant with typical steel tanks with standard insulation were observed to be <1% per day [19]. For rock-based systems, the storage losses themselves are low, and studies on continuous 8 h-charging/16 h-discharging cycles have shown that the storage losses are about 0.5% of the input heat [30]. It is safe to assume storage losses to be <1% day for rock storage systems that do not operate continuously.
3.1.4. Typical Characteristics and Capacities
TESs can be constructed as scalable modular units. Enhancing the storage capacity does not require extra investment for the power components. The charging component typically costs <10% of the discharge component; therefore, the total investment costs for additional storage and charging capacity are relatively small. This enables TESs to charge systems quickly and dispatch electricity for a longer duration.
An an energy to power ratio (ratio between storage capacity and discharge power) of 7 to 15 is typically used for CSP applications. A storage duration longer than a few weeks is limited by the energy loss in the storage tanks. Although typical storage losses for molten salt systems are <1% per day, a part of the tank may be exposed to higher losses that promote solidification of the salt [38]. Storage duration >7 day should only be considered if solidification is entirely ruled out, for example, by having auxiliary electric heaters in many different parts of the tank. For rock-based systems, a storage duration of a few weeks is possible.
3.1.5. Research and Development Perspective
The high melting point of the molten salt mixture means that additional energy is needed to avoid the solidification of salts. A hot storage temperature of at least 600 °C is needed to utilize more efficient supercritical steam or supercritical CO2 generators. Some promising research results for finding a new generation of molten salts are reported by [39,40,41]. Molten salt is an electrolyte, which, at high temperatures, is corrosive. Large-scale storage depends on the ability to use low-cost construction materials. Despite much research in the area [42,43,44], finding appropriate low-cost storage tank material and coating to prevent corrosion is still a challenge.
When rocks are heated to temperatures of 600 °C from the ambient, they expand (1% to 2%) and subsequently contract when cooled [45]. The thermal expansion of steel is twice the thermal expansion of rocks. It is still a challenge to solve expansion stress in the steel tanks cost-effectively. Even when they are of the same type, rocks may have different individual minerals in them. Different expansion coefficients of the individual minerals may cause internal fractures and disintegration in the form of dust. The dust wears the turbomachinery. An effective solution for dust management is yet to be found.
3.1.6. Advantages and Disadvantages of Thermal Energy Storage
| Advantages | Disadvantages |
| No geographic constraints for construction of storage facility | Costly compared to pumped hydro storage |
| Known scalable technology | Round-trip efficiency limited by Carnot efficiency |
| Cheap investment cost for charging and storage units. Those units can be sized independently of discharge capacity | |
| Molten Salt | |
| Good heat and electrical conductivity, high thermal and chemical stability, low viscosity, and environmental friendliness | Relatively high melting point, small liquid temperature range, and corrosive at high temperature |
| Rocks | |
| Highly abundant cheap material, good thermal and chemical stability, environmental friendly | Expansion of rock pose a significant challenge, dust generation should be managed properly |
3.2. Pumped Thermal Energy Storage
PTES uses electrical energy to power a heat pump cycle during charging to create a temperature difference between two heat reservoirs. The thermal storage can be sensible, latent, or chemical. During discharging, the temperature difference between the reservoirs drives a thermal cycle. The Carnot efficiency does not limit the round-trip efficiency of PTES because it is theoretically possible to extract most of the charging work during discharge.
Bryton cycle-based PTES systems use an ideal gas as the power cycle working fluid and operate similar to reversible Joule–Brayton cycles. Rankine cycle-based systems use transcritical working fluids (often CO2) or the subcritical (or latent) PTES with steam or ammonia as the working fluid.
Patents with the concept of PTES were already filled in the 1920s [10]. There is a wide range of theoretical studies conducted on PTES based on Bryton cycles [46,47,48], Ericsson cycles [49], Rankine cycles based on CO2 [50,51,52], and steam cycles [53]. Practical implementation of the concept other than PTESs based on Bryton cycles is limited; therefore, we focus on Bryton cycle-based systems in the subsequent text.
An Italian company, Saipem, filed a patent application [54] for a PTES based on Bryton cycles that use argon as the working fluid and sensible hot storage at temperatures above 1000 °C using concrete in 2007. At the same time, a UK-based company, Isentropic Ltd, filed another patent [55] that also used argon as the working fluid but stored heat at temperatures around 600 °C using a Packed bed. These two systems were extensively discussed in the literature [46,56,57,58]); however, it appears that the concept never got materialized. Isentropic Ltd is bankrupt, and there are no current records that show Saipam’s technology was ever built. A Google spin-off, Malta Inc, is currently working with a PTES design based on Bryton cycles [59] that utilize molten salt for hot storage and a chilled liquid to store cold [59].
In 2021, Stiesdal storage technologies and the energy and fiber-optic group Andel signed an agreement to build a utility-scale prototype of a new full-scale rock storage system based on the innovation of Stiesdal storage technologies [60,61,62]) for long-term energy storage. A demonstration plant of 2 MW discharge power capacity is being constructed for commissioning in 2022. Stiesdal’s Grid-Scale Technology uses air as the working fluid and rocks as a storage medium. During charging, air from the low-pressure cold tank (at 2.5 bar) is compressed to a pressure of 7.5 bar resulting in an exit temperature from the compressors of about 540 °C (1–2 in Figure 3).
The heat of compressed air is transferred in the high-pressure hot storage tank (2–3) with the volcanic rocks. The air exiting the high-pressure tank is cooled to the ambient (3–4) and further expanded in a turbine (4–5) to lower the temperature and pressure. Cold air at a temperature of about −39 °C is used to transfer the heat in the low-pressure cold storage tank (5–1).
During discharge, the low-pressure cold air from the cold store is compressed (6–7), heated in the high-pressure tank to temperatures of about 535 °C (7–8), and expanded in turbines (8–9) to release energy. The temperature exiting the turbines at about 320 °C finally enters the low-pressure tank. A simplified schematic is shown in Figure 3.
3.2.1. Energy Efficiency and Losses
Isentropic efficiency of turbomachinery, work ratio, and heat-to-work ratio are three main parameters that dictate the overall round-trip efficiency of PTES.
The work ratio, i.e., the ratio between the compression and expansion work during charging, can be increased by increasing the pressure ratio or increasing the ratio between discharged temperature after the compressor (T2 in Figure 3) and the inlet temperature to the compressor (T1 in Figure 3) in the charging loop. Ratio (T2/T1) depends on the working fluid; for example, argon achieves a higher value of (T2/T1) than air while operating with the same pressure ratio and same sets of turbomachinery. The pressure ratio, and thus, the work ratio for a given working fluid, cannot be increased infinitely because of the difficulty in storing thermal energy at high pressure. For systems operating with low work ratios (also implies low storage temperatures), a slight decrease in the isentropic efficiency of turbomachinery has a large impact on overall round-trip efficiency. The heat-to-work ratio is the amount of heat possessed by the system for a given amount of net-work input. Large heat-to-work ratios are undesirable because heat transfer irreversibilities have a large impact on the cycle performance.
Rankine cycle-based PTES systems use sub-critical or transcritical cycles, so they have a high work ratio, but the heat-to-work ratio of such systems is also higher. In systems with a high heat-to-work ratio, the heat exchanger designs become the critical factor limiting round-trip efficiency.
Since PTES systems store energy as the temperature difference between the heat reservoirs, the heat-to-work ratio is also the charging efficiency of the system. Patented and demonstrated PTES systems have a heat-to-work ratio between 2 and 3. The discharge efficiency mainly depends on the discharge cycle and the pressure ratio, and it is between 0.2 and 0.25 for Bryton cycle-based PTESs.
Thermal and pressure losses further contribute to the decrease in round-trip efficiency. Thermodynamic analysis of patented PTES technologies showed that they could achieve theoretical maximum round-trip efficiencies between 59% and 70% [46,63]. In a more realistic cyclic transient simulation of a similar PTES system, ref. [64] found that an efficiency of 56.9% might be achievable under realistic operating conditions when all loss components and cyclic operations are considered. Scalable PTES systems that might achieve round-trip efficiency of more than 55% require significant development.
3.2.2. Typical Characteristics and Capacities
PTES systems can also be constructed as scalable modular units. Unlike TES, the highest storage temperature is not the only critical factor for PTES. Therefore, a wide range of thermal storage mediums (chemical, latent, sensible) can be employed at various temperature levels. The typical storage period of PTESs is similar to other TMESs and can cover hours to weeks. The storage losses are mostly related to the thermal losses in the storage medium.
Since the energy input-to-output ratio depends on the round-trip efficiencies, a charging system will have a larger rated capacity than the discharge system. The typical cost of charging components of 1 MW rating is less than that of the discharge components of the same rating (cost of compressors is less than half that of the turbines [65]). For a discharge system with a rated discharge capacity of 1 MW and 50% round-trip efficiency, a charging system of 2 MW is required, resulting in a high cost for the charging system.
3.2.3. Research and Development Perspective
The main technical challenge of using PTESs today is that the compressors required to compress air to high temperatures are not readily available. State-of-the-art high-pressure aero gas compressors operate at a temperature range of 450 °C to 700 °C [56]. These titanium compressors are costly, and even they do not meet the requirement for temperatures above 700 °C. There is a need to find a technical solution, so the existing gas turbines (with single crystal superalloys) that operate at high temperatures should be designed as reciprocal machines to work as a compressor and turbine. In other words, the compressors for PTES applications should be manufactured using the technologies that are currently reserved for turbines.
3.2.4. Advantages and Disadvantages of Pumped Thermal Energy Storage
| Advantages | Disadvantages |
| Round-trip efficiency not limited by Carnot efficiency | |
| Provides design freedom to choose various strategies such as precooling, preheating and recuperating, working fluids, and storage temperatures to increase the round-trip efficiency | Thermal storage that can sustain the working circuit pressure is costly compared to non-pressurized thermal storage |
| No geographic constraints for construction of storage facility | Compressors that can handle high-temperature outlet (required for higher efficiency) are costly |
3.3. Compressed Air Energy Storage (CAES)
Compressed air energy storage (CAES) is a technique of converting electrical energy into mechanical energy reversibly. During charging, the air is compressed using electricity. It is then stored (as potential energy) in a pressure tank or underground formations such as an excavated geologic cavern, mined cavity, or porous rock formation. The stored compressed air’s potential energy is released by an expansion process producing electrical power. The air can be compressed adiabatically (retaining most of the heat produced during compression) or isothermally by releasing most of the compression heat to the environment. Depending on the targeted idealized compression process, CAES technologies are classified into diabatic, adiabatic, and isothermal CAES.
In Diabatic CAESs, the heat produced during compression is wasted. During the discharge, stored compressed air should be heated to prevent condensation and icing of the expansion turbines. All existing large CAES systems are diabatic CAESs, and they rely on heating the compressed air with fossil fuel.
In an adiabatic CAES, the heat produced during the compression is captured and stored in separate thermal storage units. The stored heat then replaces the fossil fuel required in Diabatic CAESs during the discharge. The isothermal CAES system relies on preventing a temperature increase in compressors during charging and the temperature drop in expansion turbines. Isothermal CAES is limited to laboratory investigations.
The CAES concept was patented during the 1940s, and had been studied for several years in Europe [66] before the installation of the world’s first CAES system (Huntorf power plant) by a German utility, Nordwestdeutsche Kraftwerke, in 1978 [67]. The Huntorf power plant consists of a two-stage compressor (40 bar and 70 bar) with intercooling for compressing air, a cavern of about 310,000 m3, about 600 m underground for storage, and a two-stage natural gas combustor with a rated power of 290 MW [68,69]. The Huntorf power plant is still in operation and runs on a daily cycle with 8 h of charge and 2 h of discharge. During the 1970s and 1980s, The US Energy Research and Development Agency (ERDA) and US National Science Foundation (NSF) initiated two major federally-supported programs to study and develop CAESs [66]. The results of these research projects and studies, for example, refs. [66,70,71], and further technological advancements, resulted in the commissioning of the first CAES power plant (McIntosh) in the USA in 1991.
The working principle of the Huntorf power plant and McIntosh power plant is similar (they are both diabatic systems), but the McIntosh system uses a recuperator to preheat the stored compressed air before it enters the combustion chamber (as shown in Figure 4), resulting in the system that is 10% more efficient than the Huntorf power plant. The two power plants described above are the only CAES systems currently in operation.
Techniques to make CAESs more efficient were studied already in the 1980s [72,73,74,75,76]. The topic received more focus after a European research project [77,78,79] proposed a new concept called advanced adiabatic CAES (AA-CAES). Other advanced CAES systems with isothermals are proposed in the literature [80,81,82]), but these are limited to theoretical analyses.
Around 2004, an innovative, 270 Megawatt, USD 400 million CAES project was proposed to be commissioned near Des Moines, Iowa in the USA. Unfortunately, after eight years of development, the project was terminated because of site geological limitations. The report [83] on the lessons from the project showed that the cost of building such a facility would be about 20% higher than a comparably sized, conventional natural gas-fired combined-cycle electric generation facility, and the project’s long-term economics looked favorable.
The world’s first advanced adiabatic CAES demonstration plant with an electric output of 90 MW was planned in Germany [84], but the project, after a decade of planning and feasibility studies, stopped due to lack of economic viability. Several other CAES projects seem to have started in Japan, Italy, and the UK [78], but they were stopped for either economic or technical reasons.
3.3.1. Energy Efficiency and Losses
The charging efficiency of diabatic CAESs is around 80%, and the discharge efficiency is about 70%, leading to a round-trip efficiency of about 55% (electricity to electricity). Additional fuel is required to complete the cycle. Therefore, the actual electrical efficiency after subtracting electricity that could have been produced with the fuel will not be above 45%.
Some of the theoretical studies show that the adiabatic CAES system with thermal energy storage subsystems can achieve round-trip efficiencies up to 70% [78,79,85]. Achieving a practical round-trip efficiency of 70% in the near future seems unrealistic because the rapid development and deployment of the CAES technology (required for better know-how and technological enhancement) have not happened yet.
The adiabatic CAES systems store the waste heat produced during the compression. There will be some system losses even when all the heat is effectively stored during charging. Adiabatic compression is limited to low pressures due to technical limitations on the temperature at the compressor outlet. Several compression stages and inter-cooling are required to compress air to high pressures (>4 MPa). Inter-cooling cools the compressed air temperature after the first compression stage and, thus, reduces the entry temperature and work required for the air to be compressed to further higher pressures.
The adiabatic CAES system would operate in a temperature regime lower than that of the existing Diabatic CAES, so it is hard to improve the discharge efficiency of the system beyond a few percentage points from the current level of 70%. For the systems to achieve round-trip efficiencies close to 70%, most of the heat of compression should be effectively reused using several compressors, intercoolers, storage units, reheat cycles, and efficient turbomachinery. This will significantly increase the cost of the system.
3.3.2. Typical Characteristics and Capacities
The two operational plants have a charge/discharge duration of 8/3 h (Huntorf) and 38/24 h (McIntosh). The system cost of charging components in a CAES system is typically not much smaller than the discharging system. The cost of compressors per MW electric charge is about half of the cost of turbines per MW discharge. To minimize the system cost, CAES is constructed to charge more slowly than when discharging [86].
The volume-specific storage density of compressed air is 5 kWh/m³ to 20 kWh/m³ for 50 bar to 100 bar pressure. Large, cost-effective storage facilities for pressurized air are essential for CAES systems. The two existing plants utilize salt domes as a storage facility for the compressed air, but other storage facilities such as abandoned mines and aquifers might also be used.
Unlike sensible heat storage, it would be difficult to make a modular design for CAES unless costly steel tanks are used to store the compressed air. Based on the experience of the two operational plants, the typical storage period can be hours to days. Typical storage losses are virtually none for diabatic CAES; adiabatic CAES will have some obvious thermal losses, but they will not be more than 0.5% of the total input energy.
3.3.3. Research and Development Perspective
The theoretical research in CAES technology is matured, and they all point to the fact that CAES has a high extrinsic value and is technically sound. However, the lack of commercial development has halted the progress of technology.
For adiabatic CAES to be feasible, there are two major challenges. There are no off-self electrically driven compressors that can handle large outlet temperatures (see the similar discussion in Section 3.2.3), and there is a major challenge to store the high-temperature heat at the high-pressure levels.
3.3.4. Advantages and Disadvantages of Compressed Air Energy Storage
| Advantages | Disadvantages |
| High maximum achievable theoretical efficiency | |
| Known technology that has been in operation for years | Geographic constraints for construction of storage facility |
| Fast startup time compared to other TMES | Low energy density |
3.4. Liquid Air Energy Storage (LAES)
Liquid air energy storage (LAES) or cryogenic energy storage stores energy as liquified air, as shown in Figure 5. Thermal energy is captured, stored, and recycled between the charge and discharge cycles. The charging cycle cools down the liquid to very low temperatures; this cooled liquid air can be stored efficiently in insulated, low-pressure vessels. When exposed to ambient temperatures, liquid air expands rapidly, and this energy is used to drive a turbine and create electricity without combustion.
Typically, liquid air production uses the well-known Joule–Thomson effect, where cryogenic coolers liquefy the air. The discharge cycle uses heat and expands the cryogen to produce power. During the discharge, a considerable portion of the exergy is lost in the form of cold. In commercially operational plants, the discharging cycle is combined with the liquefaction, so half of the energy lost during the discharge can be recovered for liquefaction.
Storing liquid air as an energy source also dates back to the 1900s when the Tripler Liquid Air Company developed liquid–air as an alternative fuel to compete with the steam and electric vehicles of those days [87]. The concept of using cryogenic systems as large-scale energy storage for load shifting started relatively late. In 1977, researchers at the University of Newcastle [88] proposed an LAES plant of 20 MW nominal capacity for peak shaving in the electricity grid. Subsequently, commercial companies Mitsubishi Heavy Industries [89], Hitachi [90], Highview Power Storage Systems [91], and several academic researchers, for example, [92,93,94,95,96,97,98], investigated and contributed to the maturity of the technology for load shifting.
Between 2008 and 2014, a pilot-scale demonstration plant was constructed on Scottish and Southern Energy’s Slough Heat and Power station in Slough, the UK. The results and experience from this pilot plant finally resulted in Pilsworth Grid-Scale Demonstrator Plant in Bury, Greater Manchester, in 2018 [99]. The Pilsworth plant, developed by Highview Power Storage Systems and backed by UK government funding, demonstrated that LAES could provide balancing services and support the grid during winter peaks. Highview Power currently operates two additional commercial LAES facilities with a nominal capacity of 50 MW in Vermont, USA, and Carrington, UK.
3.4.1. Energy Efficiency and Losses
The overall efficiency of liquid air production depends on the plant size and ranges between 11% and 50% [100]. The only storage energy loss of cryogen is the heat dissipation of cryogenic tank at the ambient pressure, which can be <1% per day in an insulated dewar using conventional insulation technologies [87,100].
Combined cycles store heat during compression (charging) and cold during the expansion (discharge). The stored cold is used during charging to increase the charging efficiency, and the stored heat is used during discharge to increase discharge efficiency. The recovered cold during discharge alone is insufficient to cool the compressed air to the lowest temperature [101], so additional electricity is needed for the cooling process. Round-trip efficiency of the LAES cannot be higher than 43% [97] when expended at the ambient temperature, even when waste cold during evaporation is effectively used. Round-trip efficiency can be further increased by hot storage. Not all stored heat energy can be efficiently used in the discharging process. Combined cycles that utilize thermal storage to store waste heat during charging (compression) and cold during the expansion (discharge) can achieve theoretical round-trip efficiency between 50% and 55% [102]. The overall system efficiency of the stand-alone LAES system is comparable to CAES and hydrogen storage systems.
LAES systems can integrate a wide range of external processes through hot and cold thermal streams or fuels for combustion to produce electricity, heating, and cooling at the same time [12]. If external cold sources are available, they can be used instead of electrical power for cooling during compression. The external heat source at temperatures higher than 400 K improves the discharge efficiency significantly. Such hybrid systems can achieve overall round-trip efficiencies of 60% to 70% [101,103].
3.4.2. Typical Characteristics and Capacities
LAES can provide 10 MW to 100 s MW of power and storage capacity in an order of GWh. The largest operational LAES facility has a power rating of 50 MW and a storage capacity of 250 MWh. Existing LAES systems have a storage duration of <10 h, but they can be built in a modular design, such that power and energy ratings can be changed independently. Further, there are no site constraint limits for the deployment of LAES.
The charging system (liquefaction) is the most expensive subsystem. It can contribute from 45% to 70% of the total system cost [12]. Therefore, slower charging times and higher charging efficiencies are critical for techno-economic performance.
3.4.3. Research and Development Perspective
The research in stand-alone LAES technologies is matured, but many technical challenges remain. A round-trip efficiency of only 8% was achieved on the pilot plant in Slough, the UK, in 2008 [99]. Operation below the optimal working pressure, inability to recycle cold thermal energy completely, and the small system size were listed as the cause of such low performance. In commercial plants working at a pressure up to 150 bar and optimum cold and hot energy utilization, the real efficiency can be higher. There are no openly available performance data showing that efficiency close to the theoretical maximum is achievable in a real system.
The major advantage of LAES is its ability to integrate external processes in a hybrid configuration. More case-based research is needed to quantify the financial viability of the realistic application of hybrid LAES in a particular location with other available renewable sources, such as solar thermal, or for other applications beyond electricity generation such as for data center cooling or domestic heating, etc.
3.4.4. Advantages and Disadvantages of Liquid Air Energy Storage
| Advantages | Disadvantages |
| No geographic constraints for construction of storage facility | |
| Energy density is similar to batteries and much higher than pumped hydro storage and CAES | Requires external heating or fuel to achieve theoretical round-trip efficiency above 55% |
| Can integrate a wide range of external energy sources to produce electricity, heat, and cold simultaneously | Costly compared to other thermo-mechanical energy storage technologies |
4. Techno-Economic Data
Table 1 shows the projection of techno-economical parameters for emerging TMESs for 2025. Table 2 shows the same parameters for more established technologies, i.e., pumped hydro storage, lithium-ion batteries, and hydrogen storage. The details on the assumptions and data collections are discussed in Section 2.
5. Techno-Economical Analysis
5.1. Levelized Cost of Storage
The levelized cost of storage (LCOS) is used to quantify the cost per unit of discharged electricity for particular storage technology to account for parameters affecting the cost of discharging and storing electricity during the lifetime [111]. In this work, we used the LCOS methodology formulated by [11], as shown in Equation (6), without considering end-of-life costs and assuming fixed electricity price for charging (0 $/MWh), discount rate (7%), and size (10 MW). Most TMESs can sell heat and electricity, but the revenue from the heat market was not included in the LCOS analysis. Please refer to the original paper [11] and the supplementary python code LCOS calculations (https://github.com/khem1123/Review-and-techno-economic-analysis-of-emerging-thermo-mechanical-energy-storage-technologies/blob/main/LCOS/LCOS.ipynb, accessed on 9 August 2022) for details on calculation methodology.
Figure 6 shows that pumped hydro storage is the cheapest technology for bulk energy storage. Due to its high investment cost, hydrogen storage is the most expensive technology for stationary bulk storage for discharge duration of fewer than 50 h. Lithium-ion provides a cheap storage option when used frequently (more than 250 cycles per year) for a short discharge duration (<10 h). All emerging TMESs provide relatively cheaper (not as cheap as pumped hydro storage) options for energy storage for a combination of long discharge duration and frequent cycles. Some TMESs are better than others. Still, owing to the uncertainty in predicted price and performance, we can make a generalized comment that TMESs have distinctive operation areas (a region with bluish color with cycles per year between 100 and 200 cycles and the discharge time <10 h) where they are cost-competitive with batteries.
LCOS provides an “apples-to-apples” comparison among various technologies with similar use cases (defined here as discharge time and complete cycles per year with a fixed cost of buying electricity). LCOS does not describe the dynamic operation of energy storage. The storage is not always discharged to zero states in full-cycle like assumed in our LCOS study. To calculate if a particular technology is cost-effective for the given use case, each system component and their capacity and dispatch time series must be jointly studied.
5.2. Market Analysis
We used Python for Power System Analysis (PyPSA) [112] for modeling energy systems to show the gap between revenue-generating potential from energy arbitrage and the current cost of building a storage facility. We conducted a case-based study on the wholesale energy market in Denmark-west of 2020, assuming a storage facility of 1 MW discharge was built.
A price-taker market model (Figure 7a) assumes that the storage unit can buy and sell electricity from the grid at the market price without impacting the wholesale market prices. This assumption is valid when only a few storage facilities participate in the market. Therefore, the analysis should be used only to understand the revenue-generating potential of the few first players in the storage market. We used hourly resolution for a whole year, ignoring the possibilities of participating in heating and regulation markets.
A global constraint was placed so that the storage unit, with specified techno-economical properties (obtained from Table 1 and Table 2), would only be built if it could recover investment and O&M cost (at a discount rate of 7%) by buying cheap electricity from the market and selling it at higher market prices. The algorithm maximizes profit by determining the optimum storage capacity, charge capacity, and charge/discharge patterns. We swept across power capacity costs and energy storage capacity costs to find the cost combination boundary line, under which the storage system would generate a small profit. The obtained cost combinations gave a cost curve for the storage technology.
Analysis of the Danish wholesale electricity market (Figure 8) shows that the storage technologies cannot pay for themselves at the current renewable penetration level by load shifting alone. Even a 90% efficient storage technology with a technical lifetime of 30 years and virtually zero investment cost for power components would not make any profit in a competitive market at an energy storage capacity cost of more than 100 USD/kWh. For a TMES with a round-trip efficiency of 70% to be viable, at the realistic storage cost of 15 USD/kWh to 40 USD/kWh, the power components should decrease to one-fifth of the current level.
The gap in the market was so large that any storage technologies were not able to generate any profit. It also explains why storage technologies, amid all the hype, are not already in the market. Lithium-ion batteries operate in the competitive market. However, they must create additional values related to regulation, flexibility, and energy security rather than relying on the primary function of load shifting through time longer than an hour.
In 2021, there was a considerable increase in EU wholesale energy prices, primarily caused by the increased global gas price worldwide [113]. Uncertain markets and significant fluctuations in the market enable storage technologies to be profitable. Still, the future of the electricity market and fuel price is uncertain, and it is not yet profitable investing in storage technologies in highly interconnected systems.
5.2.1. At What Costs Will TMES Be Commercially Viable?
Investment cost of power and storage components, the cost of alternative fuel, renewable penetration levels, interconnections, capacity factors for renewable energy generation, and sector coupling are some factors that determine if the storage is an economically viable option. To demonstrate the use cases where the TMES can be feasible and compare the differences between TMES technologies, we use a simplified case study in an off-grid system that is not connected to a larger electricity market.
The off-grid system (Figure 7b) was modeled to be powered by a combination of wind, solar, a type of storage unit, and alternative electricity source at a specified generation cost of (60, 100, and 140 $/MWh electricity) to meet the constant demand (load) of 100 MW. The off-grid system could freely choose between wind, solar, alternative fossil fuel generation sources, and storage to meet the demand purely based on economic incentives. Alternative fossil fuel generation sources did not require any investment but had a marginal cost of producing electricity determined by the assumed fuel prices and CO2 taxes. The off-grid system was optimized by minimizing annualized system cost in every time step. The highest cost combinations for the storage technology at which the storage technology reduces the total system cost determined the cost curve for the energy storage technology. For these simulations, the investment cost for wind and solar was fixed at 910 USD/kW and 425 USD/kW, respectively, according to the cost projection of wind and solar given by [114].
For a 100% renewable system, a large amount of storage is required, but the storage is not used optimally. Therefore, the unit cost storage would be large. In contracts, energy storage with a small storage capacity would be used to its full potential even at a very high investment cost. To limit this, we put an additional constraint that the storage technology should at least discharge 2% of the total electricity demand.
The marginal cost of producing electricity with gas between 2018 to 2021 in Europe was between 30 USD/MWh and 60 USD/MWh [115]. However, the marginal cost in other parts of the world, for example, in South Korea, was between 35 USD/MWh and 85 USD/MWh. We used the marginal cost of alternative fuel between 60 USD/MWh and 140 USD/MWh for the off-grid system in anticipation that (1) the marginal cost in such a remote location will be higher than in the mainland and (2) the marginal cost will rise in the future because of the CO2 tax. Therefore, we modeled the off-grid system with an alternative electricity source with a marginal cost of (60 USD/MWh, 100 USD/MWh, and 140 USD/MWh electricity).
Figure 9 shows that the marginal cost of alternative fuel is the main factor that determines whether the storage is the cheapest option. As long as alternative electricity can be generated at 60 USD/MWh, the storage is not economically viable. All storage technologies become financially viable when the marginal cost of alternative fuel rises to 140 USD/MWh.
At the marginal cost of alternative fuel of 100 USD/MWh, all TMES technologies can be viable options at projected techno-economic maturity levels. Lithium-ion batteries would be competitive with all TMES technologies if they follow the project cost reduction and the energy storage cost goes below 200 USD/MWh. Hydrogen storage, because of its higher projected investment cost for power and lower round-trip efficiency, is the technology that may not be competitive at the marginal cost of alternative fuel of 100 USD/MWh when used only for electricity storage. Further discussion will focus on an alternative fuel price of 100 USD/MWh to highlight the difference between the TMES technologies.
For its relatively high round-trip efficiency and lower investment cost power, CAES is feasible under most of the projected cost ranges. Because of the cheap energy investment cost, TES is a viable option even with the lowest round-trip efficiency among all TMES technologies. PTES and LAES are also feasible when the energy storage and power investment costs are near the lower end of projected values.
5.2.2. Charge and Discharge Efficiency
Decomposing round-trip efficiency into charge and discharge efficiency provides better insight into how they impact overall system costs. The impact can be explained with the concept of efficiency ratio () described in Section 2 and defined in Equation (5).
LAES and CAES can technically achieve high discharge efficiencies (above 70%) and can achieve close to 1. The discharge efficiency of TES is limited by the maximum thermal efficiencies achievable by the Rankine cycle. Thus, it will have a higher than 2. PTES is unique because it has a charging efficiency about 8 to 10 times higher than the discharge efficiency.
Figure 10a shows that high discharge efficiency reduces the overall cost of the storage system. For example, at an energy storage investment cost of 30 USD/kWh, a storage technology (with a round-trip efficiency of 60%) but equal charge and discharge efficiency (77.4% each) could have 28% more expensive power components than another technology with the same round-trip efficiency but an efficiency ratio of four (charge efficiency of ≈155% and discharge efficiency of ≈39%). The purple star denotes this example in Figure 10a.
LEAS and CAES technologies can be economically viable at higher investment cost—power—when compared to TES and PTES systems operating at the exact investment cost—energy—because they have a smaller efficiency ratio. Decreasing the efficiency ratio (increasing the discharge efficiency) is even more critical when the energy capacity costs are higher; thus, PTES and TES systems need cheap energy storage to reduce this effect.
5.2.3. Cost of Charging and Discharging Components
TES is characterized by cheap charging power components that are almost 100% efficient. The unit charging power components () for TES costs about 10% of the unit discharge component (). Having cheap charging power components enables storage systems to have a rapid charging time. Rapid charging time is desirable because it enables the use of excess electricity produced in peak hours quickly. The cost ratio () defined in Equation (1) is an important parameter that determines the economic viability of a system, which can be observed in Figure 10b. For example, at an energy storage investment cost of 40 USD/kWh, a storage technology with charging components costing one-tenth of the discharging components could have been built at 30% less cost () compared to the technology that has the same cost for charging and discharging components. The red star denotes this example in Figure 10b.
For CAES and PTES, the unit cost of charging components is about half of the discharge components, and for LEAS, the charging parts and discharging components cost about the same. TES compensates for lower round-trip efficiencies and higher efficiency ratios with desirable cost ratios and comparatively cheaper energy storage. CAES technology is the most market-competitive at the projected cost because it has a comparatively high discharge efficiency (65%) and a relatively small cost ratio (0.5).
5.3. Discussion on Storage Size and Wind-Solar Capacity Factors
LCOS analysis shows that TMES technologies should operate for specific cycles with discharge duration >10 h to compete with batteries. The same is true for the off-grid case. In the Market analysis, we handpicked a case where the TMES would be competitive. Batteries are usually a good option when used frequently; this is related to the fraction of energy it should supply or the amount of fuel it should displace.
Completely displacing the alternative fuel requires storage to be built for long duration and not used optimally. TMES would only be economically viable in the scenario when the storage cost comes down to <5 USD/MWh. This has already been documented in earlier published studies [116] and supported by our analysis included in the Supplementary File, where results from Section 5.2 are replicated for different storage size requirements.
The location’s solar and wind capacity factors also determine the cost at which the storage technologies are market competitive. Wind-dominated systems need storage technologies with high discharge efficiencies and small self-discharge (CAES and LAES). Solar-dominated systems prefer batteries and technologies with a small cost ratio (TES). Some of these observations are highlighted in the Supplementary File, where the results of the market analysis discussed in Section 5.2 are extended to off-grid locations with wind and solar domination.
6. Concluding Remarks
Thermo-Mechanical Energy Storages (TMES) have the potential to provide bulk energy storage at a large scale. They can cover both the 8 h to 18 h duration required for day-to-day smoothing of solar PV and the 3 day to 7 day duration required for smoothing wind power gaps caused by low wind periods. Long life expectancies (in the range of 20 years to 30 years), cheap storage components (<40 $/kWh), and the potential of using already developed, commercial components make TMES attractive.
TMES are based on a solid and long history of theoretical research. The real-life implementation of these concepts, however, is limited to a few demonstration plants. Stories of abandoned projects and below-average performance in constructed facilities are not new. Most of the concepts would need rapid deployment for further technological advancement and reduction of cost to be market competitive. The limited deployment of TMES is primarily because of economic reasons and lack of market rather than technical limitations. At current penetration levels and fuel prices, TMESs cannot pay for themselves.
TMESs have similar technical performance. What TMES is best for a given project should be answered by qualitative factors such as geographical restrictions, availability of external energy sources, technological maturity, and cost quotation from the manufacturers. If one form of TMES develops rapidly, the economy of scale will likely kick all other forms of TMES off the market.
In off-grid systems with high fuel prices, TMESs are already economically competitive. Deployment of TMESs on a large scale in such markets would help technological advancement and cost reduction. Cheap storage components are required when the renewable energy penetration increases beyond 80% to 90%. TMESs are likely to achieve cost reductions if they are developed and deployed rapidly.
Sector coupling between heating, cooling, and electricity will be as important as the storage technologies themselves in the future. TMESs can help the sector coupling and provide the necessary infrastructure to do so. Nothing might have contributed more to shaping the modern world than the humble heat engines; they will remain crucial, in an evolved form, helping reverse some of the unwanted consequences caused by their exploitation.
Supplementary Materials
The Supplemental information—Review and techno-economic analysis of emerging thermo-mechanical energy storage technologies is available from https://www.mdpi.com/article/10.3390/en15176328/s1.
Author Contributions
K.R.G., G.B.A. and M.V. contributed equally to this work. All authors have read and agreed to the published version of the manuscript.
Funding
This work is a part of the GridScale project funded by the Danish Energy Agency under the EUDP Program, Grant No. 64020-2120.
Data Availability Statement
Python code used to calculate LCOS and the associated cost data is publicly available at https://github.com/khem1123/Review-and-techno-economic-analysis-of-emerging-thermo-mechanical-energy-storage-technologies/blob/main/LCOS/LCOS.ipynb. Python code for formulating energy system models, the required data files, and the scripts to generate figures discussed in the paper are also available in the same repository (https://github.com/khem1123/Review-and-techno-economic-analysis-of-emerging-thermo-mechanical-energy-storage-technologies/blob/main/LCOS/LCOS.ipynb) (accessed on 9 August 2022).
Acknowledgments
We want to thank Jesper Tang and his team at Aalborg CSP, Angelo La Seta and Stiesdal storage technologies, and Filip Gamborg and the team at Danish Energy Agency for providing the latest market trend and cost projections of thermal energy storage technologies and reviewing the paper. We thank Aslak Kristensen and his team at Dansk Energi for valuable discussions on electricity markets. We thank Ebbe K. Gøtske for fruitful discussions regarding the modeling of storage technologies.
Conflicts of Interest
The authors declare that they have no known competing financial interest or personal relationships that could have appeared to influence the work reported in this paper. The funders had no role in the design of the study; in the collection, analyses, or interpretation of data; in the writing of the manuscript; or in the decision to publish the results.
Nomenclature
| Acronyms | |
| TES | Thermal Energy Storage |
| CEAS | Compressed Air Energy Storage |
| PTES | Pumped Thermal Energy Storage |
| LAES | Liquid Air Energy Storage |
| TMES | Thermo-Mechanical Energy Storage |
| O&M | Operation and Maintenance |
| LCOS | Levelized Cost of Storage |
| CSP | Concentrated Solar Power |
| Symbols | |
| T | Temperature |
| P | Pressure |
| Greek Symbols | |
| Efficiency | |
| Subscripts | |
| ele | Electric |
| charge | Charge |
| dis | Discharge |
| RT | Round-trip |
| min | Minimum |
| max | Maximum |
References
- Weitemeyer, S.; Kleinhans, D.; Vogt, T.; Agert, C. Integration of Renewable Energy Sources in future power systems: The role of storage. Renew. Energy 2015, 75, 14–20. [Google Scholar] [CrossRef]
- Blanco, H.; Faaij, A. A review at the role of storage in energy systems with a focus on Power to Gas and long-term storage. Renew. Sustain. Energy Rev. 2018, 81, 1049–1086. [Google Scholar] [CrossRef]
- Victoria, M.; Zhu, K.; Brown, T.; Andresen, G.B.; Greiner, M. The role of storage technologies throughout the decarbonisation of the sector-coupled European energy system. Energy Convers. Manag. 2019, 201, 111977. [Google Scholar] [CrossRef]
- Dowling, J.A.; Rinaldi, K.Z.; Ruggles, T.H.; Davis, S.J.; Yuan, M.; Tong, F.; Lewis, N.S.; Caldeira, K. Role of Long-Duration Energy Storage in Variable Renewable Electricity Systems. Joule 2020, 4, 1907–1928. [Google Scholar] [CrossRef]
- Figgener, J.; Stenzel, P.; Kairies, K.P.; Linßen, J.; Haberschusz, D.; Wessels, O.; Angenendt, G.; Robinius, M.; Stolten, D.; Sauer, D.U. The development of stationary battery storage systems in Germany–A market review. J. Energy Storage 2020, 29, 101153. [Google Scholar] [CrossRef]
- Ralon, P.; Taylor, M.; Ilas, A.; Diaz-Bone, H.; Kairies, K. Electricity Storage and Renewables: Costs and Markets to 2030; International Renewable Energy Agency: Abu Dhabi, United Arab Emirates, 2017. [Google Scholar]
- Albertus, P.; Manser, J.S.; Litzelman, S. Long-Duration Electricity Storage Applications, Economics, and Technologies. Joule 2020, 4, 21–32. [Google Scholar] [CrossRef]
- National Technology & Engineering Sciences of Sandia. Global Energy Storage Database|Energy Storage Systems. 2021. Available online: https://www.sandia.gov/ess-ssl/global-energy-storage-database-home/ (accessed on 9 August 2021).
- Blaabjerg, F.; Consoli, A.; Ferreira, J.; van Wyk, J. The future of electronic power processing and conversion. IEEE Trans. Ind. Appl. 2005, 41, 3–8. [Google Scholar] [CrossRef]
- Steinmann, W.D. Thermo-mechanical concepts for bulk energy storage. Renew. Sustain. Energy Rev. 2017, 75, 205–219. [Google Scholar] [CrossRef]
- Schmidt, O.; Melchior, S.; Hawkes, A.; Staffell, I. Projecting the Future Levelized Cost of Electricity Storage Technologies. Joule 2019, 3, 81–100. [Google Scholar] [CrossRef]
- Vecchi, A.; Li, Y.l.; Ding, Y.; Mancarella, P.; Sciacovelli, A. Liquid air energy storage (LAES): A review on technology state-of-the-art, integration pathways and future perspectives. Adv. Appl. Energy 2021, 3, 100047. [Google Scholar] [CrossRef]
- Reed, S.; Sugo, H.; Kisi, E. High temperature thermal storage materials with high energy density and conductivity. Sol. Energy 2018, 163, 307–314. [Google Scholar] [CrossRef]
- Datas, A.; Ramos, A.; Martí, A.; del Cañizo, C.; Luque, A. Ultra high temperature latent heat energy storage and thermophotovoltaic energy conversion. Energy 2016, 107, 542–549. [Google Scholar] [CrossRef]
- Enescu, D.; Chicco, G.; Porumb, R.; Seritan, G. Thermal Energy Storage for Grid Applications: Current Status and Emerging Trends. Energies 2020, 13, 340. [Google Scholar] [CrossRef]
- Diago, M.; Iniesta, A.C.; Delclos, T.; Soum-Glaude, A.; Shamim, T.; Calvet, N. Characterization of desert sand as a sensible thermal energy storage medium. AIP Conf. Proc. 2016, 1734, 050011. [Google Scholar] [CrossRef]
- Angelini, G.; Lucchini, A.; Manzolini, G. Comparison of Thermocline Molten Salt Storage Performances to Commercial Two-tank Configuration. Energy Procedia 2014, 49, 694–704. [Google Scholar] [CrossRef]
- Ladkany, S.; Culbreth, W.; Loyd, N. Molten salts and applications I: Molten salt history, types, thermodynamic and physical properties, and cost. J. Energy Power Eng. 2018, 12, 507–516. [Google Scholar]
- Pacheco, J.E.; Bradshaw, R.W.; Dawson, D.B.; De la Rosa, W.; Gilbert, R.; Goods, S.H. Final Test and Evaluation Results from the Solar Two Project; SAND2002-0120; Sandia National Laboratories: Albuquerque, NM, USA, 2002; pp. 1–294.
- Murdock, H.E.; Gibb, D.; André, T.; Sawin, J.L.; Brown, A.; Appavou, F.; Ellis, G.; Epp, B.; Guerra, F.; Joubert, F.; et al. Renewables 2020-Global Status Report; Technical Report, Ren21: Renewables Now; Ren21: Paris, France, 2020. [Google Scholar]
- Bauer, T.; Odenthal, C.; Bonk, A. Molten Salt Storage for Power Generation. Chem. Ing. Tech. 2021, 93, 534–546. [Google Scholar] [CrossRef]
- Azouzoute, A.; El Ydrissi, M.; Elmaazouzi, Z.; Benhaddou, M.; Salihi, M.; Hajjaj, C.; Garoum, M. Thermal production and heat cost analysis of the potential of solar concentrators for industrial process applications: A case study in six sites in Morocco. Sci. Afr. 2021, 12, e00765. [Google Scholar] [CrossRef]
- Lilliestam, J.; Pitz-Paal, R. Concentrating solar power for less than USD 0.07 per kWh: Finally the breakthrough? Renew. Energy Focus 2018, 26, 17–21. [Google Scholar] [CrossRef]
- John, E.; Hale, M.; Selvam, P. Concrete as a thermal energy storage medium for thermocline solar energy storage systems. Sol. Energy 2013, 96, 194–204. [Google Scholar] [CrossRef]
- Zhang, D.; Li, Z.; Zhou, J.; Wu, K. Development of thermal energy storage concrete. Cem. Concr. Res. 2004, 34, 927–934. [Google Scholar] [CrossRef]
- Buscemi, A.; Panno, D.; Ciulla, G.; Beccali, M.; Lo Brano, V. Concrete thermal energy storage for linear Fresnel collectors: Exploiting the South Mediterranean’s solar potential for agri-food processes. Energy Convers. Manag. 2018, 166, 719–734. [Google Scholar] [CrossRef]
- Meier, A.; Winkler, C.; Wuillemin, D. Experiment for modelling high temperature rock bed storage. Sol. Energy Mater. 1991, 24, 255–264. [Google Scholar] [CrossRef]
- Beasley, D.E.; Clark, J.A. Transient response of a packed bed for thermal energy storage. Int. J. Heat Mass Transf. 1984, 27, 1659–1669. [Google Scholar] [CrossRef]
- Hänchen, M.; Brückner, S.; Steinfeld, A. High-temperature thermal storage using a packed bed of rocks–heat transfer analysis and experimental validation. Appl. Therm. Eng. 2011, 31, 1798–1806. [Google Scholar] [CrossRef]
- Zanganeh, G.; Pedretti, A.; Zavattoni, S.; Barbato, M.; Steinfeld, A. Packed-bed thermal storage for concentrated solar power–Pilot-scale demonstration and industrial-scale design. Sol. Energy 2012, 86, 3084–3098. [Google Scholar] [CrossRef]
- Allen, K.; Von Backström, T.; Kröger, D. Packed rock bed thermal storage in power plants: Design considerations. Energy Procedia 2014, 49, 666–675. [Google Scholar] [CrossRef]
- Jemmal, Y.; Zari, N.; Maaroufi, M. Experimental characterization of siliceous rocks to be used as filler materials for air-rock packed beds thermal energy storage systems in concentrated solar power plants. Sol. Energy Mater. Sol. Cells 2017, 171, 33–42. [Google Scholar] [CrossRef]
- Marongiu, F.; Soprani, S.; Engelbrecht, K. Modeling of high temperature thermal energy storage in rock beds—Experimental comparison and parametric study. Appl. Therm. Eng. 2019, 163, 114355. [Google Scholar] [CrossRef]
- Pacheco, J.; Wolf, T.; Muley, N. Incorporating Supercritical Steam Turbines into Advanced Molten-Salt Power Tower Plants: Feasibility and Performance; Sandia National Laboratories: Albuquerque, NM, USA, 2013. [CrossRef]
- Kosman, W.; Rusin, A. The Application of Molten Salt Energy Storage to Advance the Transition from Coal to Green Energy Power Systems. Energies 2020, 13, 2222. [Google Scholar] [CrossRef]
- Turchi, C.S.; Vidal, J.; Bauer, M. Molten salt power towers operating at 600–650 °C: Salt selection and cost benefits. Sol. Energy 2018, 164, 38–46. [Google Scholar] [CrossRef]
- Nicol, K. Status of Advanced Ultra-Supercritical Pulverised Coal Technology; IEA Clean Coal Centre: London, UK, 2013. [Google Scholar]
- Zhang, X.; Wu, Y.; Ma, C.; Meng, Q.; Hu, X.; Yang, C. Experimental Study on Temperature Distribution and Heat Losses of a Molten Salt Heat Storage Tank. Energies 2019, 12, 1943. [Google Scholar] [CrossRef]
- Raade, J.W.; Padowitz, D. Development of Molten Salt Heat Transfer Fluid With Low Melting Point and High Thermal Stability. J. Sol. Energy Eng. 2011, 133, 031013. [Google Scholar] [CrossRef]
- Ding, W.; Bonk, A.; Bauer, T. Molten chloride salts for next generation CSP plants: Selection of promising chloride salts & study on corrosion of alloys in molten chloride salts. AIP Conf. Proc. 2019, 2126, 200014. [Google Scholar] [CrossRef]
- Vaka, M.; Walvekar, R.; Khalid, M.; Jagadish, P. Low-melting-temperature binary molten nitrate salt mixtures for solar energy storage. J. Therm. Anal. Calorim. 2020, 141, 2657–2664. [Google Scholar] [CrossRef]
- Bradshaw, R.W.; Goods, S.H. Corrosion Resistance of Stainless Steels During Thermal Cycling in Alkali Nitrate Molten Salts; Technical Report; The U.S. Department of Energy: Washington, DC, USA, 2001. [CrossRef]
- Audigié, P.; Bizien, N.; Baráibar, I.; Rodríguez, S.; Pastor, A.; Hernández, M.; Agüero, A. Aluminide slurry coatings for protection of ferritic steel in molten nitrate corrosion for concentrated solar power technology. AIP Conf. Proc. 2017, 1850, 070002. [Google Scholar] [CrossRef]
- Agüero, A.; Audigié, P.; Rodríguez, S.; Encinas-Sánchez, V.; de Miguel, M.T.; Pérez, F.J. Protective coatings for high temperature molten salt heat storage systems in solar concentration power plants. AIP Conf. Proc. 2018, 2033, 090001. [Google Scholar] [CrossRef]
- Pedersen, A.S.; Engelbrecht, K.; Soprani, S.; Wichmann, M.; Borchsenius, J.; Marongiu, F.; Dinesen, K.; Ulrich, T.; Algren, L.; Capion, K. High-Temperature Thermal Energy Storage for electrification and district heating. In Proceedings of the 1st LA SDEWES Conference, Rio de Janerio, Brazil, 28–31 January 2018. [Google Scholar]
- Desrues, T.; Ruer, J.; Marty, P.; Fourmigué, J.F. A thermal energy storage process for large scale electric applications. Appl. Therm. Eng. 2010, 30, 425–432. [Google Scholar] [CrossRef]
- White, A.; Parks, G.; Markides, C.N. Thermodynamic analysis of pumped thermal electricity storage. Appl. Therm. Eng. 2013, 53, 291–298. [Google Scholar] [CrossRef] [Green Version]
- Howes, J. Concept and Development of a Pumped Heat Electricity Storage Device. Proc. IEEE 2012, 100, 493–503. [Google Scholar] [CrossRef]
- Arabkoohsar, A.; Andresen, G.B. Thermodynamics and economic performance comparison of three high-temperature hot rock cavern based energy storage concepts. Energy 2017, 132, 12–21. [Google Scholar] [CrossRef]
- Okazaki, T.; Shirai, Y.; Nakamura, T. Concept study of wind power utilizing direct thermal energy conversion and thermal energy storage. Renew. Energy 2015, 83, 332–338. [Google Scholar] [CrossRef]
- Morandin, M.; Maréchal, F.; Mercangöz, M.; Buchter, F. Conceptual design of a thermo-electrical energy storage system based on heat integration of thermodynamic cycles—Part A: Methodology and base case. Energy 2012, 45, 375–385. [Google Scholar] [CrossRef]
- Mercangöz, M.; Hemrle, J.; Kaufmann, L.; Z’Graggen, A.; Ohler, C. Electrothermal energy storage with transcritical CO2 cycles. Energy 2012, 45, 407–415. [Google Scholar] [CrossRef]
- Steinmann, W.D. The CHEST (Compressed Heat Energy STorage) concept for facility scale thermo mechanical energy storage. Energy 2014, 69, 543–552. [Google Scholar] [CrossRef]
- Ruer, J. Installation et Procedes de Stockage et Restitution d’Energie Electrique. WO Patent WO2008148962A3, 11 December 2022. [Google Scholar]
- Howes, J.S.; MacNaghten, J. Energy Storage. U.S. Patent 8656712B2, 25 February 2014. [Google Scholar]
- Périlhon, C.; Lacour, S.; Podevin, P.; Descombes, G. Thermal Electricity Storage by a Thermodynamic Process: Study of Temperature Impact on the Machines. Energy Procedia 2013, 36, 923–938. [Google Scholar] [CrossRef]
- Ni, F.; Caram, H.S. Analysis of pumped heat electricity storage process using exponential matrix solutions. Appl. Therm. Eng. 2015, 84, 34–44. [Google Scholar] [CrossRef]
- Olympios, A.V.; McTigue, J.D.; Farres-Antunez, P.; Tafone, A.; Romagnoli, A.; Li, Y.; Ding, Y.; Steinmann, W.D.; Wang, L.; Chen, H.; et al. Progress and prospects of thermo-mechanical energy storage—A critical review. Prog. Energy 2021, 3, 022001. [Google Scholar] [CrossRef]
- Laughlin, R.B.; Larochelle, P.; Cizek, N. Systems and Methods for Energy Storage and Retrieval. U.S. Patent 20150260463A1, 17 September 2015. [Google Scholar]
- Stiesdal, H. Thermal Energy Storage and Recovery with a Heat Exchanger Arrangement Having an Extended Thermal Interaction Region. EP Patent 2593742A2, 22 May 2013. [Google Scholar]
- Reznik, D.; Stiesdal, H. System for Storing and Outputting Thermal Energy Having a Heat Accumulator and a Cold Accumulator and Metho for the Operation Thereof. U.S. Patent 20150136351A1, 21 May 2015. [Google Scholar]
- Laurberg, H.; Stiesdal, H. Storage and Recovery of Thermal Energy Using Heat Storage Material Being Filled in a Plurality of Enclosures. EP Patent 2758637A1, 13 December 2017. [Google Scholar]
- McTigue, J.D.; White, A.J.; Markides, C.N. Parametric studies and optimisation of pumped thermal electricity storage. Appl. Energy 2015, 137, 800–811. [Google Scholar] [CrossRef] [Green Version]
- Wang, L.; Lin, X.; Chai, L.; Peng, L.; Yu, D.; Chen, H. Cyclic transient behavior of the Joule–Brayton based pumped heat electricity storage: Modeling and analysis. Renew. Sustain. Energy Rev. 2019, 111, 523–534. [Google Scholar] [CrossRef]
- Mongird, K.; Viswanathan, V.; Alam, J.; Vartanian, C.; Sprenkle, V.; Baxter, R. 2020 Grid Energy Storage Technology Cost and Performance Assessment; U.S. Department of Energy: Washington, DC, USA, 2020.
- Giramonti, A.J.; Lessard, R.D.; Blecher, W.A.; Smith, E.B. Conceptual design of compressed air energy storage electric power systems. Appl. Energy 1978, 4, 231–249. [Google Scholar] [CrossRef]
- Crotogino, F.; Mohmeyer, K.U.; Scharf, R. Huntorf CAES: More than 20 years of successful operation. In Proceedings of the SMRI Spring Meeting, Galveston, TX, USA, 19–22 September 2001; Volume 2001. [Google Scholar]
- Karellas, S.; Tzouganatos, N. Comparison of the performance of compressed-air and hydrogen energy storage systems: Karpathos island case study. Renew. Sustain. Energy Rev. 2014, 29, 865–882. [Google Scholar] [CrossRef]
- Luo, X.; Wang, J.; Dooner, M.; Clarke, J. Overview of current development in electrical energy storage technologies and the application potential in power system operation. Appl. Energy 2015, 137, 511–536. [Google Scholar] [CrossRef]
- Glendenning, I. Long-term prospects for compressed air storage. Appl. Energy 1976, 2, 39–56. [Google Scholar] [CrossRef]
- Allen, R.; Doherty, T.; Kannberg, L. Summary of Selected Compressed Air Energy Storage Studies; Technical Report; Pacific Northwest Labs.: Richland, WA, USA, 1985.
- Driggs, C.L. Adiabatic Compressed Air Energy Storage in Hard Rock; NASA STI/Recon Technical Report N; 1980; Volume 81, Available online: http://adsabs.harvard.edu/abs/1980STIN...8117591D (accessed on 12 May 2021).
- Drost, M.K.; Zaloudek, F.R.; Loscutoff, W.V. Preliminary Study of Adiabatic Compressed-Air Energy Storage in Aquifers; Performance analysis using CYCLOPS computer code; Technical Report; The U.S. Department of Energy: Washington, DC, USA, 1980. Available online: https://www.osti.gov/biblio/6468760 (accessed on 12 May 2021).
- Hobson, M.J. Conceptual Design and Engineering Studies of Adiabatic Compressed Air Energy Storage (CAES) with Thermal Energy Storage; Technical Report; The U.S. Department of Energy: Washington, DC, USA, 1981. Available online: https://www.osti.gov/biblio/5744345 (accessed on 12 May 2021). [CrossRef]
- Zaloudek, F.R.; Reilly, R.W. An Assessment of Second-Generation Compressed-Air Energy-Storage Concepts; Technical Report; The U.S. Department of Energy: Washington, DC, USA, 1982. [CrossRef]
- Muis, H. An Attractive Candidate: Adiabatic Compressed Air Storage; Ingenieur: Hague, The Netherlands, 1987; Volume 99. [Google Scholar]
- Jakiel, C.; Zunft, S.; Nowi, A. Adiabatic compressed air energy storage plants for efficient peak load power supply from wind energy: The European project AA-CAES. Int. J. Energy Technol. Policy 2007, 5, 296–306. [Google Scholar] [CrossRef]
- Luo, X.; Wang, J.; Krupke, C.; Wang, Y.; Sheng, Y.; Li, J.; Xu, Y.; Wang, D.; Miao, S.; Chen, H. Modelling study, efficiency analysis and optimisation of large-scale Adiabatic Compressed Air Energy Storage systems with low-temperature thermal storage. Appl. Energy 2016, 162, 589–600. [Google Scholar] [CrossRef]
- Hartmann, N.; Vöhringer, O.; Kruck, C.; Eltrop, L. Simulation and analysis of different adiabatic Compressed Air Energy Storage plant configurations. Appl. Energy 2012, 93, 541–548. [Google Scholar] [CrossRef]
- Qin, C.; Loth, E. Simulation of spray direct injection for compressed air energy storage. Appl. Therm. Eng. 2016, 95, 24–34. [Google Scholar] [CrossRef]
- Odukomaiya, A.; Kokou, E.; Hussein, Z.; Abu-Heiba, A.; Graham, S.; Momen, A.M. Near-isothermal-isobaric compressed gas energy storage. J. Energy Storage 2017, 12, 276–287. [Google Scholar] [CrossRef]
- Chen, H.; Peng, Y.h.; Wang, Y.l.; Zhang, J. Thermodynamic analysis of an open type isothermal compressed air energy storage system based on hydraulic pump/turbine and spray cooling. Energy Convers. Manag. 2020, 204, 112293. [Google Scholar] [CrossRef]
- Holst, K.; Huff, G.; Schulte, R.H.; Critelli, N. Lessons from IOWA: Development of a 270 Megawatt Compressed Air Energy Storage Project in Midwest Independent System Operator: A Study for the DOE Energy Storage Systems Program; Technical Report; Sandia National Laboratories: Albuquerque, NM, USA, 2012.
- Power, R. Adele–Adiabatic Compressed-Air Energy Storage for Electricity Supply; RWE Power AG: Essen, Germany, 2010; pp. 953–956. [Google Scholar]
- Barbour, E.; Mignard, D.; Ding, Y.; Li, Y. Adiabatic Compressed Air Energy Storage with packed bed thermal energy storage. Appl. Energy 2015, 155, 804–815. [Google Scholar] [CrossRef]
- Hunter, C.A.; Penev, M.M.; Reznicek, E.P.; Eichman, J.; Rustagi, N.; Baldwin, S.F. Techno-economic analysis of long-duration energy storage and flexible power generation technologies to support high-variable renewable energy grids. Joule 2021, 5, 2077–2101. [Google Scholar] [CrossRef]
- Abdo, R.F.; Pedro, H.T.C.; Koury, R.N.N.; Machado, L.; Coimbra, C.F.M.; Porto, M.P. Performance evaluation of various cryogenic energy storage systems. Energy 2015, 90, 1024–1032. [Google Scholar] [CrossRef]
- Smith, E. Storage of electrical energy using supercritical liquid air. Proc. Inst. Mech. Eng. 1977, 191, 289–298. [Google Scholar] [CrossRef]
- Kenji, K.; Keiichi, H.; Takahisa, A. Development of Generator of Liquid Air Storage Energy System; Technical Review; Mitsubishi Heavy Industries, Ltd.: Tokyo, Japan, 1998; Volume 35. [Google Scholar]
- Chino, K.; Araki, H. Evaluation of energy storage method using liquid air. Heat Transf. Res. Spons. Soc. Chem. Eng. Jpn. Heat Transf. Div. Asme 2000, 29, 347–357. [Google Scholar] [CrossRef]
- Chen, H.; Ding, Y.; Peters, T.; Berger, F. Energy Storage and Generation. U.S. Patent App. 12/280,739, 9 October 2009. [Google Scholar]
- Ordonez, C.; Plummer, M. Cold thermal storage and cryogenic heat engines for energy storage applications. Energy Sources 1997, 19, 389–396. [Google Scholar] [CrossRef]
- Ordonez, C.A. Liquid nitrogen fueled, closed Brayton cycle cryogenic heat engine. Energy Convers. Manag. 2000, 41, 331–341. [Google Scholar] [CrossRef]
- Li, Y.; Chen, H.; Ding, Y. Fundamentals and applications of cryogen as a thermal energy carrier: A critical assessment. Int. J. Therm. Sci. 2010, 49, 941–949. [Google Scholar] [CrossRef]
- Li, Y.; Wang, X.; Jin, Y.; Ding, Y. An integrated solar-cryogen hybrid power system. Renew. Energy 2012, 37, 76–81. [Google Scholar] [CrossRef]
- Hu, Y.; Li, X.; Li, H.; Yan, J. Peak and off-peak operations of the air separation unit in oxy-coal combustion power generation systems. Appl. Energy 2013, 112, 747–754. [Google Scholar] [CrossRef]
- Ameel, B.; T’Joen, C.; De Kerpel, K.; De Jaeger, P.; Huisseune, H.; Van Belleghem, M.; De Paepe, M. Thermodynamic analysis of energy storage with a liquid air Rankine cycle. Appl. Therm. Eng. 2013, 52, 130–140. [Google Scholar] [CrossRef]
- Khani, H.; Dadash Zadeh, M.R. Real-Time Optimal Dispatch and Economic Viability of Cryogenic Energy Storage Exploiting Arbitrage Opportunities in an Electricity Market. IEEE Trans. Smart Grid 2015, 6, 391–401. [Google Scholar] [CrossRef]
- Morgan, R.; Nelmes, S.; Gibson, E.; Brett, G. Liquid air energy storage—Analysis and first results from a pilot scale demonstration plant. Appl. Energy 2015, 137, 845–853. [Google Scholar] [CrossRef]
- Li, Y.; Chen, H.; Zhang, X.; Tan, C.; Ding, Y. Renewable energy carriers: Hydrogen or liquid air/nitrogen? Appl. Therm. Eng. 2010, 30, 1985–1990. [Google Scholar] [CrossRef]
- Peng, X.; She, X.; Cong, L.; Zhang, T.; Li, C.; Li, Y.; Wang, L.; Tong, L.; Ding, Y. Thermodynamic study on the effect of cold and heat recovery on performance of liquid air energy storage. Appl. Energy 2018, 221, 86–99. [Google Scholar] [CrossRef]
- Guizzi, G.L.; Manno, M.; Tolomei, L.M.; Vitali, R.M. Thermodynamic analysis of a liquid air energy storage system. Energy 2015, 93, 1639–1647. [Google Scholar] [CrossRef]
- Borri, E.; Tafone, A.; Romagnoli, A.; Comodi, G. A review on liquid air energy storage: History, state of the art and recent developments. Renew. Sustain. Energy Rev. 2021, 137, 110572. [Google Scholar] [CrossRef]
- Turchi, C.S.; Boyd, M.; Kesseli, D.; Kurup, P.; Mehos, M.S.; Neises, T.W.; Sharan, P.; Wagner, M.J.; Wendelin, T. CSP Systems Analysis-Final Project Report; Technical Report; National Renewable Energy Lab. (NREL): Golden, CO, USA, 2019.
- Cost, C. Performance Characteristic Estimates for Utility Scale Electric Power Generating Technologies; US Energy Information Administration, Sargent and Lundy: Washington, DC, USA, 2020. Available online: https://www.eia.gov/analysis/studies/powerplants/capitalcost/pdf/capital_cost_AEO2020.pdf (accessed on 31 January 2022).
- Agency, T.I.R.E. Concentrating Solar Power. Chem. Rev. 2015, 115, 12797–12838. [Google Scholar]
- European Solar Thermal Electricity Association. The Value of Solar Thermal Electricity Cost vs. Value Approach; Technical Report; 2016; Available online: https://www.estelasolar.org/Docs/2016_ESTELA_STE-CSP_Value_Final.pdf (accessed on 5 February 2022).
- Nahhas, T.; Py, X.; Sadiki, N. Experimental investigation of basalt rocks as storage material for high-temperature concentrated solar power plants. Renew. Sustain. Energy Rev. 2019, 110, 226–235. [Google Scholar] [CrossRef]
- Madlener, R.; Latz, J. Economics of centralized and decentralized compressed air energy storage for enhanced grid integration of wind power. Appl. Energy 2013, 101, 299–309. [Google Scholar] [CrossRef]
- Frost & Sullivan. Highview-Power-Storage 2015 Global Large Scale Energy Storage Technology Innovation Award. 2015. Available online: https://www.highviewpower.com/wp-content/uploads/2018/04/Frost-Sullivan-Report-Highview-Power-Storage.pdf (accessed on 14 February 2022).
- Jülch, V. Comparison of electricity storage options using levelized cost of storage (LCOS) method. Appl. Energy 2016, 183, 1594–1606. [Google Scholar] [CrossRef]
- Brown, T.; Hörsch, J.; Schlachtberger, D. PyPSA: Python for Power System Analysis. J. Open Res. Softw. 2018, 6, 4. [Google Scholar] [CrossRef]
- fernbas. EU Energy Prices. 2021.
- Schröder, A.; Kunz, F.; Meiss, J.; Mendelevitch, R.; von Hirschhausen, C. Current and Prospective Costs of Electricity Generation Until 2050; Technical Report; 2013; Available online: https://www.econstor.eu/handle/10419/80348 (accessed on 29 November 2021).
- IEA. Coal 2020 Analysis and Forecast to 2025. 2020. Available online: https://iea.blob.core.windows.net/assets/00abf3d2-4599-4353-977c-8f80e9085420/Coal_2020.pdf (accessed on 24 November 2014).
- Sepulveda, N.A.; Jenkins, J.D.; Edington, A.; Mallapragada, D.S.; Lester, R.K. The design space for long-duration energy storage in decarbonized power systems. Nat. Energy 2021, 6, 506–516. [Google Scholar] [CrossRef]
Figure 1.
General classification of thermo-mechanical energy storage concepts. Similar classifications are also used in other published papers, for example, see [10]. Technologies demonstrated at a scale >1 MW are highlighted in solid colors.
Figure 1.
General classification of thermo-mechanical energy storage concepts. Similar classifications are also used in other published papers, for example, see [10]. Technologies demonstrated at a scale >1 MW are highlighted in solid colors.

Figure 2.
Generic schematic of a two-tank high-temperature heat storage system used for molten salt. In variations with one tank, the hot and cold storage are separated naturally by the temperature gradients.
Figure 2.
Generic schematic of a two-tank high-temperature heat storage system used for molten salt. In variations with one tank, the hot and cold storage are separated naturally by the temperature gradients.

Figure 3.
Schematics of Stiesdal’s Grid Scale technology. Green is the charge cycle; pink is the discharge cycle. The compressors are blue, and the turbines are red. The schematic is verified with Stiesdal storage technologies.
Figure 3.
Schematics of Stiesdal’s Grid Scale technology. Green is the charge cycle; pink is the discharge cycle. The compressors are blue, and the turbines are red. The schematic is verified with Stiesdal storage technologies.

Figure 4.
Working principle of two large CAES facilities in operation today. Figures from [68].
Figure 4.
Working principle of two large CAES facilities in operation today. Figures from [68].

Figure 5.
Simplified diagram of Highview Power’s liquid air storage system. Source: Highview Power®.
Figure 5.
Simplified diagram of Highview Power’s liquid air storage system. Source: Highview Power®.

Figure 6.
Levelized cost of storage (LCOS) of various storage technologies. LCOS is plotted as a function of discharge duration and cycles per year. A cycle consists of equal charge and discharge duration and variable storage periods. The cost of electricity for charging storage is 0 $/MWh. Whitespaces in the left side of each sub-figure show the infeasible cycles where the self-discharge during the storage period is greater than the discharged energy. Whitespaces in the right are the regions where the cycle time is less than 3 times the discharge duration. See Table 1 and Table 2 for technology input parameters and Section 2 for detailed assumptions.

Figure 7.
Energy storage system models analyzed in this review.

Figure 8.
Investment cost curves for storage technologies to be market competitive. The curves assume storage technology creates profit only by load shifting for a duration longer than an hour. The analysis is based on the wholesale electricity market of 2020 in Denmark.
Figure 8.
Investment cost curves for storage technologies to be market competitive. The curves assume storage technology creates profit only by load shifting for a duration longer than an hour. The analysis is based on the wholesale electricity market of 2020 in Denmark.

Figure 9.
Investment cost curves for storage technologies to be economically viable in an off-grid energy system. Low, intermediate, and high are alternative-fuel costs fixed at 60 USD/MWh, 100 USD/MWh, and 140 USD/MWh. Round-trip efficiencies of each technology are extracted from Table 1. For the marginal cost of alternative fuel of 100 USD/MWh, blue hatched shades show the cost ranges for ±10% round-trip efficiencies except for the TES system where the range denotes ±5% round-trip efficiencies. The region below the cost curves represents the costs at which the technology is feasible; this is highlighted in pink shades for a marginal cost of alternative fuel of 100 USD/MWh. The green error bar shows the uncertainty range of cost for each technology.

Figure 10.
Percentage reduction in power component cost from the baseline case. Baseline case is a generic TMES with round-trip efficiency of 60% operating in an off-grid energy system at a marginal cost of alternative fuel of 100 USD/MWh. The efficiency ratio is changed by fixing the cost ratio at 0.5. The cost ratio is changed by fixing the efficiency ratio at 1.4. A negative y-axis signifies the actual increase in the power component cost.


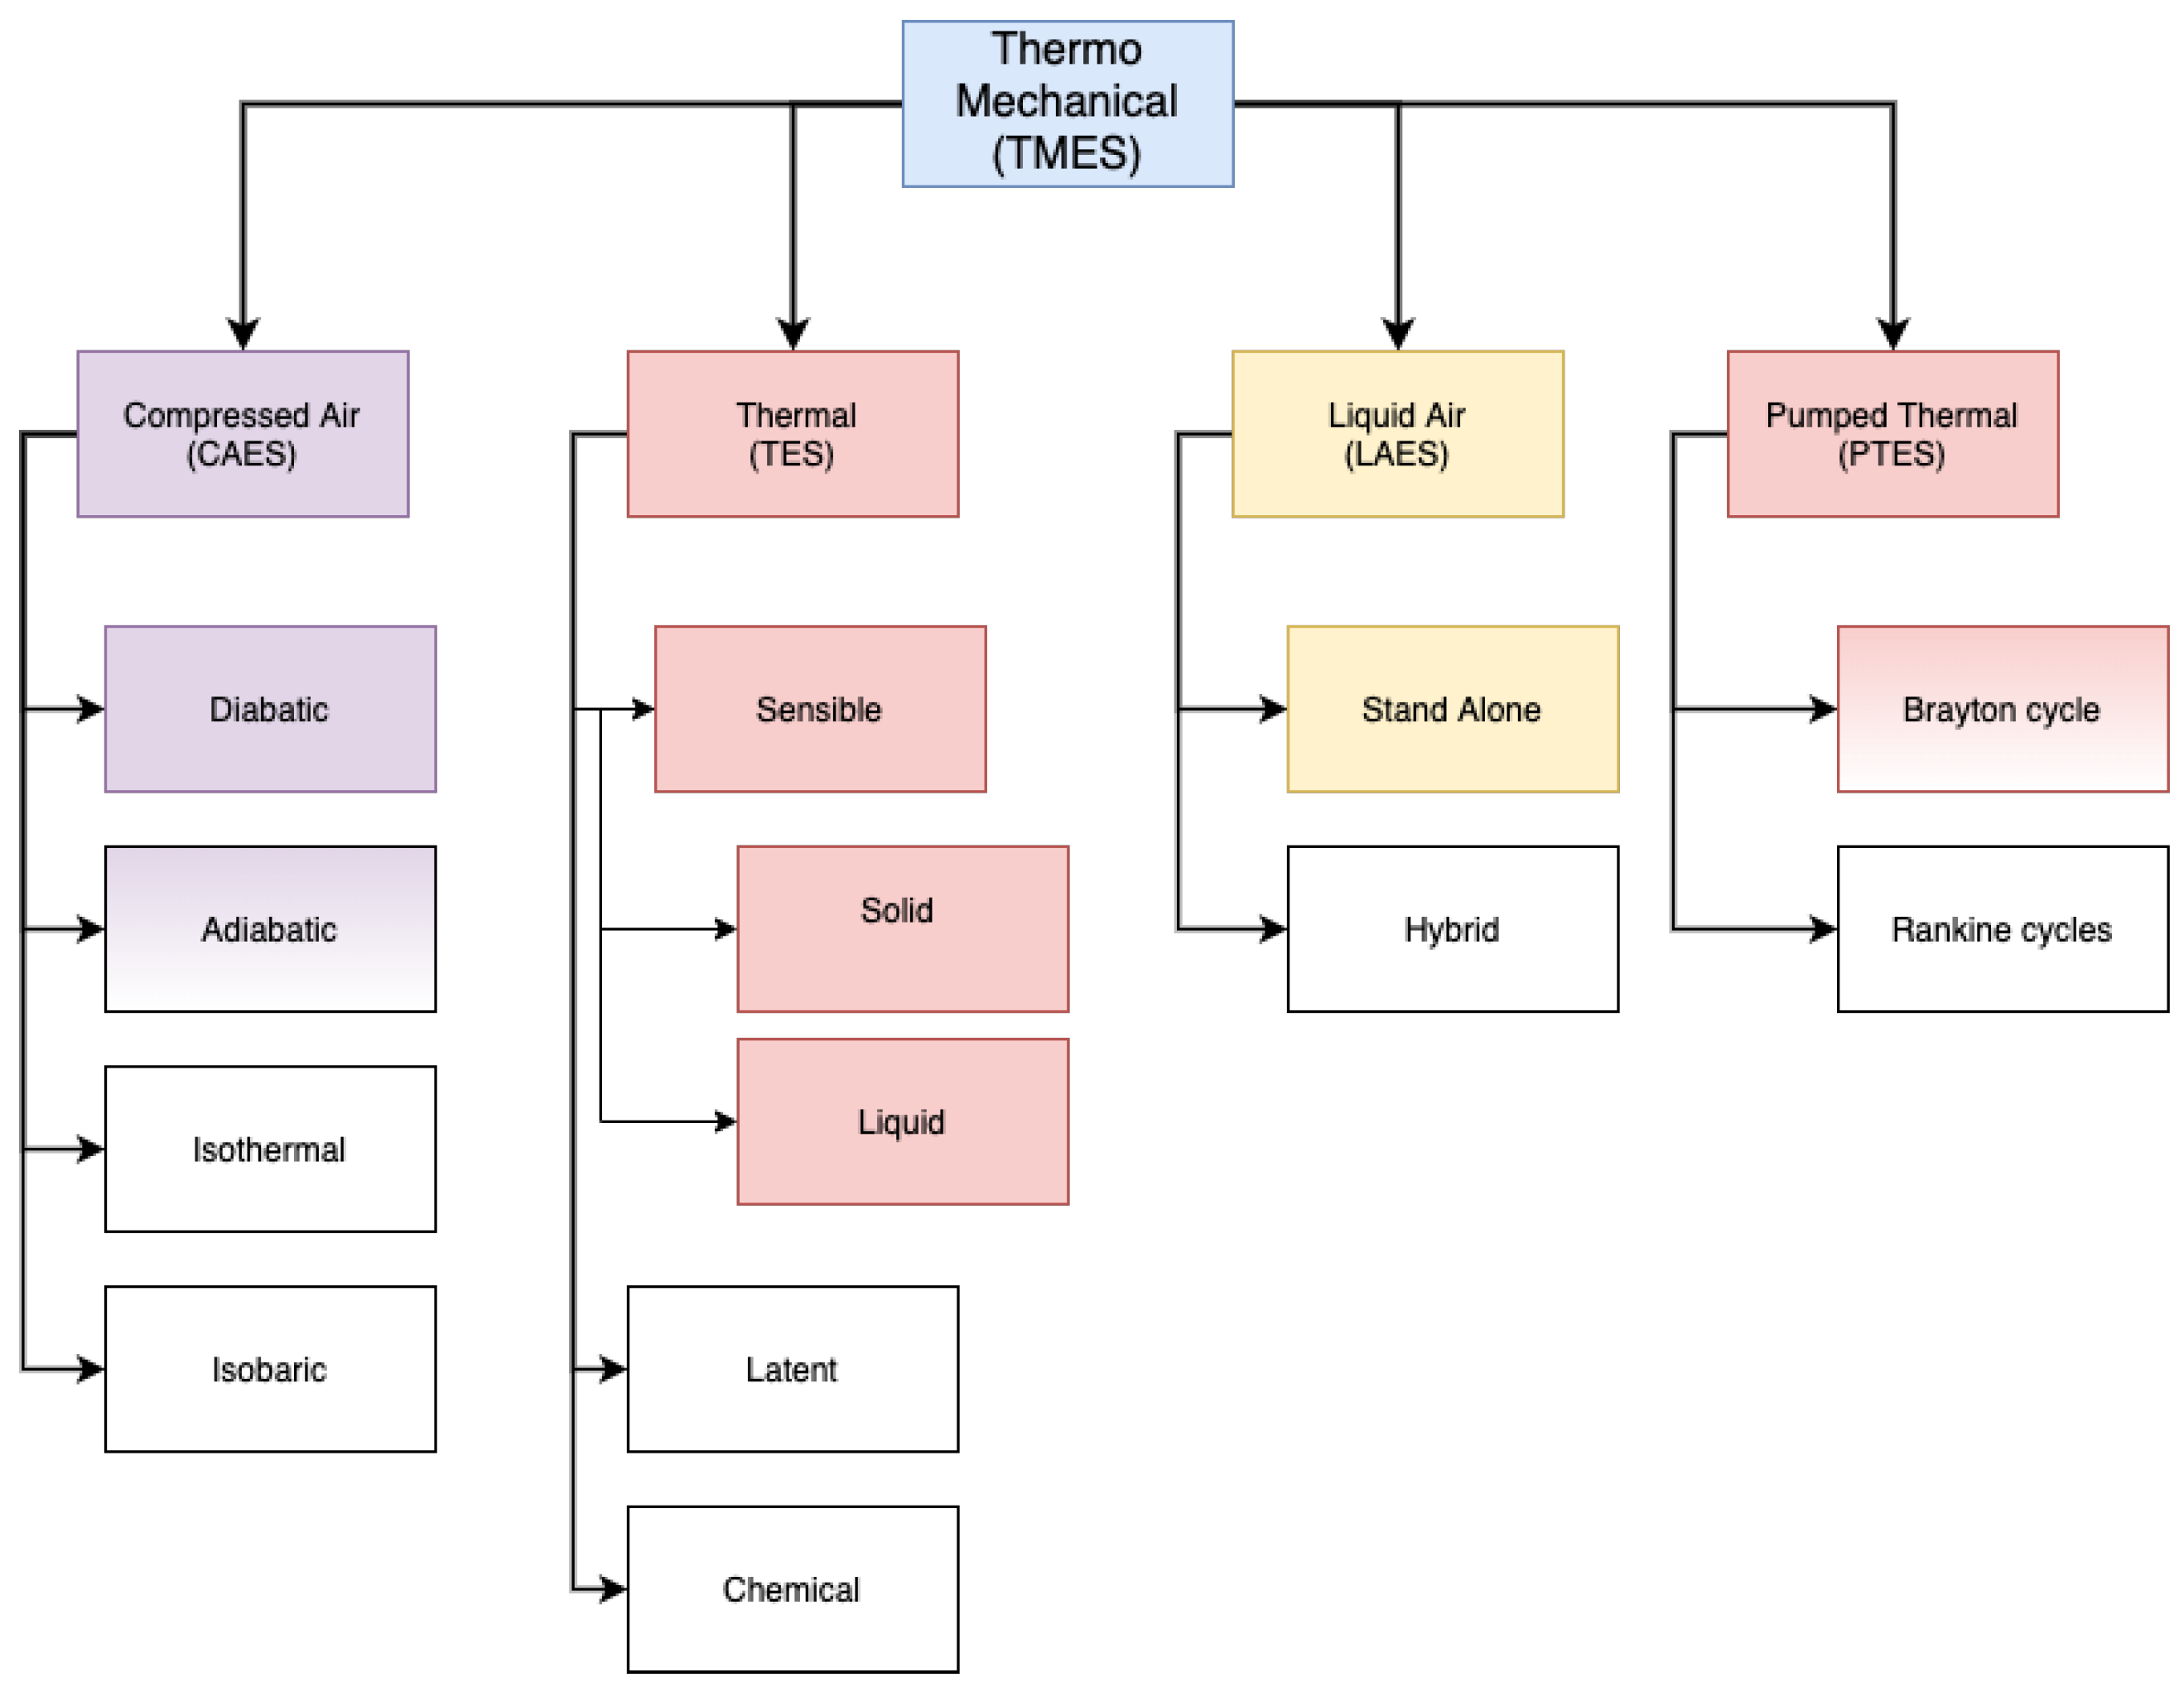
Table 1.
Best estimates for techno-economical data for emerging thermo-mechanical energy storage technologies for 2025. See Section 2 for discussion on data collection and the associated uncertainty.
Table 1.
Best estimates for techno-economical data for emerging thermo-mechanical energy storage technologies for 2025. See Section 2 for discussion on data collection and the associated uncertainty.
| Name | Unit | TES (Molten Salt) | PTES (Rock) | CAES (Adiabatic) | LAES (Standalone) |
|---|---|---|---|---|---|
| Investment cost—power # | $/kW | 1341 | 1300 | 1200 | 1700 a |
| Investment cost—energy | $/kWh | 18.30 a | 20 | 27 | 32 |
| Operation cost—power | $/kW-yr | 10 | 5 | 4 | 6 |
| Operation cost—energy ## | $/MWh | 3.5 | 5 | 5 | 4 |
| Cost ratio—power * | - | 0.1 | 0.5 | 0.5 | 1 |
| Round-trip efficiency ** | - | 0.42 | 0.55 | 0.6 | 0.5 |
| Discharge efficiency | - | 0.43 | 0.25 | 0.65 | 0.65 |
| Efficiency ratio *** | - | 2.3 | 8.8 | 1.42 | 1.18 |
| Self-discharge | /day | 0.01 | 0.01 | 0.01 | 0.005 x |
| Lifetime | cycles | 30,000 | 16,250 y | 16,250 | 16,250 y |
| Shelf life | years | 30 | 30 y | 30 | 25 |
| Energy density | kWhm−3 | 200 | 250 | 15 | 177 |
| References | - | [104,105,106,107] | [108] | [11,58,97,107,109] | [100,110] |
[#] Power capacity cost per kW discharged electricity when the charge and discharge times are equal. [##] Energy capacity cost per kWh thermal or mechanical. [*] Cost ratio is defined as: . [**] These are the expected round-trip efficiencies for a real system that can be built by 2025. [***] The efficiency ratio is defined as: . [a] The current power cost of LAES, according to High-view Power, is in the range of 2000–2200 $/kW. This value is based on their projection of 1500 $/kW for 2030. [x] Same as hydrogen. [y] Same as CAES. For LAES, investment cost energy is estimated as a combination of PTES based on rocks and Hydrogen storage in cylinders. For adiabatic CAES, investment cost energy is a summation of diabetic CAES and TES based on rocks.
Table 2.
Best estimates for techno-economical data for comparable technologies for 2025. All data are obtained from Ref. [11] unless stated otherwise.
Table 2.
Best estimates for techno-economical data for comparable technologies for 2025. All data are obtained from Ref. [11] unless stated otherwise.
| Name | Unit | Pumped Hydro Storage | Battery (Lithium-Ion) * | Hydrogen ** |
|---|---|---|---|---|
| Investment cost—power | $/kW | 1129 | 156 | 2741 |
| Investment cost—energy | $/kWh | 80 | 168 | 15 |
| Operation cost—power | $/kW-yr | 8 | 10 | 24 |
| Cost ratio—power | $- | - | 1 | 1 |
| Operation cost—energy | $/MWh | 1 | 3 | 1 |
| Round-trip efficiency | 0.78 | 0.9 | 0.4 | |
| Discharge efficiency | - | 0.948 | 0.57 | |
| Efficiency ratio | - | - | 1 | 1.2 |
| Self-discharge | /day | 0 | 0.01 | 0.005 |
| Lifetime | cycles | 33,250 | 3250 | 20,000 |
| Shelf life | years | 55 | 13 | 18 |
[*] Lithium-ion batteries are the fastest-growing energy storage technology in the market. The market price for electric vehicle batteries has fallen well below the projected price given by [11]. However, the price of stationary storage batteries differs from that of electric vehicle batteries. The capital cost included here is based on [86], who considered the difference between electric vehicles and stationary storage batteries. The cost quoted here still has a high level of uncertainty. [**] The parameters are for hydrogen production via electrolysis, power generation via combined cycle, and hydrogen storage in underground pipes/tanks and obtained from [86]. These cost data reported by [86] are about 20% lower than the costs projected by [11]. The power generation via stationary proton exchange membrane fuel cells could be substantially cheaper in the future, which may bring the Investment cost power down to <1500 $/kW [86]. The cost of hydrogen storage, thus, has a high level of uncertainty.
Publisher’s Note: MDPI stays neutral with regard to jurisdictional claims in published maps and institutional affiliations. |
© 2022 by the authors. Licensee MDPI, Basel, Switzerland. This article is an open access article distributed under the terms and conditions of the Creative Commons Attribution (CC BY) license (https://creativecommons.org/licenses/by/4.0/).
Share and Cite
MDPI and ACS Style
Gautam, K.R.; Andresen, G.B.; Victoria, M. Review and Techno-Economic Analysis of Emerging Thermo-Mechanical Energy Storage Technologies. Energies 2022, 15, 6328. https://doi.org/10.3390/en15176328
AMA Style
Gautam KR, Andresen GB, Victoria M. Review and Techno-Economic Analysis of Emerging Thermo-Mechanical Energy Storage Technologies. Energies. 2022; 15(17):6328. https://doi.org/10.3390/en15176328
Chicago/Turabian StyleGautam, Khem Raj, Gorm Brunn Andresen, and Marta Victoria. 2022. "Review and Techno-Economic Analysis of Emerging Thermo-Mechanical Energy Storage Technologies" Energies 15, no. 17: 6328. https://doi.org/10.3390/en15176328
Note that from the first issue of 2016, this journal uses article numbers instead of page numbers. See further details here.