
Analysis of the Impact of Propanol-Gasoline Blends on Lubricant Oil Degradation and Spark-Ignition Engine Characteristics

 ,
,  ,
,  , and
, and
Abstract
:1. Introduction
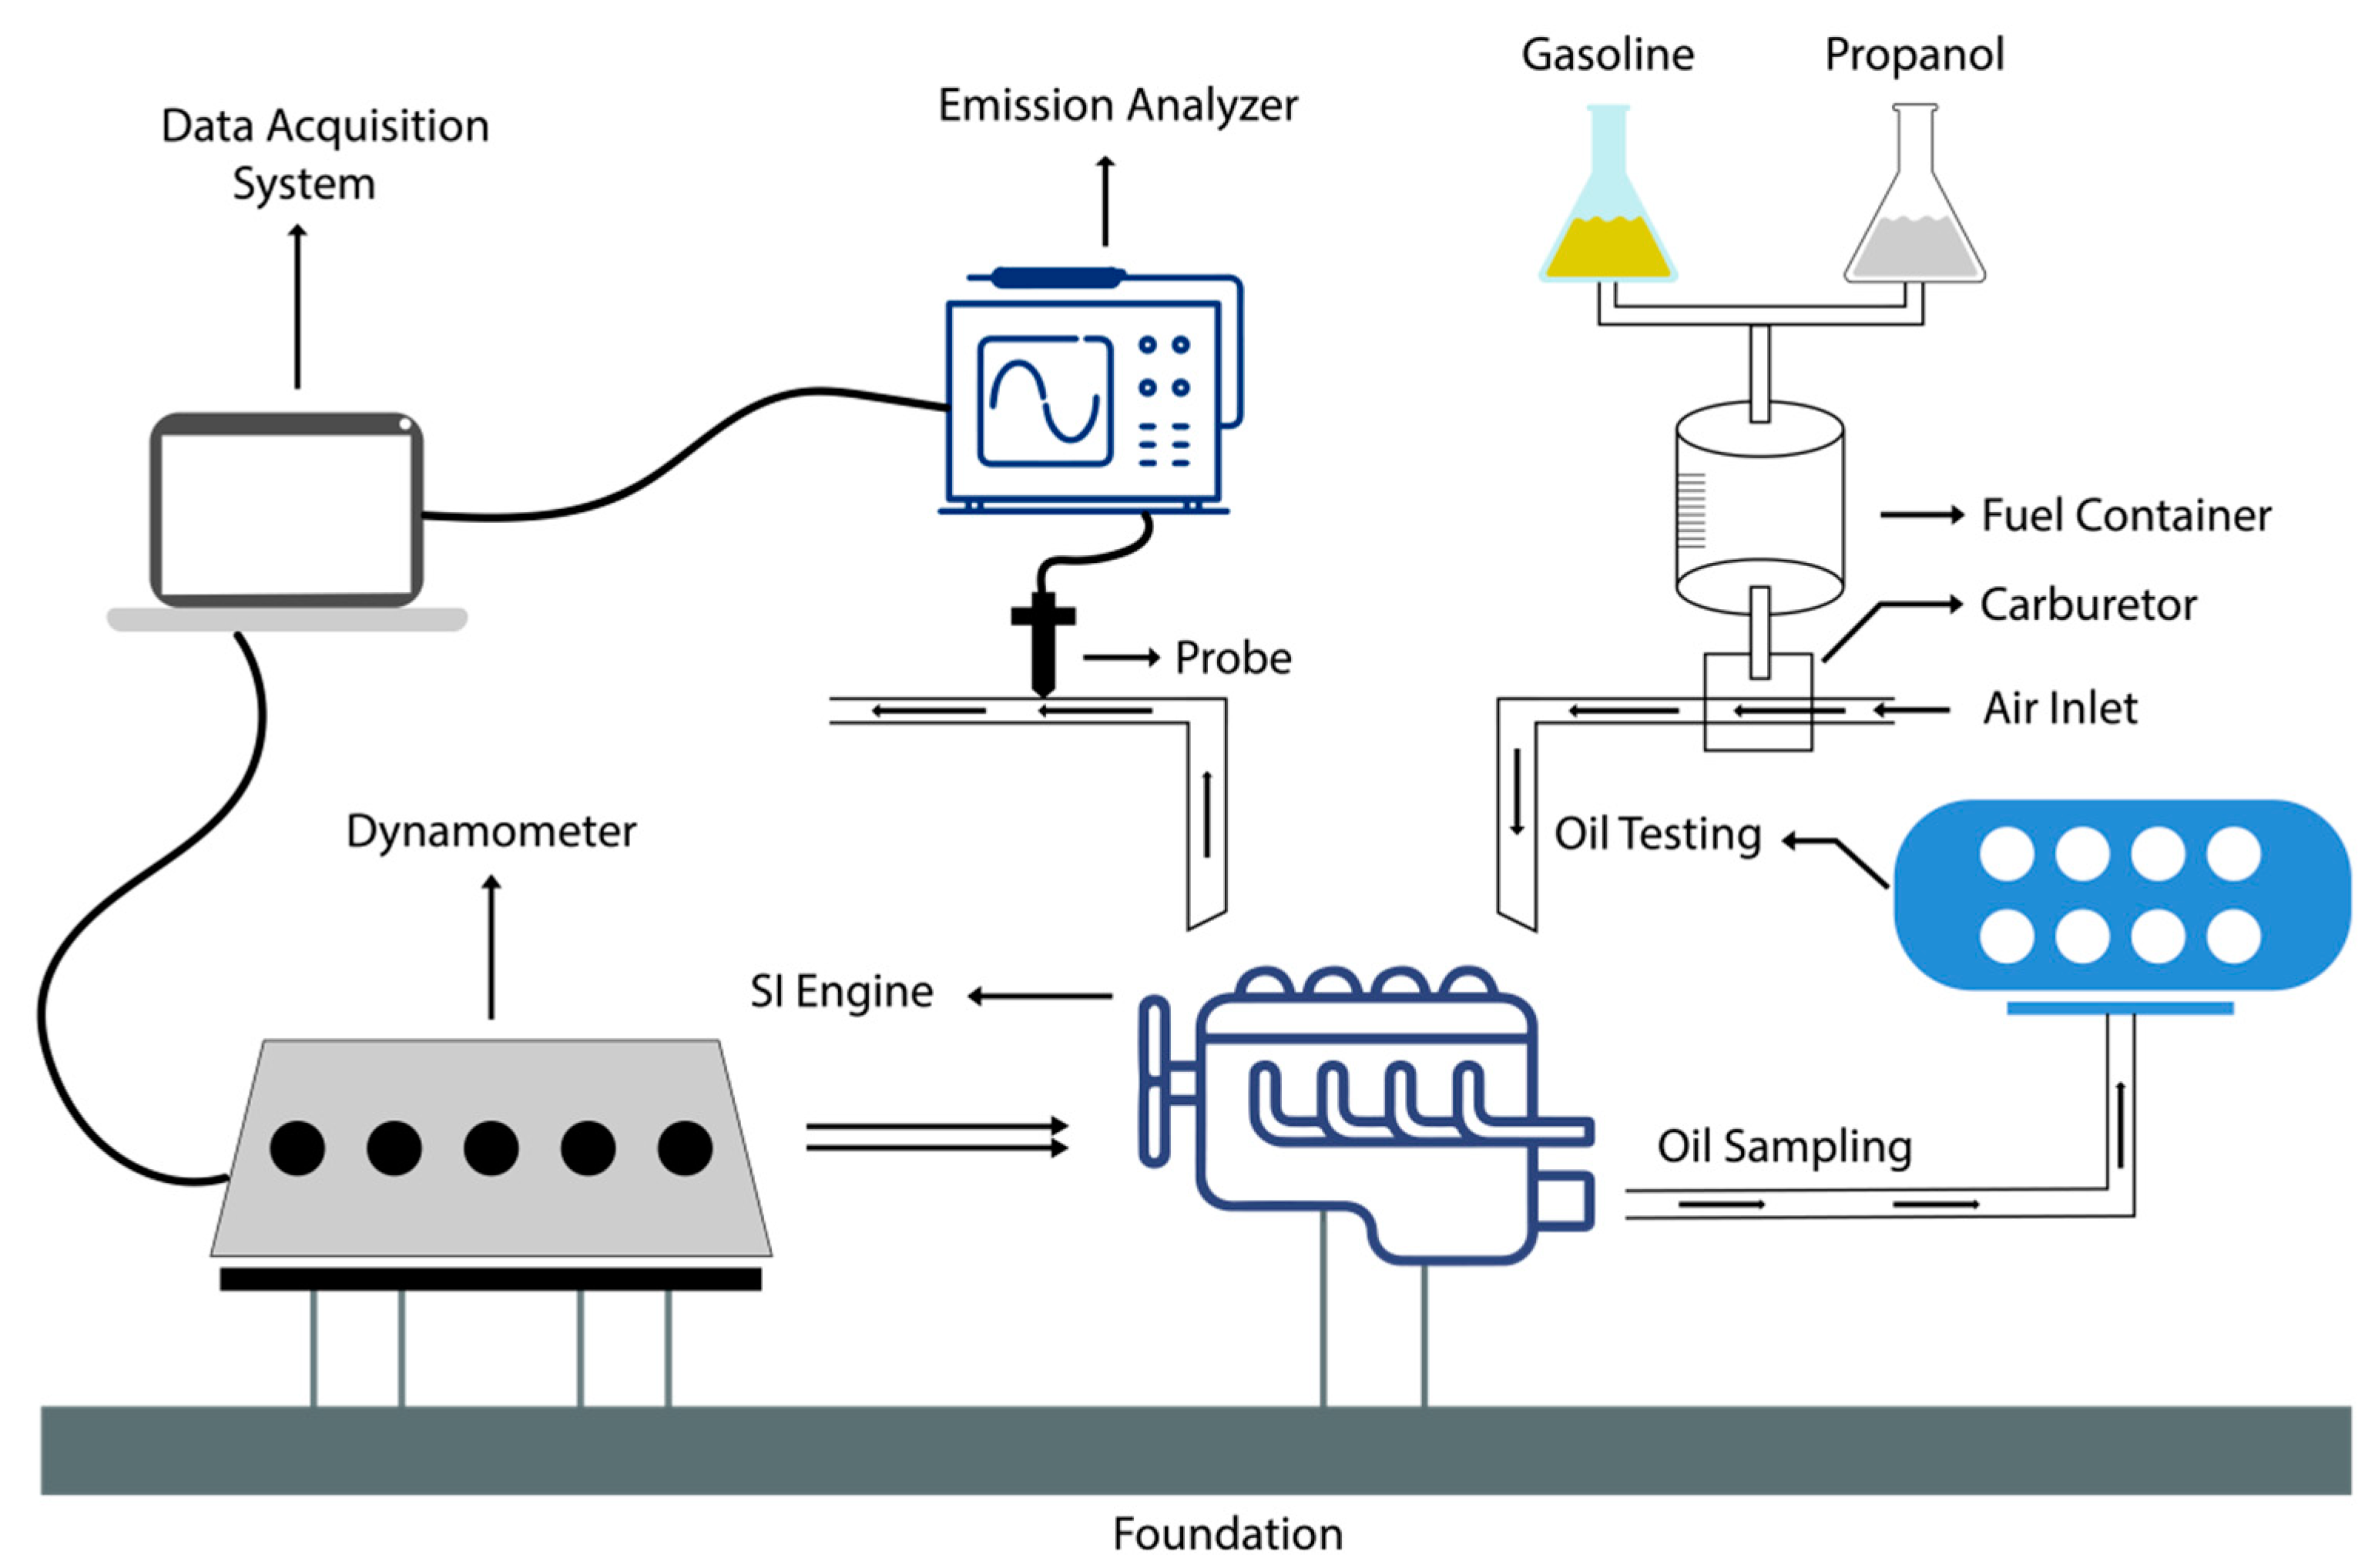
2. Methodology
3. Results and Discussion
3.1. Assessment of Lubricating Oil Condition
3.2. Impact on Engine Performance
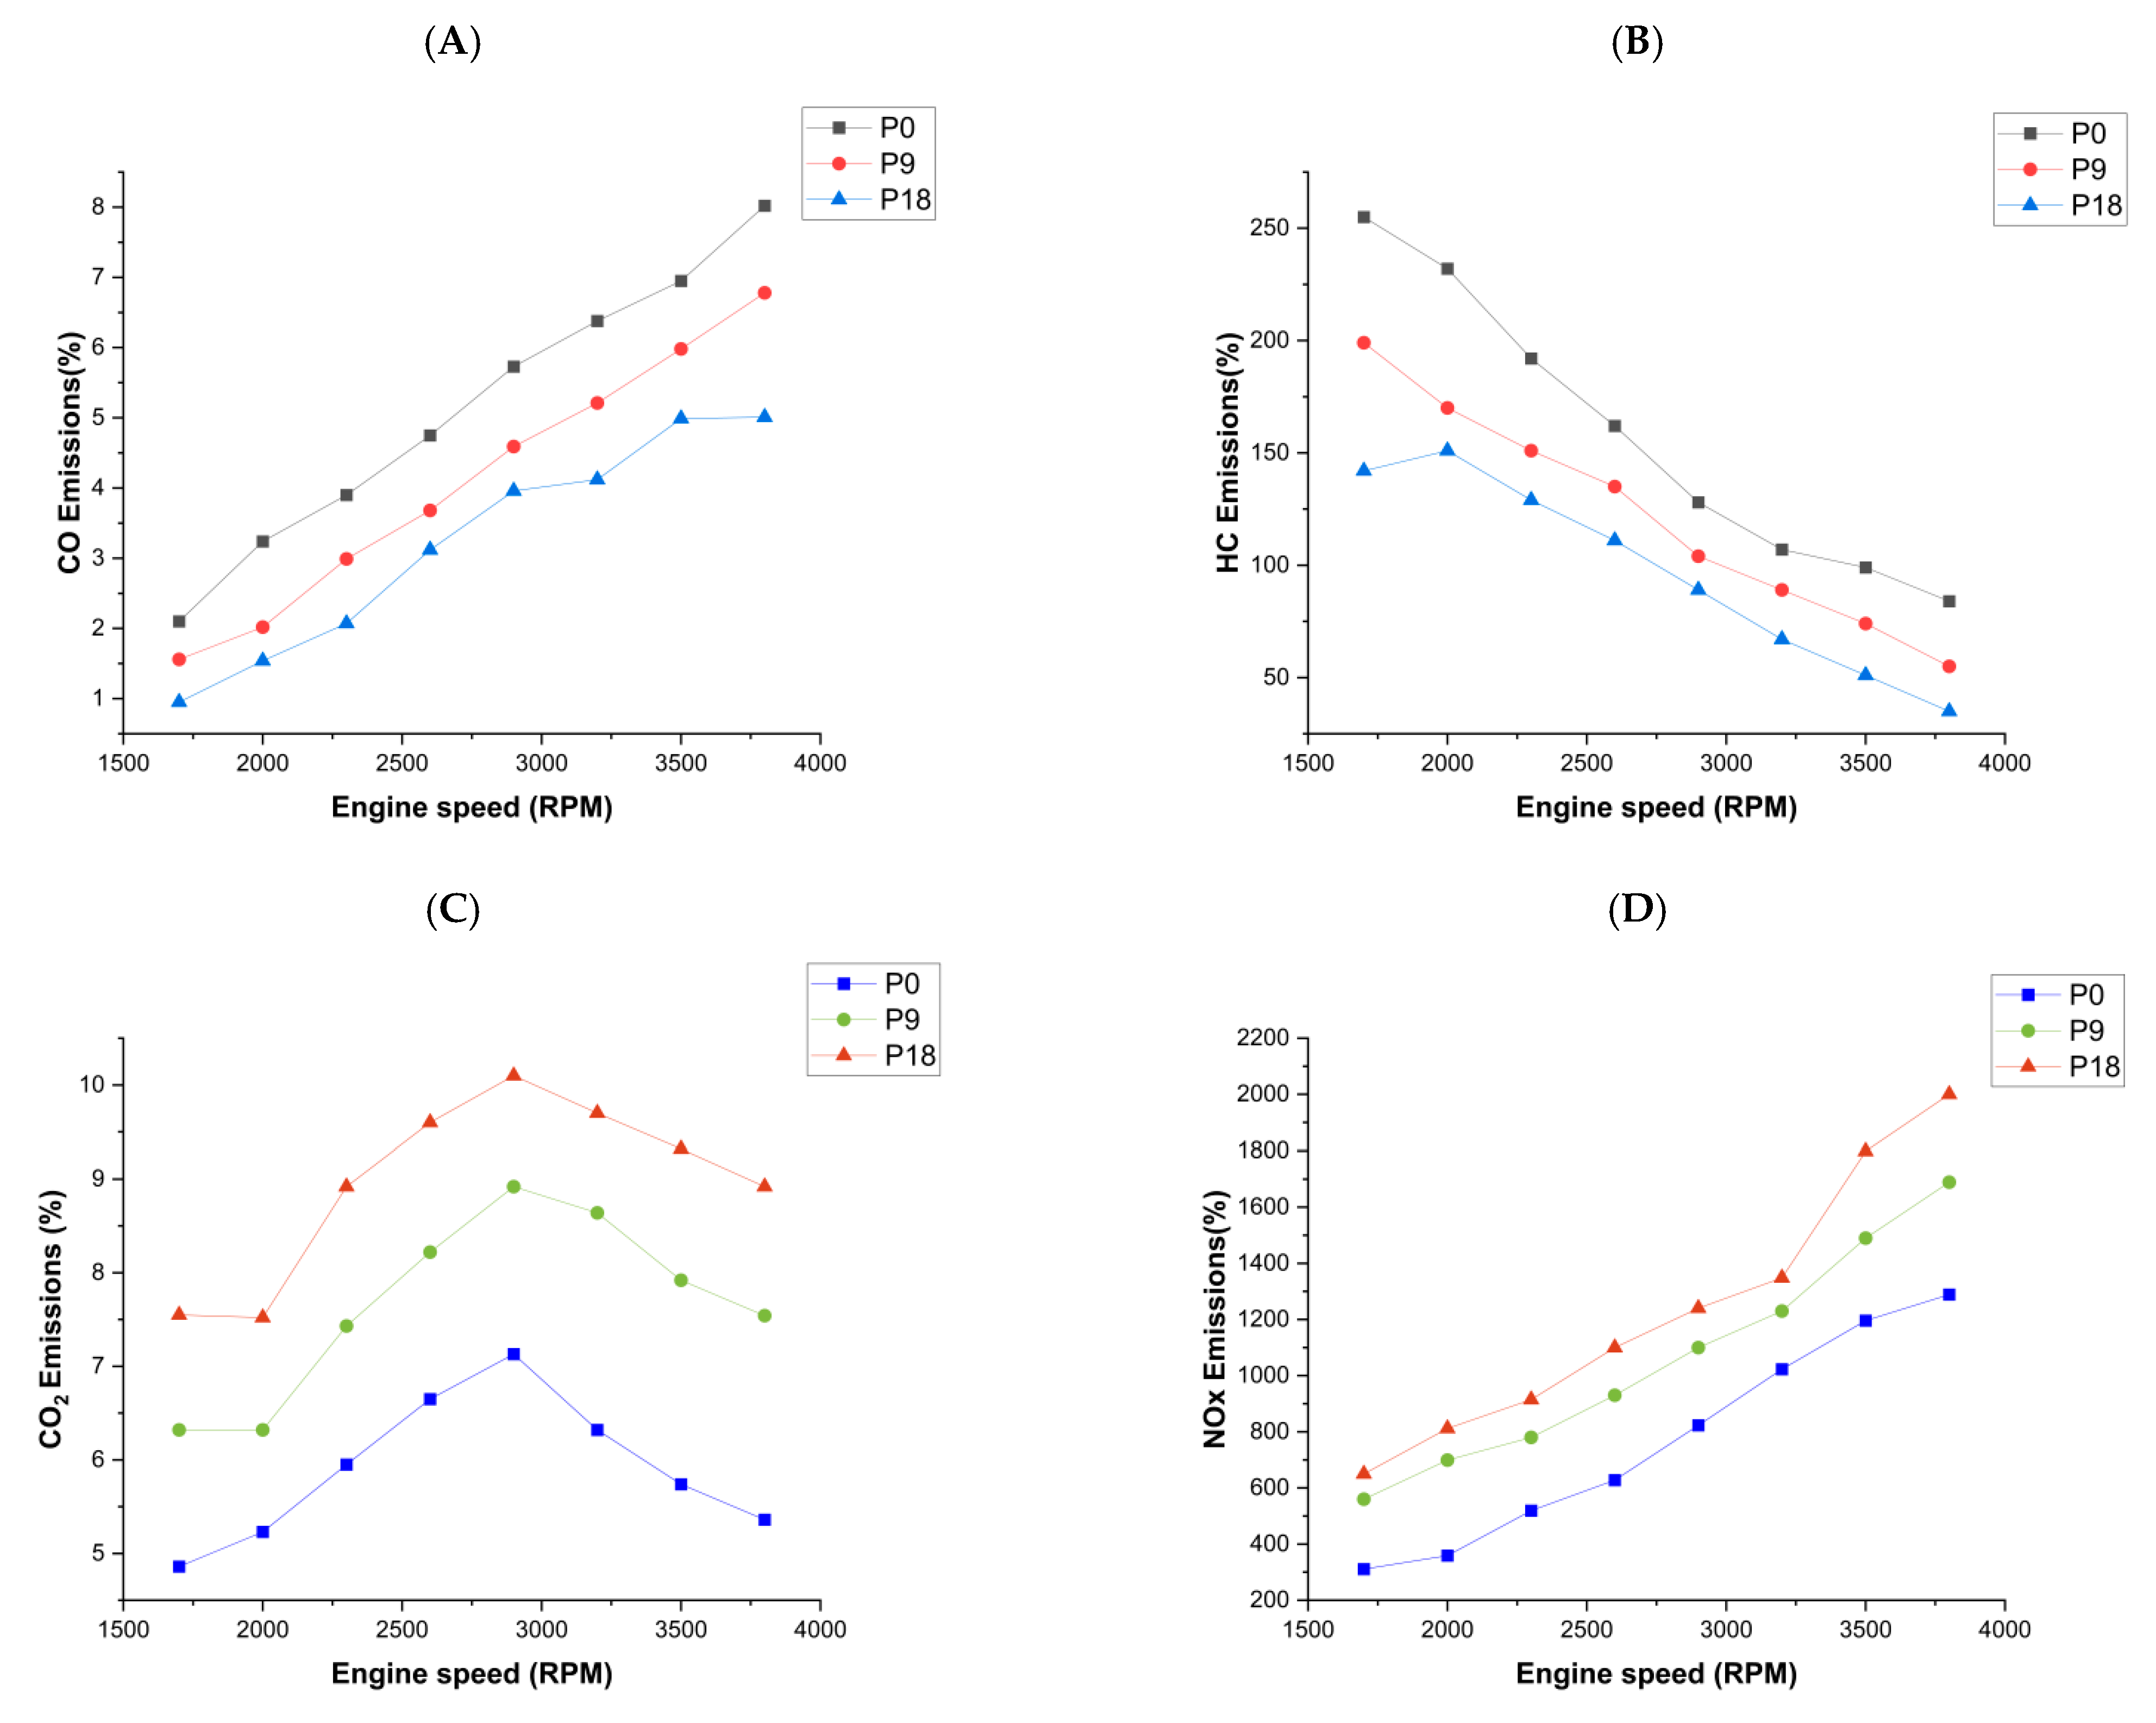
3.3. Environmental Impact of Propanol-Enriched Gasoline
4. Conclusions
- i.
- Compared to fresh lubricating oil, the kinematic viscosity of P9 lube oil exhibited the highest drop, i.e., 36.2% at 40 °C. At the same time, the flash point temperature showed the highest drop, i.e., 27.25% for P0. In the P18 lubricating oil, the highest TBN was also reduced by 29.9%. While using P18, higher concentrations of metal particles were found in the lubricating oil, i.e., (Fe (27 PPM), Al (11 PPM), and Cu (14 PPM).
- ii.
- Compared to fresh lubricating oil, zinc additives were decreased by 18%, 11%, and 7% for P18, P9, and P0, respectively; calcium additives were lowered by 15%, 10%, and 5%, respectively.
- iii.
- The engine brake power (BP), brake thermal efficiency (BTE), and engine torque enhanced as the fuel blend’s propanol ratio was elevated. The most significant values for BP and BTE were found in P18, which were 37.5% and 18.4% higher than pure gasoline (P0), respectively.
- iv.
- Blended fuels had the lowest HC and CO emissions. In comparison with gasoline, the typical reductions in emissions for P9 and P18 were CO at 22.1% and 40.1%, respectively, and HC at 22.8% and 39.8%, respectively. CO2 and NOx emissions were enhanced in the case of propanol–gasoline mixtures. The average increase in CO2 emissions for both blended fuels were 30.0% and 52.2%, respectively, whereas the increase in NOx emissions for P9 and P18 were 47.8% and 71.8%, respectively, when compared with gasoline levels.
Author Contributions
Funding
Institutional Review Board Statement
Informed Consent Statement
Data Availability Statement
Conflicts of Interest
References
- Pugazhendhi, A.; Mathimani, T.; Varjani, S.; Rene, E.R.; Kumar, G.; Kim, S.H.; Ponnusamy, V.K.; Yoon, J.J. Biobutanol as a promising liquid fuel for the future—Recent updates and perspectives. Fuel 2019, 253, 637–646. [Google Scholar] [CrossRef]
- Malik, M.A.I.; Usman, M.; Bashir, R.; Hanif, M.S.; Zubair, S.W.H. Use of methanol-gasoline blend: A comparison of SI engine characteristics and lubricant oil condition. J. Chin. Inst. Eng. 2022, 45, 402–412. [Google Scholar] [CrossRef]
- Khuong, L.S.; Masjuki, H.H.; Zulkifli, N.W.M.; Mohamad, E.N.; Kalam, M.A.; Alabdulkarem, A.; Arslan, A.; Mosarof, M.H.; Syahir, A.Z.; Jamshaid, M. Effect of gasoline–bioethanol blends on the properties and lubrication characteristics of commercial engine oil. RSC Adv. 2017, 7, 15005–15019. [Google Scholar] [CrossRef] [Green Version]
- Ahmed, W.; Usman, M. A Comparison of Performance, Emissions, and Lube Oil Deterioration for Gasoline–Ethanol Fuel. Processes 2022, 10, 876. [Google Scholar] [CrossRef]
- Cesur, I.; Ayhan, V.; Parlak, A.; Savas, Ö.; Aydin, Z. The Effects of Different Fuels on Wear between Piston Ring. Adv. Mech. Eng. 2014, 6, 503212. [Google Scholar] [CrossRef]
- Yadav, G.; Tiwari, S.; Jain, M.L. Tribological analysis of extreme pressure and anti-wear properties of engine. Mater. Proc. 2018, 5, 248–253. [Google Scholar]
- Fitch, J. Clean Oil Reduces Engine Fuel Consumption; Noria Corporation: Tulsa, OK, USA, 2020; Available online: https://www.machinerylubrication.com/Read/401/oil-engine-fuel-consumption (accessed on 27 June 2022).
- Kurre, K.S.; Garg, R.; Pandey, S. A review of biofuel generated contamination, engine oil degradation and engine wear. Biofuels 2017, 8, 273–280. [Google Scholar] [CrossRef]
- Usman, M.; Saqib, S.; Zubair, S.W.H.; Irshad, M.; Kazmi, A.H.; Noor, A.; Zaman, H.U.; Nasir, Z.; Malik, M.A.I. Experimental assessment of regenerated lube oil in spark-ignition engine for sustainable environment. Adv. Mech. Eng. 2020, 12, 1687814020940451. [Google Scholar] [CrossRef]
- Usman, M.; Jamil, M.; Riaz, F.; Hussain, H.; Hussain, G.; Shah, M.; Qyyum, M.; Salman, C.; Lee, M. Refining and Reuse of Waste Lube Oil in SI Engines: A Novel Approach for a Sustainable Environment. Energies 2021, 14, 2937. [Google Scholar] [CrossRef]
- Kaisan, M.U.; Yusuf, L.O.; Ibrahim, I.U.; Abubakar, S.; Narayan, S. Effects of Propanol and Camphor Blended with Gasoline Fuel on the Performance and Emissions of a Spark Ignition Engine. ACS Omega 2020, 5, 26454–26462. [Google Scholar] [CrossRef]
- Mourad, M.; Mahmoud, K. Investigation into SI engine performance characteristics and emissions fuelled. Renew. Energy 2019, 143, 762–771. [Google Scholar] [CrossRef]
- Keskin, A.; Gürü, M. The Effects of Ethanol and Propanol Additions into Unleaded Gasoline on Exhaust and Noise Emissions of a Spark Ignition Engine. Energy Sources Part A Recovery Util. Environ. Eff. 2011, 33, 2194–2205. [Google Scholar] [CrossRef]
- Hussain, S.K.A.; Usman, M.; Umer, J.; Farooq, M.; Noor, F.; Anjum, R. A novel analysis of n-butanol–gasoline blends impact on spark ignition engine characteristics and lubricant oil degradation. Energy Sources Part A Recovery Util. Environ. Eff. 2022. [Google Scholar] [CrossRef]
- Malik, M.A.I.; Usman, M.; Hayat, N.; Zubair, S.W.H.; Bashir, R.; Ahmed, E. Experimental evaluation of methanol-gasoline fuel blend on performance, emissions and lubricant oil deterioration in SI engine. Adv. Mech. Eng. 2021, 13, 16878140211025213. [Google Scholar] [CrossRef]
- Stepin, Z.; Urzedowska, W.; Oleksiak, S.; Czerwinski, J. Research on emissions and engine lube oil deterioration of diesel engines with biofuels (RME). SAE. Int. J. Fuels Lubr. 2011, 4, 125–138. [Google Scholar] [CrossRef]
- Usman, M.; Naveed, A.; Saqib, S.; Hussain, J.; Tariq, M.K. Comparative assessment of lube oil, emission and performance of SI engine fueled with two different grades octane numbers. J. Chin. Inst. Eng. 2020, 43, 734–741. [Google Scholar] [CrossRef]
- Chen, Y.; Ma, J.; Han, B.; Zhang, P.; Hua, H.; Chen, H.; Su, X. Emissions of automobiles fueled with alternative fuels based on engine technology: A review. J. Traffic Transp. Eng. 2018, 5, 318–334. [Google Scholar] [CrossRef]
- Usman, M.; Saleem, M.W.; Saqib, S.; Umer, J.; Naveed, A.; Hassan, Z.U. SI engine performance, lubricant oil deterioration, and emission: A comparison of liquid and gaseous fuel. Adv. Mech. Eng. 2014, 12, 1687814020930451. [Google Scholar] [CrossRef]
- Wilson, R.W.; Lyon, S.B. 2.26—Corrosion in Lubricants/Fuels. In Shreir’s Corrosion; Cottis, B., Graham, M., Lindsay, R., Lyon, S., Richardson, T., Scantlebury, D., Stott, H., Eds.; Elsevier: Oxford, UK, 2010; pp. 1299–1307. [Google Scholar]
- Abdulkareem, A.S.; Afolabi, A.S.; Ahanonu, S.O.; Mokrani, T. Effect of Treatment Methods on Used Lubricating Oil for Recycling Purposes. Energy Sources Part A Recovery Util. Environ. Eff. 2014, 36, 966–973. [Google Scholar] [CrossRef]
- Haseeb, A.; Fazal, M.; Jahirul, M.; Masjuki, H. Compatibility of automotive materials in biodiesel: A review. Fuel 2011, 90, 922–931. [Google Scholar] [CrossRef]
- Usman, M.; Hayat, N.; Bhutta, M.M.A. SI Engine Fueled with Gasoline, CNG and CNG-HHO Blend: Comparative Evaluation of Performance, Emission and Lubrication Oil Deterioration. J. Therm. Sci. 2021, 30, 1199–1211. [Google Scholar] [CrossRef]
- Fagundez, J.; Golke, D.; Martins, M.; Salau, N. An investigation on performance and combustion characteristics of pure n-butanol and a blend of n-butanol/ethanol as fuels in a spark ignition engine. Energy 2019, 176, 521–530. [Google Scholar] [CrossRef]
- Schifter, I.; Diaz, L.; Gómez, J.P.; Gonzalez, U. Combustion characterization in a single cylinder engine with mid-level hydrated ethanol–gasoline blended fuels. Fuel 2013, 103, 292–298. [Google Scholar] [CrossRef]
- Masum, B.M.; Kalam, M.A.; Palash, S.M.; Habibullah, M. Effect of alcohol–gasoline blends optimization on fuel properties, performance and emissions of a SI engine. J. Clean. Prod. 2015, 86, 230–237. [Google Scholar] [CrossRef] [Green Version]
- Tian, Z.; Zhen, X.; Wang, Y.; Liu, D.; Li, X. Combustion and emission characteristics of n-butanol-gasoline blends in SI direct injection gasoline engine. Renew. Energy 2020, 146, 267–279. [Google Scholar] [CrossRef]
- Balki, M.K.; Sayin, C.; Canakci, M. The effect of different alcohol fuels on the performance, emission and combustion characteristics of a gasoline engine. Fuel 2014, 115, 901–906. [Google Scholar] [CrossRef]
- Veza, I.; Said, M.F.M.; Latiff, Z.A. Progress of acetone-butanol-ethanol (ABE) as biofuel in gasoline and diesel engine: A review. Fuel Processing Technol. 2019, 196, 106179. [Google Scholar] [CrossRef]
- Masum, B.M.; Masjuki, H.H.; Kalam, M.A.; Palash, S.M.; Fattah, I.M.R. Performance and emission analysis of a multi cylinder gasoline engine operating at different alcohol–gasoline blends. RSC Adv. 2014, 4, 27898–27904. [Google Scholar] [CrossRef]
- Masum, B.M.; Kalam, M.A.; Masjuki, H.H.; Rahman, S.M.A.; Daggig, E.E. Impact of denatured anhydrous ethanol–gasoline fuel blends on a spark-ignition engine. RSC Adv. 2014, 4, 51220–51227. [Google Scholar] [CrossRef]
- Wu, G.; Wu, D.; Li, Y.; Meng, L. Effect of Acetone-n-Butanol-Ethanol (ABE) as an Oxygenate on Combustion, Performance, and Emission Characteristics of a Spark Ignition Engine. J. Chem. 2020, 2020, 7468651. [Google Scholar] [CrossRef] [Green Version]


| Parameters | Test Standards | Units | Fresh Oil (20 W–40) |
|---|---|---|---|
| Kinematic viscosity at 100 °C | ASTM D445 | cSt | 17.6 |
| Kinematic viscosity at 40 °C | ASTM D445 | cSt | 159.1 |
| TBN | ASTM D4739 | mg KOH/g | 8.7 |
| Flash temperature | ASTM D92 | °C | 162 |
| Property of Fuel | Units | Test Methods | Gasoline | Propanol |
|---|---|---|---|---|
| Calorific Value | MJ/kg | ASTM D240 | 45.0 | 33.6 |
| Density | kg/m3 | ASTM D4052 | 748 | 803 |
| RON | - | ASTM D2699 | 95 | 118 |
| Oxygen Content | % By mass | ASTM D5622 | 0 | 27.6 |
| Measured Quantity | P0 | P9 | P18 |
|---|---|---|---|
| CO | 0.389 | 0.455 | 0.484 |
| CO2 | 0.129 | 0.122 | 0.107 |
| HC | 0.405 | 0.408 | 0.446 |
| NOx | 0.487 | 0.372 | 0.382 |
Publisher’s Note: MDPI stays neutral with regard to jurisdictional claims in published maps and institutional affiliations. |
© 2022 by the authors. Licensee MDPI, Basel, Switzerland. This article is an open access article distributed under the terms and conditions of the Creative Commons Attribution (CC BY) license (https://creativecommons.org/licenses/by/4.0/).
Share and Cite
Jamil, M.K.; Akhtar, M.; Farooq, M.; Abbas, M.M.; Saad; Khuzaima, M.; Ahmad, K.; Kalam, M.A.; Abdelrahman, A. Analysis of the Impact of Propanol-Gasoline Blends on Lubricant Oil Degradation and Spark-Ignition Engine Characteristics. Energies 2022, 15, 5757. https://doi.org/10.3390/en15155757
Jamil MK, Akhtar M, Farooq M, Abbas MM, Saad, Khuzaima M, Ahmad K, Kalam MA, Abdelrahman A. Analysis of the Impact of Propanol-Gasoline Blends on Lubricant Oil Degradation and Spark-Ignition Engine Characteristics. Energies. 2022; 15(15):5757. https://doi.org/10.3390/en15155757
Chicago/Turabian StyleJamil, Muhammad Kashif, Maaz Akhtar, Muhammad Farooq, Muhammad Mujtaba Abbas, Saad, Muhammad Khuzaima, Khurshid Ahmad, Md Abul Kalam, and Anas Abdelrahman. 2022. "Analysis of the Impact of Propanol-Gasoline Blends on Lubricant Oil Degradation and Spark-Ignition Engine Characteristics" Energies 15, no. 15: 5757. https://doi.org/10.3390/en15155757