
Nonlinear Surface Conductivity Characteristics of Epoxy Resin-Based Micro-Nano Structured Composites
by
 , , , , ,
Ning Guo
1 ,
,
Jiaming Sun
1,
Yunlei Li
1,
Xiaoyu Lv
1,
Junguo Gao
1,*,
Mingpeng He
2,* and
Yue Zhang
2,* 1
Key Laboratory of Engineering Dielectrics and Its Application, Ministry of Education, Harbin University of Science and Technology, Harbin 150080, China
2
DongFang Electric Machinery Co., Ltd., Deyang 618000, China
*
Authors to whom correspondence should be addressed.
Energies 2022, 15(15), 5374; https://doi.org/10.3390/en15155374
Submission received: 31 May 2022
/
Revised: 19 July 2022
/
Accepted: 21 July 2022
/
Published: 25 July 2022
(This article belongs to the Special Issue Recent Developments in Theories, Technologies and Applications of HVDC Insulation Systems)
Abstract
:Nonlinear composite materials serve to homogenize electric fields and can effectively improve the local concentration of the electric field in power systems. In order to study the nonlinear surface conductivity properties of micro-nano epoxy composites, two types of epoxy micro-nano composite specimens were prepared in the laboratory using the co-blending method. The surface conductivity of the composites was tested under different conditions using a high-voltage DC surface conductivity test system. The results show that the surface conductivity of micro-nano structured composites increases and then decreases with the rise of nanofiller doping concentration. The nonlinear coefficient was 1.781 at 4 wt% of doped nanostructured SiC, which was the most significant nonlinear coefficient compared to other doping contents. For the same doping concentration, the micro-nano structured composites doped with nanostructured SiC have more significant surface conductivity at the same test temperature with a nonlinear coefficient of 1.635. As the temperature increases, the surface conductivity of the micro-nano structured composite increases significantly, and the threshold field strength moves towards the high electric field. Along with the increase in temperature, the nonlinear coefficients of micro-nano composites after doping with nanostructured SiC showed a gradually decreasing trend. The temperature has little effect on the nonlinear coefficients of the micro-nano structured composites after doping with O-MMT.
1. Introduction
An electrical system is usually made up of multiple components or devices connected serially. Damage to any one part can cause the entire system to fail. Insulation material is one of the weakest components in the power system, and its performance determines the stability of the whole power system operation [1]. In rotating machinery such as hydroelectric generators, insulation damage causes up to 50% of failures [2,3], mainly because the voltage applied to the end of the stator wire rod during operation can exceed the average value by several times. The main insulation is usually coated with anti-corona paint to improve the concentration of local electric field strength, thus extending the service life of the main insulation [4,5,6]. The new anti-corona materials are divided into two main types, high-conductivity composites with constant parameters and composites with nonlinear pressure-sensitive conductivity [7,8]. High-conductivity composites with constant parameters can effectively improve the field concentration phenomenon. However, the application of high conductivity composites is limited by the problems of large leakage current, and the inability to apply a single parameter to parts with large differences in electric field values for these materials [9,10]. Therefore, the use of composite materials with nonlinear conductivity properties to improve the field concentration problem has gradually become a research focus.
At present, the paramount preparation of anti-halation varnishes with nonlinear conductivity characteristics is to add semiconductor inorganic fillers to the epoxy resin matrix. Commonly used semi-conductive inorganic fillers include microstructured ZnO and microstructured SiC [11]. The polymer matrix is modified by combining a suitable inorganic filler that can meet the application requirements of different occasions. Scholars have also investigated the nonlinear mechanism of composites doped with single-component particles of microstructured SiC and microstructured ZnO. The source of its nonlinear conductivity is considered to be the contact surface between the filler particles in the polymer matrix, where interfacial polarization occurs on the contact surface, thus leading to the bending of the energy band and the appearance of a Schottky barrier showing nonlinear properties [12].
More experts have found that the nonlinear electrical conductivity of nanostructured SiC composites is better than that of microstructured SiC composites. The advantage of nanodielectrics is that they exhibit many electrical properties different from those unique to micron composites through the unique quantum size effect, small size effect, surface effect, and macroscopic quantum tunneling effect of nano cells [13]. Among them, the great specific surface area of nanoparticles makes it possible to have unusually high nonlinear effects and geometric size effects of electrical conductivity. However, the dispersion and aggregation of nanoparticles are difficult to control, and the uncertainty of the interfacial properties and structure formed in the polymer increases the breakdown dispersion of the dielectric. Therefore, there is still instability in the effect of nano-doping on the properties of composites.
The modification effect of epoxy resin composites depends on factors such as the type, particle size, and content of micro-nano particles [14]. As research has progressed, it has been found that the doping of micro-nano particles can effectively improve the properties of nonlinear conductivity, partial discharge resistance, and dielectric properties of the epoxy resin polymer composite system [15,16,17]. Scholars also consider the interface formed between the microparticles, nanoparticles, and the polymer as an essential factor affecting the various properties of the epoxy resin polymer [18,19,20,21,22]. Especially in the field of nonlinear conductivity properties, nonlinear conductivity composites doped with only one component nano or microstructured filler have nonlinear conductivity property parameters that are not easy to control. The nonlinear conductivity properties of micro-nano composites are mainly caused by the nonlinear potential barriers formed between the particles in the internal parts of the polymer, and their properties are easily controlled. Therefore, using micro-nano structured composites to regulate the nonlinear conductivity properties of composites has become a new research direction.
In this paper, we mainly use epoxy resin prepolymer as the main body and nanostructured SiC and organically modified MMT as inorganic fillers. The nanostructured SiC with organically modified MMT doping content of 0.5, 1, 3, and 4 wt% composite specimens were prepared to study the dispersion state of inorganic fillers in polymers and to investigate the effects of nanofiller type, content, and temperature on the electrical conductivity and nonlinear properties of micro-nano structured composites.
2. Experimental
2.1. Tested Materials
The selection of suitable reagents and sample preparation process will result in interfacial structures between inorganic fillers and polymer matrix, and the specimens present excellent properties. The raw materials required in the experiments are shown in Table 1.
2.2. Sample Preparation
The epoxy resin micro-nano structured composites were prepared by the co-blending method, as shown in Figure 1. The specific process is as follows.
- Surface treatment of nanostructured SiC. Surface treatment of nanostructured SiC using KH560 to increase the compatibility of the epoxy resin matrix with the nanostructured filler. After washing the modified nanoparticles in low mineralization water at pH = 7, the nanoparticles were vacuum-dried to remove moisture to obtain the modified nanostructured SiC (N-SiC).
- Organic treatment of MMT. A measuring cylinder was used to measure 300 mL of acid solution (prepared by injecting 0.8 mL of acetic acid into 800 mL of distilled water) and 40 g of nacreous montmorillonite raw clay into a three-necked flask. The flask was placed in an 80 °C water bath with ultrasonic shaking and stirring for 1 h. The solution was centrifuged three times using a centrifuge. The time of centrifugation treatment was set to 1 min, 2 min, and 2 min, respectively. Then, 2.8 g of octadecyl trimethyl ammonium chloride was added, followed by stirring with ultrasonic shaking for 2 h. After several rounds of standing, washing, filtering and then drying, grinding, and sieving, the organically modified MMT(O-MMT) was obtained.
- Preparation of epoxy resin composite hybrid materials. The epoxy resin composites were mixed with 0.5, 1, 3, and 4 wt% nanoparticles by a mass fraction. The mixture was ultrasonically and mechanically stirred at room temperature (20 °C) at 2000 r/min for 1 h. Then, curing agent 593 was added to the mix (the amount of curing agent added was 10% of the mass of DECJ1345). The epoxy resin composite mixture was obtained by continuing ultrasonic mechanical stirring at 2000 r/min for 30 min at room temperature (20 °C).
- Preparation of micro-nano structured composite specimens. The blended mixture was evenly coated on the outer wall of the high-temperature resistant glass tube and cured at room temperature (20 °C) for 24 h to obtain a prefabricated sample of the glass tube. Copper conductive tape was wrapped around the top and bottom of the glass tube to perform sample coating. The copper conductive tape was wrapped around the copper wire and the copper wire was led out for the electrode to facilitate the test. The final composite samples to be tested were obtained with different nano-doped fillers and different mass fractions.
A total of nine composites were prepared by the co-blending method, with two specimens of each material. The ratios and numbers of the specimens are shown in Table 2 below.
2.3. Test Method and Principle
2.3.1. DC Surface Conductivity
A DC surface conductivity test system with a DW-O153-5ACF3 (Dongwen High Voltage Power Supply Co., Ltd., Tianjin, China) DC power supply with a voltage regulation range of 0 to 15 kV and an EST122 (with Beijing’s Venture Technology Co., Ltd., Beijing, China) picoammeter were used to ensure that DC was flowing through the specimen. The electrode system was placed in a 101-2AB (Shanghai Guangpin Test Equipments Manufacturing Co., Ltd., Shanghai, China) electric blast dryer with a temperature accuracy of ±1 °C. The variation pattern of surface conductivity characteristics of composite materials with temperature were tested. To ensure the accuracy of the test, placement in the dryer before the test short-circuited 24 h of processing. The specimen was connected to the circuit, pressure was applied to the specimen for one minute, then the picoammeter was opened for testing and obtaining the current value. The value of applied voltage was 0.04~10 kV. Figure 2 shows a schematic diagram of the surface conductivity test system.
The current obtained by the pressurized 1 min reading method was chosen as the surface conductivity current. The currents tested at different voltages were recorded to calculate the surface conductivity of the composites according to Equation (1).
In the formula, D is the diameter of the specimen; d is the distance between the electrodes.
The relationship between current and voltage measured in the test has the empirical Formula (2).
In the formula, I and U are the current and voltage values during the test, respectively. Taking J = I/l, σ = J/E, and E = U/d into the above equation, we can obtain Equation (3).
Defining the constants in Equation (3) as coefficients K, organization leads to Equation (4).
In order to study the nonlinear surface conductivity properties of composite materials, the nonlinear coefficient is defined as β, where β = α − 1 and the logarithm are obtained for both sides of Equation (5) simultaneously.
E is the electric field strength, K is a constant, and β is a nonlinear coefficient.
2.3.2. Cross-Sectional Characterization
The results of the characterization of composite sections using a SU8020 (Hitachi Limited, Tokyo, Japan) scanning electron microscopy (SEM) revealed the degree of dispersion of inorganic micro-fillers and nanostructured fillers in the epoxy resin matrix and the degree of exfoliation of the organically modified montmorillonite. To ensure a neat and clean section, the specimens were made brittle and broken after cooling with liquid nitrogen and then ultrasonically shaken in anhydrous ethanol for 30 min. The cross-section was then sprayed with gold before observation.
3. Results and Discussion
The factors influencing the conductivity of the composites need to be analyzed in terms of carrier concentration and mobility. Conductive carriers can be classified by type into ionic and electronic conductivity. The weak electric field is mainly ionic conductivity. The strong electric field is primarily electron conductivity. In the forbidden bandwidth of the smaller media and thin layer, the media are more prominent. The conductive process of semiconductor materials, as shown in Figure 3, can be summarized. The electrons or holes move freely in the conduction band of the grain region to reach the grain surface. Tunneling effect and thermal excitation result in them jumping through the grain boundary region to another grain surface. Then they move in the conduction band of that grain. The arrow in Figure 3 indicates the carrier leap paths. The migration of ion carriers within the resin matrix is considered a result of ion thermal vibrations. The ions vibrate at the equilibrium position with the lowest possible point, and adjacent resin molecules make a critical potential for ion migration. The ions vibrate at the equilibrium position with the lowest potential energy, and neighboring resin molecules create a critical potential for ion migration. When the ion’s thermal vibrational energy exceeds the binding potential of the resin molecule to it, the ion leaves the equilibrium position to produce charge migration.
The carriers of polymers in weak fields are dominated by the intrinsic ionic conductivity with weakly bound ionic conductivity [23]. Intrinsic ionic conductivity is when ions on a dielectric crystal are heated to leave the dot matrix and become carriers to participate in the conductivity. Since the dissociation of intrinsic ions requires a particular temperature environment, the ionic conductivity characteristics have a more obvious correlation with temperature. Under low-temperature conditions, the conductance in the specimen is mainly dominated by the impurity of ionic conductance. The intrinsic ionic conductance is the main component of the material carriers when the temperature is increased to the point where the ligand covalent bonds connecting the polar groups of the epoxy resin macromolecular chains dissociate. At high temperatures, the carriers with irregular thermal motion gain higher energy. Under the action of the external electric field, more carriers can cross the potential barrier in the interfacial region more efficiently and break away from the deep trap within the epoxy resin to reach the nearby silicon carbide particles, increasing the electrical conductivity of the composite. Silicon carbide particles are a typical semiconductor material, and the intrinsic carrier concentration in SiC grains conforms to the relationship shown in Equation (6).
In the equation, ni is the intrinsic carrier concentration; Nc is the effective density of states in the SiC conduction band; Nv is the effective density of states in the valence band; Eg is the forbidden bandwidth; k is the Boltzmann constant at absolute zero; and T is the temperature. When the temperature increases, the intrinsic carrier concentration rises exponentially. At high temperatures, more SiC carriers can further increase the conductivity, which also becomes apparent with increasing temperature [24].
3.1. Morphology of Micro-Nano Structured Composites
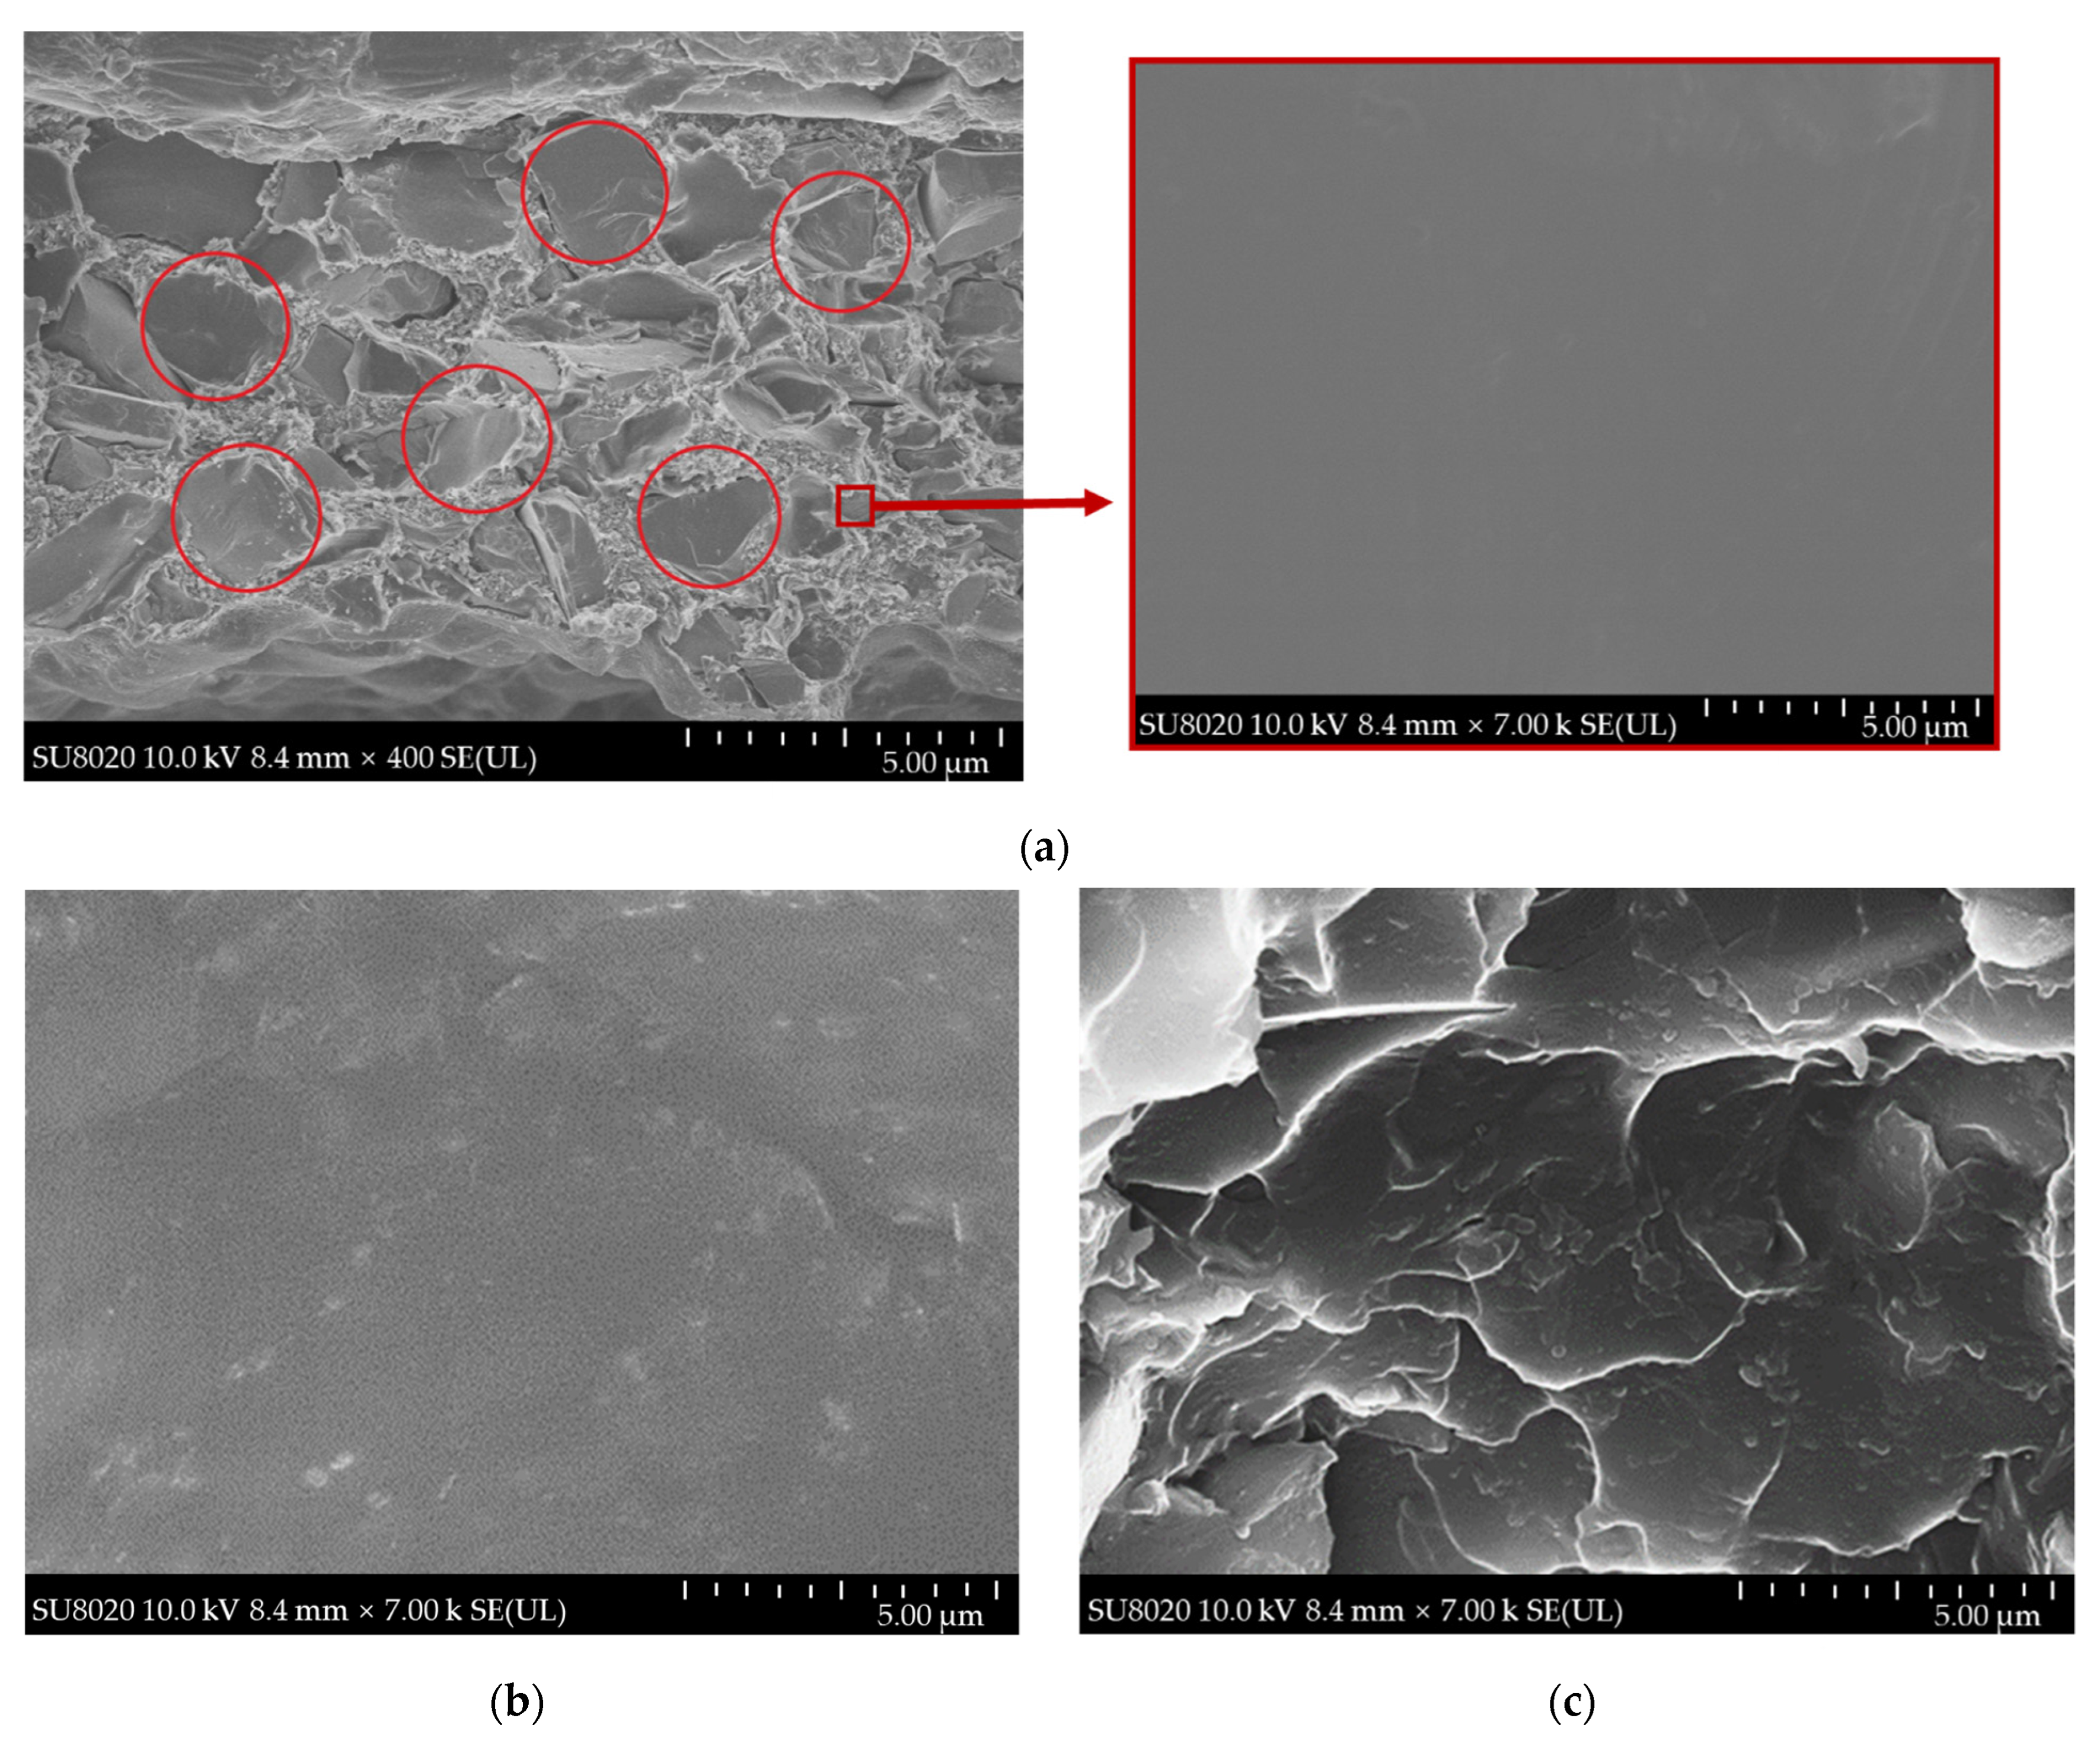
The cross-sectional microscopic morphology of the different composite specimens is shown in Figure 4. SEM cross-sections of the epoxy composite without doped nanoparticles at the scale of 100 μm and local magnification at 5 μm are shown in Figure 4a. It is obvious in the figure that micron silicon carbide particles are uniformly dispersed in the epoxy resin. A small fraction of micrometer silicon carbide particles is nearly tightly connected in the matrix. Most of the particles are interspersed with epoxy resin and are not in contact with each other. The smooth and flat matrix between the particles and the absence of noticeable other particles can be seen in the partial magnification. Figure 4 shows SEM images of the micro-nano composites after adding 1 wt% SiC nanoparticles (Figure 4b) and 1 wt% O-MMT (Figure 4c), respectively. It can be seen that the nanostructured SiC is uniformly dispersed in the matrix without apparent aggregation. The matrix is shown in Figure 4c contains only micron SiC and O-MMT. Therefore, the small flaky particles in SEM images at the 5 μm scale are O-MMT. It can be more clearly seen that the lamellar O-MMT exfoliates better. O-MMT is uniformly distributed in the epoxy resin in lamellar form without apparent aggregation. The incorporation of nanostructured SiC and the incorporation of O-MMT resulted in the filling of nanoparticles between micron silicon carbide particles. Therefore, the analysis shows that the addition of nanofillers affects the properties of epoxy composites.
3.2. Effect of Packing Type on Surface Conductivity Characteristics
In this paper, we obtained the nonlinear surface conductivity characteristics of different micro-nano composites by testing the surface conductivity currents of two micro-nano composite specimens with both nanostructured SiC and O-MMT doping contents of 1 wt%. The variation of the conductivity of the composite material with the field strength is shown in Figure 5a. Compared with the epoxy composites, the electrical conductivity of the micro-nano composites was significantly increased after doping with nanofillers. The threshold field strength of the micro-nano composites did not change considerably after doping with nanofillers. The most significant increase in conductivity was observed for the specimens doped with SiC nanoparticles. The conductivity of the 1 wt% SiC specimen at a field strength of 0.1 kV/mm reached 1.39 × 10⁻⁹ S, an improvement of two orders of magnitude compared to the DECJ specimen. The conductivity of the 1 wt% MMT specimen was smaller than that of the 1 wt% SiC specimen but larger than that of the DECJ specimen. It shows that the doping of nanofillers results in a significant improvement in the electrical conductivity properties of the composites.
The change of nonlinear coefficients before and after the threshold field strength is shown in Figure 5b. The dependence of the conductivity on the electric field strength is weak before the threshold field strength. The dependence of the conductivity on the externally applied field strength becomes larger after the threshold field strength. It shows a small nonlinear coefficient before the threshold field strength and a large nonlinear coefficient after the threshold field strength. Comparing the doping of two different nanoparticle composites revealed that the nonlinearity coefficient of the 1 wt% SiC specimen was higher than that of the 1 wt% MMT specimen and the DECJ specimen at the same doping concentration, and it was increased by 36.25% relative to the DECJ specimen. It is illustrated that the nonlinear properties of the micro-nano composites formed after doping with nanostructured SiC fillers are superior to those of the single-doped micron composites.
The influence of inorganic fillers on the nonlinear surface conductivity properties of micro- and nanocomposites was analyzed for the following reasons.
First, incorporating micron silicon carbide particles gives the epoxy micron composite its nonlinear electrical conductivity properties. The epoxy resin composites contain multiple grain boundary regions inside the micron silicon carbide particles. The externally applied electric field causes the carriers to concentrate on some of the grains on one side of the silicon carbide particles, resulting in a significant value of the field distortion there. The carriers are shot into the polymer matrix. Due to impurities in silicon carbide crystals, intermediate energy levels are introduced in the forbidden band, and the impurity energy levels are close to the conduction band, contributing electrons to the conduction band to act as a conductor [25]. As the externally applied electric field increases, the grain boundary potential tilt intensifies, and the carrier mobility becomes more extensive, leading to a gradual increase in the material conductivity. After reaching a particular field strength, the silicon carbide grain boundary potential barrier disappears. The high conductivity of silicon carbide makes the carriers concentrate rapidly on one side of the particles, and the field distortion is more serious. The pages jump across the polymer matrix, which makes the conductivity of the composite specimen larger rapidly with the increase of the field strength.
Secondly, the doping of nanostructured SiC can optimize the nonlinear electrical conductivity properties of the micro-nano composites. The doping of micron fillers can improve the electrical conductivity as well as the nonlinear coefficient of epoxy composites. However, the doping of a large number of micron particles will precipitate during the curing process of epoxy resin composites and therefore affect the performance of the composites. Nanoparticles doped with appropriate concentrations can reduce the doping content of micron silicon carbide while increasing the electrical conductivity of the composite. A SiC nanoparticle does not mean that it is a complete crystal with a grain–grain boundary structure. There is a particular concentration of free electrons inside the grain, and the conductivity is much larger than that of the grain boundary layer. The special structure of the grain–grain boundary layer is the root cause of the semiconducting properties of semiconducting nanomaterials. The free electrons are trapped by traps in the grain boundary region and form an electron depletion layer on the grain surface. Under the action of the externally applied electric field, the grain boundary potential barrier is tilted, and the electrons migrate directionally with a certain probability in thermal motion to form carriers. The addition of nanostructured SiC, as shown in Figure 3, corresponds to an increase in the effective contact area between the micron SiC particles, which reduces the potential barrier for electron jumping and thus increases the carrier mobility, resulting in macroscopically increasing the conductivity and nonlinear coefficients.
Finally, the doping of SiC nanoparticles enhanced the nonlinear conductivity properties of the composites more than the doping of O-MMT. The doping of O-MMT can introduce many impurity ions into the composite, which can be activated at low temperature and participate in the conductivity and increase the carrier concentration. As shown in Figure 3, the reaction heat released by the organically modified montmorillonite during the curing reaction of the epoxy resin has damaged the interlayer force of the montmorillonite to some extent and changed the lamellar structure. The epoxy resin molecular chain segments are inserted into the montmorillonite lamellae to peel them off and form a large number of interfaces. The orderly distribution of epoxy resin molecules in the interface area can homogenize the molecular spacing within the composite. The carrier mobility can be improved by converging the binding barriers that need to be overcome for carrier migration. However, the effect of increasing the carrier mobility by homogenizing the molecular spacing within the composite is lower than that of increasing the carrier mobility by increasing the conductive pathways. Therefore, the electrical conductivity and nonlinear coefficients of the micro-nano composites doped with organically modified montmorillonite were higher than before the incorporation. However, it is lower than the micro-nano composite after doping with nanostructured SiC.
3.3. Effect of Nanoparticle Content on Electrical Surface Conductivity Characteristics
The variation patterns of surface conductivity and nonlinearity of micro-nano composites doped with different contents of nanostructured SiC are shown in Figure 6. From Figure 6a, it can see that the conductivity of micro-nanocomposites shows a trend of increasing and then decreasing with the increase of nanostructured SiC content after the threshold field strength. The highest conductivity was achieved at a nanostructured SiC content of 1 wt%, reaching 1.39 × 10⁻⁹ S at a field strength of 0.12 kV/mm. The threshold field strength is shifted back in the doping concentration at 0.5 wt%, and the threshold field strength is the same at 3 wt% and 4 wt% doping concentration. Figure 6b shows that the nonlinear coefficients of the micro-nano composites after the threshold field strength change significantly compared to the nonlinearity before the threshold field strength. The nonlinear coefficient gradually becomes more significant at 3 wt% and 4 wt% of SiC nanoparticles, and the nonlinear coefficient is the largest at 4 wt%, which is 1.781.
The effect pattern of doping different contents of O-MMT on the electrical conductivity and nonlinearity of the micro-nano composites is shown in Figure 7. Figure 7a shows the variation curves of conductivity of micro-nano composites with O-MMT doping concentration for doped O-MMT content of 0.5, 1, 3, and 4 wt%. It can be seen that the trend of the conductivity of the micro-nano composites also increases and then decreases, with the highest conductivity reaching 4.23 × 10⁻¹⁰ S at 1 wt% of O-MMT content. The threshold field strength is slightly changed with increasing doping concentration. Figure 7b shows the nonlinear coefficients of the O-MMT doped micro-nano composites before and after the threshold field strength. The nonlinear coefficients with doped nanostructured SiC micro-nano composites were found to offer a similar pattern. However, the nonlinear coefficients at contents of 1, 3, and 4 wt% were smaller than those of the SiC doped nano specimens.
The analysis concluded that the content of inorganic fillers has both promoting and inhibiting effects on the nonlinear electrical conductivity properties of the micro-nano composites. The impact of nanostructured SiC and O-MMT on the conductivity of the composites show similar patterns. Still, products on nonlinearity are different and need to be analyzed on a case-by-case basis.
For one, the carrier concentration as well as the mobility inside the micro-nano composite changes as the nanostructured SiC concentration continues to increase. Therefore, it will affect the nonlinear conductivity characteristics of the composite. The analysis concluded that the doped silicon carbide nanoparticles have considerable surface energy. When the nanoparticle surface is in contact with the epoxy resin matrix, the epoxy resin molecular chains in connection with the nanosurface are restricted to uniformly aligned. As a result, the atomic spacing decreases, reducing the original barrier width and height. In the presence of an applied electric field, the electrons in the higher energy state penetrate the potential barrier and move to another atom. The addition of silicon carbide nanoparticles increases the effective contact area between the micron carbide particles and allows for more carrier transport paths. When the nanoparticle concentration increases, some of the nanoparticles have smaller spacing, the formed interfacial states appear to overlap, and the carrier flow path rises further. When the decrease in the simplicity of energy levels between atoms is significant, the high-energy electrons can move freely in the periodic potential field formed in the interface. Therefore, the carrier concentration and conductivity in the local region are increased. Due to the large specific surface energy of nanoparticles, the charge attraction at the particle interface is strong. Therefore, the nanoparticles have a deep trap energy level distribution. As the nanofiller content increases, more charges are attracted, the concentration of carriers decreases, and the electrical conductivity decreases. The interface of nanoparticles can have an impact on the nonlinear properties of micro-nano composites. The trapping of electrons around nanoparticles results in the accumulation of space charge if nanoparticles appear around micrometer silicon carbide, which may raise the migration potential of electrons or impurity ions. However, the nanoparticle content decreases the carrier concentration after more than 1 wt%. Nonetheless, after reaching the threshold field strength, with the further increase of field strength, a large number of trapped electrons will gradually break away from the trap to become carriers into the epoxy resin medium to participate in the conductivity. This increases the amount of carrier concentration change, which increases the nonlinear slope after the threshold field strength.
Secondly, the conductivity characteristics of doped organically modified montmorillonite composites are influenced by traps in the montmorillonite interface region. This is because the higher the O-MMT content, the more montmorillonite lamellae need to be stripped in the curing reaction. At the same time, the number of resin molecules between the silicon carbide particles is certain, resulting in incomplete stripping of montmorillonite, more loosening of the connection with the substrate, and more significant trap density in the interface region. At higher field strengths, the carriers trapped by the traps gain enough energy to be strapped, so the conductivity increases with the increase of O-MMT content. The trap in the composite increases dramatically when the O-MMT content exceeds 1 wt%, causing an increase in the amount of trapped charge. Thus, the carrier concentration decreases, causing the conductivity to start falling. After the conductivity reaches the threshold field strength when the O-MMT content is 4 wt%, due to the high content of trapped charges, a slight increase in the electric field can cause many leaders in the web to leave the trap to form carriers to participate in the conductivity. At this point, the web can no longer capture new pages, which leads to a large conductivity. Therefore, the nonlinear coefficient after the threshold field strength gradually becomes larger as the trap density increases.
3.4. Effect of Temperature on Nonlinear Surface Conductivity Properties of Micro-Nano Composites
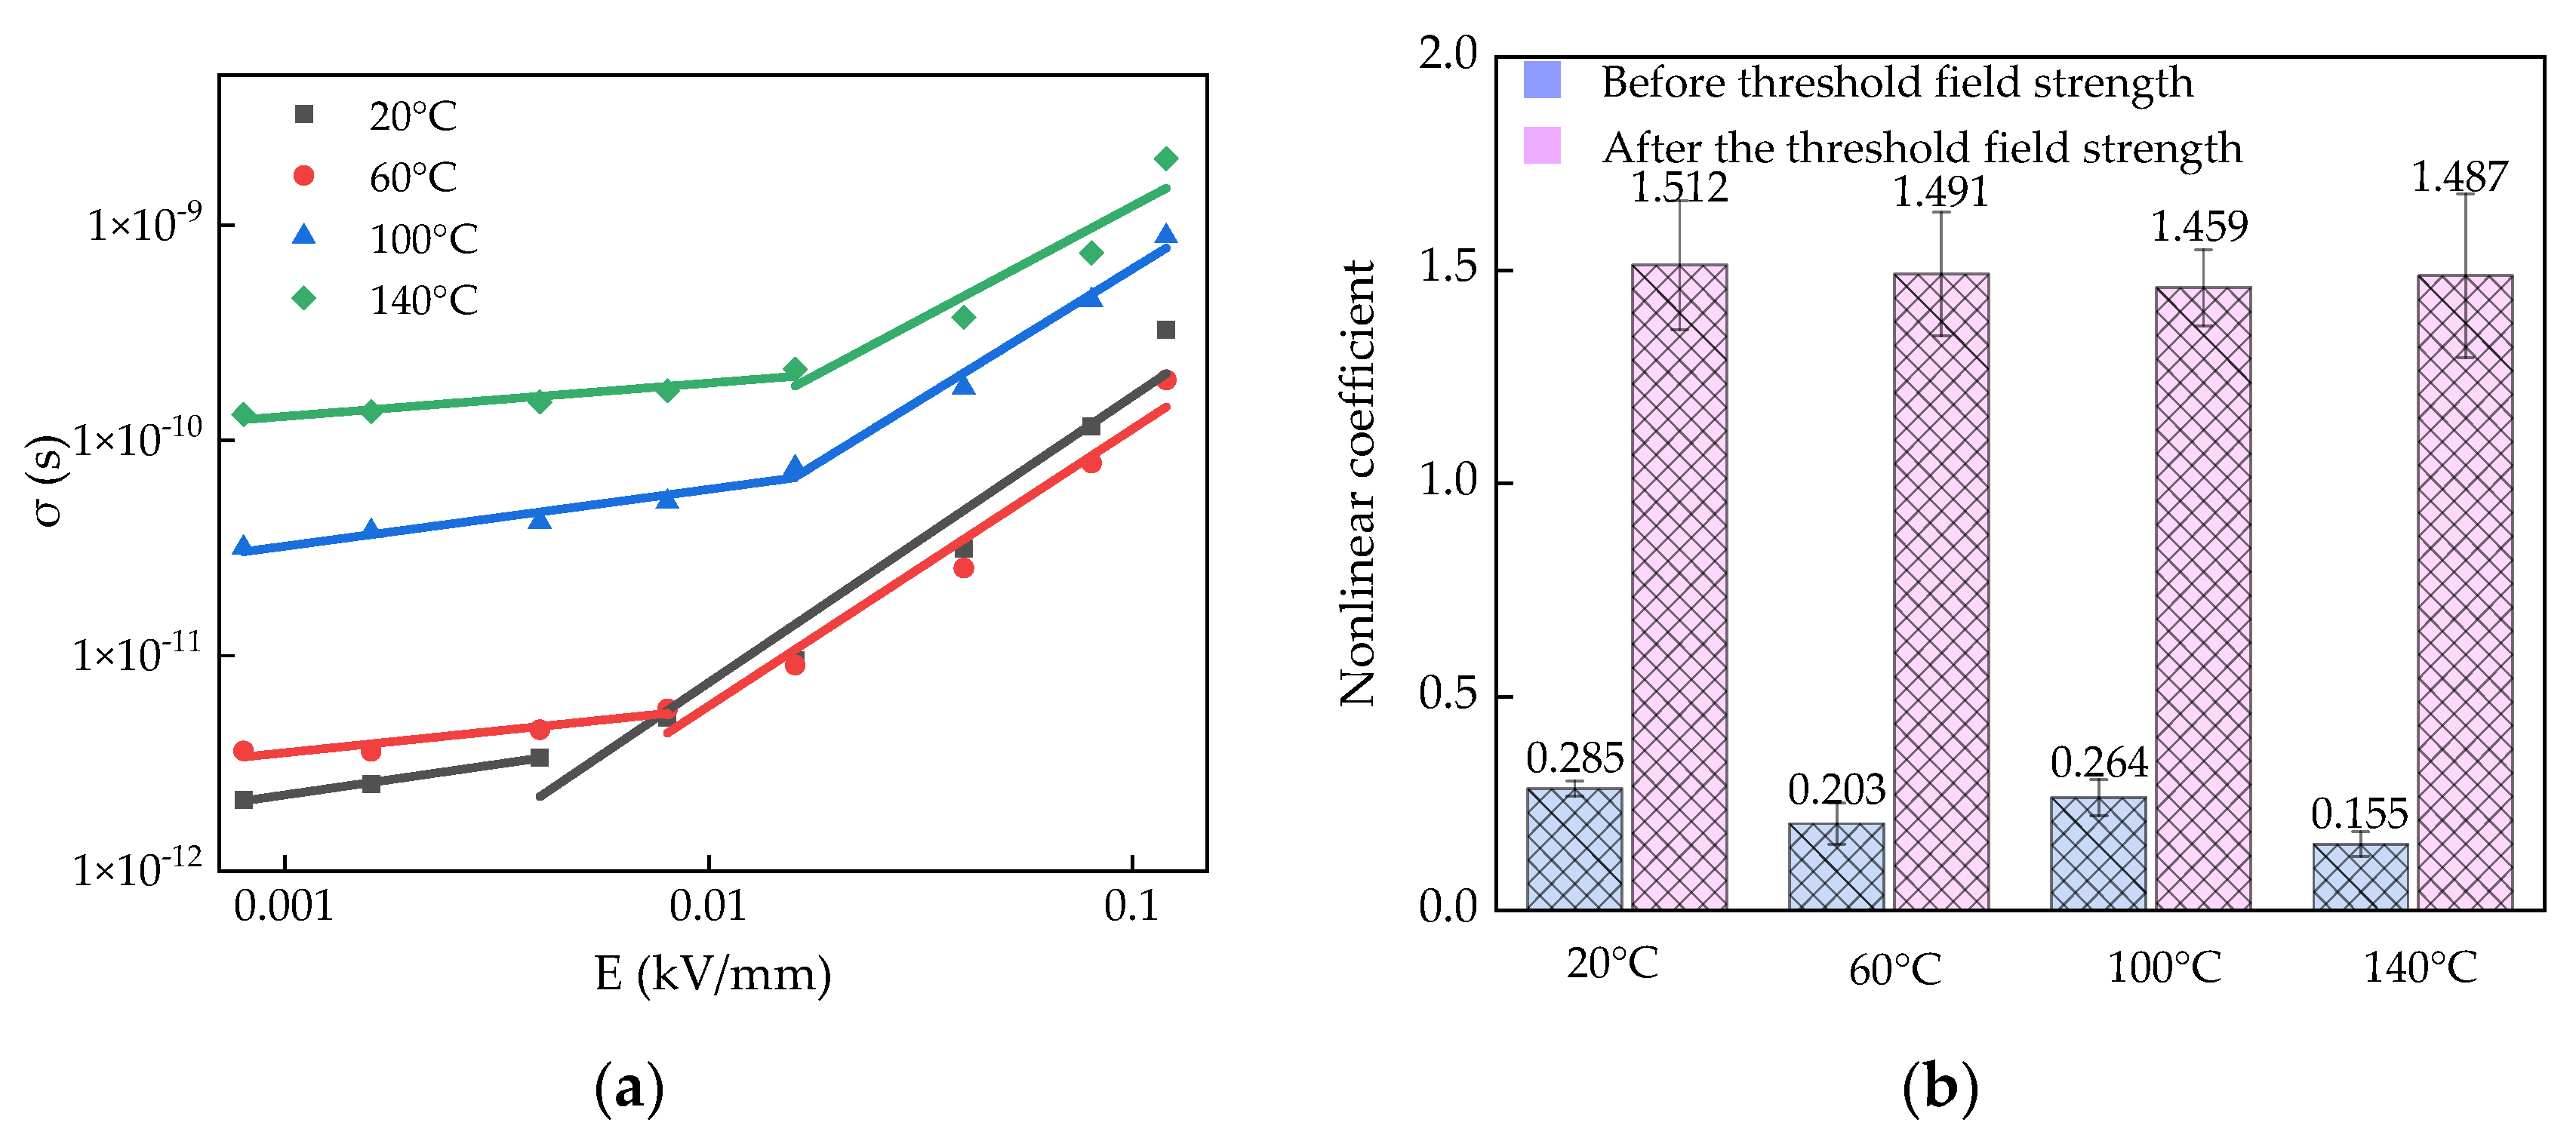
In the experiments, 1 wt% SiC specimens and 1 wt% MMT specimens were tested at 20, 60, 100 and 140 °C environments using the controlled variable method with a DC surface conductivity test system. After each temperature rise, the specimen was put into the dryer for 30 min to ensure that the sample was heated evenly to reach the test temperature. The effect of temperature on the nonlinear surface conductivity characteristics of the doped nanostructured SiC micro-nano composites is shown in Figure 8. The result of temperature on the nonlinear surface conductivity characteristics of the doped O-MMT micro-nano composites is shown in Figure 9.
By studying the conductivity characteristics of the composites at higher temperatures, the conductivity versus field strength curves of the composites at variable temperatures and fields were analyzed. As seen in Figure 8 and Figure 9, the increase in temperature causes the conductivity to become larger, and the conductivity is more sensitive to temperature in low fields. The increasing trend of conductivity is more extensive than that in high areas. The threshold field strength moves in the direction of the high field when a specific temperature is reached, and when the temperature exceeds 100 °C, the threshold field strength no longer moves forward. Figure 8a yields a gradual decrease in the post-threshold field strength slope of the composite specimens doped with nanostructured SiC as the temperature increases. Figure 9a delivers little change in pitch after threshold field strength for the O-MMT doped composite models. Figure 8b shows that the nonlinear coefficients of the composite models doped with nanostructured SiC show a gradual decrease with increasing temperature. The nonlinearity coefficient gradually decreases from 1.216 to 1.071 between 20 °C and 140 °C. Figure 9b shows that the nonlinear coefficients of the O-MMT doped composite specimens do not vary much, all fluctuating above and below 1.487 ± 0.028.
Micron silicon carbide is uniformly dispersed in epoxy resin composites. However, irregularly shaped micron silicon carbide particles can lead to many intervals between the particles, which are filled by the epoxy matrix. The increase in nanoparticles introduces many impurity ions and increases the carrier concentration. Nanoparticles also fill these intervals, making a portion of nanoparticles present in the gaps. As the temperature increases, more and more ions gain energy to break through the potential barrier to form carriers. This results in an increase in carrier concentration and an increase in electrical conductivity [26]. In summary, the conductivity of the micro-nano composites doped with SiC nanoparticles and O-MMT increases continuously at both low and high fields as the temperature increases. However, the nonlinear coefficients of the composites doped with nanostructured SiC showed a trend of gradual decrease. The nonlinear coefficients of the composite specimens doped with O-MMT do not vary much. The difference is mainly due to the different effects of the two inorganic fillers on the carrier concentration and carrier mobility in the composites. The specific analysis is as follows.
First, the narrow width of the forbidden band of silicon carbide crystals causes the electrons in the valence band to be easily excited from the valence band to cross the forbidden band and form carriers in the conduction band. These carriers are called intrinsic carriers and can migrate under the action of electric fields to form currents. Usually, it is only possible to exhibit the excitation properties of intrinsic electrons in the case of highly pure crystals. The semiconductor filler used in nonlinear composites undergoes multiple processes during factory processing, which can cause the semiconductor filler to contain many impurities, and there are bound to be defects in the crystal. In this case, impurities and weaknesses in the fill can also provide carriers into the material through the ionization process. When the material is in the low-temperature region, the dissociation process of impurities and defections in the crystal offers many carriers. The intrinsic carriers increase rapidly as the temperature gradually increases. It can be seen that intrinsic carriers and carriers generated by impurities and defects jointly participate in the process of internal conductivity of the material. The increase in temperature will inevitably cause the composite volume to expand, resulting in the micron silicon carbide particles not being linked closely enough to each other. The energy required for carrier jumping becomes large at high fields, and the conducting pathway does not form well. However, incorporating silicon carbide nanoparticles increases the carriers to promote the construction of conducting paths. Nonetheless, in a high-temperature environment, the volume expansion of the composite material makes the energy required to form carriers from the ion leap potential more significant, which inhibits the conductive pathway to a greater extent than the addition of nanoparticles facilitates the construction of the conductive path. This also leads to a shift in the threshold field strength of the nanostructured SiC composites toward higher fields as the temperature increases. The concentration of carriers increases after the threshold field strength, the efficiency decreases, and the nonlinear coefficient becomes smaller. The threshold field strength does not continue to move forward when the promotion and suppression effects reach essentially the same level.
Secondly, the doping of O-MMT is equivalent to the introduction of weakly bound ions. The low- and high-temperature sections can dissociate to produce carriers, so the ionic conductivity barrier decreases and the conductivity becomes large. For composite materials, the number of pages generated by weakly bound ions introduced by montmorillonite is much smaller than that caused by the dissociation of silicon carbide impurity ions. The pages generated by the dissociation of weakly bound ions do not provide much of a boost to the conductivity, instead trapping the pages and reducing the carrier mobility. The pages trapped by the trap under the action of the external thermal field gain energy and vibration intensification can be strapped. Still, volume expansion of the composite caused by high temperature increases the energy required for the ion conductivity to overcome the possible barrier migration. Therefore, the ionic conductivity must overcome not only the potential barriers of weakly bound and intrinsic ion dissociation but also the high potential barriers caused by traps. This causes the threshold electric field intensity of the O-MMT doped composites to shift in the direction of the high electric field at high temperatures. When steady-state is reached, even if the temperature increases, the threshold electric field intensity no longer shifts forward, and the nonlinear coefficient does not change much.
4. Conclusions
In this paper, we use epoxy resin composites as a matrix, nanostructured SiC, and organically modified MMT with nano-sheet structure as nanofillers. Micro-nano composite specimens were prepared. The microscopic morphology of the composites was characterized using scanning electron microscopy. By studying the effects of filler type, content, and temperature on the surface conductivity properties of the composites, we came to the following conclusions.
- After doping with nanofillers, the surface conductivity of the micro-nano composites was significantly higher than that of the micron composites before doping. The surface conductivity and nonlinear coefficients of SiC-doped micro-nano composites were more excellent than those of micro-nano composites doped with a nano-sheet structure O-MMT. The nonlinear coefficient was improved by 36.25% in the epoxy composites by doping SiC nanoparticles with a content of 1 wt%.
- The surface conductivity of the micro-nanocomposites showed a trend of increasing and then decreasing with the increase of nanostructured SiC and O-MMT contents after the threshold field strength. The highest surface conductivity of the micro-nanocomposites was observed at 1 wt% of both nanostructured SiC and O-MMT content, and the threshold electric field intensity shifted backward relative to the doping concentration at 0.5 wt%. The threshold field strengths are the same for doping concentrations of 3 wt% and 4 wt%. The surface conductivity of the O-MMT doped micro-nanocomposites was highest at 1 wt% of O-MMT content, and the threshold field strength was essentially constant with increasing doping concentration. The nonlinear coefficients of the two micro-nano composites show a similar pattern, and the nonlinear coefficients after the threshold field strength vary significantly concerning the nonlinearity before the threshold field strength. The nonlinear coefficient reaches 1.781 at a doped nanostructured SiC content of 4 wt%.
- The surface conductivity of the micro-nanocomposites doped with nanostructured SiC and O-MMT increased continuously with increasing temperature at both low and high fields. However, the nonlinear coefficients of the composites doped with nanostructured SiC showed a trend of gradual decrease. The nonlinearity coefficient gradually decreases from 1.216 to 1.071 between 20 °C and 140 °C. The nonlinear coefficients of the O-MMT doped composite specimens varied less significantly, all fluctuating above and below 1.487 ± 0.028.
Author Contributions
Conceptualization, N.G.; methodology, J.G.; investigation, J.S., Y.L. and X.L.; resources, M.H. and Y.Z.; data curation, N.G.; writing—original draft preparation, J.S.; writing—review and editing, J.S.; supervision, J.G.; project administration, N.G. and J.G.; funding acquisition, M.H. and Y.Z. All authors have read and agreed to the published version of the manuscript.
Funding
This research work is funded by [the National Natural Science Foundation of China] grant number [51577045] and [Postdoctoral Research Startup Fund Project of Heilongjiang Province of China] grant number [LBH-Q19106].
Institutional Review Board Statement
Not applicable.
Informed Consent Statement
Not applicable.
Data Availability Statement
Not applicable.
Conflicts of Interest
The authors declare no conflict of interest.
References
- Haque, S.K.M.; Ardila-Rey, J.A.; Umar, Y.; Mas’ud, A.A.; Muhammad-Sukki, F.; Jume, B.H.; Rahman, H.; Bani, N.A. Application and Suitability of Polymeric Materials as Insulators in Electrical Equipment. Energies 2021, 14, 2758. [Google Scholar] [CrossRef]
- Lenko, D.; Schlögl, S.; Bichler, S.; Lemesch, G.; Ramsauer, F.; Ladstätter, W.; Rosc, J.; Kern, W. New Approaches towards the Investigation on Defects and Failure Mechanisms of Insulating Composites Used in High Voltage Applications. Compos. Part B Eng. 2014, 58, 83–90. [Google Scholar] [CrossRef]
- Alam, H.S.; Djunaedi, I.; Soetraprawata, D. Remaining Life Assessment of the Generator Stator Insulation: A Case Study on Suralaya Coal Fired Power Plant in Indonesia. Appl. Mech. Mater. 2015, 799–800, 1344–1348. [Google Scholar] [CrossRef]
- Xie, J.; Hu, J.; He, J.; Guo, Z.; Yin, Y. Simulation Analyse of Modification Effect of Nonlinear Composites on Nonuniform Electrical Fields. Gaodianya Jishu/High Volt. Eng. 2014, 40, 741–750. [Google Scholar] [CrossRef]
- IEEE Dielectrics and Electrical Insulation Society. Annual IEEE Computer Conference. In Proceedings of the IEEE Conference on Electrical Insulation and Dielectric Phenomena (CEIDP), Shenzhen, China, 20–23 October 2013; Ming Wah International Conference Center: Shenzhen, China, 2013. ISBN 9781479925971. [Google Scholar]
- Hu, H.; Zhang, X.; Zhang, D.; Gao, J.; Hu, C.; Wang, Y. Study on the Nonlinear Conductivity of SiC/ZnO/Epoxy Resin Micro- and Nanocomposite Materials. Materials 2019, 12, 761. [Google Scholar] [CrossRef] [Green Version]
- Shao, T.; Liu, F.; Hai, B.; Ma, Y.; Wang, R.; Ren, C. Surface Modification of Epoxy Using an Atmospheric Pressure Dielectric Barrier Discharge to Accelerate Surface Charge Dissipation. IEEE Trans. Dielectr. Electr. Insul. 2017, 24, 1557–1565. [Google Scholar] [CrossRef]
- Tu, Y.; Zhou, F.; Jiang, H.; Bai, F.; Wang, C.; Lin, J.; Cheng, Y. Effect of Nano-TiO2/EP Composite Coating on Dynamic Characteristics of Surface Charge in Epoxy Resin. IEEE Trans. Dielectr. Electr. Insul. 2018, 25, 1308–1317. [Google Scholar] [CrossRef]
- Hu, H.; Zhang, X.; Liu, Y.; Guo, L.; Gao, J. Optimization of the Electric Field Distribution at the End of the Stator in a Large Generator. Energies 2018, 11, 2510. [Google Scholar] [CrossRef] [Green Version]
- Du, B.X.; Liang, H.C.; Li, J.; Zhang, C. Temperature Dependent Surface Potential Decay and Flashover Characteristics of Epoxy/SiC Composites. IEEE Trans. Dielectr. Electr. Insul. 2018, 25, 631–638. [Google Scholar] [CrossRef]
- Can-Ortiz, A.; Laudebat, L.; Valdez-Nava, Z.; Diaham, S. Nonlinear Electrical Conduction in Polymer Composites for Field Grading in High-Voltage Applications: A Review. Polymers 2021, 13, 1370. [Google Scholar] [CrossRef]
- Yang, X.; Hu, J.; He, J. Adjusting Nonlinear Characteristics of ZnO-Silicone Rubber Composites by Controlling Filler’s Shape and Size. In Proceedings of the 2016 IEEE International Conference on Dielectrics (ICD 2016), Montpellier, France, 3–7 July 2016; Institute of Electrical and Electronics Engineers Inc.: Manhattan, NY, USA, 2016; Volume 1, pp. 313–317. [Google Scholar]
- Liu, C.; Zheng, Y.; Zhang, B.; Zheng, X.; Hu, S.; Han, K. Review of Nonlinear Conductivity Theory Research of Modified Composite Materials. IEEE Access 2019, 7, 50536–50548. [Google Scholar] [CrossRef]
- Katayama, J.; Ohki, Y.; Fuse, N.; Kozako, M.; Tanaka, T. Effects of Nanofiller Materials on the Dielectric Properties of Epoxy Nanocomposites. IEEE Trans. Dielectr. Electr. Insul. 2013, 20, 157–165. [Google Scholar] [CrossRef]
- Ramu, T.; Nagamani, H. Alumina and Silica Based Epoxy Nano-Composites for Electrical Insulation. IEEE Trans. Dielectr. Electr. Insul. 2014, 21, 236–243. [Google Scholar] [CrossRef]
- Yang, G.; Guo, Y.; Wang, D.; Wang, S.; Jia, R.; Li, P. Dielectric Characteristics of Epoxy Composites Modified with Nano ZnO in Non-Uniform Electrical Field. Gaodianya Jishu/High Volt. Eng. 2017, 43, 2825–2830. [Google Scholar] [CrossRef]
- Jeon, Y.; Hong, S.K.; Kim, M. Effect of Filler Concentration on Tracking Resistance of ATH-Filled Silicone Rubber Nanocomposites. Energies 2019, 12, 2401. [Google Scholar] [CrossRef] [Green Version]
- Li, S.; Yin, G.; Chen, G.; Li, J.; Bai, S.; Zhong, L.; Zhang, Y.; Lei, Q. Short-Term Breakdown and Long-Term Failure in Nanodielectrics: A Review. IEEE Trans. Dielectr. Electr. Insul. 2010, 17, 1523–1535. [Google Scholar] [CrossRef] [Green Version]
- Castellon, J.; Nguyen, H.N.; Agnel, S.; Toureille, A.; Frechette, M.; Savoie, S.; Krivda, A.; Schmidt, L.E. Electrical Properties Analysis of Micro and Nano Composite Epoxy Resin Materials. IEEE Trans. Dielectr. Electr. Insul. 2011, 18, 651–658. [Google Scholar] [CrossRef]
- Roy, M.; Nelson, J.K.; MacCrone, R.K.; Schadler, L.S.; Reed, C.W.; Keefe, R.; Zenger, W. Polymer Nanocomposite Dielectrics—The Role of the Interface. IEEE Trans. Dielectr. Electr. Insul. 2005, 12, 629–642. [Google Scholar] [CrossRef]
- Tanaka, T.; Montanari, G.C.; Mülhaupt, R. Polymer Nanocomposites as Dielectrics and Electrical Insulation- Perspectives for Processing Technologies, Material Characterization and Future Applications. IEEE Trans. Dielectr. Electr. Insul. 2004, 11, 763–784. [Google Scholar] [CrossRef]
- Tanaka, T. Dielectric Nanocomposites with Insulating Properties. IEEE Trans. Dielectr. Electr. Insul. 2005, 12, 914–928. [Google Scholar] [CrossRef]
- Roling, B.; Patro, L.N.; Burghaus, O.; Gräf, M. Nonlinear Ion Transport in Liquid and Solid Electrolytes. Eur. Phys. J. Spec. Top. 2017, 226, 3095–3112. [Google Scholar] [CrossRef]
- Han, Y.; Min, D.; Li, S. Nonlinear Conduction and Surface Potential Decay of Epoxy/SiC Nanocomposites. IEEE Trans. Dielectr. Electr. Insul. 2017, 24, 3154–3164. [Google Scholar] [CrossRef]
- Wang, X.; Nelson, J.; Schadler, L.; Hillborg, H. Mechanisms Leading to Nonlinear Electrical Response of a Nano P-SiC/Silicone Rubber Composite. IEEE Trans. Dielectr. Electr. Insul. 2010, 17, 1687–1696. [Google Scholar] [CrossRef]
- Han, Y.; Li, S.; Frechette, M.; Min, D. Nonlinear Conductivity of Polymer Nanocomposites: A Study on Epoxy Resin/Silicon Carbide Materials. IEEE Nanotechnol. Mag. 2018, 12, 23–32. [Google Scholar] [CrossRef]
Figure 1.
Preparation process.

Figure 2.
Schematic diagram of surface conductivity test system.

Figure 3.
Schematic diagram of doped nanostructured SiC and doped O-MMT composites with nonlinear surface conductivity properties.
Figure 3.
Schematic diagram of doped nanostructured SiC and doped O-MMT composites with nonlinear surface conductivity properties.

Figure 4.
SEM cross-sections of different composites. (a) DECJ; (b) 1 wt% SiC; (c) 1 wt% MMT.

Figure 5.
(a) Surface conductivity versus electric field strength curves for different micro-nano composites; (b) nonlinearity before and after threshold electric field strength.
Figure 5.
(a) Surface conductivity versus electric field strength curves for different micro-nano composites; (b) nonlinearity before and after threshold electric field strength.

Figure 6.
(a) Relationship between surface conductivity and field strength of micro-nano composites with different SiC nanoparticles; (b) nonlinear coefficient before and after threshold field strength.
Figure 6.
(a) Relationship between surface conductivity and field strength of micro-nano composites with different SiC nanoparticles; (b) nonlinear coefficient before and after threshold field strength.

Figure 7.
(a) Relationship between surface conductivity and field strength of micro-nano composites with different O-MMT contents; (b) nonlinear coefficient before and after threshold field strength.
Figure 7.
(a) Relationship between surface conductivity and field strength of micro-nano composites with different O-MMT contents; (b) nonlinear coefficient before and after threshold field strength.

Figure 8.
(a) Relationship between surface conductivity and field strength of doped nanostructured SiC micro-nano composites at different temperatures; (b) nonlinear coefficient before and after threshold field strength.
Figure 8.
(a) Relationship between surface conductivity and field strength of doped nanostructured SiC micro-nano composites at different temperatures; (b) nonlinear coefficient before and after threshold field strength.

Figure 9.
(a) Relationship between surface conductivity and field strength of doped O-MMT micro-nano composites at different temperatures; (b) nonlinear coefficient before and after threshold field strength.
Figure 9.
(a) Relationship between surface conductivity and field strength of doped O-MMT micro-nano composites at different temperatures; (b) nonlinear coefficient before and after threshold field strength.


Table 1.
Tested materials.
| Name | Notation | Production Manufacturer | Remarks |
|---|---|---|---|
| Epoxy resin composites | DECJ1345 | Dongfang Electric Corporation Limited, Chengdu, China | Epoxy resin blended with micron silicon carbide (72 wt%) |
| Curing agent | 593 | Dongfang Electric Corporation Limited, Chengdu, China | Diethylenetriamine and butyl glycidyl ether |
| Nano silicon carbide | SiC | Beijing Deke Daojin Science and Technology Co., Ltd., Beijing, China | Average particle size of 30 nm |
| Montmorillonite | MMT | Qinghe Chemical Factory, Zhangjiakou, Hebei, China | Average layer spacing of 1.25 nm |
| Octadecyl trimethyl ammonium chloride | S817662 | Shanghai Macklin Biochemical Co., Ltd., Shanghai, China | |
| Silane coupling agent | KH560 | Saen Chemical Technology (Shanghai) Co., Ltd., Shanghai, China |
Table 2.
Micro-nano structured composite materials.
| Number | Specimen Code | Specimen Formulation |
|---|---|---|
| 1 | DECJ | DECJ1345 |
| 2 | 0.5 wt% SiC | DECJ1345 + 0.5 wt% N-SiC |
| 3 | 1 wt% SiC | DECJ1345 + 1 wt% N-SiC |
| 4 | 3 wt% SiC | DECJ1345 + 3 wt% N-SiC |
| 5 | 4 wt% SiC | DECJ1345 + 4 wt% N-SiC |
| 6 | 0.5 wt% MMT | DECJ1345 + 0.5 wt% O-MMT |
| 7 | 1 wt% MMT | DECJ1345 + 1 wt% O-MMT |
| 8 | 3 wt% MMT | DECJ1345 + 3 wt% O-MMT |
| 9 | 4 wt% MMT | DECJ1345 + 4 wt% O-MMT |
Publisher’s Note: MDPI stays neutral with regard to jurisdictional claims in published maps and institutional affiliations. |
© 2022 by the authors. Licensee MDPI, Basel, Switzerland. This article is an open access article distributed under the terms and conditions of the Creative Commons Attribution (CC BY) license (https://creativecommons.org/licenses/by/4.0/).
Share and Cite
MDPI and ACS Style
Guo, N.; Sun, J.; Li, Y.; Lv, X.; Gao, J.; He, M.; Zhang, Y. Nonlinear Surface Conductivity Characteristics of Epoxy Resin-Based Micro-Nano Structured Composites. Energies 2022, 15, 5374. https://doi.org/10.3390/en15155374
AMA Style
Guo N, Sun J, Li Y, Lv X, Gao J, He M, Zhang Y. Nonlinear Surface Conductivity Characteristics of Epoxy Resin-Based Micro-Nano Structured Composites. Energies. 2022; 15(15):5374. https://doi.org/10.3390/en15155374
Chicago/Turabian StyleGuo, Ning, Jiaming Sun, Yunlei Li, Xiaoyu Lv, Junguo Gao, Mingpeng He, and Yue Zhang. 2022. "Nonlinear Surface Conductivity Characteristics of Epoxy Resin-Based Micro-Nano Structured Composites" Energies 15, no. 15: 5374. https://doi.org/10.3390/en15155374
Note that from the first issue of 2016, this journal uses article numbers instead of page numbers. See further details here.