Article

Potential Benefits for Residential Building with Photovoltaic Battery System Participation in Peer-to-Peer Energy Trading

1
Department of Electrical Engineering and Electronics, University of Liverpool, Liverpool L69 3BX, UK
2
College of Science and Engineering, James Cook University, Douglas 4811, Australia
3
Department of Electrical and Electronic Engineering, Xi’an Jiaotong-Liverpool University, Suzhou 215000, China
4
Department of the Built Environment, College of Design and Engineering, National University of Singapore, Singapore 117566, Singapore
*
Author to whom correspondence should be addressed.
Current address: College of Science and Engineering, James Cook University, Smithfield 4878, Australia.
Energies 2022, 15(11), 3913; https://doi.org/10.3390/en15113913
Submission received: 30 April 2022 / Revised: 19 May 2022 / Accepted: 20 May 2022 / Published: 25 May 2022

Abstract

:
The increasing number of residential buildings that are installing distributed energy resources enforces the need for schemes to facilitate a local energy balance. With the continuing evolution of Internet of Things (IoT) technology, Peer-to-Peer (P2P) energy trading is becoming a viable solution to incentivize prosumers and promote efficient energy sharing in a community. This paper develops a model to quantitatively analyze the potential benefits of P2P energy trading for residential buildings that have installed photovoltaic battery systems. The integration of the bidding strategy into a residential energy-management system is feasible to realize cost savings for prosumers. However, the coordination between the bidding strategy and the optimal scheduling of energy has received far too little attention. To better participate in the P2P market, we propose a novel separate bidding energy-management system (SBEMS) that can realize rolling optimal energy scheduling while determining energy bids. The model’s effectiveness is verified via case studies of 75 participants in a community. The results indicate that the prosumers can reduce their costs by up to 24% by employing the proposed SBEMS in the P2P market. In addition, the proposed method is found to offer better performance in terms of economic and technical indices.

1. Introduction

Inspired by regulatory incentives and plummeting costs, the installation of distributed energy resources (DERs) is boosting. In particular, the amount of residential photovoltaic (PV) generation in the United States has been reported to increase from 4947 GWh to 25,370 GWh between 2014 and 2020 [1]. Meanwhile, sold-back energy from small-scale residential was 78,760 MWh in 2020, exceeding the commercial and industrial sectors [2]. A coordinated effort among multiple DER owners can improve local energy utilization and facilitate the efficient scheduling of flexible loads [3].
A large number of residential consumers have been transformed into prosumers. This situation necessitates providing them with automated tools to help them fulfil their energy-related transactions and management [4]. Meanwhile, smart grids are undergoing technological advancement, including the development of the so-called smart home, the installation of ubiquitous smart metering devices, and the evolution of Internet of Things (IoT) technology [5,6]. Prosumers will, therefore, be able to possess PV, household batteries, smart meters, and energy-management systems, allowing them to manage their energy demand and generation on a proactive basis [7]. When coordinated properly, DERs owned by prosumers can bring significant value to the grid by reducing losses and alleviating network constraints. Otherwise, it may be necessary to curtail renewable energy sources or upgrade expensive infrastructures [8,9,10]. The existing energy market arrangements are not conducive to active coordination within the distribution network. Producing and consuming on such a small scale cannot be integrated into the wholesale market distribution system [11]. Therefore, it is expected to stimulate the development of schemes that facilitate interactions between these prosumers and consumers in the energy-sharing context.
Conventionally, the feed-in tariff (FiT) scheme has been implemented by market operators to incentivize prosumers to sell their energy surplus to power grids [12,13]. However, delivering power from low-voltage distribution networks to a high-voltage transmission grid over a long distance can result in significant transmission losses [14]. Furthermore, this scheme does not provide the opportunity of trading freedom for the prosumers.
In this context, the Peer-to-Peer (P2P) energy trading paradigm encourages localized transactions [15,16,17] and provides a remedy for this problem. P2P trading reduces the stress on the grid supply compared to traditional FiT and presents the potential for promoting local energy consumption and offering greater profits to participants [18,19].
In a P2P market, demand refers to the quantity of energy a buyer needs, and supply refers to how much energy the sellers can provide. From the economic perspective, P2P trading mechanisms can be classified into four categories, namely, supply and demand ratio (SDR) [20,21,22,23,24], mid-market rate (MMR) [22,23,24], bill sharing (BS) [22,23,24], and double auction (DA)-based trading [25,26,27,28,29,30,31]. The SDR, MMR, and BS methods adopt a unified clearing method and do not allow participants to submit their price orders. There is generally a lack of communication between participants in the trading process, and, as a result, they are unable to determine whether the transaction results will meet their expectations [23]. Accordingly, in order to meet the increasingly flexible needs of market participants, the DA mechanism is being implemented to enable prosumers to participate more actively in the trading process, including the submission of orders, demands, and bids [27,32]. Specifically, in the DA mechanism, only the orders that meet or exceed the participants’ expectations will be traded. Transaction prices are determined by the current market order matching scenario, which may be either uniform or non-uniform [25]. With predefined rational goals (participants only trade at a profit), the DA transaction always moves toward a Pareto optimal allocation, thus resulting in more balanced and efficient commodity trading [33]. In this regard, proper bidding strategies and energy management programs become critical to reaping the benefits of a DA-based market.
Residential buildings are subject to greater randomness than commercial buildings in terms of energy management since individual consumption patterns are more difficult to predict. Solar photovoltaic systems that integrate battery storage devices are a preferred solution that provides flexibility [34]. The cost-effectiveness of a clean energy fee structure can be realized when the residence is equipped with a PV battery system [35], reducing the demand reliance of the residence upon the central electrical system [36]. The use of distributed battery storage can reduce the load on the transmission network in addition to lowering conversion and transmission losses [37]. In addition, the energy storage between residential units can be shared using an auction-based mechanism [38]. Battery applications in the P2P market demonstrate their potential to benefit both the power network and prosumers [18,20,39,40,41,42]. As a result of its controllability, the battery can be used for energy balance [20,40], as well as improving economic benefits [18,41,42,43]. While the batteries offer more flexibility in terms of trading, their operational costs need to be factored into the control and bidding procedures. Conversely, uncontrollable devices such as PV generation incur zero marginal cost but offer less flexibility [5]. Therefore, it is imperative that energy management considers both flexibility and energy trading profit to reduce the total costs.
Researchers have proposed a variety of strategies for DA-based P2P energy trading. In [29], the zero intelligence (ZI) and eyes on the best (EOB) strategies were applied to a DA-based P2P market. The results indicate that even market participants with little learning ability and trading knowledge can fairly benefit from the bidding mechanism. The work in [27] compares three bidding strategies, namely, the best-offer approach, ZI, and market-power approach in a DA market. The key findings indicate that the best bidding strategy is the best-offer game theory approach, which shows near ideal economic efficiency and outperforms other strategies on three indicators. A novel adaptive aggressiveness (AA) bidding strategy is proposed in [30], wherein autonomous trading agents can be used to participate in the continuous double auction (CDA) market. The agent updates the aggressiveness of its bidding behavior based on the market information observed after every bid or ask appears in the market to improve the economic benefits. In [31], a novel electricity transaction mode based on Blockchain and CDA is proposed, and three bidding strategies(ZI, ZI-plus, AA) are analyzed. The results show that the CDA mechanism can be used in community electricity transactions, and the AA strategy can help market participants make significant returns. The authors of these papers are concerned with developing new bid strategies. Nevertheless, the coordination of bidding behaviors with energy scheduling decision making has not been considered simultaneously, and the characteristics of different devices were neglected. In addition, it is not yet clear which strategies may be most effective in a residential building equipped with a PV battery system. It would be ideal for residential participants to modify their energy plans according to the transaction information and the bidding strategies to assure greater benefits.
In light of the above, we attempt to investigate the potential benefits derived from residential prosumers participating in P2P energy trading. Furthermore, an energy-management system that incorporates separate bid strategies for controllable and uncontrollable devices will help to address the differences in device schedules and costs. However, the roles of separate bidding strategies for controllable and uncontrollable devices remain unclear. In most previous studies, participants were assumed to employ the same strategy when bidding at an auction. Nevertheless, participants in a real market may implement different strategies, leading to entirely different outcomes. Similarly, retail price variations may also influence participants’ decisions and should be considered accordingly.
To solve the above-mentioned problems, this paper aims to develop a P2P energy trading model to explore whether it can facilitate the integration of DERs for residential buildings and benefit residents. In addition, we developed an energy-management system to coordinate scheduling and bidding strategies. In comparison with the conventional energy-management system, the proposed system is able to process bids separately to achieve individual optimization. The main contributions of this paper can be summarized as follows:
  • A P2P energy trading model is developed; the trading framework includes a FiT scheme for the retail market and a discriminatory CDA trading mechanism for the P2P energy trading coordinator.
  • A SBEMS is proposed to realize rolling optimal energy scheduling while determining energy bids. With respect to the previous works of the energy-management systems, this method integrates two strategies for enhancing participation in the P2P market.
  • Simulations of the competition between prosumers on the local P2P market are examined using three strategic combinations under an imposed dynamic retail price. A discussion of the potential benefits of residential prosumers who have installed a PV battery system participating in P2P energy trading systems is evaluated using five indices.
The remainder of this paper is organized as follows. Section 2 provides an overview of the P2P trading scheme and the trading algorithm. Section 3 describes the SBEMS model. Section 4 demonstrates case studies of a community with 75 residents. Section 5 presents a conclusive summary of the study.

2. P2P Trading Scheme Description

This section describes the implementation of a community based on a P2P market. That said, each prosumer within the community submits their own bids and only shares the required information without the central control.

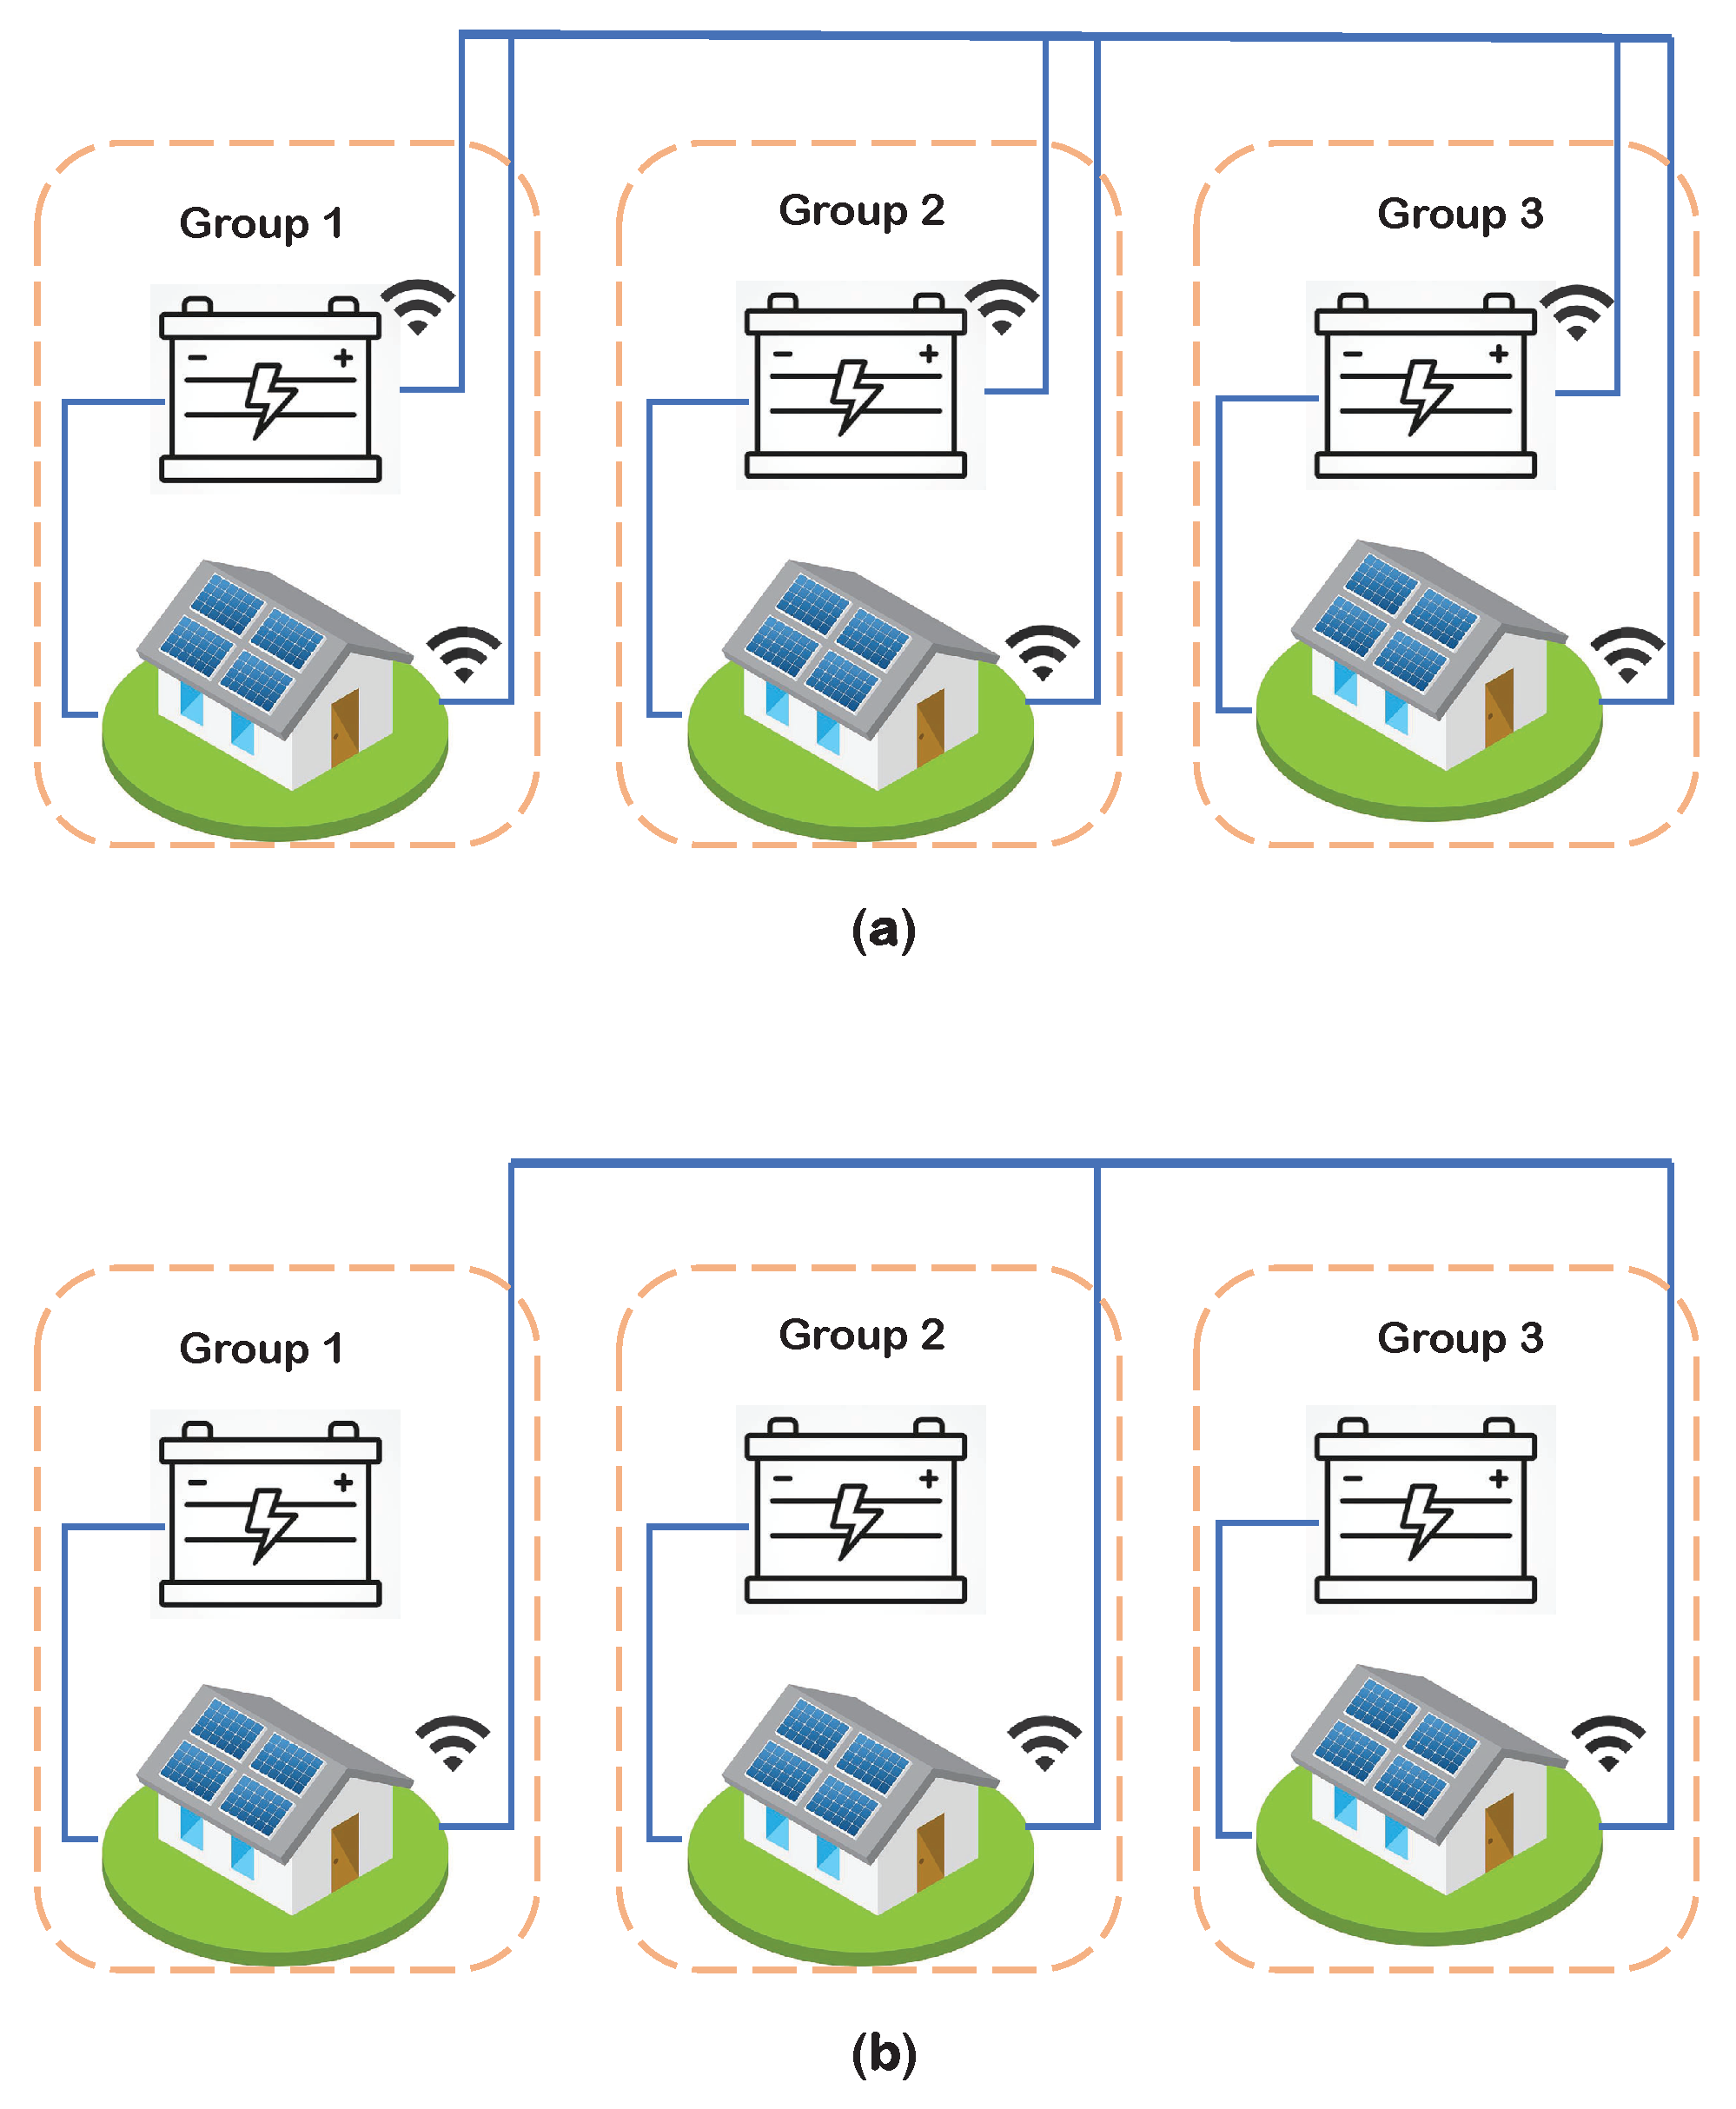
2.1. P2P Trading Framework

As mentioned previously, the CDA-based P2P market structure is suitable for privacy-conscious residents, because they only submit prices and energy orders without losing control of the DERs. Prosumers can also trade with the external retail market at specific retail and export prices. They will prefer trading energy locally through the P2P trading platform to obtain a better potential benefit. As shown in Figure 1, the P2P trading framework includes three information and two physical layers. Each information layer has its specific function, and the trading data are exchanged through the information network. Since a consumer can be regarded as a prosumer with zero energy production, they will be referred to as prosumers in the rest of this paper. Referring to Figure 1, the functionalities of each section will be introduced in the following sections.
Energy Trading Coordinator (ETC): In the P2P energy trading scheme, prosumers first trade their power generation and consumption directly with each other at market-clearing prices. The ETC manages transactions via the CDA mechanism, which can be implemented as a self-contained web platform that does not require human intervention. Its main functions are setting and executing trading rules, monitoring energy trading activities, as well as metering, billing, and information sharing. Likewise, ETC will protect the privacy of participants; their individual information and order/transaction information will remain confidential. The CDA-based market comprises a series of concurrent time-slots, and the ETC shares the transaction information in real time.
Retail Market: After a local P2P transaction is completed, the unbalanced energy (unfilled orders) of prosumers will continue to be replenished in the retail market and exchanged with the power grid. Under the FiT scheme, the electricity surplus and electricity deficit of prosumers are settled by the retail market at the export and retail prices, respectively. To encourage prosumers to consume locally, the export price is usually set much lower than the retail price of electricity purchased from the grid [23].
Energy-Management System (EMS): EMS is responsible for controlling batteries and making bidding decisions. To make sure that residents’ habits are not affected, we consider only controlling the battery without shifting the load. Before each transaction, the system performs a rolling optimization by using the collected data to make control decisions. These data include load data, PV power generation, battery operation information, external market transaction information, and billing information.
The interaction between the information and the physical layers is reflected in Figure 1. The trading procedures act as a rolling transaction. In the first step, each prosumer’s SBEMS makes their own energy consumption schedule and submits individual bids to the ETC in the first 15 min at the beginning of a trading cycle. Next, the ETC determines the MCP, as shown in the diagram of the CDA mechanism. This method guarantees that the total welfare will be maximized through the sorting principle and clearing algorithm [25,27]. Most generally, the market-clearing price is set between the retail and export price so that each seller and buyer can benefit from the P2P market. The transaction results will then be announced and sent to prosumers within 15 min after the submitted order has been processed. The third step is to execute the successfully matched orders within 15 min after receiving ETC feedback, and the bidding process for the following transaction will begin as well. At the same time, the unbalanced energy is traded on the retail market based on meter measurements without the need for the participant to bid again. The final step is that the ETC and the retail market generate bills and then send them to prosumers. The settlement period can be determined according to market conditions, and a daily settlement is adopted in this paper.

2.2. CDA Transaction Formulation

There are several underlying assumptions in implementing CDA transactions. A fair machine executes an automated auction following an algorithmic formulation. Orders containing participant information are converted into numbered orders, protecting the participants’ privacy. To maintain a weak budget balance, the sellers can only sell energy for a price below or equal to the buyers’ price, whereas the buyers can purchase energy for a price that is above or equal to the sellers’ price. The low-price-first-match strategy can effectively encourage competition among prosumers and attract consumers with a lower market-clearing price. Following the nature ordering rule, bid prices are sorted in descending order, while ask prices are sorted in ascending order. When k = 0.5, the CDA with the average mechanism will exhibit individual rationality, economic efficiency, and budget balance [27]. The market-clearing price is determined between each matched pair. Therefore a single market-clearing price will not exist in each auction interval.
It should be noted that the energy order can be regarded as a single divisible commodity under the k-discriminatory CDA market mechanism, which allows one prosumer to trade with several other prosumers. The full-day trading time is divided into several periods (in this paper, the length of each period Δ t = 15 min). In the trading period, prosumer i will submit energy selling orders which queue in the order book buy ( O B B ), and energy purchasing orders of prosumer j queue in the order book sell ( O B S ). The order book at t is shown in (1) and (2).
O B B t = B i , 1 , Q i , 1 B B i , m , Q i , m B
O B S t = S j , 1 , Q j , 1 S S j , n , Q j , n S
The transaction algorithm set in this paper is summarized in Algorithm 1. The clearing prices and volumes were derived using the transaction algorithm after sorting the orders in O B B and O B S by price. The clearing results ensure that social welfare is maximized due to the sorting principle and the average mechanism [25].
Algorithm 1:The transaction algorithm of t.
Input: O B B t , O B S t
Output: clearing price P j , i , m , n T , Transaction quantity Q j , i , m , n T
1:
Initial: n = m = i = j = 1 ;
2:
while do S j , n B i , m
3:
    if  Q j , n s = 0  then
4:
         n = n + 1 ;
5:
    end if
6:
 
7:
    if  Q i , m B = 0  then
8:
         m = m + 1 ;
9:
    end if
10:
 
11:
     P j , i , m , n T = B i , m S j , m k + S j , m ;
12:
 
13:
    if  Q j , n S Q i , m B  then
14:
         Q j , i , m , n T = Q i , m B Q j , n S ;
15:
         Q j , n S = 0 ;
16:
         Q i , m B = Q i , m B Q j , i , m , n T ;
17:
         j = j + 1 ;
18:
    end if
19:
 
20:
    if  Q i , m B Q j , n S  then
21:
         Q j , i , m , n T = Q j , n S Q i , m B ;
22:
         Q i , m B = 0 ;
23:
         Q j , n S = Q j , n S Q j , i , m , n T ;
24:
         i = i + 1 ;
25:
    end if
26:
 
27:
    if  j > length of O B S t or i > length of O B B t  then
28:
        break;
29:
    end if
30:
end while

3. Separate Bidding Energy-Management System Model

This section introduces the proposed SBEMS model for controllable and uncontrollable devices, including battery, PV, and load. Considering the local prosumers installed with PV and battery in the secondary distribution network, the function of SBEMS is to manage battery scheduling and share information with the ETC according to optimization strategies. Conventionally, the battery is used as a backup system to complement the intermittent PV generation [18,40]. In that case, battery units are charged with PV power during the daytime and discharged to supply higher residential load demands in the evening. On the other hand, the battery can also be used for arbitrage when there is a price difference in electricity prices [44]. That said, batteries can discharge at high electricity prices and charge low electricity prices. Generally, the battery is not designed to have the right to bid alone in these situations.
The CDA transaction can be considered to be a non-cooperation game, where the buyers and sellers know only their own valuations. The CDA ranking rules do not require prosumers to negotiate with one another, so there is no need for information sharing between them. Accordingly, this paper assumes that there is no cooperation among prosumers, but rather that they only maximize their self-interests strategically. Individual prosumers will devise their own energy management plans and bidding strategies based on the information about their DERs and the prices revealed by the retail market.
Due to the flexibility of controllable devices, their bidding strategy will be different from that of uncontrollable devices. Therefore, unlike previous studies where a prosumer only needed to submit one order, in this paper, we consider that a prosumer can submit two orders with different prices and electricity quantities. One potential benefit of this separate bidding is that, when the profit of the controllable devices does not meet the expectation, the device can choose not to respond. As a controllable device, the battery will submit an order separately following the controllable device’s bidding strategy, with retail market price information, P2P market price information, PV, and load.The load and PV are regarded as uncontrollable devices, so they submit an order simultaneously. Furthermore, it is recommended that prosumers avoid simultaneous purchase and sale orders, since self-utilization is the most advantageous method.
The objective function for SBEMS is displayed in (3), which relates to load, PV, battery data, and price information from the ETC and the retail market. The optimization of SBEMS operation allows for the minimization (or maximization) of any project function S t and can be solved by many available solvers (e.g., IBM CPLEX and Gurobi). In this case, the aim is to minimize the cost of electricity and obtain the maximum potential revenue from the PV and battery. Before each trading cycle, SBEMS optimizes the individual household benefit from the bidding period t to the future period ( t + m · Δ t ) , then generates orders and realizes optimal control of the battery. Meanwhile, the market-clearing price of the local P2P market has a price floor of the FiT export price and is capped by the incumbent electricity retail price. Thus, the SBEMS sets the maximum trading price for each bidding decision for the real-time retail price, and the minimum is the real-time export price.
S t = min t t + m · Δ t p r t d i s c h a p r t P p r t d e m + c t P + c t c h a
The battery control is activated only when the profit is higher than the operating cost. We assume that the battery operating cost c B E S mainly comes from two aspects. On one hand, frequent charging and discharging will reduce the life cycle of the battery. The purchase cost of the battery is then divided by the total number of charge–discharge cycles. On the other hand, the utilization efficiency of the battery cannot reach 100%, and each charge/discharge of the battery can cause a certain amount of energy waste. Hence, the operational cost of a battery, c B E S , should also be taken into account during the decision-making process.
The battery-charging cost is shown in (4). The power can be obtained through three ways: PV power generation C t V , energy purchase in the P2P market C t P , and energy purchase in the retail market C t G . To promote self-consumption, charging from the PV is set as the cheapest way at minimum price P i E x p , and charging from the retail market is the most expensive way at the highest price P i R e t .
c t c h a = P i E x p · C t V + B t B E S · C t P + P i R e t · C t G · c B E S · Δ t
The profit from battery discharging is shown in (5). The power discharged by the battery can be sold to the retail market at the lowest price P t E x p , to the P2P market at battery bidding price S t B E S , and used by the load at the highest price P i R e t . Due to the price uncertainty in the local P2P market, this assumption is most beneficial when replenishing the household load.
p r t discha = P t E x p · D t G + S t B E S · D t P + P i R e t · D t D · c B E S · Δ t
The cost of electricity purchased from the P2P market is presented in (6), and the income from selling electricity is shown in (7), where the bid price is set according to the uncontrollable device bidding strategy.
c t P = B t P · E B P t · Δ t
p r t P = S t P · E S P t · Δ t
Compared with the abovementioned situation that all devices submit one order into the market, this objective function includes the profit S t B E S · D t P and cost B t B E S · C t P of battery participation in the P2P market. These two variables are not included in the consideration of a conventional unified bidding strategy.
The profit of the PV electricity surplus supplementing the users’ load is presented in (8). The price set as the highest price indicates that residents are encouraged to give priority to self-consumption of excess PV power to avoid transmission losses.
p r t d e m = P t R e t · p v t D · Δ t

3.1. Battery Constraints

The battery energy flow model considers power charging and discharging, operation efficiency, and storage level. The proposed algorithm does not allow the battery to charge and discharge simultaneously. The battery’s charging and discharging rate is limited to a specified rate as shown in (9) and (10), where C M a x and D M a x are the maximum allowable charging and discharging power, and C M i n and D M i n are the minimum allowable charging and discharging power. The physical characteristic of the battery, as described in (11), where a lower bound and an upper bound limit the storage level S O C . The state of charge for the battery in a time step t is determined by Equation (12).
C M i n C t V + C t P + C t G C M a x
D M i n D t G + D t P + D t D D M a x
S O C M i n S O C t S O C Max
S O C t = S O C t Δ t + η C C t V + C t P + C t G 1 η D D t V + D t P + D t G

3.2. Energy Balance Constraints

Each prosumer’s power flow balance is required amongst the PV, battery, load, P2P market, and the utility grid. Constraint (13) means that the electricity obtained from the PV should not exceed the maximum generation value p v t M a x . Equation (14) indicates that the energy obtained from the battery, D t D , P2P market, E B P t , and PV + p v t D must meet the resident’s load usage d e m t .
C t V + E S P t + p v t D p v t M a x
D t D + E B P t + p v t D = d e m t

3.3. Controllable Device Bidding Strategy

The bidding price and quantity relationship can be expressed as a linear equation for the controllable device. This bidding strategy involves generating bids and optimizing energy control. In this work, only the battery is treated as the controllable device for bidding, since load shifting is not considered. The time-varying price in a P2P market allows participants to arbitrage by buying energy at a low price and selling it at a higher price.
Participants do not know the bidding strategies of other people in the market, so they set the probability of accepting the bid based on the retail and export prices. Equation (15) shows the relationship between bid acceptance probability and the bidding price for purchasing energy from the P2P market. Due to CDA’s sorting mechanism, sellers will be the first to match when they offer the lowest price, and then they will be ranked at the end when they offer the highest price and lose orders. Similarly, buyers can easily receive orders when the bid price is the highest, and the chance of matching is easily lost when the bid price is the lowest. It is assumed that when the bidding price is set to the highest, the probability of winning the purchase request is 100%, and at the lowest price, the probability is 0%. Buyers tend to buy more quantity when the energy price is low, while the probability of winning needs to be taken into account as in (16).
ρ t B = B t B E S P t R e t P t E x p P t E x p P t R e t P t E x p
C t P = C M a x C Min P t R e t P t E x p · B t B E S + c B E S · ρ t B + C M a x · P t R e t + C M i n · P t E x p P t R e t P t E x p · ρ t B w 1
The seller’s bidding strategy is opposed to the one of buyer’s, with the goal of selling more electricity at a higher price. Equation (17) represents the bid acceptance probability for the seller. The higher the bid price is set, the lower the probability of winning becomes. The sellers’ bidding decision equation is shown in (18).
ρ t S = 1 S t B E S P t R e t P t E x p + P t E x p P t R e t P t E x p
D t P = D M a x D M i n P t R e t P t E x p · S t B E S c B E S · ρ t S D M a x · P t R e t D M i n · P t E x p P t R e t P t E x p · ρ t S w 2
The order generation constraints are shown in (19) and (20), which state that the purchase order is submitted when the battery is charging, and the selling order is submitted when the battery is discharging.
Q j , n B = C j , t P , B j , n = B t B E S ; C j , t P > 0
Q j , n S = D j , t P , S j , n = S t B E S ; D j , t P > 0

3.4. Uncontrollable Device Bidding Strategy

The strategy for uncontrollable devices is different from that for controllable devices, as it does not need to consider optimal energy control. A residential load and PV are considered to be uncontrollable devices in this study. According to [5], renewable energy has a zero marginal cost and is intermittent. Therefore, the purpose of bidding for PV is to increase local consumption (self utilization and P2P trading) in order to maximize the yield. Considering the potential savings on energy costs from the P2P market, it is recommended that the load purchase electricity primarily from this market.
The strategy for uncontrollable energy is a modified best-offer approach. Due to the natural ordering rules, sellers with lower prices can clear their bids before sellers with higher prices. In other words, a seller must bid lower than all other sellers in order to win a non-zero return. This is described as a ’winner-takes-all’ situation, because the losing party receives a zero payoff. One of the benefits of this strategy is that it can ensure orders for the uncontrollable device can be traded first and avoid unnecessary waste.
Best-Offer Approach: Prosumers compete in bidding at the best price, regardless of the market’s supply and demand. In this case, the ask price from the buyer is always set as the maximum trading price, and the bid price of the seller is set as the minimum trading price. In [5], it is mentioned that the marginal cost of renewable generation outputs is zero, so the bid price of the energy surplus should be set to zero according to the best-offer approach. However, this assumption might not be suitable for the trading rules in this paper. Instead, we modify the best-offer approach so that, even if the prosumer does not participate in the P2P market, the energy surplus can be sold to the retail market at an export price to make a profit. Similarly, the price of the energy deficit purchased on the P2P market should not exceed the retail price, otherwise the electricity bill will increase. Participating in the P2P market is aimed at obtaining greater potential profits, so the minimum limit of the best-offer approach is set as the real-time export price, and the maximum limit is set as the real-time retail price. This strategy seeks to maximize the local consumption of PV generation while increasing the profit of all prosumers. Orders can be generated as follows:
Q j , n S = E S P j , t , S j , n = P t E x p ; E S P j , t > 0
Q j , n B = E B P j , t , B j , n = P t R e t ; E B P j , t > 0
Consider the possibility that residential participants may use several competing strategies simultaneously. We introduce two other bidding strategies to compare with the proposed strategy to evaluate its performance. The AA method is a strategy proposed for double auction transactions. Users need to consider historical market-clearing prices and bidding success rates to pursue more benefits. We have also implemented a ZI strategy in consideration of the fact that market participants may exhibit unpredictable behavior. When these mixed strategies are entered into the unified market, this can determine if the separate bidding strategy will be affected.
Adaptive-Aggressiveness Approach: AA strategy is an adaptive learning quotation strategy, which involves a short-term and a long-term learning mechanism to update the prosumer’s bidding aggressiveness to remain competitive in the market [30,31]. This strategy can change the behavior of market participants according to different situations. When a bid fails, it has the option of being more active to increase its odds of being able to trade. On the other hand, when the bid is successful, it can choose to become more conservative in an attempt to increase its profits. In other words, participants can react to market information by taking more or less aggressive actions based on their market performance. In (23), P ^ can be calculated using the moving average method, based on the historical clearing prices, where i = t N + 1 t w i = 1 , w i 1 = ρ w i .
P ^ = i = N t w i × P i T N
The role of the aggressiveness model is to generate the current target price given the prosumers’ current degree of aggressiveness. The adaptive learning process refers to both parties’ short-term and long-term learning to adjust r and θ according to market information. Short-term learning performance is as shown in (24) and (25).
r ( t + 1 ) = r ( t ) + β 1 ( δ ( t ) r ( t ) )
δ ( t ) = 1 ± λ r r shout ± λ a
The long-term learning performance is as follows:
θ ( t + 1 ) = θ ( t ) + β 2 θ * ( α ) θ t
α = 1 P ^ i = 1 N P t T P ^ 2 N
θ * ( α ) = θ max θ min 1 α α min α max α min e 2 α α min α max α min 1 + θ min
In the bidding layer, the prosumer employs a set of bidding rules to decide whether or not to submit a bid or an ask and at what price if it decides to do so. The pricing strategy of the seller as (29) and the pricing strategy of the buyer is expressed as (30), where η [ 1 , ) is a constant that determines the rate of increase (decrease) of the bids (asks).
S t P = P t E x p + τ P t E x p / η
B t P = P t R e t P t R e t τ / η
Zero-Intelligence Strategy: ZI strategy assumes that each prosumer will bid randomly without any strategic expectation and ignores the market’s historical price and cost of electricity [27]. We assume that bid/ask prices are randomly sampled from a uniform distribution ranging from the real-time retail and export prices. Some studies [27,45,46] have demonstrated that prosumers can benefit from local interactions on the demand side and trade in electricity surplus, even in situations of zero intelligence.

3.5. Bidding Constrains

Assuming that the prosumers participating in the P2P market are rational, they expect to obtain greater benefits than participating in the retail market, so the setting of bidding action constraints is reasonable. If an order submitted by a prosumer exceeds the FiT scheme’s price range, the order is not competitive in the P2P market. Therefore, the bidding price should be controlled within the maximum and minimum price range. The bidding price for uncontrollable devices is constrained by (31) and (32). For the controllable devices, the bidding price range can be adjusted according to the prosumer’s expectations as shown in (33) and (34).
P s M i n S s P P s M a x
P s M n B s P P s M a x
P s M i n + λ B E S S s B E S P s M a x
P s M i n B s B E S P s M a x λ B E S

4. Case Studies

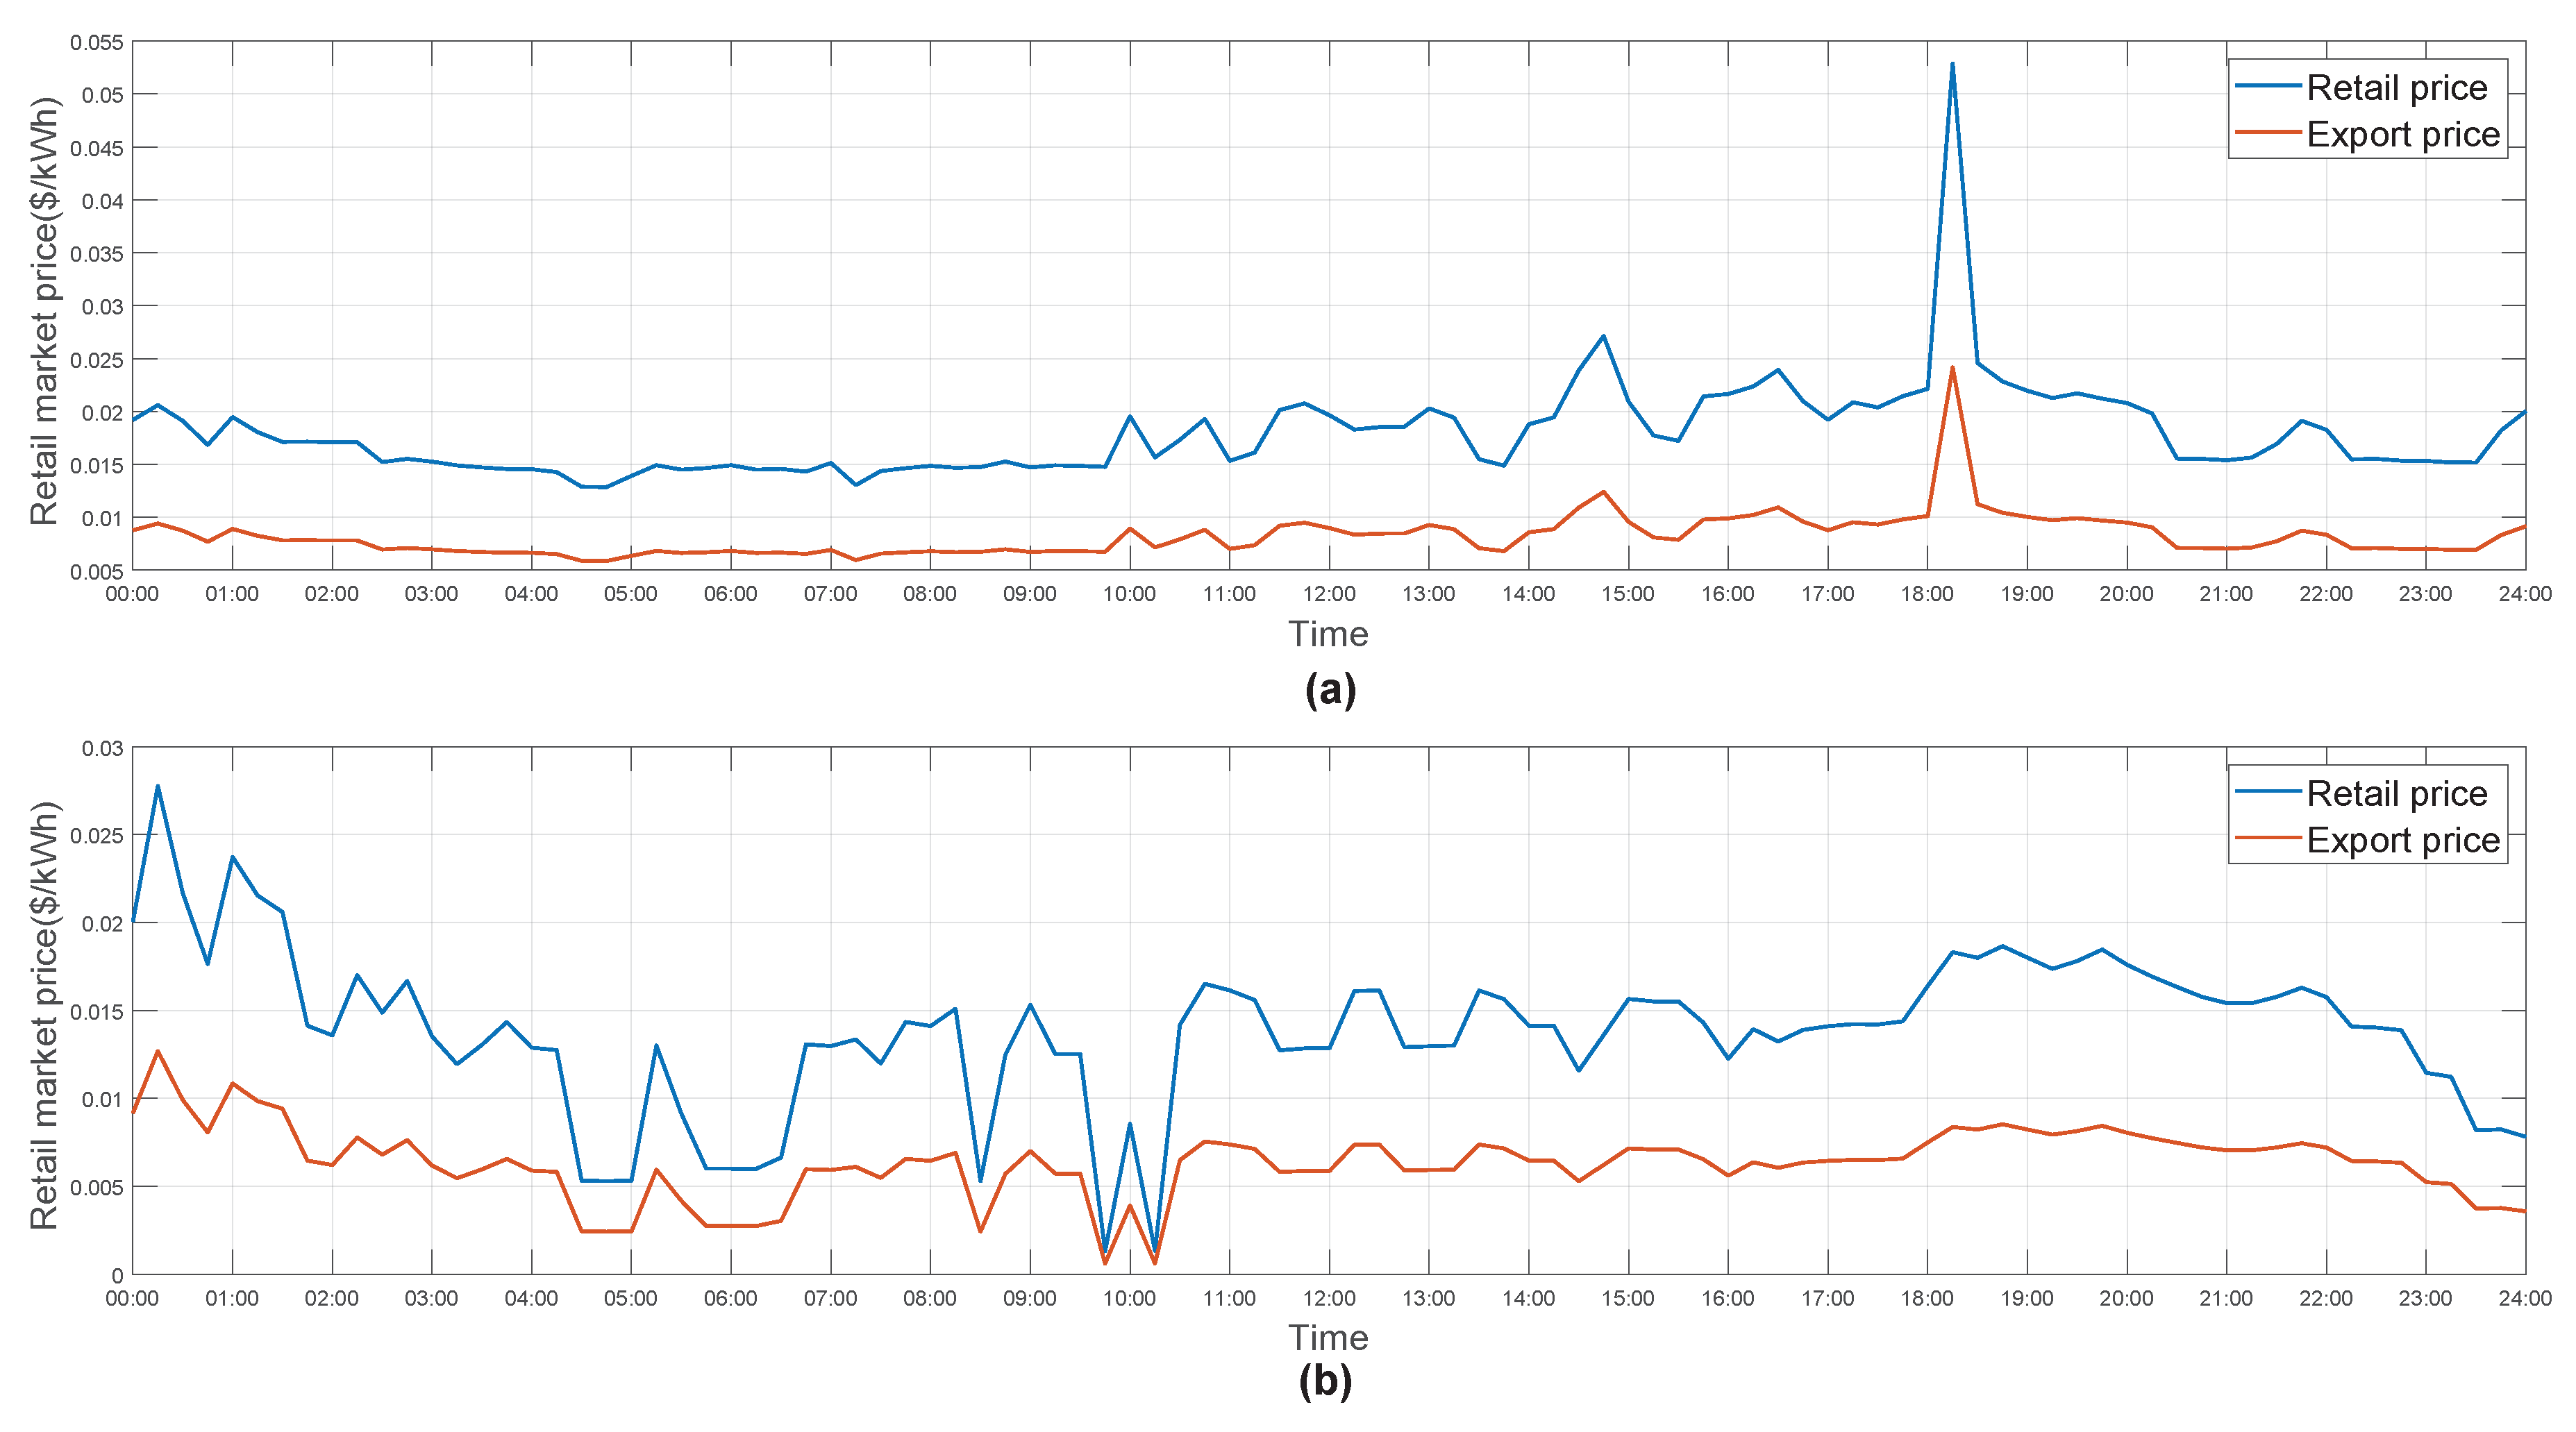
4.1. Simulation Platform and Data

To ensure the fidelity of the simulated P2P transaction model, we use household load/generation datasets and real-time power market prices collected in New York, USA [47,48]. The electricity consumption data and PV generation data from real-world measurements were taken from Pecan Street in June 2019, which measures circuit-level electricity usage and generation from volunteer homes. We assume that the retail price in the simulation is the real-time power market price from New York in June 2019 and set the export price as 45% of the retail price. A total of 75 single-family households in a community are simulated to utilize different bidding strategies to participate in the local P2P market. All cases are implemented based on MATLAB, among which the SBEMS model calls the CPLEX optimization toolbox and Yalmip toolbox.
As shown in Figure 2, the 75 households are divided into three groups to adopt three bidding strategies, i.e., Group 1 (ZI), Group 2 (AA), and Group 3 (Best-Offer). A total of 25 unique load/generation portfolios were used within each group, and seven prosumers in each group are assumed to have a battery–PV system. The parameters of the battery can be found from [41]. Two sets of cases are simulated. As shown in case 1, which is based on the SBEMS proposed in this paper, the battery has its bidding strategy and communication functions. In contrast, the battery in the reference case does not have its bidding strategy and can only be controlled.

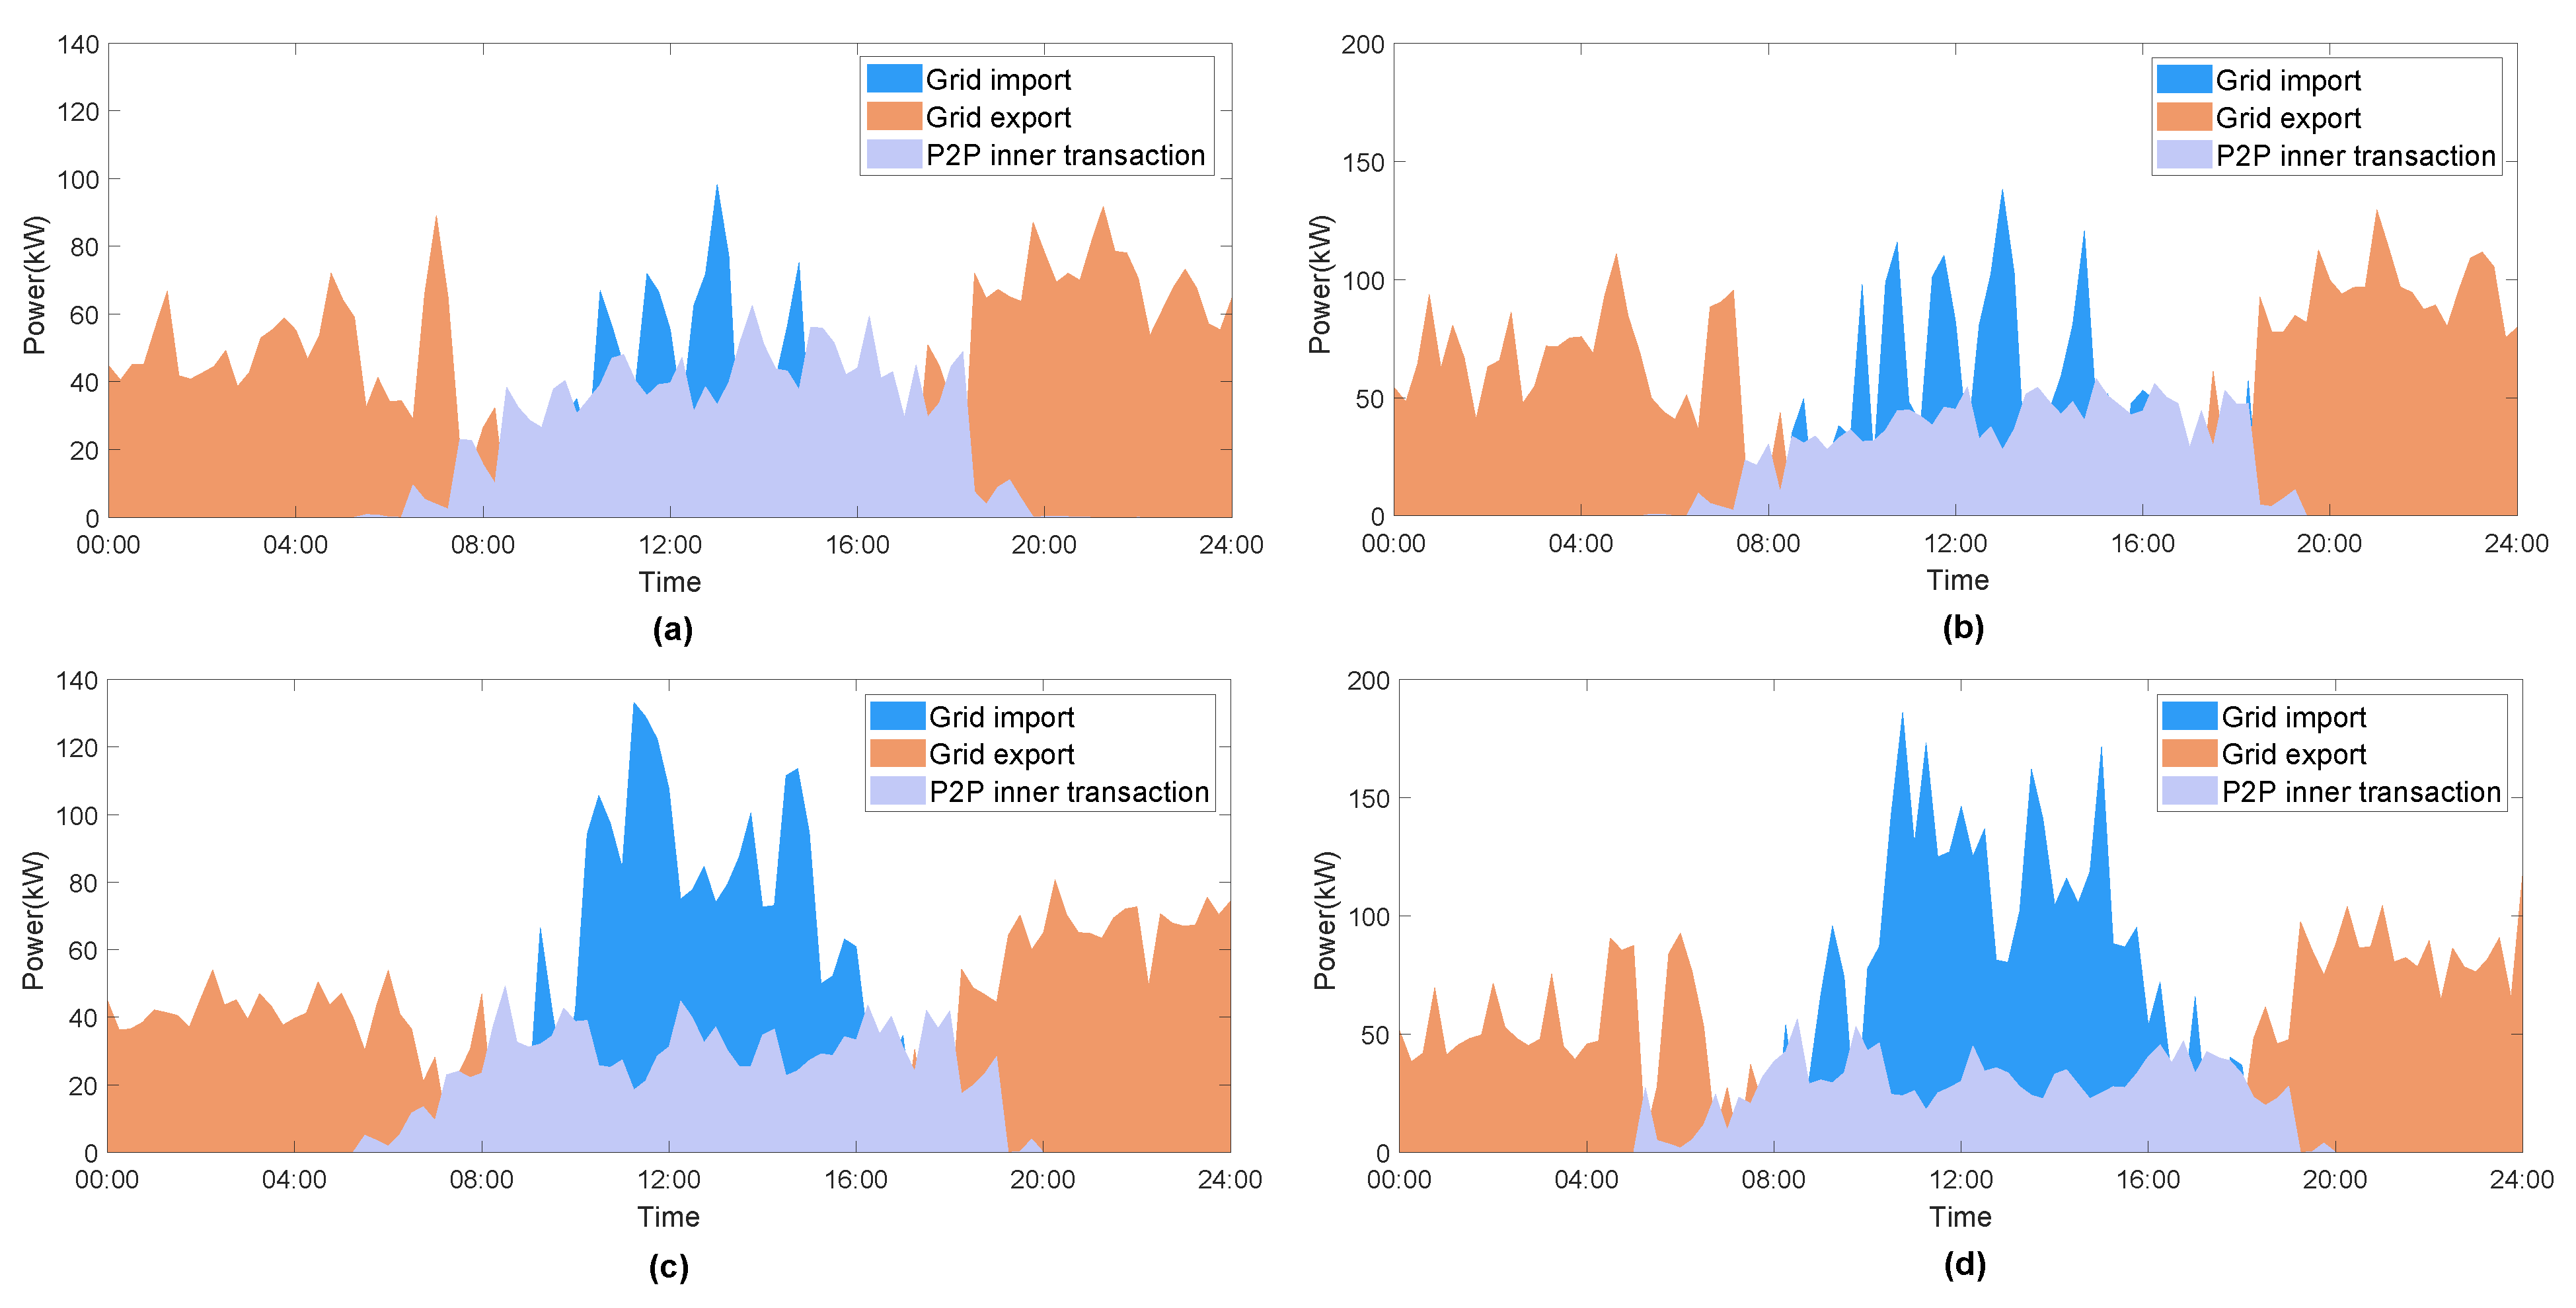
4.2. Local P2P Energy Transaction Results

Table 1 shows the results of the average clearing price of each group over weekdays and weekends. The randomly selected weekday and weekend electricity prices are shown in Figure 3. It is found that group 3 shows a relatively lower average clearing price, and the average transaction price of SBEMS is lower than the reference. The reason behind this is that more low-priced orders were traded. Lower transaction prices can attract more buyers to participate in the market. For sellers, it is still profitable for the transaction price to be higher than the retailer’s recovery price. The success rate presents the ratio of the number of successful bids to the total number of bids in a group. From Table 1, it can be seen that group 3 presents the highest success rate. The results indicate that adopting the best-offer approach can help win more orders than the other strategies. It offers the highest/lowest price each time and obtains priority under the ranking mechanism. It is observed from Table 1 that the success rate of the AA strategy is higher than that of the ZI strategy. The AA strategy can adjust its aggressiveness for bidding behavior depending on market data collected after each purchase or sale. By adopting a ZI strategy, bids are made with randomness within the scope, and most market information is ignored. Although this strategy can also profit from the market, its success rate is generally low.
Furthermore, Table 1 shows that the SBEMS has a lower success rate than the reference. One of the reasons for the bid’s failure is that the transaction price fails to meet expectations. Compared to the orders for PV/load with zero marginal cost, orders for the batteries have a lower competitive advantage, since the cost is considered in the bidding process. CDA market rules dictate that orders with greater competitive advantages (lower-priced sales orders and higher-priced purchase orders) are matched first. The success rate of battery orders is relatively low when SBEMS issues battery bids separately. When the battery orders fail to match, it is not profitable for the battery to operate in the current market situation.

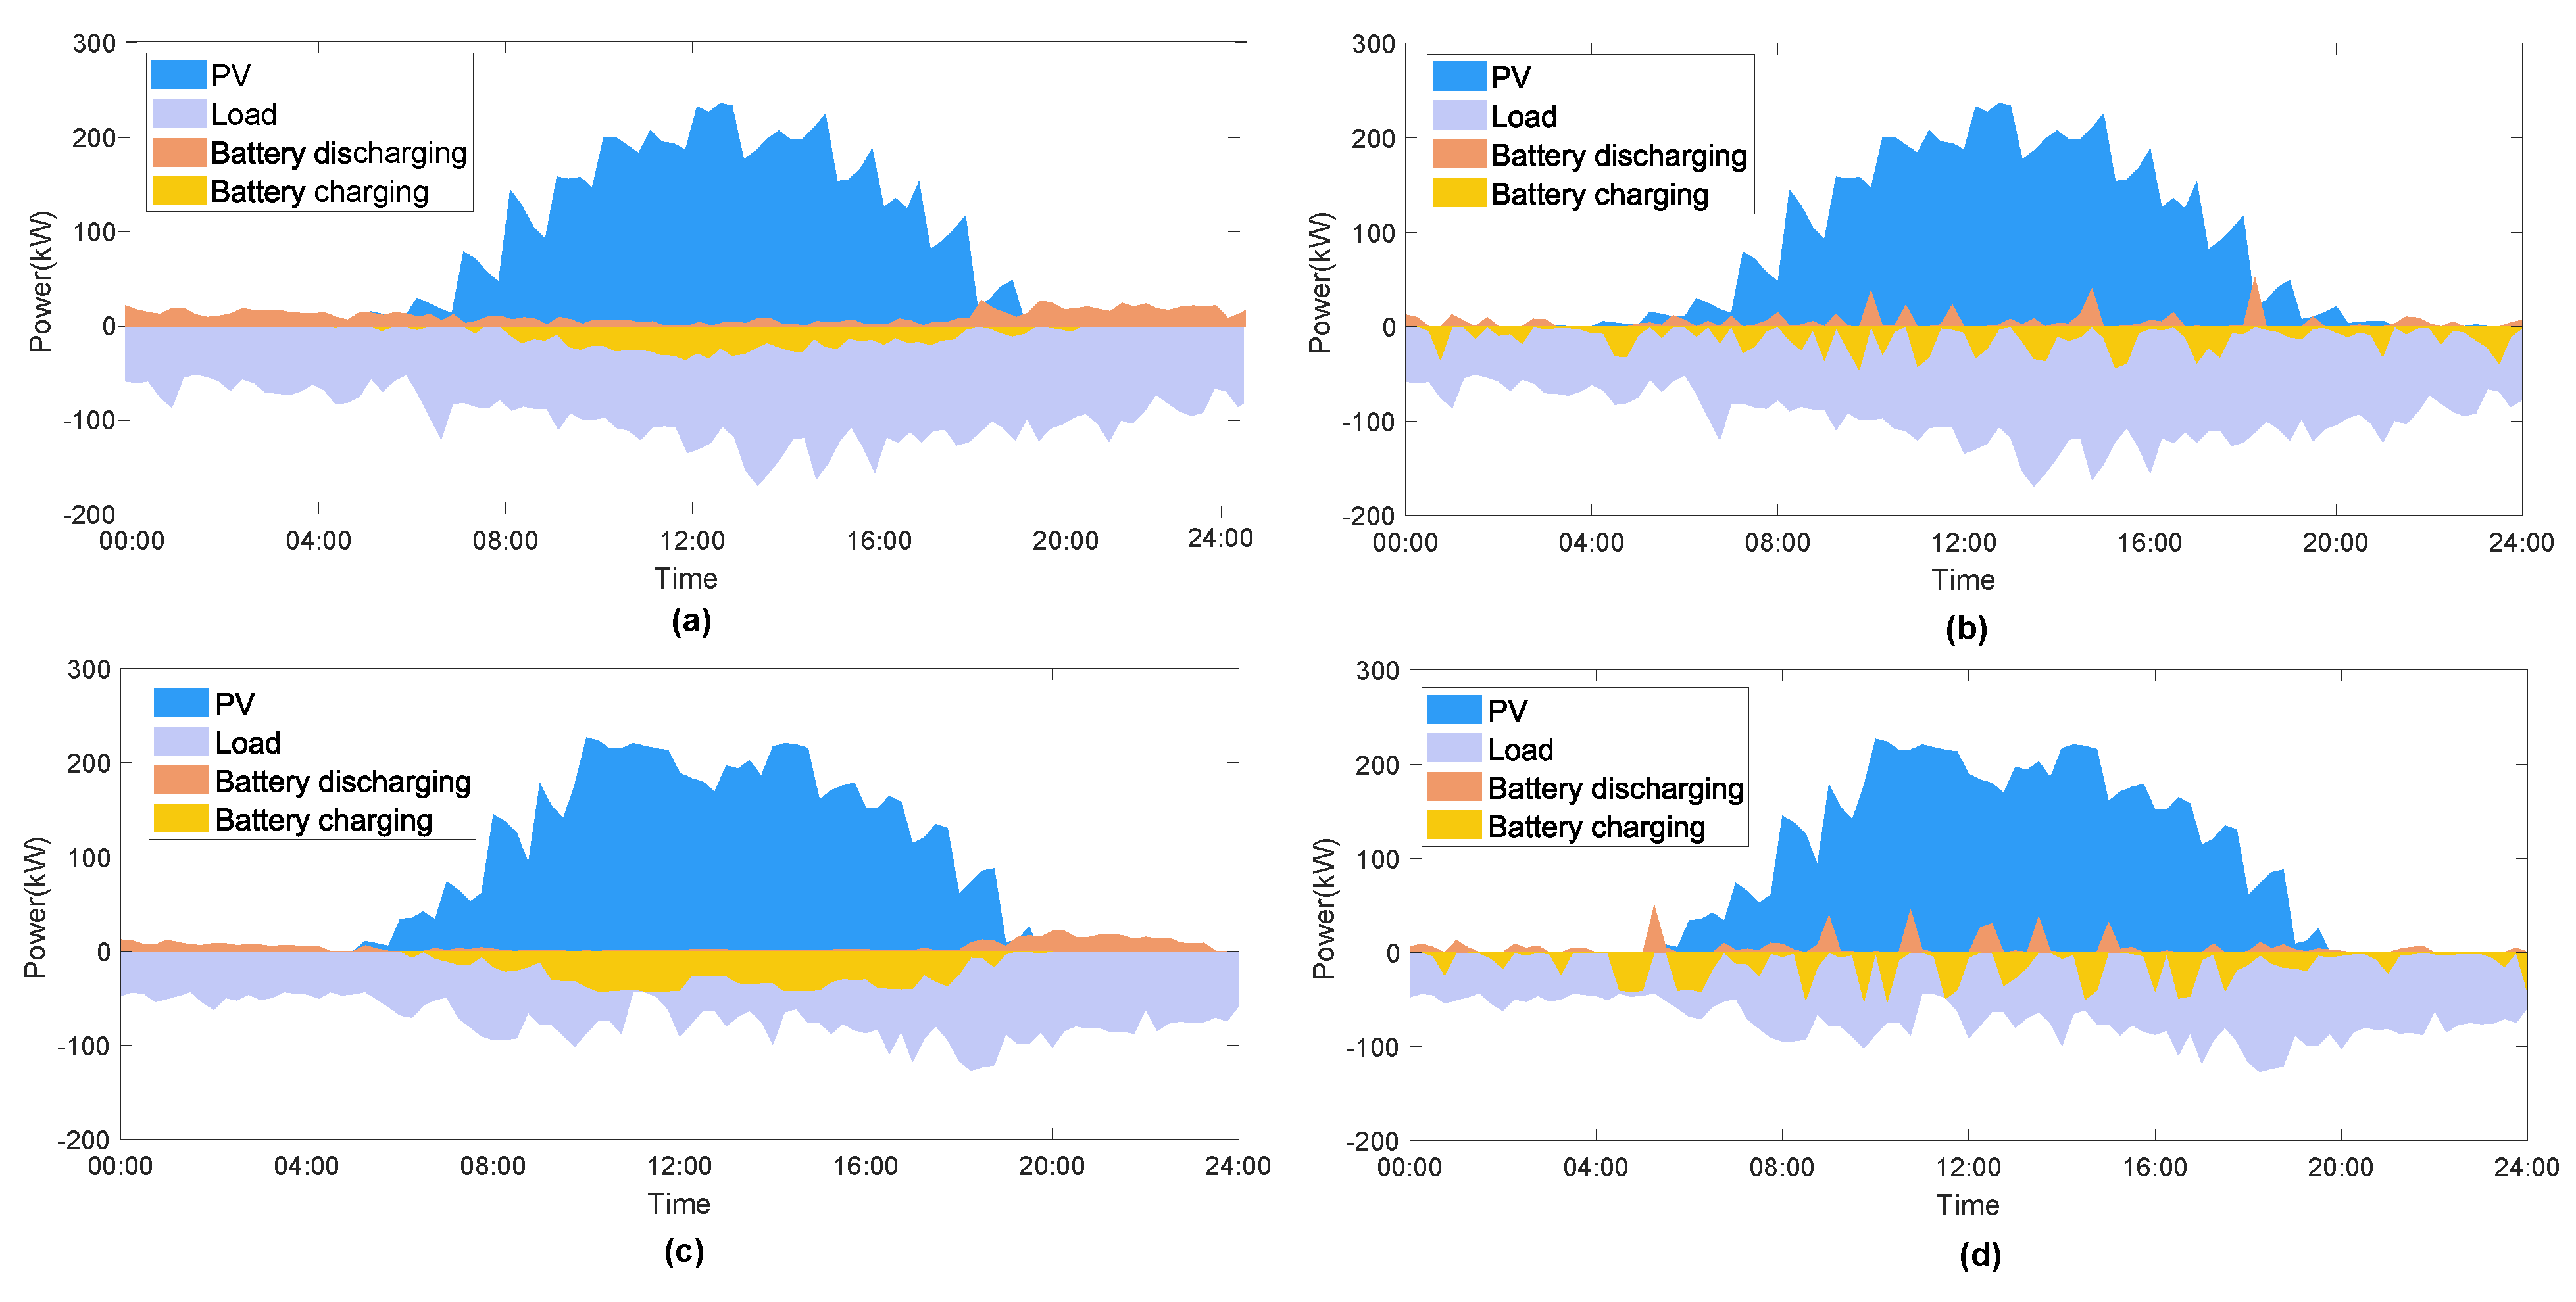
4.3. Energy Analysis
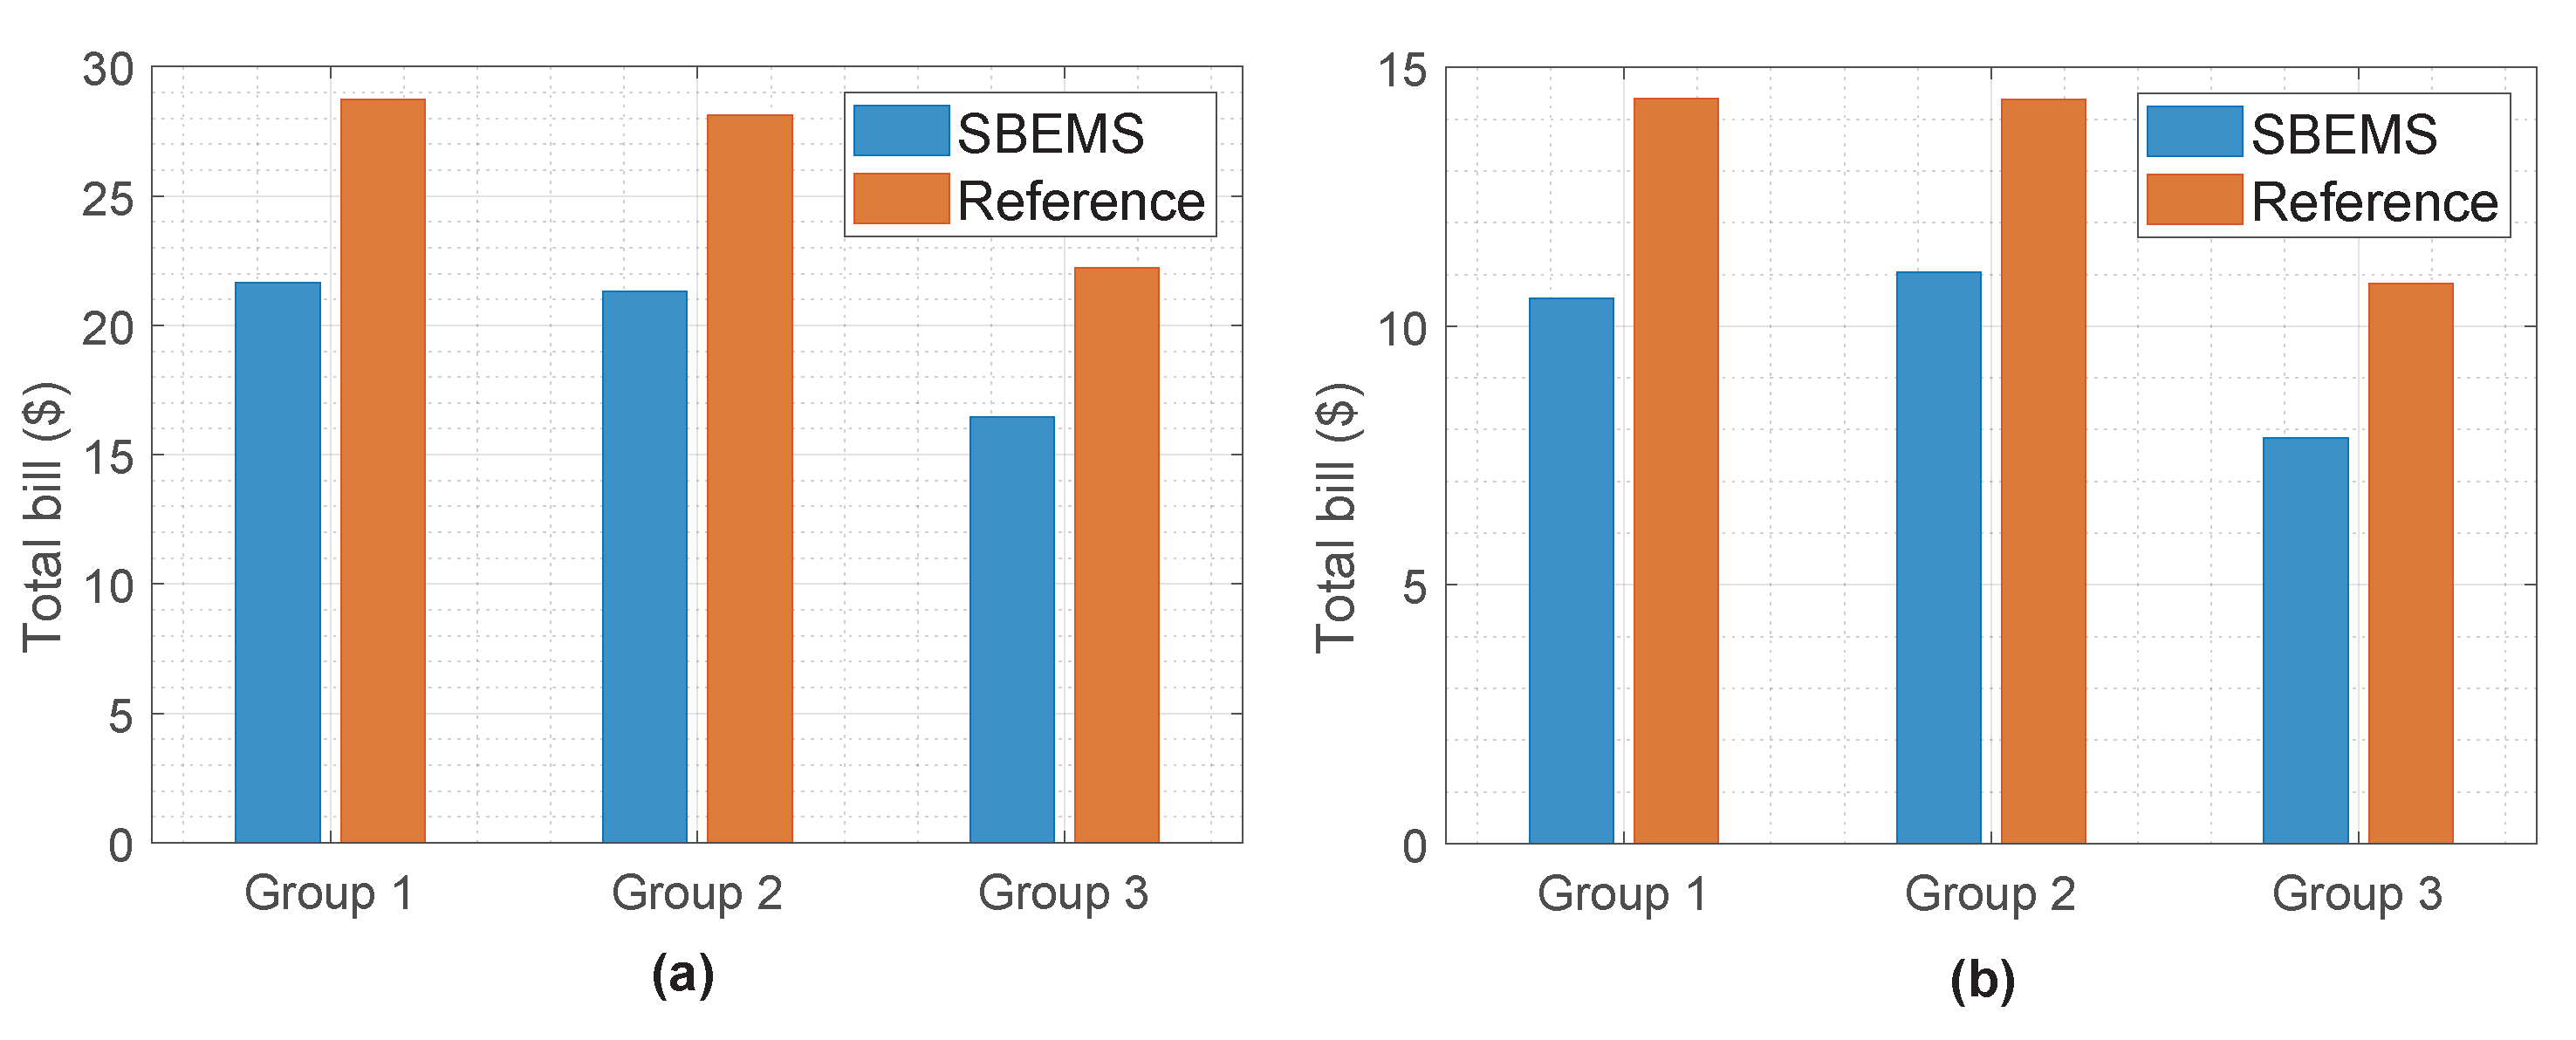
Figure 4 illustrates the detailed demand profile of the entire community, where the positive value represents electricity production and the negative value represents electricity consumption. It is noteworthy to point out that, in the case of adopting SBEMS, battery charging and discharge are different from those of the reference case. Figure 4a,c shows that the battery’s charge/discharge is related to the energy deficit and surplus in the entire community. Batteries are charged more when the energy surplus is sufficient and discharged when the energy deficit is high. According to Figure 4b,d, the charging and discharging operations correlate with the retail market price curve, as depicted in Figure 3. For example, the battery discharge peaks occur around 18:00 on a weekday, along with the highest electricity price. The battery shows a peak charging rate at the lowest electricity price point, which appears around 10:00 on the weekend. Through SBEMS, the battery can exchange information with the P2P market by using a separate bidding strategy. When the PV surplus exceeds the load demand, a flood of low-price orders attracts the battery to charge. In the reference case, the battery works more frequently. It does not bid independently and seeks benefit from the retail market electricity price difference between the “peak” and “valley”.
The power flow of the two cases is presented in Figure 5. As shown in Figure 5a,b, the peak values of grid import and grid export are at least 40 kW lower than the reference case. The results in Figure 5c,d show the peak values of the grid import and export are about 45% and 25% lower than the reference case, respectively. The adoption of SBEMS resulted in a lower amount of being energy exchanged with the utility grid. Regarding P2P internal transactions, the results show that the local peak value of energy trading is slightly higher than the reference case for weekdays and weekends. It is important to note that, despite the fact that PV generation and load curves differ significantly for weekday and weekend, in both cases the adoption of SBEMS results in a lower peak power exchange with the utility grid and greater local self-sufficiency. High peak power results in high costs for the network reinforcement and a heavy burden on the power system’s operation [23]. Consequently, the adoption of SBEMS may have the potential to reduce power grid infrastructure investments.

4.4. Discussion

This section first performs an economic analysis of the three groups. Then five indexes, covering both economic and technical aspects, will be used to evaluate the overall performance of different P2P trading frameworks, namely, the participation willingness index, the energy balance index, the power flatness index, and the self-sufficiency index. The readers are referred to [23] for more detailed information on the indexes.
When multiple strategies compete in the market simultaneously, the total bill can be utilized to assess which method will provide prosumers with the most economical gain. The total bill includes electricity sales and purchases and the battery cost for a single day. After adopting the SBEMS, the electricity bills for each group are shown in Figure 6. Group 3, using the proposed best-offer approach to cooperate with a controllable device bidding strategy, maintains the lowest total electricity bill, which results in high economic efficiency. Cost savings of up to 27.3% are observed compared with the reference. It is worth noting that, even though the AA strategy takes historical data into account and has a relatively complex bidding decision-making process, it does not gain more benefits than the best-offer approach. Therefore, the bidding strategy should consider the specific market climate, with different tactics being tested to see which is the most competitive. Furthermore, while comparing the SBEMS and reference, it can be noted that all three strategy groups demonstrate the superiority of separate bidding by having lower total bills than the reference. In other words, it is necessary to manage and bid for controllable and uncontrollable devices separately.
Table 2 shows the five indexes used to evaluate the effectiveness of the separate bidding strategy. The economic benefit index measures the cost savings and income increases of all prosumers within the community after participating in P2P trading, reflecting the total economic benefit increase for residents. The higher the index value, the higher the economic benefit prosumers receive:
E B I = v a l u e P 2 P v a l u e F i T | v a l u e F i T | ,
where the revenue and expenditures are represented by v a l u e P 2 P after participating in P2P trading and by v a l u e F i T after participating in the FiT scheme, in which the revenue is represented by a positive number and the expenditure by a negative number. The positive value of the E B I indicates that the economic benefit is increasing; the negative value indicates that it is decreasing.
The participation willingness index measures the percentage of prosumers who receive more benefits after participating in P2P energy trading, reflecting the overall participation willingness of the whole population:
P W I = N L o w e r c o s t N ,
where the N L o w e r c o s t represents the number of prosumers who receive economic benefits in P2P energy trading than that under direct trading with the retailer; N is the total number of prosumers participating in the P2P trading.
The energy balance index measures the total energy exchange with the utility grid for both import and export. A higher index value reflects the higher enhanced energy balance ability of the P2P energy trading:
E B I = 1 t T n N j L l n , j , t + j G g n , j , t t T n N j L l n , j , t + t T n N j G g n , j , t ,
where the numerator represents the sum of the energy imbalance throughout the considered time horizon, while the denominator represents the total amount of production and consumption over the same time horizon, which is used to normalize the index.
The power flatness index is used to evaluate the impact of peak power, considering both the positive and negative directions. The higher value reflects the utilization rate and operational efficiency of the power equipment increase:
P F I = 1 max t n N j L l n , j , t + j G g n , j , t 1 T t T n N j L l n , j , t + j G g n , j , t ,
which is calculated based on a quotient between peak power and average power over a period of time, in which both the power surplus and deficit are considered.
The self-sufficiency index measures the capacity of local power generation to meet the local demand, and a higher value of it represents a lower energy interchange with the main grid, hence fewer power transmission losses:
S S I = 1 t T + T n N j L l n , j , t + j G g n , j , t t T n N j L l n , j , t ,
which assesses the level of self-sufficiency in P2P trading areas based on the proportion of energy dependent upon the exchange with the utility grid.
It can be observed from Table 2 that, compared with the FiT scheme, P2P energy trading has better performance in terms of economic benefit, participation willingness, energy balance, and self-sufficiency index. The power flatness index is not involved in the assessment scope, because there is no P2P trading area in the conventional FiT paradigm. The index values show that the adoption of P2P trading achieves an economic benefit increase and improves the efficiency of local energy utilization. P2P trading could create an opportunity to solve grid problems by all market participants rather than reinforcing the grid. This could contribute to the resilience and security of the community network. The SBEMS model proposed in this study can further enhance the economic and technical benefits. The following paragraphs will discuss these two points in detail.
Regarding the economic benefit index, it is observed that the SBEMS with separate bidding can result in more economic benefits than the reference case with conventional unified bidding (simulation indicates about a 13% increase) on both a weekday and a weekend. Combined with the result shown in Figure 5, the SBEMS can help prosumers avoid operating their battery during the less profitable time interval, thus increasing their economic benefits. The participation willingness indexes for SBEMS are higher than the reference on a weekday and a weekend. The utilization of SBEMS can increase the incentives for prosumers, so most prosumers are willing to use the system for energy trading. Compared with traditional bid-management methods, the index value demonstrated that SBEMS has a greater ability to provide economic benefits to more prosumers. As a result, their willingness to participate in P2P trading increases.
The SBEMS achieves a better energy balance and self-sufficiency index performance from a technical perspective. The results show that the energy balance index in case 1 is 37% and 27% higher than the reference case on a weekday and a weekend, respectively. The self-sufficiency index is at least 15% higher. Thus, all prosumers in a community adopting the separate bidding method would help reduce grid stress and improve the reliability of the local power supply. The power flatness index in case 1 is slightly lower. This is due to the amount of local energy trading, and the peak value in case 1 is greater than in case 2. The relatively small deviation in the index indicates that the effects of cases 1 and 2 on the power grid are similar. To evaluate the overall performance, all five indexes were considered and weighted equally. The average value shows that the SBEMS is at least 13.7% higher than the reference. Based upon the results, it can be concluded that SBEMS promoted the overall performance.
P2P energy trading is one of the key drivers behind a broader penetration of renewable energy in the electricity system and further decentralizing energy production. It could result in higher cost savings and potential income generation for prosumers. This paper developed a model to quantitatively analyze the potential benefits of P2P energy trading for residential buildings based on which several further works can be further conducted. Detailed findings are necessary to quantify the true potential benefits of the P2P energy trading model to provide long-term benefits to all parties involved. For example, if system operators plan networks without considering the potential for P2P energy trading platforms to unlock embedded flexibility, then networks will be overbuilt. This is likely to result in higher network charges and reduce the value of the flexibility that P2P energy trading platforms may offer, undermining otherwise valuable business models. For future policy-making decisions made at the central level, the availability of clear rules that allow for experimental and technological change is an important enabler of innovation and investment. Meanwhile, updated regulations need to be developed regarding balancing responsibilities and determining network charges.

5. Conclusions

In this paper, a local P2P energy market is modeled, in which a CDA-based trading framework and a decentralized residential SBEMS are presented. Residential buildings with PV battery systems installed can benefit from participating in P2P markets. The SBEMS allows residential prosumers to submit individual orders and create rolling scheduling for energy by incorporating two bidding strategies.
The results demonstrate that P2P energy trading can be utilized as a solution to integrate the PV battery system installed in residential buildings. In contrast to the FiT scheme, DERs can be sold at higher prices, while residents can enjoy a lower electricity purchase price. Through localized transactions, the energy exchange between communities and the utility grid is reduced, resulting in lower energy transportation costs and losses for the grid. Therefore, the P2P market can bring potential benefits to power grid infrastructure investments. Compared with the conventional energy-management system, the proposed SBEMS can provide a comprehensive improvement in terms of (1) a reduction of the total bill of a group by 27%; (2) an economic benefit index indicating an approximate 13% increase; (3) a participation willingness index up to 0.88; (4) the self-sufficiency index being at least 15% higher; and (5) the energy balance index being up to 37% higher. Moreover, the proposed combination (best-offer approach with the battery bidding strategy) strategy can outperform others under a dynamic auction system.

Author Contributions

B.Z.: Conceptualization, Methodology, Software, Investigation, Visualization, Writing Original Draft; Y.D.: Conceptualization, Methodology, Writing, Review and Editing, Supervision; X.C.: Writing, Review and Editing, Validation; E.G.L.: Project administration, Resources; L.J.: Supervision; and K.Y.: Validation. All authors have read and agreed to the published version of the manuscript.

Funding

This work was supported by the AI University Research Centre (AI-URC) through XJTLU Key Programmer Special Fund (KSF-P-02), and the research development fund of XJTLU (RDF-17-01-28).

Institutional Review Board Statement

Not applicable.

Informed Consent Statement

Not applicable.

Data Availability Statement

Not applicable.

Conflicts of Interest

The authors declare that they have no known competing financial interests or personal relationships that could have appeared to influence the work reported in this paper.

Nomenclature

tIndex to refer to the tth trading time unit
Δ t Trading time horizon
O B B t Order book buy, contains all buyers at t
O B S t Order book sell, contains all sellers at t
S t Total benefit of a prosumer at t
p r t d i s c h a Profit from battery discharging at t
p r t P Profit from selling energy in P2P market at t
p r t d e m Profit from PV surplus supplementing demand at t
c t cha Battery charging cost at t
c t P Cost of energy purchased from P2P market at t
P j , i , k , n T Clearing price of buyer i order k with seller j order n
B i , k Order k price of buyer i
Q i , k B Order k quantity of buyer i
S j , n Order n price of seller j
Q j , n S Order n quantity of seller j
kOrder number of buyer
nOrder number of seller
P t E x p Export price
c B E S Battery operating cost
C t V Battery charging from PV
C t P Battery charging from P2P market
P t R e t Retail price
C t G Battery charging from utility grid
B t B E S Battery bidding price for buyer
D t G Battery discharging for utility grid
S t B E S Battery bidding price for seller
D t P Battery discharging for P 2 P market
B t P Uncontrolled energy bidding price for buyer
E S P t Energy selling to P2P market
S t P Uncontrolled energy bidding price for seller
E B P t Energy buying from P2P market
D Min Minimum limitation of battery discharging
D Max Maximum limitation of battery discharging
C M i n Minimum limitation of battery charging
C M a x Maximum limitation of battery charging
S O C t State of charge of the battery at t
S O C Min Minimum allowable state of charge
S O C M a x Maximum allowable state of charge
η C Charging efficiency of battery
η D Discharging efficiency of battery
p v t D Energy sold to P2P market from PV
p v t M a x Maximum energy produced by PV at t
d e m t Demand at t
ρ t B Probability of success in buying
ρ t S Probability of success in selling
ω Random value
w i Weight parameter of deal i
τ Target price
t Limit price for buyer
c j Limit price for seller
rAggressiveness degree
β Learning parameter
α The normalized standard deviation value
θ Varies parameter
τ Current target price in AA strategy
rCurrent degree of aggressiveness
λ B E S Preference value of battery bidding

References

  1. Net Generation by Energy Source: Residential Sector, 2014-April 2020; U.S. Energy Information Administration: Washington, DC, USA, 2020.
  2. Form EIA-861M Detailed Data Net Metering; U.S. Energy Information Administration: Washington, DC, USA, 2020. Available online: https://www.eia.gov/electricity/data/eia861m/xls/net_metering2020.xlsx (accessed on 2 January 2021).
  3. Askeland, M.; Backe, S.; Bjarghov, S.; Lindberg, K.B.; Korpås, M. Activating the potential of decentralized flexibility and energy resources to increase the EV hosting capacity: A case study of a multi-stakeholder local electricity system in Norway. Smart Energy 2021, 3, 100034. [Google Scholar] [CrossRef]
  4. Toquica, D.; Agbossou, K.; Henao, N.; Malhamé, R.; Kelouwani, S.; Amara, F. Prevision and planning for residential agents in a transactive energy environment. Smart Energy 2021, 2, 100019. [Google Scholar] [CrossRef]
  5. Yang, J.; Dong, Z.Y.; Wen, F.; Chen, Q.; Luo, F.; Liu, W.; Zhan, J. A Penalty Scheme for Mitigating Uninstructed Deviation of Generation Outputs From Variable Renewables in a Distribution Market. IEEE Trans. Smart Grid 2020, 11, 4056–4069. [Google Scholar] [CrossRef]
  6. Wen, H.; Du, Y.; Chen, X.; Lim, E.; Wen, H.; Jiang, L.; Xiang, W. Deep Learning Based Multistep Solar Forecasting for PV Ramp-Rate Control Using Sky Images. IEEE Trans. Ind. Inform. 2021, 17, 1397–1406. [Google Scholar] [CrossRef]
  7. Javadi, M.S.; Gough, M.; Lotfi, M.; Esmaeel Nezhad, A.; Santos, S.F.; Catalão, J.P.S. Optimal self-scheduling of home energy-management system in the presence of photovoltaic power generation and batteries. Energy 2020, 210, 118568. [Google Scholar] [CrossRef]
  8. Morstyn, T.; Teytelboym, A.; Hepburn, C.; McCulloch, M.D. Integrating P2P Energy Trading With Probabilistic Distribution Locational Marginal Pricing. IEEE Trans. Smart Grid 2020, 11, 3095–3106. [Google Scholar] [CrossRef]
  9. Chen, X.; Du, Y.; Wen, H.; Jiang, L.; Xiao, W. Forecasting-Based Power Ramp-Rate Control Strategies for Utility-Scale PV Systems. IEEE Trans. Ind. Electron. 2019, 66, 1862–1871. [Google Scholar] [CrossRef]
  10. Chen, X.Y.; Du, Y.; Lim, E.; Wen, H.Q.; Yan, K.; Kirtley, J. Power ramp-rates of utility-scale PV systems under passing clouds: Module-level emulation with cloud shadow modeling. Appl. Energy 2020, 268, 114980. [Google Scholar] [CrossRef]
  11. Littlechild, S. Retail competition in electricity markets. Expectations, outcomes and economics. Energy Policy 2009, 37, 759–763. [Google Scholar] [CrossRef]
  12. Couture, T.D.; Cory, K.; Kreycik, C.; Williams, E. Policymaker’s Guide to Feed-in Tariff Policy Design; National Renewable Energy Lab. (NREL): Golden, CO, USA, 2010. [Google Scholar]
  13. Tushar, W.; Saha, T.K.; Yuen, C.; Morstyn, T.; McCulloch, M.D.; Poor, H.V.; Wood, K.L. A motivational game-theoretic approach for peer-to-peer energy trading in the smart grid. Appl. Energy 2019, 243, 10–20. [Google Scholar] [CrossRef]
  14. An, D.; Yang, Q.; Yu, W.; Yang, X.; Fu, X.; Zhao, W. SODA: Strategy-Proof Online Double Auction Scheme for Multimicrogrids Bidding. IEEE Trans. Syst. Man, Cybern. Syst. 2018, 48, 1177–1190. [Google Scholar] [CrossRef]
  15. Zhang, C.; Wu, J.; Zhou, Y.; Cheng, M.; Long, C. Peer-to-Peer energy trading in a Microgrid. Appl. Energy 2018, 220, 1–12. [Google Scholar] [CrossRef]
  16. Tushar, W.; Yuen, C.; Mohsenian-Rad, H.; Saha, T.; Poor, H.V.; Wood, K.L. Transforming Energy Networks via Peer-to-Peer Energy Trading The potential of game-theoretic approaches. IEEE Signal Process. Mag. 2018, 35, 90–111. [Google Scholar] [CrossRef] [Green Version]
  17. Fu, M.; Xu, Z.Y.; Wang, N.; Lyu, X.Y.; Xu, W.S. “Peer-to-Peer Plus” Electricity Transaction within Community of Active Energy Agents Regarding Distribution Network Constraints. Energies 2020, 13, 2408. [Google Scholar] [CrossRef]
  18. Luth, A.; Zepter, J.M.; del Granado, P.C.; Egging, R. Local electricity market designs for peer-to-peer trading: The role of battery flexibility. Appl. Energy 2018, 229, 1233–1243. [Google Scholar] [CrossRef] [Green Version]
  19. Neves, D.; Scott, I.; Silva, C.A. Peer-to-peer energy trading potential: An assessment for the residential sector under different technology and tariff availabilities. Energy 2020, 205, 118023. [Google Scholar] [CrossRef]
  20. Long, C.; Wu, J.; Zhou, Y.; Jenkins, N. Peer-to-peer energy sharing through a two-stage aggregated battery control in a community Microgrid. Appl. Energy 2018, 226, 261–276. [Google Scholar] [CrossRef]
  21. Liu, N.; Yu, X.; Wang, C.; Li, C.; Ma, L.; Lei, J. Energy-sharing model with price-based demand response for microgrids of peer-to-peer prosumers. IEEE Trans. Power Syst. 2017, 32, 3569–3583. [Google Scholar] [CrossRef]
  22. Long, C.; Zhou, Y.; Wu, J. A game theoretic approach for Peer-to-Peer energy trading. Energy Procedia 2019, 159, 454–459. [Google Scholar] [CrossRef]
  23. Zhou, Y.; Wu, J.; Long, C. Evaluation of peer-to-peer energy sharing mechanisms based on a multiagent simulation framework. Appl. Energy 2018, 222, 993–1022. [Google Scholar] [CrossRef]
  24. Long, C.; Wu, J.; Zhang, C.; Thomas, L.; Cheng, M.; Jenkins, N. Peer-to-peer energy trading in a community microgrid. In Proceedings of the 2017 IEEE Power and Energy Society General Meeting, Chicago, IL, USA, 16–20 July 2017; pp. 1–5. [Google Scholar]
  25. Chen, K.X.; Lin, J.; Song, Y.H. Trading strategy optimization for a prosumer in continuous double auction based peer-to-peer market: A prediction-integration model. Appl. Energy 2019, 242, 1121–1133. [Google Scholar] [CrossRef]
  26. Faqiry, M.N.; Das, S. Double Auction With Hidden User Information: Application to Energy Transaction in Microgrid. IEEE Trans. Syst. Man Cybern. Syst. 2019, 49, 2326–2339. [Google Scholar] [CrossRef]
  27. Lin, J.; Pipattanasomporn, M.; Rahman, S. Comparative analysis of auction mechanisms and bidding strategies for P2P solar transactive energy markets. Appl. Energy 2019, 255. [Google Scholar] [CrossRef]
  28. Guerrero, J.; Sok, B.; Chapman, A.C.; Verbic, G. Electrical-distance driven peer-to-peer energy trading in a low-voltage network. Appl. Energy 2021, 287. [Google Scholar] [CrossRef]
  29. Li, Z.; Ma, T. Peer-to-peer electricity trading in grid-connected residential communities with household distributed photovoltaic. Appl. Energy 2020, 278, 115670. [Google Scholar] [CrossRef]
  30. Vytelingum, P.; Cliff, D.; Jennings, N.R. Strategic bidding in continuous double auctions. Artif. Intell. 2008, 172, 1700–1729. [Google Scholar] [CrossRef] [Green Version]
  31. Jian, W.; Wang, Q.; Zhou, N.; Yuan, C. A Novel Electricity Transaction Mode of Microgrids Based on Blockchain and Continuous Double Auction. Energies 2017, 10, 1971. [Google Scholar]
  32. Han, D.; Zhang, C.Z.H.; Ping, J.; Yan, Z. Smart contract architecture for decentralized energy trading and management based on blockchains. Energy 2020, 199, 117417. [Google Scholar] [CrossRef]
  33. Guerrero, J.; Chapman, A.C.; Verbic, G. Decentralized P2P Energy Trading Under Network Constraints in a Low-Voltage Network. IEEE Trans. Smart Grid 2019, 10, 5163–5173. [Google Scholar] [CrossRef] [Green Version]
  34. Yang, F.; Xia, X.H. Techno-economic and environmental optimization of a household photovoltaic-battery hybrid power system within demand side management. Renew. Energy 2017, 108, 132–143. [Google Scholar] [CrossRef] [Green Version]
  35. Raziei, A.; Hallinan, K.P.; Brecha, R.J. Clean energy utility for multifamily housing in a deregulated energy market. Energy Build. 2016, 127, 806–817. [Google Scholar] [CrossRef]
  36. Pietila, A.; Beausoleil-Morrison, I.; Newsham, G.R. Zero peak housing: Exploring the possibility of eliminating electrical draws from houses during periods of high demand on the electrical grid. Build. Environ. 2012, 58, 103–113. [Google Scholar] [CrossRef]
  37. Müller, D.; Monti, A.; Stinner, S.; Schlösser, T.; Schütz, T.; Matthes, P.; Wolisz, H.; Molitor, C.; Harb, H.; Streblow, R. Demand side management for city districts. Build. Environ. 2015, 91, 283–293. [Google Scholar] [CrossRef]
  38. Tushar, W.; Chai, B.; Yuen, C.; Huang, S.; Smith, D.B.; Poor, H.V.; Yang, Z. Energy Storage Sharing in Smart Grid: A Modified Auction-Based Approach. IEEE Trans. Smart Grid 2016, 7, 1462–1475. [Google Scholar] [CrossRef] [Green Version]
  39. Qin, Z.; Mo, Y.; Liu, H.; Zhang, Y. Operational flexibility enhancements using mobile energy storage in day-ahead electricity market by game-theoretic approach. Energy 2021, 232, 121008. [Google Scholar] [CrossRef]
  40. El-Baz, W.; Tzscheutschler, P.; Wagner, U. Integration of energy markets in microgrids: A double-sided auction with device-oriented bidding strategies. Appl. Energy 2019, 241, 625–639. [Google Scholar] [CrossRef]
  41. Rodrigues, D.L.; Ye, X.; Xia, X.; Zhu, B. Battery energy storage sizing optimisation for different ownership structures in a peer-to-peer energy sharing community. Appl. Energy 2020, 262, 114498. [Google Scholar] [CrossRef]
  42. Huang, H.; Nie, S.L.; Lin, J.; Wang, Y.Y.; Dong, J. Optimization of Peer-to-Peer Power Trading in a Microgrid with Distributed PV and Battery Energy Storage Systems. Sustainability 2020, 12, 923. [Google Scholar] [CrossRef] [Green Version]
  43. Alabdullatif, A.M.; Gerding, E.H.; Perez-Diaz, A. Market Design and Trading Strategies for Community Energy Markets with Storage and Renewable Supply. Energies 2020, 13, 31. [Google Scholar] [CrossRef] [Green Version]
  44. Alam, M.R.; St-Hilaire, M.; Kunz, T. Peer-to-peer energy trading among smart homes. Appl. Energy 2019, 238, 1434–1443. [Google Scholar] [CrossRef]
  45. Ilic, D.; Silva, P.G.D.; Karnouskos, S.; Griesemer, M. An energy market for trading electricity in smart grid neighbourhoods. In Proceedings of the 2012 6th IEEE International Conference on Digital Ecosystems and Technologies (DEST), Campione d’Italia, Italy, 18–20 June 2012; pp. 1–6. [Google Scholar] [CrossRef]
  46. Vytelingum, P.; Ramchurn, S.D.; Voice, T.D.; Rogers, A.; Jennings, N.R. Trading agents for the smart electricity grid. In Proceedings of the 9th International Conference on Autonomous Agents and Multiagent Systems, Toronto, ON, Canada, 10–14 May 2010. [Google Scholar]
  47. ENERGY MARKET and OPERATIONAL DATA. Available online: https://www.nyiso.com/energy-market-operational-data (accessed on 2 January 2021).
  48. Pecanstreet Dataport. 2021. Available online: https://www.pecanstreet.org/dataport/ (accessed on 2 January 2021).
Figure 1. Framework of local P2P trading using continuous double auction.
Energies 15 03913 g001
Figure 2. Proposed case configuration for case studies: (a) Case 1, SBEMS; (b) Case 2, reference.
Energies 15 03913 g002
Figure 3. Retail market price on (a) weekday and (b) weekend.
Energies 15 03913 g003
Figure 4. Detailed demand profile of the community: (a) weekday-SBEMS, (b) weekday-reference, (c) weekend-SBEMS, and (d) weekend-reference.
Energies 15 03913 g004
Figure 5. Type day profile of the whole community: (a) weekday-SBEMS, (b) weekday-reference, (c) weekend-SBEMS, and (d) weekend-reference.
Energies 15 03913 g005
Figure 6. Electricity bill of 3 groups: (a) weekday, (b) weekend.
Energies 15 03913 g006
Table 1. Comparison of average clearing prices and success rates.
IndexSBEMSReference
Group 1Group 2Group 3Group 1Group 2Group 3
Average clearing price weekday ($/kWh)0.01640.01620.01530.01680.01670.0156
Average clearing price weekend ($/kWh)0.01190.01190.01130.01260.01270.0121
Success rate weekday0.32400.43450.68260.36080.49470.7565
Success rate weekend0.41660.48960.77650.42760.48680.8195
Table 2. Comparison of technical and economic indexes.
IndexCase 1:
SBEMS
Case 2:
Reference
Conventional Paradigm:
FiT Scheme
WeekdayWeekendWeekdayWeekendWeekdayWeekend
Economic benefit index0.2480.2240.1090.10100
Participation willingness index0.8330.8800.8260.8050.2800.280
Energy balance index0.6680.5450.4860.4280.2870.197
Power flatness index0.7170.8330.7590.832________
Self-sufficiency index0.5570.4780.4770.4140.3210.291
Average value0.6050.5920.5320.5160.2770.192
Publisher’s Note: MDPI stays neutral with regard to jurisdictional claims in published maps and institutional affiliations.

