
New Insights into Crust and upper Mantle Structure in Guangdong Province, China and Its Geothermal Implications


1
State Key Laboratory of Biogeology and Environmental Geology, China University of Geosciences, Wuhan 430074, China
2
Hubei Subsurface Multiscale Imaging Laboratory, Institute of Geophysics and Geomatics, China University of Geosciences, Wuhan 430074, China
*
Author to whom correspondence should be addressed.
Energies 2021, 14(8), 2236; https://doi.org/10.3390/en14082236
Submission received: 24 February 2021
/
Revised: 8 April 2021
/
Accepted: 14 April 2021
/
Published: 16 April 2021
(This article belongs to the Special Issue New Perspectives on Geothermal Energy Exploration and Evaluation of Geothermal Potential)
Abstract
:Southeast Asia contains significant natural geothermal resources. However, the mechanism for generating geothermal anomalies by the crust–mantle structure still needs to define. In this study, we focused on Guangdong Province, China. We conducted three magnetotelluric profiles to interpret the crust and upper mantle structure beneath the Guangdong Province and its geothermal implications. Based on data analysis results, a two-dimension inversion was conducted on the dataset. The inversion model revealed that there is a presence of upwelling channels, and some channels are connected with shallow crustal fault zone; the thickness of crust and lithosphere in Guangdong Province is relatively thin. Such a special crust and upper mantle structure form high surface heat flow. Merged with previous research, our results imply that massive Late Mesozoic granites, which contain high radioactive heat generating elements, are distributed on the surface and underground of Guangdong Province. Based on the correlation between high radioactive Late Mesozoic granites, crust-upper mantle structure, surface heat flow, and locations of natural hot springs, we established a geothermal conceptual model to visualize the origin of a current geophysical and geothermal anomaly in Guangdong Province.
1. Introduction
Southeast Asia straddles the boundary between the Pacific/Philippine Plate and Eurasia Plate and locates in the South China fold belt. It is mainly located on the Cathaysian plate. The geology is highly diverse, and the tectonic setting ranges from the amalgamation between the Yangtze block and the Cathaysia Block during the Neoproterozoic [1] to the subduction of the Pacific/Philippine Plate in the Cenozoic [2]. Guangdong Province is located on the Cathaysian plate and has the same tectonic evolution as the Cathaysian plate (Figure 1). The crust and upper mantle structure of Guangdong Province in this area have shaped by these tectonic impacts, which are mainly manifested as follows:
First, the predominant feature in Guangdong Province is the widespread exposure of Mesozoic granite with an exposed area of 60,000 km2, accounting for about one-third of the area, considered the result of the multi-stage emplacement of magmatic rocks [3]. Such spatial-temporal distribution characteristics of the Mesozoic granites have been attributed to the dynamic mechanism associated with subduction and interaction with multiple plates [5,6]. These granites, Late Mesozoic granite, in particular, were formed by the remelting of the Neoproterozoic and Paleozoic crust [7] and extremely rich heat-producing elements (Th, U, and K) with average heat production of more than 5 μW/m3 [8]. Second, various geophysical methods have led to the thin lithosphere (~80 km) present in South China [9,10,11,12]. Combining with studies on mantle peridotite enclaves/xenoliths in Paleozoic suggested that a lithospheric thinning process has occurred in Meso-Cenozoic [13,14,15]. Furthermore, there are abundant NE- and NW/WNW-trending faults and associated fold-and-fault zones in Southeast Asia ([6]; Figure 1). Consequently, these processes shaped Southeast Asia into a geothermally active region and southeast China into the second-largest high heat flow region in China, where there are many natural hot springs spanning an unusually large area ([16,17]; Figure 2). The large area geothermal anomaly constitutes an impressive geothermal utilization prospective area; however, it has not been well exploited due to the deficiency of comprehensive studies of the geothermal anomaly in southeast China.
Recently, a study based on Bouguer gravity data has suggested that the geothermal anomalies in Guangdong Province originated from the combined effect of asthenosphere upwelling and granite, which emplaced along the faults [18]. Another study based on heat flow data and tectonic setting stated that the high surface heat flow values correspond to the lithosphere’s thinning [17]. However, these results do not fully explain the crust structure, geothermal anomalies, and their interrelationships. These results do not fully account for the crust structure, geothermal anomalies, and their interrelationships, which hinders the subsequent utilization of geothermal resources, the implementation of relevant simulation work, and analysis of the geothermal polygeneration system [19,20,21].
To solve these problems, the primary goals are to constrain the crust–mantle structure and to establish the association between geothermal anomalies and the crust–mantle structure. In this study, we conducted three magnetotelluric profiles in Guangdong Province, China, where these areas are abundant in the geothermal resource. Further, the granitic intrusions and faults are available for analyzing the effects of different factors on the generation of hot springs. We present new imaging results of the crust and upper mantle structure across a major portion of Guangdong Province and establish a geothermal conceptual model to decipher geothermal formation in Guangdong Province.
2. Geological Setting
The Guangdong Province has narrowed due to three major convergent tectonic plates since the Mesozoic, which are the subduction of the Pacific Plate to the east, the subduction of the India Plate beneath the Eurasia Plate to the southwest, and the convergence between North and South China Blocks to the north (Figure 1). As a response to this tectonic event multi-plate interaction, this region underwent a widespread tectonic thermal event and intracontinental deformation. These events are characterized by massive magmatic emplacement, widespread shortening, thrusting, and decollement in the Mesozoic [4,6]. Specifically, these events could be evidenced by the widespread granitoid belts of different ages and large-scale fault zones. Such features were mainly caused by the multi-plate interaction [7] or by the advance and retreat of the Pacific Plate [6,22]. Later on, during the Cenozoic, a basin and range-like region and widely distributed basalt were generated in the coastal areas [23,24]. These tectonic events have been suggested to be formed by asthenospheric convection-driven extension and thinning of continental crust. Such asthenospheric convection is controlled by the collision between India Plate and Eurasia Plate (for a review, see [3]).
3. MT Data Acquisition
From July to August 2013, three MT profiles (L100, L200, and L300) with 440 km and 103 stations were established to obtain the electrical structure of crust and mantle in southeast China (Figure 2). The L100 is divided into two parts. The east part has a length of 40 km with an interval of 1 km. The west part has a length of 100 km with a station spacing of 5 km. L200 has a length of 100 km with a station spacing of 5 km. The L300 has a length of 200 km with a station spacing of 10 km. The L100 and L200 cross the Wuchuan-Sihui fault zone and the Enping-Xinfeng fault zone (Figure 2). The L300 crosses the Enping-Xinfeng fault zone, Heyan fault zone, Zijin-Boluo fault zone, and Lianhuashan fault zone (south section of the Zhenghe-Dapu fault zone) (Figure 2). Extending direction of the MT profiles is designed to be east-west trending.
MT data were collected with Phoenix MTU-5 instruments. All 5 orthogonal components of the electromagnetic field (Ex, Ey, Hx, Hy, and Hz) were recorded. The x-axis and the y-axis are magnetic N-S trending and magnetic E-W trending, respectively. The horizontal electric (E) and magnetic (H) fields are measured in the time domain and converted to the frequency domain by Fourier transform to receive the MT response function. Before the field data collection, we performed calibration and consistency experiments on all the instruments and equipment used to ensure that the instruments invested during the construction process work properly. The first and second Supplementary Figures (Supplementary Figures S1 and S2) show the calibration results of the V5 system 2000 equipment box and probe, respectively. With a recording time no less than 18 h, MT data were obtained in an average period of 0.003–2000 s. The MT time-series were transformed into frequency domain with fast Fourier transform, and the frequency-dependent transfer function elements were calculated by standard remote reference [25], robust routines [26].
4. MT Data Analysis, Inversion, and Result
4.1. MT Data Analysis
In magnetotelluric analyses, the regional structure’s response can be concealed by the galvanic distortion caused by small-scale inhomogeneities near the surface. In this work, the multi-site multi-frequency distortion decomposition, which is based on the Goom–Bailey (GB) decomposition method [27], was used to estimate the galvanic distortion of the MT response and the regional strike and dimension of magnetotelluric data before two-dimensional inversion and obtained the best electrical principal axis information of the three profiles in the study area according to this method (Supplementary Table S1). Under the assumption that the surface layer is partially covered by 3D on 2D structural paper, the observed impedance tensor (Z) was decomposed [27], the formula is as follows:
C is the frequency-independent local distortion matrix, g is a scalar factor, R is the rotation matrix, RT is the transpose matrix of R, T is the torsion matrix, S is the shear matrix, A is the decomposition tensor, and Z2-D is the actual 2D impedance tensor of the region. T can be expressed as:
t is the torsion factor, θ is the strike angle, e is the shear factor, and s is the splitting scale factor. gAZ2-D is solved as a whole due to its nonuniqueness:
There are 8 equations and 7 unknowns when the impedance tensor is expanded in the form of a real part and an imaginary part. The parameters of regional impedance, strike, and distortion can be obtained by using the least-squares method. Furthermore, the whole frequencies of the MT data are rotated to the respective strike directions before inversion. The GB strike directions of all sites for whole frequencies were depict using the rose diagram (Figure 3). As shown in Figure 4, the calculated structural strike almost coincides with the strike of the large-scale fault in Guangdong Province, China. The main electrical axes of the three profiles are mainly NE, which are consistent with the large structural trend of southeast China [6].
4.2. MT Data Inversion
Using the nonlinear conjugate gradient algorithm developed by Rodi and Mackie [28], two-dimensional inversion analysis of the rotated data is carried out, and the algorithm is implemented in the data interpretation package WinGLink. Before calculating the final model, several inversion parameters should be set to fit the data.
The collected magnetotelluric data can be divided into two parts, which includes data with a magnetic field direction perpendicular to propagation direction (TM) and data with the electric field direction perpendicular to propagation direction (TE), and the inversion modes include TM mode, TE mode, and TE and TM joint inversion mode. For TM mode it is more sensitive to the low-resistance structure in the shallow part and is susceptible to the influence of static displacement, which mainly produces current-type distortion; the TE mode well reflects the deep and high-resistance structure and is less affected by the static displacement, which is prone to inductive distortion. For measured data, it is generally preferred to use TM model data for two-dimensional inversion [29,30]. Consequently, to select the inversion results more suitable for the geological parameters, TE model inversion, TM model inversion, and TE and TM joint model inversion were carried out for the L300, respectively (Figure 5). The TE model inversion has a good reflection on the shallow high-resistance layer. However, the low-resistance layer is missing, and it is impossible to analyze the fracture characteristics of the underground structure. The TM model highlights the low-resistance layer well and has a perfect correspondence with the deep-seated fault in the Guangdong Province. There is a certain similarity between TE and TM joint inversion model and the TM model. However, the result of joint inversion is not ideal due to the large fitting difference between the TE and TM joint model and TM model. Accordingly, in this study, the TM model of nonlinear conjugate gradient (NLCG) two-dimensional was selected for inversion. The NLCG inversion method has the advantages of fast operation layer speed, less memory occupation, multimode inversion, avoiding the single inversion mode and multi-solution of inversion results. The results are more comprehensive and selective, and the inversion model is more intuitive, reflecting the underground problems clearly.
To obtain the best regularization parameter (τ) values, we selected different τ values (τ = 1, 3, 5, 10, 20, 50) for the L300, and carry out inversion, respectively. In the inversion process, the other parameters remain unchanged with the weighted parameter is 1.5 and the error range is 5%. Meanwhile, the fitting difference root-mean-square (RMS) value of each inversion is discriminated (Supplementary Table S2). Figure 6 displays that, τ = 1, it can be seen from the figure that its reflection effect on the shallow part is better, however, for the deep information, the overall performance is low resistance, which does not achieve good results; τ = 3, both the shallow part and the deep part have a good reflection effect; τ = 5 and τ = 10, it can be seen from figures that there is no significant difference in the whole, and it also has a large similarity with τ = 3. However, it does not obviously reflect the highly conductive upper mantle layer; τ = 20 and 50, the inversion results are much smoother than that in others. Although it reflects well on deep electrical characteristics, it does weakly on shallow formation information. Therefore, 3 is the best τ value, and it is used in the later inversion. Moreover, the initial resistivity was set as 100 Ω·m; the homogeneous half-space initial model was adopted; the WinGLink data inversion software was used for inversion.
4.3. Inversion Results
The most notable feature of the 2D inversion result is the large area of low resistance area along with these profiles (Figure 7). Each profile’s conductivity has a three-layered structure in vertical, and the low conductors are inserted between the high conductors across these profiles. The overall RMS of the L100, L200, and L300 are 4.4, 4.7, and 5.2, respectively. As demonstrated in Figure 7, the RMS value of most of the stations of the three profiles is below 4.5, and the RMS value of 90% of the station is less than 6. The 190 and 195 stations of the L100, which are located near Yangjiang City and Yangdong County, have a relatively large RMS value and may be greatly disturbed by human activity, resulting in poor data fitting in two-dimensional inversion. Similarly, the 225 station of the L200, which is located near Enping City, has a relatively large RMS value. The overall RMS of the L300 is much large than that of L100 and L200, and 20% of the L300 stations have high RMS values (>6). However, there is no significant human disturbance near these stations with high RMS values. Thus, we speculate that there are complex fault systems near these stations, and the RMS is affected by a three-dimensional inhomogeneous geological body near the surface.
5. Interpretations and Discussions
5.1. Interpretations of the Model
As can be seen from Figure 8, the resistivity increases with the depth in vertical profile, which contains three layers: crust sedimentary caprock in the top, middle and lower crust in the middle, and mantle to the bottom.
The top layer’s thickness gradually thins from west to east in L100 and L200 profiles ranging from 9 km to 2 km thickness, while it is about 4 km thickness in the L300 profile. Similarly, crust thickness gradually thins from west to east in all profiles with an average of ~30 km even though the crust’s thickness is various with 22 km in local. The high-resistance layer in the entire crust is cut into several blocks by the low-resistance bodies, forming a discontinuous spatial distribution of the high-resistance layer. A large area of low resistance layer has a resistivity value of 0.4–100 Ω·m in the lower layer of L100 and L200 profiles, and it tends to extend to −120 km or deeper. Furthermore, there is a large area of low resistivity in the upper mantle with a depth below 90 km, which is supposed to be asthenospheric. The presence of a discontinuous low resistivity layer in the range of −10 to −30 km suggests multiple channels for upwelling of the mantle sources or recommends a high-conductor formed by the alteration or melting of wall rocks caused by mantle materials. Specifically, Figure 8 shows the F3 (Heyuan Fault) adjacent to Heyuan City is connected with the asthenospheric upwelling in the L300. Our previous geophysical exploration in the Heyuan Basin confirmed that the Heyuan Fault controls Cenozoic basalt occurrence [3]. Moreover, all the regional fault zones are well reflected in the inversion model, and the low resistance zone near the surface matches with the actual location of fracture exposure.
5.2. Lithosphere and Asthenosphere
5.2.1. Thickness of Lithosphere and Structure of the upper Mantle
The lithosphere thickness of the study areas and adjacent areas is around 80 km, as shown in this study. This result is similar to other geophysical observations in South China. For example, the ambient noise tomography work indicated that the lithosphere thickness in the Cathaysia Block is 60–70 km [9]. The receiver function results implied a lithosphere thickness of ~65 km in southeast China [11,31]. Deng and Levandowski proposed that the depth of the lithosphere–asthenosphere boundary (LAB) is ranging around 100 km, which is estimated by the final density model and receiver functions [12]. A joint inversion of Rayleigh wave dispersion data, topography, geoid height, and terrestrial heat flow with a probabilistic Monte Carlo method predicts the recent lithosphere in South China is ranging from 80–105 km [10].
Notably, the depth of LAB in South China observed by different complex and commendably geophysical methods seems variable. The presence of multichannel of asthenosphere upwelling in the coastal area and adjacent area may well explain the variable depth of LAB as these upwelling channels interfered with geophysical interpretation to some extent. As shown in Figure 8, each profile has several asthenospheric upwelling channels along deep-seated faults whose influence width is tens of kilometers. Similarly, using the magnetotelluric method to detect the crust/mantle thermal structure shows that the asthenospheric upwelling is common in southeast China, including Fujian Province, Guangdong Province, etc. [32,33]. The impact of these widespread distributed multichannel asthenospheric upwelling on the lithosphere mainly reflects in the following two points. For one, the rigid lithosphere turns into a plastic state under the underplating of high-temperature materials. It is gradually eroded by the asthenosphere, resulting in thinning of the lithosphere. Additionally, the lithosphere undergoes partially melting due to the underplating of the asthenosphere with meltable material separate out from the lithosphere to the asthenosphere. The lithosphere’s remaining rigid material undergoes rigid rupture under gravity and sinks into the asthenosphere [34,35]. These two mechanisms coexist in the upwelling process of the asthenosphere, and all have a significant impact on lithospheric thinning. Furthermore, Compared with other ancient cratons, U-Pb zircon geochronology dates the Cathaysian block where southeast China locates as Neoproterozoic in age [36] indicate the lithosphere is more vulnerable to erosion and destruction [32]. In summary, the asthenosphere’s upwelling has completely modified the lithospheric structure, resulting in different thicknesses of the lithosphere and crust–mantle structures in Guangdong Province.
Guangdong Province straddles the boundary between three energetic tectonic domains: the Pacific subduction zone to the east, the collision zone between the Philippine Sea and the Eurasian plate to the southeast, and the spreading of the South China Sea to the south (Figure 1). Specifically, for the Pacific plate, previous receiver function images of mantle transition zone [37,38,39] and tomographic studies [40,41] indicate that the slab front extends into the area beneath the South China block (~105° E). Various geophysical and geochemical evidence has indicated that the Pacific plate stagnant in the mantle transition zone and has continuously released fluid material to destruct and reform the overlying lithospheric mantle [40,42,43]. The collision zone between the Philippine Sea and the Eurasian plate forms compressional uplifting and orogeny along the southeast coast area and Taiwan [44,45]. The evolution of the South China Sea has a significant impact on the surrounding continents, which is reflected in the formation of crustal uplifting or depression [2,46,47]. The interaction of these plates affects the activity of the asthenosphere in Guangdong Province and adjacent areas. For example, the force driven by the Pacific plate’s subduction triggers the mantle convection, inducing the eastward asthenospheric flow beneath South China in the big mantle wedge. For one, during the flow process, the positive buoyancy causes asthenospheric upwelling accompanied by decompression melting and melt extraction [48]. This process will erode the overlying lithosphere. On another side, fluid released by the stagnant Pacific plate is added to the asthenosphere to promote the partial melting of the Upper mantle and Mantle transition zone [49,50,51].
Moreover, geophysical results imply that the present lithospheric thickness (~80 km) is much less than that of the Paleozoic lithosphere. Geochemistry and P-T studies on mantle peridotite enclaves/xenoliths entrained by Paleozoic kimberlite and basalt have indicated that there was a thick lithosphere (110–230 km) at that time beneath South China [13,15]. However, the study on Mesozoic Ningyuan mantle xenoliths implies a thin lithosphere (<80 km) [52] and that on Cenozoic Xinchang mantle xenoliths intimate the mantle replacement and accretion is a common process in South China since the Mesozoic [14]. These pieces of geological evidence present a process of incessant lithospheric thinning and asthenospheric intrusion.
In summary, for a given tectonic domain mainly affected by subduction or collision, the evolution of the continent plate depends on the fluid (primarily water) content and forms of the subducting or colliding plate and the intrinsic properties of the continental block [32]. The structure of the upper mantle and thickness of the lithosphere in southeast China are affected by different motion types of different plates, fluid addition, and its crust–mantle properties, leading to regional large-scale asthenosphere upwelling, causing the South China lithosphere to be destructed and reformed by mantle-derived hot materials. As a consequence, a thin lithosphere (<80 km) is commonly present beneath southeast China and is consistent with the high heat flow (Q) [17].
5.2.2. Structure of the Crust
MT results thoroughly document the crustal electrical structure, the characteristics of deep-seated faults, and the variation of crustal thickness. As mentioned in previous (Section 5.1), numerous low electric resistance geological body is present in the crust where couples with deep-seated faults. The asthenosphere uplift’s top interface corresponds well with the position of the fault zone in the crust. For example, the asthenospheric material can uplift to a shallow position where there are deep-seated faults in the superficial (Figure 8). In other words, deep-seated fault zones play an important role in controlling the upwelling of the asthenosphere. The thickness of the crust is generally around 30 km and tends to thin eastward.
The same geological structure feature was also reported in most other southeast China areas by different geophysics observations or numerical simulations. The MT results in other southeast China regions presented a similar crustal electrical structure, the characteristics of deep-seated faults, and the variation of crustal thickness of that in this study [33]. Based on deep seismic-sounding data, Zhang and Wang inferred that the crust thickness in the Cathaysia Block is around 33 km, and the crustal thickness tends to thin eastward [53]. Deep seismic-sounding data also displays such a thin eastward trend of crustal thickness and the crustal thickness ranging from 30 to 34 km; the result from receiver function analysis with teleseismic wavefield reconstruction suggested that Moho surface depth in southeast China ranges from 25–35 km [54]. Based on the numerical simulation in South China, Zhang et al. proposed the Moho temperature, and the Moho depth is ranged from 500 to 650 °C and from 27 to 32 km, respectively [55]. The joint inversion of receiver functions and surface wave dispersion indicated a crust thickness in southeast China is approximately 30 km [56]. These studies all show a relatively thin and electrical heterogeneity crust in Guangdong Province.
5.3. Interpretation of the Geothermal Anomalies in Guangdong Province
Heat flow is considered as one of the direct surface geothermal manifestations of subterranean thermal energy and is a key parameter used to interpret the crust–mantle structure and geodynamics [17,57,58]. Guangdong Province is located in the second-largest geothermal anomaly area in China, where surface heat flow ranges from 61.6 to 97 mW/m2 with a mean average of 73 mW/m2 [17]. The values of surface heat flow are greater than the mean heat flow of continental China (60 mW/m2, [17]), and the globe means heat flow of continental crust (65 mW/m2, [57]). High heat flow has formed many “hot” basins in Guangdong Province (Figure 2) and developed with numerous natural hot springs (recorded natural hot springs more than 300, Figure 2). However, the surface heat flow for Guangdong Province is limited by the small number of measurement sites (only 24 sites have been reported in the literature up to 2019 in Guangdong Province, Figure 2) and are affected by the local geothermal fluid convection [59]. Therefore, we use the surface heat flow and the natural hot spring, which is a direct indicator to interpret the geothermal anomalies in Guangdong Province.
The high ratio of mean Qmantle/Qcrust (~1.33) in southeast China implies that mantle heat causes surface geothermal anomalies in Guangdong Province [17]. As mentioned above, the thin lithosphere, which accompanies by multichannel asthenospheric upwelling, determines a high terrestrial heat flow in Guangdong Province. The upwelling channel of mantle-derived material is connected with the fault system of shallow crust in Guangdong Province. Source waters penetrate the fault system and reach deep into the places where the mantle-derived material is affected. These places have a high temperature, warming the cold water and resulting in fluid convection in the fault system. Fluid convection causes heat upwelling and the development of natural hot springs along with the fault system or adjacent areas (Figure 2).
It should be noted that many natural hot springs in Guangdong Province and its surroundings are distributed along with the faults system and the exposed areas of the Late Mesozoic granite. This is attributed to the high radioactive heat-producing elements (HPE, such as 238U, 232Th, and 40K) of the Late Mesozoic granites in South China. These Late Mesozoic granites in Guangdong Province are widely distributed with an exposed area of 60,000 km2, accounting for more than one-third of the area (Figure 2). These granites in Guangdong Province and adjacent areas were formed in a typical continental arc setting and were considered to associate with the advance of the Paleo-Pacific Plate in the Early Middle Jurassic and the retreat of the Paleo-Pacific Plate in the Late Jurassic to Cretaceous [2,5,22]. Importantly, subduction plate-derived materials and the decompression melting caused by stress relaxation promoted the reworking of terrane in South China [7,60]. Two-stage model age of Jurassic and Cretaceous granite Hf isotope ranges between 1.6 and 1.8 Ga, suggesting Late Mesozoic granites in Huizhou area were generated by remelting of Proterozoic crust [61]. This result is consistent with the two-stage model age of detrital zircons Hf isotope in Oujiang River, eastern Cathaysia, Fogang granites, and Nankunshan granites [7,60]. The remelting of differentiated crust material leads to redifferentiation occur. Consequently, the Late Mesozoic granites inevitably have high large ion lithophile elements. Statistics and calculation of the Th, U, and K content of Mesozoic granites in South China show an extremely high heat production with average values of 6.29 μW/m3 for the Late Mesozoic granite in Guangdong [8,62]. The radioactive heat reservoirs calculated based on the heat production show the Mesozoic granite intrusions contain abundant radioactive heat production (Figure S3). As shown in Figure S3, compared with the Mesozoic granites in Guangdong Province and its surrounding areas, the Late Mesozoic granites in Nanling Range have the highest heat production (heat production more than 9 μW/m3 of some granites, radioactivity heat reservoirs more than 1016 J/a of some granite intrusions) and radioactive heat reservoirs and couple with numerous high-temperature (>80 °C) natural hot spring. This finding reveals Late Mesozoic granite has a marked contribution to the regional geothermal anomaly.
The previous study inferred, based on low gravity anomalies, that there are massive concealed granitic bodies under the exposed Mesozoic granite and adjacent areas [18]. However, our previous study in the Huiyang-Meixian depression between Huizhou and Heyuan City revealed a continuous concealed granite under the depression [3] where Xi et al. [18] deduced there was an absence of concealed granite. Thus, we speculate that the scale of concealed granite under the Guangdong Province is larger than Xi et al. [17] suspected. In other words, due to the extremely high heat production of the Late Mesozoic granite, the Late Mesozoic granite under the Guangdong Province turned into a high-temperature geothermal reservoir. Large quantities of heat released from persistent radioactive decay are one of the most significant geothermal mechanisms in Guangdong Province.
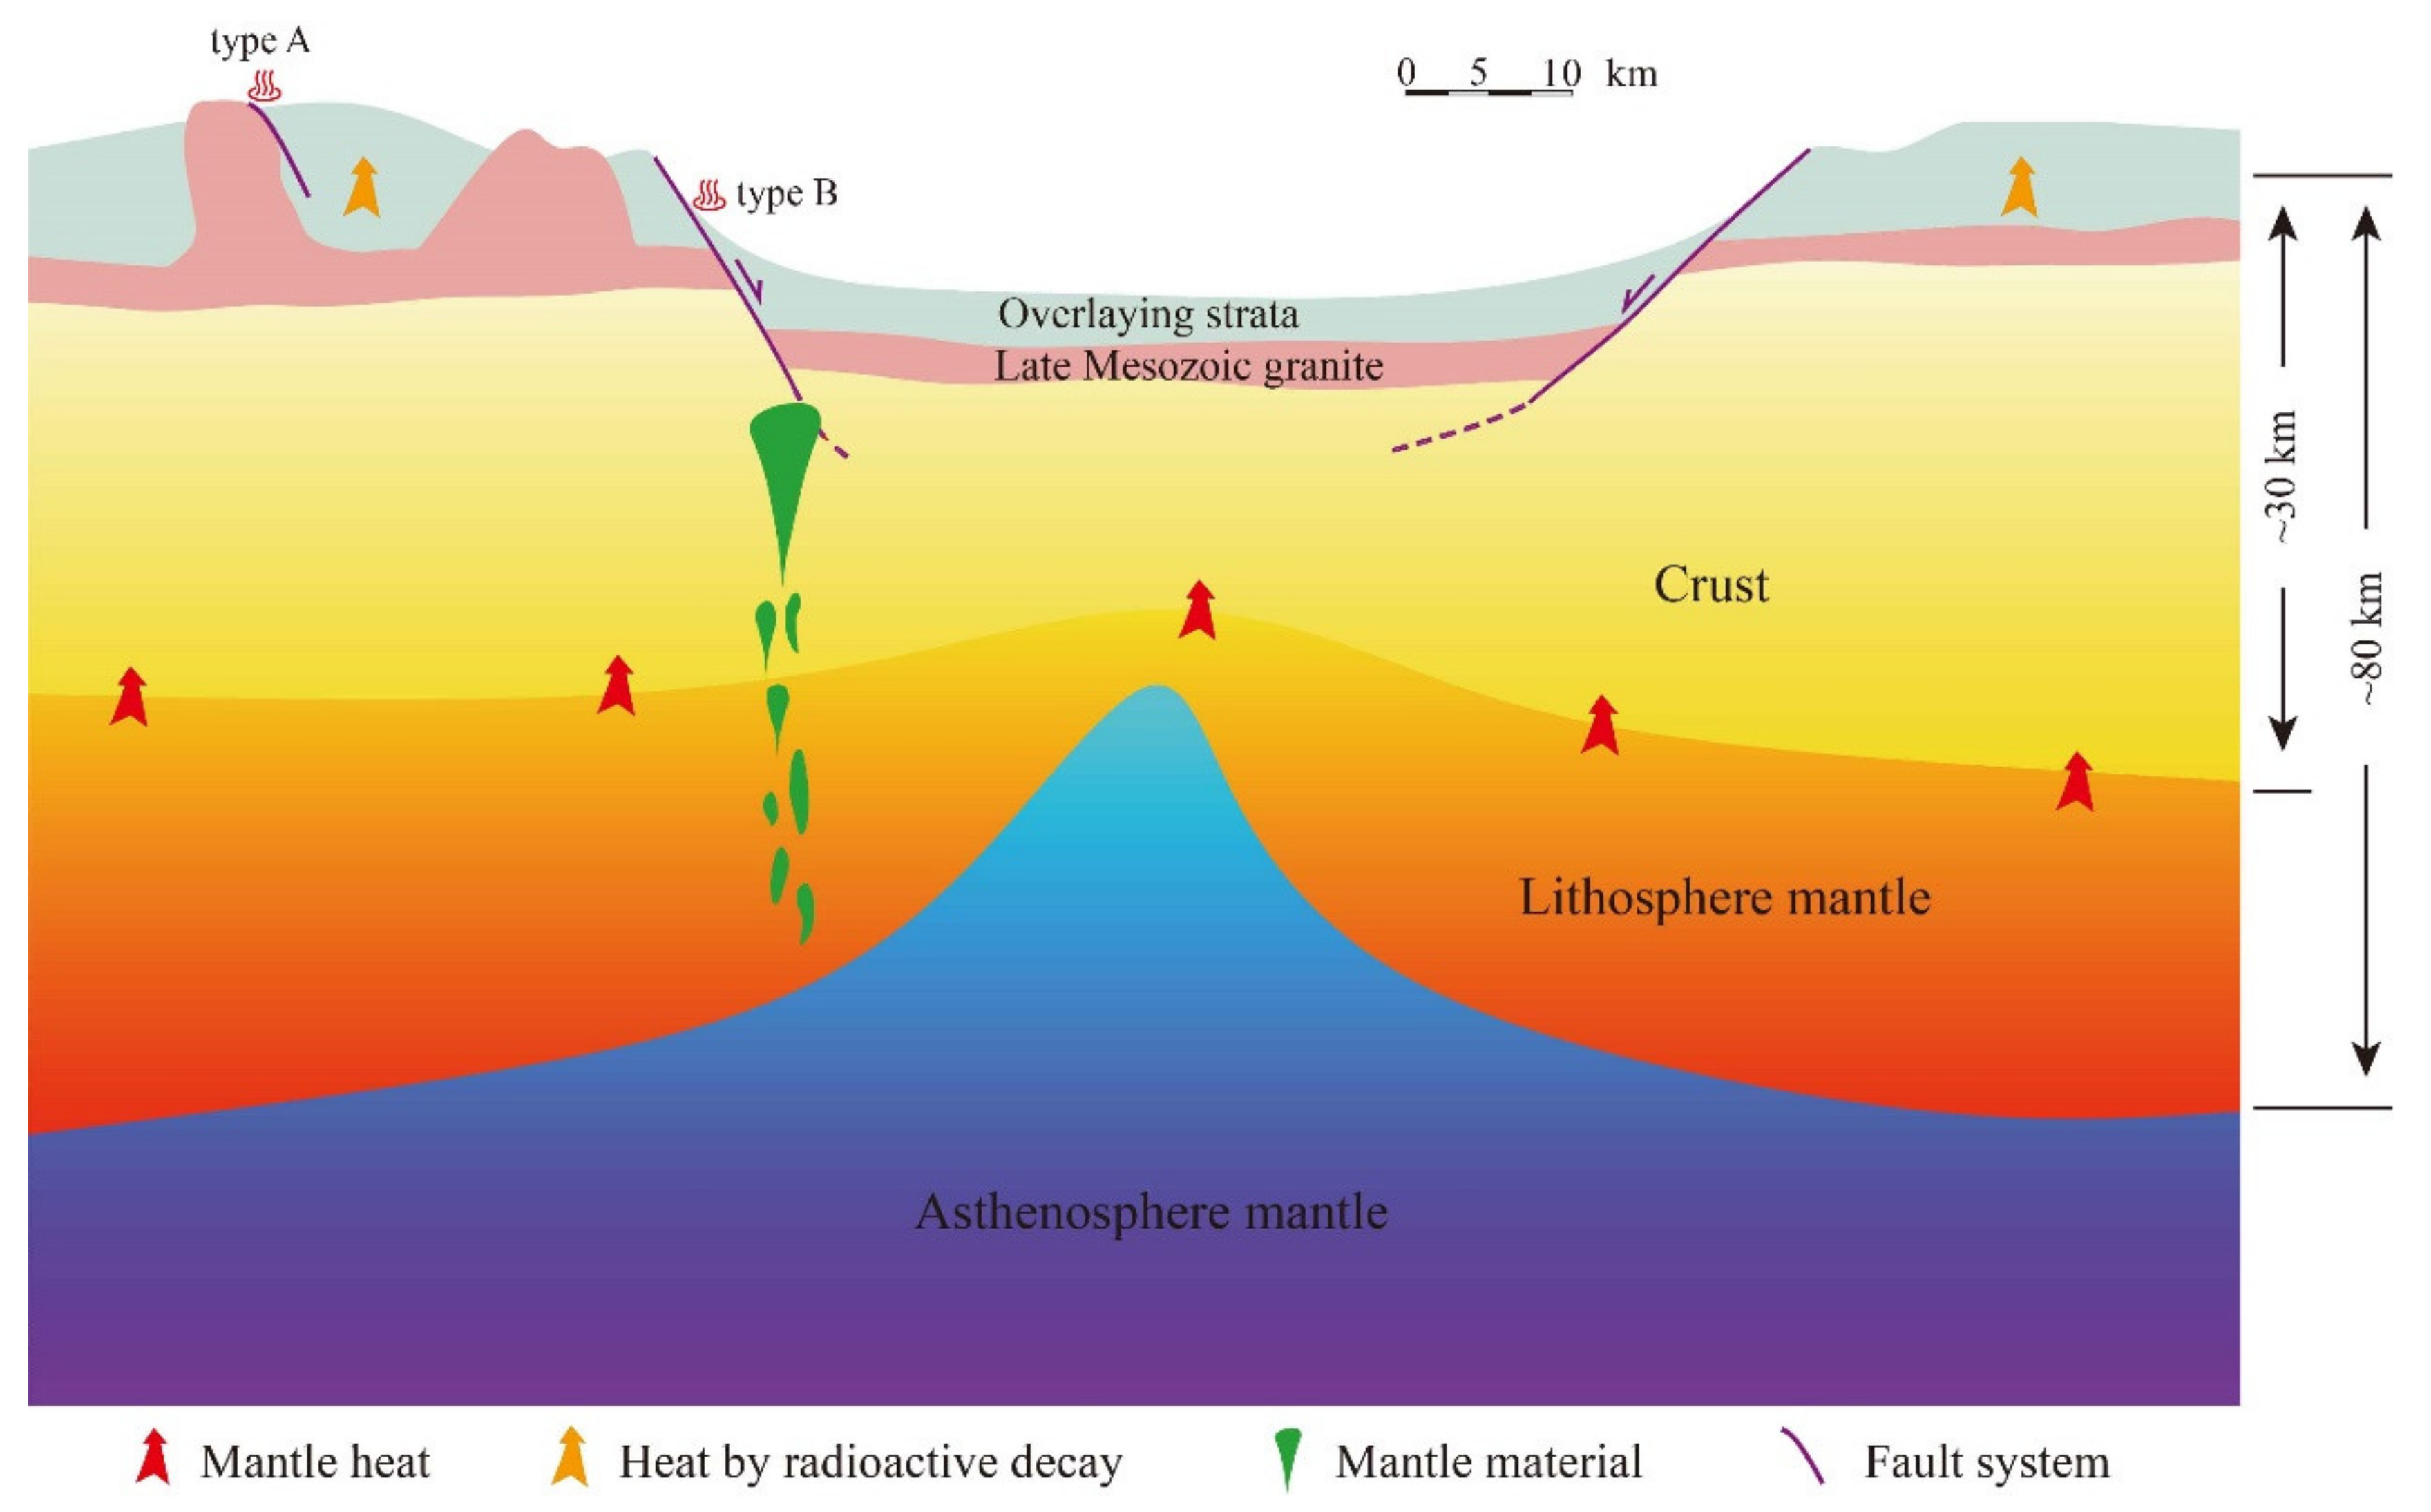
By integrating the results and discussions above, a geothermal model is proposed to visualize the origin and evolution process of geothermic in Guangdong Province (Figure 9). For one, the arc tectonic setting in Guangdong had gradually changed into an intraplate rift setting since Mesozoic [2,22], forming large-scale basins includes Heyuan Basin, Sanshui Basin, Lianping Basin, etc. [3,4,23], and accompanying with upwelling of mantle material. The thin lithosphere superimposed upwelling of mantle-derived material determines the high heat flow background in Guangdong Province. For another, voluminous Late Mesozoic granite generated by remelting of the Neoproterozoic and Paleozoic crust [7,61] contains an extremely high content of heat-producing elements. Large quantities of heat are released from the persistent radioactive decay of these heat-producing elements. Consequently, the special crust-upper mantle structure in Guangdong Province has led to the formation of numerous natural hot springs. These hot springs can be divided into two types (Figure 9). The first is type A, hot springs distributed near the fault of granite area, the Late Mesozoic granite is the key heat source. Typical examples are the hot springs in the Nanling Range. The second is type B, hot springs distributed along fault zones with mantle-derived material upwelling, the mantle material and the Late Mesozoic granite are the key heat source. Typical examples are the hot springs along the Heyuan fault, where noble gas evidence shows the upwelling of mantle material [63].
6. Conclusions
In this study, we focused on the crust and upper mantle structure and its geothermal implications in Guangdong Province. The main results and conclusions are as follows:
- Three new MT profiles with a total of 440 km long across the major portion of Guangdong Province were acquired to reconstruct crust and upper mantle structure. The TM model of the nonlinear conjugate gradient (NLCG) two-dimensional inversion with τ = 3 was determined by data analysis;
- Inversion results show that the low resistance zone on the shallow surface matches the actual location of the fault; there is the presence of multi upwelling channels of asthenosphere mantle, and some channels are connected with shallow crustal fault zone; the thickness of the crust and the lithosphere in Guangdong Province are relatively thin. The crust and upper mantle structure in Guangdong Province is the result of long-term (from Proterozoic to Cenozoic) tectonic magmatism, especially the intense tectonic magmatism caused by multi-plate interaction since the late Mesozoic. Such special crust and upper mantle structure forms high surface heat flow and is one of the key factors for generating anomalies;
- Massive Late Mesozoic granites, which contain high radioactive heat-producing elements, are distributed on the surface and underground of Guangdong Province. Large quantities of heat released from persistent radioactive decay of Late Mesozoic granite are another significant geothermal mechanism in Guangdong Province.
Supplementary Materials
The following are available online at https://www.mdpi.com/article/10.3390/en14082236/s1, Figure S1: Calibration results of V5 system 2000 equipment box, Figure S2: Calibration results of V5 system 2000 equipment probe, Figure S3: Radioactive heat reservoirs and radioactive heat production rate of the late Mesozoic exposed granite and the distribution of the hot springs in Guangdong province and adjacent area.
Author Contributions
Conceptualization, investigation and data curation, J.K.; methodology, software, validation, formal analysis, S.Q. and X.H.; writing—Original draft preparation, J.K.; writing—Review and editing, S.Q. and X.H.; supervision and project administration, S.Q. and X.H. All authors have read and agreed to the published version of the manuscript.
Funding
This research was funded by the Urban Underground Space Development and Utilization of Huizhou and China Geological Survey Project (1212011220014).
Acknowledgments
The first author would like to acknowledge Wang Shuai, Huang Xuelian, Xiao Zhicai, and Cheng Zihao for the support during the analyses. Special thanks go to three reviewers whose constructive comments help us a lot. Our deepest gratitude goes to the Academic Editors, Renato Somma and Raul Andreica, for their careful work and thoughtful suggestions that have helped improve this manuscript substantially. We appreciate Zhou Bing for the technical support.
Conflicts of Interest
The authors declare no conflict of interest.
References
- Zheng, Y.-F.; Xiao, W.-J.; Zhao, G. Introduction to tectonics of China. Gondwana Res. 2013, 23, 1189–1206. [Google Scholar] [CrossRef]
- Suo, Y.; Li, S.; Jin, C.; Zhang, Y.; Zhou, J.; Li, X.; Wang, P.; Liu, Z.; Wang, X.; Somerville, I. Eastward tectonic migration and transition of the Jurassic-Cretaceous Andean-type continental margin along Southeast China. Earth Sci. Rev. 2019, 196, 102884. [Google Scholar] [CrossRef]
- Kuang, J.; Wang, S.; Qi, S.; Xiao, Z.; Zhang, M.; Wang, Y. Cenozoic tectonic evolution of South China: A brief review, and new insights from the Huangshadong-Shiba area, south-east China. Geol. J. 2020, 55, 7716–7737. [Google Scholar] [CrossRef]
- Zhou, X.; Sun, T.; Shen, W.; Shu, L.; Niu, Y. Petrogenesis of Mesozoic granitoids and volcanic rocks in South China: A response to tectonic evolution. Episodes 2006, 29, 26. [Google Scholar] [CrossRef] [PubMed] [Green Version]
- Li, Z.-X.; Li, X.-H. Formation of the 1300-km-wide intracontinental orogen and postorogenic magmatic province in Mesozoic South China: A flat-slab subduction model. Geology 2007, 35, 179–182. [Google Scholar] [CrossRef]
- Wang, Y.; Fan, W.; Zhang, G.; Zhang, Y. Phanerozoic tectonics of the South China Block: Key observations and controversies. Gondwana Res. 2013, 23, 1273–1305. [Google Scholar] [CrossRef]
- Xu, X.; O’Reilly, S.Y.; Griffin, W.L.; Wang, X.; Pearson, N.J.; He, Z. The crust of Cathaysia: Age, assembly and reworking of two terranes. Precambr. Res. 2007, 158, 51–78. [Google Scholar] [CrossRef]
- Zhou, Z.-M.; Ma, C.-Q.; Qi, S.-H.; Xi, Y.-F.; Liu, W. Late Mesozoic high-heat-producing (HHP) and high-temperature geothermal reservoir granitoids: The most significant geothermal mechanism in South China. Lithos 2020, 366, 105568. [Google Scholar] [CrossRef]
- Zhou, L.; Xie, J.; Shen, W.; Zheng, Y.; Yang, Y.; Shi, H.; Ritzwoller, M.H. The structure of the crust and uppermost mantle beneath South China from ambient noise and earthquake tomography. Geophys. J. Int. 2012, 189, 1565–1583. [Google Scholar] [CrossRef] [Green Version]
- Shan, B.; Afonso, J.C.; Yang, Y.; Grose, C.J.; Zheng, Y.; Xiong, X.; Zhou, L. The thermochemical structure of the lithosphere and upper mantle beneath south China: Results from multiobservable probabilistic inversion. J. Geophys. Res. Solid Earth 2014, 119, 8417–8441. [Google Scholar] [CrossRef] [Green Version]
- Zheng, T.-Y.; Zhao, L.; He, Y.-M.; Zhu, R.-X. Seismic imaging of crustal reworking and lithospheric modification in eastern China. Geophys. J. Int. 2014, 196, 656–670. [Google Scholar] [CrossRef] [Green Version]
- Deng, Y.; Levandowski, W. Lithospheric Alteration, Intraplate Crustal Deformation, and Topography in Eastern China. Tectonics 2018, 37, 4120–4134. [Google Scholar] [CrossRef]
- Zhang, H.-F.; Sun, M.; Lu, F.-X.; Zhou, X.-H.; Zhou, M.-F.; Liu, Y.-S.; Zhang, G.-H. Geochemical significance of a garnet lherzolite from the Dahongshan kimberlite, Yangtze Craton, southern China. Geochem. J. 2001, 35, 315–331. [Google Scholar] [CrossRef]
- Liu, C.-Z.; Liu, Z.-C.; Wu, F.-Y.; Chu, Z.-Y. Mesozoic accretion of juvenile sub-continental lithospheric mantle beneath South China and its implications: Geochemical and Re–Os isotopic results from Ningyuan mantle xenoliths. Chem. Geol. 2012, 291, 186–198. [Google Scholar] [CrossRef]
- Zheng, J.P.; Lee, C.-T.A.; Lu, J.G.; Zhao, J.H.; Wu, Y.B.; Xia, B.; Li, X.Y.; Zhang, J.F.; Liu, Y.S. Refertilization-driven destabilization of subcontinental mantle and the importance of initial lithospheric thickness for the fate of continents. Earth Planet. Sci. Lett. 2015, 409, 225–231. [Google Scholar] [CrossRef]
- Hu, S.; He, L.; Wang, J. Heat flow in the continental area of China: A new data set. Earth Planet. Sci. Lett. 2000, 179, 407–419. [Google Scholar] [CrossRef]
- Jiang, G.; Hu, S.; Shi, Y.; Zhang, C.; Wang, Z.; Hu, D. Terrestrial heat flow of continental China: Updated dataset and tectonic implications. Tectonophysics 2019, 753, 36–48. [Google Scholar] [CrossRef]
- Xi, Y.; Wang, G.; Liu, S.; Zhao, Y.; Hu, X. The formation of a geothermal anomaly and extensional structures in Guangdong, China: Evidence from gravity analyses. Geothermics 2018, 72, 225–231. [Google Scholar] [CrossRef]
- Van der Zwaan, B.; Dalla Longa, F. Integrated assessment projections for global geothermal energy use. Geothermics 2019, 82, 203–211. [Google Scholar] [CrossRef]
- Ceglia, F.; Macaluso, A.; Marrasso, E.; Roselli, C.; Vanoli, L. Energy, Environmental, and Economic Analyses of Geothermal Polygeneration System Using Dynamic Simulations. Energies 2020, 13, 4603. [Google Scholar] [CrossRef]
- Ceglia, F.; Macaluso, A.; Marrasso, E.; Sasso, M.; Vanoli, L. Modelling of Polymeric Shell and Tube Heat Exchangers for Low-Medium Temperature Geothermal Applications. Energies 2020, 13, 2737. [Google Scholar] [CrossRef]
- Tao, N.; Li, Z.-X.; Danišík, M.; Evans, N.J.; Batt, G.E.; Li, W.-X.; Pang, C.-J.; Jourdan, F.; Xu, Y.-G.; Liu, L.-P. Thermochronological record of Middle–Late Jurassic magmatic reheating to Eocene rift-related rapid cooling in the SE South China Block. Gondwana Res. 2017, 46, 191–203. [Google Scholar] [CrossRef]
- Ren, J.; Tamaki, K.; Li, S.; Junxia, Z. Late Mesozoic and Cenozoic rifting and its dynamic setting in Eastern China and adjacent areas. Tectonophysics 2002, 344, 175–205. [Google Scholar] [CrossRef]
- Gong, J.; Chen, Y.J. Evidence of lateral asthenosphere flow beneath the South China craton driven by both Pacific plate subduction and the India–Eurasia continental collision. Terra Nova 2014, 26, 55–63. [Google Scholar] [CrossRef]
- Gamble, T.D.; Goubau, W.M.; Clarke, J. Magnetotellurics with a remote magnetic reference. Geophysics 1979, 44, 53–68. [Google Scholar] [CrossRef] [Green Version]
- Egbert, G.D.; Booker, J.R. Robust estimation of geomagnetic transfer functions. Geophys. J. R. Astron. Soc. 1986, 87, 173–194. [Google Scholar] [CrossRef] [Green Version]
- Groom, R.W.; Bailey, R.C. Decomposition of magnetotelluric impedance tensors in the presence of local three-dimensional galvanic distortion. J. Geophys. Res. Solid Earth 1989, 94, 1913–1925. [Google Scholar] [CrossRef] [Green Version]
- Rodi, W.; Mackie, R.L. Nonlinear conjugate gradients algorithm for 2-D magnetotelluric inversion. Geophysics 2001, 66, 174–187. [Google Scholar] [CrossRef]
- Berdichevsky, M.N. Marginal Notes on Magnetotellurics. Surv. Geophys. 1999, 20, 341–375. [Google Scholar] [CrossRef]
- Ledo, J. 2-D versus 3-D magnetotelluric data interpretation. Surv. Geophys. 2005, 26, 511–543. [Google Scholar] [CrossRef]
- Zhang, M.; Guo, Z.; Liu, J.; Liu, G.; Zhang, L.; Lei, M.; Zhao, W.; Ma, L.; Sepe, V.; Ventura, G. The intraplate Changbaishan volcanic field (China/North Korea): A review on eruptive history, magma genesis, geodynamic significance, recent dynamics and potential hazards. Earth Sci. Rev. 2018, 187, 19–52. [Google Scholar] [CrossRef]
- Zhao, L.; Allen, R.M.; Zheng, T.; Zhu, R. High-resolution body wave tomography models of the upper mantle beneath eastern China and the adjacent areas. Geochem. Geophys. Geosyst. 2012, 13. [Google Scholar] [CrossRef] [Green Version]
- Hu, X.Y.; Bi, B.T.; Liu, G.X.; Han, J.T.; Cai, J.C.; Peng, R.H.; Xu, S.; Liu, S.J. The lithospheric electrical structure of ji’an-fuzhou profile in the east part of south china. Chin. J. Geophys. 2017, 60, 532–543. [Google Scholar]
- Menke, W.; Lamoureux, J.; Abbott, D.; Hopper, E.; Hutson, D.; Marrero, A. Crustal heating and lithospheric alteration and erosion associated with asthenospheric upwelling beneath southern New England (USA). J. Geophys. Res. Solid Earth 2018, 123, 8995–9008. [Google Scholar] [CrossRef]
- Zheng, Y.; Xu, Z.; Zhao, Z.; Dai, L. Mesozoic mafic magmatism in North China: Implications for thinning and destruction of cratonic lithosphere. Sci. China Earth Sci. 2018, 61, 353–385. [Google Scholar] [CrossRef]
- Yu, J.-H.; Wei, Z.-Y.; Wang, L.-J.; Shu, L.-S.; Sun, T. Cathaysia Block: A young continent composed of ancient materials. Geol. J. China Univ. 2006, 12, 440–447. [Google Scholar]
- Ai, Y.; Zheng, T. The upper mantle discontinuity structure beneath eastern China. Geophys. Res. Lett. 2003, 30. [Google Scholar] [CrossRef] [Green Version]
- Chen, L.; Ai, Y. Discontinuity structure of the mantle transition zone beneath the North China Craton from receiver function migration. J. Geophys. Res. Solid Earth 2009, 114. [Google Scholar] [CrossRef]
- Xu, W.; Zheng, T.; Zhao, L. Mantle dynamics of the reactivating North China Craton: Constraints from the topographies of the 410-km and 660-km discontinuities. Sci. China Earth Sci. 2011, 54, 881–887. [Google Scholar] [CrossRef]
- Huang, J.; Zhao, D. High-resolution mantle tomography of China and surrounding regions. J. Geophys. Res. Solid Earth 2006, 111. [Google Scholar] [CrossRef]
- Li, C.; Hilst, R.D. Structure of the upper mantle and transition zone beneath Southeast Asia from traveltime tomography. J. Geophys. Res. Solid Earth 2010, 115. [Google Scholar] [CrossRef]
- Zhao, D.; Maruyama, S.; Omori, S. Mantle dynamics of Western Pacific and East Asia: Insight from seismic tomography and mineral physics. Gondwana Res. 2007, 11, 120–131. [Google Scholar] [CrossRef]
- Yan, D.; Tian, Y.; Zhao, D.; Liu, C.; Zhu, H.; Li, H. Upper mantle temperature structure of the North China Craton. Phys. Earth Planet. Inter. 2019, 293, 106269. [Google Scholar] [CrossRef]
- Lallemand, S.; Theunissen, T.; Schnürle, P.; Lee, C.-S.; Liu, C.-S.; Font, Y. Indentation of the Philippine Sea plate by the Eurasia plate in Taiwan: Details from recent marine seismological experiments. Tectonophysics 2013, 594, 60–79. [Google Scholar] [CrossRef] [Green Version]
- Wu, J.; Suppe, J.; Lu, R.; Kanda, R. Philippine Sea and East Asian plate tectonics since 52 Ma constrained by new subducted slab reconstruction methods. J. Geophys. Res. Solid Earth 2016, 121, 4670–4741. [Google Scholar] [CrossRef] [Green Version]
- Ye, Q.; Mei, L.; Shi, H.; Camanni, G.; Shu, Y.; Wu, J.; Yu, L.; Deng, P.; Li, G. The Late Cretaceous tectonic evolution of the South China Sea area: An overview, and new perspectives from 3D seismic reflection data. Earth Sci. Rev. 2018, 187, 186–204. [Google Scholar] [CrossRef]
- Ye, Q.; Mei, L.; Shi, H.; Shu, Y.; Camanni, G.; Wu, J. A low-angle normal fault and basement structures within the Enping Sag, Pearl River Mouth Basin: Insights into late Mesozoic to early Cenozoic tectonic evolution of the South China Sea area. Tectonophysics 2018, 731, 1–16. [Google Scholar] [CrossRef]
- Raddick, M.J.; Parmentier, E.M.; Scheirer, D.S. Buoyant decompression melting: A possible mechanism for intraplate volcanism. J. Geophys. Res. Solid Earth 2002, 107, ECV 7-1–ECV 7-14. [Google Scholar] [CrossRef]
- Zou, H.; Fan, Q.; Yao, Y. U–Th systematics of dispersed young volcanoes in NE China: Asthenosphere upwelling caused by piling up and upward thickening of stagnant Pacific slab. Chem. Geol. 2008, 255, 134–142. [Google Scholar] [CrossRef]
- Sakuyama, T.; Tian, W.; Kimura, J.-I.; Fukao, Y.; Hirahara, Y.; Takahashi, T.; Senda, R.; Chang, Q.; Miyazaki, T.; Obayashi, M.; et al. Melting of dehydrated oceanic crust from the stagnant slab and of the hydrated mantle transition zone: Constraints from Cenozoic alkaline basalts in eastern China. Chem. Geol. 2013, 359, 32–48. [Google Scholar] [CrossRef]
- Huang, J.; Li, S.-G.; Xiao, Y.; Ke, S.; Li, W.-Y.; Tian, Y. Origin of low δ26Mg Cenozoic basalts from South China Block and their geodynamic implications. Geochim. Cosmochim. Acta 2015, 164, 298–317. [Google Scholar] [CrossRef]
- Liu, C.-Z.; Wu, F.-Y.; Sun, J.; Chu, Z.-Y.; Qiu, Z.-L. The Xinchang peridotite xenoliths reveal mantle replacement and accretion in southeastern China. Lithos 2012, 150, 171–187. [Google Scholar] [CrossRef]
- Zhang, Z.; Wang, Y. Crustal structure and contact relationship revealed from deep seismic sounding data in South China. Phys. Earth Planet. Inter. 2007, 165, 114–126. [Google Scholar] [CrossRef] [Green Version]
- Song, P.; Zhang, X.; Liu, Y.; Teng, J. Moho imaging based on receiver function analysis with teleseismic wavefield reconstruction: Application to South China. Tectonophysics 2017, 718, 118–131. [Google Scholar] [CrossRef]
- Zhang, J.; Wang, B.; Tang, X.; Dong, M.; Ai, Y. Temperature structure and dynamic background of crust and mantle beneath the high heat flow area of the South China continental margin (in Chinese with English abstract). Chin. J. Geophys. 2018, 61, 16. [Google Scholar]
- Deng, Y.; Li, J.; Peng, T.; Ma, Q.; Song, X.; Sun, X.; Shen, Y.; Fan, W. Lithospheric structure in the Cathaysia block (South China) and its implication for the Late Mesozoic magmatism. Phys. Earth Planet. Inter. 2019, 291, 24–34. [Google Scholar] [CrossRef]
- Davies, J.H. Global map of solid Earth surface heat flow. Geochem. Geophys. Geosyst. 2013, 14, 4608–4622. [Google Scholar] [CrossRef]
- Furlong, K.P.; Chapman, D.S. Heat Flow, Heat Generation, and the Thermal State of the Lithosphere. Annu. Rev. Earth Planet. Sci. 2013, 41, 385–410. [Google Scholar] [CrossRef]
- Hu, S.-B.; He, L.-J.; Wang, J.-Y. Compilation of Heat Flow Data in the China Continental Area. Chin. J. Geophys. 2001, 44, 604–618. [Google Scholar] [CrossRef]
- Li, X.-H.; Li, Z.-X.; Li, W.-X.; Liu, Y.; Yuan, C.; Wei, G.; Qi, C. U–Pb zircon, geochemical and Sr–Nd–Hf isotopic constraints on age and origin of Jurassic I- and A-type granites from central Guangdong, SE China: A major igneous event in response to foundering of a subducted flat-slab? Lithos 2007, 96, 186–204. [Google Scholar] [CrossRef]
- Xiao, Z.; Wang, S.; Qi, S.; Kuang, J.; Zhang, M.; Tian, F.; Han, Y. Petrogenesis, Tectonic Evolution and Geothermal Implications of Mesozoic Granites in the Huangshadong Geothermal Field, South China. J. Earth Sci. 2020, 31, 141–158. [Google Scholar] [CrossRef]
- Sun, Z.; Wang, A.; Liu, J.; Hu, B.; Chen, G. Radiogenic heat production of granites and potential for hot dry rock geothermal resource in Guangdong Province, Southern China. In Proceedings of the World Geothermal Congress, Melbourne, Australia, 19–25 April 2015; pp. 2–6. [Google Scholar]
- Wang, S.; Kuang, J.; Huang, X.; Zhang, H.; Zhang, M.; Qi, S.; Han, Y.; Xiao, Z.; Wang, S.; Tang, L. Upwelling of Mantle Derived Material in Southeast China: Evidence from Noble Gas Isotopes. Acta Geol. Sin. Engl. Ed. 2021. [Google Scholar] [CrossRef]
Figure 1.
Tectonic map in East Asia and distribution of exposed Late Mesozoic granite in South China (modified from Kuang et al. [3]). The green area is the distribution of exposed Late Mesozoic granite, modified from Zhou et al. [4]. The red line is Guangdong Province.

Figure 2.
Tectonic map of Guangdong Province and adjacent area. The distribution of faults is modified from Wang et al. [6]. The yellow lines are the magnetotellurics profiles. The heat flow values and “hot” basin are modified from Jiang et al. [17].
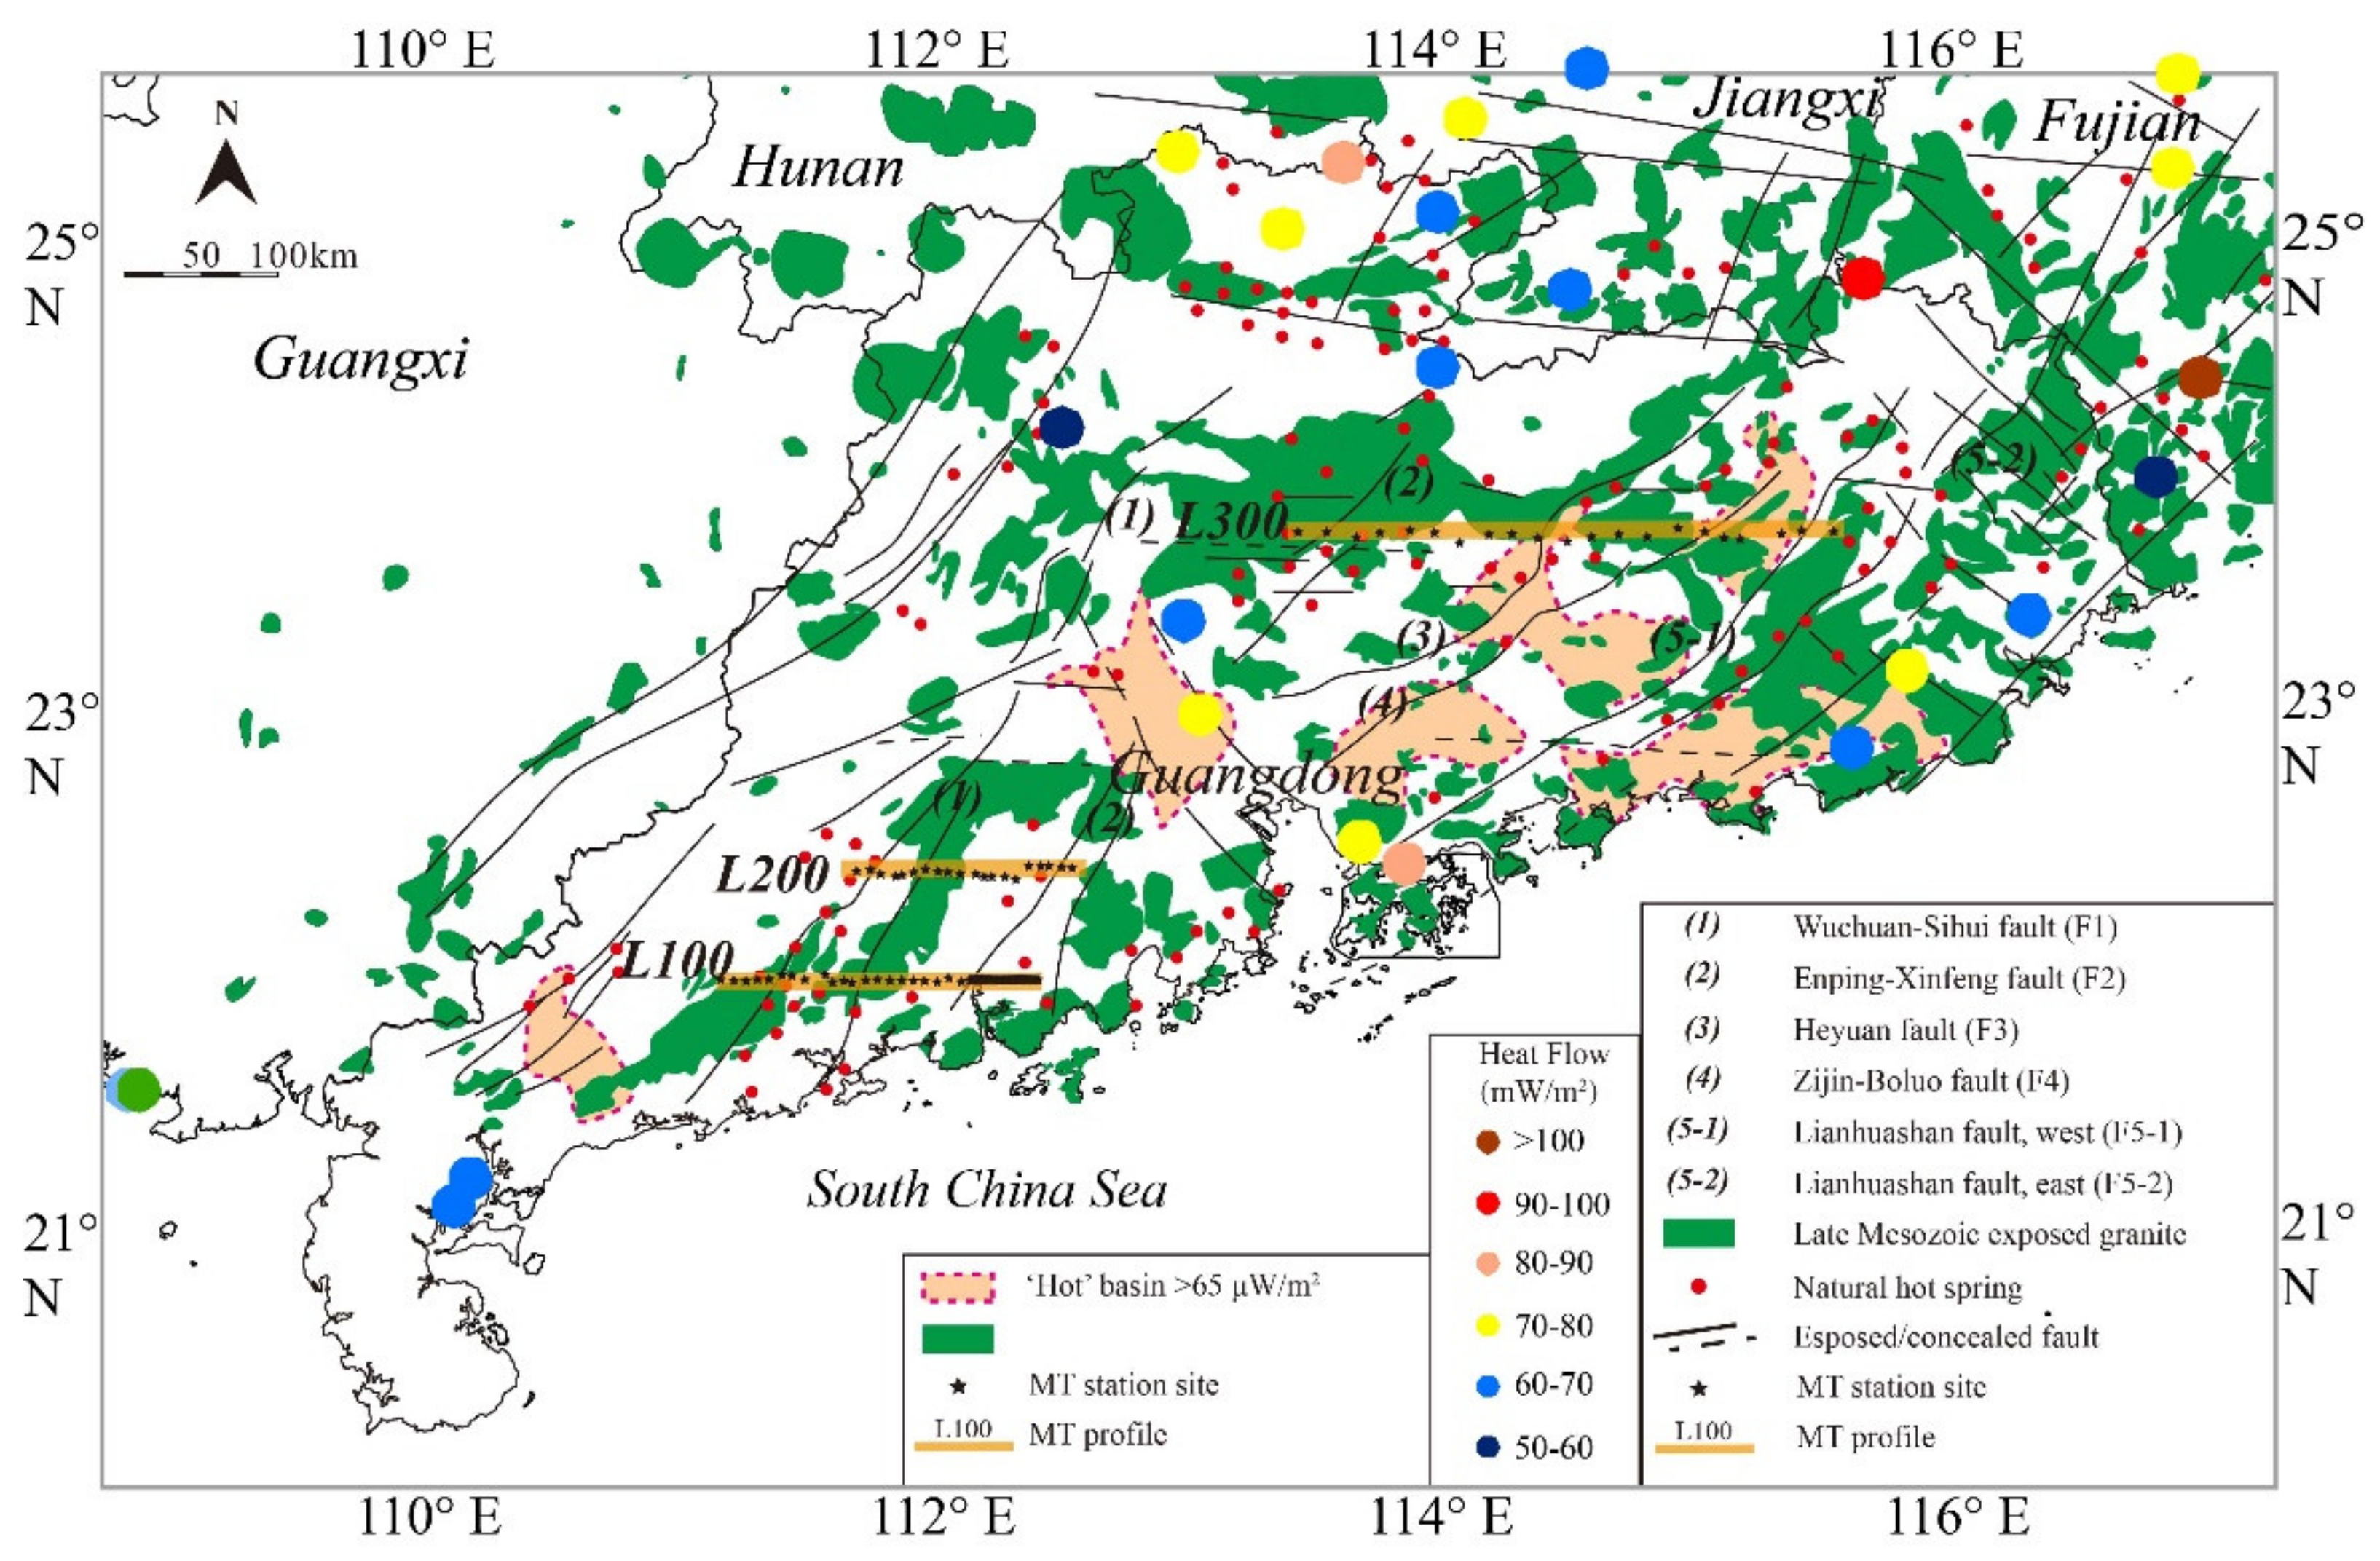
Figure 3.
Multi-frequency rose diagrams of geoelectric strike direction of some stations by using the Goom–Bailey (GB) decomposition.
Figure 3.
Multi-frequency rose diagrams of geoelectric strike direction of some stations by using the Goom–Bailey (GB) decomposition.

Figure 4.
The structural trend of the survey points in the three profiles. The orange lines are major regional deep-seated fault, the yellow line is the MT profile, the pink arrow is the structure trend, and the black star is the MT station.
Figure 4.
The structural trend of the survey points in the three profiles. The orange lines are major regional deep-seated fault, the yellow line is the MT profile, the pink arrow is the structure trend, and the black star is the MT station.
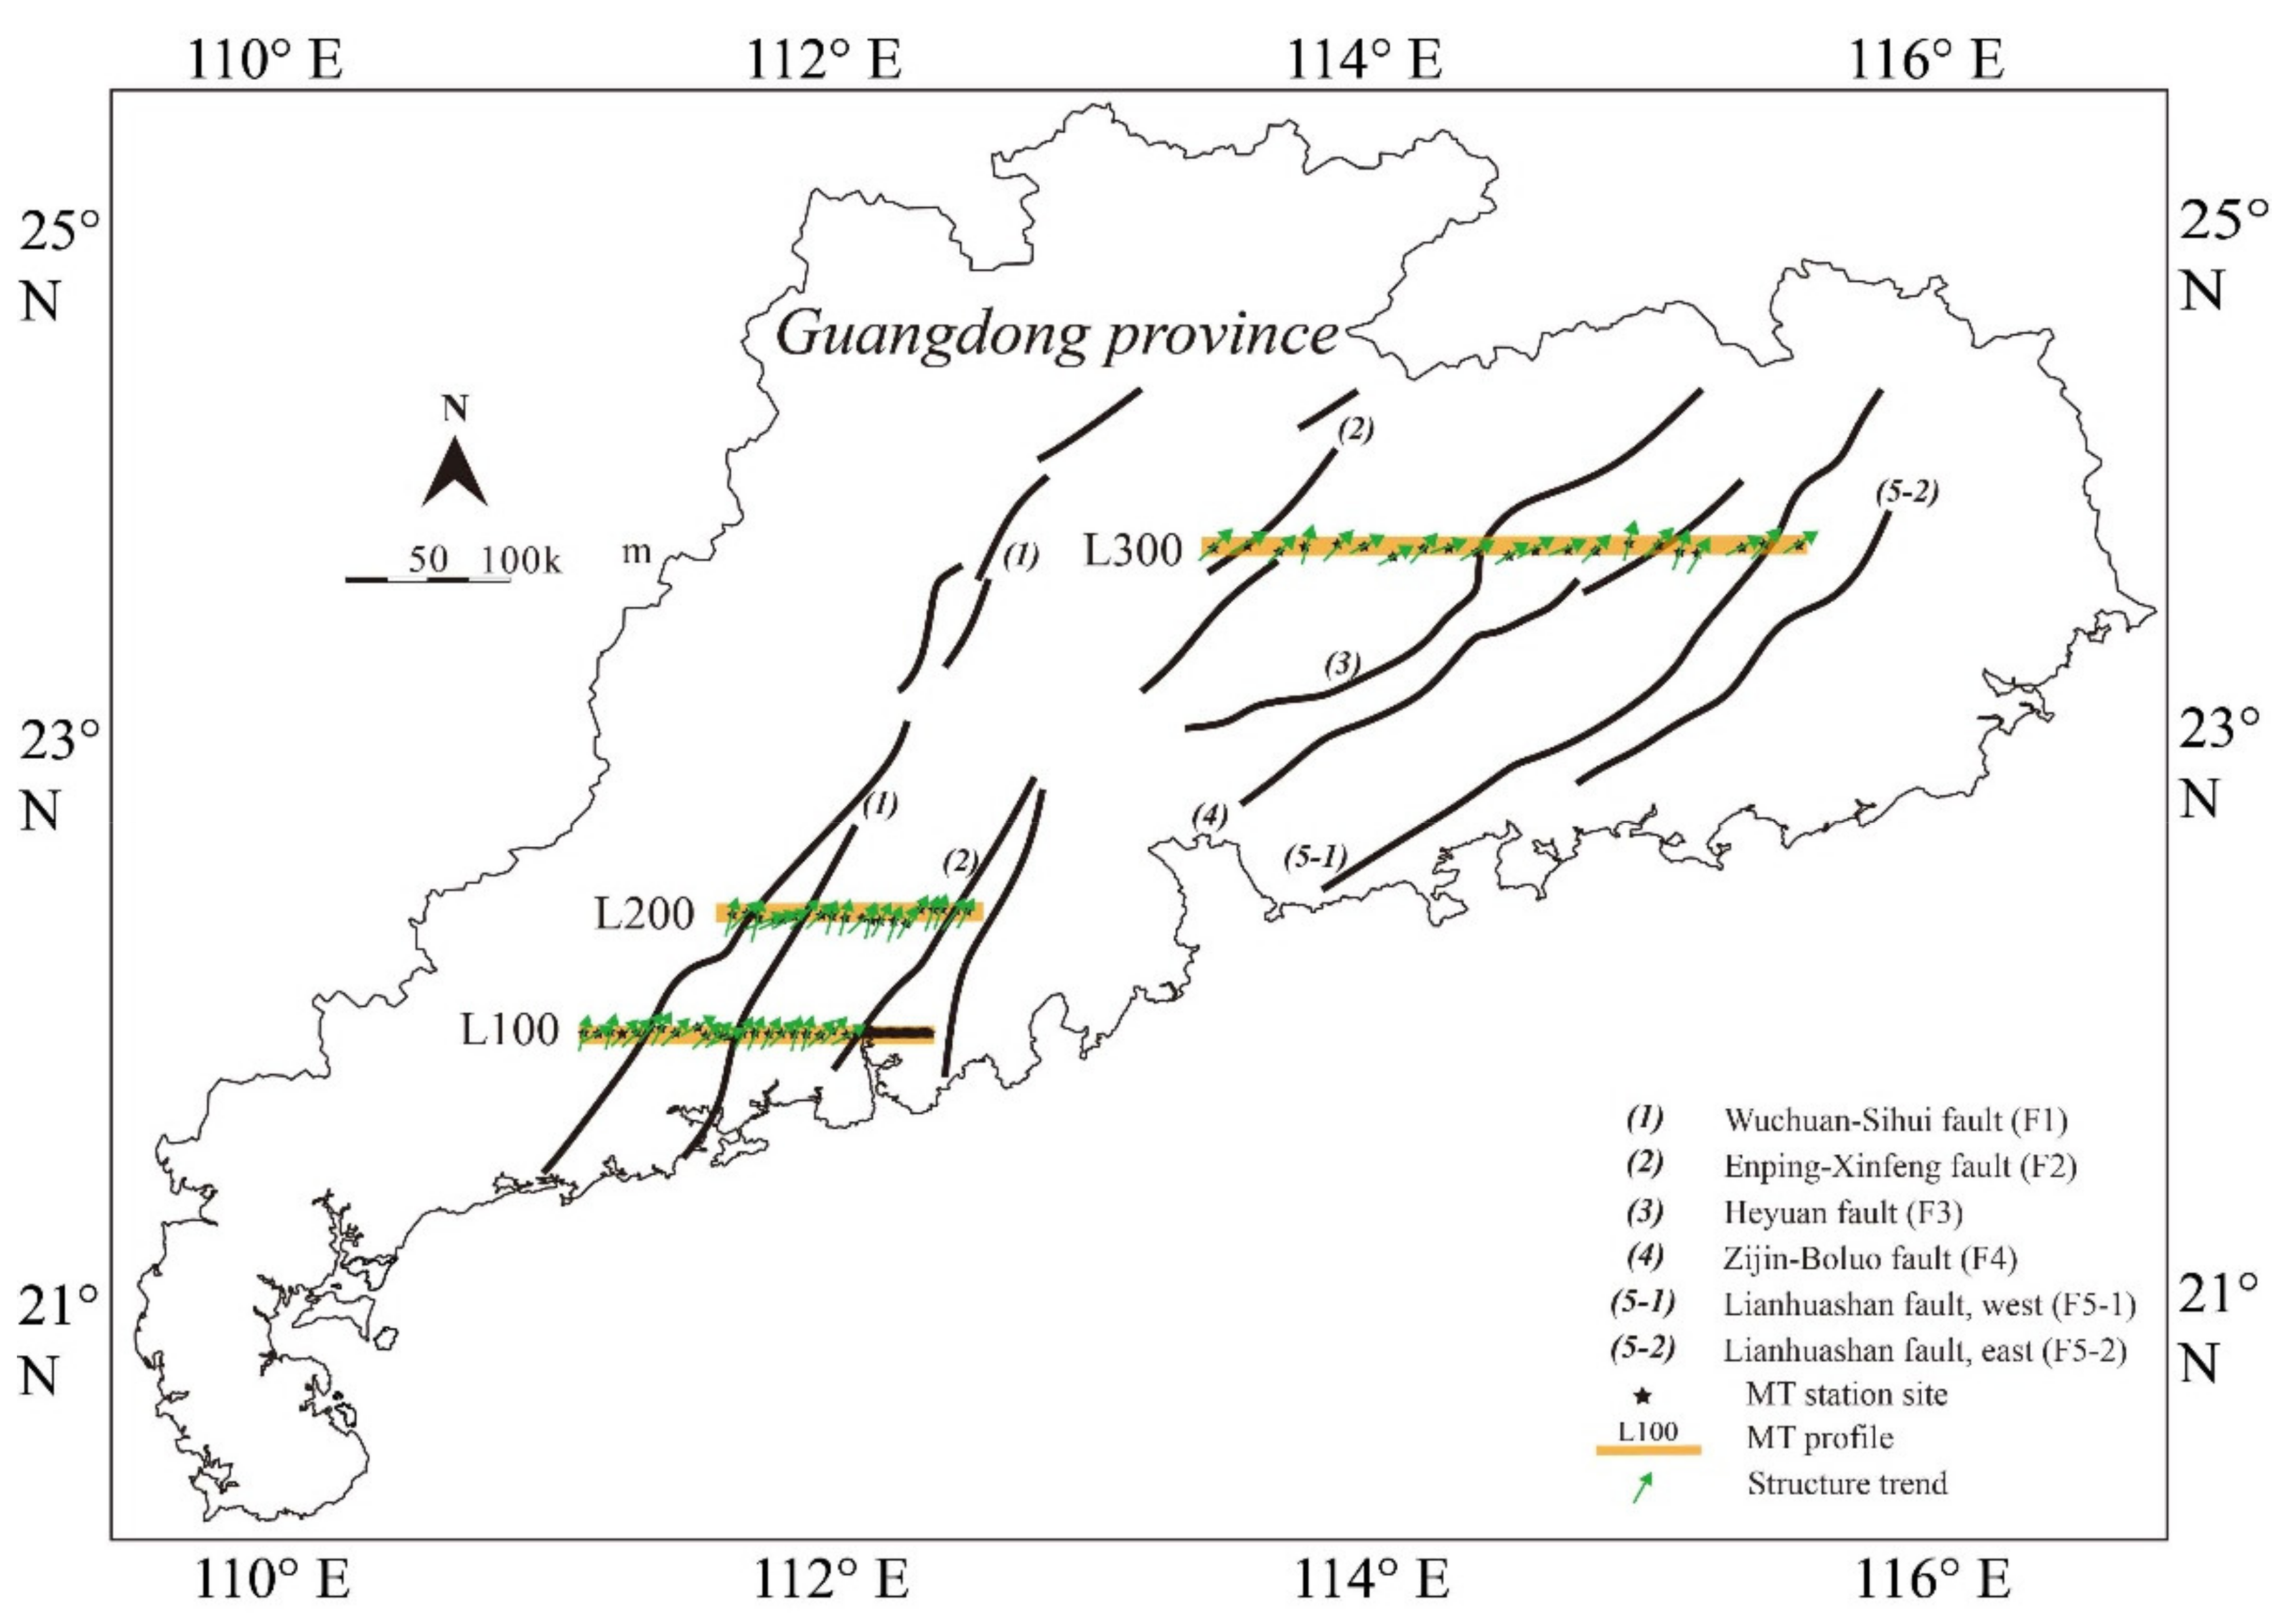
Figure 5.
Compares of NLCG 2D inversion result of three inversion models (TE, TE and TM, and TM) of MT profile L300.
Figure 5.
Compares of NLCG 2D inversion result of three inversion models (TE, TE and TM, and TM) of MT profile L300.
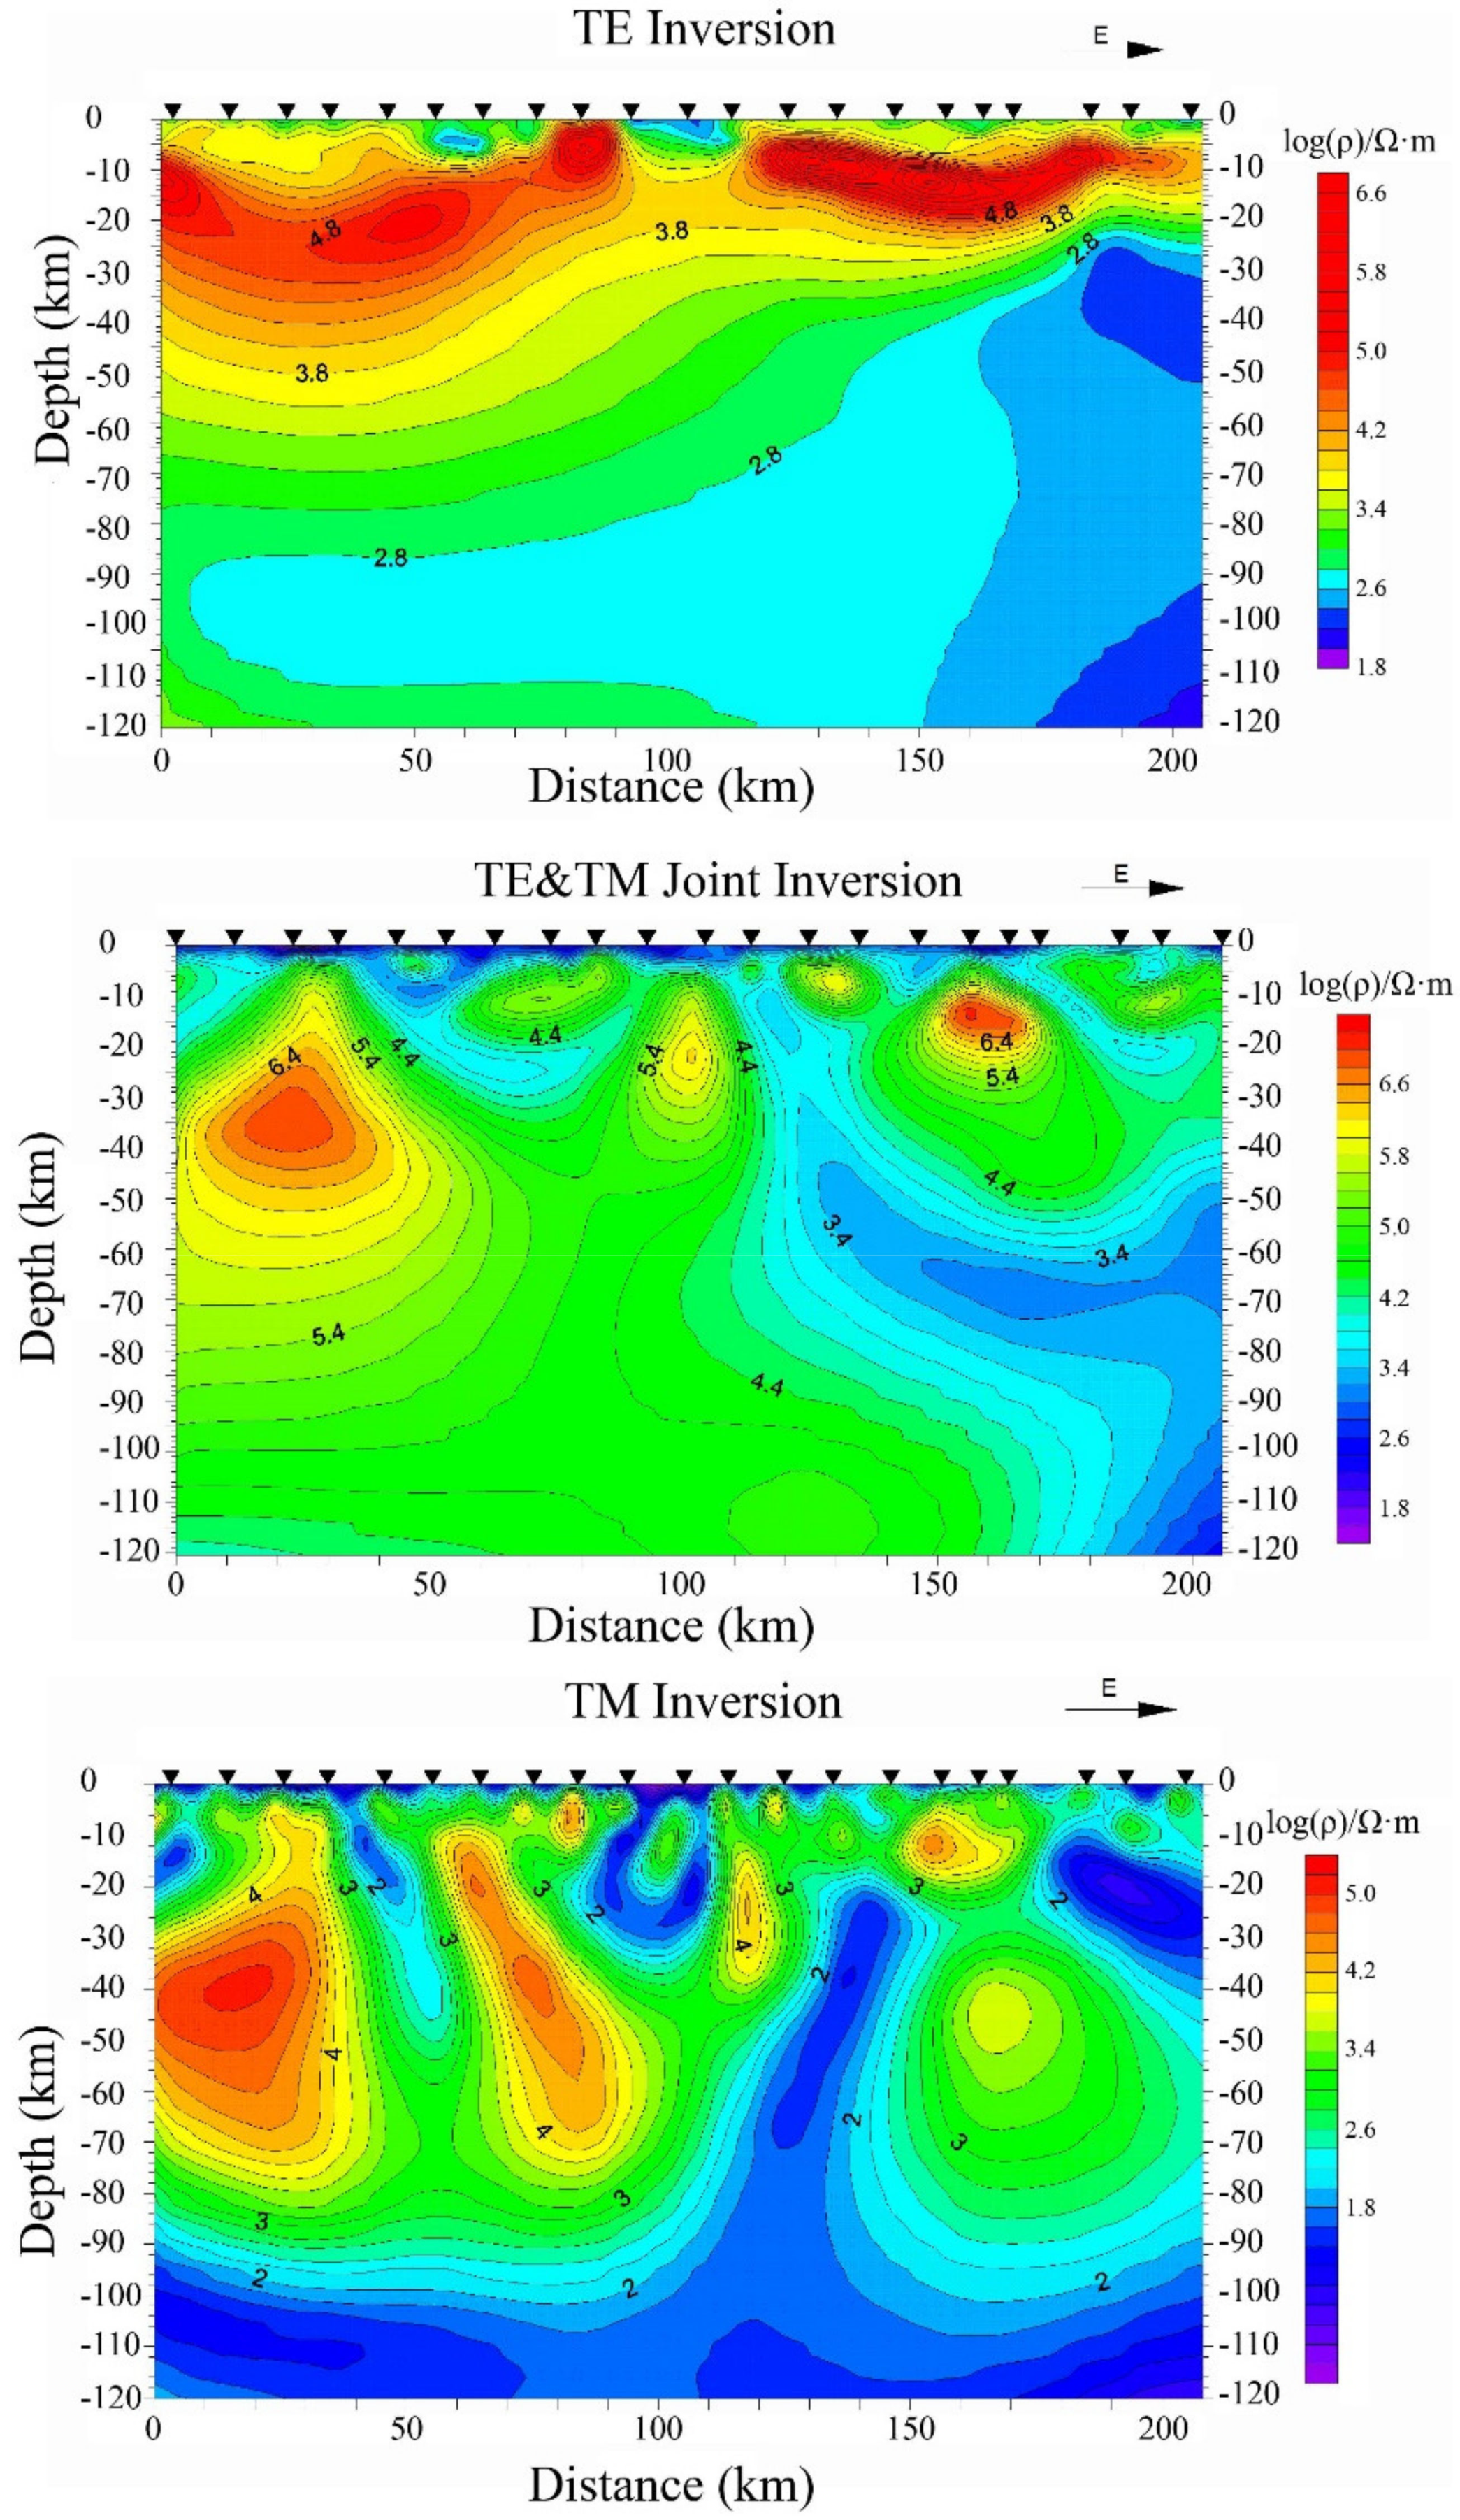
Figure 6.
2D inversion results of NLCG in L300 TM mode under different the regularization parameter (τ) values.
Figure 6.
2D inversion results of NLCG in L300 TM mode under different the regularization parameter (τ) values.

Figure 7.
RMS distribution along these three profiles for the original 2D inversion.

Figure 8.
Preferred inversion model of electrical resistivity for the upper 120 km along the profiles with station locations and position of major tectonic features. F1-1, West part of F1; F1-2, East part of F1; F1, F2, F3, F4, and F5 are identical to that in Figure 2. The RF is the Renzishi Fault. The purple dotted line represents the inferred boundary between strata and Jurassic and Cretaceous granite; the yellow dotted line represents the inferred Moho boundary; the black arrow represents the upwelling direction of mantle material.
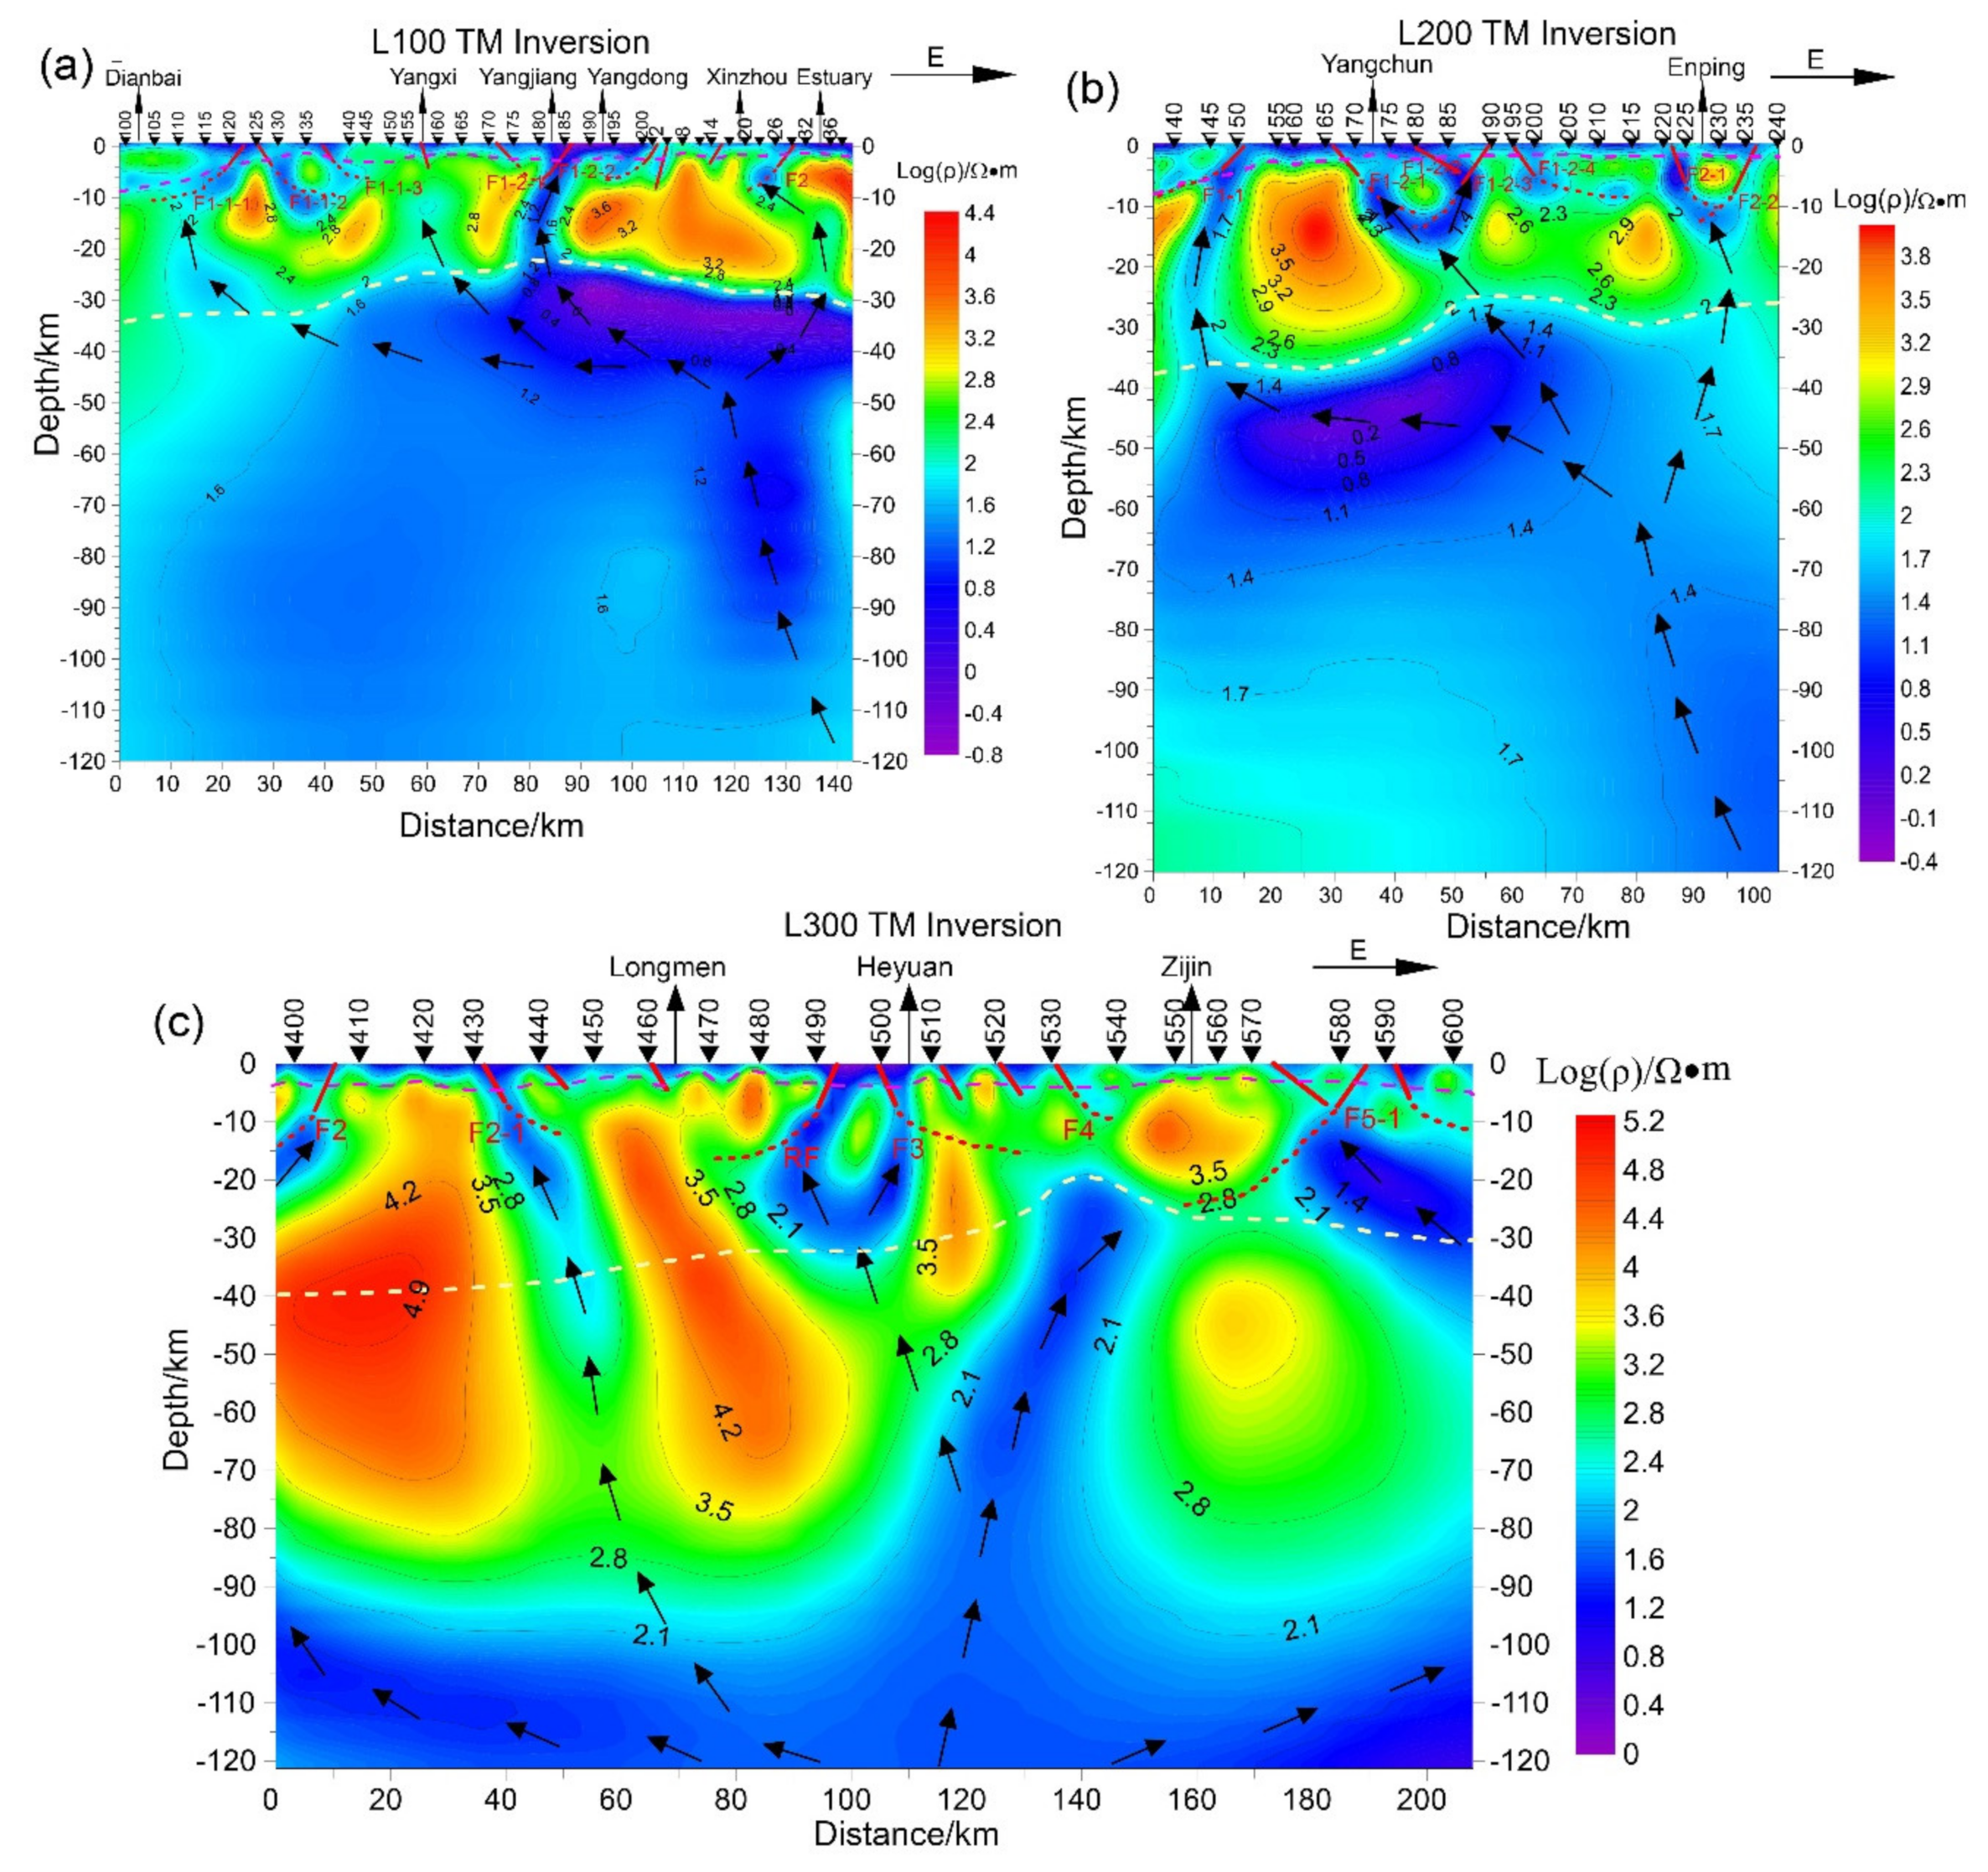
Figure 9.
A model of the crust–mantle structure to decipher geothermal formation in Guangdong Province. The granite layer was modified from Kuang et al. [3].
Figure 9.
A model of the crust–mantle structure to decipher geothermal formation in Guangdong Province. The granite layer was modified from Kuang et al. [3].
Publisher’s Note: MDPI stays neutral with regard to jurisdictional claims in published maps and institutional affiliations. |
© 2021 by the authors. Licensee MDPI, Basel, Switzerland. This article is an open access article distributed under the terms and conditions of the Creative Commons Attribution (CC BY) license (https://creativecommons.org/licenses/by/4.0/).
Share and Cite
MDPI and ACS Style
Kuang, J.; Qi, S.; Hu, X. New Insights into Crust and upper Mantle Structure in Guangdong Province, China and Its Geothermal Implications. Energies 2021, 14, 2236. https://doi.org/10.3390/en14082236
AMA Style
Kuang J, Qi S, Hu X. New Insights into Crust and upper Mantle Structure in Guangdong Province, China and Its Geothermal Implications. Energies. 2021; 14(8):2236. https://doi.org/10.3390/en14082236
Chicago/Turabian StyleKuang, Jian, Shihua Qi, and Xiangyun Hu. 2021. "New Insights into Crust and upper Mantle Structure in Guangdong Province, China and Its Geothermal Implications" Energies 14, no. 8: 2236. https://doi.org/10.3390/en14082236
Note that from the first issue of 2016, this journal uses article numbers instead of page numbers. See further details here.