Article

Novel Effective Yeast Strains and Their Performance in High Gravity and Very High Gravity Ethanol Fermentations from Sweet Sorghum Juice

by
Lakkana Laopaiboon
1,2,
Suntaree Suporn
1,
Preekamol Klanrit
1,3,
Niphaphat Phukoetphim
1,
Chalida Daengbussadee
4 and
Pattana Laopaiboon
1,3,*
1
Department of Biotechnology, Faculty of Technology, Khon Kaen University, Khon Kaen 40002, Thailand
2
Center for Alternative Energy Research and Development, Khon Kaen University, Khon Kaen 40002, Thailand
3
Fermentation Research Center for Value Added Agricultural Products, Khon Kaen University, Khon Kaen 40002, Thailand
4
Graduate School, Khon Kaen University, Khon Kaen 40002, Thailand
*
Author to whom correspondence should be addressed.
Energies 2021, 14(3), 557; https://doi.org/10.3390/en14030557
Submission received: 24 November 2020 / Revised: 11 January 2021 / Accepted: 16 January 2021 / Published: 22 January 2021

Abstract

:
Yeasts were isolated from four potential sources, sweet sorghum juice, sugar cane juice, grapes and rambutan. The 27 yeast isolates were tested for their ethanol tolerance (15% v/v of ethanol) and ethanol fermentation performance in a synthetic ethanol production medium (200 g/L of total sugar). Only five isolates, SCJ04KKU, SCJ07KKU, SCJ09KKU, SCJ14KKU and SSJ01KKU could tolerate 15% ethanol and produce ethanol at levels higher than 55 g/L. The ethanol production efficiency from sweet sorghum juice under high gravity (HG, 200 and 240 g/L of total sugar) and very high gravity (VHG, 280 g/L of total sugar) conditions of the five isolates was tested. Saccharomyces cerevisiae NP01 and S. cerevisiae ATCC4132 were used as reference strains. The results showed that the SSJ01KKU isolate gave the highest ethanol production efficiency under all conditions. Ethanol concentration (PE), yield (YP/S) and productivity (QP) values were 98.89 g/L, 0.50 and 1.18 g/L·h, respectively, with sugar consumption (SC) of 98.96% under the HG condition at 200 g/L of total sugar. Under the HG condition at 240 g/L of total sugar, the PE, YP/S and QP values were 118.12 g/L, 0.51 and 1.41 g/L·h, respectively, with the SC of 95.79%. These values were 82.29 g/L, 0.34 and 0.98 g/L·h, respectively, with the SC of 85.59% under the VHG condition. Addition of urea into the sweet sorghum juice under all conditions significantly shortened the fermentation time, resulting in increased QP values. Based on molecular taxonomic analysis of the five isolates using sequence analysis of the D1/D2 domain and the ITS1 and ITS2 regions, SSJ01KKU is S. cerevisiae, whereas SCJ04KKU, SCJ07KKU, SCJ09KKU and SCJ14KKU are Pichia caribbica.

1. Introduction

Bioethanol is one of the most important biofuels from renewable resources. Using bioethanol as a biofuel has attracted much attention since it has higher environmental and economic benefits in comparison to fossil fuels. Ethanol is mainly produced from sugarcane, sugarcane molasses, sugar beets, cassava, corn and starch by yeast fermentation. Sugarcane, sugarcane molasses and sugar beets have an advantage in that they contain directly fermentable sugars, such as sucrose, glucose and fructose. However, the use of these crops for ethanol production competes with their use as food and feed sources.
Sweet sorghum {Sorghum biocolor (L.) Moench} is a high biomass- and sugar-yielding crop. It is characterized by high sugar content in the juice from its stalks, mainly sucrose, but also fructose and glucose, which can be easily converted to ethanol. Sweet sorghum is the only crop that provides grain and stems that can be used for human food or livestock feed, silage, grazing, biofuels [1]. It is one of the most drought resistant agricultural crops as it has the capability of remaining dormant during the driest periods [2]. Additionally, it is also well adapted to different climates. The plant grows to a height of about 100 to above 400 cm, depending on the variety and growing conditions. It can be either an annual or short perennial crop [3,4]. In light of this, sweet sorghum is a substrate that shows great promise for ethanol production.
Ethanol is fermentatively produced by yeasts and bacteria. Such microorganisms use sugar to ethanol and carbon dioxide via glycolysis pathway under anaerobic condition. Theoretically, 1 g of glucose can be metabolized to form 0.511 g of ethanol and 0.499 g of CO2. Two molecules of ATP are produced in glycolysis that are used to drive yeast cell biosynthesis, including a variety of energy-requiring reactions under anaerobic conditions. Hence, ethanol fermentation is tightly coupled with yeast growth as a growth-associated product.
The ability of yeast to produce ethanol depends on many factors such as the strain used, nutrients and environmental conditions. Moreover, it also depends on the initial sugar concentration in the fermentation medium [5,6,7]. The initial sugar concentrations of normal gravity (NG) fermentations (<180 g/L of sugar) are most often used in industrial processes. To increase ethanol concentration in the same fermenter, high gravity (HG) conditions (180–240 g/L of sugar) and very high gravity (VHG) fermentations (≥250 g/L of initial sugar) are introduced [6,8]. However, substrate inhibition may occur at high sugar concentrations. Furthermore, ethanol at high levels can stress yeast cells, causing fermentation failure. Zhang et al. [9] reported that the growth of Saccharomyces cerevisiae BY4742 was stopped completely by exogenous ethanol concentration over 70 g/L, and the greater impact was occurred from the endogenous ethanol during fermentation. Ethanol targets to interact with the lipid bilayer of the plasma membrane through the hydrophilic side, disturbing the original membrane structure resulting cell lysis [10]. However, with its nutritional needs met and under appropriate environmental conditions, S. cerevisiae can thrive in the presence of high ethanol concentrations [6,7].
The objectives of the research are to isolate, screen and characterize novel potential yeast strains having high ethanol production efficiency under HG and VHG conditions from various sources. Physiology of the yeast strains during ethanol fermentation from sweet sorghum juice under HG and VHG conditions was also studied. Additionally, the efficiencies of ethanol fermentation from sweet sorghum juice under HG and VHG conditions by the isolated yeast strains were investigated.

2. Materials and Methods

2.1. Isolation and Screening of Yeasts for Ethanol Tolerance and Ethanol Fermentation

2.1.1. Yeast Isolation

Yeasts were isolated from four potential sources, sweet sorghum juice (obtained from the Faculty of Agriculture, Khon Kaen University, Khon Kaen, Thailand), sugarcane juice, grapes and rambutan (from local market, Khon Kaen, Thailand). Each sample (5 g) was added into 25 mL of sterile distilled water. Then, they were serially diluted and spread on yeast extract peptone dextrose agar (YEPDA) plates (modified from Bhima et al. [11]). The YEPDA medium consisted of (g/L) yeast extract, 10; peptone, 20; dextrose, 20 and agar, 20. To inhibit bacterial growth, 500 ppm of chloramphenicol was added into the YEPDA medium [12]. After incubation at 30 °C for 48 h, the developed colonies were observed to determine their morphological features. The yeast colonies were off-white in colour, circular in shape, convex elevated with opaque growth and smooth texture. Additionally, yeast cells were spherical and egg-shaped with budding under microscopic examination [11,13]. A single colony of each isolate that was similar to yeast colony was grown on a YEPDA slant and stored at 4 °C for further experiments.

2.1.2. Inoculum Preparation

A loopful of each isolate from the slant was transferred into 50 mL of YEPD broth and incubated at 200 rpm and 30 °C for 18 h. The yeast cells (10% of inoculum size) were then transferred into 250 mL of a sweet sorghum juice (SSJ) medium containing 100 g/L of total sugar [14] and incubated under the same conditions for 15 h before use as an inoculum for ethanol tolerance and ethanol fermentation tests (modified from Deesuth et al. [5]). S. cerevisiae NP01 (accession number KP866701) isolated from Loog-pang (Chinese yeast cake) [6] and S. cerevisiae ATCC4132, obtained from the Thailand Institute of Scientific and Technological Research (TISTR), were used as the reference strains.

2.1.3. Ethanol Tolerance Test

To assess the ethanol tolerance of yeast isolates, each isolate from Section 2.1.1 was inoculated into 50 mL of sterile SSJ medium containing 100 g/L of total sugar and 15% (v/v) ethanol to obtain the initial cell concentrations of ~3.0 × 10⁷ cells/mL. Then, they were incubated at 30 °C under static conditions. Yeast viability was measured after 24 h.

2.1.4. Ethanol Fermentation Test

To obtain the appropriate yeast isolates for ethanol fermentation under various initial sugar concentrations, the yeast isolates were tested for their ethanol production in a synthetic ethanol production (EP) medium. The synthetic EP medium was modified from Melzoch’s medium, which consisted of (g/L) sucrose, 200; yeast extract, 6.0; KH2PO4, 0.5; (NH4)2SO4, 1.0; CaCl2∙2H2O, 1.0 and MgSO4∙7H2O, 0.025 [15]. Each isolate was transferred into 50 mL of a sterile EP medium in an air-locked flask, and the initial cell concentration in the medium was ~3.0 × 10⁷ cells/mL. The fermentation was carried out in batch mode at 30 °C under static conditions. The yeast viability, sugar consumption and resulting ethanol concentrations were determined after 48 h of fermentation.

2.2. Batch Ethanol Fermentation under HG and VHG Conditions

2.2.1. Microorganisms and Inoculum Preparation

The potential yeast isolates on YEPDA slants obtained from Section 2.1.4 were inoculated into 125 mL air-locked flasks containing 50 mL of YEPD medium and incubated on a rotating shaker at 200 rpm and 30 °C for 18 h. Then, the yeast cells (10% of inoculum size) were transferred into 250 mL of a SSJ medium containing 100 g/L of total sugar [16,17] and incubated under the same conditions. After 15 h, the active cells were harvested and used as an inoculum for ethanol production.

2.2.2. Raw Materials

Sweet sorghum juice (cv. KKU 40), extracted from its stalks using a sugarcane juice extractor, was obtained from the Department of Plant Science and Agricultural Resources, Faculty of Agriculture, Khon Kean University, Thailand. The juice containing total soluble solids of 18 °Bx was concentrated to 65 °Bx to prevent bacterial growth and stored at 4 °C until further use.

2.2.3. Batch Ethanol Fermentation

The concentrated juice was diluted with distilled water to obtain initial total sugar concentrations of 200 and 240 g/L for HG conditions and 280 g/L for VHG conditions. These media were transferred into 500-mL air-locked flasks with a final working volume of 350 mL before autoclaving at 110 °C for 28 min and use as ethanol production media [18]. The inoculum was added into the sterile media to obtain initial cell concentrations of ~3.0 × 10⁷ cells/mL. The fermentation was operated in batch mode at 30 °C and 200 rpm [7]. Samples were withdrawn at regular time intervals for analyses. The media were supplemented with 1.54 g/L urea to improve ethanol production efficiency and sugar utilization under the HG and VHG conditions. This corresponds to a nitrogen content equivalent to addition of 6 g/L of yeast extract (from Melzoch’s medium). The batch fermentation under urea addition was carried out as previously described.

2.3. Molecular Identification

2.3.1. Genomic DNA Extraction and PCR Amplification

Genomic DNA (gDNA) was extracted from actively growing cells of yeast isolates in YEPD medium and purified following a protocol from Harju et al. [19] with slight modification. The freezing process in liquid nitrogen for 1 min and heating process in a water bath at 95 °C for 1 min were applied to efficiently break the yeast cells. Then, the standard phenol-chloroform extraction was performed, and the gDNA was precipitated using absolute ethanol. The quality and quantity of the extracted gDNA were determined using agarose gel electrophoresis employing a 1% agarose gel stained with ethidium bromide (modified from Harju et al. [19]). For polymerase chain reaction (PCR), primer pairs NL1 (5′-GCA TAT CAA TAA GCG GAG GAA AAG-3′) and NL4 (5′-GGT CCG TGT TTC AAG ACG G-3′) were used to amplify the D1/D2 domains of the 26S rDNA. The internal transcribed spacer (ITS) regions 1 (ITS1) and 2 (ITS2) were also amplified by PCR using the ITS1 (5′-TCC GTA GGT GAA CCT GCG G-3′) and ITS4 (5′-TCC TCC GCT TAT TGA TAT GC-3′) primer pairs [12]. The PCR amplification was carried out in a thermal cycler using a standard protocol: an initial denaturation at 95 °C for 5 min, 35 cycles of denaturation at 95 °C for 1 min, annealing at 53 °C for 1 min, and extension at 72 °C for 1 min, followed by a final extension at 72 °C for 7 min. The quality and quantity of the PCR products were analyzed by agarose gel electrophoresis. Amplified fragments were purified with a GF-1 Ambiclean kit (Vivantis Technologies Sdn Bhd, Kuala Lumpur, Malaysia). Purified PCR products were sequenced at First BASE Laboratories (First BASE Laboratories Sdn Bhd, Seri Kembangan, Selangor, Malaysia).

2.3.2. Sequence Analyses

The D1/D2 and ITS sequences were compared to the reference data available at the National Center for Biotechnology Information (NCBI) database using Basic Local Alignment Search Tool (BLASTN). Phylogenetic tree was constructed with the bootstrap analysis based on 1000 replicates using the neighbor-joining method with the Molecular Evolutionary Genetics Analysis version 5 (MEGA5) program [20].

2.4. Analytical Methods

The viable cell numbers in the fermented broth were determined by direct counting method using a haemacytometer with methylene blue staining technique under an optical microscope [21]. The fermented broth was centrifuged at 12,000 rpm for 10 min. The supernatant was used for determination of the total residual sugar via a phenol-sulfuric acid method [22]. The total sugar was measured in terms of total carbohydrate in the fermentation broth. Ethanol concentration was analyzed using gas chromatography [18]. The ethanol yield (YP/S), volumetric ethanol productivity (QP) and sugar consumption (SC) were calculated as follows:
Y P / S   ( g / g )   =               Actual   ethanol   produced   ( g / L ) Sugar   utilized   ( g / L )
Q P   ( g / L · h )   =   Actual   ethanol   produced   ( g / L ) Fermentation   time   ( h )
SC   ( % )   =   Sugar   utilized   ( g / L ) Initial   sugar   concentration   ( g / L ) ×   100    
All experiments were carried out in triplicate, and the results are expressed as mean values ± SD.

3. Results and Discussions

3.1. Isolation and Screening of Yeast for Ethanol Tolerance and Ethanol Fermentation

3.1.1. Yeast Isolation

Based on yeast colony morphological characteristics and microscopic observation, 27 yeast isolates were obtained from the four potential sources. SSJ01KKU was isolated from sweet sorghum juice, SCJ01KKU to SCJ14KKU were isolated from sugarcane juice, GR01KKU to GR10KKU were isolated from grapes, and RBT01KKU to RBT02KKU were isolated from rambutan. The morphological features of yeast colonies grown on YEPD agar for 48 h were observed. They were off-white in color, circular in shape, convex elevated with high opacity and smooth textures. The yeast cells were spherical and egg shaped with budding under microscopic observation. The sizes of isolated yeasts in this study were in the range of 2.50 to 7.50 µm.

3.1.2. Ethanol Tolerance Test

The ethanol tolerance of the 27 isolates was investigated in the presence of 15% (v/v) ethanol at 30 °C for 24 h. The two isolates from rambutan that could not be tested in this study because of flocculation and clumping of cells. This phenomenon was an obstacle for determination of cell concentration. It was found that there were seven isolates, i.e., SCJ02KKU, SCJ06KKU, SCJ07KKU, SCJ09KKU, SCJ14KKU (Figure 1A), GR01KKU and SSJ01KKU (Figure 1B) could survive 24 h of incubation. Interestingly, 15% ethanol had no effect on SCJ07KKU, SCJ09KKU and SSJ01KKU cells. Viable cell counts of these three isolates remained constant over 24 h.

3.1.3. Ethanol Fermentation Test

When the ethanol fermentation capability of the remaining 25 isolates was tested, it was found that only five isolates, SCJ04KKU, SCJ07KKU, SCJ09KKU, SCJ14KKU and SSJ01KKU could produce ethanol in concentrations higher than 55 g/L with sugar consumption of 58–69%. However, S. cerevisiae NP01 and ATCC4132 (reference strains) produced 56–61 g/L of ethanol with sugar consumption of 56–61% (Table 1). High ethanol yields (YP/S, 0.46–0.50 g/g) were obtained from these strains, except for SCJ09KKU (YP/S, 0.42), indicating that by-products were produced at low levels during the fermentation [8]. Additionally, the results showed that ethanol productivity of the five isolates (QP, 1.16–1.33 g/L.h) was also higher than others. Interestingly, it was observed that SCJ04KKU could not tolerate 15% ethanol (Figure 1A), but it could produce 58 g/L of ethanol.
Even though SCJ01KKU, SCJ06KKU, GR01KKU could survive in 15% ethanol, they produced only ~26–43 g/L of ethanol. Therefore, only five isolates, SCJ04KKU, SCJ07KKU, SCJ09KKU, SCJ14KKU and SSJ01KKU, were selected as potential strains for ethanol fermentation from the SSJ medium in subsequent experiments.

3.2. Batch Ethanol Fermentation under HG and VHG Conditions

3.2.1. Ethanol Fermentation from SSJ Medium without Nutrient Addition

Five isolates, SCJ04KKU, SCJ07KKU, SCJ09KKU, SCJ14KKU and SSJ01KKU, were investigated for their ethanol production efficiency and sugar utilization from the SSJ medium with no nutrient addition under two HG conditions (200 and 240 g/L of total sugar) and a VHG condition (280 g/L of total sugar). The time profiles of cell viability, total sugar and ethanol concentrations during batch fermentation under an initial sugar level of 200 g/L for the five isolates are shown in Figure 2A,B. The cell numbers of all isolates increased into the range of 1.12 × 10⁸ to 2.01 × 10⁸ cells/mL in 24 h and remained constant throughout the experiments (Figure 2A). The highest sugar consumption and ethanol production rates were observed for SSJ01KKU (Figure 2B, Table 2). SCJ09KKU showed the lowest sugar consumption and ethanol production, followed by SCJ07KKU (Table 2). Additionally, lower QP values (0.66–0.93 g/L·h) were obtained for these two isolates. These values of the two isolates were significantly lower than those of other isolates and the reference strains, indicating that SCJ07KKU and SCJ09KKU were not suitable for ethanol fermentation under HG conditions. Therefore, they were not used in subsequent experiments.
The sugar consumption and ethanol production of SCJ14KKU and SSJ01KKU were similar to those of ATCC4132 and were higher than those of NP01 at an initial sugar concentration of 200 g/L (Table 2). Among the remaining isolates, SCJ04KKU gave a lower PE (~89 g/L) compared to those of SCJ14KKU and SSJ01KKU (~99 g/L), but SCJ04KKU also had a high ethanol yield (0.50 g/g) with ~91% sugar consumption. Additionally, high QP (>1.0 g/L·h) was achieved by these isolates. Hence, SCJ04KKU, SCJ14KKU and SSJ01KKU were further examined for their ethanol production capabilities under higher initial sugar concentrations.
Under the HG condition at 200 g/L of initial sugar (Table 2), all isolates tested except SCJ09KKU had relatively high ethanol yields (0.50–0.51 g/g), implying the production of few by-products and that the yeast cells were not stressed. This was supported by Bai et al. [8], who proposed that yeast cells suffered from various stresses such as those from nutrient deficiency, temperature, contamination and ethanol. These stresses have adverse effects on yeast growth and ethanol production, leading to lower yeast viability and ethanol yield. In the present study, temperature and pH during the fermentation should not have a negative effect on the yeast growth and ethanol fermentation because they were in the optimum ranges for S. cerevisiae [9,23,24]. Additionally, our results revealed that the sugar utilization of SCJ14KKU and SSJ01KKU (96–99%) was almost complete, higher than the reference strains (93–94%) (Table 2). These results suggested that SCJ14KKU and SSJ01KKU were suitable strains for ethanol production from SSJ medium under the HG condition at 200 g/L of initial sugar.
The time profiles of cell viability, total sugar and ethanol concentrations during batch fermentation under an initial sugar concentration, 240 g/L, of SCJ04KKU, SCJ14KKU, SSJ01KKU and the reference strains are shown in Figure 2C,D. The cell numbers of all strains increased to 1.79 × 10⁸ to 2.02 × 10⁸ cells/mL in 24 h and remained constant until the end of the fermentation (Figure 2C). SCJ14KKU showed the lowest sugar consumption and ethanol production, followed by SCJ04KKU. However, the values of SSJ01KKU were comparable to those of the two reference strains (Figure 2D and Table 2). Surprisingly, the PE of SCJ04KKU produced under the initial sugar of 200 g/L (~89 g/L) was lower than that of SCJ14KKU (~99 g/L). Under an initial sugar concentration of 240 g/L, the PE produced by SCJ04KKU (~104 g/L) was higher than that of SCJ14KKU (~87 g/L). This might have been due to the capability of SSJ04KKU for higher sugar utilization and concurrently higher ethanol production. However, the PE values produced by SCJ04KKU were ~11–14% lower than those of SSJ01KKU and the reference strains. Thus, both SSJ01KKU and SCJ04KKU were chosen for the subsequent VHG experiments.
Under an initial sugar concentration of 240 g/L, SSJ01KKU gave the highest ethanol production efficiency among all of the isolates, including the reference strains. The cell viability of SSJ01KKU was relatively constant after 24 h, indicating that it could tolerate high PE conditions, up to ~118 g/L (Figure 2C,D and Table 2). High ethanol yields of SCJ04KKU and SSJ01KKU and the reference strains (0.50–0.51 g/g) were observed, suggesting that few by-products were produced under the HG condition [8]. The sugar consumption of the reference strains was about the same under HG conditions (200–240 g/L of initial sugar). However, the sugar consumption of the isolates tested (SSJ04KKU, SCJ14KKU and SSJ01KKU) slightly decreased under an initial sugar concentration of 240 g/L, suggesting susceptibility to osmotic pressure, especially for SCJ04KKU and SCJ14KKU. However, the sugar consumption of SSJ01KKU, NP01 and ATCC4132 under an initial sugar concentration of 240 g/L was similar and almost complete with 95–96% (Table 2), suggesting that these three isolates were suitable for ethanol production from the SSJ under the HG condition.
Under the VHG condition, the cell numbers of all strains increased over 24 h (Figure 2E). The cell concentrations ranged from 1.84 × 10⁸ to 2.02 × 10⁸ cells/mL, and they remained constant throughout the experiments. At the end of fermentation, the sugar consumption of SSJ01KKU and NP01 was similar, approximately 85–86% (Figure 2F and Table 2). Among the four strains, including the reference strains, the PE and QP values of the SSJ01KKU were the highest, indicating that it was the most suitable strain for ethanol production from the SSJ medium under VHG conditions.
The results clearly show that when the initial sugar concentration was increased in the fermentation broth (from HG to VHG), the percentage of sugar consumption of almost all strains decreased. This might have been due to osmotic pressure. Ozmihci and Kari [25] reported that osmotic pressure increased with sugar concentration, resulting in a reduction of sugar utilization. However, SSJ01KKU gave the highest ethanol production efficiency, PE of 82.29 g/L, QP of 0.98 g/L·h and YP/S of 0.34 g/g under VHG conditions. Low ethanol yield was observed in all strains under the VHG condition, suggesting that the utilized carbon was converted to other products in pyruvate metabolism such as organic acids (e.g., acetic, succinic and pyruvic acids) and glycerol. Nevertheless, these possible by-products were not quantified in the current study. Low ethanol yields under the VHG conditions might have been due to environmental stresses on the yeast cells [8]. However, many researchers reported that higher sugar consumption could be achieved if essential nutrients were provided in the fermentation medium [5,7,26]. Chan-u-tit et al. [14] reported that nutrient supplementation (yeast extract, and dried spent yeast as well as glycine as an osmoprotectant) promoted ethanol production from SSJ (containing 280 g/L of total sugar) in terms of concentration (~32%), productivity (~54%) and sugar utilization (~41%). Hence, in the subsequent experiments, addition of urea as a low-cost nitrogen supplement into the fermentation broth was further investigated to improve the sugar consumption and ethanol production from the SSJ medium under HG and VHG conditions.

3.2.2. Ethanol Fermentation from SSJ Medium with Urea Addition

The time profiles of cell viability, total sugar and ethanol level during the HG batch fermentation from the SSJ medium containing 200 g/L of total sugar and 1.54 g/L of urea are shown in Figure 3A,B. The cell concentrations of SCJ04KKU and SCJ14KKU increased into the range of 2.19 × 10⁸ to 3.13 × 10⁸ cells/mL in 24 h, and remained constant until the end of experiments. However, the cell concentrations of SSJ01KKU, NP01 and ATCC4132 decreased dramatically after 60 h of fermentation. Bai el al. [8] reported that yeast cells suffer from various stresses during ethanol fermentation. Some stresses are from the yeast cell metabolism such as ethanol accumulation, leading to reduced yeast viability. Higher sugar consumption rates were observed with urea addition compared to those with no urea addition, with at least 94% sugar consumption (Figure 2B, Figure 3B and Table 3). The PE values of SSJ01KKU, NP01 and ATCC4132 obviously increased over 36 h and remained constant after 48 h, while the ethanol production rate of SCJ04KKU and SCJ14KKU was lower in the first 48 h. However, at 60 h, the ethanol levels produced by SCJ04KKU were similar to those of SSJ01KKU and the two reference strains. Additionally, the results showed that the fermentation times of all strains with urea addition were about 24–36 h shorter than those with no urea addition (Table 2 and Table 3), suggesting that urea as a nitrogen source boosted the rate of ethanol production or ethanol productivity. Similar results were observed by Yue et al. [27], who demonstrated that a dramatic reduction of the time for the fermentation cycle was obtained with supplemental urea in concentrated sweet sorghum juice at an initial sugar concentration of 300 g/L by S. cerevisiae 3013, which decreased the fermentation time from 60 h to 48 h. Under all conditions tested in the current experiments, YP/S values of 0.50–0.51 g/g were observed in all strains tested, demonstrating that urea as a nitrogen source did not have any effect on the metabolic pathway of ethanol fermentation.
Figure 3C,D show the time profiles of cell viability, total sugar and ethanol concentration during HG fermentation from the SSJ medium containing 240 g/L total sugar and 1.54 g/L of urea. The changes of cell concentration in all strains were similar during 80 h of fermentation, ranging from 1.48 × 10⁸ to 2.21 × 10⁸ cells/mL. After 80 h, the viable cell count of SCJ04KKU was relatively constant, but others decreased to 2.97 × 10⁷ to 5.47 × 10⁷ cells/mL after 84 h (Figure 3C). This was also true for SCJ04KKU which could tolerate high ethanol concentrations, up to 109 g/L, under the HG condition in the presence of sufficient nitrogen supplementation. However, the PE of SCJ04KKU was about 1–6 g/L lower than those of SSJ01KKU and the reference strains (Table 3). These results also showed that under both HG conditions (200 and 240 g/L of initial sugar) shorter fermentation time was occurred with urea addition (Table 2 and Table 3), suggesting that supplemental nitrogen promoted ethanol productivity. Again, urea supplementation did not disturb the ethanol fermentation pathway as similar YP/S values (0.50–0.51 g/g) were observed for all isolates tested except SCJ14KKU. A significantly lower sugar consumption (72%) and ethanol production (79 g/L) were observed for SSJ14KKU, indicating that this strain could not tolerate high initial sugar concentrations of 240 g/L or it was under osmotic stress. Additionally, a lower YP/S (0.46 g/g) value for the SSJ14KKU strain was obtained, implying that the metabolic pathway of this strain was changed due to osmotic pressure under HG conditions at 240 g/L of sugar. Therefore, SSJ14KKU was not further studied under VHG conditions.
Under the VHG condition (280 g/L total sugar) with urea addition (1.54 g/L), the cell numbers of all strains increased into the range of 1.60 × 10⁸ to 2.11 × 10⁸ cells/mL in 24 h (Figure 3E) as found under the HG conditions with and without urea addition (Figure 2 and Figure 3). After 24 h, the cells counts remained constant throughout all experiments. A higher sugar consumption rate was observed for SSJ01KKU and the reference strains, corresponding to higher ethanol production rates (Figure 3F) compared to those with no urea addition (Figure 2F). The results suggested that high productivity of SSJ01KKU and the reference strains on the SSJ medium under the VHG condition was achieved. Among the four strains, the PE values of SSJ01KKU, NP01 and ATCC4132 (~117 to 119 g/L) were significantly higher (approximately 14–16%) than that of SCJ04KKU (~103 g/L). Additionally, under the VHG condition supplemented with urea, higher ethanol production efficiencies were clearly gained compared to those with no supplemental urea (Table 3). These results again indicated that urea was a suitable nitrogen source to promote ethanol production from the SSJ medium.
To improve ethanol production efficiency and sugar consumption of SSJ01KKU, NP01 and ATCC4132 strains, more urea, 2.3 g/L (corresponding to the nitrogen content provided by 9 g/L yeast extract) was added into the VHG medium (Table 3). The results showed that the ethanol production and sugar utilization under both urea concentrations (1.54 and 2.3 g/L of urea) were similar. Therefore, 1.54 g/L urea (nitrogen content equivalent to that supplied by 6 g/L of yeast extract) was sufficient for the yeasts to produce ethanol under the HG and VHG conditions.

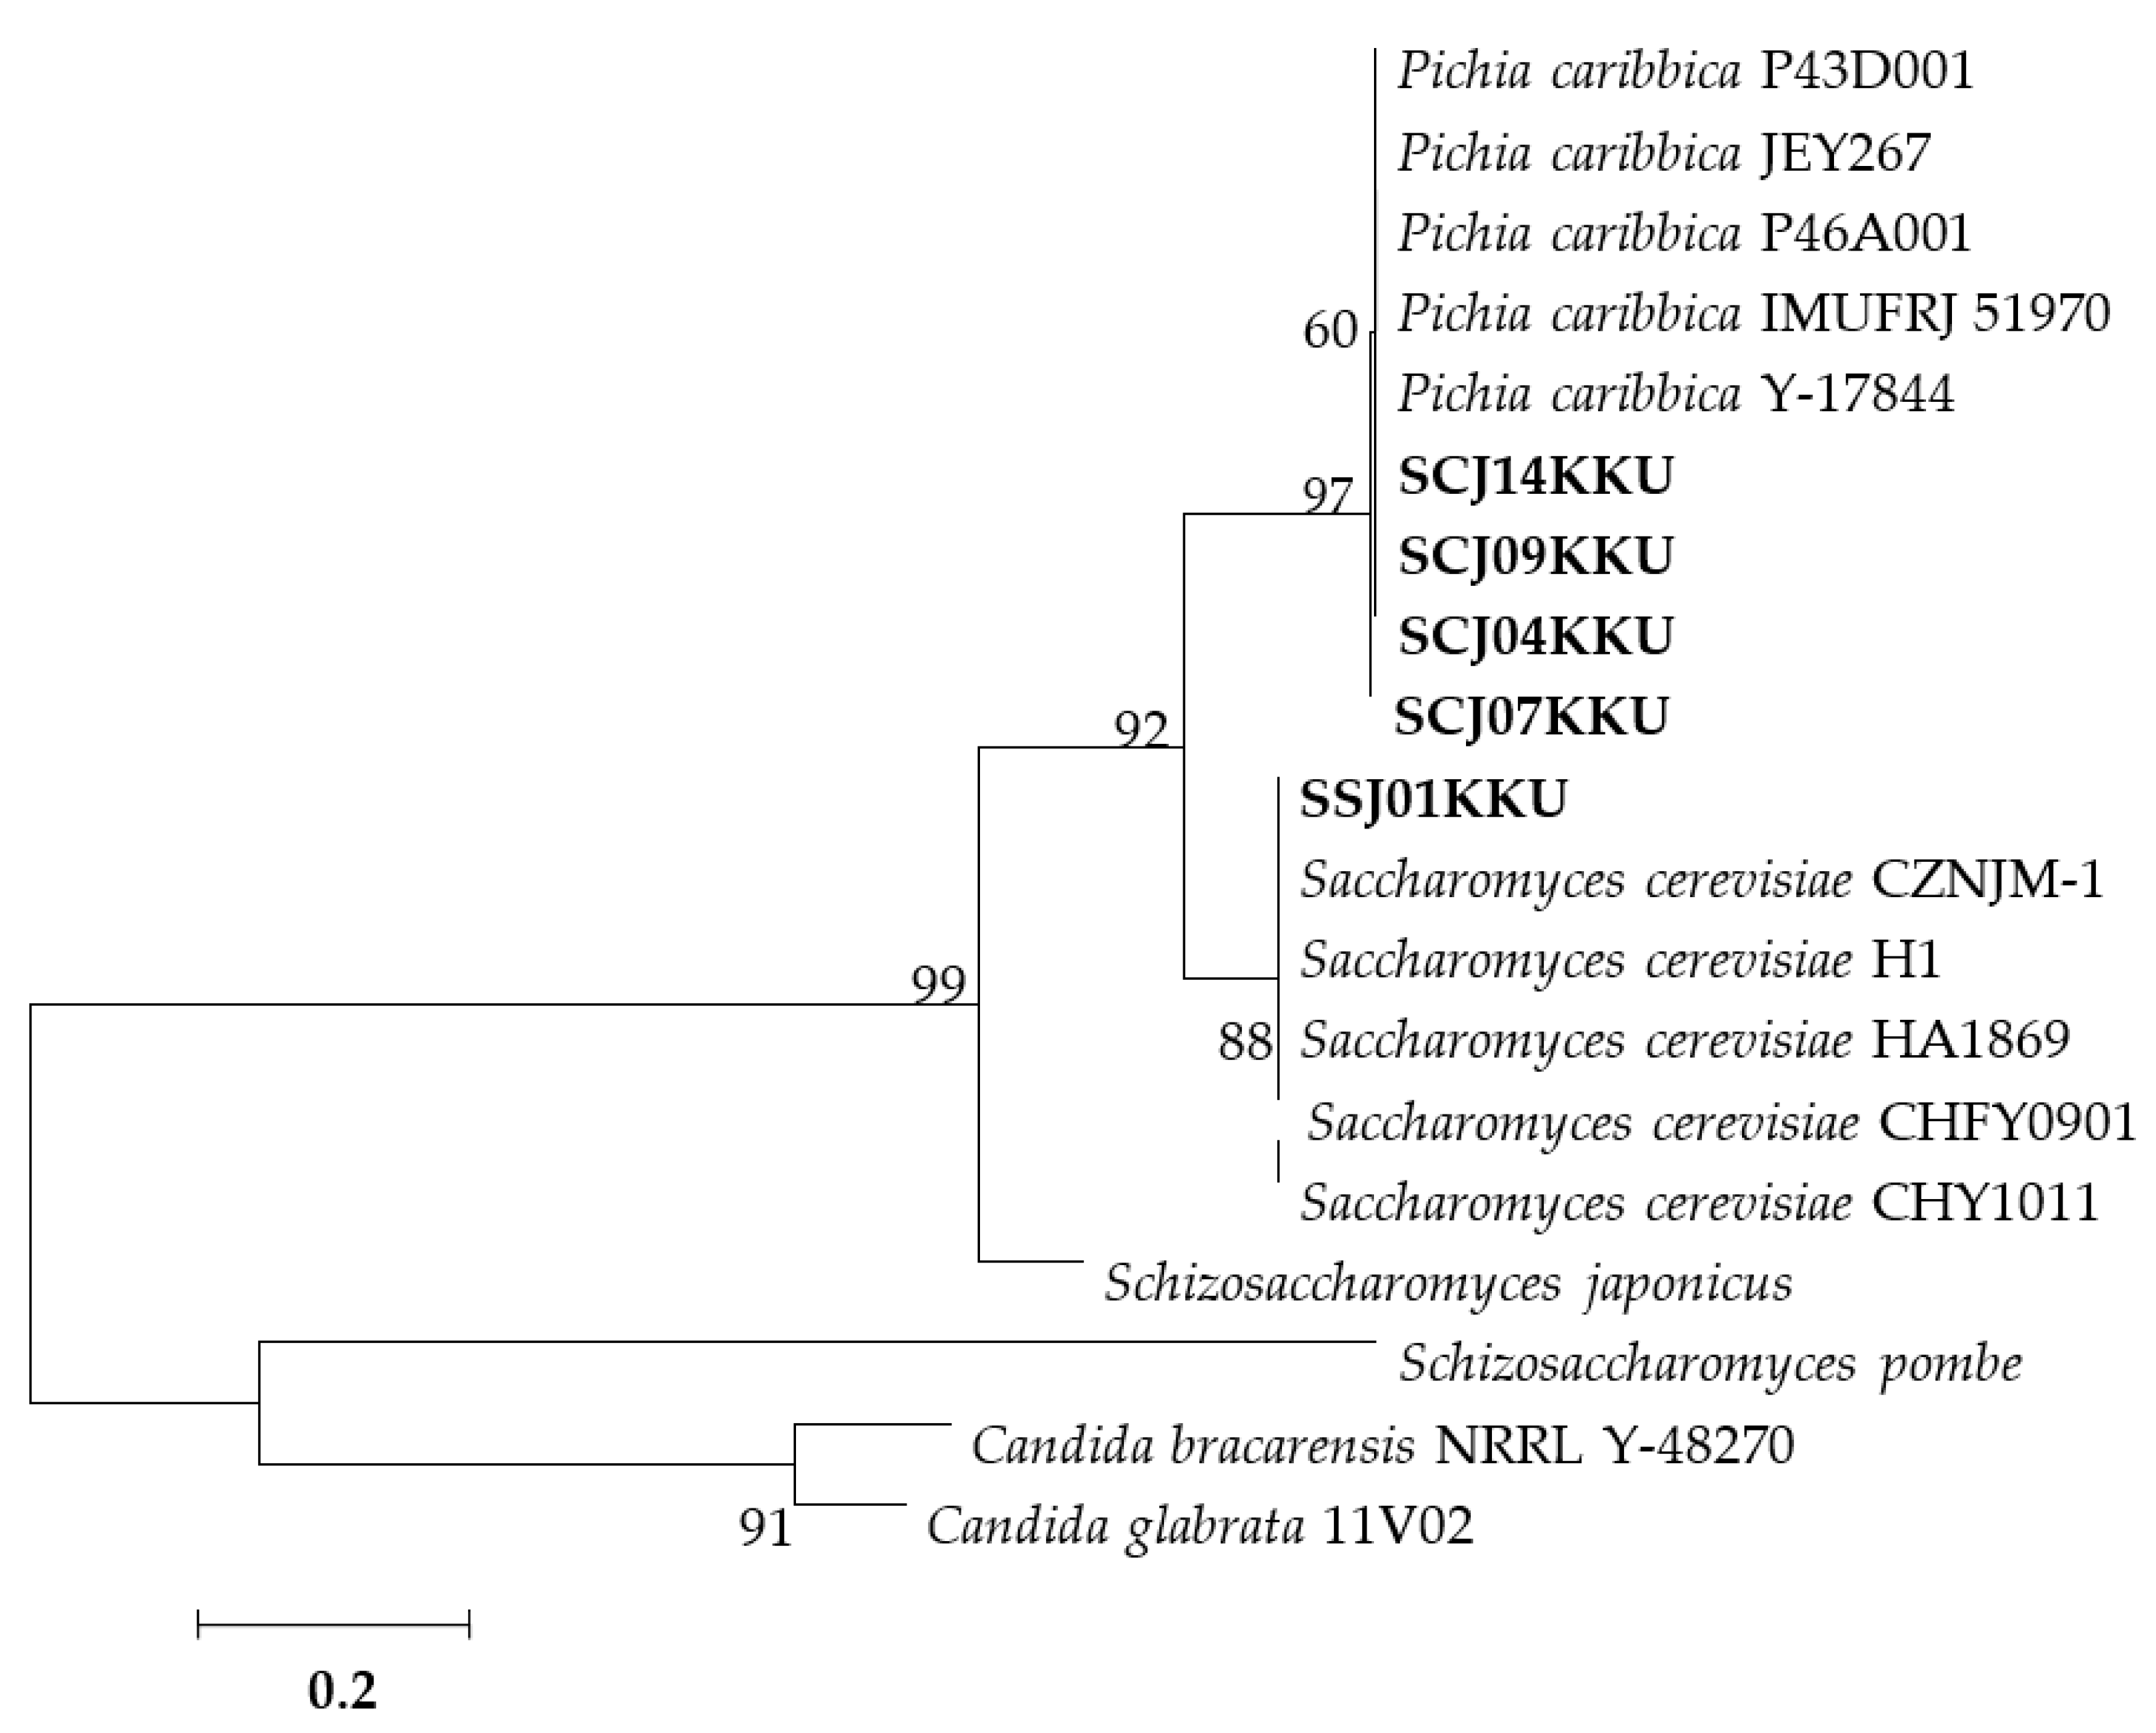
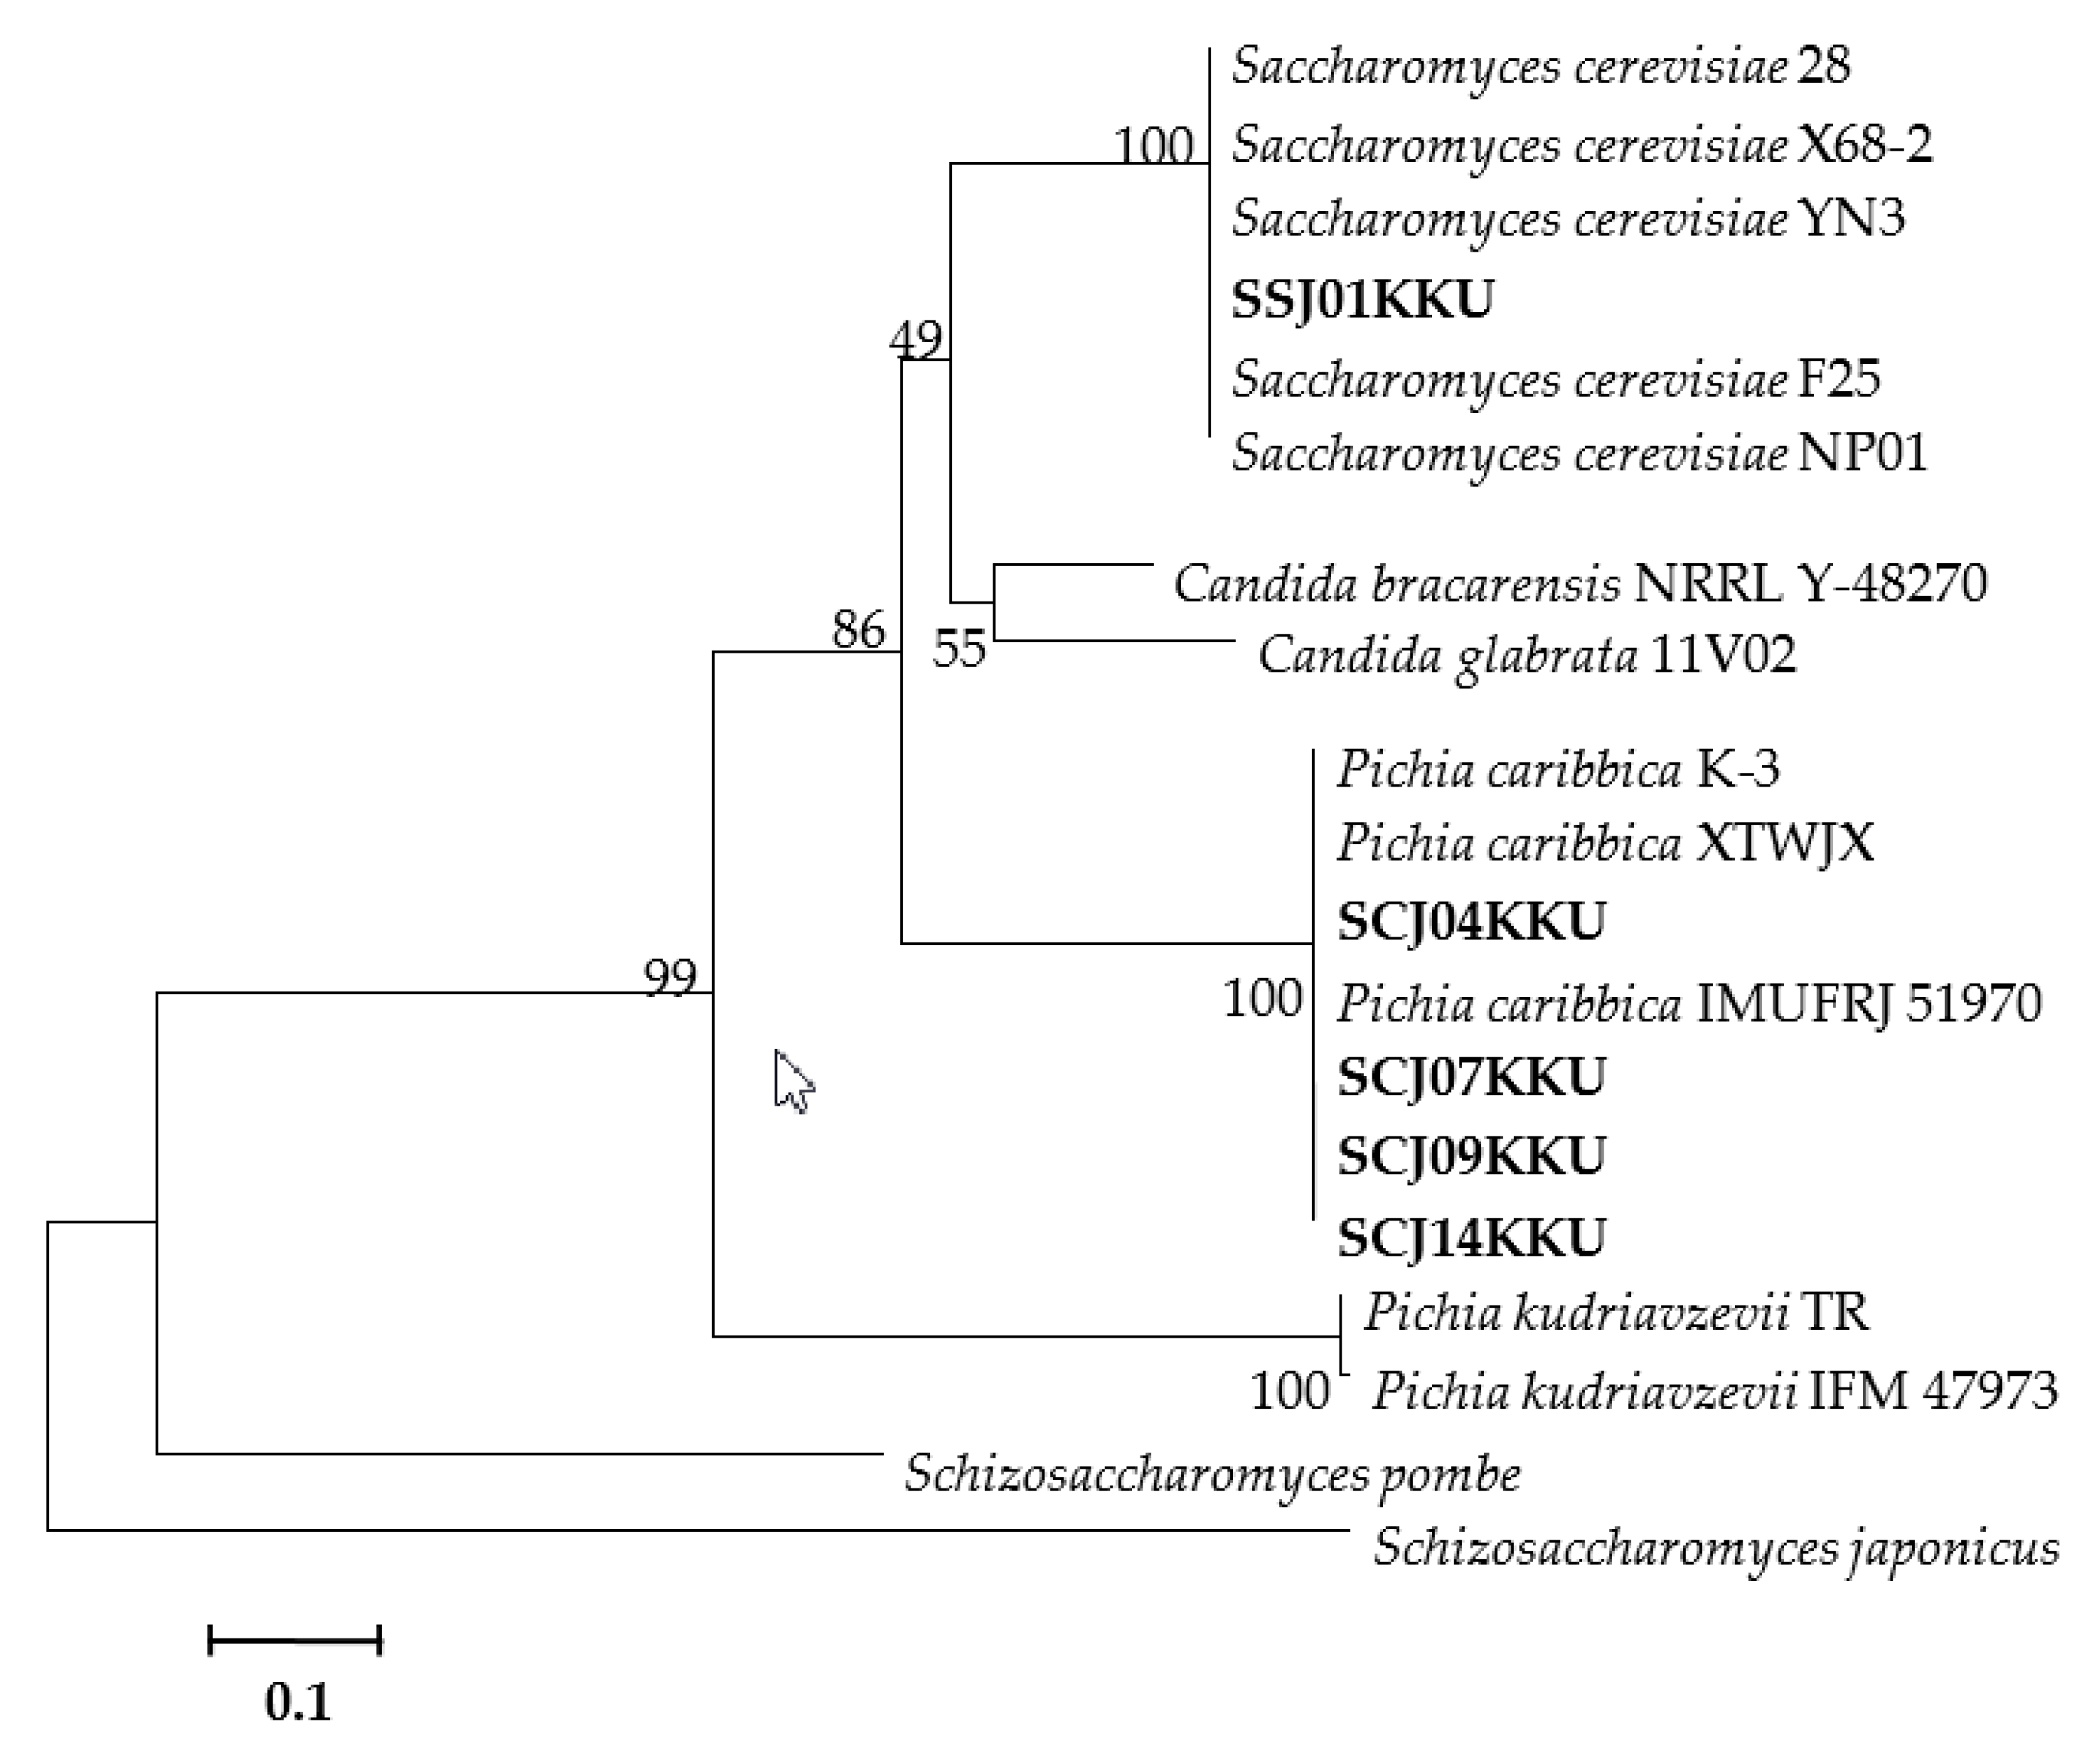
3.3. Molecular Identification of the Selected Yeasts

After primary isolation of each isolate using morphological characterization, their molecular taxonomy was investigated using nucleotide sequence determination of the D1/D2 domain and the ITS1 and ITS2 regions [28]. Kurtzman and Robnett [28,29] characterized ascomycetous yeast nucleotide divergence in the D1/D2 variable region of the 26S rDNA. The degree of divergence was sufficient to resolve nearly all ascomycetous species. The ITS1 and ITS2 regions are useful for phylogenetic analysis of closely related species. Since both the non-coding ITS regions and the 5.8S are quite variable and show high interspecific divergence [30], sequence analysis of these regions has thus been useful for differentiation of species within Saccharomyces [31]. In the present study, SSJ01KKU was identified as S. cerevisiae, and SCJ04KKU, SCJ07KKU, SCJ09KKU and SCJ14KKU strains were identified as Pichia caribbica, based on clusters defined by the tree nodes with high bootstrap support. The bootstrap percentages indicate the reliability of the cluster descending from that node. (Figure 4). Similarly, phylogenetic analysis of the internal transcribed spacer 1 and 2 regions (ITS1 and ITS2) was in good agreement with the results of the D1/D2 domain, confirming the molecular identification of all isolates. (Figure 5). Based on the morphological and molecular data, including its unique geographical origin, SSJ01KKU as an accession number KU 059,757 from GenBank is a novel effective yeast strain of S. cerevisiae, which can grow and produce ethanol effectively under both HG and VHG conditions, yielding ethanol up to 15% (v/v). In addition, SCJ04KKU (accession number KU 059758), SCJ07KKU (accession number KU 059759), SCJ09KKU (accession number KU 059760) and SCJ14KKU (accession number KU 059761) were novel yeast strains of Pichia caribbica.
Higher sugar utilization and ethanol production efficiency from the SSJ medium under VHG conditions may be obtained if adequate amounts of essential nutrients such as some vitamins, sterols and trace elements (Mg2+, Mn2+ and Zn2+) as well as an osmoprotectant (such as glycine and proline) are supplied [5,8,14,26,32]. Additionally, an aeration technique using the redox potential control during ethanol fermentation under the VHG condition may improve ethanol production efficiency [33,34].

4. Conclusions

Effective yeast strains for ethanol production from sweet sorghum juice and sugarcane juice were isolated. In ethanol fermentation from a SSJ medium with no nutrient supplement under the HG conditions at 200 g/L of sugar, the SCJ14KKU and SSJ01KKU strains gave high ethanol production efficiencies that were comparable to the reference strains. The SCJ04KKU and SSJ01KKU strains showed high ethanol production efficiency under the HG conditions at 240 g/L of sugar, whereas SSJ01KKU was the most suitable for VHG fermentation at 280 g/L of sugar.
Nitrogen supplementation in the SSJ medium promoted ethanol production efficiency (in terms of PE and QP) under both HG and VHG conditions. Under the VHG condition, the SSJ01KKU strain gave the highest ethanol production efficiency with ethanol concentration, productivity and yield of 121.83 g/L, 1.69 g/L·h and 0.49, respectively. Molecular taxonomic analysis revealed that the SSJ01KKU strain is S. cerevisiae. The results obtained from this study demonstrate S. cerevisiae SSJ01KKU as a novel effective yeast strain with high potential for use in industrial ethanol fermentation processes under both HG and VHG conditions.

Author Contributions

Conceptualization, P.L., L.L. and P.K.; data curation, S.S.; formal analysis, S.S. and N.P.; investigation, S.S. and C.D.; methodology, S.S. and N.P.; supervision, P.L., L.L. and P.K.; writing-original draft, L.L.; writing-review and editing, P.L., L.L. and P.K. All authors have read and agreed to the published version of the manuscript.

Funding

This research was funded by the National Research Council of Thailand (NRTC), the Post-doctoral Program from Research Affairs and Graduate School, Khon Kaen University (KKU) (Grant No. 59153) and Center for Alternative Energy Research and Development, Thailand.

Conflicts of Interest

The authors declare no conflict of interest.

References

  1. Mathur, S.; Umakanth, A.V.; Tonapi, V.A.; Sharma, R.; Sharma, M.K. Sweet sorghum as biofuel feedstock: Recent advances and available resources. Biotechnol. Biofuels 2017, 10, 146. [Google Scholar] [CrossRef] [Green Version]
  2. Woods, J. Integrating Sweet Sorghum and Sugarcane for Bioenergy: Modelling the Potential for Electricity and Ethanol Production in SE Zimbabwe. Ph.D. Thesis, King’s College, London, UK, 2000. [Google Scholar]
  3. Gnansounou, E.; Dauriat, A.; Wyman, C.E. Refining sweet sorghum to ethanol and sugar: Economic trade-offs in the context of North China. Bioresour. Technol. 2005, 96, 885–1002. [Google Scholar] [CrossRef] [PubMed]
  4. Jaisil, P.; Pakdee, P.; Pothisoong, T.; Lertprasert-rat, K. Production cost of sweet sorghum (Sorghum bicolor (L.) Moench) and syrup production for ethanol plant. J. Nat. Res. Counc. Thail. 2009, 148–156. [Google Scholar]
  5. Deesuth, O.; Laopaiboon, P.; Jaisil, P.; Laopaiboon, L. Optimization of nitrogen and metal ions supplementation for very high gravity bioethanol fermentation from sweet sorghum juice using an orthogonal array design. Energies 2012, 5, 3178–3197. [Google Scholar] [CrossRef]
  6. Deesuth, O.; Laopaiboon, P.; Klanrit, P.; Laopaiboon, L. Improvement of ethanol production from sweet sorghum juice under high gravity and very high gravity conditions: Effects of nutrient supplementation and aeration. Ind. Crops Prod. 2015, 74, 95–102. [Google Scholar] [CrossRef]
  7. Phukoetphim, N.; Salakkam, A.; Laopaiboon, P.; Laopaiboon, L. Improvement of ethanol production from sweet sorghum juice under batch and fed-batch fermentations: Effects of sugar levels, nitrogen supplementation, and feeding regimes. Electron. J. Biotechnol. 2017, 26, 84–92. [Google Scholar] [CrossRef]
  8. Bai, F.W.; Anderson, W.A.; Moo-Young, M. Ethanol fermentation technologies from sugar and starch feedstocks. Biotechnol. Adv. 2008, 26, 89–105. [Google Scholar] [CrossRef]
  9. Zhang, Q.; Wu, D.; Lin, Y.; Wang, X.; Kong, H.; Tanaka, S. Substrate and product inhibition on yeast performance in ethanol fermentation. Energy Fuels 2015, 29, 1019–1027. [Google Scholar] [CrossRef]
  10. Stanley, D.; Bandara, A.; Fraser, S.; Chambers, P.J.; Stanley, G.A. The ethanol stress response and ethanol tolerance of Saccharomyces cerevisiae. J. Appl. Microbiol. 2010, 109, 13–24. [Google Scholar] [CrossRef]
  11. Bhima, B.; Marrivada, S.R.; Devi, T.A.; Reddy, Y.R.; Rao, L.V. Screening and characterization of stress tolerant Saccharomyces cerevisiae isolated from brewery effluents for animal probiotic applications. IIOAB J. 2010, 1, 32–39. [Google Scholar]
  12. Choi, G.W.; Um, H.J.; Kim, Y.; Kang, H.W.; Kim, M.; Chung, B.W.; Kim, Y.W. Isolation and characterization of two soil derived yeasts for bioethanol production on Cassava starch. Biomass Bioenergy 2010, 34, 1223–1231. [Google Scholar] [CrossRef]
  13. Kurtzman, C.P. Candida shehatae: Genetic diversity and phylogenetic relationships with other xylose-fermenting yeasts. Antonie Leeuwenhoek 1990, 57, 215–222. [Google Scholar] [CrossRef] [PubMed]
  14. Chan-u-tit, P.; Laopaiboon, L.; Jaisil, P.; Laopaiboon, P. High level ethanol production by nitrogen and osmoprotectant supplementation under very high gravity fermentation conditions. Energies 2013, 6, 884–899. [Google Scholar] [CrossRef] [Green Version]
  15. Melzoch, K.; Rychtera, M.; Hábová, V. Effect of immobilization upon the properties and behaviour of Saccharomyces cerevisiae cells. J. Biotechnol. 1994, 32, 59–65. [Google Scholar] [CrossRef]
  16. Ariyajarearnwong, P.; Laopaiboon, L.; Jaisil, P.; Laopaiboon, P. Repeated-batch ethanol fermentation from sweet sorghum juice by free cells of Saccharomyces cerevisiae NP 01. Afr. J. Biotechnol. 2011, 10, 13909–13918. [Google Scholar] [CrossRef] [Green Version]
  17. Sridee, W.; Laopaiboon, L.; Jaisil, P.; Laopaiboon, P. The use of dried spent yeast as a low-cost nitrogen supplement in ethanol fermentation from sweet sorghum juice under very high gravity conditions. Electron. J. Biotechnol. 2011, 14, 3. [Google Scholar] [CrossRef]
  18. Laopaiboon, L.; Nuanpeng, S.; Srinophakun, P.; Klanrit, P.; Laopaiboon, P. Ethanol production from sweet sorghum juice using very high gravity technology: Effect carbon and nitrogen supplementations. Bioresour. Technol. 2009, 100, 4176–4182. [Google Scholar] [CrossRef]
  19. Harju, S.; Fedosyuk, H.; Peterson, K.R. Rapid isolation of yeast genomic DNA: Bust n’ Grab. BMC Biotechnol. 2004, 4, 8. [Google Scholar] [CrossRef] [Green Version]
  20. Tamura, K.; Peterson, D.; Peterson, N.; Stecher, G.; Nei, M.; Kumar, S. MEGA5: Molecular evolutionary genetics analysis using maximum likelihood, evolutionary distance, and maximum parsimony methods. Mol. Biol. Evol. 2011, 28, 2731–2739. [Google Scholar] [CrossRef] [Green Version]
  21. Zoecklien, B.W.; Fugelsang, K.C.; Gump, B.H.; Nury, F.S. Wine Analysis and Production; Chapman & Hall: New York, NY, USA, 1995. [Google Scholar]
  22. Mecozzi, M. Estimation of total carbohydrate amount in environmental samples by the phenol-sulphuric acid method assisted by multivariate calibration. Chemometr. Intell. Lab. Syst. 2005, 9, 84–90. [Google Scholar] [CrossRef]
  23. Lin, Y.; Zhang, W.; Li, C.; Sakakibara, K.; Tanaka, S.; Kong, H. Factors affecting ethanol fermentation using Saccharomyces cerevisiae BY4742. Biomass Bioenergy 2012, 47, 395–401. [Google Scholar] [CrossRef]
  24. Wang, L.; Zhao, X.; Xue, C.; Bai, F. Impact of osmotic stress and ethanol inhibition in yeast cells on process oscillation associated with continuous very-high-gravity ethanol fermentation. Biotechnol. Biofuels 2013, 6, 133. [Google Scholar] [CrossRef] [PubMed] [Green Version]
  25. Ozmihci, S.; Kargi, F. Ethanol fermentation of cheese whey powder solution by repeated fed-batch operation. Enzym. Microb. Technol. 2007, 41, 169–174. [Google Scholar] [CrossRef]
  26. Suwanapong, S.; Khongsay, N.; Laopaiboon, L.; Jaisil, P.; Laopaiboon, P. Dried spent yeast and its hydrolysate as nitrogen supplements for single batch and repeated-batch ethanol fermentation from sweet sorghum juice. Energies 2013, 6, 1618–1631. [Google Scholar] [CrossRef]
  27. Yue, G.; Yu, J.; Zhang, X.; Tan, T. The influence of nitrogen sources on ethanol production by yeast from concentrated sweet sorghum juice. Biomass Bioenerg. 2012, 39, 48–52. [Google Scholar] [CrossRef]
  28. Kurtzman, C.P.; Robnett, C.J. Identification of clinically important ascomycetous yeasts based on nucleotide divergence in the 5′ end of the large-subunit (26S) ribosomal DNA gene. J. Clin. Microbiol. 1997, 35, 1216–1233. [Google Scholar] [CrossRef] [Green Version]
  29. Kurtzman, C.P.; Robnett, C.J. Identification and phylogeny of ascomycetous yeasts from analysis of nuclear large subunit (26S) ribosomal DNA partial sequences. Antonie Leeuwenhoek 1998, 73, 331–371. [Google Scholar] [CrossRef]
  30. Oda, Y.; Yabuki, M.; Tonomura, K.; Fukunaga, M. A phylogenetic analysis of Saccharomyces species by the sequence of 18S-28S rRNA spacer regions. Yeast 1997, 13, 1243–1250. [Google Scholar] [CrossRef]
  31. Belloch, C.; Fernández-Espinar, T.; Querol, A.; García, M.D.; Barrio, E. An analysis of inter- and intraspecific genetic variabilities in the Kluyveromyces marxianus group of yeast species for the reconsideration of the K. lactis taxon. Yeast 2002, 19, 257–268. [Google Scholar] [CrossRef]
  32. Chang, J.W.; Lin, Y.H.; Huang, L.Y.; Duan, K.J. The effect of fermentation configurations and FAN supplementation on ethanol production from sorghum grains under very-high-gravity conditions. J. Taiwan Inst. Chem. E 2011, 42, 1–4. [Google Scholar] [CrossRef]
  33. Khongsay, N.; Lin, Y.H.; Laopaiboon, P.; Laopaiboon, L. Improvement of very-high-gravity ethanol fermentation from sweet sorghum juice by controlling fermentation redox potential. J. Taiwan Inst. Chem. E 2014, 45, 302–307. [Google Scholar] [CrossRef]
  34. Thani, A.; Lin, Y.H.; Laopaiboon, P.; Laopaiboon, L. Variation of fermentation redox potential during cell-recycling continuous ethanol operation. J. Biotechnol. 2016, 239, 68–75. [Google Scholar] [CrossRef] [PubMed]
Figure 1. Time profiles of yeast isolates from sugar cane juice (SCJ), grapes (GR) and sweet sorghum juice (SSJ) grown on SSJ containing 100 g/L of total sugar and 15% (v/v) of ethanol; (A): SCJ01KKU ( Energies 14 00557 i001), SCJ02KKU (△), SCJ03KKU (✕), SCJ04KKU ( Energies 14 00557 i002), SCJ05KKU (▽), SCJ06KKU ( Energies 14 00557 i003), SCJ07KKU (☐), SCJ08KKU (◆), SCJ09KKU ( Energies 14 00557 i004), SCJ10KKU ( Energies 14 00557 i005), SCJ11KKU ( Energies 14 00557 i006), SCJ12KKU ( Energies 14 00557 i007), SCJ13KKU ( Energies 14 00557 i008) and SCJ14KKU ( Energies 14 00557 i009); (B): GR01KKU ( Energies 14 00557 i001), GR02KKU (△), GR03KKU (✕), GR04KKU ( Energies 14 00557 i002), GR05KKU (▽), GR06KKU ( Energies 14 00557 i003), GR07KKU (☐), GR08KKU (◆), GR09KKU ( Energies 14 00557 i004), GR10KKU ( Energies 14 00557 i005) and SSJ01KKU ( Energies 14 00557 i006), NP01 ( Energies 14 00557 i014) and ATCC4132 (▲).
Energies 14 00557 g001
Figure 2. Cell viability (A,C,E), sugar consumption (B,D,F: solid lines) and ethanol production (B,D,F: dashed lines) during batch ethanol fermentation from SSJ media containing initial sugar of 200 g/L (A,B), 240 g/L (C,D) and 280 g/L (E,F) with no nutrient supplementation; SCJ04KKU ( Energies 14 00557 i003,☐), SCJ07KKU ( Energies 14 00557 i005, Energies 14 00557 i010), SCJ09KKU (▼,∇), SCJ14KKU (◆, Energies 14 00557 i004) and SSJ01KKU ( Energies 14 00557 i011, Energies 14 00557 i012); reference strains: S. cerevisiae NP01 ( Energies 14 00557 i014, Energies 14 00557 i001) and ATCC4132 (▲, Energies 14 00557 i013).
Energies 14 00557 g002
Figure 3. Cell viability (A,C,E), sugar consumption (B,D,F: solid lines) and ethanol production (B,D,F: dashed lines) during batch ethanol fermentation from SSJ media containing initial sugar of 200 g/L (A,B), 240 g/L (C,D) and 280 g/L (E,F) and urea at 1.54 g/L; SCJ04KKU ( Energies 14 00557 i003,☐), SCJ14KKU (◆, Energies 14 00557 i004) and SSJ01KKU ( Energies 14 00557 i011, Energies 14 00557 i012); reference strains: S. cerevisiae NP01 ( Energies 14 00557 i014, Energies 14 00557 i001) and ATCC4132 (▲, Energies 14 00557 i013).
Energies 14 00557 g003
Figure 4. Phylogenetic relationship of SCJ04KKU, SCJ07KKU, SCJ09KKU, SCJ14KKU and SSJ01KKU based on a combined sequence analysis of the D1/D2 domain of 26S rDNA. Clustering was performed using the neighbor-joining method, MEGA (Molecular Evolutionary Genetics Analysis) Version 5. The percentages at the nodes indicate the levels of bootstrap support for the branch point based on 1000 bootstrap replicates. The scale bar represents 0.2 nucleotide substitution per sequence position.
Energies 14 00557 g004
Figure 5. Phylogenetic relationship of SCJ04KKU, SCJ07KKU, SCJ09KKU, SCJ14KKU and SSJ01KKU based on a combined sequence analysis of the ITS1 and ITS2 regions. Clustering was performed using the neighbor-joining method, MEGA (Molecular Evolutionary Genetics Analysis) Version 5. The percentages at the nodes indicate the levels of bootstrap support for the branch point based on 1000 bootstrap replicates. The scale bar represents 0.1 nucleotide substitution per sequence position.
Energies 14 00557 g005
Table 1. Fermentation parameters of batch ethanol production from the SSJ medium containing 200 g/L of total sugar.
IsolateSugar
Consumption (%)
Parameter
PE (g/L)QP (g/L·h)YP/S (g/g)
NP01 (control)55.97 ± 1.86 h,j56.46 ± 0.43 l,n1.18 ± 0.02 n0.51 ± 0.00 a
ATCC4132 (control)61.03 ± 0.21 k,l61.31 ± 0.56 m1.28 ± 0.02 j,m0.49 ± 0.01 a
SCJ01KKU33.70 ± 1.46 c25.71 ± 0.21 b0.54 ± 0.01 b0.37 ± 0.00 a
SCJ02KKU38.29 ± 1.43 d,e31.54 ± 0.27 c0.66 ± 0.01 b0.40 ± 0.01 a
SCJ03KKU44.13 ± 0.17 f42.01 ± 041 d,e,f0.88 ± 0.02 c,d,e0.48 ± 0.00 a
SCJ04KKU68.64 ± 1.87 n58.17 ± 0.27 l,m1.21 ± 0.02 j,m0.46 ± 0.00 a
SCJ05KKU33.53 ± 1.42 c31.27 ± 0.52 c0.65 ± 0.01 b0.46 ± 0.01 a
SCJ06KKU46.62 ± 1.03 f41.71 ± 0.42 d,e,f0.87 ± 0.02 c,d0.49 ± 0.01 a
SCJ07KKU67.42 ± 1.35 n55.88 ± 0.46 k,l1.16 ± 0.01 g,h,j0.46 ± 0.00 a
SCJ08KKU53.59 ± 1.56 g,h41.56 ± 0.30 d,e,f0.87 ± 0.02 c,d0.38 ± 0.01 a
SCJ09KKU66.34 ± 1.50 m,n56.37 ± 0.34 k,l1.17 ± 0.02 h,j0.42 ± 0.01 a
SCJ10KKU53.23 ± 1.07 g,h43.61 ± 0.40 d,e,f0.91 ± 0.02 c,d,e,f0.40 ± 0.01 a
SCJ11KKU53.23 ± 1.26 g,h44.97 ± 0.35 e,f,g0.94 ± 0.02 c,d,e,f0.41 ± 0.00 a
SCJ12KKU53.23 ± 1.40 g,h50.00 ± 0.28 h,j1.04 ± 0.02 g,h0.46 ± 0.01 a
SCJ13KKU63.82 ± 1.68 l,m48.88 ± 0.30 g,h,j1.02 ± 0.02 d,e,f0.38 ± 0.00 a
SCJ14KKU58.32 ± 0.06 j,k60.12 ± 0.48 l,m,n1.25 ± 0.03 j,m0.50 ± 0.00 a
GR01KKU43.90 ± 1.73 h42.45 ± 0.35 h0.88 ± 0.01 h0.40 ± 0.01 a
GR02KKU50.48 ± 1.53 h43.43 ± 0.27 h0.90 ± 0.02 h0.42 ± 0.01 a
GR03KKU51.30 ± 1.24 g46.23 ± 0.32 f,g,h0.96 ± 0.072 c,d,e,f0.44 ± 0.00 a
GR04KKU53.20 ± 1.84 g,h49.36 ± 0.41 j,k1.03 ± 0.02 f,g0.45± 0.00 a
GR05KKU9.82 ± 0.68 a13.06 ± 0.19 a0.27 ± 0.00 a0.49 ± 0.00 a
GR06KKU52.72 ± 1.22 g,h49.01 ± 0.53 g,h,j1.02 ± 0.01 e,f0.45 ± 0.01 a
GR07KKU21.41 ± 0.81 b14.13 ± 0.15 a0.29 ± 0.00 a0.32 ± 0.00 a
GR08KKU39.64 ± 0.85 e40.51 ± 0.25 d,e0.84 ± 0.02 c0.49 ± 0.00 a
GR09KKU36.80 ± 1.54 c,d,e39.59 ± 0.38 d0.82 ± 0.02 c0.49 ± 0.01 a
GR10KKU35.56 ± 0.84 c,d32.19 ± 0.50 c0.67 ± 0.01 b0.44 ± 0.00 a
SSJ01KKU60.82 ± 0.21 k,l63.96 ± 0.63 n1.33 ± 0.03 m0.50 ± 0.00 a
PE = ethanol concentration, QP = ethanol productivity and YP/S = ethanol yield. The results were performed in triplicate and expressed as ± SD. a,b,c,d,e,f,g,h,j,k,l,m,n Means followed by the same letter within the same column are not significantly different using Duncan’s multiple range test at the level of 0.05.
Table 2. Fermentation parameters of batch ethanol production from SSJ media under HG and VHG conditions with no nutrient addition.
Initial Sugar (g/L)ParameterStrains
NP01
(Control)
ATCC4132 (Control)SCJ04KKUSCJ07KKUSCJ09KKUSCJ14KKUSSJ01KKU
200
(HG)
SC (%)93.06 ± 1.09 b,c94.43 ± 1.08 b90.83 ± 0.92 c74.31 ± 1.37 d61.89 ± 0.78 e96.11 ± 0.68 a,b98.96 ± 0.17 a
PE (g/L)93.05 ± 0.57 b98.18 ± 0.44 a88.89 ± 0.27 c78.28 ± 0.45 d55.79 ± 0.46 e98.49 ± 0.19 a98.89 ± 0.20 a
QP (g/L·h)1.11 ± 0.01 c1.36 ± 0.02 a1.06 ± 0.02 d0.93 ± 0.02 e0.66 ± 0.02 f1.17 ± 0.01 b1.18 ± 0.01 b
YP/S (g/g)0.51 ± 0.01 a0.50 ± 0.01 a0.50 ± 0.01 a0.51 ± 0.00 a0.45 ± 0.00 b0.50 ± 0.00 b0.50 ± 0.01 a
t (h)84728484848484
240
(HG)
SC (%)94.68 ± 0.22 b95.82 ± 0.41 a85.47 ± 0.69 c--74.17 ± 0.69 d95.79 ± 0.13 a
PE (g/L)114.94 ± 0.40 b 115.32 ± 0.30 b103.78 ± 0.45 c--87.06 ± 0.39 d118.12 ± 0.57 a
QP (g/L·h)1.37 ± 0.02 b1.37 ± 0.00 b1.24 ± 0.01 c--1.04 ± 0.00 d1.41 ± 0.01 a
YP/S (g/g)0.51 ± 0.00 a0.50 ± 0.01 a,b0.51 ± 0.00 a--0.49 ± 0.00 a0.51 ± 0.00 a
t (h)848484--8484
280
(VHG)
SC (%)84.55 ± 0.04 d81.20 ± 0.17 c80.65 ± 0.04 b---85.59 ± 0.17 a
PE (g/L)80.40 ± 0.31 b79.32 ± 0.58 c80.03± 0.76 c,b---82.29± 0.10 a
QP (g/L·h)0.96 ± 0.00 b0.94 ± 0.01 c0.96 ± 0.01 b---0.98 ± 0.00 a
YP/S (g/g)0.34 ± 0.00 a0.35 ± 0.00 a0.35 ± 0.01 a---0.34 ± 0.00 a
t (h)848484---84
HG = high gravity, VHG = very high gravity, SC = sugar consumption, PE = ethanol concentration, QP = ethanol productivity, YP/S = ethanol yield and t = fermentation time. - = not tested. The results were performed in triplicate and expressed as mean ± SD. a,b,c,d,e,f Means followed by the same letter within the same row are not significantly different using Duncan’s multiple range test at the level of 0.05.
Table 3. Fermentation parameters of batch ethanol production from SSJ media under HG and VHG conditions with urea addition (1.54 g/L).
Initial Sugar (g/L)ParameterStrains
NP01 (Control)ATCC4132 (Control)SCJ04KKUSCJ14KKUSSJ01KKU
200
(HG)
SC (%)96.34 ± 0.76 b95.62 ± 0.09 b96.18 ± 0.46 b93.59 ± 0.41 a96.91 ± 0.12 b
PE (g/L)97.97 ± 0.33 b113.26 ± 0.13 c97.94 ± 0.11 b94.44 ± 0.13 a97.10 ± 0.05 b
QP(g/L·h)2.04 ± 0.02 c2.04 ± 0.00 c1.63 ± 0.00 b1.57 ± 0.01 a2.02 ± 0.00 c
YP/S (g/g)0.51 ± 0.00 a0.51 ± 0.00 a0.51 ± 0.00 a0.50 ± 0.01 a0.50 ± 0.01 a
t (h)4848606048
240
(HG)
SC (%)90.97 ± 0.01 b92.41 ± 0.13 b91.31 ± 0.08 b72.30 ± 2.86 a -91.89 ± 0.11 b
PE (g/L)110.32 ± 0.65 b115.32 ± 0.30 b109.03 ± 1.27 b78.95 ± 1.21 a112.47 ± 0.31 c
QP(g/L·h)2.30 ± 0.01 c2.36 ± 0.00 d1.82 ± 0.02 b1.10 ± 0.02 a2.34 ± 0.01 d
YP/S (g/g)0.51 c0.51 c0.50 b0.46 a0.51 c
t (h)4848607248
280
(VHG)
SC (%)88.23 ± 0.09 c86.98 ± 0.39 b80.66 ± 0.52 a-88.47 ± 0.04 c
PE (g/L)118.23 ± 0.70 b,c117.06 ± 0.71 b103.20 ± 0.13 a-119.06 ± 0.64 c
QP(g/L·h)1.64 ± 0.01 b,c1.63 ± 0.00 b1.43 ± 0.00 a-1.65 ± 0.01 c
YP/S (g/g)0.48 ± 0.00 b0.48 ± 0.01 b0.46 ± 0.00 a-0.48 ± 0.01 b
t (h)727272-72
280
(VHG **)
SC (%)88.85 ± 0.48 b87.68 ± 0.25 a--89.07 ± 0.10 b
PE (g/L)119.91 ± 0.32 b119.05 ± 0.09 a--121.83 ± 0.49 c
QP (g/L·h)1.67 ± 0.00 b1.65 ± 0.01 a--1.69 ± 0.00 c
YP/S (g/g)0.48 ± 0.00 b0.48 ± 0.00 b--0.49 ± 0.00 a
t (h)7272--72
HG = high gravity, VHG = very high gravity, SC = sugar consumption, PE = ethanol concentration, QP = ethanol productivity, YP/S = ethanol yield and t = fermentation time. - = not tested. The results were performed in triplicate and expressed as mean ± SD. a,b,c,d Means followed by the same letter within the same column are not significantly different using Duncan’s multiple range test at the level of 0.05. ** Urea addition at 2.30 g/L.
Publisher’s Note: MDPI stays neutral with regard to jurisdictional claims in published maps and institutional affiliations.

