Evaporator Optimization of Refrigerator Systems Using Quality Analysis
by

Sangkyung Na
1,†, 
Sanghun Song
2,†,
Seunghyuk Lee
1,
Jehwan Lee
1,
Hyun Kim
2,
Sungwoo Lee
2,
Gyungmin Choi
1,* and
Seongyool Ahn
1,* 1
School of Mechanical Engineering, Pusan National University, Busan 46241, Korea
2
LG Electronics 391-2, Changwon 51533, Korea
*
Authors to whom correspondence should be addressed.
†
Co-First authors.
Energies 2021, 14(3), 555; https://doi.org/10.3390/en14030555
Submission received: 16 November 2020
/
Revised: 13 January 2021
/
Accepted: 16 January 2021
/
Published: 22 January 2021
(This article belongs to the Special Issue Advances in Reduction Technologies of Gas Emissions (CO2, NOx, and SO2) in Combustion-Related Applications)
Abstract
:In this study, evaporator optimization, via both experimental and simulation methods was conducted. To evaluate the evaporator performance, under the optimal system, the compressor operating time and the effects of oil on the refrigerator system were studied. If the temperature of the refrigerator chamber reaches the setting value, the compressor stops working and it leads to the temperature of the refrigerator chamber slowly increasing, due to the heat transfer to the ambient. When the refrigerator temperature is out of the setting range, the compressor works again, and the refrigerator repeats this process until the end of its life. These on/off period can be controlled through the compressor piston movement. To determine the optimal compressor operating conditions, experiments of monthly power consumption were conducted under various compressor working times and the lowest power consumption conditions was determined when the compressor worked continuously. Lubricating oil, the refrigerator system, using oil, also influenced the system performance. To evaluate the effect of oil, oil eliminated and oil systems were compared based on cooling capacity and power consumption. The cooling capacity of the oil eliminated system was 2.6% higher and the power consumption was 3.6% lower than that of the oil system. After determining the optimal operating conditions of the refrigerator system, visualization experiments and simulations were conducted to decide the optimal evaporator and the conventional evaporator size can be reduced by approximately 2.9%.
1. Introduction
Domestic refrigerators are one of the greatest power consumers of household appliances because they are in continuous operating [1,2]. The International Institute of Refrigeration (IIR) reported that about 1.5 billion domestic refrigerators and freezers are in service worldwide, comprising approximately 4% of global electricity consumption [3]. As these appliances account for such a significant portion of the world’s electricity consumption, improving efficiency can improve a significant portion of the total energy consumption [4,5,6,7,8,9,10].
The efficiency of a refrigerator is defined with coefficient of performance (COP), which is the ratio of the cooling capacity and the power consumption of the compressor. COP is determined by several parameters, including the compressor capacity, compressor type, refrigerant type, and so on. The evaporator is one of the most important factors affecting the COP because the cooling capacity is determined by the enthalpy and mass flow rate between the inlet and outlet of the evaporator. The flow inside the evaporator of a refrigeration system is in a nearly two-phase state, making it is difficult to predict the enthalpy difference or quality of the refrigerant exactly. Therefore, the internal flow characteristics of the evaporator tubing have been extensively studied. Mohseni et al. studied the influence of the tube inclination angle on the internal flow regime [11]. Seven different angles range from −90° to 90° were evaluated, and five refrigerant mass velocities were applied ranging from 53 kg/m2 to 1709 kg/m2. They categorized the internal flow of the evaporator at different tube inclinations as one of the following types: annular, wavy-annular, annular-wavy, stratified wavy, and churn. They found that the inclination also affected the heat transfer coefficient. At low vapor qualities of vertical upward flow in the evaporator, the highest heat transfer coefficient is attained at 90° inclination. In the case of horizontal flow in the evaporator, the highest heat transfer coefficient is achieved at an inclination of −30°. Zhang et al. analyzed the heat transfer and flow characteristics of a heat pipe loop visually [12]. To create a visualization of the heat pipe, they designed an evaporator-compensation chamber as a half-sectioned cylindrical structure sealed with a glass window. This chamber was installed with a tilt angle, −15°, 0°, 15°, to horizontal and it was found that the temperature fluctuations were caused by oscillations in the vapor-liquid interface and pressure at these angles. This simulation method also revealed that the specific angle influences the internal flow of the heat pipe, and the bubble generation/merging mechanism is associated with the heat load and surface characteristics. Tugba and Mert investigated heat exchanger optimization about the effects of evaporator type and geometry, capillary tube diameter and bypass system [13]. The experimental results show that the most influential parameter of the system is the evaporator type and finned tube evaporator with 12 tube passes was the best option for the bypass system. Engin et al. studied the predicted cooling time of a domestic refrigerator using computational fluid dynamics (CFD) analysis [14]. They found that the cooling time is 146.5 min and the packages on the highest shelf became cold faster and their temperature dropped below the setting temperature. Therefore, it was concluded that the cooling time under the temperature drop was different for each location inside the refrigerator, so the food storage location should be selected accordingly. Zhennan et al. studied the thermal economic environmental analysis of the household refrigerator [15]. They used the non-start/off operating compressor technology and achieved high efficiency and capacity modulation using the various refrigerants. If the non-start/off operating technology was applied to the refrigerator, CO2 emissions could be reduced.
Previous studies into refrigerator systems suggest the optimal refrigerator system using the optimal evaporator, operating conditions, and so on. In previous studies evaluating the evaporator, all the experiments and simulation were carried out on single parts, not the whole system. The flow pattern and two-phase flow are generally influenced by the other refrigeration system components during operating. Therefore, for a more accurate evaluation of the complete system, the experiment must be performed in a practical operating refrigerator with all components active. The purpose of this study was, therefore, to investigate the internal flow of the evaporator using a visualization system and to optimize the evaporator in a refrigerator under the optimal operating conditions.
2. Experimental Setup
Figure 1 show the schematic diagram of the experimental setup. All the main components of the refrigeration system were relocated in external space because of the space constraints in device installation and modification. The evaporator installed in the freezer chamber, and the cold air feed into a refrigerator chamber through the damper. The damper operates based on the refrigerator chamber temperature. The role of the dryer, located between the condenser and the evaporator, is to remove moisture in the system. The filter circulates oil into the inlet and outlet of the compressor. The MFM, mass flow meter, measures the mass flow in the refrigerator system. The temperature of the refrigerant was measured by a T-type thermocouple with a maximum error of ±0.2 °C, while pressure was observed by a pressure transducer (Huba Control 506) with a maximum error of ±0.01 bar. The mass flow rate of the refrigerant was obtained using a Coriolis mass flow meter (Oval ALTI MFM) installed at the compressor discharge pipe with a maximum error of ±0.05 kg/h. All data were recorded in real time using a data acquisition device (Graphtec GL850). The compressor and heater power were measured by a power meter (Yokogawa WT310E) with a maximum error of ±1.2 Watt. The internal flow in the evaporator was recorded using a high-speed camera (Fastcam Mini UX100) and a mobile phone camera (LG V50). To evaluate the visualization results, the quality sensor (HBX-DX-HFC) was installed in the evaporator inlet part with a maximum error of ±0.5%. In a normal refrigerator system, the lubricating oil is used to decrease the mechanical loss of the compressor. However, this lubricating oil adversely affects the system performance in terms of heat transfer of the evaporator and pressure drop in the tube. To evaluate the evaporator under the optimal system, the oil was removed by oil eliminating equipment. The monthly power consumption and COP of the refrigerator were evaluated both with and without the oil eliminated equipment. Copper tubing was replaced with polycarbonate at the visualization parts, namely the entrance, and middle parts of the evaporator, as shown in Figure 2a. This polycarbonate tube is exposed to the outside through a hole in the body of the refrigerator because the camera cannot be installed due to space constraints, as shown in Figure 2b. These exposed holes generate an ice film on the polycarbonate surface owing to the temperature difference between the outside and inside of the refrigerator. To visualize the internal flow of the evaporator through the polycarbonate pipe, this film must be eliminated. To eliminate this film, a small vacuum chamber is installed around the polycarbonate tube and evacuated of air by a vacuum pump during the experiment, as shown in Figure 2c. All the experimental equipment was placed in a climate chamber that could control the air temperature from −30 °C to 50 °C and relative humidity from 10% to 100%.
The refrigerant was charged through an additional optimization experiment. The optimal condition was defined as the point where the superheating degree of the evaporator outlet was less than ±1 °C and the suction temperature was not reduced excessively. The experiment was carried out at 5 g intervals and further detailed tests were performed at 1 g. The results shown in Figure 3 indicate that the optimal refrigerant charge 78 g. The air temperature of the R room (Refrigerator room) and F room (Freezer room) were maintained at 5 ± 1.5 °C, −18 ± 2 °C, respectively. The ambient air temperature was maintained at 25 °C with a constant humidity of 50% during the refrigerant charging experiment.
3. Evaluation of the Refrigerator System
3.1. Monthly Power Consumption of Refrigeration System
Refrigerator performance is evaluated by the cooling capacity of the evaporator and power consumption of the compressor. The compressor operates or stops, for most of its lifetime as the refrigerator maintains or fluctuates from the set temperature. The ratio of the compressor operating time to the total refrigerator operating time is an important factor in the performance evaluation of the refrigerator because the entire time is considered when evaluating the refrigerator system. Figure 4 express the power consumption with the variation of on-time ratio (OTR) when ambient temperature is 25 °C and humidity is 50% conditions. The OTR (τ) is defined as the ratio of the compressor operating time (tom) to the refrigerator cycle operating time (timeon + timeoff), as shown in Equation (1).
The OTR is dependent on the stroke of the compressor. When the compressor displacement volume increased, the OTR is decreased and power consumption is increased. When the compressor displacement volume decreased, the OTR increased and power consumption decreased. In the case of the low OTR conditions (compressor displacement volume increased), the amount of refrigerant discharged from the compressor increases and it leads to an increase in the power consumption required for compression work increases. Although it has the advantage of increasing the cooling capacity, the time required to reach the refrigerator target temperature is shortened, and the compressor is frequently turned off and on. When the compressor is turned off, the pressure inside the system is equalized, and when the compressor is turned on again due to unsatisfied temperature conditions, it consumes a lot of power instantaneously to escape the equalization state, as shown by the peak point of Figure 5a.
When the OTR is higher, the monthly power consumption decreases because additional power, required to operate the compressor, decreases. By comparing the performance of the oil system (OS) and oil eliminated systems (OES), the average power consumption of the OES is lower than that of the conventional system by about 2.6% In the case where OTR is 1, the monthly power consumption of the OES is higher about by 6.8% more than OS, as shown by Figure 5a,b.
3.2. Steady-State Energy Test
Refrigerator performance is evaluated by COP, the ratio of the cooling capacity and power consumption. In general, the power consumption is measured by a power meter and the cooling capacity is measured by the standard international organization for standardization (ISO) energy test, as shown in Table 1 [16].
However, this test takes a long time (at least 1 week) for each test condition. To overcome several drawbacks including the time constraints, Hermes et al. suggested a new means of measuring the cooling capacity [16]. They installed a proportional-integral-derivative driven electrical heater into the refrigerator and adjusted the heater power to match the evaporator cooling capacity. They assumed that the power of the electrical heater corresponded to the cooling capacity of the evaporator in this steady-state condition. We introduced this concept into our experiment to obtain the cooling capacity. Figure 6a,b respectively illustrate the cooling capacity and input power as various mass flow rate conditions. The average cooling capacity of the OES was approximately 2.6% higher, while the input power was approximately 3.6% lower than that of the OS.
The power consumption of the compressor is related to the mass flow rate. As the mass flow rate increases, the amount of work required to compress the refrigerant increases. So, the power consumption increases, as shown by Figure 6b. If the OS and OES are compared under the same mass flow rate conditions, OS comprises oil/refrigerant mixture but OES was constituted of only refrigerant, which is the driving force of heat transfer. To reach the set temperature value, more of the refrigerant and oil mixture of the OS (by mass) is required, when compared to the OES, and the input power of the OS is higher than that of the OES. Therefore, the OS consumes more power than OES to achieve the same refrigeration capacity. Figure 7 shows the COP of the two systems. The average COP of the OES was 6.2% higher than that of the OS.
4. Quality Analysis of the Evaporator
When measuring the cooling capacity of the refrigerator, indirectly the method used is as mentioned Section 3.2 because it is difficult to consider the two-phase state of the refrigerant. This indirect measurement method is also a reasonable method to sufficiently evaluate the refrigeration capacity of the refrigerator but has a disadvantage in that the information on the phase change of the refrigerant inside the evaporator cannot be known. In this study, a visualization method and simulation software (Coil designer, Optimized Thermal Systems) were used to measure the quality of the refrigerant in the evaporator. To evaluate under the optimal operating system, OTR is 1 and OES conditions were used.
4.1. Quality Analysis through Visualization Method
The quality of the evaporator is defined as the ratio of vapor and vapor-liquid mixture by mass, but direct measurement of the mass is impossible because the evaporator tubing is not large enough to accommodate a measuring device. To overcome the spatial constraints and other problems, several techniques such as typical flow pattern classification, numerical models, and predicting the void fraction, are used. [17,18,19,20,21,22,23]. The drift flux model, using the horizontal pipe, can calculate the refrigerant quality inside the evaporator as presented in Equation (2) [24].
The distribution parameter () which are descriptive measures of an entire data and drift velocity () were calculated by empirical correlations suggested by previous studies, as shown in Equations (3) and (4) [25,26].
Figure 8 shows the visualization results at the evaporator inlet and middle part in OES, where OTR = 1 condition and ambient temperature is 25 °C and humidity is 50% conditions. At the inlet of the evaporator, the internal flow has an annular shape. In the case of the middle of the evaporator, a wavy flow shape is observed. These different patterns occurred due to the difference in velocity between the liquid and vapor phase refrigerant decreasing as the absolute amount of vapor refrigerant with relatively high velocity increases and the absolute amount of liquid refrigerant decreases [17]. The boundary surface between the liquid and vapor phases is obtained from the original recorded images by post-processing using the Sobel method [27,28]. The treated images contain two white lines because of the camera angle. The boundary line dividing the two-phase flow is determined by the middle of these lines. The areas of each phase were used to calculate the void fraction () and surface tension () [29].
Table 2 shows the quality values as calculated by this method at the inlet and middle of the evaporator. If the ambient temperature increased, the quality at the inlet and middle also increased. This is because the refrigerant temperature of the entire evaporator area increased as the ambient temperature increased [30].
To evaluate the visualization experiments, the quality of the evaporator inlet part was compared to the results of the quality sensor, the results are expressed in Table 3. The sensor cannot be installed in the middle part of the evaporator due to the constraint of the refrigerator chamber. Maximum error between the visualization results and sensing value is 3.43% when the ambient temperature is 43 °C.
4.2. Simulation Results of Evaporator Quality
It is difficult to measure the state of the flowing fluid directly in all regions of the evaporator during the experiment because of space constraints within the refrigerator chamber. Therefore, in this study, quality analysis of the evaporator was conducted using a simulation program under the OTR is 1 and OES operating conditions. Input parameters (quality at the evaporator inlet, refrigerant temperature and pressure at the evaporator inlet, ambient temperature and humidity) were measured experimentally. Numerical models to calculate the amount of heat transfer and pressure drops are expressed in Table 4.
Figure 9 shows a schematic of the evaporator shape used in this simulation and experiments. The evaporator is divided into 6 parts according to the number of fins. The quality of the evaporator is calculated at 10 points for each column. The ambient temperature was set to 5 °C, 25 °C and 43 °C. The simulation was validated by comparing the experimental results at the middle of the evaporator and Table 5 shows the accuracy of the simulation results. The maximum error of the quality values is 4.61% when the ambient temperature is 5 °C. Figure 10 illustrates the flow state simulation results in the evaporator according to the length when the humidity is 50%. As the ambient temperature increased, the point at which the super-heated region was observed became closer to the end of the evaporator. This occurs because an increase in ambient temperature leads to an increase in the temperature and pressure at the inlet of the evaporator [30].
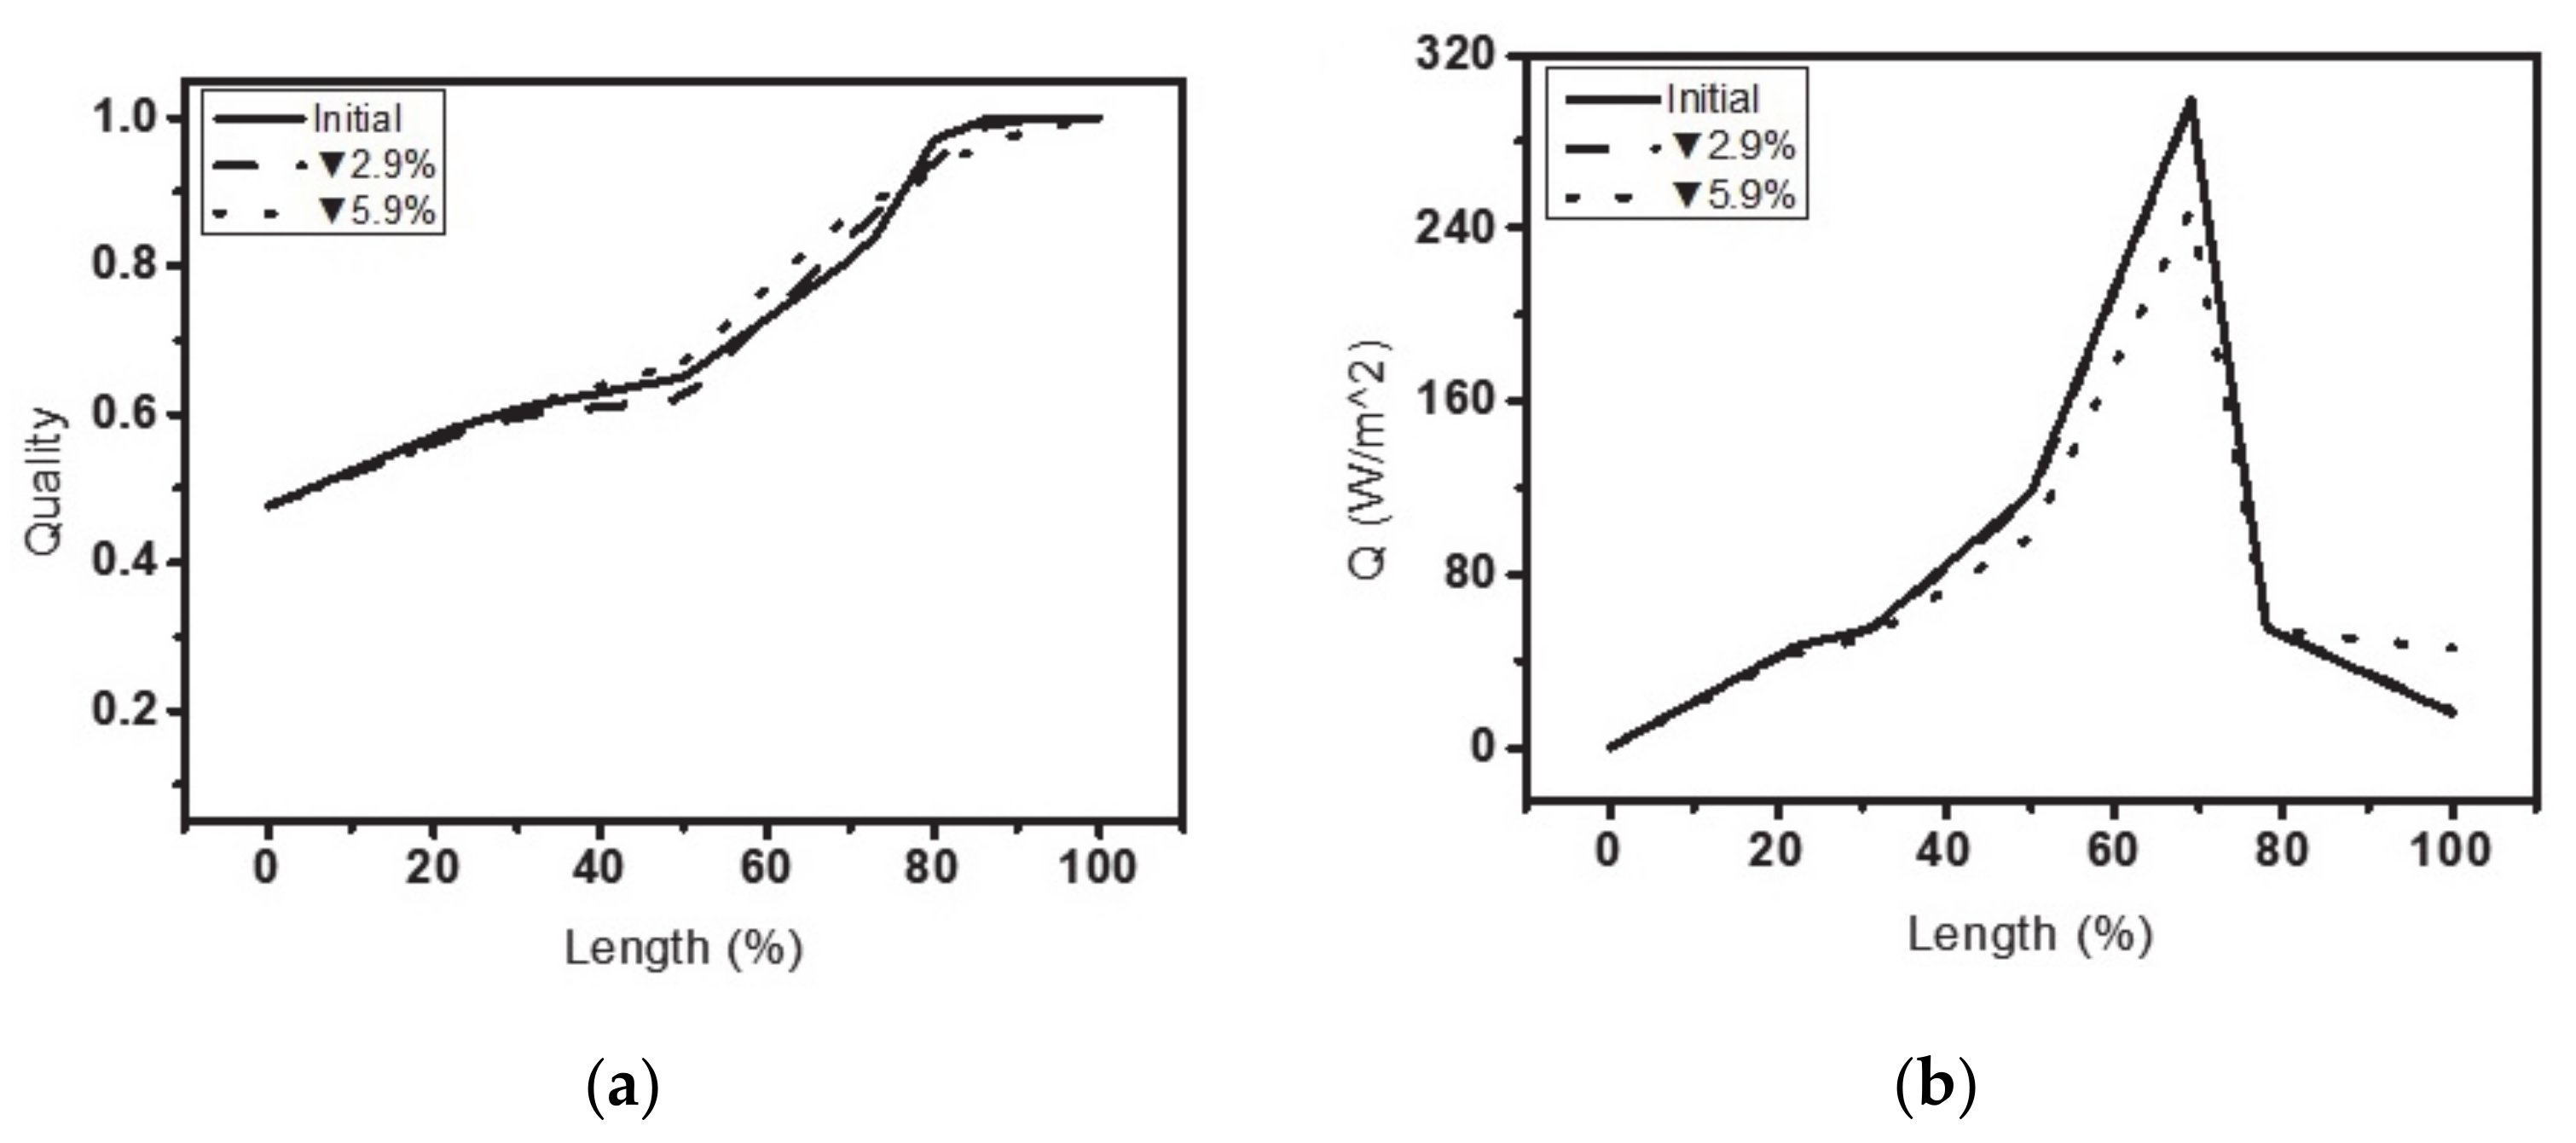
In the two-phase region, the refrigerant changes phase as a result of heat transfer and maintains pressure, but in the super-heated region, the pressure increases as the temperature increases, which adversely affects the compression work aspect and the heat transfer efficiency. If the super-heated region can minimize, the system of the refrigerator can optimize. In order to minimize the super-heated area, the evaporator size reduced based on the amount of heat transfer per unit area of the heat exchanger as shown in Figure 11. The amount of heat transfer in the super-heated region is very small compared to the two-phase region, so it is possible to minimize the evaporator size based on the total amount of heat transfer. The area under the data-line reflects the total amount of heat transfer. The optimal evaporator size was determined as the limit point in which the performance does not change dramatically compared to the conventional evaporator size. As shown in Figure 11a,b, the evaporator size can be reduced by approximately 2.9%.
5. Conclusions
In this study, the evaporator of a refrigerator was evaluated. To evaluate the evaporator under the optimal operating conditions, experiments into the lubricating oil effect and compressor operating time were conducted. The results of the evaluation show that OES has better performance than OS and the refrigerator performance is higher when OTR is higher. Detailed results of these experiments are as follows:
- When the OTR varies from 0.6 to 1, the monthly power consumption of the OES is about 2.6% less than for the OS. In the case where the OTR is 1, the monthly power consumption of the OES is lower by about 6.8% compared to the OS. This is because the additional power consumption to overcome the equalization pressure, occurs in the OS and the heat transfer capability of the evaporator has been improved by eliminating oil in the OES.
- -
- When the OTR is 1, the cooling capacity of the OES was an average 2.6% higher, at various mass flow rate conditions. When considering the power consumption, OES is lower, by an average of 3.6%, compared to the OS. This is because the power loss attributable to the oil film inside the evaporator was removed and heat transfer capacity improved. COP, the ratio of the cooling capacity and power consumption, of the OES is higher by an average of 6.2% at various mass flow rate conditions.
- To optimize the evaporator of the refrigerator, visualization experiments and simulations were conducted under the optimal operating conditions (OES and OTR are 1). The size of the evaporator can be reduced by about 2.9%. The details and results of the visualization experiments and simulations follow in the text bellow:
- -
- To evaluate the quality of the refrigerant in the evaporator, the visualization experiments were conducted at three different ambient temperature conditions. The quality of the refrigerants was calculated using numerical models based on the visualization results. The visualization results of the evaporator inlet part were compared to the sensing value to evaluate the visualization experiments. The maximum error of the visualization results is 3.43% when the ambient temperature is 43 °C. In the case of the visualization results of the evaporator middle part, the results compared to simulation results to evaluate the simulation accuracy and the maximum error of the simulation is 4.61% when the ambient temperature is 5 °C condition.
- -
- To minimize the evaporator of the refrigerator, quality simulations were conducted at all regions of the evaporator. The amount of heat transfer per unit area, 2.9% for the case of the minimized evaporator a similar amount of heat transfer was observed when compared to the conventional evaporator size. If it is reduced by more than 2.9%, the heat transfer amount per unit area is lower than the conventional evaporator performance.
Author Contributions
Conceptualization, H.K.; methodology, J.L.; software, S.L. (Seunghyuk Lee); validation, S.N. and S.S.; formal analysis, S.L. (Seunghyuk Lee); investigation, S.S.; resources, S.S.; data curation, S.N.; writing—original draft preparation, S.N.; writing—review and editing, S.N.; visualization, S.L. (Sungwoo Lee); supervision, S.A.; project administration, G.C.; funding acquisition, H.K. All authors have read and agreed to the published version of the manuscript.
Funding
This work was supported by the Human Resources Development program (No. 20184030202060) of the Korea Institute of Energy Technology Evaluation and Planning (KETEP) grant funded by the Korea government Ministry of Trade, Industry and Energy and “Human Resources Program in Energy Technology” of the Korea Institute of Energy Technology Evaluation and Planning (KETEP), granted financial resource from the Ministry of Trade, Industry & Energy, Republic of Korea. (No. 20184010201660).
Institutional Review Board Statement
Not applicable.
Informed Consent Statement
Not applicable.
Conflicts of Interest
The authors declare no conflict of interest.
Nomenclature
| COP | Coefficient of performance |
| CFD | Computational fluid dynamics |
| MFM | Mass flow meter |
| R room | Refrigerator room |
| F room | Freezer room |
| ISO | International organization for standardization |
| τ | On-Time Ratio(OTR) |
| ton | Compressor operating time [s] |
| toff | Compressor off time [s] |
| ε | Void fraction |
| x | Quality |
| ρG | Gas phase density of refrigerant [kg/m3] |
| ρL | Liquid phase density of refrigerant [kg/m3] |
| C0 | Distribution parameter |
| UGU | Drift velocity [m/s] |
| G | Total mass flux of gas and liquid [kg/m2] |
| σ | Surface tension [N/m] |
| g | Acceleration of gravity [9.81 m/s2] |
References
- Elarem, R.; Mellouli, S.; Abhilash, E.; Jemni, A. Performance analysis of a household refrigerator integrating a PCM heat exchanger. Appl. Therm. Eng. 2017, 125, 1320–1333. [Google Scholar] [CrossRef]
- Simard, A.; Lacroix, M. Study of the thermal behavior of a latent heat cold storage unit operating under frosting conditions. Energy Convers. Manag. 2003, 44, 1605–1624. [Google Scholar] [CrossRef]
- Coulomb, D.; Dupont, J.L.; Pichard, A. The Role of refrigeration in the Global Economy—29th Informatory Note on Refrigeration Technologies; International Institute of Refrigeration: Paris, France, 2015. [Google Scholar]
- Kim, J.K.; Roh, C.G.; Kim, H.; Jeong, J.H. An experimental and numerical study on an inherent capacity modulated linear compressor for home refrigerators. Int. J. Refrig. 2011, 34, 1415–1423. [Google Scholar] [CrossRef]
- Chun, T.-W.; Ahn, J.-R.; Lee, H.-H.; Kim, H.-G.; Nho, E.-C. A Novel Strategy of Efficiency Control for a Linear Compressor System Driven by a PWM Inverter. IEEE Trans. Ind. Electron. 2008, 55, 296–301. [Google Scholar] [CrossRef]
- Na, S.; Shin, M.; Choi, G.; Min, B. Effect of pressure ratio and oil viscosity on rotary compressor efficiency. J. Mech. Sci. Technol. 2018, 32, 4971–4981. [Google Scholar] [CrossRef]
- Aprea, C.; Mastrullo, R.; Renno, C. Determination of the compressor optimal working conditions. Appl. Therm. Eng. 2009, 29, 1991–1997. [Google Scholar] [CrossRef] [Green Version]
- Ooi, K.; Wong, T. A computer simulation of a rotary compressor for household refrigerators. Appl. Therm. Eng. 1997, 17, 65–78. [Google Scholar] [CrossRef]
- Tuhovcak, J.; Hejcik, J.; Jicha, M. Comparison of heat transfer models for reciprocating compressor. Appl. Therm. Eng. 2016, 103, 607–615. [Google Scholar] [CrossRef]
- Cai, D.; Qiu, C.; Pan, J.; Yang, X.; He, G.; Tetsuhide, Y.; Chen, X.; Li, H. Leakage characteristics and an updated volumetric efficiency prediction model of rolling piston type rotary compressor for small capacity air-conditioner and heat pump applications. Appl. Therm. Eng. 2017, 121, 1080–1094. [Google Scholar] [CrossRef]
- Mohseni, S.; Akhavan-Behabadi, M. Flow pattern visualization and heat transfer characteristics of R-134a during evaporation inside a smooth tube with different tube inclinations. Int. Commun. Heat Mass Transf. 2014, 59, 39–45. [Google Scholar] [CrossRef]
- Zhang, Q.; Lin, G.; Shen, X.; Bai, L.; Wen, D. Visualization study on the heat and mass transfer in the evaporator-compensation chamber of a loop heat pipe. Appl. Therm. Eng. 2020, 164, 114472. [Google Scholar] [CrossRef]
- Tosun, T.; Tosun, M. Heat exchanger optimization of a domestic refrigerator with separate cooling circuits. Appl. Therm. Eng. 2020, 168, 114810. [Google Scholar] [CrossRef]
- Söylemez, E.; Alpman, E.; Onat, A.; Hartomacıoğlu, S. CFD analysis for predicting cooling time of a domestic refrigerator with thermoelectric cooling system. Int. J. Refrig. 2021, 123, 138–149. [Google Scholar] [CrossRef]
- Zhu, Z.; Liang, K.; Li, Z.; Jiang, H.; Meng, Z. Thermal-economic-environmental analysis on household refrigerator using a variable displacement compressor and low-GWP refrigerants. Int. J. Refrig. 2021, 123, 189–197. [Google Scholar] [CrossRef]
- Hermes, C.J.; Melo, C.; Knabben, F.T. Alternative test method to assess the energy performance of frost-free refrigerating appliances. Appl. Therm. Eng. 2013, 50, 1029–1034. [Google Scholar] [CrossRef]
- Thome, J.R. Encyclopedia of Two-Phase Heat Transfer and Flow IV: Modeling Methodologies-Boiling of CO2 and Micro Two-Phase Cooling; World Scientific Publishing: Singapore, 2018. [Google Scholar]
- Zuber, N.; Findlay, J.A. Average Volumetric Concentration in Two-Phase Flow Systems. J. Heat Transf. 1965, 87, 453–468. [Google Scholar] [CrossRef]
- Wallis, G.B. One-Dimensional Two-Phase Flow; McGraw Hill: New York, NY, USA, 1969. [Google Scholar]
- Hibiki, T.; Ishii, M. One-dimensional drift-flux model and constitutive equations for relative motion between phases in various two-phase flow regimes. Int. J. Heat Mass Transf. 2003, 46, 4935–4948. [Google Scholar] [CrossRef] [Green Version]
- Godbole, P.V.; Tang, C.C.; Ghajar, A.J. Comparison of Void Fraction Correlations for Different Flow Patterns in Upward Vertical Two-Phase Flow. Heat Transf. Eng. 2011, 32, 843–860. [Google Scholar] [CrossRef]
- Woldesemayat, M.A.; Ghajar, A.J. Comparison of void fraction correlations for different flow patterns in horizontal and upward inclined pipes. Int. J. Multiph. Flow 2007, 33, 347–370. [Google Scholar] [CrossRef]
- Coddington, P.; Macian, R. A study of the performance of void fraction correlations used in the context of drift-flux two-phase flow models. Nucl. Eng. Des. 2002, 215, 199–216. [Google Scholar] [CrossRef]
- Kim, G.; Lee, J.; Park, J.; Song, S. Flow visualization and noise measurement of R410A two-phase flow near electric expansion valve for heating cycle of multi-split air-source heat pump. Appl. Therm. Eng. 2019, 157, 113712. [Google Scholar] [CrossRef]
- Rouhani, S.; Axelsson, E. Calculation of void volume fraction in the subcooled and quality boiling regions. Int. J. Heat Mass Transf. 1970, 13, 383–393. [Google Scholar] [CrossRef]
- Steiner, D. VDI-Gesellshaft Verfahrenstechnik und Chemieingenieurwesen (GVC); Springer: Berlin/Heidelberg, Germany, 1993. [Google Scholar]
- Gao, W.; Zhang, X.; Yang, L.; Liu, H. An improved Sobel edge detection. In Proceedings of the 2010 3rd International conference on computer science and information technology, Chengdu, China, 9–11 July 2010; Volume 5, pp. 67–71. [Google Scholar]
- Malik, J.; Sainarayanan, G.; Dahiya, R. Min Max Threshold Range (MMTR) based approach in palmprint authentication by sobel code method. Procedia Comput. Sci. 2010, 2, 149–158. [Google Scholar] [CrossRef] [Green Version]
- Tanaka, K.; Higashi, Y. Measurements of the surface tension for R290, R600a and R290/R600a mixture. Int. J. Refrig. 2007, 30, 1368–1373. [Google Scholar] [CrossRef]
- Sharifian, A.; Siang, J.T. Impacts of Room Temperature on the Performance of a Portable Propane Air Conditioner. Int. J. Air-Conditioning Refrig. 2015, 23, 1550015. [Google Scholar] [CrossRef]
- Ameel, B.; Huisseune, H.; DeGroote, J.; T’Joen, C.; De Jaeger, P.; Vierendeels, J.; De Paepe, M. On fin efficiency in interrupted fin and tube heat exchangers. Int. J. Heat Mass Transf. 2013, 60, 557–566. [Google Scholar] [CrossRef]
- Wang, C.-C.; Chi, K.-Y.; Chang, C.-J. Heat transfer and friction characteristics of plain fin-and-tube heat exchangers, part II: Correlation. Int. J. Heat Mass Transf. 2000, 43, 2693–2700. [Google Scholar] [CrossRef]
- Dittus, F.; Boelter, L. Heat transfer in automobile radiators of the tubular type. Int. Commun. Heat Mass Transf. 1985, 12, 3–22. [Google Scholar] [CrossRef]
- Wojtan, L.; Ursenbacher, T.; Thome, J.R. Investigation of flow boiling in horizontal tubes: Part II—Development of a new heat transfer model for stratified-wavy, dryout and mist flow regimes. Int. J. Heat Mass Transf. 2005, 48, 2970–2985. [Google Scholar] [CrossRef]
- Incropera, F.P.; Dewitt, D.P. Introduction to Heat Transfer, 3rd ed.; WILEY: New York, NY, USA, 1996. [Google Scholar]
Figure 1.
Schematic diagram of experimental system.

Figure 2.
(a) Polycarbonate part of the evaporator; (b) Visualization hole of the refrigerator; (c) Vacuum pump chamber.
Figure 2.
(a) Polycarbonate part of the evaporator; (b) Visualization hole of the refrigerator; (c) Vacuum pump chamber.

Figure 3.
Results of the optimal refrigerant charging experiments.
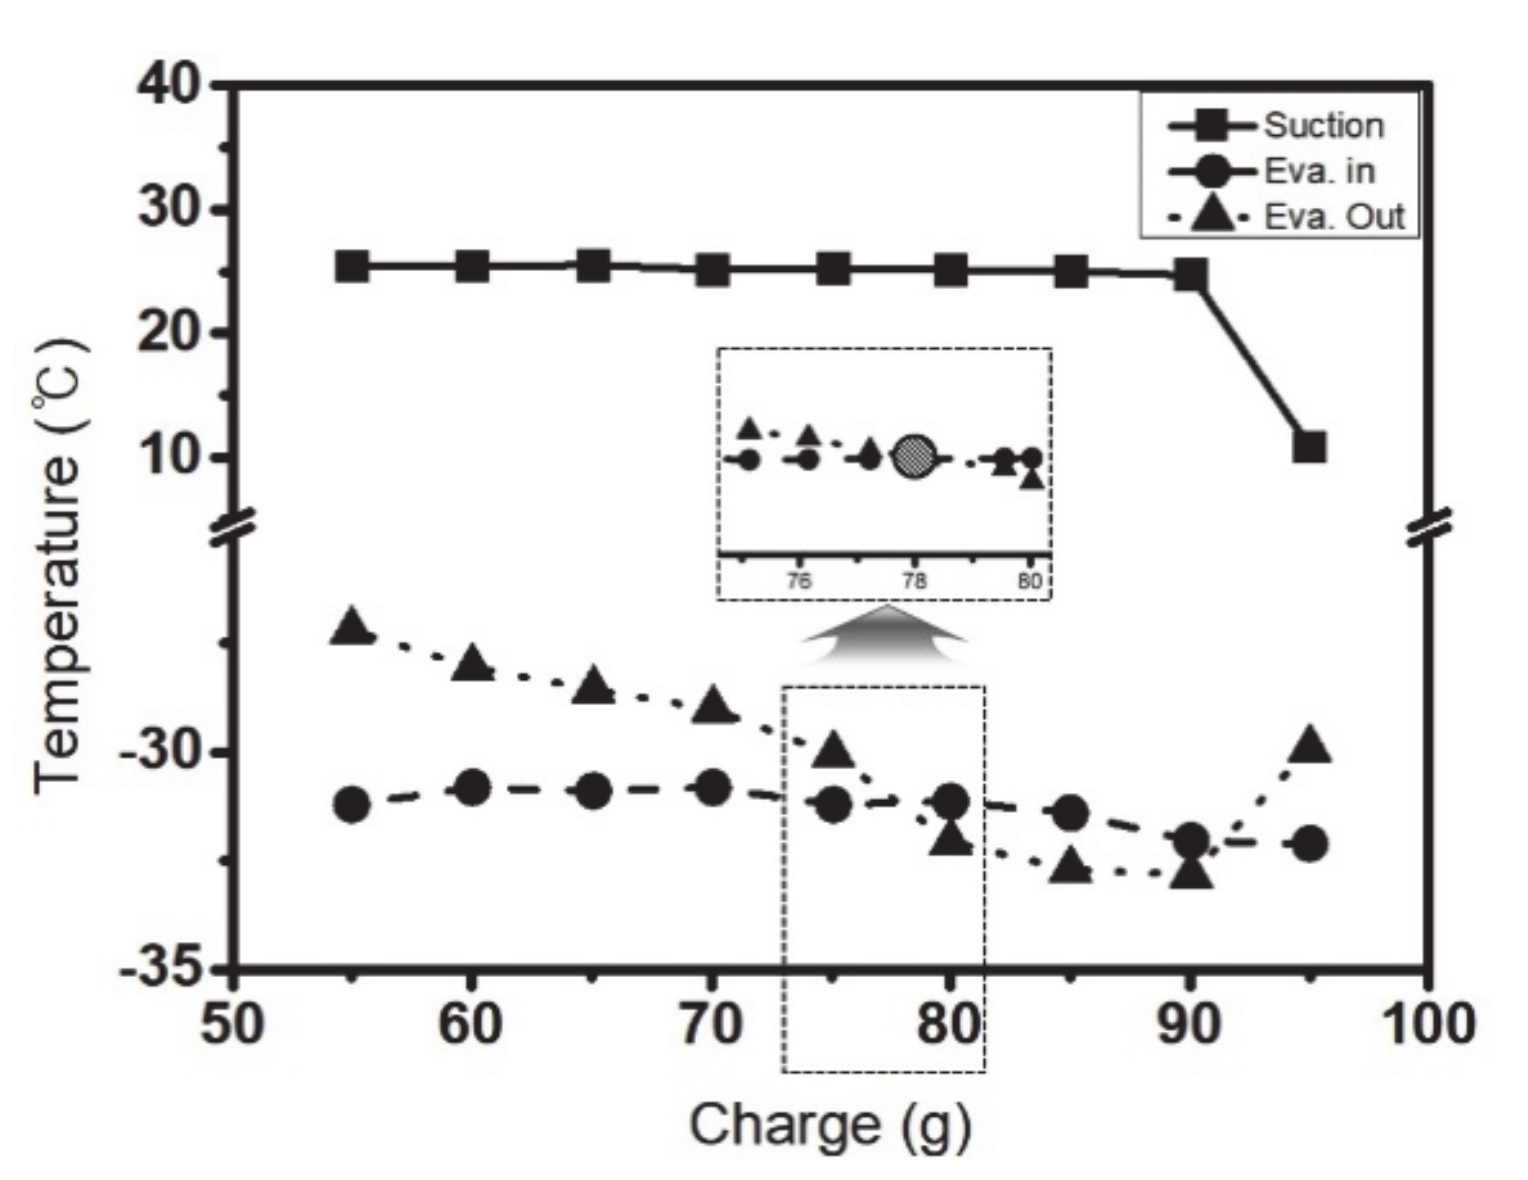
Figure 4.
Monthly power consumption with varying OTR.

Figure 5.
Power consumption trend with (a) OTR = 0.7; (b) OTR = 1.
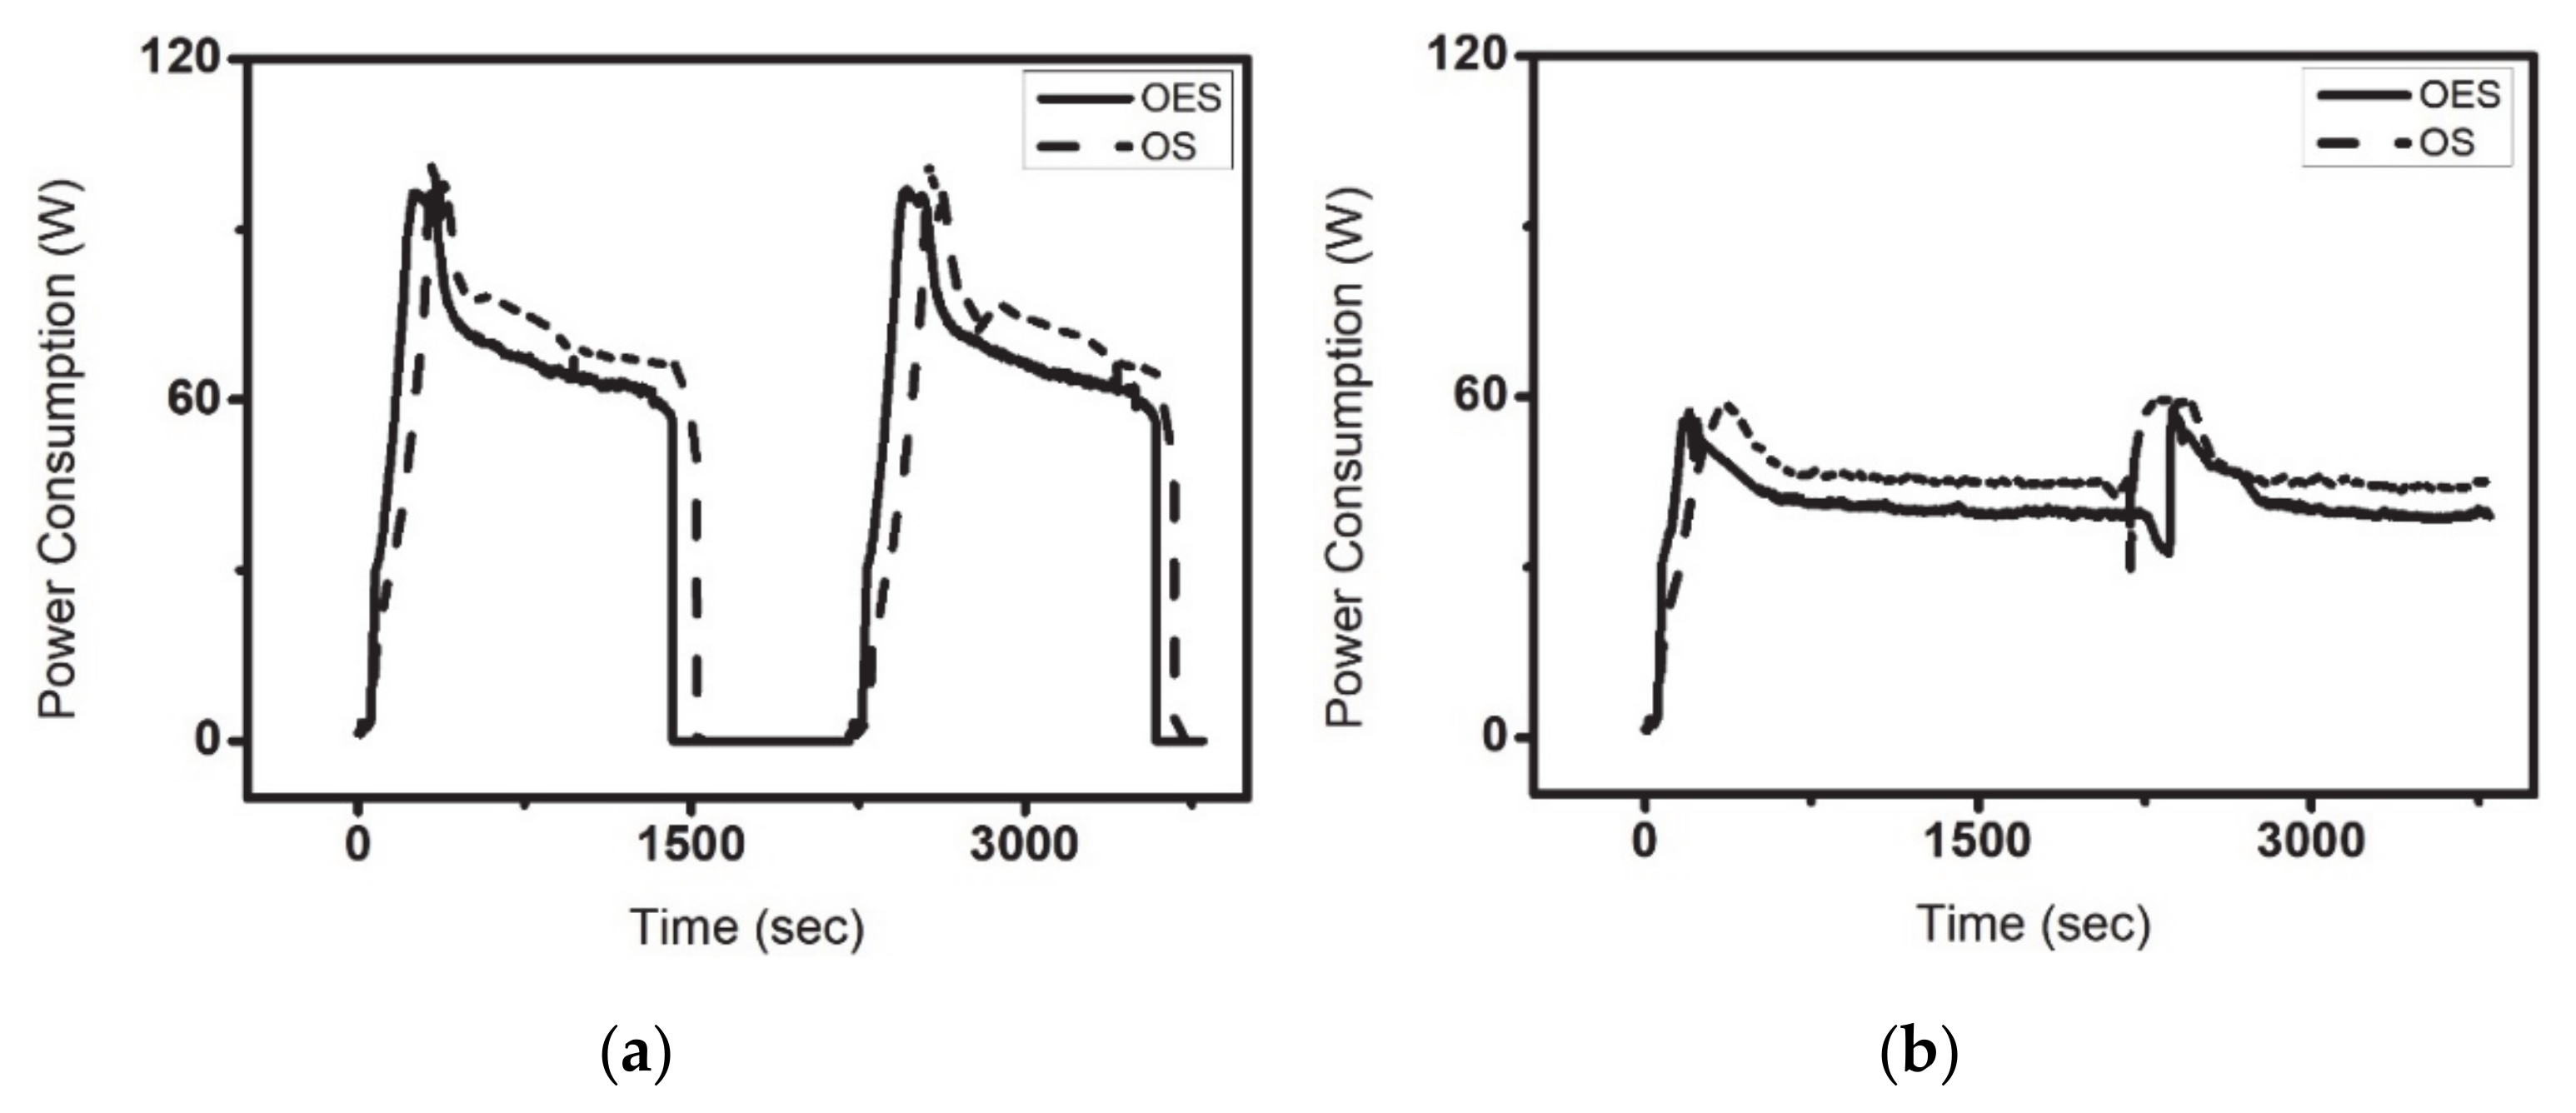
Figure 6.
(a) Cooling capacity variation with mass flow rate; (b) Input power variation with mass flow rate when ambient temperature is 25 °C and humidity is 50% conditions.
Figure 6.
(a) Cooling capacity variation with mass flow rate; (b) Input power variation with mass flow rate when ambient temperature is 25 °C and humidity is 50% conditions.
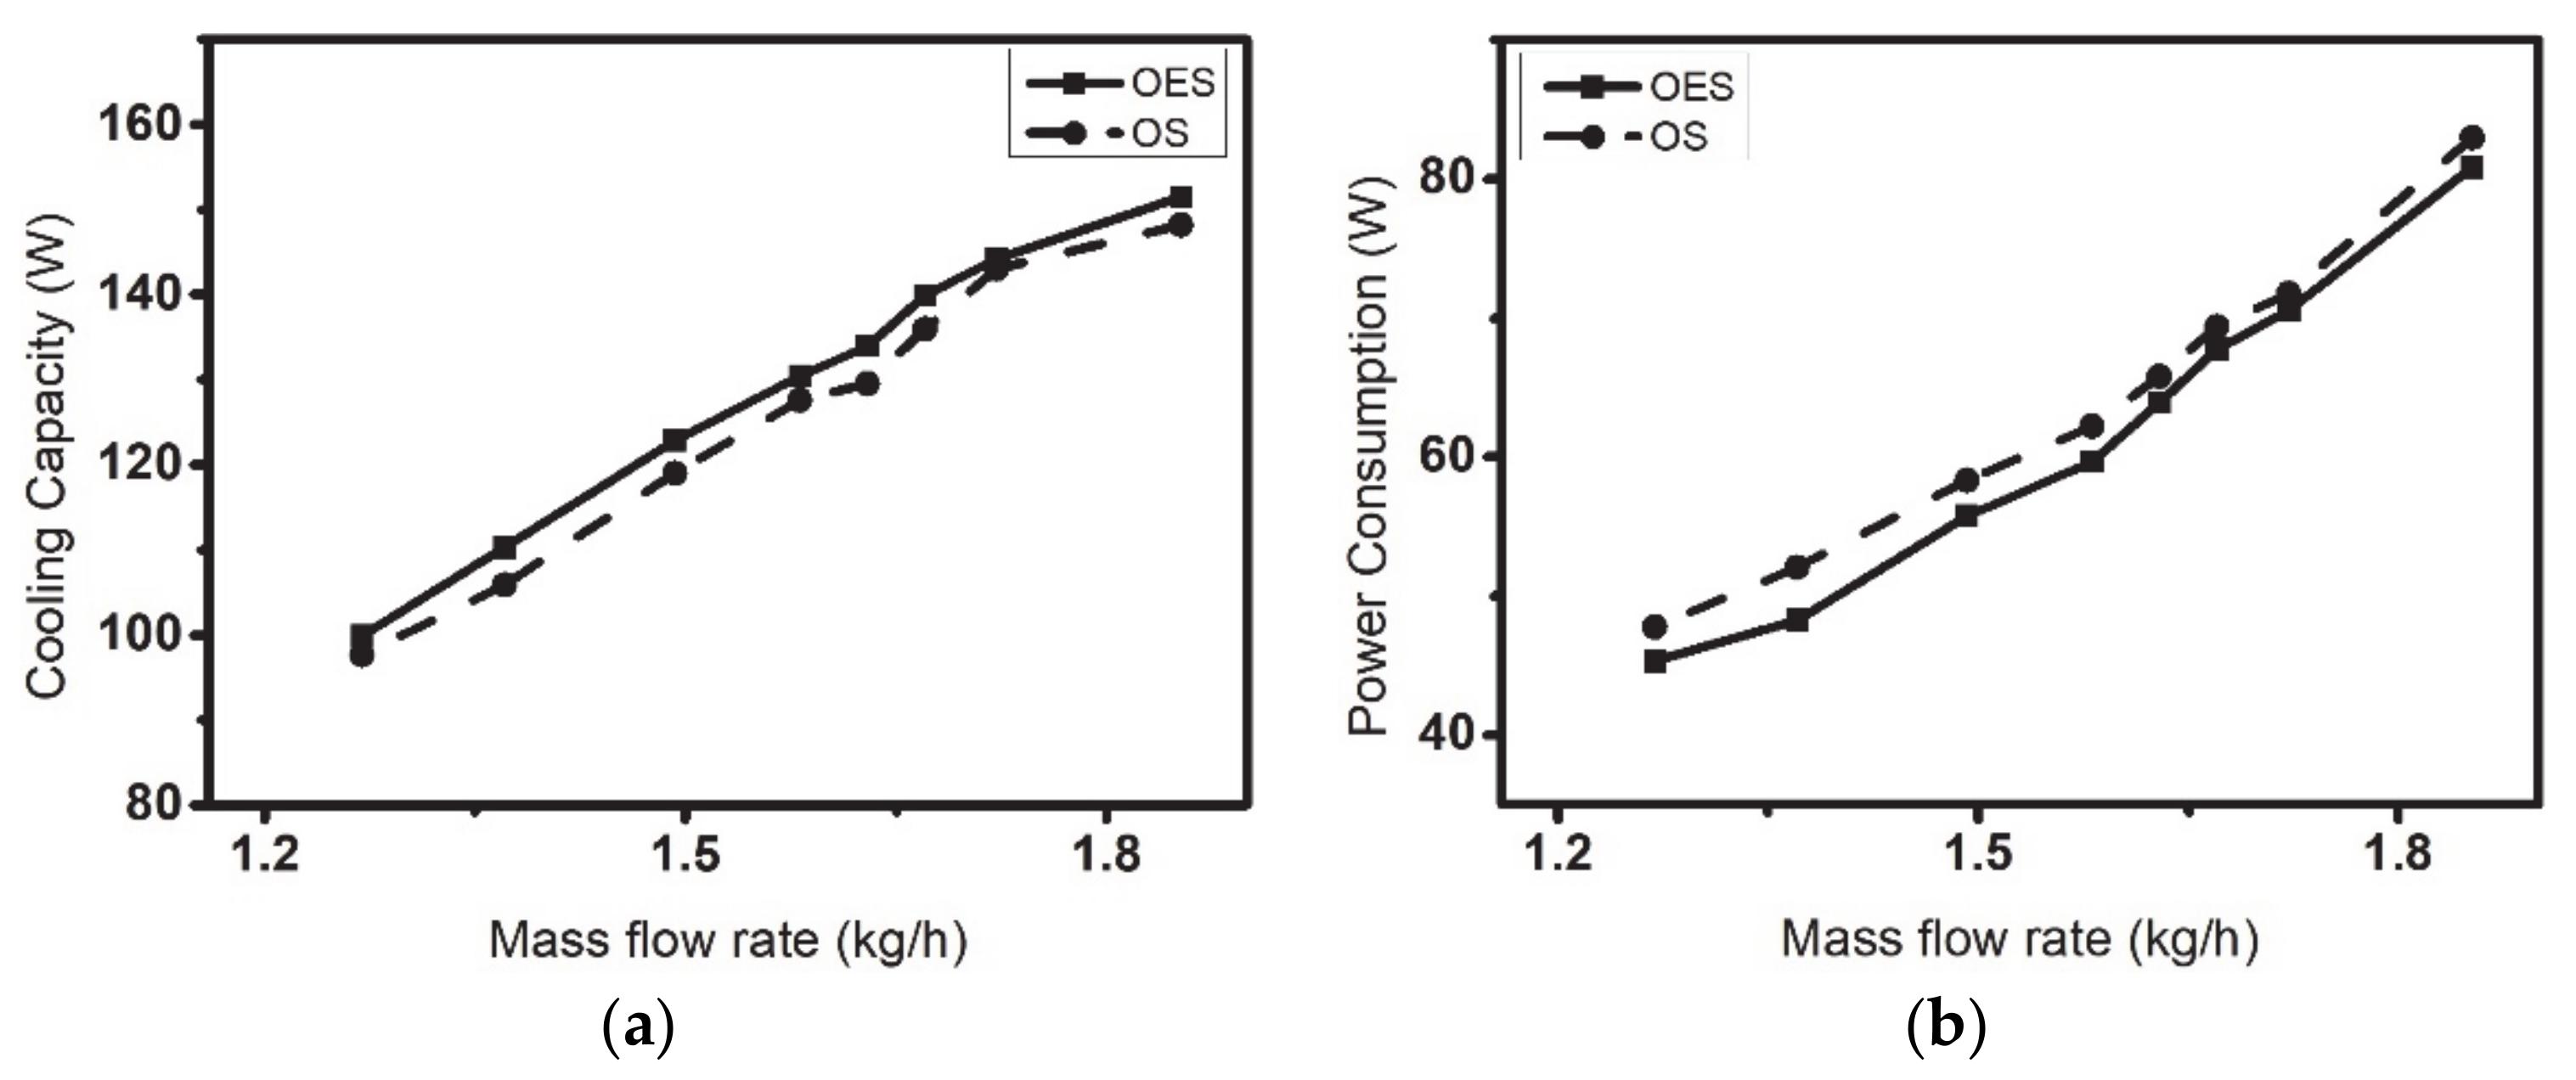
Figure 7.
COP with variation of mass flow rate.

Figure 8.
Results of visualization and image processing at (a) inlet section and (b) middle section.
Figure 8.
Results of visualization and image processing at (a) inlet section and (b) middle section.
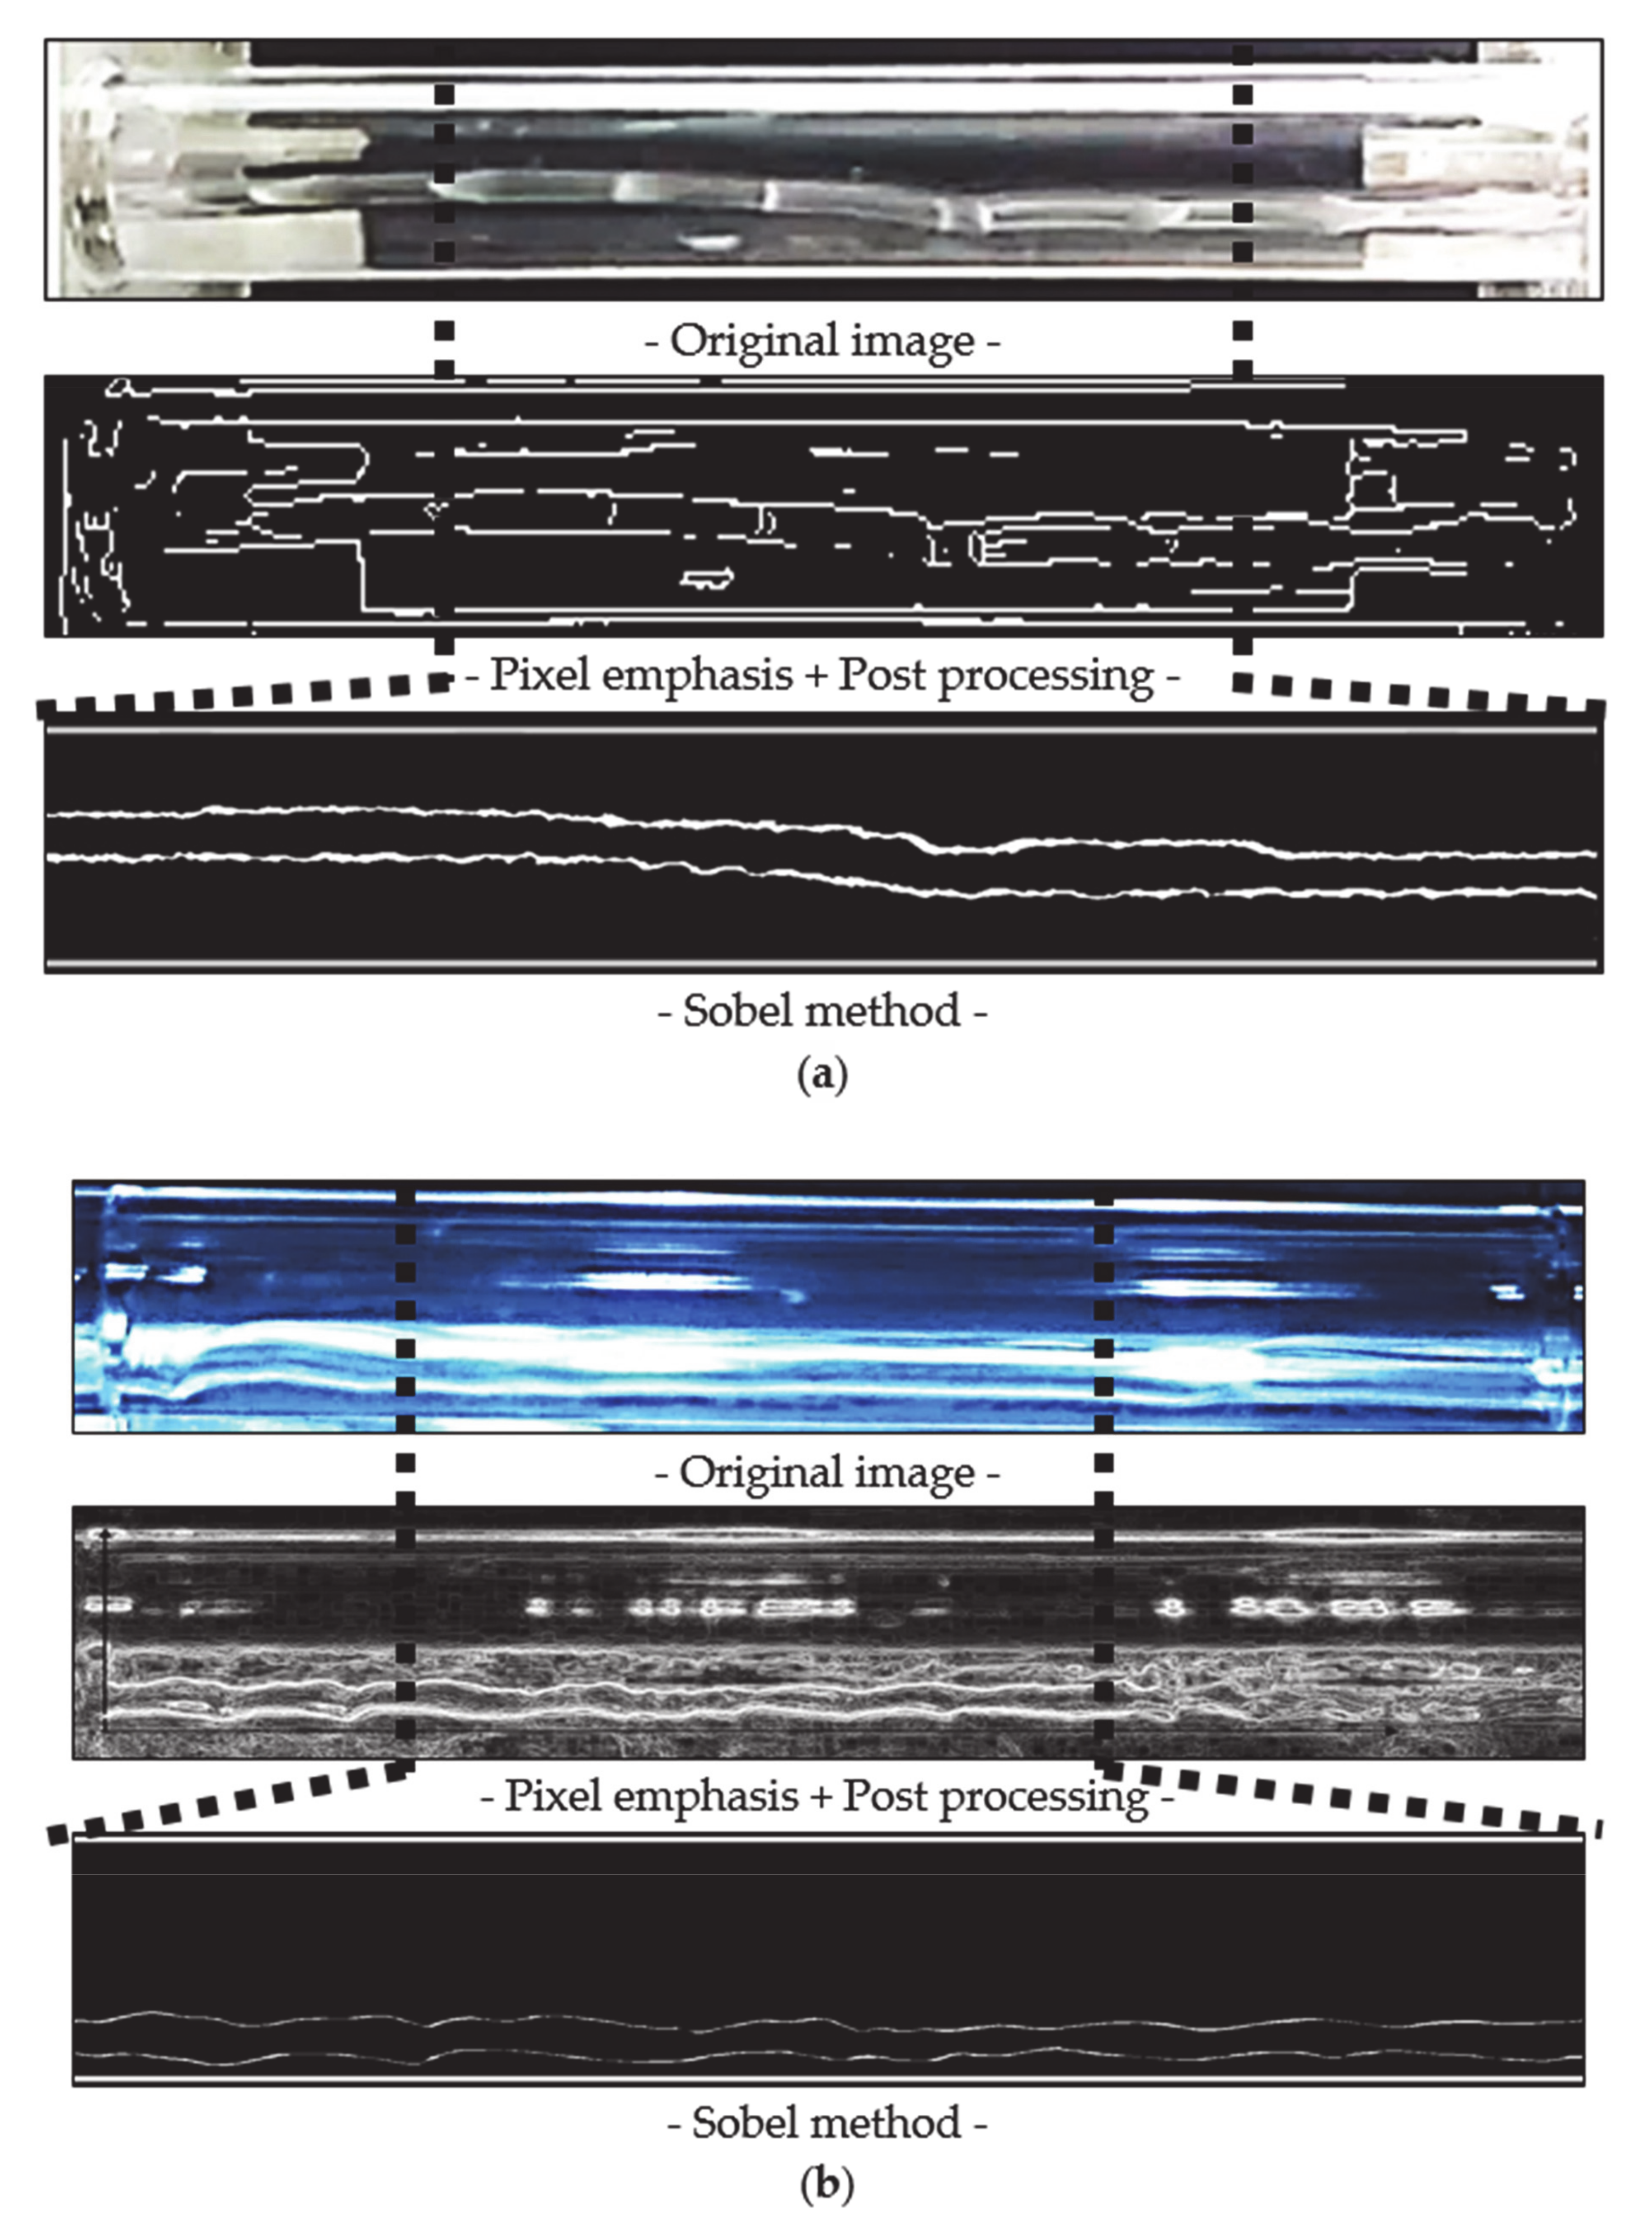
Figure 9.
Schematic of the evaporator shape.

Figure 10.
Point where super-heated state occurred with variable ambient temperature and two OTR conditions.
Figure 10.
Point where super-heated state occurred with variable ambient temperature and two OTR conditions.
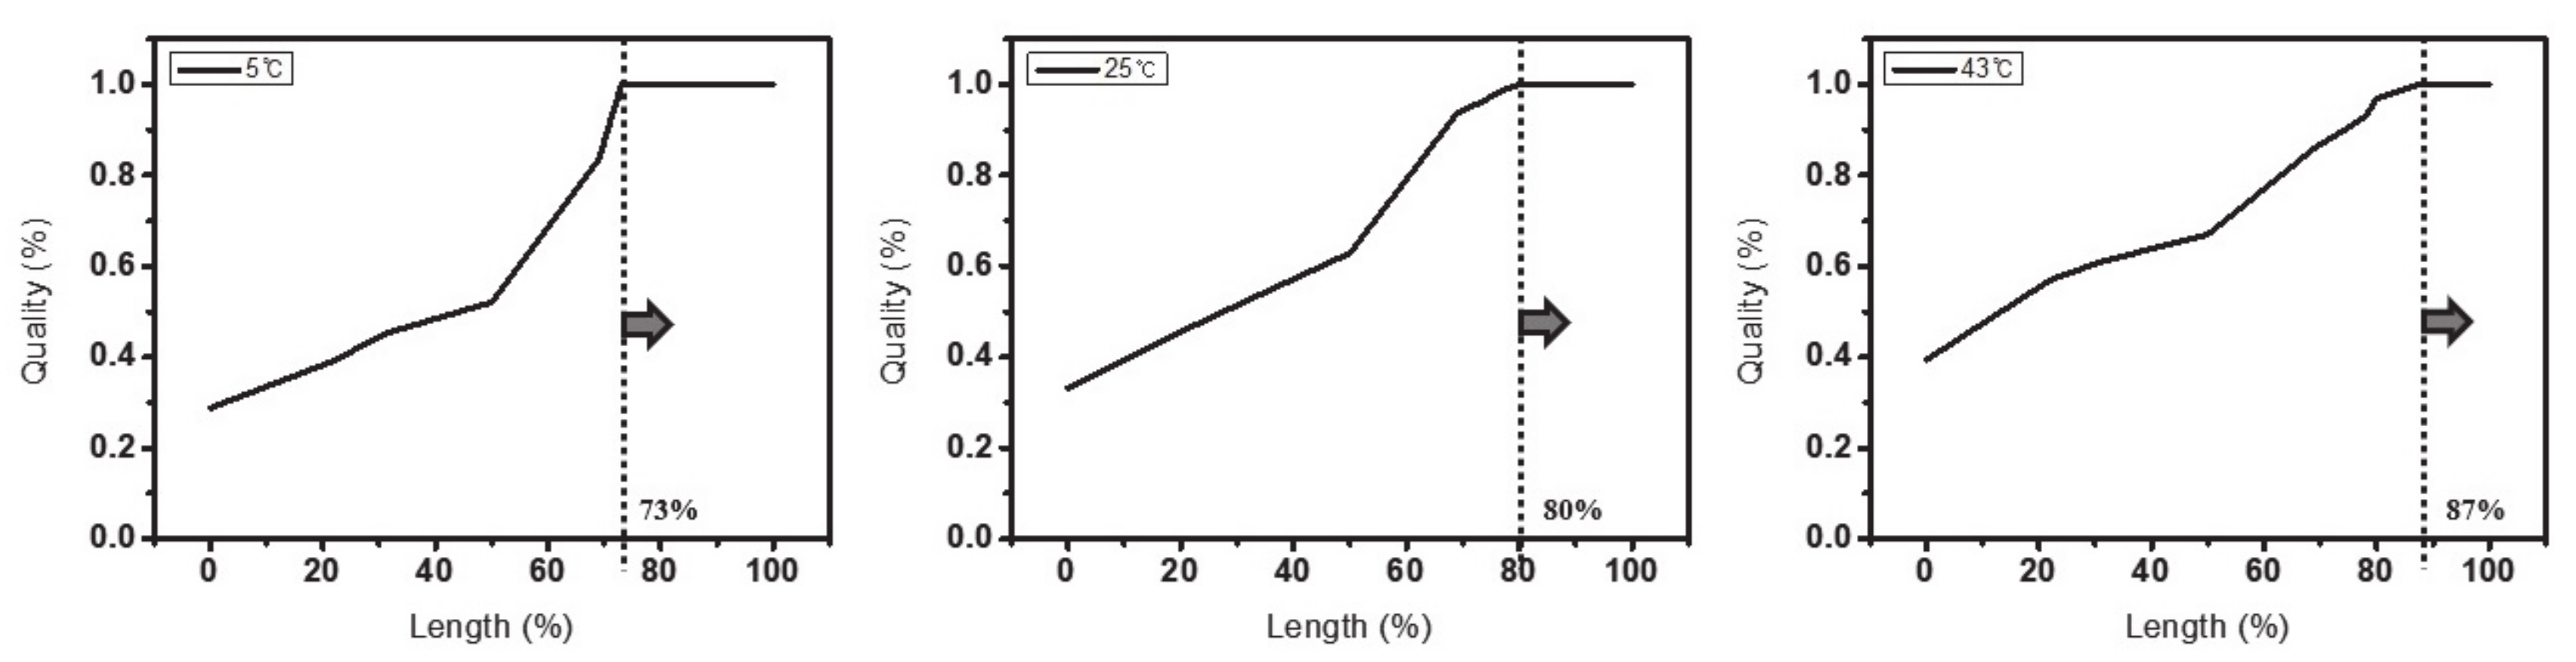
Figure 11.
(a) quality variation with evaporator size down; (b) Heat transfer amount per unit area with evaporator size down.
Figure 11.
(a) quality variation with evaporator size down; (b) Heat transfer amount per unit area with evaporator size down.

Table 1.
Standard ISO test condition.
| Condition | Year | Domains | Ambient Temp. | Fresh Food Temp. | Freezer Temp. |
|---|---|---|---|---|---|
| ISO 62552 | 2007 | International | 25 °C or 32 °C | 5.0 °C | −6.0 °C or −12.0 °C or −18.0 °C |
Table 2.
Results of visualization experiments in inlet and middle parts of evaporator.
| Ambient Temp. | Humidity | Inlet Part x | Middle Part x |
|---|---|---|---|
| 5°C | 50% | 0.288 | 0.521 |
| 25°C | 0.332 | 0.629 | |
| 43°C | 0.394 | 0.670 |
Table 3.
Accuracy of the quality experiments using the quality sensor at evaporator inlet part.
| Ambient Temperature | Humidity | Experimental Results | Sensing Results | Error (%) |
|---|---|---|---|---|
| 5 °C | 50% | 0.288 | 0.291 | 1.03 |
| 25 °C | 0.332 | 0.343 | 3.21 | |
| 43 °C | 0.394 | 0.408 | 3.43 |
Table 4.
Numerical models applied to simulation method.
| Refrigerants State | Numerical Model | |
|---|---|---|
| Fin efficiency correlations | Schmidt correlation [31] | |
| Air side heat transfer | Wang Chi Chang plate fin model [32] | |
| Refrigerant side heat transfer | Liquid-phase | Dittus Boelter model [33] |
| Two-phase | Thome TP evapo flow pattern-map [34] | |
| Vapor-phase | Dittus Boelter model [33] | |
| Air side pressure drop | Wang Chi Chang plate fin model [32] | |
| Refrigerant side pressure drop | Liquid-phase | Blasius type model [35] |
| Two-phase | Thome TP evapo flow pattern-map [34] | |
| Vapor-phase | Blasius type model [35] |
Table 5.
Accuracy of the quality simulation results within the evaporator middle part.
| Ambient Temperature | Experimental Results | Simulation Results | Error (%) |
|---|---|---|---|
| 5 °C | 0.521 | 0.545 | 4.61 |
| 25 °C | 0.629 | 0.647 | 2.86 |
| 43 °C | 0.670 | 0.680 | 1.50 |
Publisher’s Note: MDPI stays neutral with regard to jurisdictional claims in published maps and institutional affiliations. |
© 2021 by the authors. Licensee MDPI, Basel, Switzerland. This article is an open access article distributed under the terms and conditions of the Creative Commons Attribution (CC BY) license (http://creativecommons.org/licenses/by/4.0/).
Share and Cite
MDPI and ACS Style
Na, S.; Song, S.; Lee, S.; Lee, J.; Kim, H.; Lee, S.; Choi, G.; Ahn, S. Evaporator Optimization of Refrigerator Systems Using Quality Analysis. Energies 2021, 14, 555. https://doi.org/10.3390/en14030555
AMA Style
Na S, Song S, Lee S, Lee J, Kim H, Lee S, Choi G, Ahn S. Evaporator Optimization of Refrigerator Systems Using Quality Analysis. Energies. 2021; 14(3):555. https://doi.org/10.3390/en14030555
Chicago/Turabian StyleNa, Sangkyung, Sanghun Song, Seunghyuk Lee, Jehwan Lee, Hyun Kim, Sungwoo Lee, Gyungmin Choi, and Seongyool Ahn. 2021. "Evaporator Optimization of Refrigerator Systems Using Quality Analysis" Energies 14, no. 3: 555. https://doi.org/10.3390/en14030555
Note that from the first issue of 2016, this journal uses article numbers instead of page numbers. See further details here.