
Evolution of Hydropower Support Schemes in Poland and Their Assessment Using the LCOE Method


1
Faculty of Environmental Engineering and Energy, Politechnika Krakowska, Warszawska 24, 31-155 Kraków, Poland
2
Faculty of Management, AGH University of Science and Technology, Gramatyka 10, 30-067 Kraków, Poland
*
Author to whom correspondence should be addressed.
Energies 2021, 14(24), 8473; https://doi.org/10.3390/en14248473
Submission received: 10 November 2021
/
Revised: 10 December 2021
/
Accepted: 11 December 2021
/
Published: 15 December 2021
(This article belongs to the Special Issue Role of Hydropower for Sustainable Future Energy System: Synergies, Challenges and Development)
Abstract
:Hydropower as stable power installations play an important role among renewable energy sources. Yet, their share in renewable energy is small. Currently, it is only 10% of energy from renewable energy sources (RES), compared to 27% in 2010. Therefore, the aim of this paper is to assess the RES support schemes in Poland related to hydropower, such as green certificates, auctions and FIT, with the use of the Levelized Cost of Electricity (LCOE) analysis in order to determine which support scheme is best incentivizing hydropower development. The evolution of the hydropower support scheme in Poland is presented. The total LCOE and possible revenues from support systems for various segments of hydropower installations are graphically analyzed for two analysis periods (15 and 50 years) and for two discount rates (7% and 11.4%). The analysis shows the great importance of the support schemes in the profitability of the hydropower plants investments. The LCOE graphical analysis proves to be suitable for showing sensitivity analysis of capital and operating costs of various sizes of hydropower plants. The analysis shows that the LCOE in micro-power plants is usually higher than the support and revenues available in the green certificates or auctions or FIT schemes in Poland.
1. Introduction
Obligations in the field of energy policy of EU member states and the resulting ambitious plan for the development of energy based on renewable energy sources (RES) requires support from investors in order to increase the attractiveness of this type of investment ensuring its profitability [1,2]. The dynamic development of wind energy and photovoltaics brought a significant decrease in investment costs. Currently, in many countries, wind energy and photovoltaics offer prices that are already close to the market prices of electricity. However, a number of technologies, such as hydropower or biogas energy production, still require support as the costs of energy production are far higher than market prices. This is the first premise for differentiating support systems for individual RES technologies. The second reason for the different approach to different technologies is their role in the energy system. Energy production in wind and solar farms is highly variable over time and depends on weather factors. The energy system must be flexible and have the ability to balance production. Such a possibility is provided by hydroelectric power plants that can act as intervention producers and are also a RES. Hence, the policy of many countries is implemented in two sub-areas: (1) development of wind and photovoltaic energy as the cheapest and most willingly undertaken investments by investors, (2) development of stable RES (hydropower, biogas), but much more expensive to build. Due to the different level of actual costs of energy production and the structure of the energy system, as well as different visions of energy policy, the support systems for individual technologies should be different. There are a lot of schemes to support energy production from RES in Europe. The European Commission does not impose any solutions on the member countries and enables them a free selection of a support system. However, there is one condition, an applied system needs to be simple, efficient and cost-effective. Support schemes, which pose an operational support for producers of energy from RES, usually take the form of guaranteed tariffs (feed-in-tariff FIT and fit-in premium FIP), green certificates, auctions (tenders) and financial incentives (loans, subsidies, donations).
The EU countries implemented the development of RES technology in various ways, and the installed capacity was almost doubled (from 255 to 449 GW—an increase of 77%) in the last 10 years (Table 1). It was achieved mainly thanks to investments in wind installations (increase in capacity of 112%) and solar installations (287%), with a slight increase in the renewable capacity of hydropower of only 6% (Table 1).
The development of installed hydropower capacity exceeded 5% only in eight countries presented in Table 2 below, whereas in Poland the increase was approx. 3%. As countries can support the development of RES technologies in different ways, Table 2 presents the support mechanisms used in the countries that have achieved greater success in the development of hydropower than Poland (capacity increase above 5%).
The purpose of the support scheme is to provide conditions for the development of RES installations, and as a result, to achieve the targets set in the country’s energy policy and commitments to the increasing share of renewable energy in final energy production. FITs were widely used over the last dozen or so years. Their effectiveness has been proof of the increase in hydropower capacity in all countries mentioned in Table 2, but also above all, the very dynamic increase onshore installation capacity in many EU countries, e.g., in Germany and Spain.
In Poland, FITs were introduced only in 2019, previously from 2005, the main support scheme was a system of green certificates. The collapse of the green certificates’ market in 2012 forced the Polish government to introduce changes in the support scheme. From 2016, an auction system has been the main support mechanism. Auctions carried out in 2016–2018 revealed many deficiencies of the tender system, which was finally corrected and supplemented with feed-in-tariff (FIT) and fit-in premium (FIP) in 2019.
In this paper, Polish support mechanisms and their impact on the implementation of energy policy and on the efficiency and prospects of hydropower development are presented. For the assessment of efficiency of the support scheme, the Levelized cost of electricity method (LCOE) is used. LCOE is estimated and compared to prices and revenues obtained in different existing support schemes.
2. Materials and Methods
2.1. Development of Hydropower in Poland
In Poland, the initial slow but steady growth of energy production from RES was observed in the years 2010–2015. However, it decreased after the year 2015. As a consequence, in Poland, the share of electricity generation from RES does not keep up with the set policy goals and legal obligations [9,10]. According to the obligations of “Package 3 × 20%”, Poland should have achieved, by the year 2020, 15% share of RES in gross final energy consumption. However, by the year 2019, it was 12.2%. According to the country’s plans, presented in Table 3 below, the legal obligation of share of RES in electricity generation in the year 2019 was at the level 18.5% whereas, in reality, it reached 15.5% [9].
In this paper, the evolution of the hydropower support scheme in Poland is presented. The aim of the paper is to assess the RES support schemes in Poland related to hydropower, such as green certificates, auctions and FIT, with the use of the Levelized Cost of Electricity (LCOE) analysis.
Hydropower, despite its small share in renewable energy (currently it is only 10% of energy from RES, compared to 27% in 2010), plays a significant role, because these are installations with stable power, which are an important regulatory element during peak energy demand hours. This role is also taken into account in the country’s energy policy. In the current Polish Energy Policy of 2009 [14], the government envisaged the development of hydropower, which resulted in an increase in production in 2010–2020 by almost 30%, so as to reach the level of 3.2 TWh in 2020. It was assumed that the installed capacity of hydropower plants would grow from approx. 960 MW to 1135 MW in 2020 and ultimately to 1150 MW in 2030. Unfortunately, the unstable policy of supporting investments, coupled with the required high level of investment outlays, meant that investments in the hydropower sector have not increased at such a pace. Investments carried out in recent years allowed for the achievement of a capacity of approx. 968 MW at the end of 2019. The National Energy and Climate Plan for the years 2021–2030 developed in 2018 [12] and the Draft of The Energy Policy of Poland until 2040 [15] released in 2020 keep the development of hydropower at the level of 1150 MW in 2030 and 1230 MW in 2040. The increase in power from 968 MW to 1150 MW in the year 2030 and to 1230 MW in 2040 means the implementation of investments with a total capacity of 260 MW over 20 years (13 MW/year), while in the last 10 years only 36 MW were implemented (investment rate from the last 10 years is app. 4 MW/year). This means an almost 3-fold increase in investments. Therefore, for the assumptions to be realized, the investment supporting scheme in the hydropower sector must be much stronger than in the last 10 years.
2.2. Levelized Cost of Electricity
Levelized cost of electricity (LCOE) is a popular indicator, applied to assess economic efficiency of the electric energy production. The LCOE includes current costs and capital expenditures distributed into the entire life time of a project. Hence, LCOE is also a profitability limit price (so called break-even price), assuring coverage of all expenditures from sale of generated energy [16,17,18,19,20,21,22,23,24].
The LCOE is an average price, and it is calculated as a quotient of costs and effects expressed in a current value (discounted) [24,25,26,27]:
where
- average price of the electric energy in the time of the analysis,
- It
- capital expenditures in a year t,
- Ot
- operational expenditures in a year t,
- Et
- production of the electric energy in a year t,
- r
- discount rate (the weighted average cost of capital WACC),
- t
- time in years from 0 to n,
- n
- analysis period.
In addition, it is assumed for analysis purposes that capital expenditures are incurred in year 0, and the operational expenditures and energy production are constant. Consequently, the discounted totals: the sum of operational expenditures and the sum of generation volumes may be replaced with the formula for the present value of an annuity [28].
Capital and operational expenditures are frequently given as the cost per unit of installed capacity. Costs per unit are determined and used due among others to a strong correlation between the amount of capital and operational expenditures on the one hand and the installed plant power on the other hand. The annual volume of electric energy generated also depends on the installed capacity and operation time. The time of operation of a power plant within a year is known as the capacity factor in the literature on the subject and is usually given in time units (hours of operation in a year).
where
- M
- installed capacity [MW],
- CAPEX
- unit capital expenditures [EUR /MW],
- OPEX
- unit operational expenditures [EUR /MW],
- Cf
- capacity factor [h],
other, as above.
The equation may be simplified to obtain the following formula:
The last simplification is given by the following final formula for LCOE:
3. Results
3.1. Estimation of LCOE in Hydropower Plants in Poland
For needs of analyses, average values of unit capital expenditures were assumed (CAPEX) acc. to the draft of the Polish Energy Policy for 2040 [15]—the latest governmental publications regarding costs of RES investments (incl. hydropower). The data have been adjusted on the basis of the literature regarding the costs of hydropower to IRENA report [29] and data from Poland [15,22,30]. The data are broken down by power plant capacity: (1) till 1 MW—these are installations that can benefit from FIT, and installations with a capacity of up to 20 MW, which can benefit from the support system in the form of auctions divided into small and large power plants with significantly different construction and operating costs (2) up to 5 MW and (3) power above 5 MW. Minimal and maximal unit expenditures were adopted as 50% and 150% of the average cost. The values are presented in Table 4.
Annual unit operational expenditures (OPEX) are frequently defined as percentage of the capital expenditures. Typical expenditures fluctuate from 1% to 3% [29,30,31,32]. For micro, small and mid hydropower plants OPEX costs are assumed respectively 3%, 2.5% and 2% CAPEX. Minimal and maximal unit expenditures were adopted as 50% and 150% of the average cost (Table 5).
Other data required for the LCOE analysis are: the life time (or analysis period), the capacity factor and a discount rate. In the case of hydropower plants, the life time, that is the life of the installation, is very high and equals 40–100 years [33,34,35]. Since determination of the LCOE means, among other things, distribution of capital expenditures into the life time/analysis period, correct and conscious estimation of the analysis period (time) is very important. Acceptance of a period shorter than the life time is usually applied in order to calculate the price, which enables return from the investment in such a shorter time. For instance, an investor, who finances erection of a power plant from credit, with a re-payment term equal to 10 years, is interested in LCOE for 10 years. There will be LCOE analysis for selected periods: 15 years (the duration of public support) and 50 years (a life time).
The next important variable, which affects the LCOE, is the capacity factor reflecting the number of operation hours of a power plant in a year. Therefore, the variable describes the energy production output (and therefore, incomes of an investor). The capacity factor arises, from one hand, from natural hydrologic conditions and from the other hand, from a role played by power plants in a domestic electric-energy system (e.g., essential power plants, peak demand power plants, auxiliary power plants). In order to estimate the LCOE, the capacity factor was adopted at the level equal to 40% (3504 h annually).
A discount rate is the most frequently estimated as a mean cost of capital, and it depends on costs of sources of investment funds (a weighted average cost of capital WACC). Financing costs have a significant impact on the LCOE [36,37,38,39]. To compare, in analyses of various technologies, LCOE is often used as average capital cost of technology—usually at the level of 7–8%, e.g., in the latest reports, LCOE was used by IRENA at the level of 7.5% [29], and by NEA at the level of 7% [38], by the European Commission at the level of 7% [40]. In the national analysis commissioned by the Ministry of Energy [41], LCOE was indicated for all technologies using WACC at the level of 7% (without research on the cost of capital, the adopted value was 7% based on the NEA publication from 2015 [42]). However, assuming the same WACC for all technologies when calculating LCOE may result in significant errors because an average cost of capital varies according to technology and regions [36,43]. Bachner et al. analyzed the cost of capital in EU-28 member states plus Norway, Liechtenstein and Iceland. Analyzed countries were aggregated to four regions (Eastern Europe, Northern Europe, Southern Europe and Western Europe) and separately two countries (Austria and Greece) were analyzed [43]. WACC rates were estimated for eight technologies (including mean WACC) in a given region/country. From the point of view of regional variability, the lowest WACC rates estimated in Greece (mean WACC 4.8%) and the highest for the region of Western Europe—mean WACC 11.7%; for the region of Eastern Europe, WACC changes from 7.7% for Photovoltaics to 11.4% for Hydropower and Nuclear energy, with an average at the level of 10.3%.
In this paper, two WACC levels are implemented: 7.0% as used in the country governmental analyses and 11.4% as a real value for hydropower technology in the Eastern Europe region determined on the basis of current and extensive research across regions and technologies [43].
In summary, four variants of calculations will be carried out:
- For two periods of analysis: 15 and 50 years;
- For two discount rates: 7 and 11.4%.
Estimation of the LCOE was carried out on the basis of the formula (5) and the outcomes are presented in Table 6.
LCOE values were also calculated for the remaining CAPEX and OPEX values in the ranges appropriate for the analyzed types of hydropower plants. The results are shown in Figure 1 showing the LCOE calculations for the life time of 50 years. Horizontal and vertical axes demonstrate unit costs, accordingly, CAPEX and OPEX, while the LCOE is presented by means of colors in the diagram. On its left there is a legend assigning LCOE values to particular colors. The figure also shows three black frames, which illustrate the assumed ranges of CAPEX and OPEX for micro (<1 MW), small (1–5 MW) and medium (5–20 MW) hydropower plants.
The first (from the right side) purple fields in the diagram represents the LCOE below EUR 60/MWh—this level of LCOE can be achieved with CAPEX of less than EUR 2600/kW and correspondingly low OPEX. For example, for CAPEX of EUR 2000/kW, OPEX can be up to EUR 65/kW. This LCOE range can reach medium hydropower (>5 MW) where CAPEX is in the range of EUR 1200–2500/kW and the corresponding OPEX level. Small hydropower plants defined through the middle frame (1–5 MW) have little chance of achieving such LCOE values—their CAPEX and OPEX costs tend to be higher (av. CAPEX for small hydro is EUR 3200/kW). The range of SHP (1–5 MW) lies mainly in the blue fields (LCOE in the range of EUR 50–130/MWh). Micro hydropower plants (<1 MW) cannot reach LCOE below EUR 60/MWh—their CAPEX and OPEX ranges defined by corresponding black frames are outside the purple fields.
The next blue fields in the diagram pictures the LCOE of EUR 60–120/MWh—this level of LCOE can be achieved with CAPEX below EUR 5500/kW and correspondingly level of OPEX. For example, for CAPEX of EUR 4000/kW OPEX can be up to EUR 130/kW, in case of higher CAPEX for example EUR 5000/kW OPEX can be up to EUR 60/kW. This LCOE range can mainly be achieved by typical medium and small hydropower plants—frames (>50 MW) and (1–5 MW) representing their CAPEX and OPEX ranges are located on these blue fields. Micro hydropower plants (<1 MW) can also reach this LCOE level, but only with CAPEX and OPEX below their typical average values.
Micro hydropower plants (<1 MW) tend to reach LCOE levels of EUR 80–160/MWh (the blue and green fields) and in the case of CAPEX and OPEX levels above the averages the LCOE values may exceed EUR 120/MWh (the green fields).
However, the analyzed life span, 50 years, is not the time that investors take into account. Typically, investors analyze performance over a shorter period of time—closer to the actual expected payback period for the investment. The calculations for a period of 15 years are shown below and represent a much higher LCOE for all types of power plants.
In Figure 2, LCOE calculations are presented for an analysis period of 15 years.
As shown in the chart above, the LCOE values are about two times higher than previous. In this case, the medium hydropower plants mostly reach LCOE around EUR 100/MWh. Small and micro hydropower plants can achieve LCOE values of EUR 100–200/MWh—their CAPEX and OPEX ranges defined by the respective black boxes are almost in the blue and green fields.
The next figure (Figure 3) presents LCOE calculations for higher WACC value (11.4%) and two analysis periods (15 and 50 years).
For the lifetime of hydropower plants (50 years) for micro and small power plants, LCOE EUR 100–200/MWh is about twice as much as for WACC = 7%, where LCOE was in the range of EUR 60–120/MWh. Similarly, about 1.5 times higher values occur for the 15-year analysis period.
3.2. Evolution of RES Support System in Poland
3.2.1. Green Certificates
In Poland, from 2005 to 2015, the main support system was a system of transferable origin certificates, so called green certificates. In the green certificates system, producers of the electricity from renewable resources, apart from profits from sale of energy, acquire additional profits from sale of certificates of origin. Certificates of origin of the electric energy from RES are issued by the President of the Energy Regulatory Office (URE). Proprietary rights arising from the renewable energy certificates can be re-sold to energy companies, which are obliged to hold percentage-specified quotas of green energy in their annual electric energy sale. Instead of purchasing and cancelling the green certificates, it is possible to make a replacement fee, the amount of which is established by the President of the URE. Failure to perform this obligation results in a penalty imposed on a company. Quantitative share of the electric energy from the certificates of origin in sale of total electric energy is unstable, and it follows an adopted in an energy policy of the country, growing share of the RES in production of the final energy, which has been growing annually by 1%, from 12% in 2013 to planned 21% in 2021. Green certificates are traded at the commercial sessions and at non-session transactions at Towarowa Giełda Energii S.A. (TGE S.A.). The system of green certificates has functioned in Poland since 2005. At the preliminary time, their prices were similar to the amount of a unit replacement price. However, from 2012, the situation has changed because of over-supply of the certificates in the market and implementation, since 2016, of a new auction system intended to support the RES (prices from last years are presented in Figure 4).
Prices of the green certificates stayed at the level of the replacement fee only at the initiation of the system, until January 2012. In 2012, prices started to drop. In particular, rapid drops were observed from July 2012, and in January 2013, the certificates of origin were sold at a price equal to EUR 25/MWh. In subsequent months, the prices have been gradually going up to EUR 58/MWh, but they still fluctuated a lot. In the following years, 2014–2017, a regular price drop took place, up to the EUR 6/MWh level. Collapse of prices at the certificates market from 2012 to 2017 was caused by many factors, mainly by:
- Significant investments and growth of an installed power of the RES installations, in particular, wind power plants and bio-mass power plants;
- In 2012–2015 there was too low growth of obligatory share of the green energy in total annual sale of the electric energy (in 2012—10.4%; 2013—12.0%; 2014—13.0%, 2015—14.0% [44]), while, after investments made recent years, the production capability of the RES installations gained the level in: 2012—13.2%; 2013—13.3%; 2014—15.3%; 2015—17.7% [45];
- The effect of uncertainty in the market of green certificates caused by amendments of the law (the draft in subsequent versions was presented to the public by the Ministry of Economy in 2011–2014), the final draft was submitted to the Sejm in July 2014, in subsequent versions it was planned to introduce FIT tariffs and auctions of green certificates instead of tariffs.
The most severe crisis in the market of green certificates exploded after the Act on the RES [46] came into force. The Act implemented the auction scheme as the main RES support tool. In particular, it is observed since mid-2016, when prices of the certificates went down to a low level not exceeding EUR 10 /MWh, e.g., at the TGE session dated 29 June 2017 the lowest price was EUR 5.3/MWh.
3.2.2. System of Auctions
As mentioned above, the Act on the RES [46] established the auction system in 2015. In the framework of this solution, owners of the RES installations sell manufactured electric energy at auctions, which are attended by energy companies and other entities obliged to keep the required level of the green energy in total sale of electric energy. Auctions are organized by the President of the URE (URE = Energy Regulatory Office), where bidders–manufacturers of RES energy submit their bids including price and quantity of manufactured energy for a time equal to 15 years. The system in question has one advantage, which the system of the green certificates was deprived of, namely, this is the support stability. A price guarantee for 15 years assures “companies a long-term security necessary to make investments in the renewable energy sector” [47,48], and such requirements are imposed by the European Union’s regulations in this field. Auctions are divided into separate baskets and the baskets give consideration to the size of an installation (separate auction for small installations of capacity ≤1 MW and larger installations, of installed power >1 MW), as well as the type of installation (separate auctions for energy manufactured in installations using an agricultural biogas only, and installations, which produce energy in a stable and predictable way). Offers of manufacturers must meet certain requirements set out in the Law [46] and the offered price must not exceed the referential price. Moreover, announcements concerning auctions include quantitative and amount limits arising from the annual Ordinance of the Board of Ministers on maximal quantity and value of the electric energy from renewable sources of the energy, which can be sold at an auction in a particular year. Referential prices for main certain RES installations are presented in Table 7.
The first auctions, announced and conducted in 2016, were to concern more than 7300 GWh (total in four baskets); however, the number of offers satisfied just 38% of this amount. Just in the framework of one of the baskets (auction no. 3/2016 comprising bids of photovoltaic and wind power plants), energy producers submitted more bids than permitted by the ordinance quantity of the energy to be sold, in the framework of this auction. In addition, the auction for installations consuming agricultural biogas, of power exceeding 1 MW, did not take place because the number of bids was too small (smaller than 3). The remaining two auctions, for the energy from the agricultural biogas, from installations of power not exceeding 1 MW, and auction no. 4/2016 including small hydropower plants, could not be called auctions since the no. of bids was too small; they satisfied accordingly 39% and 32% of estimated energy volume, so all the bids were accepted. In June 2017, two other auctions took place. The situation observed in 2016 repeated itself. The auction 1/2017 attended by wind power plants and photovoltaic power plants was a subject of great interest; the quantity of the energy offered at the auction exceeded the one permitted by the ordinance, so bids needed to be competitive. In turn, the second auction, attended by owners of hydropower plants satisfied the quantity limit only to the 21% extent. In 2018, 13 auctions were organized, but seven of them did not have enough bidders. Offers in total met around 30% of volume announced. Hydropower could take part in two auctions for small capacities up to 1 MW (auctions did not take place due to the lack of offers) and one auction for capacity above 1 MW (the amount of energy offered at 15% of the allowable quantity in the auction). Results regarding the quantity of energy sold at the auctions are demonstrated in Table 8.
The course of auctions, and more accurately, insufficient no. of bids at certain auctions, which resulted in a situation where bids are not competitive, obviously affected prices obtained at these auctions. Prices at auctions “without competition”, that is bids at auctions concerning agricultural biogas installations and hydropower plants, reached prices higher compared to the bids at the auction which was attended by wind and photovoltaic power plants. Prices were presented in Table 9.
Prices reached in the auctions in years 2016–2018 by owners of the hydropower plants equal EUR 70–110/MWh, and they are 70–170% higher than the average market electricity price, which was approx. EUR 40/MWh in the period of 2016–2018. The price of energy in 2019 was much higher approx. EUR 57/MWh [56], in such market conditions, the prices achieved at the auction are not so favorable.
Despite the greater profitability in the auction system compared to the system of green certificates, few entities took part in the auctions. A significant reason for the limited share of hydropower plants at the auctions in 2016 and 2017 is a requirement worded “capacity factor exceeding 3504 MWh/MW/year”. It means that a power plant must use the installed power at 40% of its capacity level (quantity of energy possible to be manufactured from 1 MW of its power for 365 days a year and 24 h during a day & night cycle is 8760 MWh). As mentioned above, to a large extent, because of hydrologic conditions, hydropower plants use installed power at the level of 35% (an average for 2005–2015; max. in 2010—42%, min. in 2015—29%). Penalties for failure to utilize the power, a smaller quantity of manufactured energy, were serious at 50% of the offered price; for instance, a manufacturer, who won an auction with the price equal to EUR 100/MWh, in case of failure to satisfy the utilization of the power, pays EUR 50 per every 1 MWh of non-manufactured energy.
Experiences arising from previous auctions, showing imperfections of the auction system, made the Ministry of Energy prepare a novelty of the Act on the RES (in 2017), which aims, among others, to take into account the dependency of the hydropower plants on a hydrologic situation. Presently, failure to meet the condition of minimal energy utilization factor resulted in serious penalties, and they were not imposed only in the event of a natural disaster in the meaning of the Act on natural disasters [57]. Unfortunately, the Act in question defines natural disaster very restrictively which means, that from the moment it was passed (2002), the natural disaster emergency has never been announced despite the fact that droughts, which heavily affected the possibility to manufacture the energy, occurred three times since then. According to amendment of the Act on the RES [46], the owner of the hydropower plant, entering into an auction, will declare the capacity factor (higher or not higher than 3504 MWh/MW/year), but after verification of the real power utilization factor, it is possible to take into account the occurrence of “changes in hydrologic flow, exceeding 25% of an average flow from a multi-annual period (SSQ), confirmed by hydrologic data of the Institute for Meteorology and Water Management”. It means that announcement of a natural disaster is no longer a necessary condition; occurrence of small flows, confirmed by the mentioned Institute, will be enough.
At 39 announced auctions, tenders were held at 20 auctions and hydropower plants entered 3 auctions in years 2016–2018. From 2019, also as a result of an analysis of the attractiveness of support systems for hydropower, another amendment to the law was initiated, which resulted in the implementation of another support tool—feed-in tariffs.
3.2.3. Guaranteed Tariffs
The second change in the governmental amendment of the Act on the RES [46], substantial for owners of small hydropower plants, is the implementation, apart from the auction system, of an additional supportive tool in the form of guaranteed tariffs (feed-in-tariff FIT and fit-in premium FIP). Owners of micro hydropower plants (capacity up to 50 kW or 50–500 kW) will be able to sell manufactured energy at a regular price equal to 80% of the referential price without entering into the auction’s system. Owners of such installations, in order to sell the energy, must submit a sale declaration to the President of the URE and meet the requirements defined in the Act. A guaranteed price equals 80% of the referential price and acc. To the data presented in Table 7 equals to EUR 102 in 2018–2019. This price is lower than the maximum and average prices (EUR 112 and EUR 108) obtained at the auction in 2018.
Poland is one of a few EU countries which have not implemented a system of guaranteed tariffs. The guaranteed tariffs systems (FIT and FIP) are a commonly applied model of operational support in the European Union’s countries. In 2005 the guaranteed tariffs were applied in 18 Union’s countries, while the green certificates in 7 countries [58]. As mentioned above, stable, long-term support in the form of guaranteed prices resulted in rapid growth of share of the RES (mainly wind power plants, photovoltaics plants and biomass powered power plants) in total production of the electric energy in Germany, Denmark and Spain. Presently, member countries, on the basis of the European Commission’s recommendations regarding public aid in the field of RES [59,60] are giving up guaranteed tariffs (they will be left only for micro and small installations of power not exceeding 500 kW) and promote such market instruments as auctions or other tender procedures.
The implementation of the FIT/FIP feed-in tariff system resulted in the fact that every year investors build several micro-power plants of this type (Table 10).
After implementation of additional FIT tariffs system, Poland has support schemes, which should stabilize the situation in the RES energy market, decrease the investment risk and consequently, translate into the development of investments in this field. In justification of the Act, it was written that proposed solutions are made in order to support, among others, the hydropower sector: “proposed new regulations concerning FIT and FIP contribute to performance of goals in Strategy for Responsible Development” [62]. In the field of hydropower, new regulations will enable performance of a strategic project meaning “increase in utilization and development of the hydro-energy industry, by elimination of administrative barriers in the area of the hydropower sector, development of the industry manufacturing devices for needs of the water energy and management or re-construction of existing dams owned by the treasury, for needs of production of the electric energy” [63].
3.3. Evaluation of Support Systems Using LCOE
Based on the above analysis, the LCOE diagram is presented to compare support schemes. The spotted lines depict potential income from the three support schemes:
- green certificates, income at the level approx. EUR 87/MWh (market energy price EUR 57/MWh (2019) + price of green certificates EUR 30/MWh),
- the average price from auction system (2018): EUR 108/MWh,
- guaranteed prices FIT: EUR 102/MWh.
The calculated LCOE costs (indicated by the black frames) is compared with the possible revenues from particular support schemes (the colored spotted lines illustrating the level of incomes that can be achieved in systems of: green certificates—green line, auctions—yellow and FIT—red) in Figure 5.
All support systems are very attractive for medium-sized power plants—the rectangle showing this type of power plant marked “>5 MW” lies mainly in the purple and navy blue field, which shows the LCOE cost at the level of 40 to 80 EUR/MWh. The “>5 MW” rectangle lies almost entirely to the right of the lines representing all support systems—so medium-sized power plants have LCOE below the support offered by all systems. This means that an investor using the green certificate system or auctions (FIT is not available for medium-sized power plants) generates profits (revenues exceed both operating and investment costs).
Small power plants, the rectangle showing this type of power plant marked “1–5 MW” lies mainly in the blue and navy blue field, which shows the LCOE cost at the level of 60 to 120 EUR. The rectangle “1–5 MW” lies halfway to the right of the lines depicting all support systems. This means that an investor using the green certificate or auction scheme (FIT is not available for small power plants) can profit if his CAPEX is below EUR 3700/kW and OPEX is sufficiently low as shown in the figure below:
- Figure 6a for CAPEX EUR 3700, OPEX can be at most at the level of EUR 40, but with a lower construction cost, e.g., EUR 3200, OPEX even at the level of EUR 77 still ensures LCOE on the border of revenues from green certificates (87 EUR/kW);
- Figure 6b for CAPEX EUR 4700, OPEX can be at most at the level of EUR 40, but with a lower construction cost, e.g., EUR 4000, OPEX even at the level of EUR 92 still provides LCOE at the limit of revenues from the auction (108 EUR/kW).
Micro power plants—the rectangle showing this type of power plant labelled “<1 MW” lies mainly in the green and blue boxes which show the LCOE cost between 80 and 160 EUR. Only a small part of this rectangle lies to the right of the lines showing all support systems. This means that the LCOE in micro-plants is usually higher than the support/revenues available in the green certificates/auctions/FIT system. For example, an investor may profit if his CAPEX and OPEX are sufficiently low as shown in the figure below:
- Figure 7a for CAPEX EUR 4400, OPEX can be at most at the level of EUR 60, but with a lower construction cost, e.g., EUR 4000, OPEX even at the level of EUR 90 still provides LCOE at the limit of revenues from the auction (108 EUR/kW);
- Figure 7b for CAPEX EUR 4000, OPEX can be at most at the level of EUR 60, but with a lower construction cost, e.g., EUR 3000, OPEX even at EUR 135 still ensures LCOE on the border of revenues from FIT (102 EUR/kW).
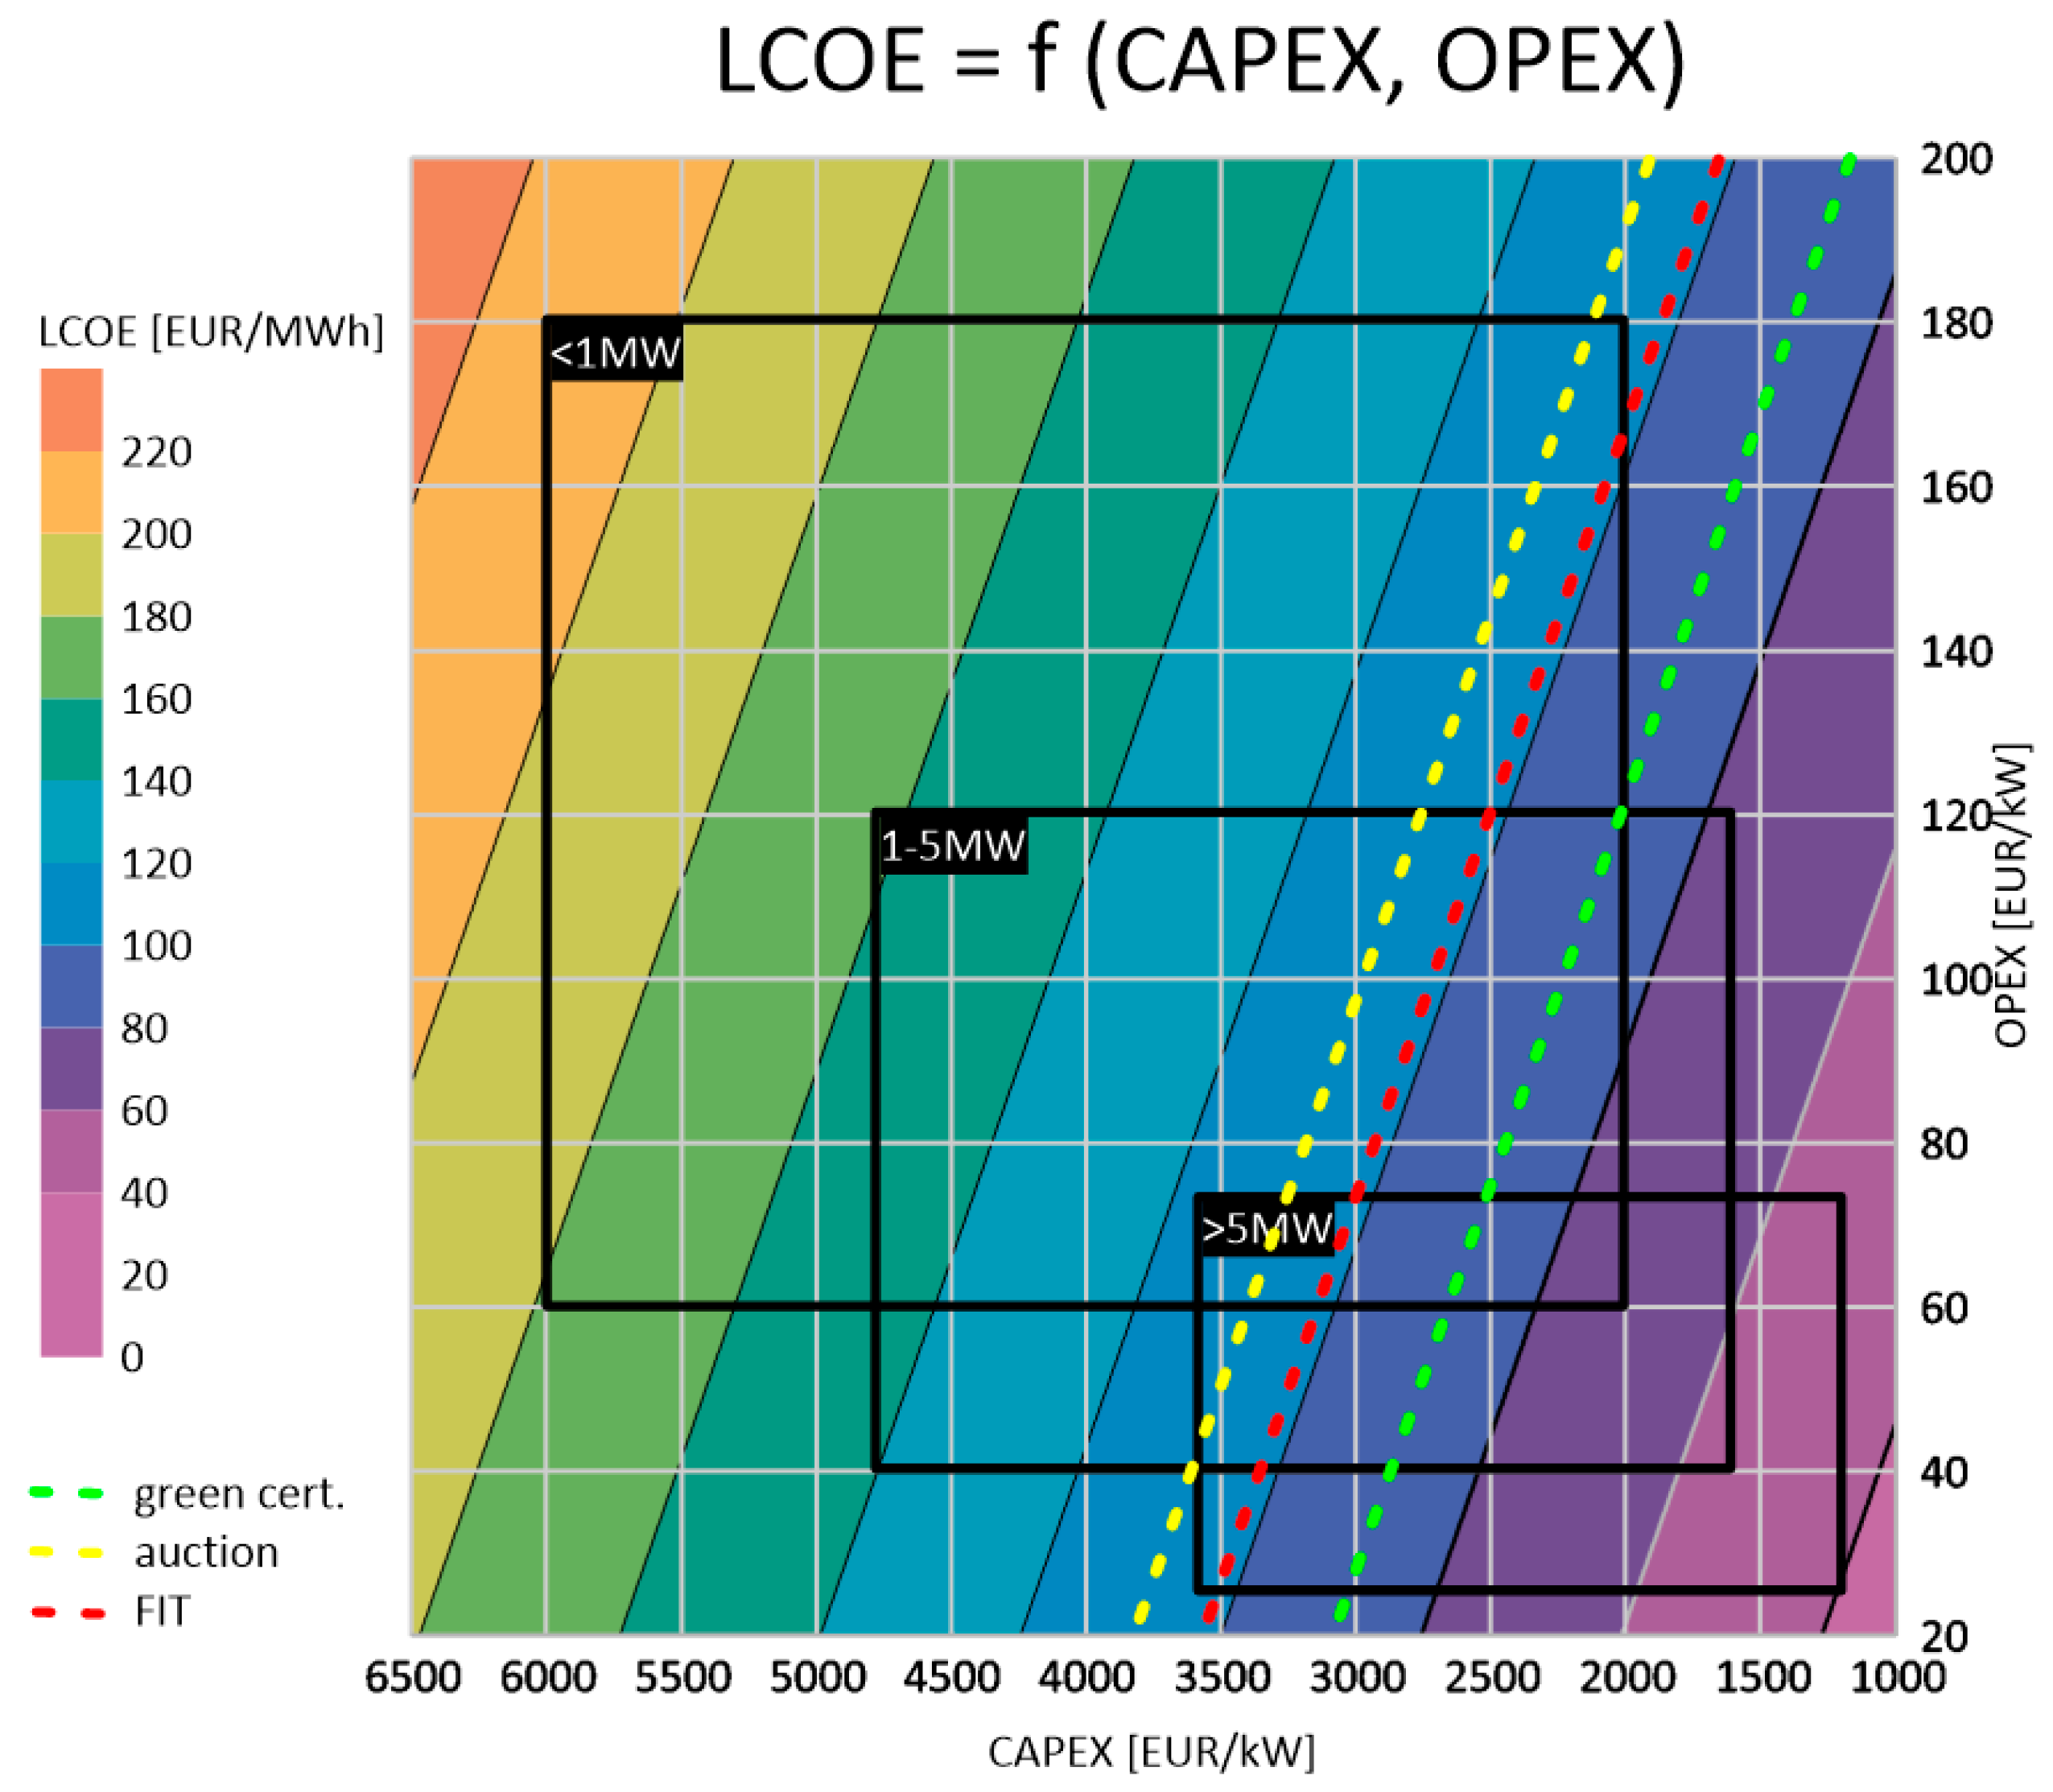
Results presented in Figure 5, Figure 6 and Figure 7 and discussed above show the total cost distributed into 50 years, which is a case when an investor gets the capital back within such time. However, typically if an investor expects a return on investment within a shorter period of time, then LCOE is much higher. In Figure 8, there are calculations of the total cost of energy production LCOE in case of return from the investment in the time period of 15 years, which corresponds to the duration of the support—all systems provide support only for this period.
Shortening of the analysis time, which means for an investor the shortening of the capital return time up to 15 years, results in a substantial increase in the LCOE. Micro and small hydropower plants hardly have the ability to reach this level of LCOE. This means that these investments have no chance of returning on investment in such a short period; they would have to be built at a cost lower than EUR 3000/kW and then operated at a sufficiently low OPEX cost (e.g., for CAPEX EUR 2500, OPEX must be less than EUR 105 in the auction system and EUR 85 in the FIT system).
Therefore, recently another change in the support systems has been proposed—extending the support period from 15 to 20 years for the hydropower sector, which would increase their attractiveness for investors and encourage them to undertake these costly and long-paying investments.
Figure 9 shows the LCOE for the 20-year period and the 7% rate.
It can be observed that the situation of small power plants 1–5 MW has significantly improved. In the auction system, there is more than half of the rectangle representing the CAPEX and OPEX usually occurring in this type of power plants. In terms of micro-power plants—still only the cheapest-built and operated installations would have LCOE below the level of revenues in FIT systems and auctions. Most of the investments in micro power plants would be unprofitable, which shows how the construction of support systems is very important in promoting this type of power plant.
4. Discussion
The Act on Renewable Energy Sources dated 20 February 2015 implemented a new operating support system for the RES industry. The first auctions, which were held in 2016–2018 resulted in many positive and negative effects in the RES market. Total collapse took place in the market of green certificates—their price dropped to the EUR 5/MW, which probably will cause total outflow of investors from this support system. For the hydropower sector, the new auction system has not turned out to be an advantageous solution, despite prices at the auction assure profitability of investments (averagely EUR 90/MW). Auctions were attended by 10–15% of hydropower plants only; a probable barrier was requirements that were too restrictive concerning the capacity factor. Experiences from first auctions made that the Ministry of the Energy prepared an amendment of the Act on the RES, which aims to mitigate the afore-mentioned barrier, and to implement a new system of support—guaranteed tariffs FIT and FIP for micro and small hydropower plants. Although the FIT scheme brings less revenues to the hydropower plants energy providers, it is more stable and thus reliable for the investors. The low attendance in the auctions shows a barrier in using this scheme for the hydro energy sector.
Evaluation of different policy frameworks and support mechanisms to promote the penetration of renewable energy technologies into the energy mix of a country is widely analyzed in the literature, e.g., [64,65,66]. Defects of the mechanisms and recommendations for the viability of the processes are proposed in a case-by-case manner depending on the country, the RES type and technology. For example, the effectiveness of auctions in India can be improved by ensuring competition, improving transmission infrastructure, providing payment guarantees, using pay-as-bid auctions, including stringent penalties for delays, and introducing auctions in a controlled manner [66]. In the case of FIT scheme, analyzed in relation to photovoltaics, Pyrgou et al. observed that for the prevention of the collapse of the scheme, the tariff’s value ought to be determined by each country’s government based on a set of influencing factors including the operational, capital and investment costs of each renewable energy technology [64]. This view is supported also by the conclusions reached after the analyses in this paper.
It is worth emphasizing that the experience of EU countries and also countries outside the EU shows that in the development of small hydropower plants, the support system based on FIT can bring rapid and significant capacity development, e.g., Vietnam, Malaysia, Turkey have achieved capacity growth at FIT supported renewable hydropower in the period 2000–2019 more than 5 times, 4 times and 2.5 times, respectively [3,67].
Another aspect that strongly influences the contemporary structure of the RES sector in Poland, namely limited development of hydropower with a significant increase in the use of solar and wind energy, is certainly the environmental impact of the RES installations. Many researchers emphasize that hydropower has a serious direct negative environmental impact related to the implementation and operation of hydropower plants, in particular those related to the construction of reservoirs [68,69,70,71]. Frey and Linke emphasize that, apart from the criterion related to renewability, sustainability is very important and it should be taken into account in public support systems for particular technologies [68]. In addition, the analyses of Pata et al. [72,73] and Bildirici and Gökmenoğlu [74] show that hydropower energy consumption may also increase environmental pollution. Therefore, despite the fact that hydropower is classified as a renewable energy source, many countries support and will promote other, more sustainable, non-consumptive technologies, such as PV and wind power plants.
Total LCOE, including capital expenditures and operational expenditures estimated for the 15-year return period and the capital cost at 8.6% level, shows that investments in micro and small hydropower plants can be attractive for investors, however, exclusively in a stable operational support system. Small and micro hydropower plants, of capacity below 1 MW have a total LCOE above EUR 100/MWh. Such price levels can be obtained at auctions, but there were also a few auctions with lower prices. For sure, the implementation of guaranteed prices established in 2018 will increase the share of existing hydropower plants in the support systems as well as contribute to new investments in the hydropower sector.
5. Conclusions
The analysis shows the great importance of the support schemes in the profitability of the hydropower plants investments. The support scheme is, in fact, the key and crucial factor when it comes to the decision-making concerning such investments.
The example of Poland shows that rapid changes in support systems may stop the development of investments, and that not all solutions can be used for small-scale investments. For instance, the auction system with a complex application system did not work for micro hydroelectric plants and only the introduction of additional FIT and FIP brought interest in this type of investment. Moreover, it was adverse to treat different technologies equally in the certificate system and in the auction system (common auction baskets, little differentiation of reference prices) because they have completely different investment costs and energy production costs.
The paper presents LCOE calculations for the hydropower sector with reference to the offered support schemes (certificates, auctions and FIT tariffs) for various discount rates and analysis periods. The LCOE graphical analysis proves to be suitable for showing sensitivity analysis of capital and operating costs of various sizes of hydropower plants.
This type of analysis can be used for the construction of support schemes, in particular for determining the levels of support for FIT rates, reference prices, as well as periods of financial support.
The analysis shows that the LCOE in micro power plants is usually higher than the support and revenues available in green certificates or auctions or FIT schemes constructed and defined for Poland. When it comes to micro power plants, only the cheapest-built and operated installations would have LCOE below the level of revenues in FIT systems and auctions. This means that most of them would be unprofitable and support systems are very important in promoting this type of RES power plants. Especially when they are playing an important role in the RES mix due to their stability as in-grid energy providers. Therefore, the functioning schemes need to be improved in order to provide more incentives for the investors of this particular RES.
Author Contributions
Conceptualization, I.G. and A.D.; methodology, I.G. and A.D.; formal analysis, I.G. and A.D.; data curation, I.G.; writing—original draft preparation, I.G.; writing—review and editing, I.G. and A.D.; visualization, I.G.; funding acquisition, I.G. All authors have read and agreed to the published version of the manuscript.
Funding
The study was financed under R&D funds of Department of Geoengineering and Water Management, Cracow University of Technology.
Institutional Review Board Statement
Not applicable.
Informed Consent Statement
Not applicable.
Data Availability Statement
Not applicable.
Conflicts of Interest
The authors declare no conflict of interest. The funding sponsors had no role in the design of the study; in the collection, analyses, or interpretation of data; in the writing of the manuscript, or in the decision to publish the results.
References
- European Parliamen; Council of the European Union. Directive (EU) 2018/2001 of the European Parliament and of the Council of 11 December 2018 on the promotion of the use of energy from renewable sources. Off. J. Eur. Union 2018, 328, 82. [Google Scholar]
- Communication from the Commission. Guidelines on State Aid for Environmental Protection and Energy 2014–2020; European Commission: Brussels, Belgium, 2014; p. 55. [Google Scholar]
- IRENA. Country Profiles. Available online: Irena.org/Statistics/View-Data-by-Topic/Renewable-Energy-Balances/Country-Profiles (accessed on 13 August 2021).
- Council of European Energy Regulators. Status Review of Renewable Support Schemes in Europe for 2016 and 2017; Public Report; Council of European Energy Regulators: Brussels, Belgium, 2018. [Google Scholar]
- Poullikkas, A.; Kourtis, G.; Hadjipaschalis, I. An overview of the EU Member States support schemes for the promotion of renewable energy sources. Int. J. Energy Environ. 2012, 3, 553–566. [Google Scholar]
- Legal Sources on Renewable Energy. Available online: http://www.res-legal.eu/search-by-country/ (accessed on 31 July 2021).
- Tomczyk, P.; Wiatkowski, M. Challenges in the Development of Hydropower in Selected European Countries. Proceedings 2020, 51, 8. [Google Scholar] [CrossRef]
- Adachi, M.; Metzger, M.; Wu, J.P.; Sproll, M.; Teipen, C.; Truger, A.; Wissen, M.; Zimmer, R. Success and Failure of Renewable Energy Policies in the EU: A Comparative Study of Bulgaria and Poland; Berlin School of Economics and Law. Work. Pap. 2020, 131, 2020. [Google Scholar]
- Local Data Bank. Statistics Poland, Warsaw, Poland. Available online: https://bdl.stat.gov.pl/ (accessed on 29 August 2021).
- Ordinance of the Minister of Energy Dated 11 August 2017 on the change in the quantitative share of the total electricity resulting from permanent certificates of origin confirming the production of electricity from renewable energy 2018–2019. Dz.U.2017.1559.
- Energy 2021. Statistics Poland, Warsaw, Poland. Available online: https://stat.gov.pl/en/topics/environment-energy/energy/energy-2021,1,9.html (accessed on 29 August 2021).
- National Energy and Climate Plan for the years 2021–2030. Ministry of Climate and Environment, Warsaw, Poland. Available online: https://www.gov.pl/web/klimat/national-energy-and-climate-plan-for-the-years-2021-2030 (accessed on 20 November 2020).
- Energy from Renewable Sources in 2019. Statistics Poland, Warsaw, Poland. Available online: https://stat.gov.pl/en/topics/environment-energy/energy/energy-from-renewable-sources-in-2019,3,12.html (accessed on 29 August 2021).
- Polityka Energetyczna Polski do 2030 Roku (Polish Energy Policy until 2030). Ministry of Climate and Environment, Warsaw, Poland. Available online: https://www.gov.pl/web/klimat/polityka-energetyczna-polski-do-2030-roku (accessed on 20 November 2020).
- Draft of Polish Energy Policy until 2040. Ministry of Climate and Environment, Warsaw, Poland. Available online: https://www.gov.pl/web/klimat/projekt-polityki-energetycznej-polski-do-2040-r (accessed on 20 November 2020).
- Martín, H.; Coronas, S.; Alonso, À.; de la Hoz, J.; Matas, J. Renewable Energy Auction Prices: Near Subsidy-Free? Energies 2020, 13, 3383. [Google Scholar] [CrossRef]
- Trypolska, G. Support Scheme for Electricity Output from Renewables in Ukraine, Starting in 2030. Econ. Anal. Policy 2019, 62, 227–235. [Google Scholar] [CrossRef]
- Aldersey-Williams, J.; Broadbent, I.D.; Strachan, P.A. Better Estimates of LCOE from Audited Accounts—A New Methodology with Examples from United Kingdom Offshore Wind and CCGT. Energy Policy 2019, 128, 25–35. [Google Scholar] [CrossRef]
- Liu, Y.; Li, F.; Yu, X. Gas Supply, Pricing Mechanism and the Economics of Power Generation in China. Energies 2018, 11, 1058. [Google Scholar] [CrossRef] [Green Version]
- Castro-Santos, L.; Silva, D.; Bento, A.; Salvação, N.; Guedes Soares, C. Economic Feasibility of Wave Energy Farms in Portugal. Energies 2018, 11, 3149. [Google Scholar] [CrossRef] [Green Version]
- Stegman, A.; de Andres, A.; Jeffrey, H.; Johanning, L.; Bradley, S. Exploring Marine Energy Potential in the UK Using a Whole Systems Modelling Approach. Energies 2017, 10, 1251. [Google Scholar] [CrossRef] [Green Version]
- Godyn, I.; Potocki, A.; Indyk, W. Poland’s Hydropower: Current Status and Future Prospects. In Proceedings of the 2015 3rd International Renewable and Sustainable Energy Conference (IRSEC), Ouarzazate, Morocco, 10–13 December 2015; pp. 1–6. [Google Scholar] [CrossRef]
- Ouyang, X.; Lin, B. Levelized Cost of Electricity (LCOE) of Renewable Energies and Required Subsidies in China. Energy Policy 2014, 70, 64–73. [Google Scholar] [CrossRef]
- Liu, Z.; Zhang, W.; Zhao, C.; Yuan, J.; Liu, Z.; Zhang, W.; Zhao, C.; Yuan, J. The Economics of Wind Power in China and Policy Implications. Energies 2015, 8, 1529–1546. [Google Scholar] [CrossRef] [Green Version]
- Hwang, S.-H.; Kim, M.-K.; Ryu, H.-S.; Hwang, S.-H.; Kim, M.-K.; Ryu, H.-S. Real Levelized Cost of Energy with Indirect Costs and Market Value of Variable Renewables: A Study of the Korean Power Market. Energies 2019, 12, 2459. [Google Scholar] [CrossRef] [Green Version]
- Muradin, M.; Joachimiak-Lechman, K.; Foltynowicz, Z.; Muradin, M.; Joachimiak-Lechman, K.; Foltynowicz, Z. Evaluation of Eco-Efficiency of Two Alternative Agricultural Biogas Plants. Appl. Sci. 2018, 8, 2083. [Google Scholar] [CrossRef] [Green Version]
- Onea, F.; Rusu, E.; Onea, F.; Rusu, E. An Assessment of Wind Energy Potential in the Caspian Sea. Energies 2019, 12, 2525. [Google Scholar] [CrossRef] [Green Version]
- Melicher, R.W.; Norton, E.A. Introduction to Finance: Markets, Investments, and Financial Management, 16th ed.; Wiley: Hoboken, NJ, USA, 2016. [Google Scholar]
- International Renewable Energy Agency (IRENA). Renewable Power Generation Costs in 2019; International Renewable Energy Agency (IRENA): Abu Dhabi, United Arab Emirates, 2020. [Google Scholar]
- Wiśniewski, G.; Dziamski, P.; Kunikowski, G.; Ligus, M.; Curkowski, A.; Michałowska-Knap, K.; Rosołek, K.; Oniszk-Popławska, A.; Więcka, A.; Mroszkiewicz, T. Analiza Dotycząca Możliwości Określenia Niezbędnej Wysokości Wsparcia Poszczególnych Technologii OZE w Kontekście Realizacji Krajowego Planu Działania w Zakresie Energii Ze Źródeł Odnawialnych; Instytut Energetyki Odnawialnej: Warszawa, Poland, 2013. [Google Scholar]
- Steller, J. Hydropower and Its Development. Acta Energ. 2013, 3, 7–20. [Google Scholar] [CrossRef]
- Impact Assessment of Planned Policies and Measures to the Draft of Poland’s National Enengy and Climate Plan for the Years 2021–2030. Ministry of Energy, Warsaw, Poland. Available online: https://www.gov.pl/web/klimat/draft-of-national-energy-and-climate-plan-for-the-years-2021-2030 (accessed on 20 August 2021).
- Stolzenberger, C.H.; Then, O. Levelised cost of electricity 2015. VGB PowerTech 2015, 95, 94–96. [Google Scholar]
- ETRI 2014 Energy Technology Reference Indicator Projections for 2010–2050; Joint Research Centre: Luxembourg, 2014. [CrossRef]
- Technology Roadmap—Hydropower. IEA, Paris, France. 2012. Available online: https://www.iea.org/reports/technology-roadmap-hydropower (accessed on 20 November 2020).
- Ondraczek, J.; Komendantova, N.; Patt, A. WACC the Dog: The Effect of Financing Costs on the Levelized Cost of Solar PV Power. Renew. Energy 2015, 75, 888–898. [Google Scholar] [CrossRef]
- Discount Rates for Low-Carbon and Renewable Generation Technologies. Oxera. Available online: https://www.oxera.com/insights/reports/discount-rates-for-low-carbon-and-renewable-generation-technologies/ (accessed on 20 August 2021).
- IEA & NEA. Projected Costs of Generating Electricity—2020 Edition. Available online: https://www.oecd-nea.org/jcms/pl_51110/projected-costs-of-generating-electricity-2020-edition?details=true (accessed on 16 June 2021).
- Vartiainen, E.; Masson, G.; Breyer, C.; Moser, D.; Medina, E.R. Impact of Weighted Average Cost of Capital, Capital Expenditure, and Other Parameters on Future Utility-Scale PV Levelised Cost of Electricity. Prog. Photovolt. Res. Appl. 2020, 28, 439–453. [Google Scholar] [CrossRef] [Green Version]
- Badouard, T.; Moreira de Oliveira, D.; Yearwood, J.; Torres, P.; Altmann, M. Cost of Energy (LCOE): Energy Costs, Taxes and the Impact of Government Interventions on Investments: Final Report; Publications Office of the European Union: Luxembourg, 2020. [Google Scholar] [CrossRef]
- Mikołajuk, H.; Duda, M.; Radovic, U.; Skwierz, S.; Lewarski, M.; Kowal, I. Aktualizacja Analizy Porównawczej Kosztów Wytwarzania Energii Elektrycznej w Elektrowniach Jądrowych, Węglowych i Gazowych Oraz Odnawialnych Źródłach Energii; Agencja Rynku Energii Spółka Akcyjna (ARE S.A.): Warszawa, Poland, 2016; p. 146. [Google Scholar]
- IEA & NEA. Projected Costs of Generating Electricity—2015 Edition. Available online: https://www.oecd-nea.org/jcms/pl_14756/projected-costs-of-generating-electricity-2015-edition?details=true (accessed on 17 June 2021).
- Bachner, G.; Mayer, J.; Steininger, K.W. Costs or Benefits? Assessing the Economy-Wide Effects of the Electricity Sector’s Low Carbon Transition–The Role of Capital Costs, Divergent Risk Perceptions and Premiums. Energy Strategy Rev. 2019, 26, 100373. [Google Scholar] [CrossRef]
- Ordinance of the Minister of Economy of 18 October 2012 on Detailed Range of Obligations to Be Fulfilled in Order to Get Certificates of Origin and to Apply for Their Cancellation, and on Paying the Replacement Fee, on Purchase of the Electric Energy and Heat Manufactured from Renewable Energy Sources and on Obligation to Confirm Data Regarding Quantity of the Electric Energy Manufactured from Renewable Energy Sources. Dz.U.2012.1229. 1229.
- Share of the Electric Energy from RES in Domestic Sale of the Electric Energy to End Users in 2005–2019. Available online: https://www.ure.gov.pl/pl/oze/potencjal-krajowy-oze/ (accessed on 31 July 2020).
- The Act of 20 February 2015 on Renewable Energy Sources. Dz.U.2015.478.
- Union, E. European Council Directive 2009/28/EC on the Promotion of the Use of Energy from Renewable Sources. Off. J. Eur. Union 2009, 140, 16–62. [Google Scholar] [CrossRef]
- Del Río, P.; Linares, P. Back to the Future? Rethinking Auctions for Renewable Electricity Support. Renew. Sustain. Energy Rev. 2014, 35, 42–56. [Google Scholar] [CrossRef] [Green Version]
- Ordinance of the Minister of Climate and Environment of 14 April 2021 on the reference price of electricity from renewable energy sources in 2021 and the periods applicable to producers who won auctions in 2021. Dz.U.2021.722.
- Ordinance of the Minister of Climate of 24 April 2020 on the reference price of electricity from renewable energy sources in 2020 and the periods applicable to producers who won auctions in 2020. Dz.U.2020.798.
- Ordinance of the Minister of Energy of 15 May 2019 on the reference price of electricity from renewable energy sources in 2019 and the periods applicable to producers who won auctions in 2019. Dz.U.2019.1001.
- Ordinance of the Minister of Energy of 16 March 2017 on the reference price of electricity from renewable energy sources in 2017 and the periods applicable to producers who won auctions in 2017. Dz.U.2017.634.
- Ordinance of the Minister of Energy of 16 October 2016 on the reference price of electricity from renewable energy sources in 2016 and the periods applicable to producers who won auctions in 2016. Dz.U.2016.1765.
- Ordinance of the Minister of Economy of 13 November 2015 on the reference price of electricity from renewable energy sources in 2016. Dz.U.2015.2063.
- Announcements and Auction Results. Energy Regulatory Office. Available online: https://www.ure.gov.pl/pl/oze/aukcje-oze/ogloszenia-i-wyniki-auk (accessed on 8 November 2021).
- Average Selling Price of Electricity on the Competitive Market (Annual and Quarterly). Energy Regulatory Office. Available online: https://www.ure.gov.pl/pl/energia-elektryczna/ceny-wskazniki/ (accessed on 29 August 2021).
- The Act of 18 April 2002 on the State of Natural Disaster. Dz.U.2002.62.558.
- Ragwitz, M.; Held, A.; Resch, G.; Faber, T.; Haas, R.; Huber, C.; Morthorst, P.E.; Jensen, S.G.; Coenraads, R.; Voogt, M.; et al. Assessment and Optimisation of Renewable Energy Support Schemes in the European Electricity Market; OPTRES: Karlsruhe, Germany, 2017. [Google Scholar]
- Koper, M.; Klessmann, C.; Von Blücher, F.; Sach, T.; Brückmann, R.; Najdawi, C.; Spitzley, J.B.; Banasiak, J.; Isi, F.; Breitschopf, B.; et al. Technical Assistance in Realisation of the 4th Report on Progress of Renewable Energy in the EU-Final Report; Ecofys: Utrecht, The Netherlands, 2019. [Google Scholar]
- Winkler, J.; Magosch, M.; Ragwitz, M. Effectiveness and Efficiency of Auctions for Supporting Renewable Electricity–What Can We Learn from Recent Experiences? Renew. Energy 2018, 119, 473–489. [Google Scholar] [CrossRef]
- Energy Regulatory Office. Register of Energy Producers in a Small Installation. Available online: https://bip.ure.gov.pl/bip/rejestry-i-bazy/wytworcy-energii-w-male/2138,Rejestr-wytworcow-energii-w-malej-instalacji.html (accessed on 8 November 2021).
- The Strategy for Responsible Development for the Period up to 2020 (Including the Perspective up to 2030); Council of Ministres: Warszawa, Poland, 2017. Available online: https://www.gov.pl/web/fundusze-regiony/informacje-o-strategii-na-rzecz-odpowiedzialnego-rozwoju (accessed on 8 November 2021).
- Justification of the Draft of the Act of 28 June 2017 on Amendment of the Act on the Renewable Energy Sources and Certain Other Acts. Ministry of Energy. Available online: https://legislacja.gov.pl/projekt/12299905 (accessed on 8 November 2021).
- Pyrgou, A.; Kylili, A.; Fokaides, P.A. The Future of the Feed-in Tariff (FiT) Scheme in Europe: The Case of Photovoltaics. Energy Policy 2016, 95, 94–102. [Google Scholar] [CrossRef]
- Kylili, A.; Fokaides, P.A. Competitive Auction Mechanisms for the Promotion Renewable Energy Technologies: The Case of the 50 MW Photovoltaics Projects in Cyprus. Renew. Sustain. Energy Rev. 2015, 42, 226–233. [Google Scholar] [CrossRef]
- Shrimali, G.; Konda, C.; Farooquee, A.A. Designing Renewable Energy Auctions for India: Managing Risks to Maximize Deployment and Cost-Effectiveness. Renewable Energy 2016, 97, 656–670. [Google Scholar] [CrossRef]
- Extension of Renewable Energy Support Scheme—Policies. Available online: https://www.iea.org/policies/12350-extension-of-renewable-energy-support-scheme-yekdem (accessed on 10 December 2021).
- Frey, G.W.; Linke, D.M. Hydropower as a Renewable and Sustainable Energy Resource Meeting Global Energy Challenges in a Reasonable Way. Energy Policy 2002, 30, 1261–1265. [Google Scholar] [CrossRef]
- Alsaleh, M.; Abdul-Rahim, A.S. Moving toward Sustainable Environment: The Effects of Hydropower Industry on Water Quality in EU Economies. Energy Environ. 2021, 1–22. [Google Scholar] [CrossRef]
- Carpejani, P.; de Jesus, É.T.; Catapan, B.L.S.B.; da Costa, S.E.G.; de Lima, E.P.; Tortato, U.; Machado, C.G.; Richter, B.K. Affordable and Clean Energy: A Study on the Advantages and Disadvantages of the Main Modalities. In International Business, Trade and Institutional Sustainability; World Sustainability Series; Springer: Cham, Switzerland, 2020; pp. 615–627. [Google Scholar] [CrossRef]
- Tahseen, S.; Karney, B.W. Reviewing and Critiquing Published Approaches to the Sustainability Assessment of Hydropower. Renew. Sustain. Energy Rev. 2017, 67, 225–234. [Google Scholar] [CrossRef]
- Pata, U.K.; Aydin, M. Testing the EKC Hypothesis for the Top Six Hydropower Energy-Consuming Countries: Evidence from Fourier Bootstrap ARDL Procedure. J. Clean. Prod. 2020, 264, 121699. [Google Scholar] [CrossRef]
- Pata, U.K.; Kumar, A. The Influence of Hydropower and Coal Consumption on Greenhouse Gas Emissions: A Comparison between China and India. Water 2021, 13, 1387. [Google Scholar] [CrossRef]
- Bildirici, M.E.; Gökmenoğlu, S.M. Environmental Pollution, Hydropower Energy Consumption and Economic Growth: Evidence from G7 Countries. Renew. Sustain. Energy Rev. 2017, 75, 68–85. [Google Scholar] [CrossRef]
Figure 1.
The total cost LCOE–WACC rate of 7% and life time 50 years. Source: own elaboration.
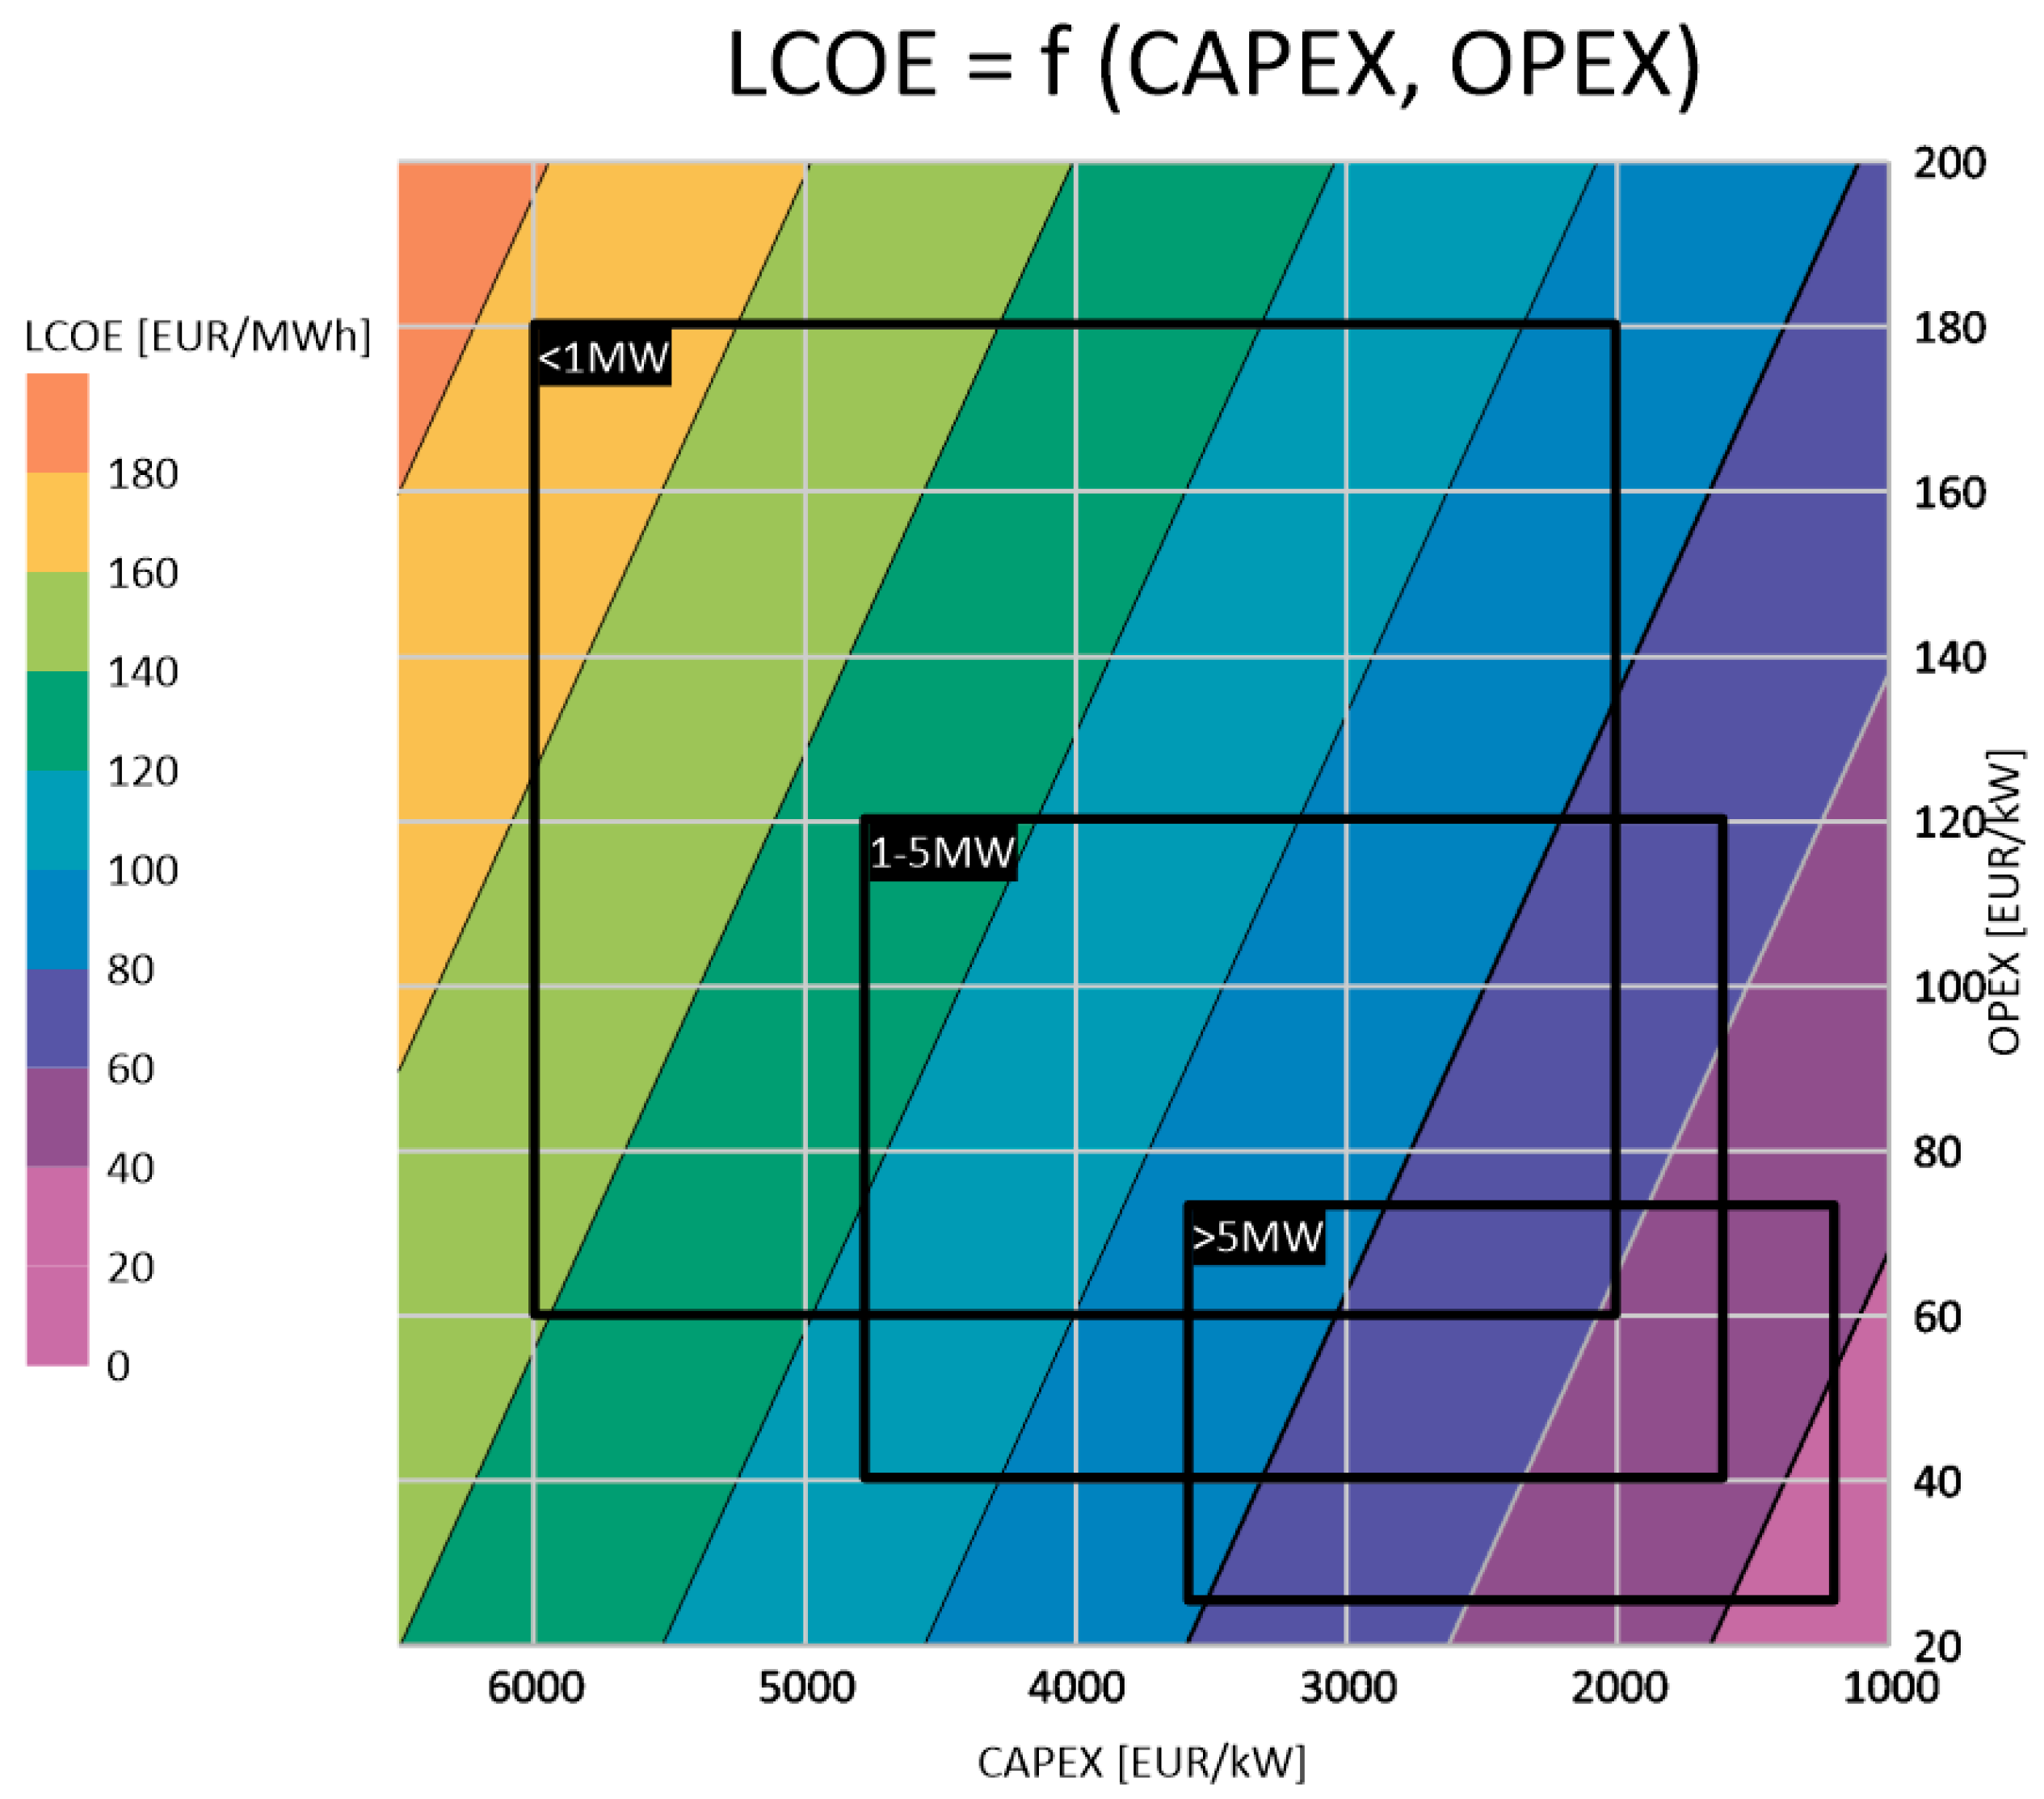
Figure 2.
The total cost LCOE–WACC rate of 7% and life time 15 years. Source: own elaboration.
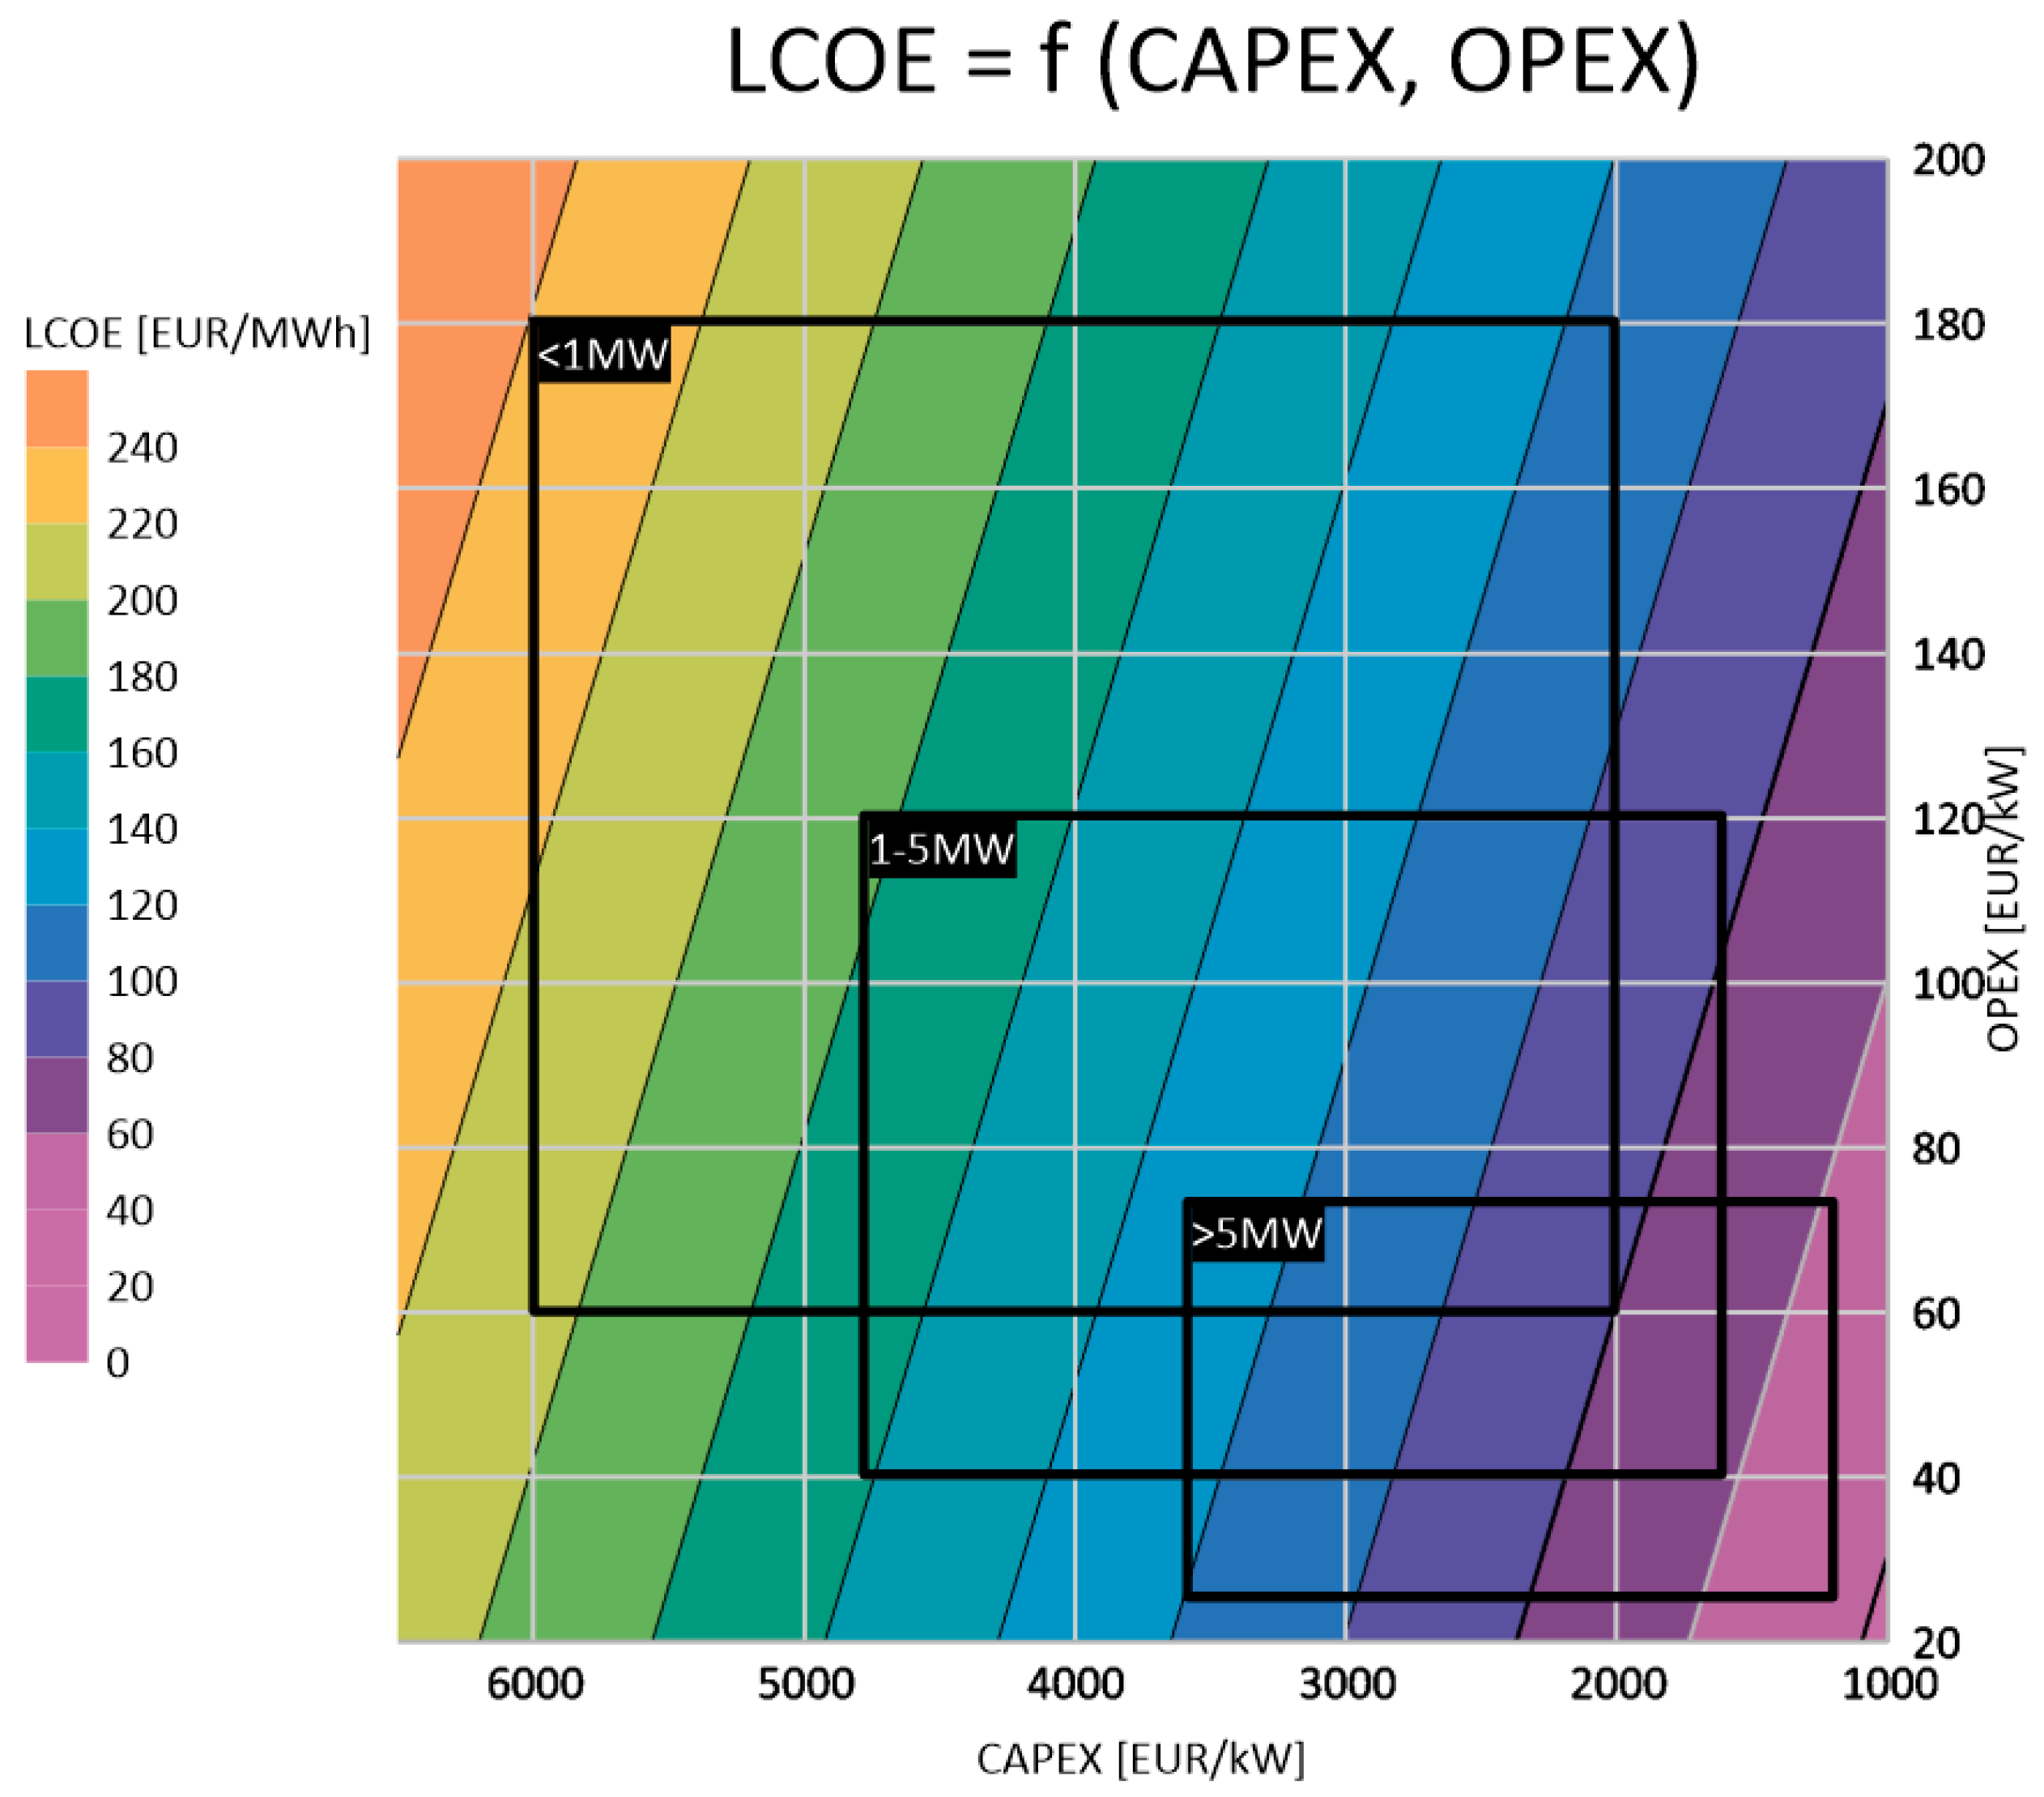
Figure 3.
The total cost LCOE WACC rate of 11.4% and life time: (a) 50 years; (b) 15 years. Source: own elaboration.
Figure 3.
The total cost LCOE WACC rate of 11.4% and life time: (a) 50 years; (b) 15 years. Source: own elaboration.
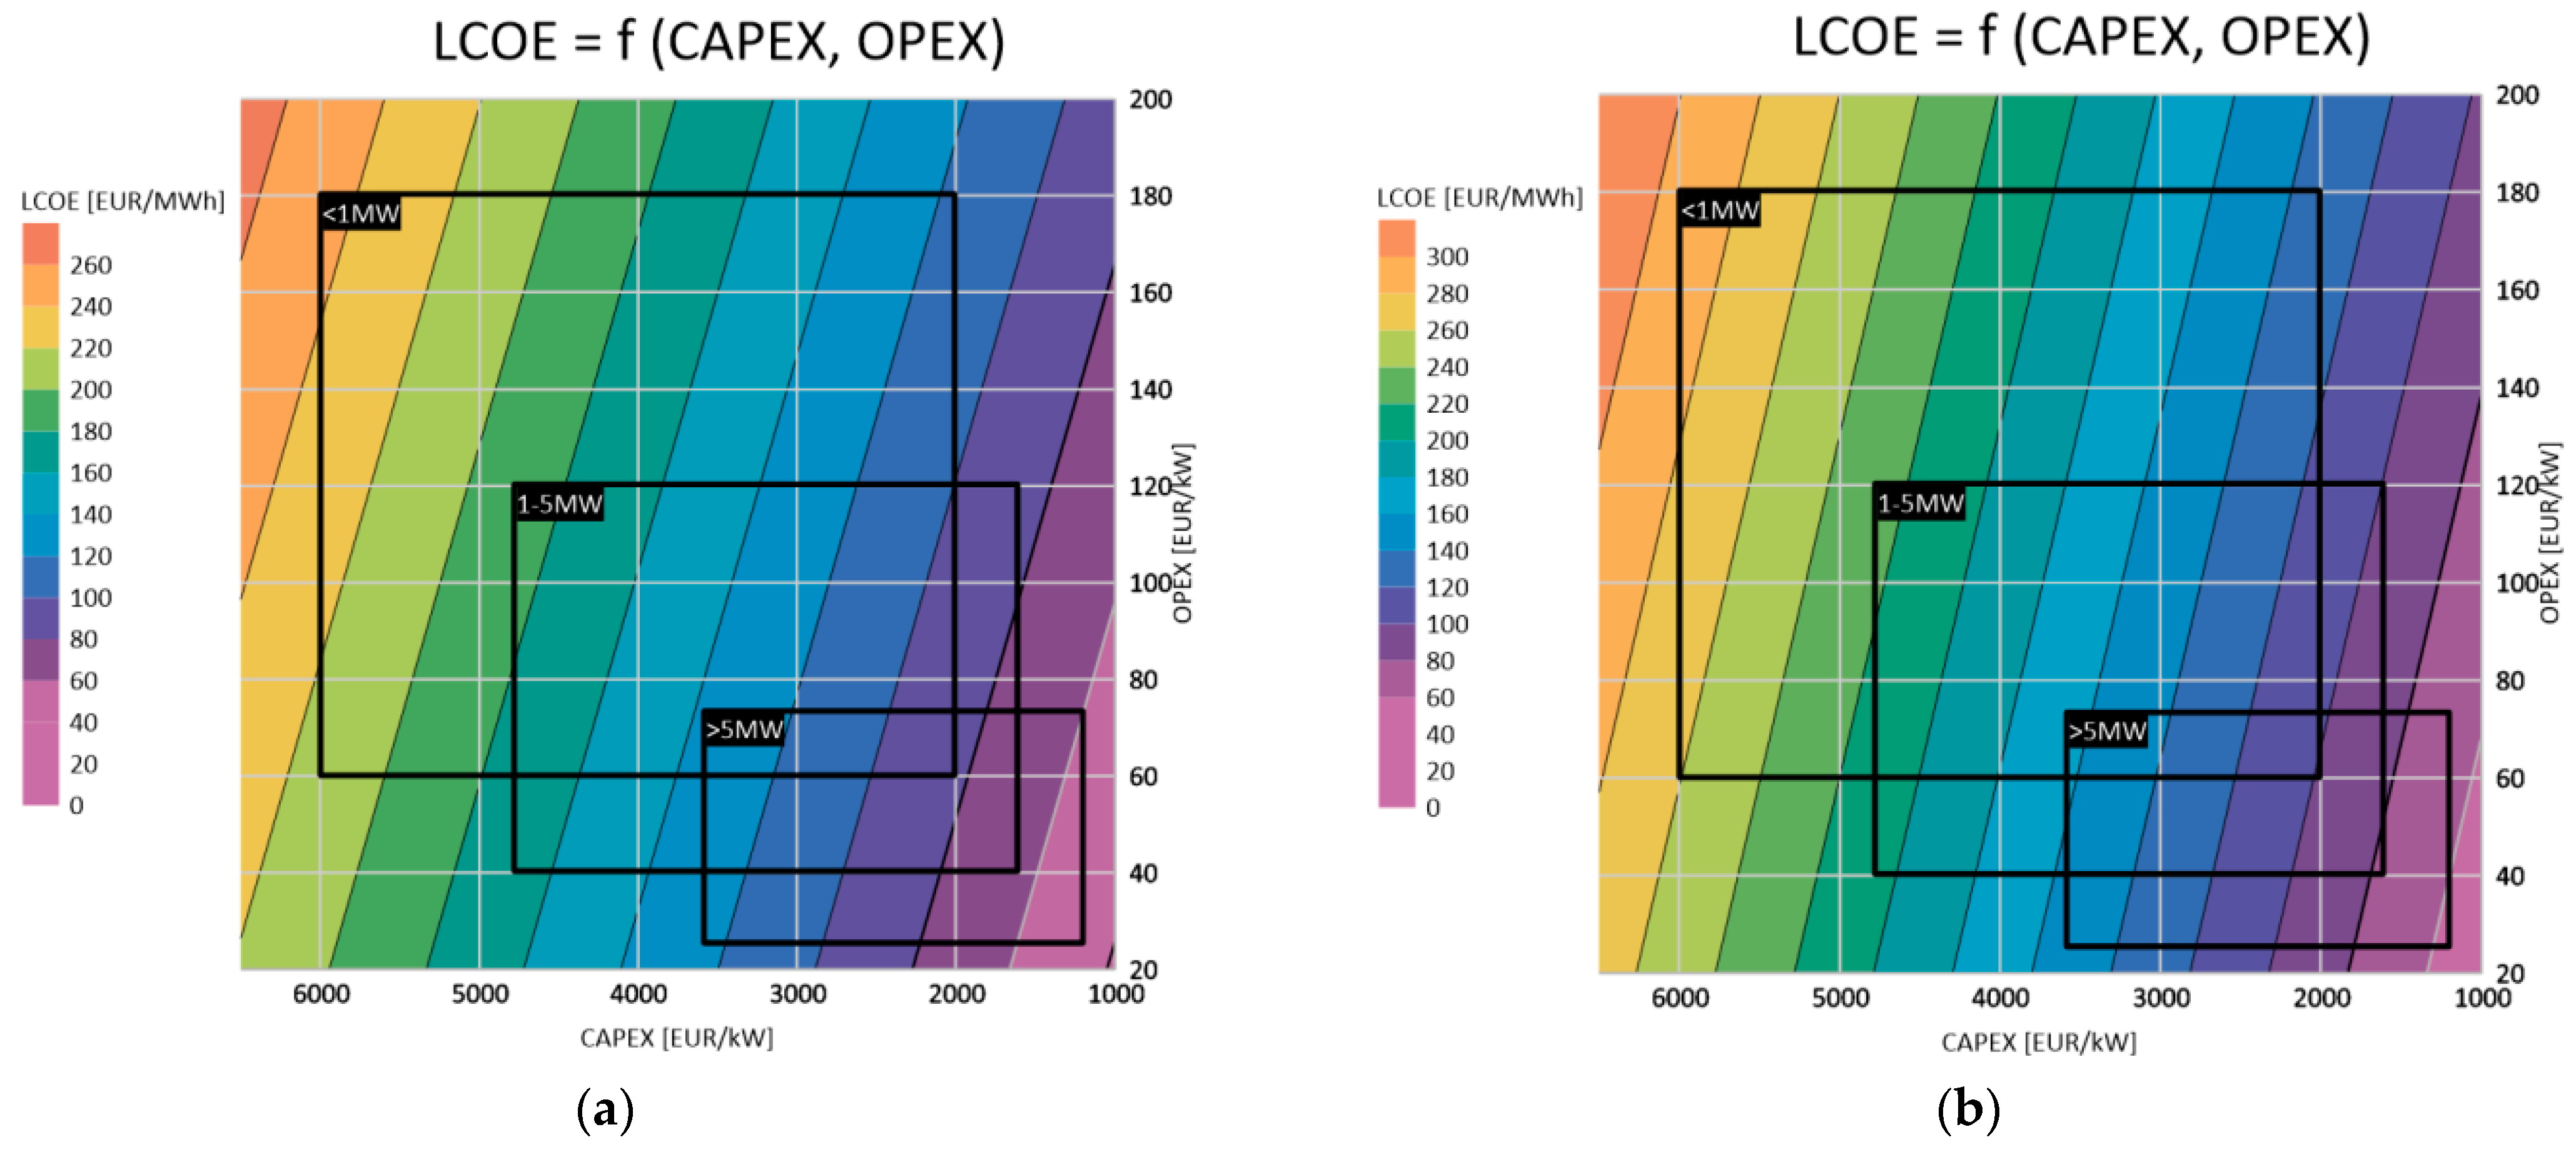
Figure 4.
Prices of the green certificates 2010–2020 (in current prices). Source: own elaboration based on TGE S.A.
Figure 4.
Prices of the green certificates 2010–2020 (in current prices). Source: own elaboration based on TGE S.A.
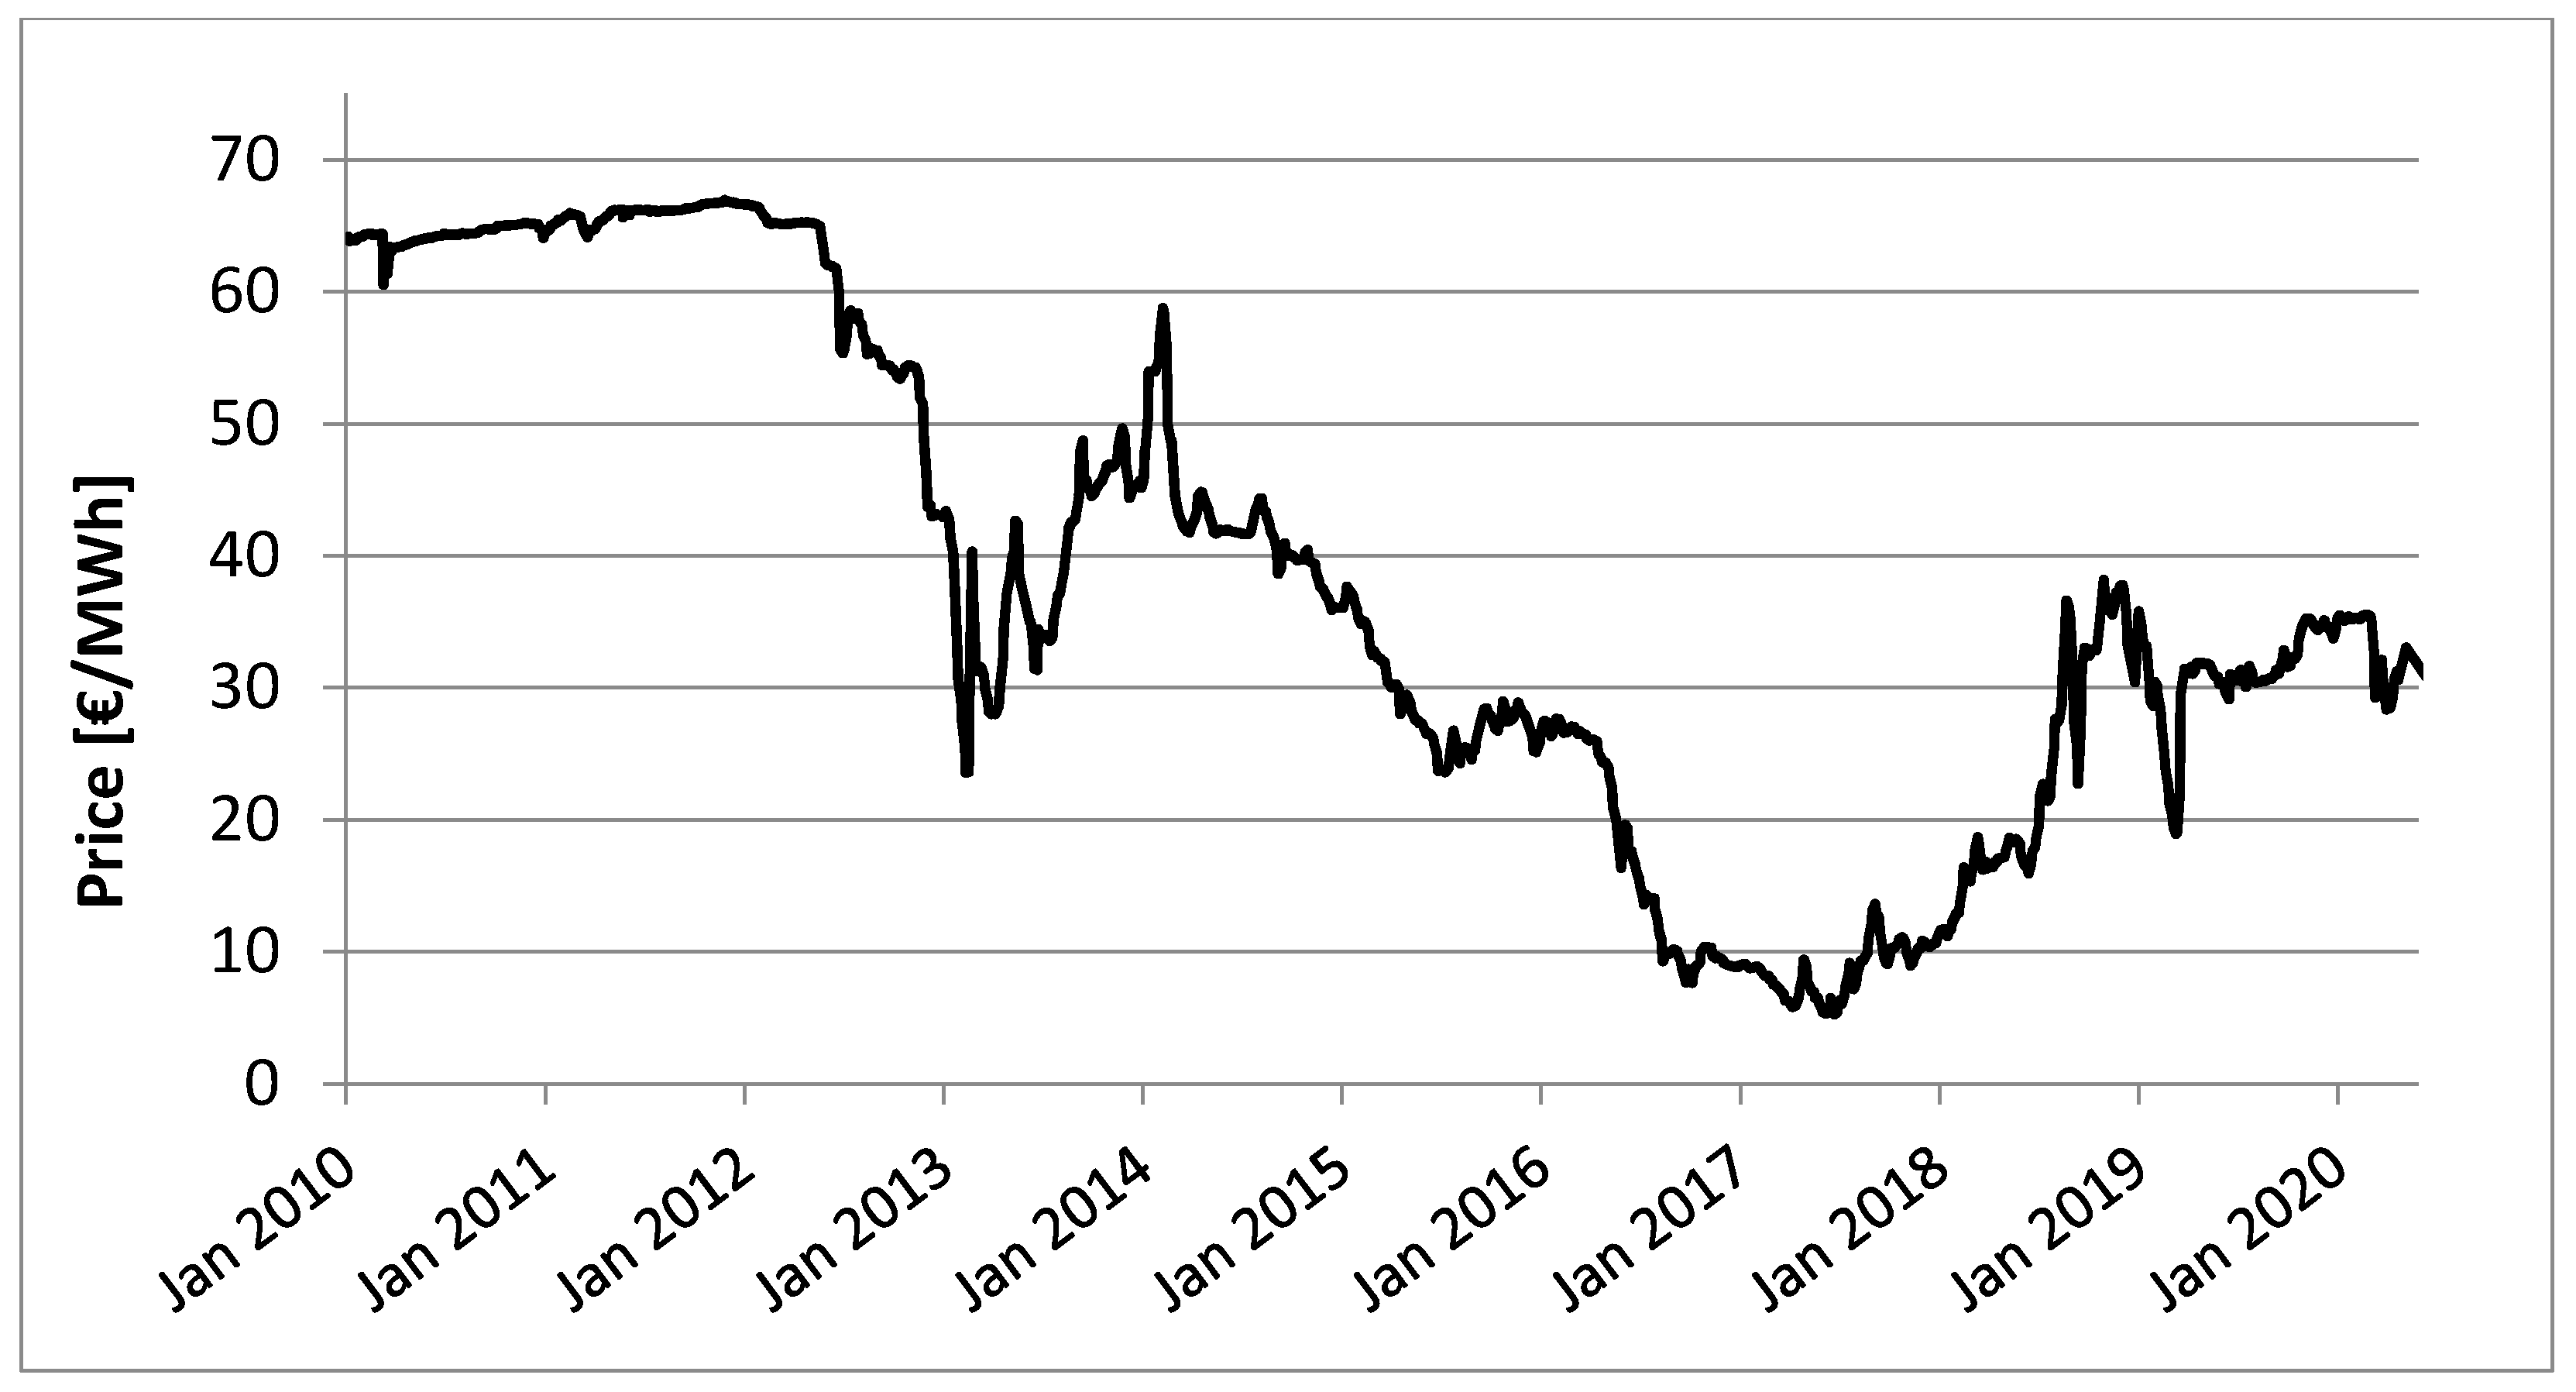
Figure 5.
The total cost LCOE and possible revenues from support systems (green certificates, auctions, FIT), analysis period 50 years, capital costs 7%. Source: own elaboration.
Figure 5.
The total cost LCOE and possible revenues from support systems (green certificates, auctions, FIT), analysis period 50 years, capital costs 7%. Source: own elaboration.

Figure 6.
Examples of CAPEX and OPEX boundaries for SHP ensuring the achievement of LCOE at the level of revenues that can be obtained (a) in the green certificates system (b) in the auction system. Source: own elaboration.
Figure 6.
Examples of CAPEX and OPEX boundaries for SHP ensuring the achievement of LCOE at the level of revenues that can be obtained (a) in the green certificates system (b) in the auction system. Source: own elaboration.
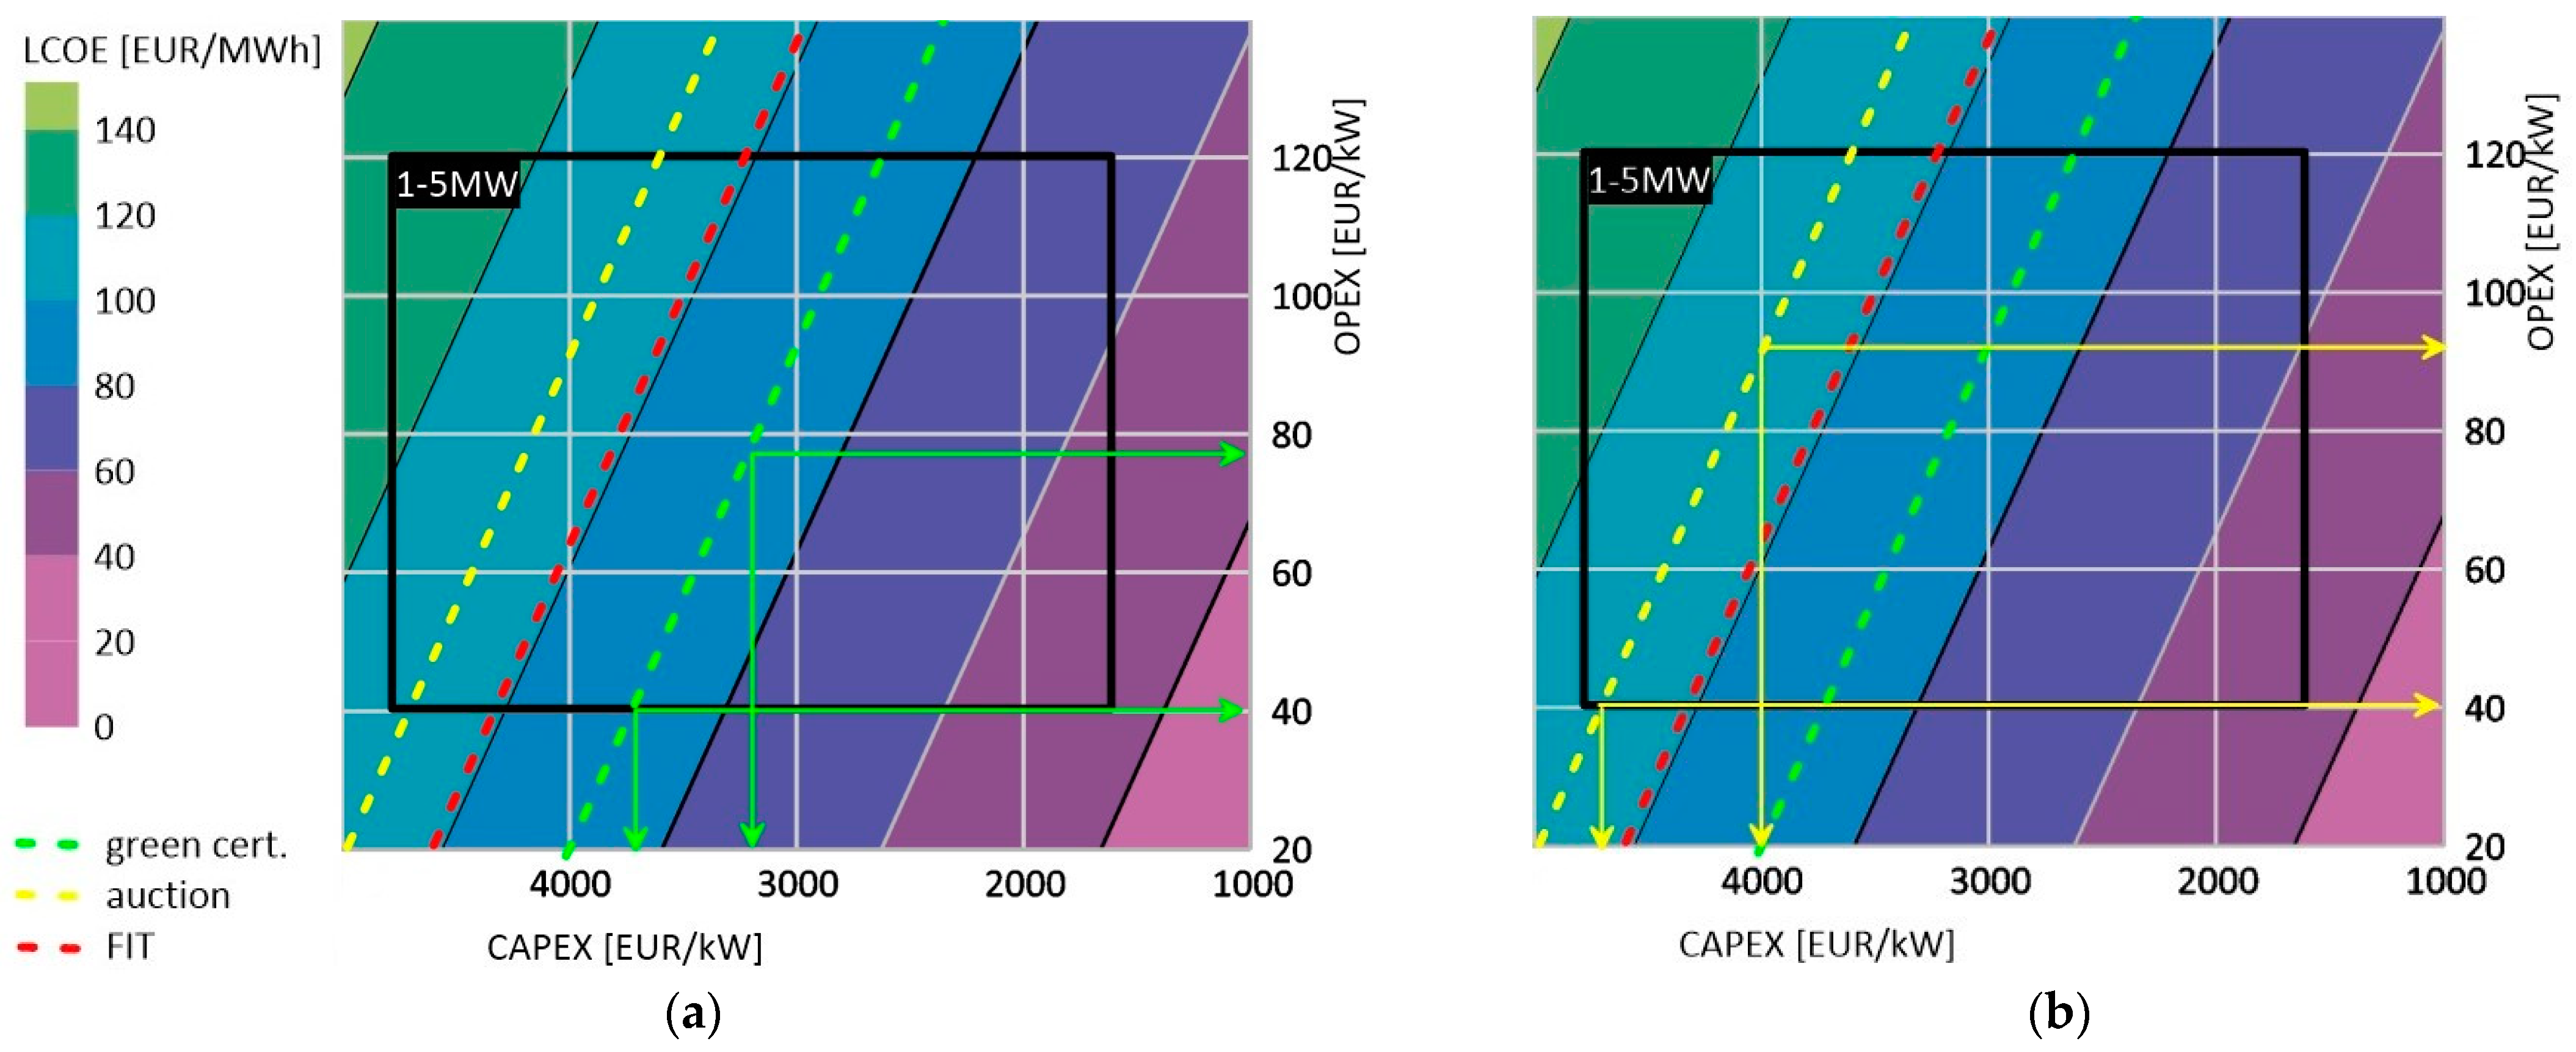
Figure 7.
Examples of CAPEX and OPEX boundaries for SHP ensuring obtaining LCOE at the level of revenues that can be obtained (a) in the auction system, (b) in the FIT system. Source: own elaboration.
Figure 7.
Examples of CAPEX and OPEX boundaries for SHP ensuring obtaining LCOE at the level of revenues that can be obtained (a) in the auction system, (b) in the FIT system. Source: own elaboration.
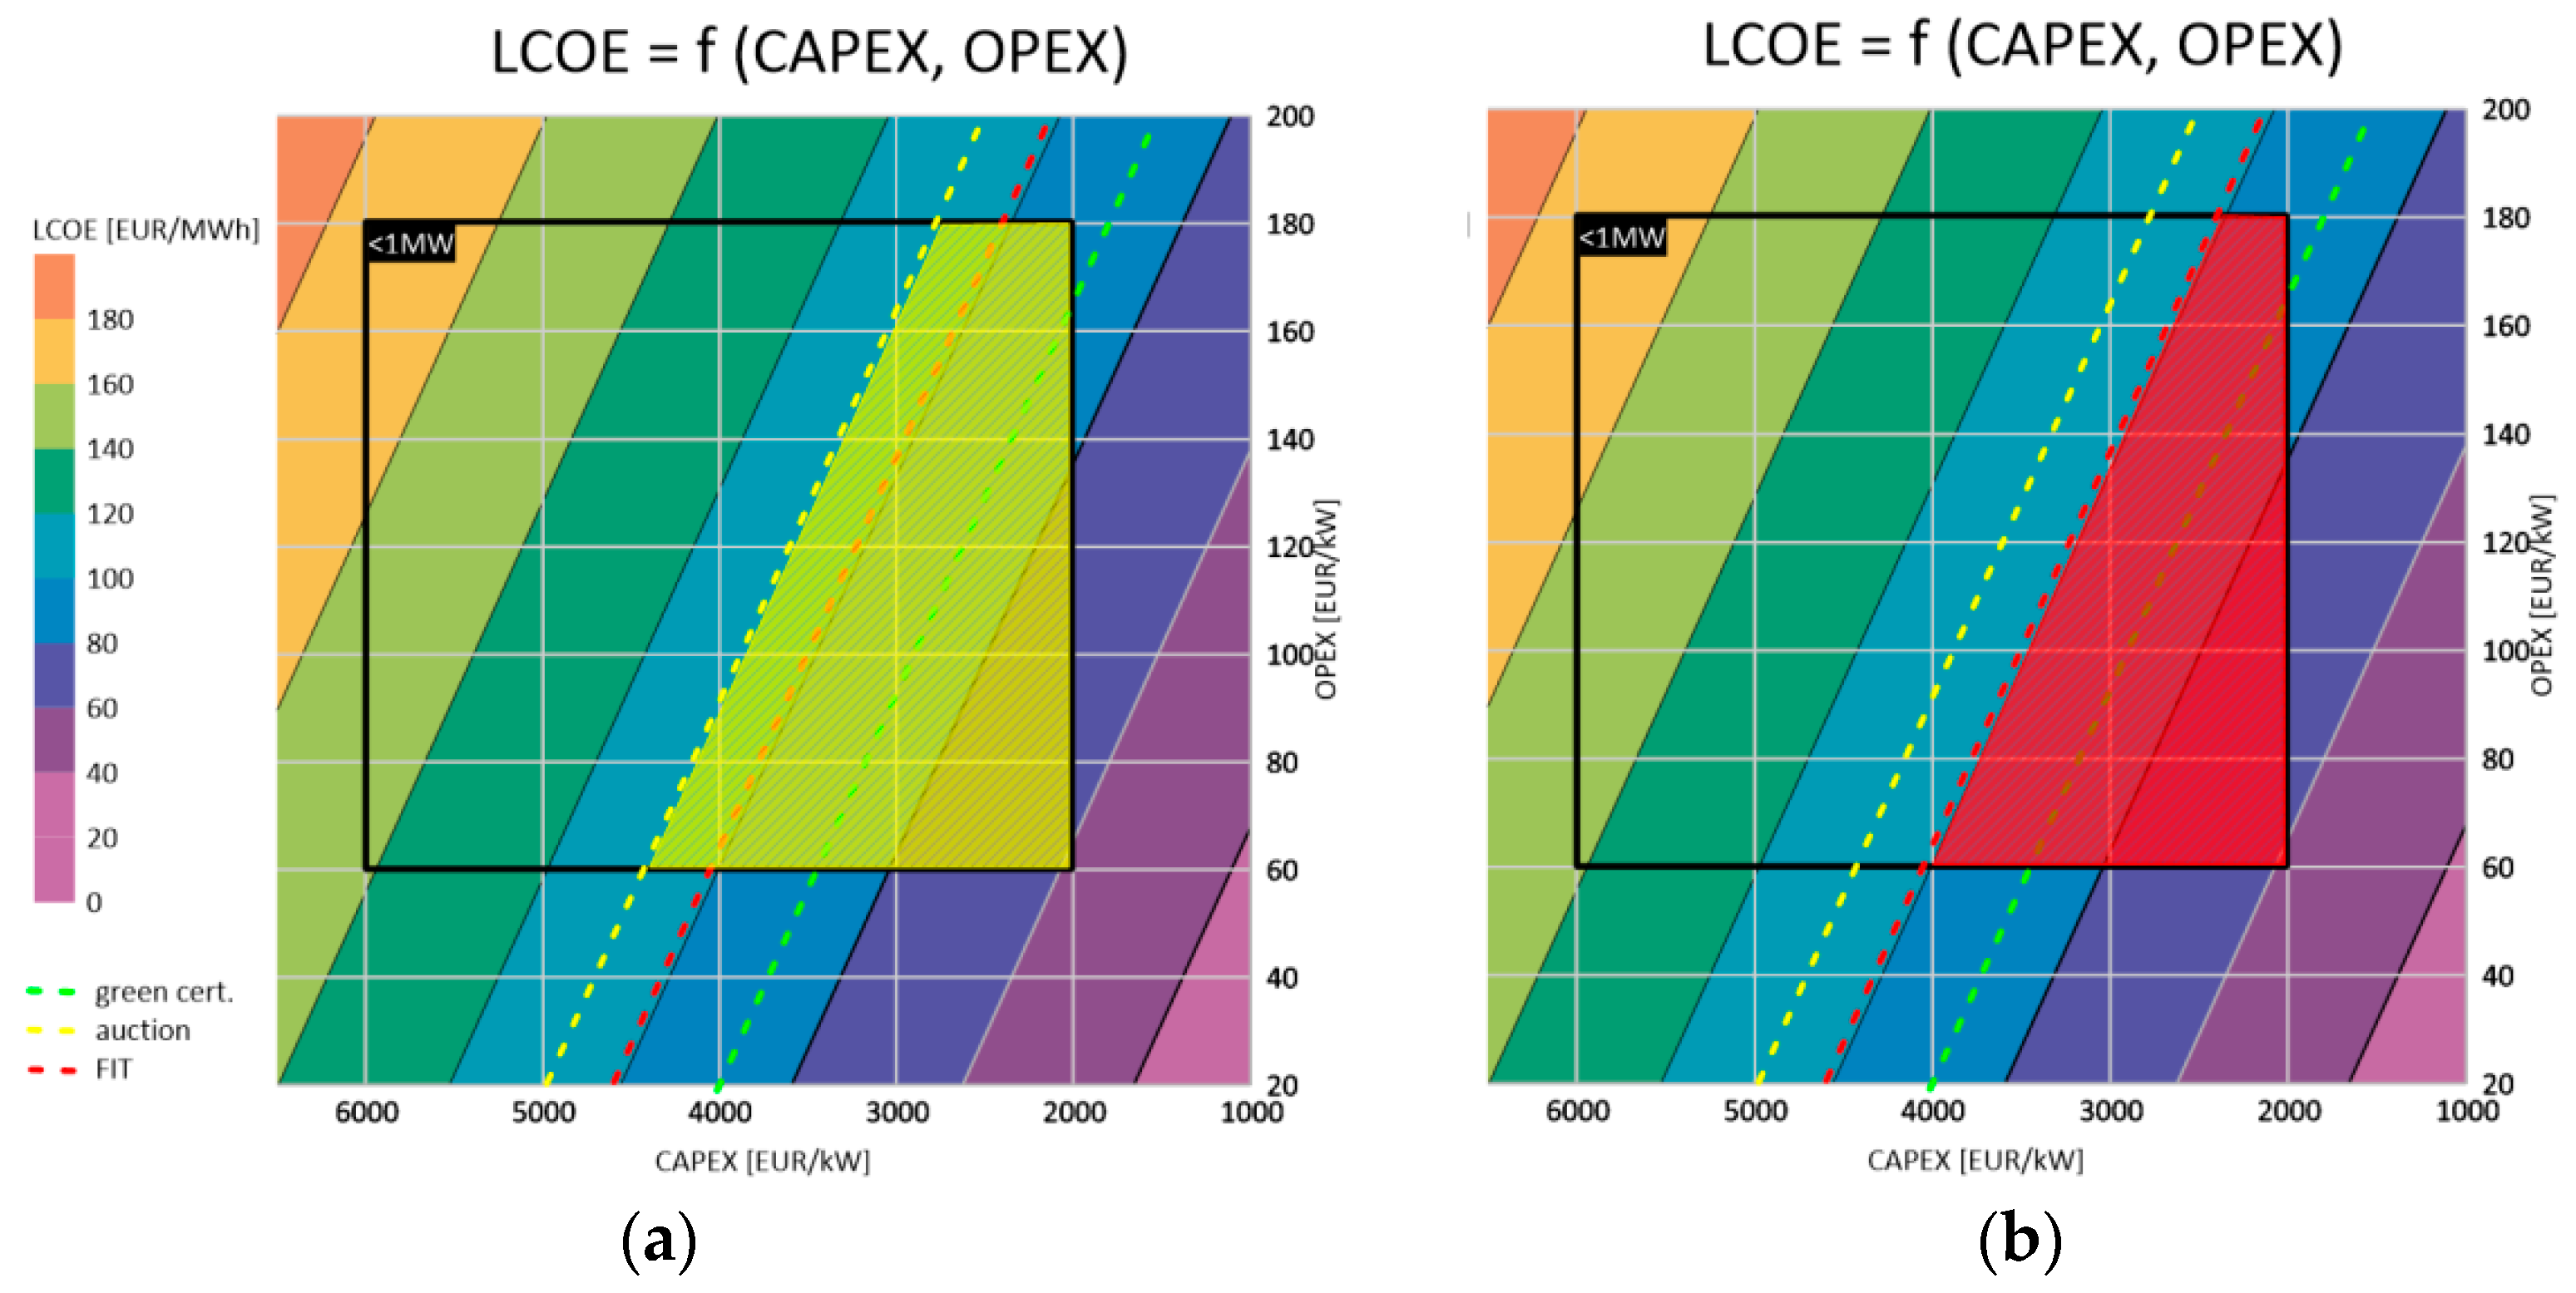
Figure 8.
The total cost LCOE and possible revenues from support systems (green certificates, auctions, FIT), analysis period 15 years, capital costs 7%. Source: own elaboration.
Figure 8.
The total cost LCOE and possible revenues from support systems (green certificates, auctions, FIT), analysis period 15 years, capital costs 7%. Source: own elaboration.
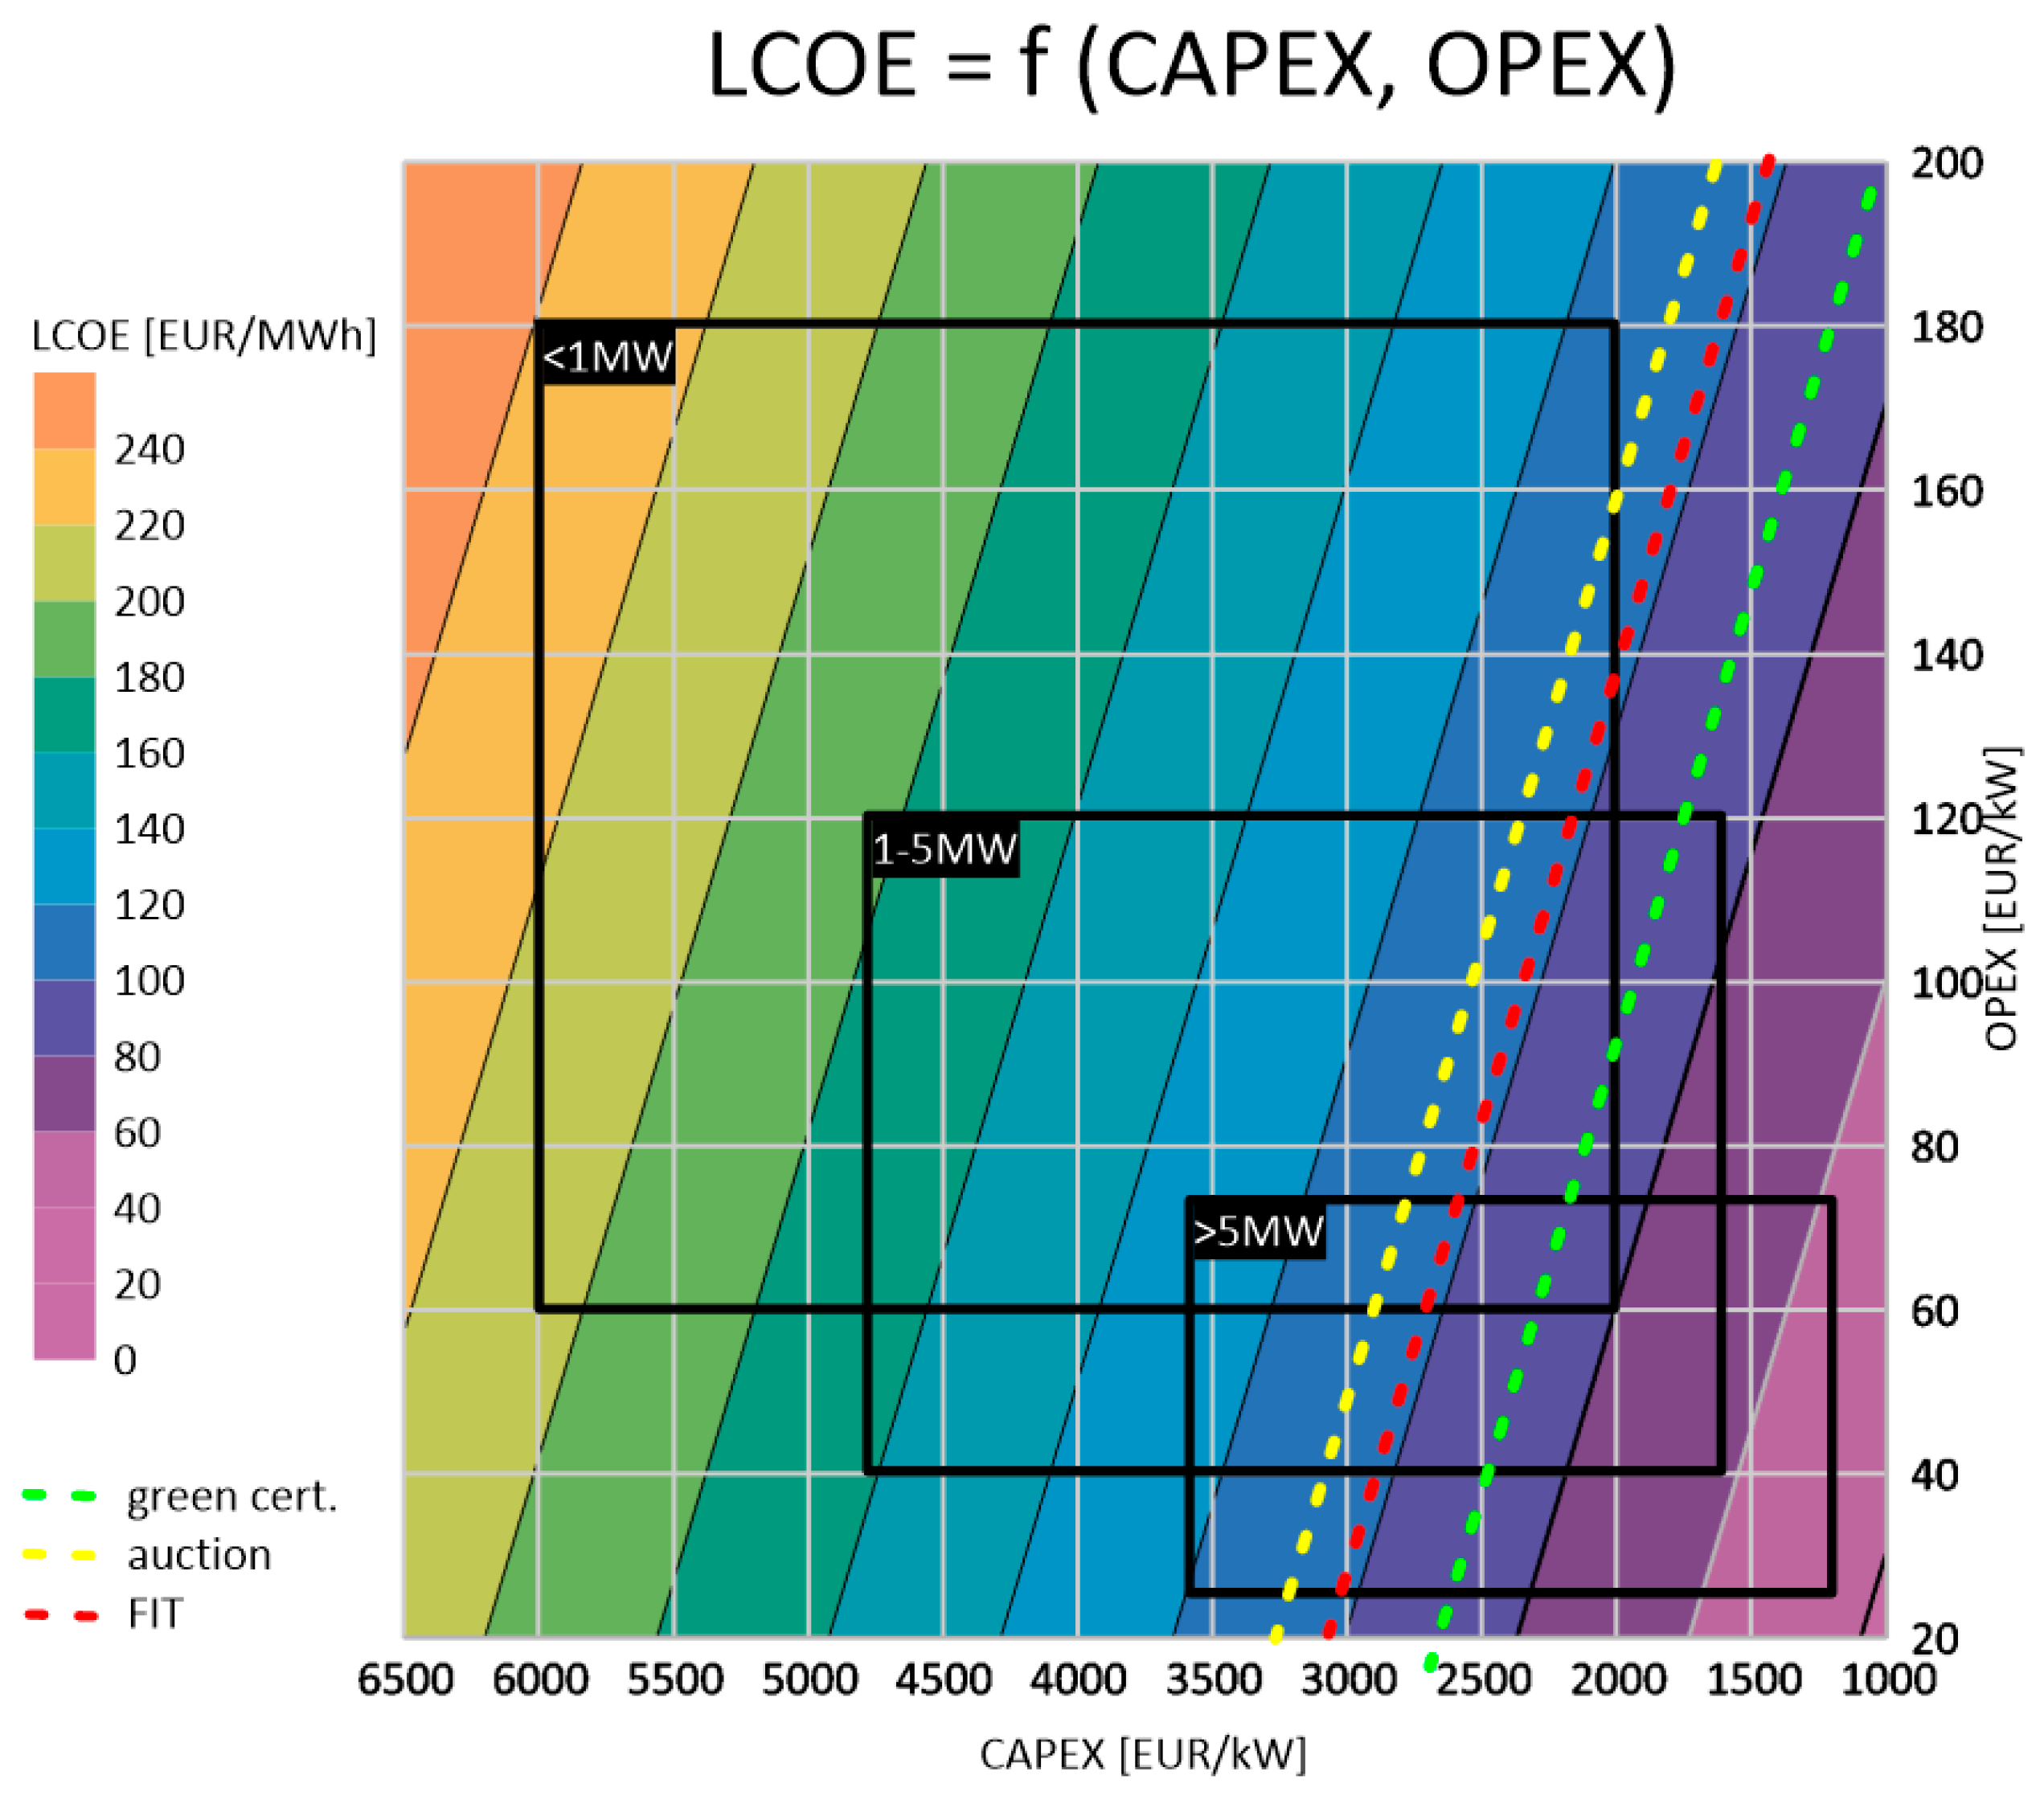
Figure 9.
The total cost LCOE and possible revenues from support systems (green certificates, auctions, FIT), analysis period 20 years, capital costs 7%. Source: own elaboration.
Figure 9.
The total cost LCOE and possible revenues from support systems (green certificates, auctions, FIT), analysis period 20 years, capital costs 7%. Source: own elaboration.

Table 1.
The capacity generated by selected RES technologies in form of power plants and other installations in the EU countries.
Table 1.
The capacity generated by selected RES technologies in form of power plants and other installations in the EU countries.
| Total RES Capacity [MW] | Wind Energy [MW] | Solar Energy [MW] | Renewable Hydropower [MW] | ||||||
|---|---|---|---|---|---|---|---|---|---|
| 2010 | 2019 | 2010 | 2019 | 2010 | 2019 | 2010 | 2019 | ||
| 1 | Austria | 16,177 | 20,627 | 1016 | 3159 | 89 | 1578 | 12,895 | 14,554 |
| 2 | Belgium | 3041 | 9318 | 912 | 3780 | 1007 | 4531 | 118 | 112 |
| 3 | Bulgaria | 2707 | 4482 | 488 | 699 | 25 | 1065 | 2184 | 2524 |
| 4 | Croatia | 2218 | 3014 | 79 | 606 | 0 | 69 | 2129 | 2200 |
| 5 | Cyprus | 97 | 299 | 82 | 158 | 7 | 129 | ||
| 6 | Czechia | 3400 | 4349 | 213 | 339 | 1727 | 2070 | 1049 | 1092 |
| 7 | Denmark | 4916 | 9012 | 3802 | 6117 | 7 | 1079 | 9 | 9 |
| 8 | Estonia | 256 | 694 | 108 | 320 | 0 | 107 | 6 | 7 |
| 9 | Finland | 5127 | 8062 | 197 | 2282 | 7 | 215 | 3155 | 3287 |
| 10 | France | 31,717 | 52,928 | 5912 | 16,260 | 1044 | 10,571 | 23,617 | 24,086 |
| 11 | Germany | 56,545 | 125,476 | 26,903 | 60,840 | 18,006 | 49,018 | 5407 | 5595 |
| 12 | Greece | 4756 | 9805 | 1298 | 3547 | 202 | 2763 | 3215 | 3409 |
| 13 | Hungary | 862 | 2153 | 293 | 329 | 2 | 1277 | 53 | 57 |
| 14 | Ireland | 1664 | 4555 | 1390 | 4172 | 1 | 36 | 237 | 237 |
| 15 | Italy | 29,507 | 55,315 | 5794 | 10,758 | 3597 | 20,906 | 17,563 | 18,960 |
| 16 | Latvia | 1622 | 1801 | 30 | 78 | 0 | 3 | 1576 | 1565 |
| 17 | Lithuania | 278 | 850 | 133 | 546 | 0 | 103 | 116 | 117 |
| 18 | Luxembourg | 126 | 356 | 44 | 136 | 29 | 150 | 34 | 34 |
| 19 | Malta | 1 | 158 | 0 | 0 | 1 | 154 | ||
| 20 | Netherlands | 3032 | 12,075 | 2237 | 4463 | 90 | 6725 | 37 | 37 |
| 21 | Poland | 2178 | 9326 | 1108 | 5917 | 0 | 1300 | 936 | 968 |
| 22 | Portugal | 9607 | 14,082 | 3796 | 5233 | 134 | 842 | 5106 | 7249 |
| 23 | Romania | 6791 | 11,190 | 389 | 3040 | 0 | 1386 | 6382 | 6621 |
| 24 | Slovakia | 1803 | 2330 | 3 | 3 | 19 | 472 | 1600 | 1612 |
| 25 | Slovenia | 1133 | 1450 | 0 | 5 | 12 | 222 | 1074 | 1164 |
| 26 | Spain | 42,246 | 54,592 | 20,693 | 25,553 | 4605 | 11,065 | 16,086 | 16,781 |
| 27 | Sweden | 22,707 | 30,984 | 2017 | 8888 | 11 | 644 | 16,624 | 16,431 |
| 27-UE | 254,512 | 449,286 | 78,937 | 167,228 | 30,622 | 118,479 | 121,208 | 128,707 | |
| Capacity change 2019/2010 | 177% | 212% | 387% | 106% | |||||
Source: own selection based on [3].
Table 2.
Existing mechanisms supporting energy production in hydropower plants in EU countries where the increase in hydropower capacity is the highest.
Table 2.
Existing mechanisms supporting energy production in hydropower plants in EU countries where the increase in hydropower capacity is the highest.
| Country | Share of Hydropower in RES Capacity in 2019 | Hydropower Capacity Change 2019/2010 | Type of Support of Hydropower | |
|---|---|---|---|---|
| 1 | Portugal | 52% | 42% | FIT |
| 2 | Estonia | 1% | 22% | FIP, Tenders |
| 3 | Bulgaria | 56% | 16% | FIT until 2018, FIP from 2018 |
| 4 | Austria | 71% | 13% | Subsidies, FIT |
| 5 | Slovenia | 80% | 8% | Loans, Subsidies, Tenders |
| 6 | Italy | 34% | 8% | FIP, Tax regulation mechanisms (Reduction in real estate tax) |
| 7 | Hungary | 3% | 7% | FIT& FIP, Loans, Subsidies |
| 8 | Greece | 35% | 6% | FIT, Net-Metering, FIP, Subsidies, Tax regulation mechanism (Development Law) |
| Poland | 10% | 3% | Tenders, FIT & FIP from 2019, Green certificates, Loans, Subsidies |
Table 3.
Existing and planned electricity generation by source [TWh], Poland.
| Specification | 2010 | 2015 | 2016 | 2017 | 2018 | 2019 | 2030 5 | 2040 5 |
|---|---|---|---|---|---|---|---|---|
| Wind | 1.7 | 10.9 | 12.6 | 14.9 | 12.8 | 15.1 | 38.3 | 55.2 |
| Biomass | 5.9 | 9.0 | 6.9 | 5.3 | 5.4 | 6.4 | 11.6 | 10.3 |
| Hydro | 2.9 | 1.8 | 2.1 | 2.6 | 1.7 | 1.7 | 3.0 | 3.1 |
| Biogas | 0.4 | 0.9 | 1.0 | 1.1 | 1.1 | 1.1 | 3.9 | 5.8 |
| Photovoltaics | 0.0 | 0.1 | 0.1 | 0.2 | 0.3 | 0.7 | 6.8 | 14.8 |
| Others RES 1 | 0.0 | 0.0 | 0.0 | 0.0 | 0.0 | 0.0 | 0.3 | 0.5 |
| Total RES | 10.9 | 22.7 | 22.8 | 24.1 | 21.6 | 25.4 | 59.6 | 88.4 |
| Share of electricity generation from RES 2 | 6.9% | 13.8% | 13.7% | 14.2% | 12.7 | 15.5 | 31.8% | 39.7% |
| Legal obligation of share of RES in electricity generation 3 | - | 14.0% | 15.0% | 16.0% | 17.5 | 18.5 | ||
| Share of RES in gross final energy consumption 4 | 9.3% | 11.9% | 11.4% | 11.1% | 11.5% | 12.2% | 23.0% | 28.5% |
Table 4.
Unit operational expenditures CAPEX calculated for the analyses.
| Specification | CAPEX Micro Hydropower (<1 MW) [EUR 2019/kW] | CAPEX Small Hydropower (1–5 MW) [EUR 2019/kW] | CAPEX Mid Hydropower (5–20 MW) [EUR 2019/kW] |
|---|---|---|---|
| CAPEXmin = 50%CAPEXavg | 2000 | 1600 | 1200 |
| CAPEXavg | 4000 | 3200 | 2400 |
| CAPEXmax = 150%CAPEXavg | 6000 | 4800 | 3600 |
average EUR /PLN exchange rate in 2019: 1 EUR = 4.2980 PLN. Source: own elaboration.
Table 5.
Unit operational expenditures OPEX used in the analyses.
| Specification | OPEX Micro Hydropower (<1 MW) [EUR 2019/kW] | OPEX Small Hydropower (1–5 MW) [EUR 2019/kW] | OPEX Mid Hydropower (5–20 MW) [EUR 2019/kW] |
|---|---|---|---|
| OPEXmin = 50%OPEXavg | 60 | 40 | 24 |
| OPEXavg | 120 | 80 | 48 |
| OPEXmax = 150%OPEXavg | 180 | 120 | 72 |
average EUR /PLN exchange rate in 2019: 1 EUR = 4.2980 PLN. Source: own elaboration.
Table 6.
LCOE.
| Micro Hydropower (<1 MW) | Small Hydropower (1–5 MW) | Mid Hydropower (5–20 MW) | |||||||
|---|---|---|---|---|---|---|---|---|---|
| Min | Mean | Max | Min | Mean | Max | Min | Mean | Max | |
| CAPEX [EUR 2019/kW] | |||||||||
| 2000 | 4000 | 6000 | 1600 | 3200 | 4800 | 1200 | 2400 | 3600 | |
| OPEX [EUR 2019/kW] | |||||||||
| 60 | 120 | 180 | 40 | 80 | 120 | 24 | 48 | 72 | |
| life time = 50 years; WACC = 7% | LCOE [EUR 2019/MWh] | ||||||||
| 58 | 117 | 175 | 45 | 89 | 134 | 32 | 63 | 95 | |
| life time = 15 years; WACC = 7% | LCOE [EUR 2019/MWh] | ||||||||
| 80 | 160 | 239 | 62 | 123 | 185 | 44 | 89 | 133 | |
| life time = 50 years; WACC = 11.4% | LCOE [EUR 2019/MWh] | ||||||||
| 82 | 117 | 82 | 45 | 82 | 134 | 82 | 63 | 82 | |
| life time = 15 years; WACC = 11.4% | LCOE [EUR 2019/MWh] | ||||||||
| 98 | 197 | 295 | 76 | 153 | 229 | 56 | 111 | 167 | |
Source: own elaboration.
Table 7.
Selected referential prices of the electric energy originating from the RES in 2016–2020.
| Type of RES Installation | Referential Price [EUR /MWh] | ||||
|---|---|---|---|---|---|
| 2016 | 2017 | 2018 | 2019 | 2020 | |
| Hydropower | |||||
| ≤0.5 MW | 109 | 112 | 128 | 128 | 144 |
| 0.5–1 MW | 109 | 112 | 116 | 116 | 130 |
| >1 MW | 112 | 112 | 112 | 112 | 124 |
| Solar energy ≤ 1 MW | 108 | 105 | 98 | 90 | 84 |
| Solar energy > 1 MW | 104 | 99 | 93 | 85 | 79 |
| Onshore wind ≤ 1 MW | 70 | 74 | 74 | 74 | 74 |
| Onshore wind > 1 MW | 90 | 81 | 81 | 66 | 58 |
Table 8.
Results of the RES electricity auction announced in 2016–2020.
| Auction No. | Description of Installations Admitted to the Auction (Installation Capacity: ≤ or >1 MW, CO2 Emission: ≤ or >100 kg/MWh; Annual Operation ≤ or >3504 h) | Quantity of the Energy Sold at the Auction [MWh] | |
|---|---|---|---|
| Planned | Real | ||
| 1/2016 | agricultural biogas, ≤1 MW | 2,113,887 | 824,629 |
| 2/2016 | agricultural biogas, >1 MW | 2,309,382 | 0 1 |
| 3/2016 | installation: ≤1 MW, CO2 > 100 kg/MWh, ≤3504 h | 1,575,000 | 1,567,289 |
| 4/2016 | installation: ≤1 MW, CO2 < 100 kg/MWh, >3504 h (incl. hydropower) | 1,306,870 | 416,554 |
| 1/2017 | installation: ≤1 MW, CO2 > 100 kg/MWh, ≤3504 h | 4,725,000 | 4,720,962 |
| 2/2017 | installation: ≤1 MW, CO2 < 100 kg/MWh, >3504 h (incl. hydropower) | 1,484,764 | 312,441 |
| 1/2018 | other biogas, biomass/waste, CHP, >1 MW | 33,864,470 | 0 1 |
| 2/2018 | agricultural biogas, >1 MW | 1,467,617 | 0 1 |
| 3/2018 | hydropower, bioliquid, offshore, ≤1 MW | 1,475,211 | 0 1 |
| 4/2018 | agricultural biogas, ≤1 MW | 1,149,296 | 0 1 |
| 5/2018 | other biogas, biomass/waste, CHP, ≤1 MW | 915,336 | 0 1 |
| 6/2018 | onshore wind, photovoltaics, >1 MW | 45,000,000 | 41,996,772 |
| 7/2018 | other biogas, biomass/waste, CHP, >1 MW | 57,699,309 | 972,000 |
| 8/2018 | agricultural biogas, ≤1 MW | 13,311,000 | 0 1 |
| 9/2018 | onshore wind, photovoltaics, ≤1 MW | 16,065,000 | 8,169,917 |
| 10/2018 | hydropower, bioliquid, offshore, ≤1 MW | 3,750,000 | 0 1 |
| 11/2018 | agricultural biogas, ≤1 MW | 11,700,000 | 3,489,766 |
| 12/2018 | hydropower, bioliquid, offshore, >1 MW | 5,400,000 | 816,000 |
| 13/2018 | agricultural biogas, >1 MW | 3,510,000 | 717,280 |
| 1/2019 | other biogas, biomass/waste, >1 MW | 33,864,470 | 0 1 |
| 2/2019 | agricultural biogas, >1 MW | 1,467,617 | 219,837 |
| 3/2019 | hydropower, bioliquid, offshore, ≤1 MW | 1,475,211 | 0 1 |
| 4/2019 | agricultural biogas, ≤1 MW | 1,149,296 | 0 1 |
| 5/2019 | other biogas, biomass/waste, CHP, ≤1 MW | 1,120,000 | 0 1 |
| 6/2019 | onshore wind, photovoltaics, >1 MW | 113,970,000 | 77,837,230 |
| 7/2019 | other biogas, biomass/waste, CHP, >1 MW | 14,190,000 | 972,000 |
| 8/2019 | agricultural biogas, ≤1 MW | 140,400 | 0 1 |
| 9/2019 | onshore wind, photovoltaics, ≤1 MW | 11,445,000 | 11,436,780 |
| 10/2019 | agricultural biogas, ≤1 MW | 1,341,821 | 0 1 |
| 11/2019 | hydropower, bioliquid, offshore, ≤1 MW | 594,000 | 0 1 |
| 12/2019 | agricultural biogas, >1 MW | 1,170,000 | 0 1 |
| 1/2020 | agricultural biogas, >1 MW | 2,500,000 | 501,214 |
| 2/2020 | other biogas, combustion of biomass/waste, >1 MW | 10,950,000 | 319,606 |
| 3/2020 | hydropower, bioliquid, offshore, ≤1 MW | 540,000 | 0 1 |
| 4/2020 | other biogas, biomass/waste, CHP, ≤1 MW | 375,000 | 0 1 |
| 5/2020 | hydropower, bioliquid, offshore, ≤1 MW | 1,080,000 | 0 1 |
| 6/2020 | agricultural biogas, >1 MW | 1,800,000 | 0 1 |
| 7/2020 | onshore wind, photovoltaics, >1 MW | 46,290,000 | 41,939,089 |
| 8/2020 | onshore wind, photovoltaics, ≤1 MW | 11,760,000 | 11,747,068 |
1—The auctions were not conducted because attenders submitted less than 3 bids meeting the requirements. Source: own elaboration based on [55].
Table 9.
Auction prices of the electric energy from the RES in 2016–2020.
| Auction No. | Description of Installations Admitted to the Auction | Prices [EUR /MWh] | ||
|---|---|---|---|---|
| Minimum | Maximum | Average | ||
| 1/2016 | agricultural biogas, ≤1 MW | 117 | 117 | 117 |
| 3/2016 | photovoltaic, onshore wind, ≤1 MW | 59 | 95 | 82 |
| 4/2016 | hydropower, biogas and biomass, ≤1 MW | 7 1 | 109 | 87 |
| 1/2017 | photovoltaic and onshore wind, ≤1 MW | 45 | 93 | 87 |
| 2/2017 | hydropower, biogas and biomass, ≤1 MW | 67 | 110 | 86 |
| 6/2018 | onshore wind, photovoltaics, >1 MW | 37 | 50 | 46 |
| 7/2018 | other biogas, biomass/waste, CHP, >1 MW | 93 | 93 | 93 |
| 9/2018 | onshore wind, photovoltaics, ≤1 MW | 67 | 85 | 82 |
| 11/2018 | agricultural biogas, ≤1 MW | 125 | 133 | 131 |
| 12/2018 | hydropower, bioliquid, >1 MW | 97 | 112 | 108 |
| 13/2018 | agricultural biogas, >1 MW | 115 | 120 | 118 |
| 2/2019 | agricultural biogas, >1 MW | 144 | 147 | 146 |
| 4/2019 | agricultural biogas, ≤1 MW | 149 | 155 | 153 |
| 6/2019 | onshore wind, photovoltaics, >1 MW | 38 | 54 | 49 |
| 7/2019 | other biogas, biomass/waste, CHP, >1 MW | 93 | 93 | 93 |
| 9/2019 | onshore wind, photovoltaics, ≤1 MW | 63 | 76 | 74 |
| 1/2020 | agricultural biogas, ≤1 MW | 146 | 152 | 150 |
| 2/2020 | other biogas, biomass/waste, CHP, >1 MW | 88 | 95 | 90 |
| 7/2020 | onshore wind, photovoltaics, ≤1 MW | 44 | 58 | 52 |
| 8/2020 | onshore wind, photovoltaics, ≤1 MW | 52 | 63 | 60 |
1—Acc. to information obtained from Small Hydropower Association, the price equal EUR 7 arises from an editorial mistake–a misprint made by the manufacturer, who submitted the bid, and who wanted to place a bid equal EUR 70. It is very probable since nobody would place a bid below the market price of the energy, which, in fourth quarter 2016 equaled approx. EUR 40. Source: own elaboration based on [55].
Table 10.
Investments in micro and small hydropower plants in years 2019–2020.
| Micro HP (Up to 50 kW) | Micro HP (Capacity 50–500 kW) | |||
|---|---|---|---|---|
| Number of Plants | Total Capacity [MW] | Number of Plants | Total Capacity [MW] | |
| 31 December 2018 | 281 | 8.06 | 346 | 54.37 |
| 31 December 2019 | 292 | 8.36 | 349 | 54.46 |
| 31 December 2020 | 298 | 8.53 | 351 | 54.73 |
Source: own elaboration based on [61].
Publisher’s Note: MDPI stays neutral with regard to jurisdictional claims in published maps and institutional affiliations. |
© 2021 by the authors. Licensee MDPI, Basel, Switzerland. This article is an open access article distributed under the terms and conditions of the Creative Commons Attribution (CC BY) license (https://creativecommons.org/licenses/by/4.0/).
Share and Cite
MDPI and ACS Style
Godyń, I.; Dubel, A. Evolution of Hydropower Support Schemes in Poland and Their Assessment Using the LCOE Method. Energies 2021, 14, 8473. https://doi.org/10.3390/en14248473
AMA Style
Godyń I, Dubel A. Evolution of Hydropower Support Schemes in Poland and Their Assessment Using the LCOE Method. Energies. 2021; 14(24):8473. https://doi.org/10.3390/en14248473
Chicago/Turabian StyleGodyń, Izabela, and Anna Dubel. 2021. "Evolution of Hydropower Support Schemes in Poland and Their Assessment Using the LCOE Method" Energies 14, no. 24: 8473. https://doi.org/10.3390/en14248473
Note that from the first issue of 2016, this journal uses article numbers instead of page numbers. See further details here.