1. Introduction
Cavitation phenomena have been studied by many authors [
1,
2,
3,
4,
5,
6] and can be used to intensify heat and mass transfer processes [
7,
8,
9]. In order to develop an effective method of a controlled cavitation effect on technological processes, one should have a clear understanding of the physical nature of cavitation mechanisms and their relevant description in spatial and temporal scales.
For years, cavitation has been considered one of the areas of hydrodynamics associated with the elucidation and elimination of negative causes of erosion destruction of the surfaces of propellers, hydraulic turbine blades, and hydraulic devices [
10,
11,
12]. It was determined that surfaces are eroded under the action of shock waves and cumulative jets formed by the micro-explosions of bubbles, considered as hollow caverns in hydrodynamics [
13,
14,
15]. Within these mechanisms alone it is difficult to explain the destruction of molecular and colloidal structures and other cavitation effects at the microlevel in the liquid itself. When cavitation is analyzed within hydrodynamics, the impact of thermal factors on the development and specific manifestation of cavitation effects is excluded. To a certain extent, such an approach has been valid to date, although it has been determined that at the maximum compression stage, the vapor–gas medium temperature inside the cavitation bubble exceeds 5000 K, and the pressure increases up to 1000 MPa [
16,
17,
18]. It is assumed that the thermal energy released in the bubble volume is sufficient for the excitation, ionization, and dissociation of water vapor molecules and gases present in the bubble, the formation of free radicals, acceleration by 5–6 orders of magnitude of the rates of gas-phase chemical reactions [
19,
20,
21], and even initiation of nuclear fusion reactions in cavitation bubbles [
22,
23]. That is, under certain conditions, various physical or chemical processes can be initiated in local zones of the liquid while concentrating energy to abnormally high values. The following problem is still to be solved: What conditions are required for the appearance of such effects? At the same time, high-temperature processes in the gas phase (in the cavitation region) do not explain the cavitation effect on disperse inclusions present in the liquid phase (droplets of another liquid in emulsions, particles in suspensions, etc.), assuming the existence of alternative mechanisms.
Reliable theoretical analysis of cavitation mechanisms is hindered, in the authors’ opinion, by the lack of generalizing mathematical models with maximum consideration of the main physical factors. Modeling is usually performed with respect to the analysis of a specific experiment without considering the interfacial heat exchange and kinetics of phase transitions; the bubble compression process is assumed to be adiabatic [
2,
24,
25]. The principles of a mathematical model for the dynamics of bubble formation and development in emulsions based on the laws of cavitation described above, with the effect of thermodynamic processes in the cavitation region, are considered in [
26,
27]. The model validation in the analysis of experimental results defines this approach as having potential.
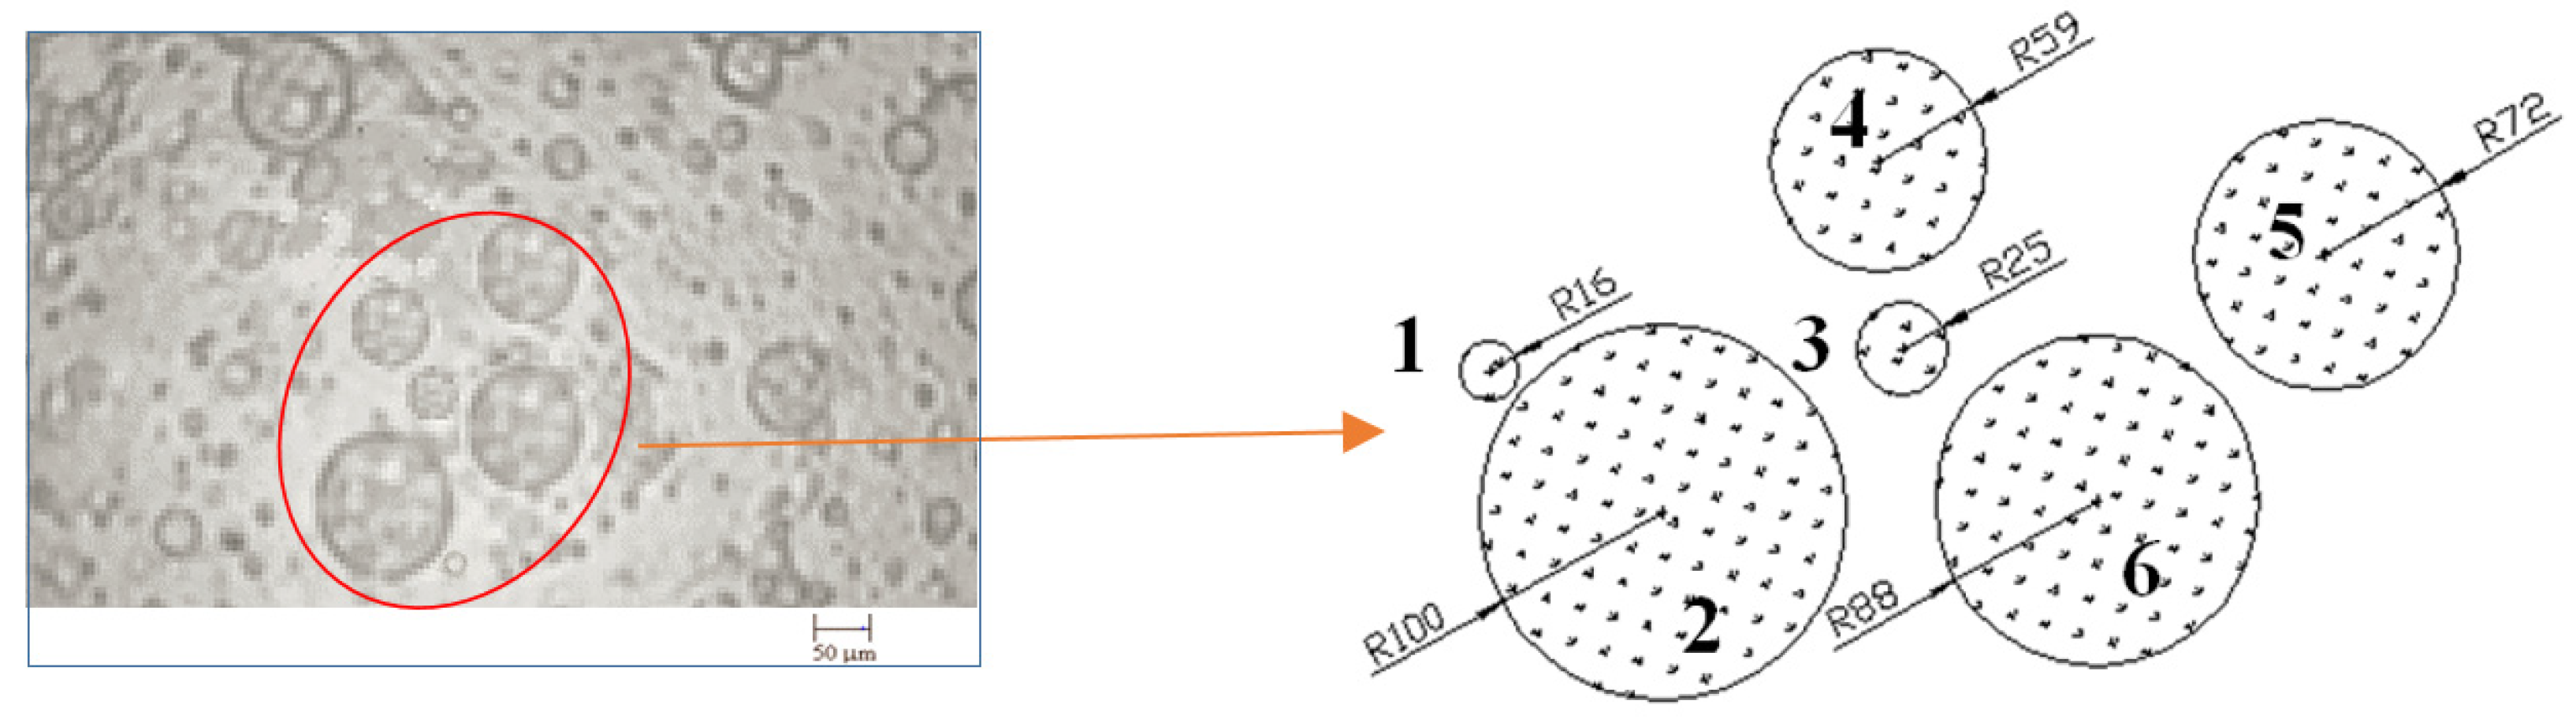
The purpose of this study is to investigate the mechanisms of the cavitation effect on water emulsions (
Figure 1) containing micro-dispersions, molecular and colloidal structures relevant to improving the design of cavitating devices, and substantiating their optimal operating modes.
Figure 1 shows one example of how thermal cavitation treatment can be applied to homogenization technologies for liquid fuels.
The tasks aimed at the efficiency increase of heat and mass transfer processes are very important for almost all heat technologies. One of the most efficient methods used to increase the intensification of heat and mass transfer processes is the use of emulsions as operating media [
28,
29,
30,
31,
32], containing various mutually insoluble liquids with certain thermophysical characteristics. An increase in the emulsion temperature is accompanied by their structure change, the breakage of dispersed fluid droplets, or their merging. When thermolabile liquid boils, heat and mass transfer processes are intensified in the emulsion due to the abnormally rapid change in the vapor phase volume and turbulence transition of the medium flow; it undoubtedly increases the efficiency of these processes. The phenomena similar to those described above (cavitation) occur in the vapor layer of the boiling thermolabile part. They have been studied by many researchers [
33,
34,
35], but these phenomena require further consideration in terms of heat and mass transfer efficiency. Moreover, the processes which induce abnormal values of pressures and temperatures in the case of thermodynamic cavitation and their application represent a separate important problem. One of the possible issues to be solved using such thermal cavitation initiation is homogenization technology.
It is worth mentioning that there is no general approach to the management of cavitation processes to obtain the expected disperse structure. Our proposed thermal cavitation method may be used to evaluate such effects. Its main ideas are described below.
2. Assessment of Dynamic and Thermal Cavitation Effects
Despite different and often contradictory definitions of cavitation, we will adhere to the following general formulation. Cavitation is a set of phenomena in a liquid when the pressure pe drops below the saturation pressure at temperature ps (T), and then it rises sharply above this level. If pe < ps (T), it is possible to observe the formation and growth of vapor bubbles both during hydrodynamic cavitation and thermal cavitation, when the pressure in a liquid, preliminarily superheated under excess pressure, is sharply reduced. Then, vapor bubbles appear at the interface of the dispersed inclusions of the emulsion. At pe > ps (T) they get compressed and subsequently destroyed (explosion). In both cases, a nonequilibrium process of the bubble system proceeds to the state of thermodynamic equilibrium, making it possible to describe bubble boiling and cavitation within the framework of one model, using the same Equations but under different initial conditions.
This concept forms the basis of the mathematical model of bubble dynamics, presented in [
26,
27].
The entire period of the cavitation effect development is accompanied by the growth and subsequent destruction of bubbles. A pulsating cavitation cluster inevitably appears in hydraulic turbines, pumps, and in various devices where the above conditions of pressure drop are realized [
36].
Let us consider the process of vapor bubble compression in water under condition
pe >
ps (
T). At the beginning of compression, the vapor pressure inside the bubble is
pint ≈
ps (
T) and the pressure in a liquid at the bubble wall is
pi = pint −
2σ (
T)/
R −
µ(
T)
∙v/
R, where
R is the bubble radius,
ν is the liquid radial rate at the bubble interface, and
σ(
T) and
µ(
T) are surface tension and viscosity coefficients. As a result of the pressure difference
pe −
pi, the liquid moves rapidly towards the bubble center, resulting in a sharp increase in vapor pressure and temperature in the collapsing bubble. The compression rate is regulated by interfacial heat transfer and vapor condensation on the “cold” bubble wall with condensation heat release. When vapor pressure
pint, compressed in the bubble, exceeds external pressure
pe, the liquid begins to decelerate, and its kinetic energy is converted into the potential energy of the compressed vapor and into the potential energy of the compressed liquid around the bubble. When kinetic energy is completely transformed, the bubble compression stops while pressure in the liquid at its boundary reaches its maximum value. The hydraulic hammer effect is realized, a compression wave propagates from the bubble into the liquid volume at the velocity of sound and its amplitude decreases with distance. Normally, when cavitation processes are modeled, the liquid is considered incompressible, while the hydraulic hammer phenomenon is not considered. To analyze the degree of the hydraulic hammer effect, the model [
27] was modified taking into account liquid compressibility. The liquid compressibility coefficient
kβ = f (
T,
p) and the temperature coefficient of adiabatic compression
α (
T,
p)
= ∂T/
∂p are introduced into the model as new parameters. Taking into account the compressibility, the motion Equation, included in the model’s basic system of Equations, is presented in the following form:
where
ρ(
T) is the liquid density. The derived Equation (1) differs from the classical Rayleigh–Plesset Equation usually used to describe cavitation processes in an incompressible liquid, by the term
in the numerator, considering the potential energy contribution of a compressed liquid, which is then realized in a force impulse form.
After the transition of the vapor parameters in the compressed bubble to the supercritical region, (
Tsteam >
Tcritical and
psteam >
pcritical), the liquid–vapor interface disappears (
σ (
Tcritical) = 0) and a quasi-spherical local zone is formed in place of a bubble with
Rmin radius within which water passes from a supercritical state to a condensed one. Similar effects are observed when the above is exposed to high pressures, even if the water temperature is below critical [
37]. We can assert that the thermal cavitation effect is not limited by the volume of a bubble with
Rmin radius where, as it is believed, only the ionization of vapor and gas molecules takes place, though covering a wider area.
When cavitation conditions are realized in a liquid, numerous vapor–gas bubbles forming a cavitation cluster grow and then simultaneously explode. The cavitation action effect is determined by the combined influence of all the cluster bubbles.
The superposition of shock waves from each individual bubble forms a single destructive shock wave. However, this concept fails to explain the destruction of micro objects (micro objects in
Figure 1) within the cluster itself. When cavitation cluster features are modeled and analytical calculation methods for cavitation reactors are developed, the temperature is often not even included in the model parameters [
14,
15]. In [
27], regarding the analysis of boiling processes, a model of the bubble ensemble dynamics is considered based on a model of the single bubble dynamics. Considering the liquid compressibility, we propose for it to be included in Equation (1), as this model makes it possible to predict the evolution of a cavitation cluster at all stages of its development and to describe the nature of microflows in the interbubble space of the cluster associated with bubble expansion or contraction. Nevertheless, in this work, a uniform distribution of gas bubbles in a liquid is assumed, which is practically unrealizable in real processes. Moreover, if we consider the problem with the temperature effect, then cluster sizes should be different, as shown in
Figure 1 since the clusters have a more complex structure.
Figure 2 shows the distribution of microflow velocity vectors at local points around vapor bubbles, modeled using the technique proposed in [
27] (gas bubble radii
R = 10–100 μm (in the diagram, the size of each bubble increases by 10 μm)), with the maximum liquid rate at the interface with bubbles being
vi = 220 m/s (superheating temperature is 110 °C).
Due to the superposition of radial flows of all the bubbles in the cluster, the pattern is quite complex. However, in real emulsions (
Figure 1), with distance from the bubble, the rate should change sharply in magnitude and direction, since the dynamics of bubble development depend on its size and distance to the neighboring bubbles, as well as their sizes.
Calculations show that shear rates in the interbubble space at local points at the boundaries of the interaction between flows can reach 10
4 s
−1, thus corresponding to a shear stress of about 0.8 kPa if the dispersion phase is water (in these calculations, a water emulsion in fuel oil was used). However, if we use a procedure that focuses on a uniform distribution of low-boiling liquid droplets, as shown in
Figure 2, we will not get the resultant flux. The dynamic effects are identical around each droplet and they will be mutually compensated. It does not correspond to the effects in real emulsions, where under similar conditions a circulating flow in the emulsion volume would occur. It is thought that the values of local velocities and accelerations will be different as they should also affect adjacent droplets. Since they have different sizes and are arranged in a chaotic manner, these effects will differ in level and direction. The resulting effect can be much more significant when the dynamic effects are directed towards the opposite droplets. It is also important to bear in mind that depending on the size of the droplets, dynamic effects can occur at different times. For example, if a small droplet evaporates very quickly, resulting in a strong dynamic effect, it may already be realized before the effect of a relatively larger droplet occurs; the resulting effect can be turbulization of the fluid volume, an increase in heat flow, or emulsion homogenization.
It is essential that even at the stage of monotonic cluster expansion when the bubble growth rate does not exceed 2 m/s, the shear rates in liquid local zones are quite high—in the order of 7 × 10
3 s
−1, comparable to the shear rates achieved in homogenizers. Thus, if a high level of thermal action is realized only at the stage of maximum cluster bubble compression, at a time interval of tens of nanoseconds, then the effective influence of shear stresses manifests itself during the entire cluster lifetime. We can consider the additional effect of liquid temperature on the above processes in terms of, for example, homogenization technologies. We assume that the creation of cavitation effects through increasing the superheated pressure with a subsequent sharp decrease will create anomalous dynamic effects at the boundaries of growing vapor bubbles (at the moment of their explosion), which make it possible to crush all the dispersed inclusions in a liquid. We refer to this method as the thermal cavitation homogenization;
Figure 1 shows the effect of such an initiation (
Figure 1c), as a result of which a homogeneous emulsion is obtained.
However, the method described in [
27], used for the assessment of microflow intensity and resulting dynamic effects, does not ensure a result ready for practical use but only reflects some of the physical processes inherent in the model. To assess the real practical effects, it is necessary to modify the model, as proposed in [
27], taking into account the real structure of the liquid.
Thus, cavitation effects can also be used for breaking secondary phases in liquids. To do this, it is necessary to develop a quantitative assessment for these phenomena, which would also be suitable for their management.
3. Determination of a Sufficient Level of Supplied Energy to Intensify Heat and Mass Transfer Processes
There is a fundamental difference in the application of methods to affect a dispersed system to crush the dispersed phase and intensify transfer processes. Dispersion breaking is a one-stage action that can either take place instantly, if the intensification level is high enough, or it will not proceed at all, even with an infinitely long energy impact, if the intensification level is below a critical value. Heat and matter transfer in the system, on the contrary, proceed even at the lowest levels of intensification, and any increase in external action only proportionally increases the speed of these processes. However, transfer processes at a certain energy level can also intensify a mass transfer (breaking processes subject to the conversion of thermal energy into kinetic energy).
If, for example, the problem is solved using a certain mixing device to create an emulsion with a given particle size of the dispersed substance in a small container, then you can stir the liquid mixture as long as you like and spend a huge amount of energy, but the required result cannot be achieved if the speed of the mixer (introduced power W0) is not high enough. At energy, consumption is . It is enough to slightly increase the number of revolutions to achieve the required power level Weff and under specified conditions, an emulsion with a given particle distribution will be obtained in a very short time with low energy consumption . In this example, the result is achieved with the mandatory exceeding of a certain power level Weff in the working volume of the apparatus, whilst Weff and are mutually independent parameters.
Thus, with the intensification of mass transfer processes, a maximum power value is also obtained. Therefore, when intensification methods are used to break up dispersions, the specific power level must exceed a certain value to ensure a positive effect of the operation. To obtain the required effect with minimal energy consumption, it is necessary to provide a specified power level () for a short time () or, in other words, convert the input energy into short but powerful impulses.
In this work, within the framework of the model of cavitation bubble growth, the authors studied velocity fields and pressures in the liquid phase (in emulsion) at the final stage of destruction (explosion) of the cavitation cluster, i.e., at the moment of transformation of the liquid thermal energy into the kinetic energy of motion at the vapor cluster boundary. These processes take place in zones of low surface tension—at the interface between emulsion phases (
Figure 3). When the vapor cavity expands, the pressure decreases and, accordingly, the vapor temperature. Compression is accompanied by an increase in temperature and pressure as well as the corresponding phase transitions. These processes are considered by the authors to be an “internal” task, well addressed in previously published works (e.g., [
26,
27]). An abrupt expansion of the vapor region boundary causes a dynamic effect on the neighboring droplets and, as a result, they can split into smaller (thermodynamically stable) clusters if the condition
is met. The combined effect of these phenomena and the external effects, described in
Section 1 and
Section 2, provide a significant dynamic effect that can be used practically in homogenization technologies.
The mathematical models, presented in the works cited above, enable qualitative assessment of the described phenomena; however, they cannot be used to determine the effective power in homogenization technologies and to predict the effect when such a power is introduced into the emulsion.
4. An Estimation Procedure for Dynamic Effects in a Cluster during the Liquid Boiling Estimation of the Energy Input Level
We first demonstrate how to estimate the effects that can be achieved when energy is input into the emulsion volume, e.g., by preheating and rapid pressure release, for a single low-boiling liquid droplet.
Calculations have been shown in
Figure 3, using the mathematical model given in [
27], taking into account the modified Equation (1) to determine the acceleration of the vapor–liquid interface and the conditions below. The superheating temperature of the primary emulsion (
Figure 1) is 180 °C, for droplet sizes of the dispersed phase shown in
Figure 2.
The resulting acceleration, taking into account (1), is calculated as follows:
where
xi are the initial coordinates of droplet centers;
di = |xi −
x| is the radius vector;
x is a coordinate of the acceleration calculation point;
v is the oil–vapor interface motion rate for the
i-th droplet; and
Ri is the radius of the oil–vapor interface of the
i-th droplet. The higher the acceleration of the phase interface, the higher the force that occurs when water starts boiling.
The graphs show that the smaller the initial droplet radius is, the more intensively the vapor phase grows, i.e., the interface rate and acceleration are higher. Therefore, in real emulsions where dispersed particles of different diameters are present, remote from each other at different distances, the dynamic effects during boiling of the thermolabile emulsion part (water in our example) will have different dynamics of cavitation effects. In this case, the idealized picture of dynamic effects shown in
Figure 2 and, accordingly, their assessment methods, cannot be applied. At different droplet radii, both joint maximums (minimums) of the rate (acceleration) and significant differences in these rates (accelerations) can be observed. Considering that rates (accelerations) for different initial radii have different amplitudes and frequencies of variation in time, it can be assumed that at some point in time Kelvin–Helmholtz instability is possible, and, for acceleration, Rayleigh–Taylor instability.
Let us analyze the conditions that can result in a certain instability. By joint analysis of the Bond and Weber criterion [
27], as well as their critical values, with the Rayleigh–Plesset Equation, it follows that critical forces, resulting in Rayleigh–Taylor or Kelvin–Helmholtz instability, respectively, are as follows:
Comparison of (4) and (5) shows that = 1.33, but these forces are caused by various factors, and they cannot be identified.
Deformation and breaking of both the vapor layer and water droplets in water–oil emulsions can be caused by different directions of both the acceleration vector and velocity vector. Let us assume that deformation, breaking, or displacement will occur only if the acceleration vector has a positive direction and, regardless of it, the rate vector is also positive. If we consider the mutual influence of droplets No. 1 and No. 2 (
Figure 4) located at a distance
l, i.e.,
x1 = 0,
x2 =
l, then the acceleration tending to destruct the interface of droplet No. 1 is
where
is determined by Equation (7);
Then, the force caused by the flow acceleration or deceleration is
Similarly, it can be written for the rate
where
.
Then the dynamic head force is
As is known, the capillary force Fσ, regardless of a deformed droplet shape, is always directed so as to restore the spherical shape, i.e., in order for Gibbs free energy to be minimal. Therefore, if a deformed droplet takes the shape of an oblate ellipsoid, the capillary force opposes the external force. If it is deformed into an oblong ellipsoid, then the capillary force coincides in direction with the external force and the droplet will be unstable, while the shape of an oblate ellipsoid can be quasi-stable.
The minimum of a given capillary force is possible. We will assume that this minimum is determined by the Laplace force:
Thus, if the dynamic action from the neighboring droplet exceeds the force Fσ, the droplet will be deformed or broken; if the forces are equal, equilibrium will occur; and if Fσ > FBo,We, repulsion without deformation will take place.
Differences between
FBo,We and
Fσ are equal:
Following the example of the force, resulting from flow acceleration or deceleration, the following conditions can be written: —breaking; —deformation; —equilibrium; and —displacement.
The system of Equations (7)–(11) for particle No. 2, located at a distance of
l from the first particle, will take the following form:
where
;
; and
.
Thus, dynamic effects from neighboring droplets of low-boiling liquid can make them move or break if critical values of the Δ
FBo criterion are reached. If opposing forces are approximately equal, abnormal pressure can be observed, as pointed out by the authors of [
16,
17,
18]. However, each liquid droplet forms its own local dynamic effect during boiling and therefore the effect of all cluster particles shall be considered.
5. Condition for the Formation of a Superposition of Dynamic Effects and the Resulting Effect
The above considerations are valid for the determination of the resulting force sufficient to break the droplet. However, different situations of cluster development are possible. For instance, if equal forces act on the droplet (No. 3,
Figure 4) from all sides, or their resultant does not exceed
, in this local vapor volume, it is possible to achieve the anomalous pressure and temperature values mentioned at the beginning of this paper. It is also important to evaluate the influence of the dynamic effect angle of action on the droplet surface.
In this part, breaking processes of dispersed phase droplets, surrounded by other droplets during their boiling up, will be analyzed. We take the emulsion shown in
Figure 1,
Figure 4 and
Figure 5 as a study object. This figure shows that there are “small” droplets between “large” droplets: the former serve as sources of increased dynamic forces at boiling up, thus initiating breaking processes of larger droplets due to significant differences in accelerations and growth rates between them.
The main types of instability emulsion structure will be considered: Kelvin–Helmholtz instability caused by the difference in rates and Rayleigh–Taylor instability, resulting from the difference in accelerations [
27].
When analyzing the possibility of dynamic effects, one can assume that the main role will be played by the forces acting along a normal component to the droplet surface, i.e., forces directed either towards the droplet center or away from it. Thus, the acceleration and rate, acting on the particle surface and directed towards its center (from the center) can be determined from the following Equations:
where
are coordinates of the droplet surface point and
is a correction for the normal component.
Correction
can be determined by
Figure 6:
The authors assume that acceleration and its resulting force are positive if they are directed towards the center and negative if they are directed away from the center. The rate (acceleration) vector of the liquid–vapor interface of the considered boiling up particle is considered positive if it is directed from the droplet center and negative if it is directed to the center.
The acceleration and velocity of the phase interface movement are determined by the following expressions:
where
N is the total number of boiling up dispersed phase droplets.
Taking angle
β as a variable (
Figure 6), the coordinates of the required opposite points of the particle surface may be represented, where dynamic effects are directed to
where
x,
y are the particle coordinates;
xs1,
ys1 are coordinates of the droplet side surface (0 ≤ α ≤ 180) from
Figure 6; and
xs2,
ys2 are the opposite side coordinates (180 ≤ α ≤ 360).
Then, correction
knr will be determined by the following expressions:
In Equation (24), xs2, ys2 are calculated, taking into account 0 ≤ α ≤ 180 and knr at β = β + 180.
Let us consider how the magnitude and direction of the force acting on the surface of the analyzed droplets (
Figure 4 and
Figure 5) changes. Its value is determined by the acceleration of the vapor cavity boundary when the pressure of the emulsion preheated to t
0 ≈ 105 °C decreases, to an atmospheric pressure equal to 10
5 Pa. For all droplets, a vapor layer equal to 1 µm at the initial moment of time is assumed. The acceleration change pattern on the surface of the analyzed droplets shows in which direction and how the resulting force will change. Calculation results for water–oil emulsion according to Equations (20)–(24) are shown in
Figure 7 and
Figure 8.
The graphs clearly show the relationship between the angles of the droplets and the acceleration values of the interface. Thus, for example, for droplet No. 2 (
Figure 4) there are two acceleration maximums at once: angle
and
, corresponding to angles of the nearest neighboring droplet No. 1 and No. 3 arrangement, respectively. As the Figures show, there are always several acceleration (force) maximums.
Let us analyze a boiling emulsion droplet (
Figure 9) affected by external forces.
If the maximum of two forces acting on opposite sides is and is at an angle of β1 to axis y, the maximum force acting on one side is Fs1 and at an angle of β2 from axis y (, where ). The force acting from the droplet side is F, with , , , . Then, the opposing force will be able to mitigate all forces, except . Therefore, only one difference will determine the resulting force, which can cause either deformation or breaking. This force is equal to .
Thus, it is obvious that though the maximum of two opposing forces is at angle β1 to axis y, the determining maximum is the one caused by force (angle β2).
This is the distinguishing feature of our method used for the assessment of dynamic effects from those cited in
Section 1 and
Section 2. They basically do not consider the dynamic effects from all cluster droplets and the superposition principle implies the coincidence of the force vector direction, as shown in
Figure 2. However, a (secondary) liquid droplet can be deformed or even destructed when tangential stresses arise inside the cluster. Therefore, the issue of what initiation level should be used to destruct the clusters and what sizes of secondary liquid droplets in the emulsion will be formed under such an action is still to be solved.
For a non-boiling droplet, the force acting on its surface, considering the assumed conditions, is determined by the following acceleration:
where
is a coefficient, considering the direction of the acceleration action;
is acceleration, acting on the inclusion surface at
; and
is acceleration, acting on the inclusion surface at
.
The force that can result in breaking of a non-boiling inclusion of a dispersed phase is determined by the maximum acceleration:
For a boiling up particle, two force maximums are determined due to accelerations, acting on one side of the inclusion:
and on opposing sides of the inclusion:
The acceleration maximums and correspond to accelerations and , respectively.
Considering that the droplet dynamic effect cannot destruct the droplet itself, it is possible to write Equations to calculate the acceleration and rates of flow in the cluster resulting in its destruction. If the resulting acceleration or rate is positive, then they cause instability, and if they are negative, then there is no destabilizing effect. One may write
where
is the resulting acceleration, acting on one side of the inclusion and
is the acceleration of the oil–vapor inclusion interface.
For the opposite side, one can write an Equation similar to (29) but inserting and instead of and , respectively.
Then, the resulting acceleration will be determined by the following Equation:
with the following required conditions:
If the force maximums (accelerations, rates) do not coincide, acting on the opposite sides of the inclusion and on the one side, we consider that the total force that is of greater importance is determined by
where
is the resulting acceleration.
Similarly, we can get an Equation for the rate. At the same time,
where
It is generally accepted that the structural stability of the emulsion is determined by the instability according to the Bond criterion [
27]. The force, acting at
, is equal to
The opposing force from the oil–vapor interface of the droplet itself is
The resulting force acting on the droplet is
The critical force, resulting in Bond instability, is
The force determining a droplet deformation or displacement is
For each of the analysed droplets, the calculation is performed either until the condition
is met, or until the mutual meeting of droplets, determined by condition
where
,
;
i = 1, 2, …,
N;
j =
i + 1,
i + 2, …, N; and
i,
j are droplet numbers with corresponding coordinates
xi,
yi;
xj,
yj.
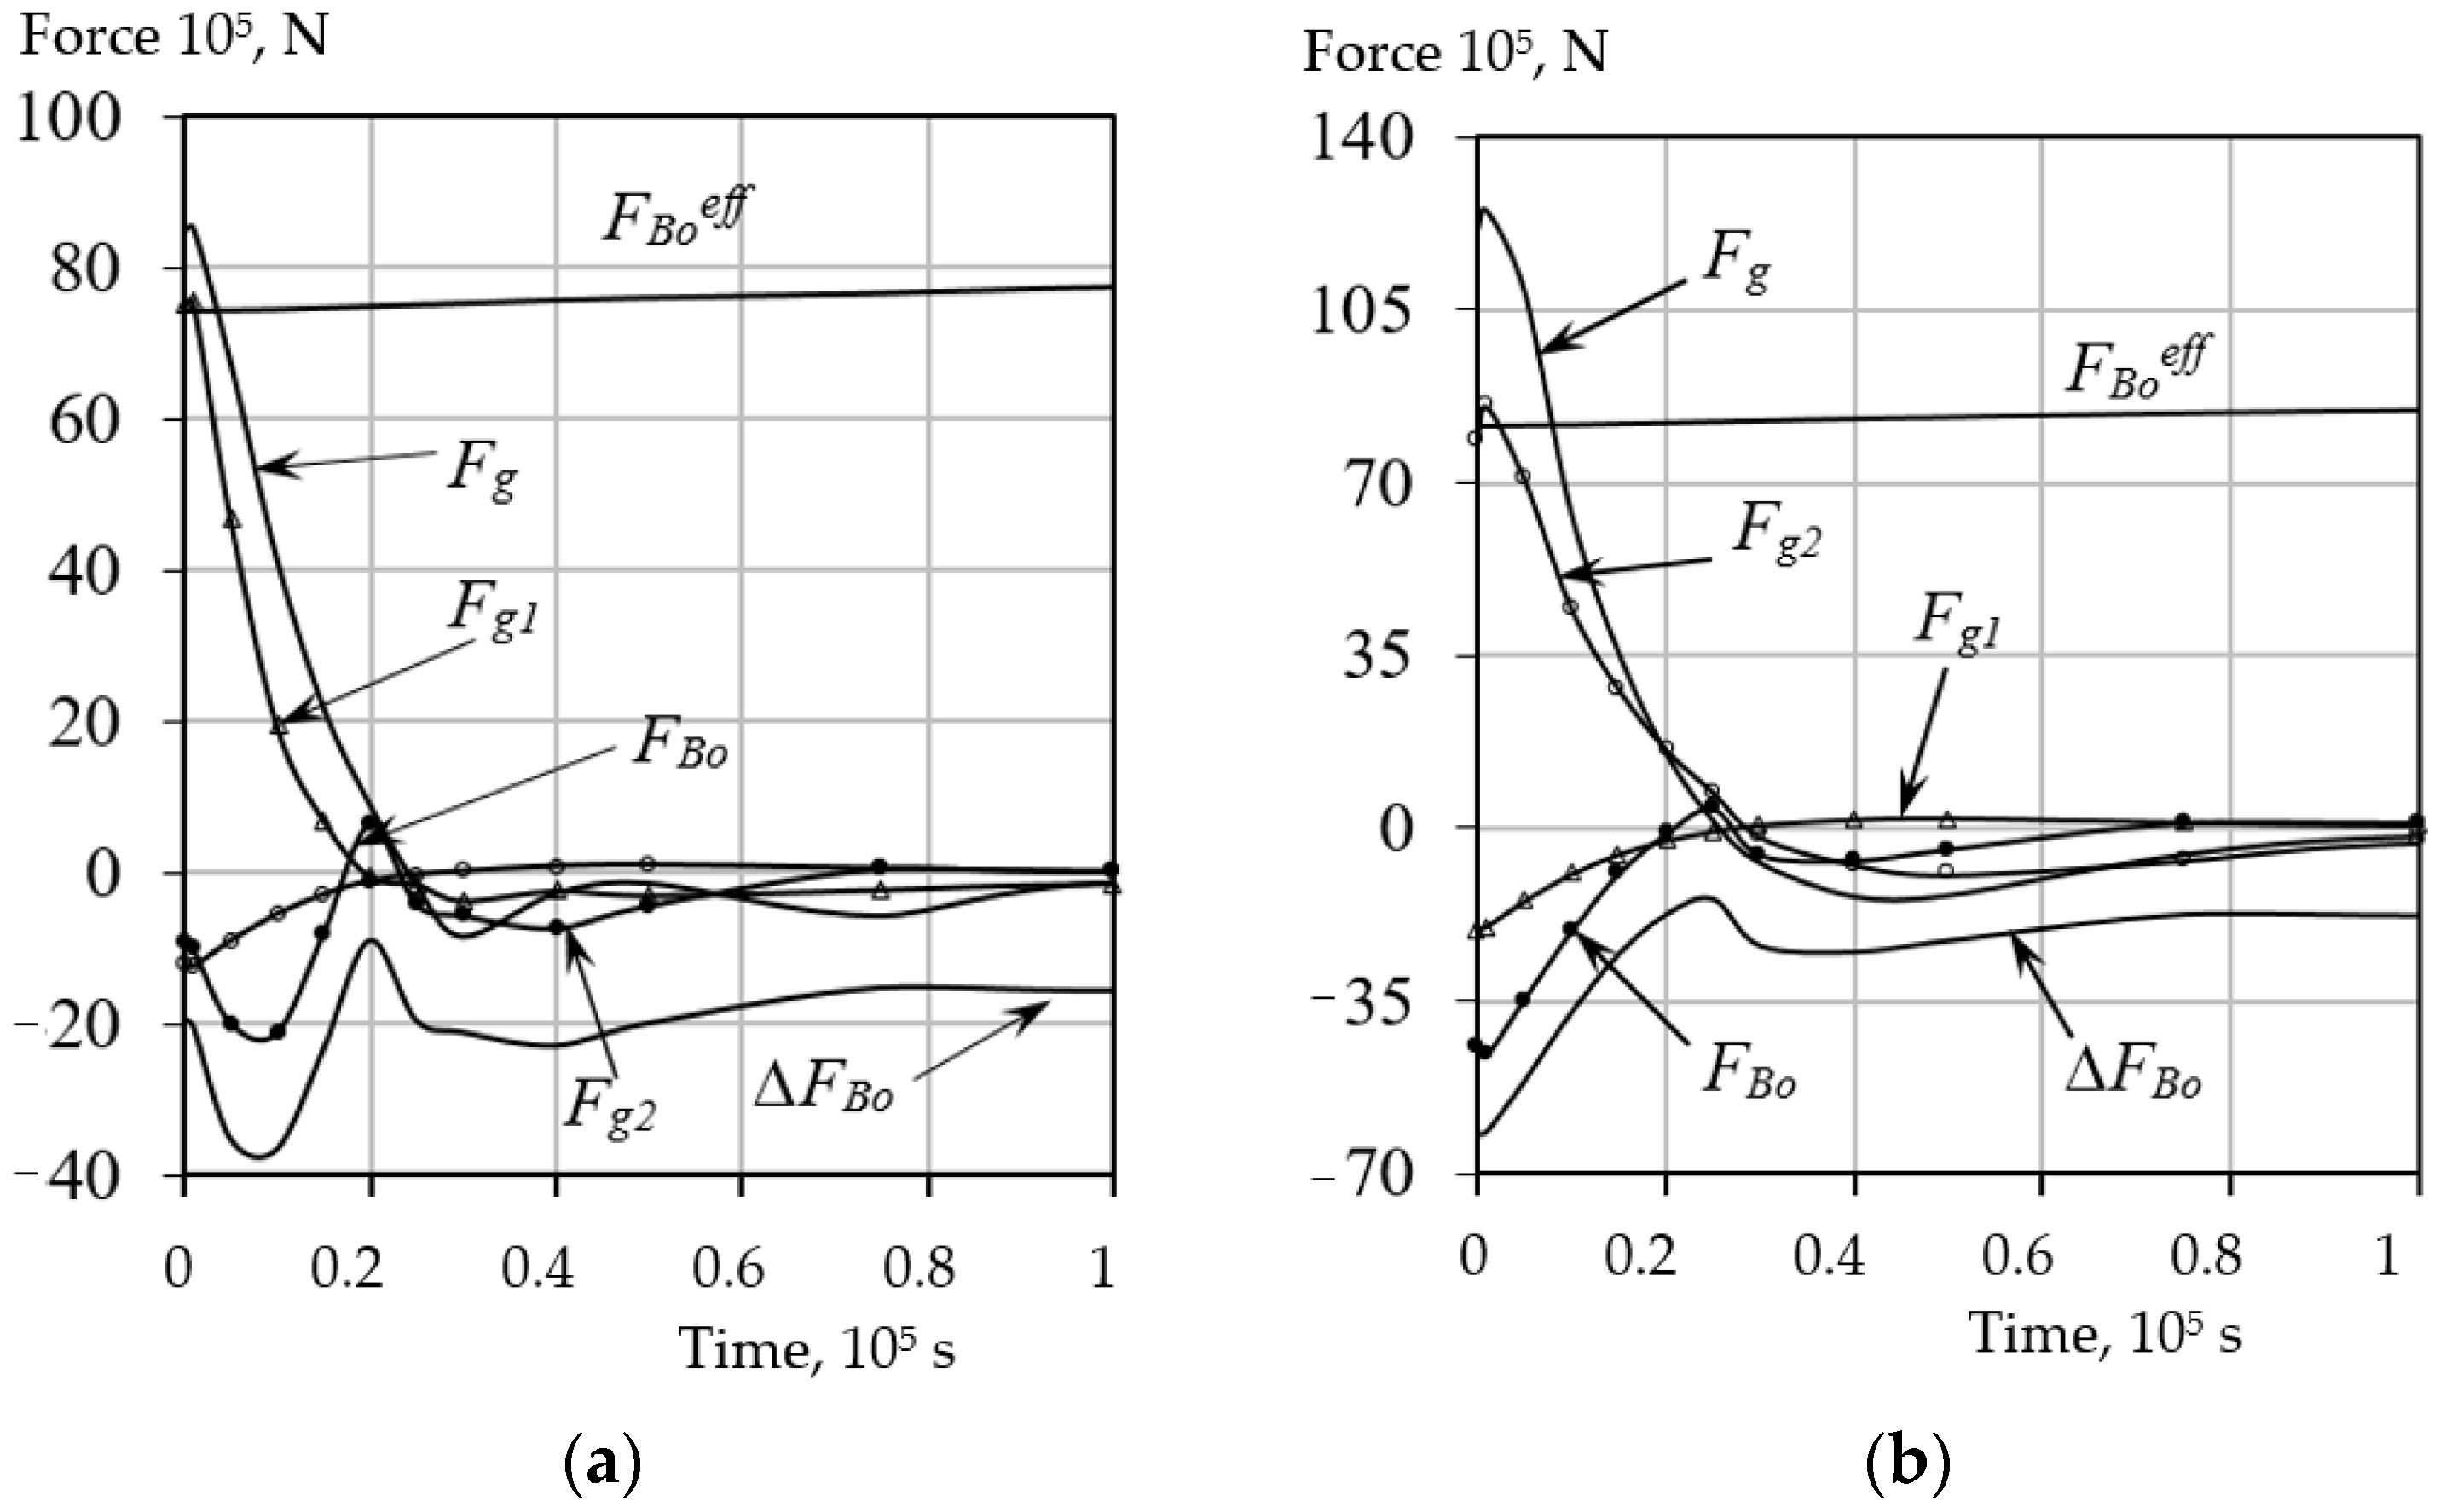
6. Results and Discussion
The calculation results are presented in
Figure 10,
Figure 11 and
Figure 12. The performed calculations (t
0 = 110 °C) showed that only droplets No. 2 and No. 6 will be destroyed at the initial moment of pressure release. This means that the level of the supplied effective power by emulsion superheating to the specified temperature is sufficient to break all emulsion droplets larger than droplet No. 6. To break smaller droplets, the superheat temperature must be increased.
The joint consideration of all the dynamic effects in a cluster makes it possible to determine the force FBo that can correspond to the level of effective impact on the cluster, being the cause of the dispersed phase breaking. The figures show that for droplets No. 1, 3, 4, and 5 with a positive value of force FBo, only their mutual displacement is possible, as indicated by a negative sign (at τ ≈ 2∙10−6 s).
To destroy these droplets, it is necessary to increase the supplied energy to the effective one. It can be achieved by raising superheating temperature and pressure (thermal cavitation initiation). The same effect can be obtained by using mixing devices, where local cavitation zones can appear on the blades at certain flow rates.
The calculations performed for overheating temperatures to = 130 °C and to = 170 °C demonstrated that, at the moment of instantaneous pressure release, almost all large droplets will be broken, while at to = 110 °C only two droplets will be broken due to boiling small neighboring particles.
As for the intensification of heat transfer processes, attention should be paid to the effect of heat accumulation by the high-boiling liquid. With a sudden drop in pressure of the superheated emulsion, the low-boiling liquid, e.g., water, evaporates partially or completely, depending on superheating level. The vapor temperature decreases during expansion. At the same time, a high-boiling fraction of the emulsion transfers the stored energy to vapor and water. Thus, we get an additional impulse of energy from the high-boiling phase. Temperature
T can be determined if we know the total liquid volume, the proportion of emulsion phases, and the size and number of the low-boiling fraction droplets. For example, if emulsion volume
is known to contain 30% water and 70% fuel oil, the number of water particles is
where
is the water droplet radius.
Then variation of fuel oil temperature in time is
where
are fuel oil mass and heat capacity and
is the fuel oil heat flow to be determined by the methods proposed in [
38].
For example, for an emulsion volume
= 0.3 × 10
−3 m
3 with 30% water and an average droplet size of
= 100 μm, the number of these droplets is approximately
= 1.8 × 10
7. The calculation results are shown in
Figure 13.
Figure 13 shows that heat flow for the considered example is approximately 1 W per particle. As the number of particles is
= 1.8 × 10
7, we can conclude that the heat exchange process is high-intensive, which would allow more heat to be removed or supplied in standard heat exchangers. Clearly, such effects can only be achieved with certain structural parameters of the emulsion, which can easily be determined using this method.


