
Hydrogen Station Location Planning via Geodesign in Connecticut: Comparing Optimization Models and Structured Stakeholder Collaboration

 , ,
, ,
Abstract
:
1. Introduction
1.1. Literature Review
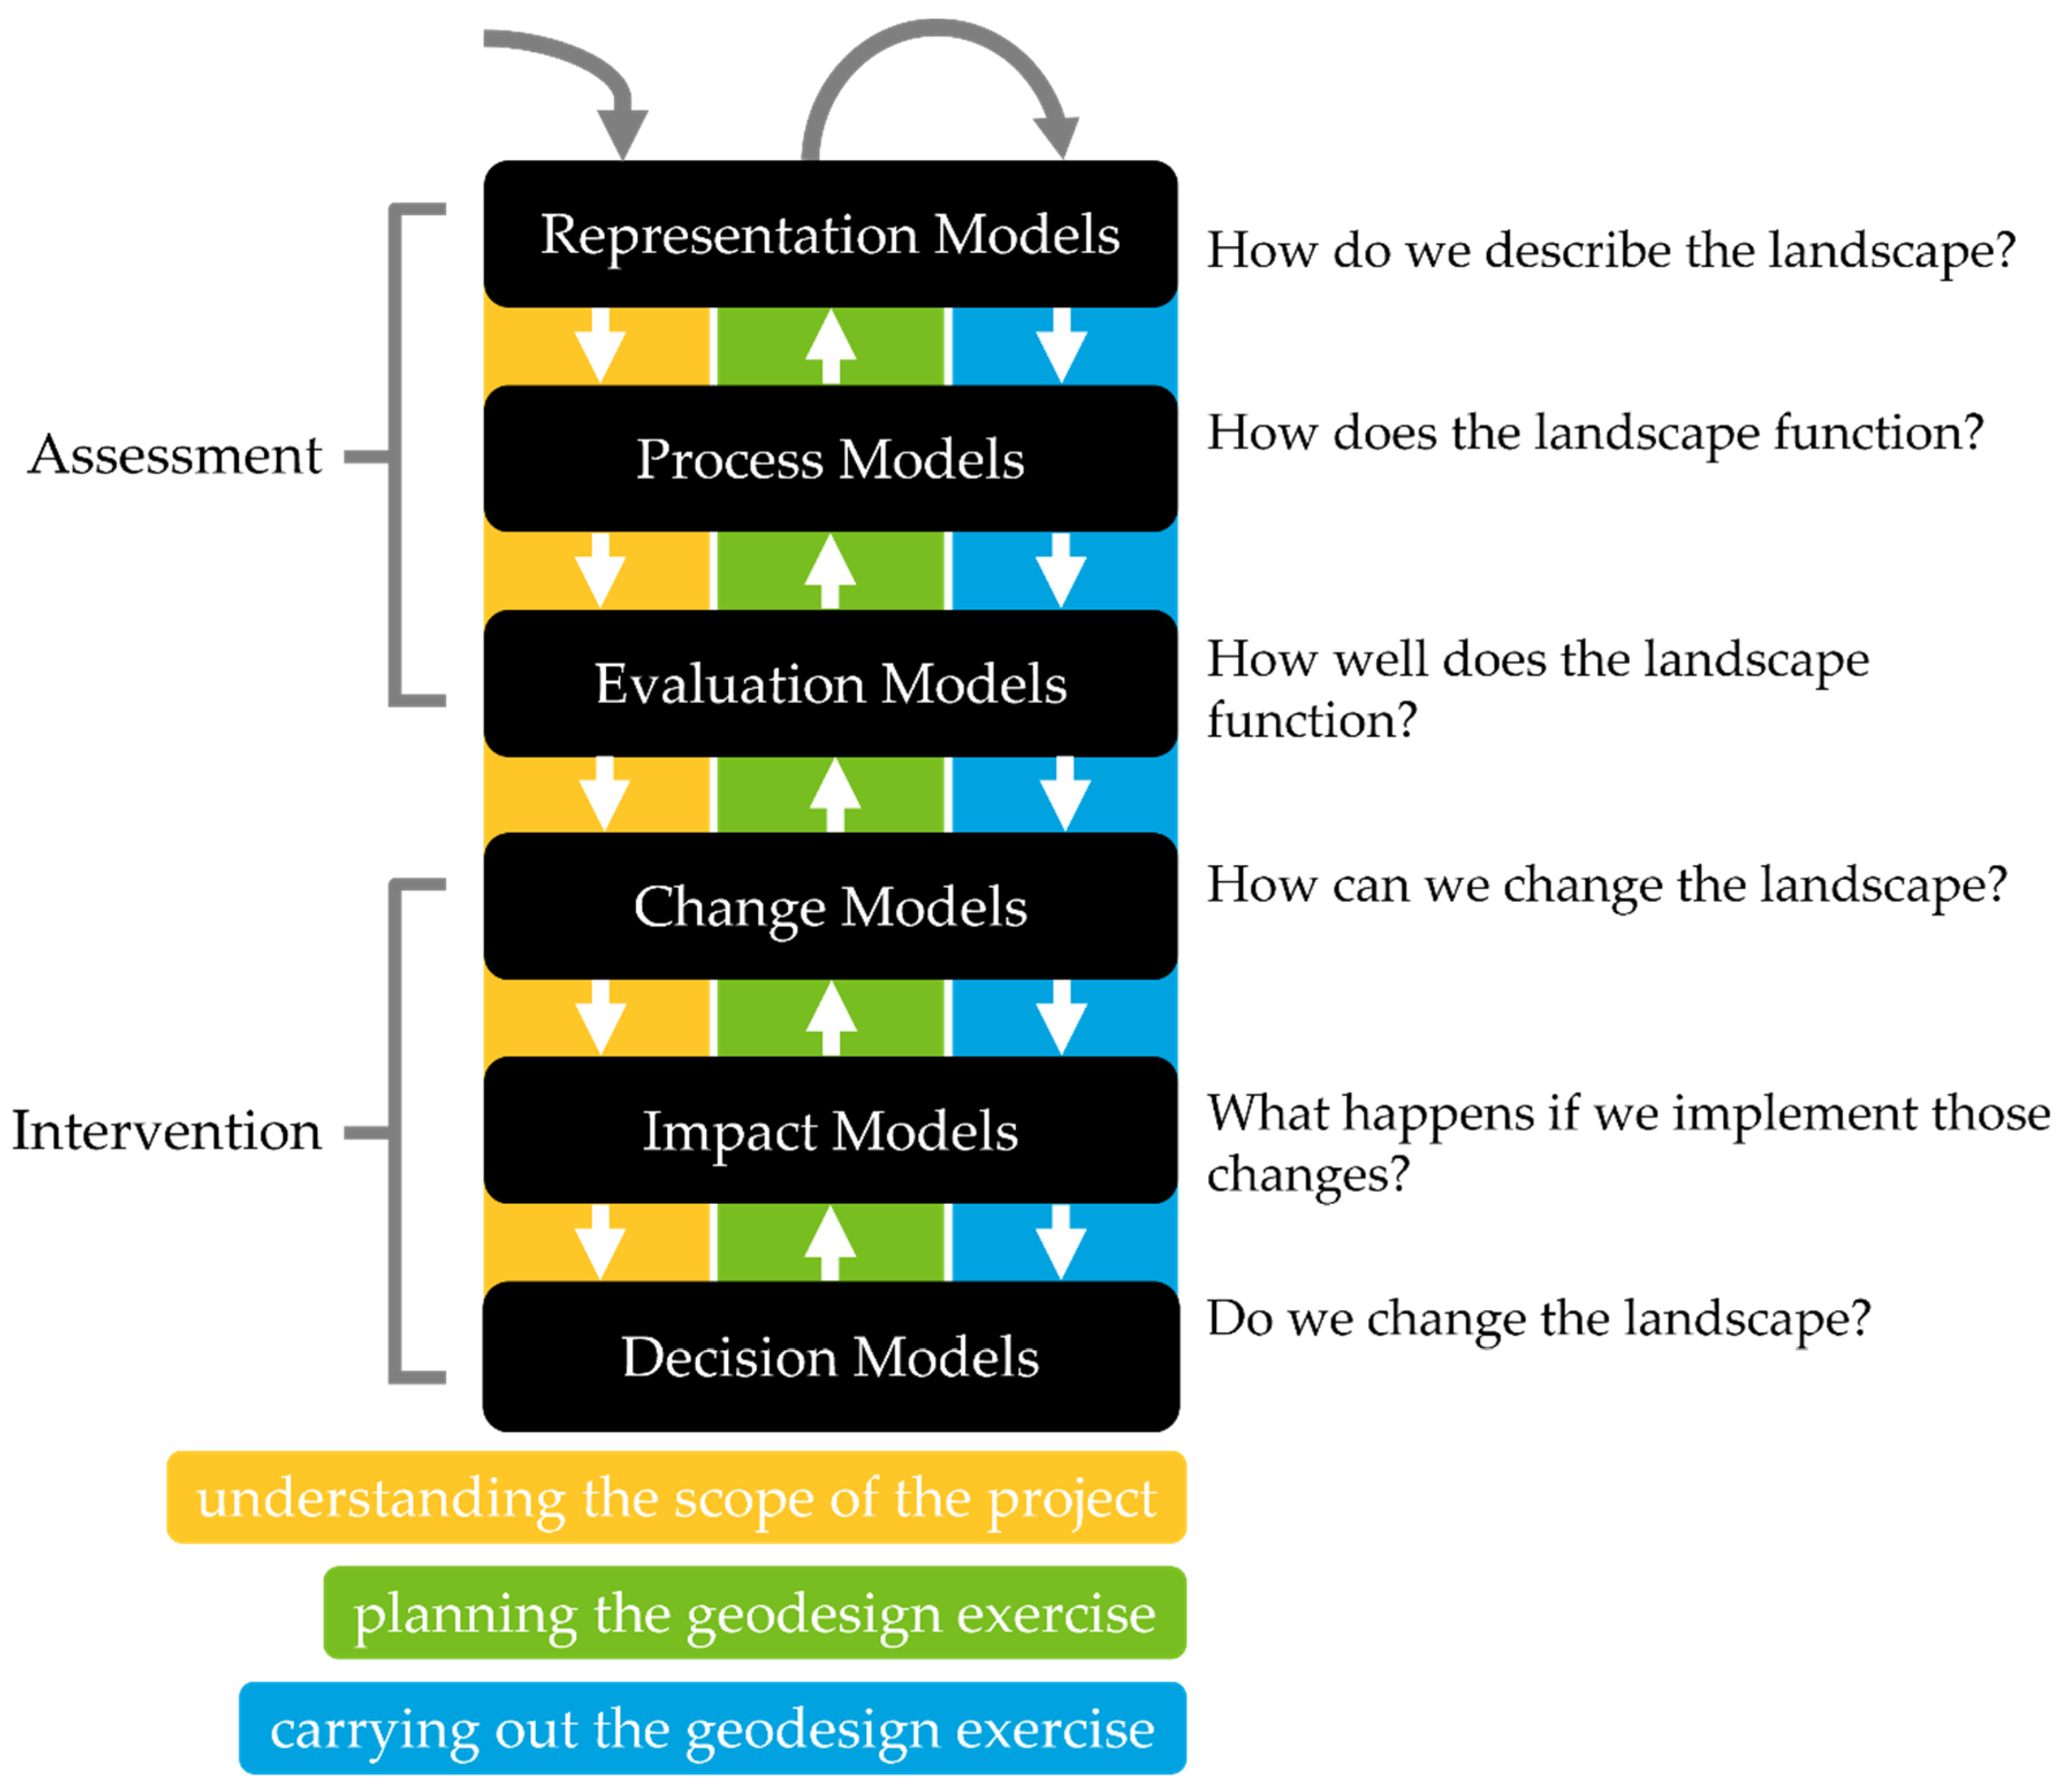
1.1.1. Geodesign
1.1.2. Methods for Locating Hydrogen Refueling Stations on a Network
Spatial Overlay Analysis
Optimization Models
2. Materials and Methods
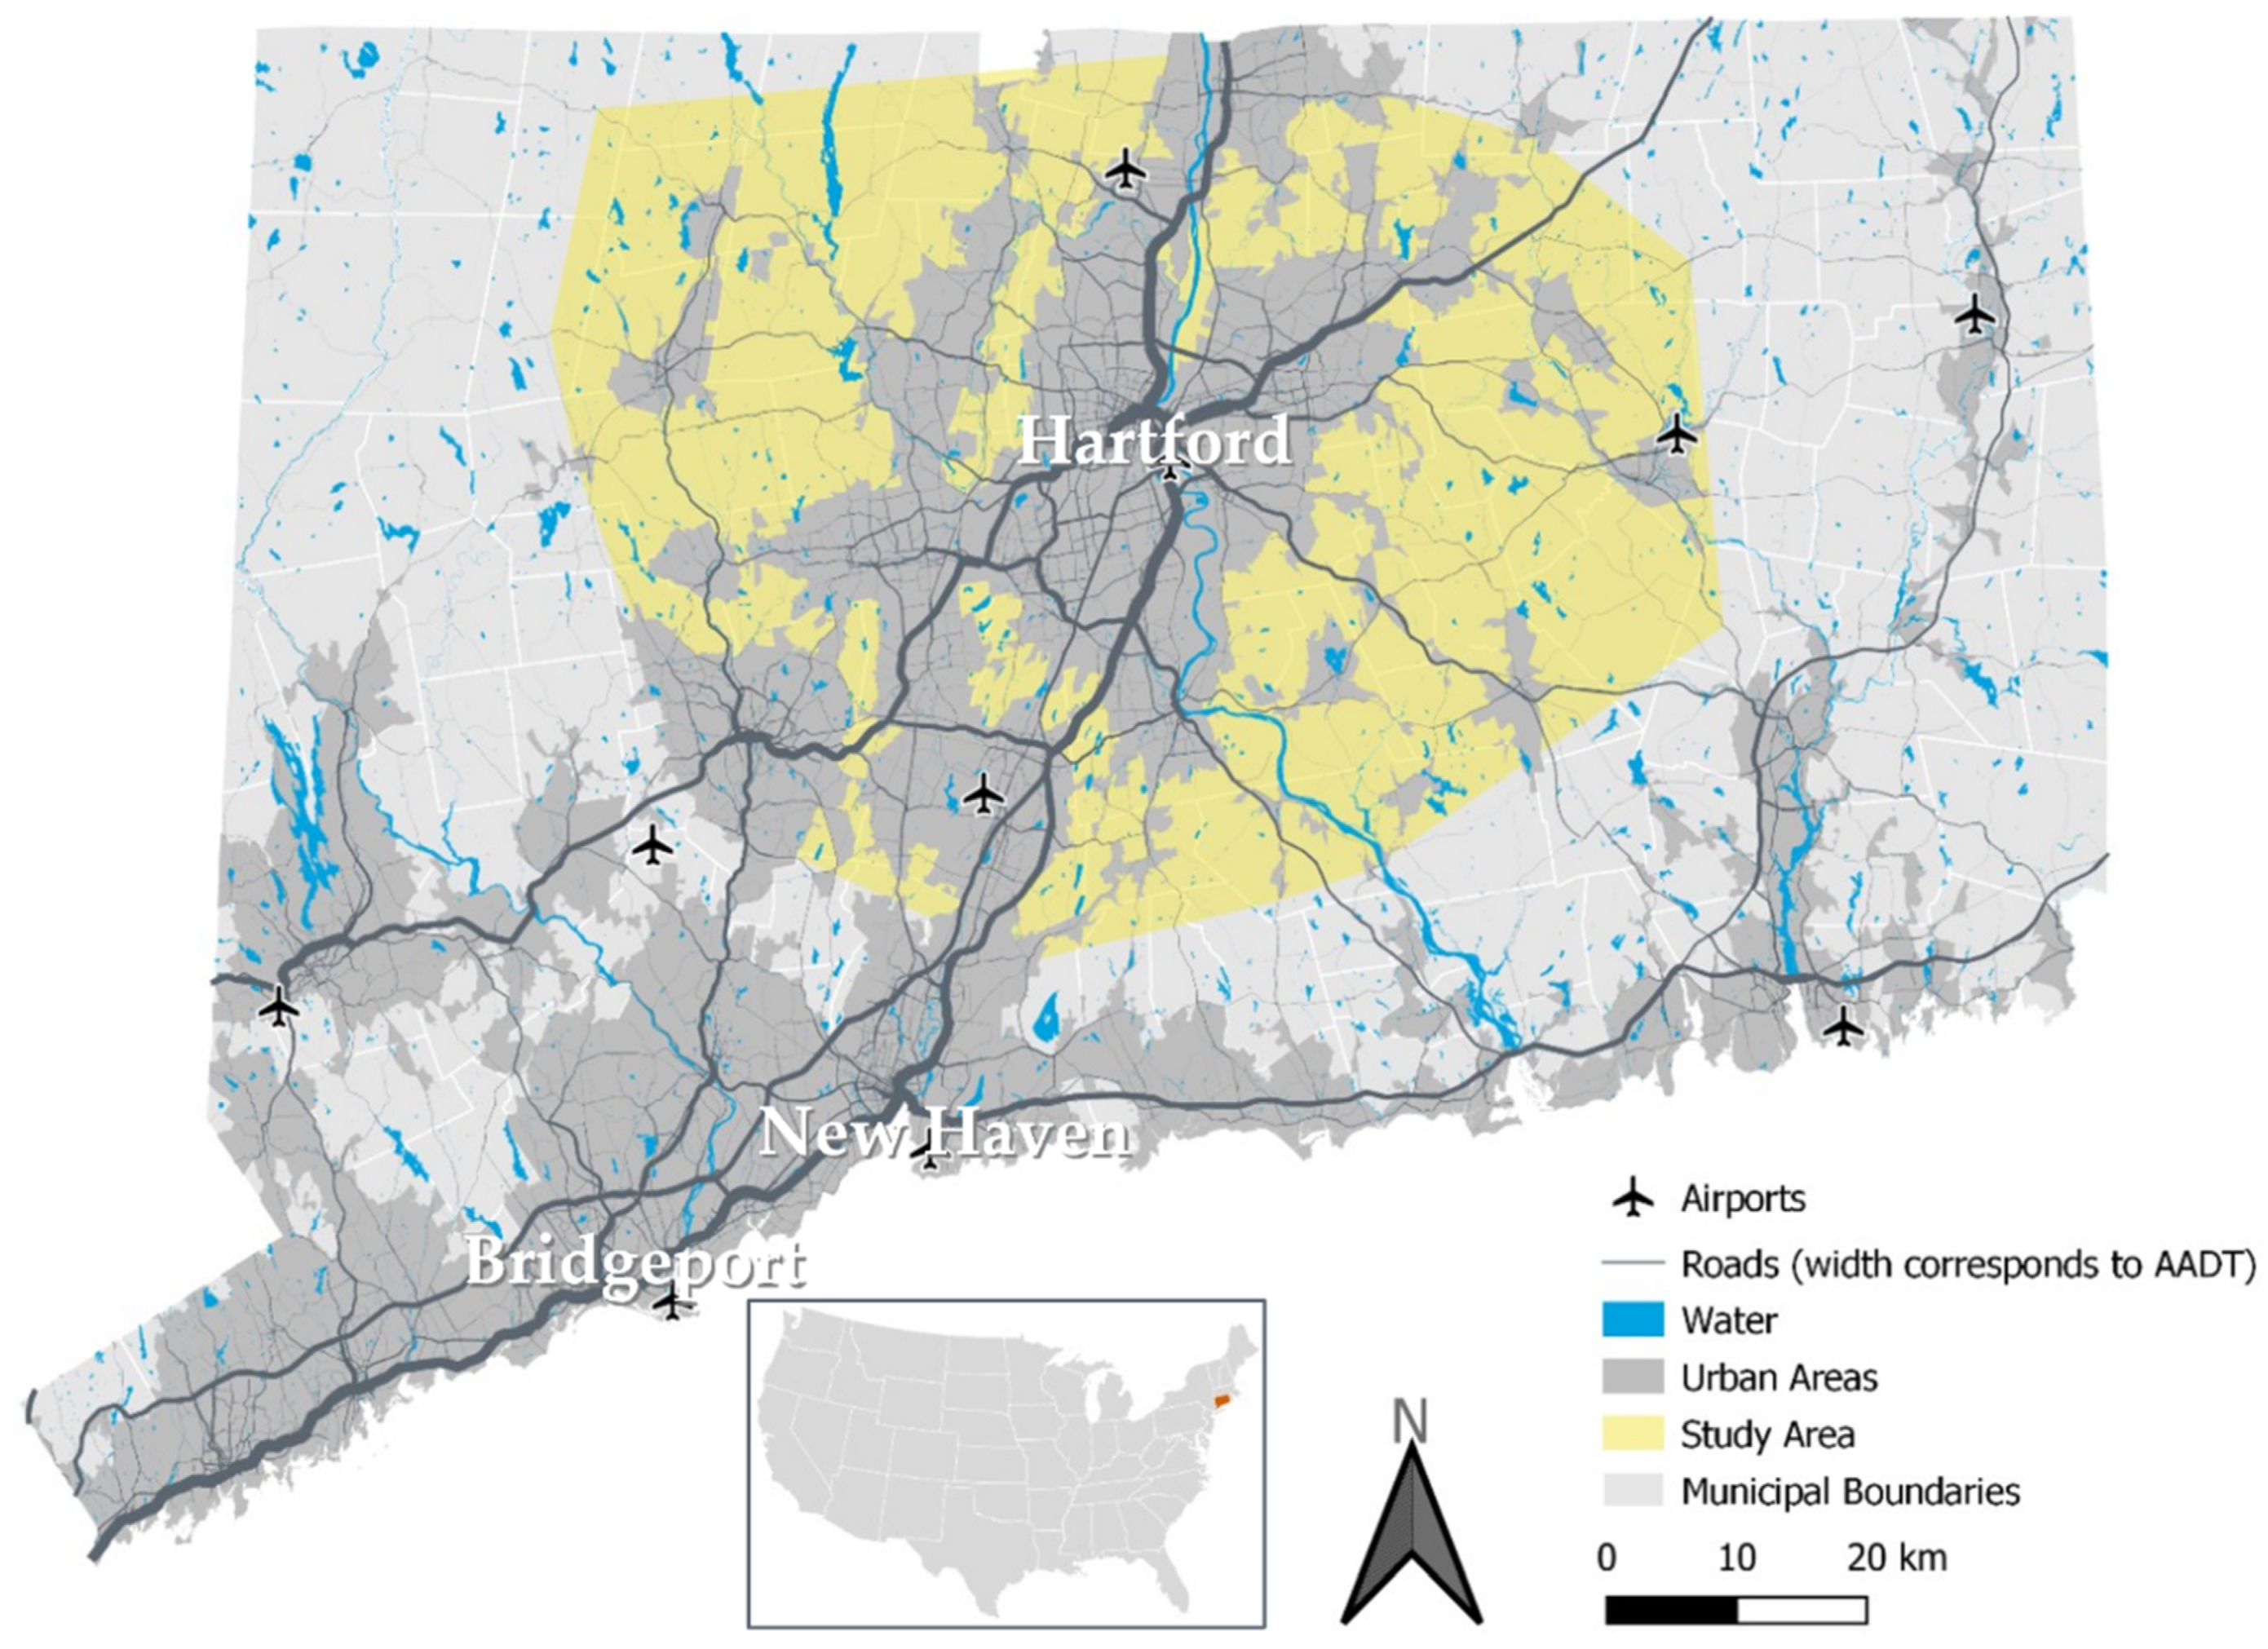
2.1. Study Area
2.2. Geodesign Workshop
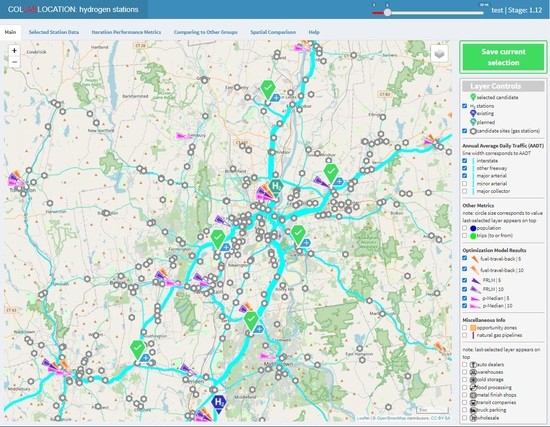
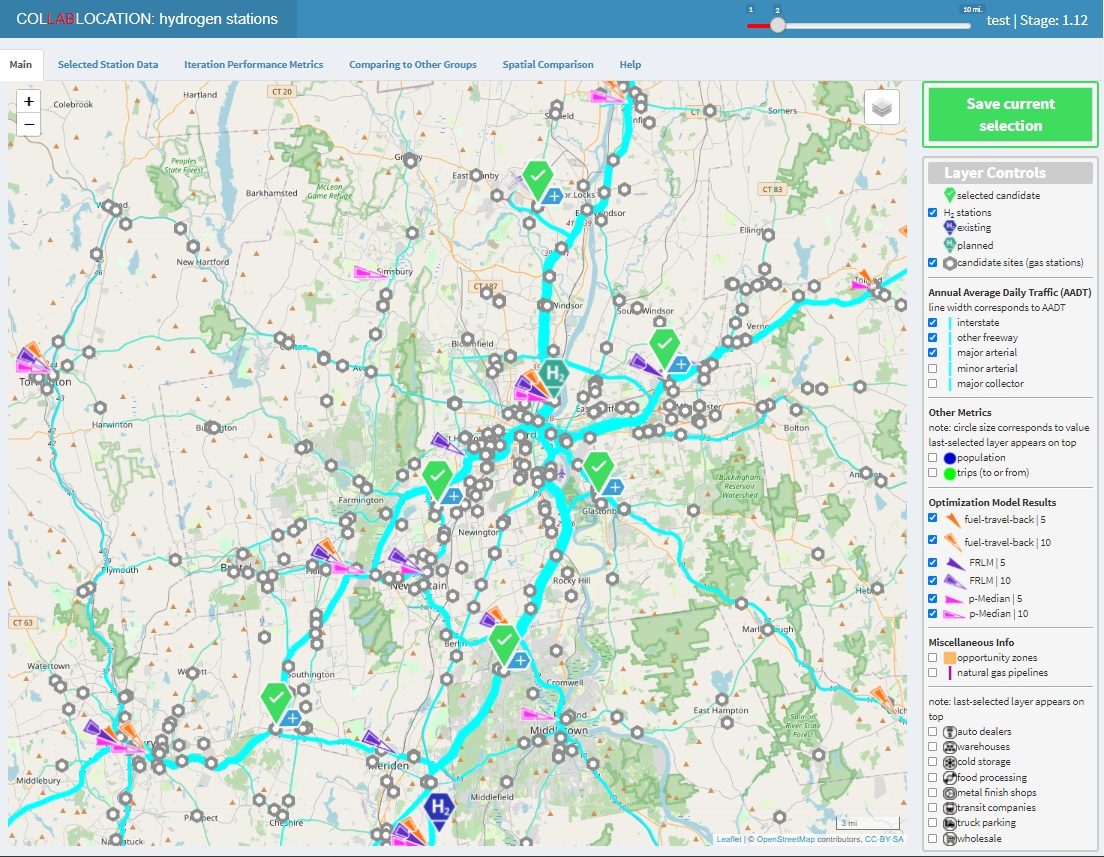
2.3. Collablocation
2.4. Optimization Models
- Minimizes total weighted travel time from residential nodes to their nearest stations, weighted by node population;
- Requires that every demand node i is allocated to exactly one HRS j;
- States that a demand node i can only be allocated to an HRS j if that station is open;
- Limits the number of stations opened to p;
- Limits the possible solution values of Yij to 0 or 1;
- Does the same for location variables Xj.
- 7.
- Minimizes the total weighted travel time from vehicles driving on arcs to their closest stations, weighted by the arc’s VMT, which is considered to represent the likelihood of vehicles needing a fill up while traveling the arc, spurring the driver to seek the closest station to that arc at that time, and returning to that arc to continue their trip.
- 13.
- Maximizes the number of O-D round trips that can be completed while not detouring off their least-travel-time routes given a reasonable driving range of FCEVs;
- 14.
- Ensures that a trip on path q can be completed (Yq = 1) only if every directional arc a on the round trip is covered by one of the HRSs (defined by the set ) that can enable an FCEV to traverse the full arc without running out of fuel.
2.5. Point Pattern Analysis Metrics
- The mean center or the point produced by the average x and y coordinate values of each arrangement of points.
- The mean distance between all pairs of stations generated in each optimization model or workshop output.
- The area and perimeter of the convex hull, i.e., the smallest convex polygon that bounds a set of points.
- The area and perimeter of the minimum bounding rectangle produced by using the maximum and minimum x and y coordinates observed in the set.
3. Results
3.1. Geodesign Workshop
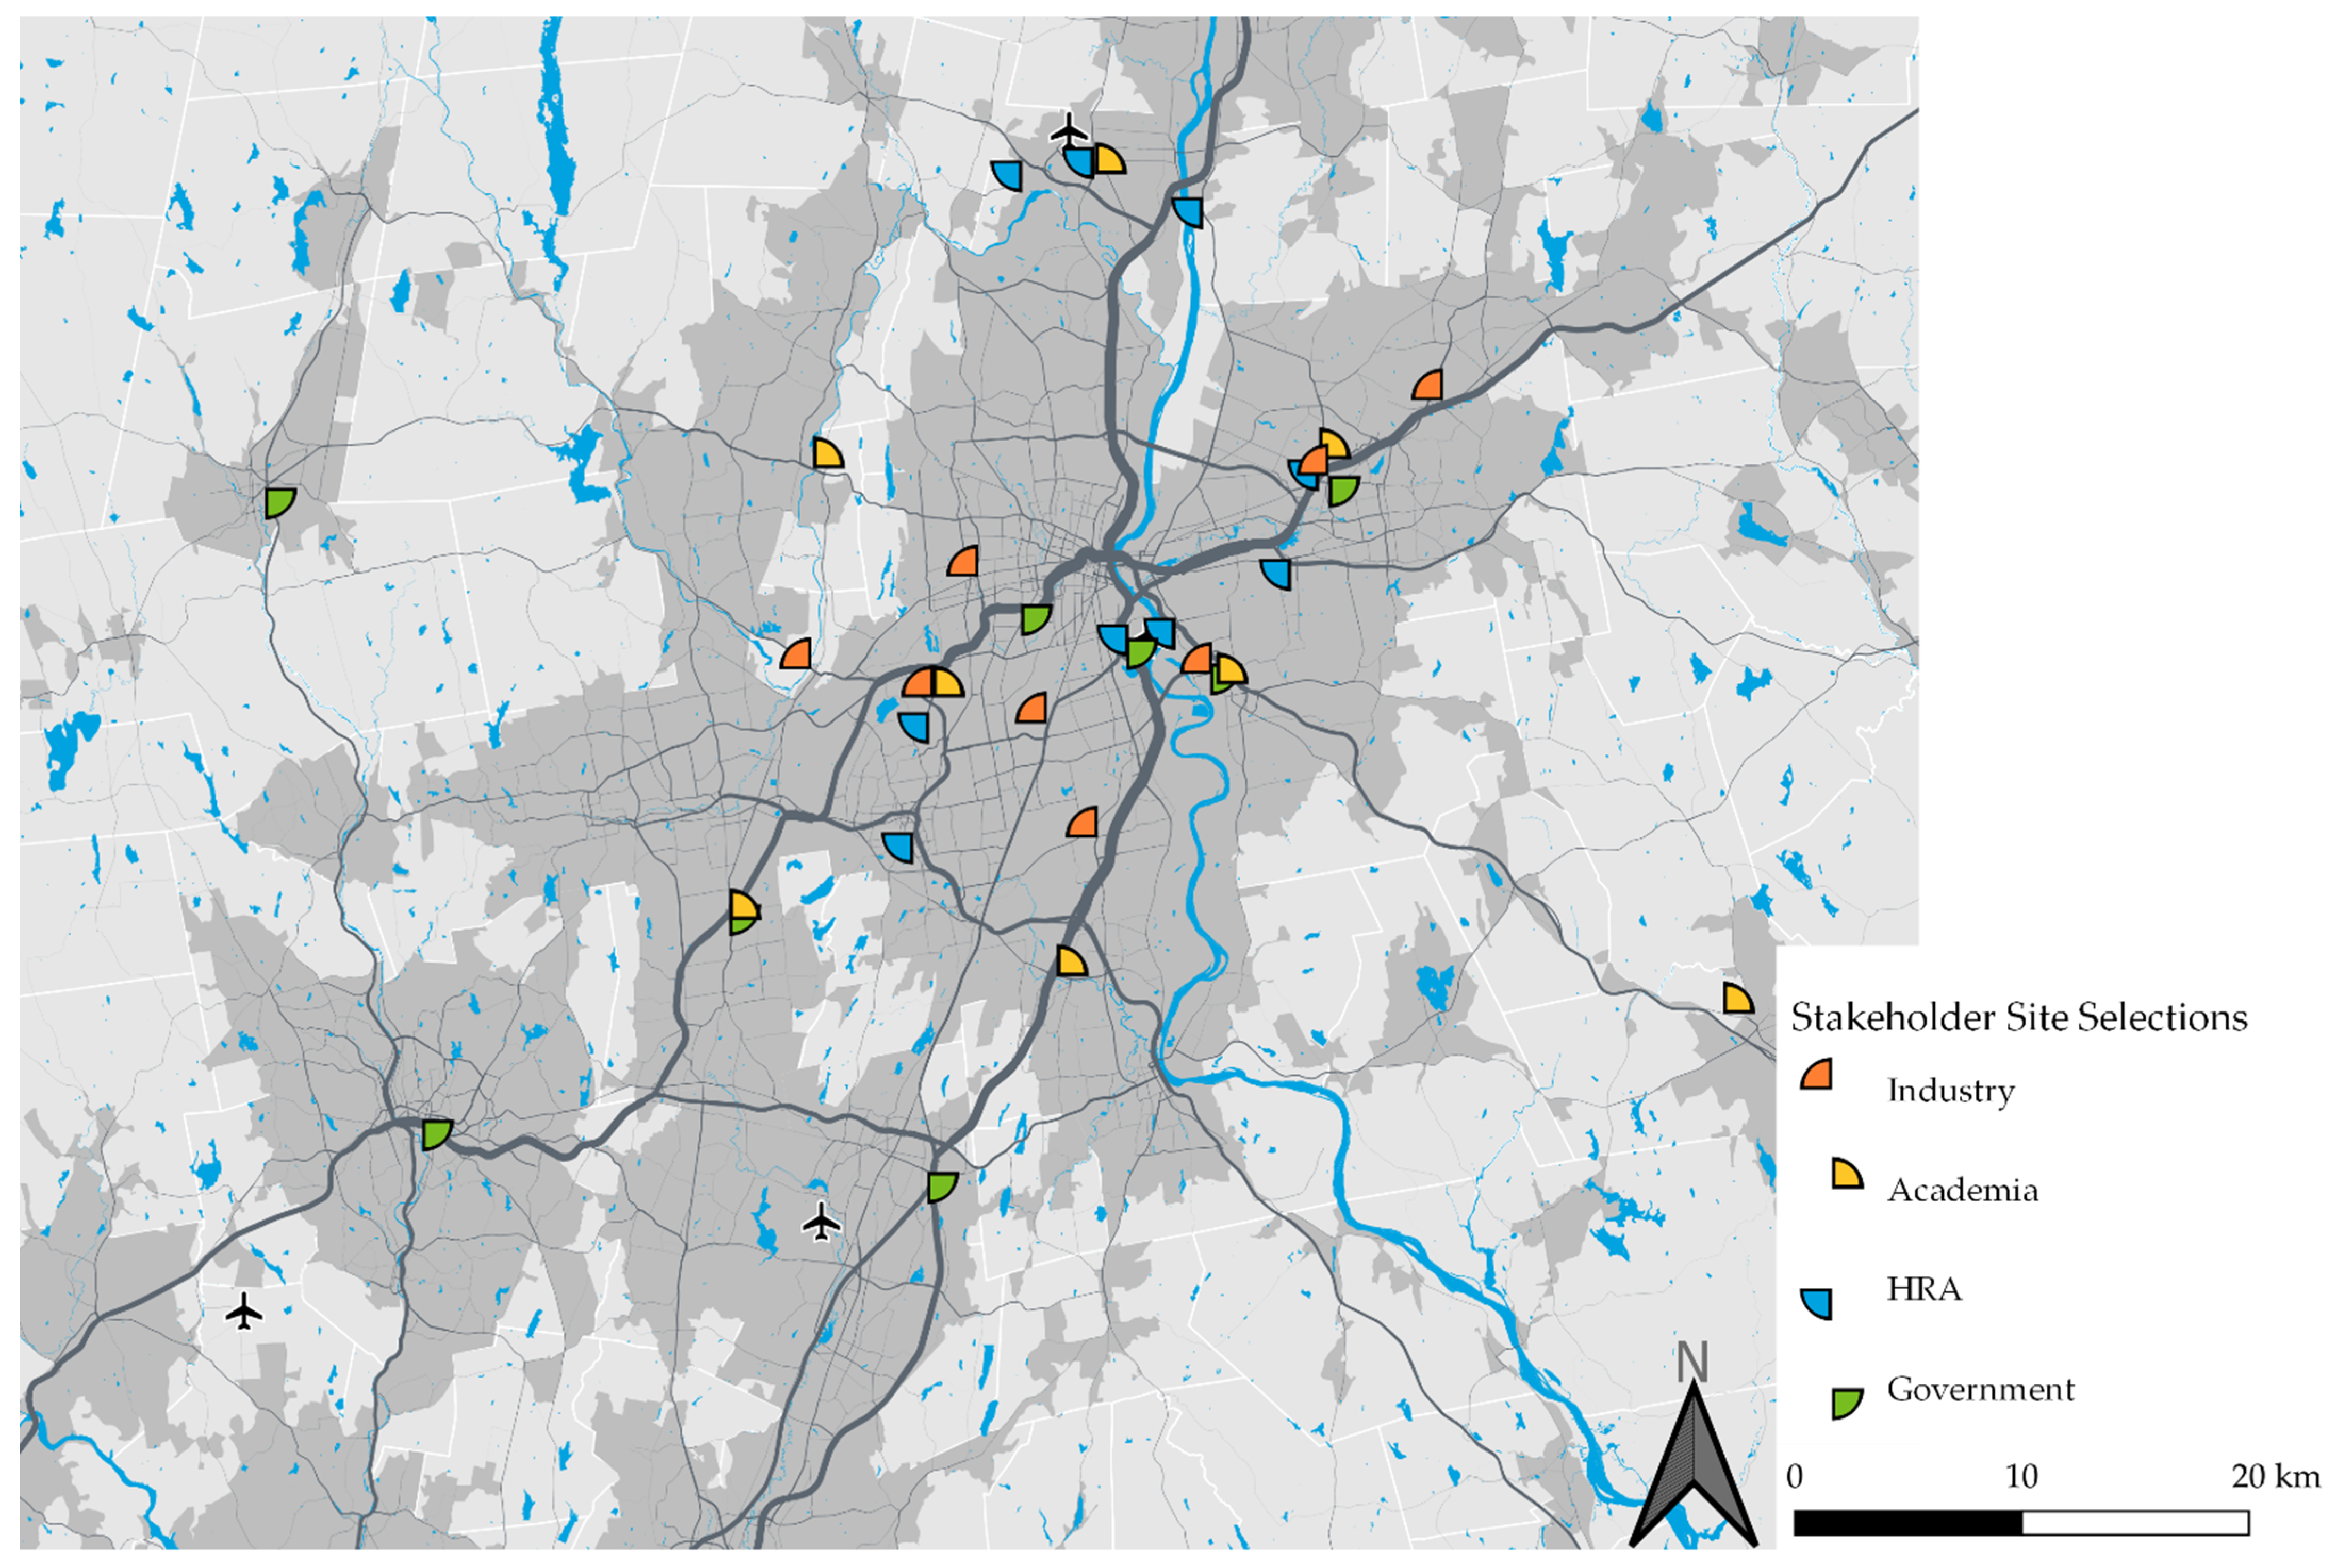
3.1.1. Stage 1
Academia
Government
Hydrogen Research and Advocacy (HRA)
Industry
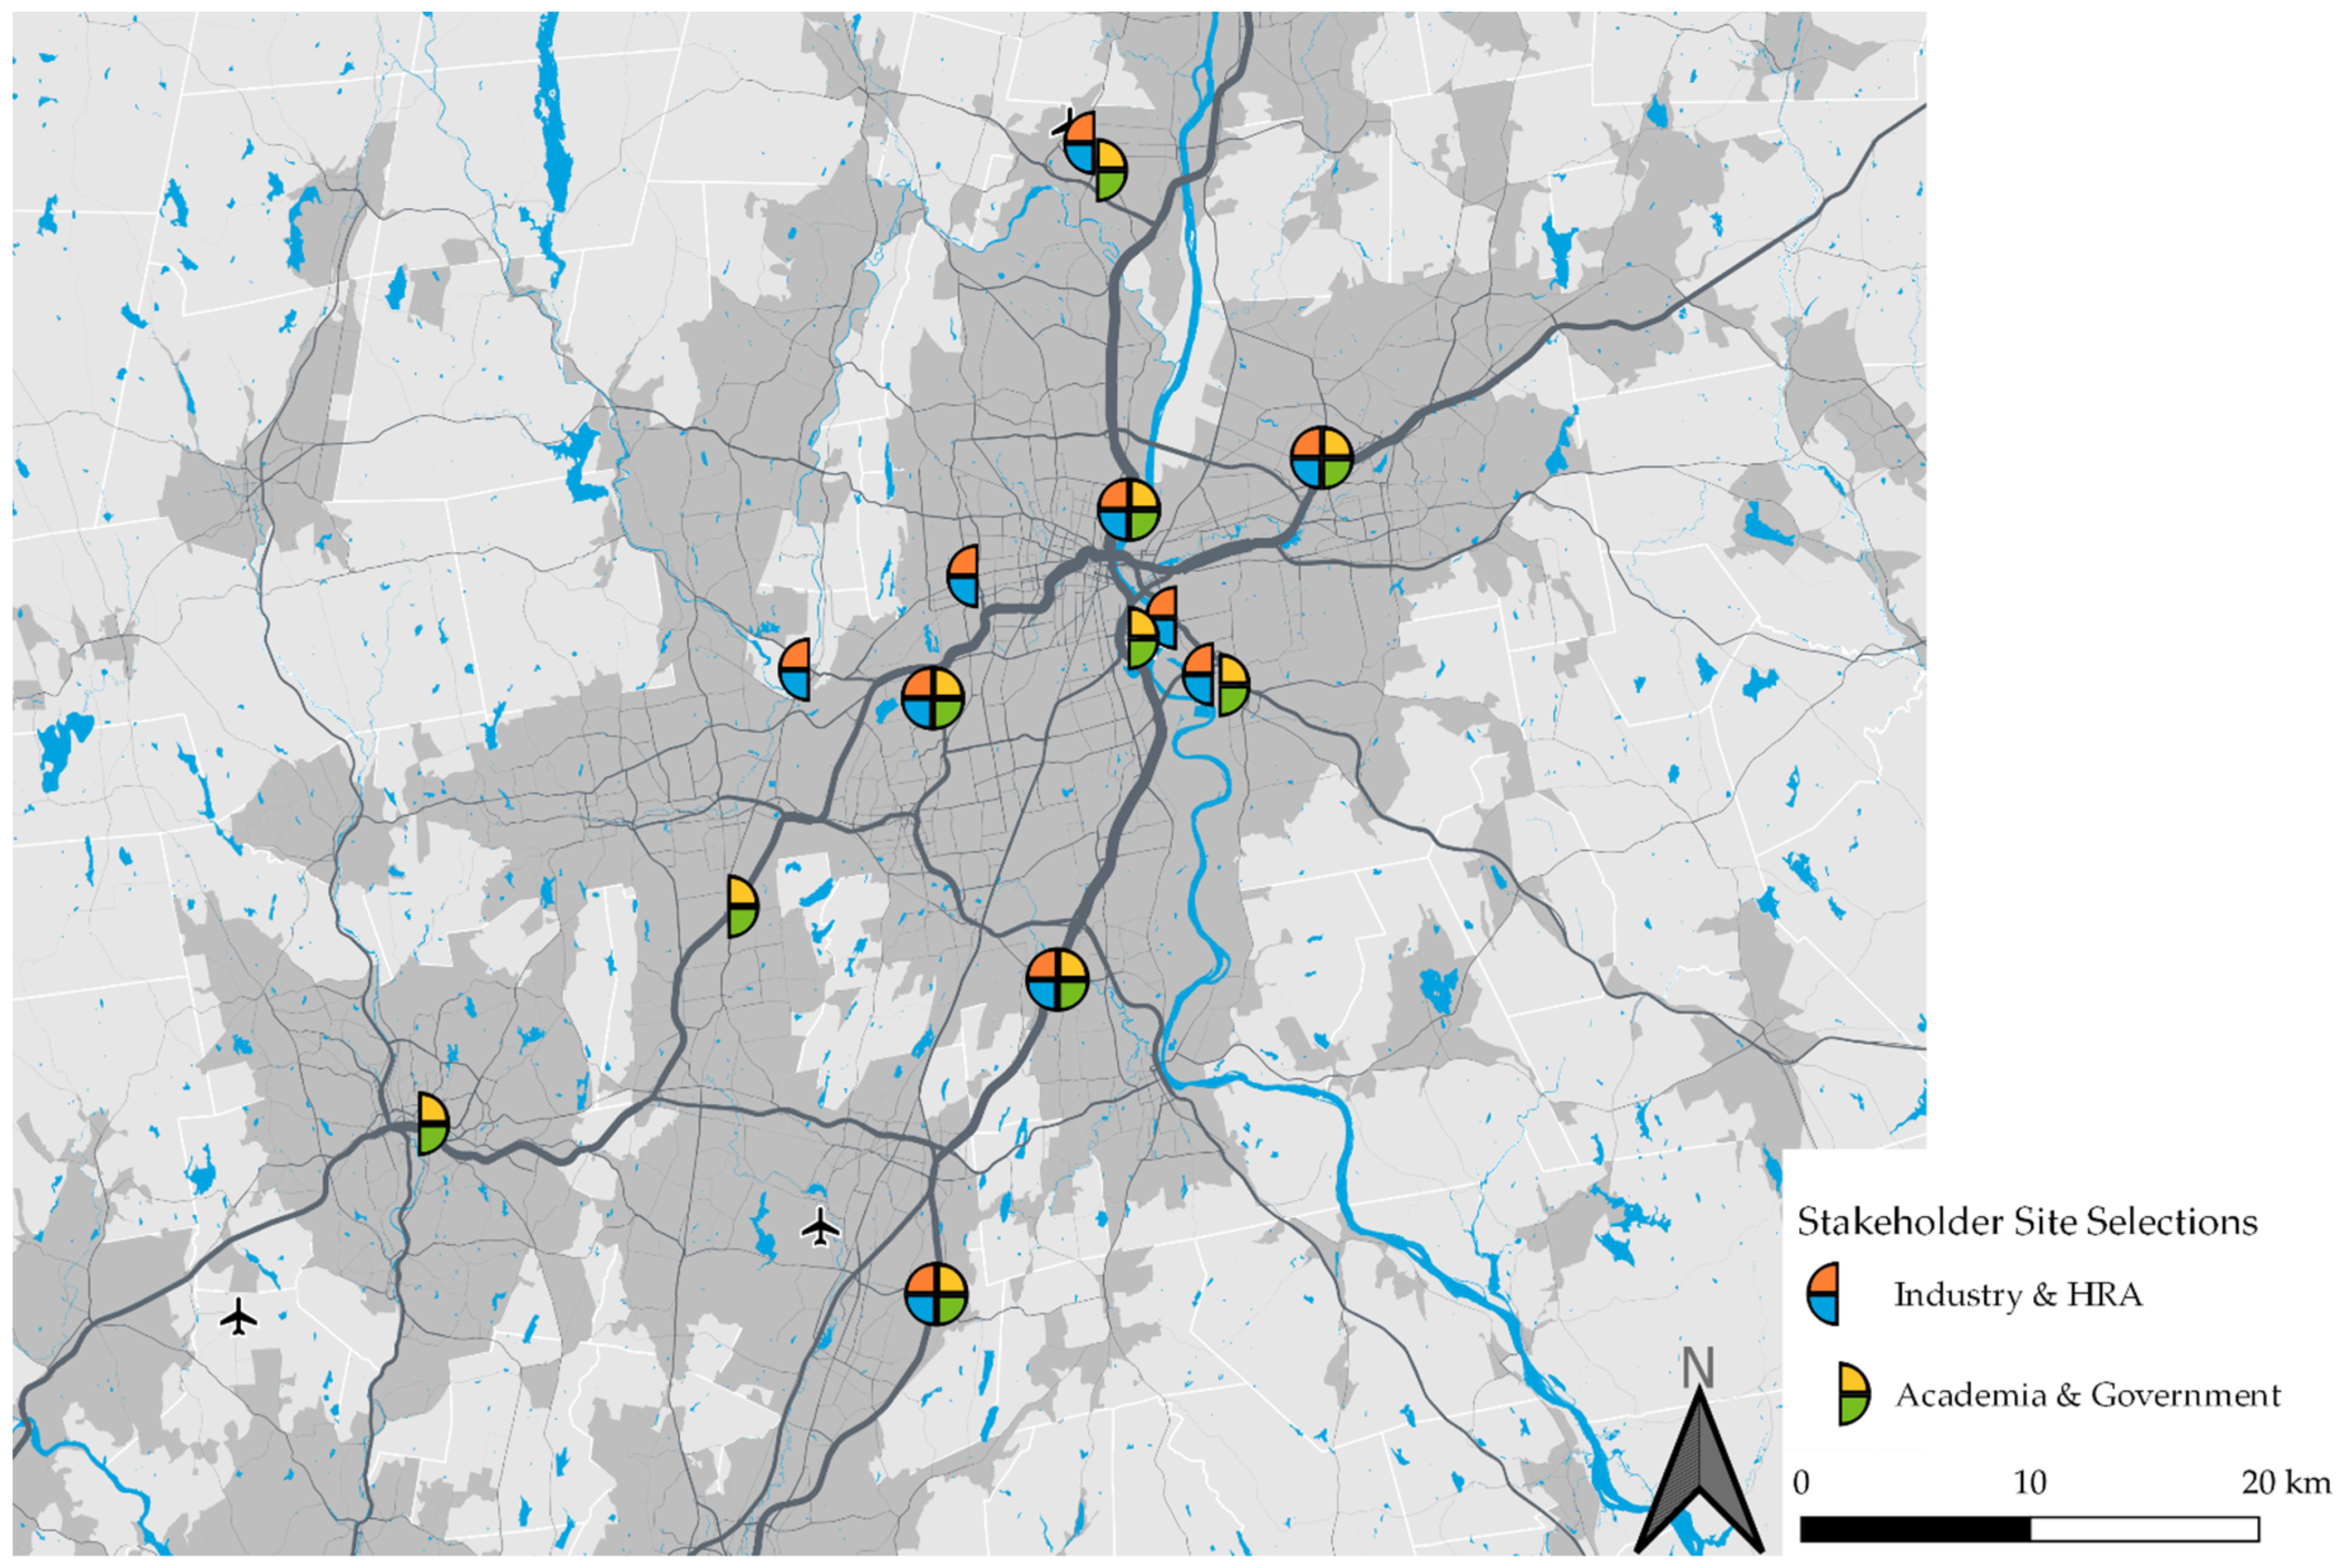
3.1.2. Stage 2
Combining Stakeholder Groups
Academia and Government
HRA and Industry
3.1.3. Stage 3
3.1.4. Survey
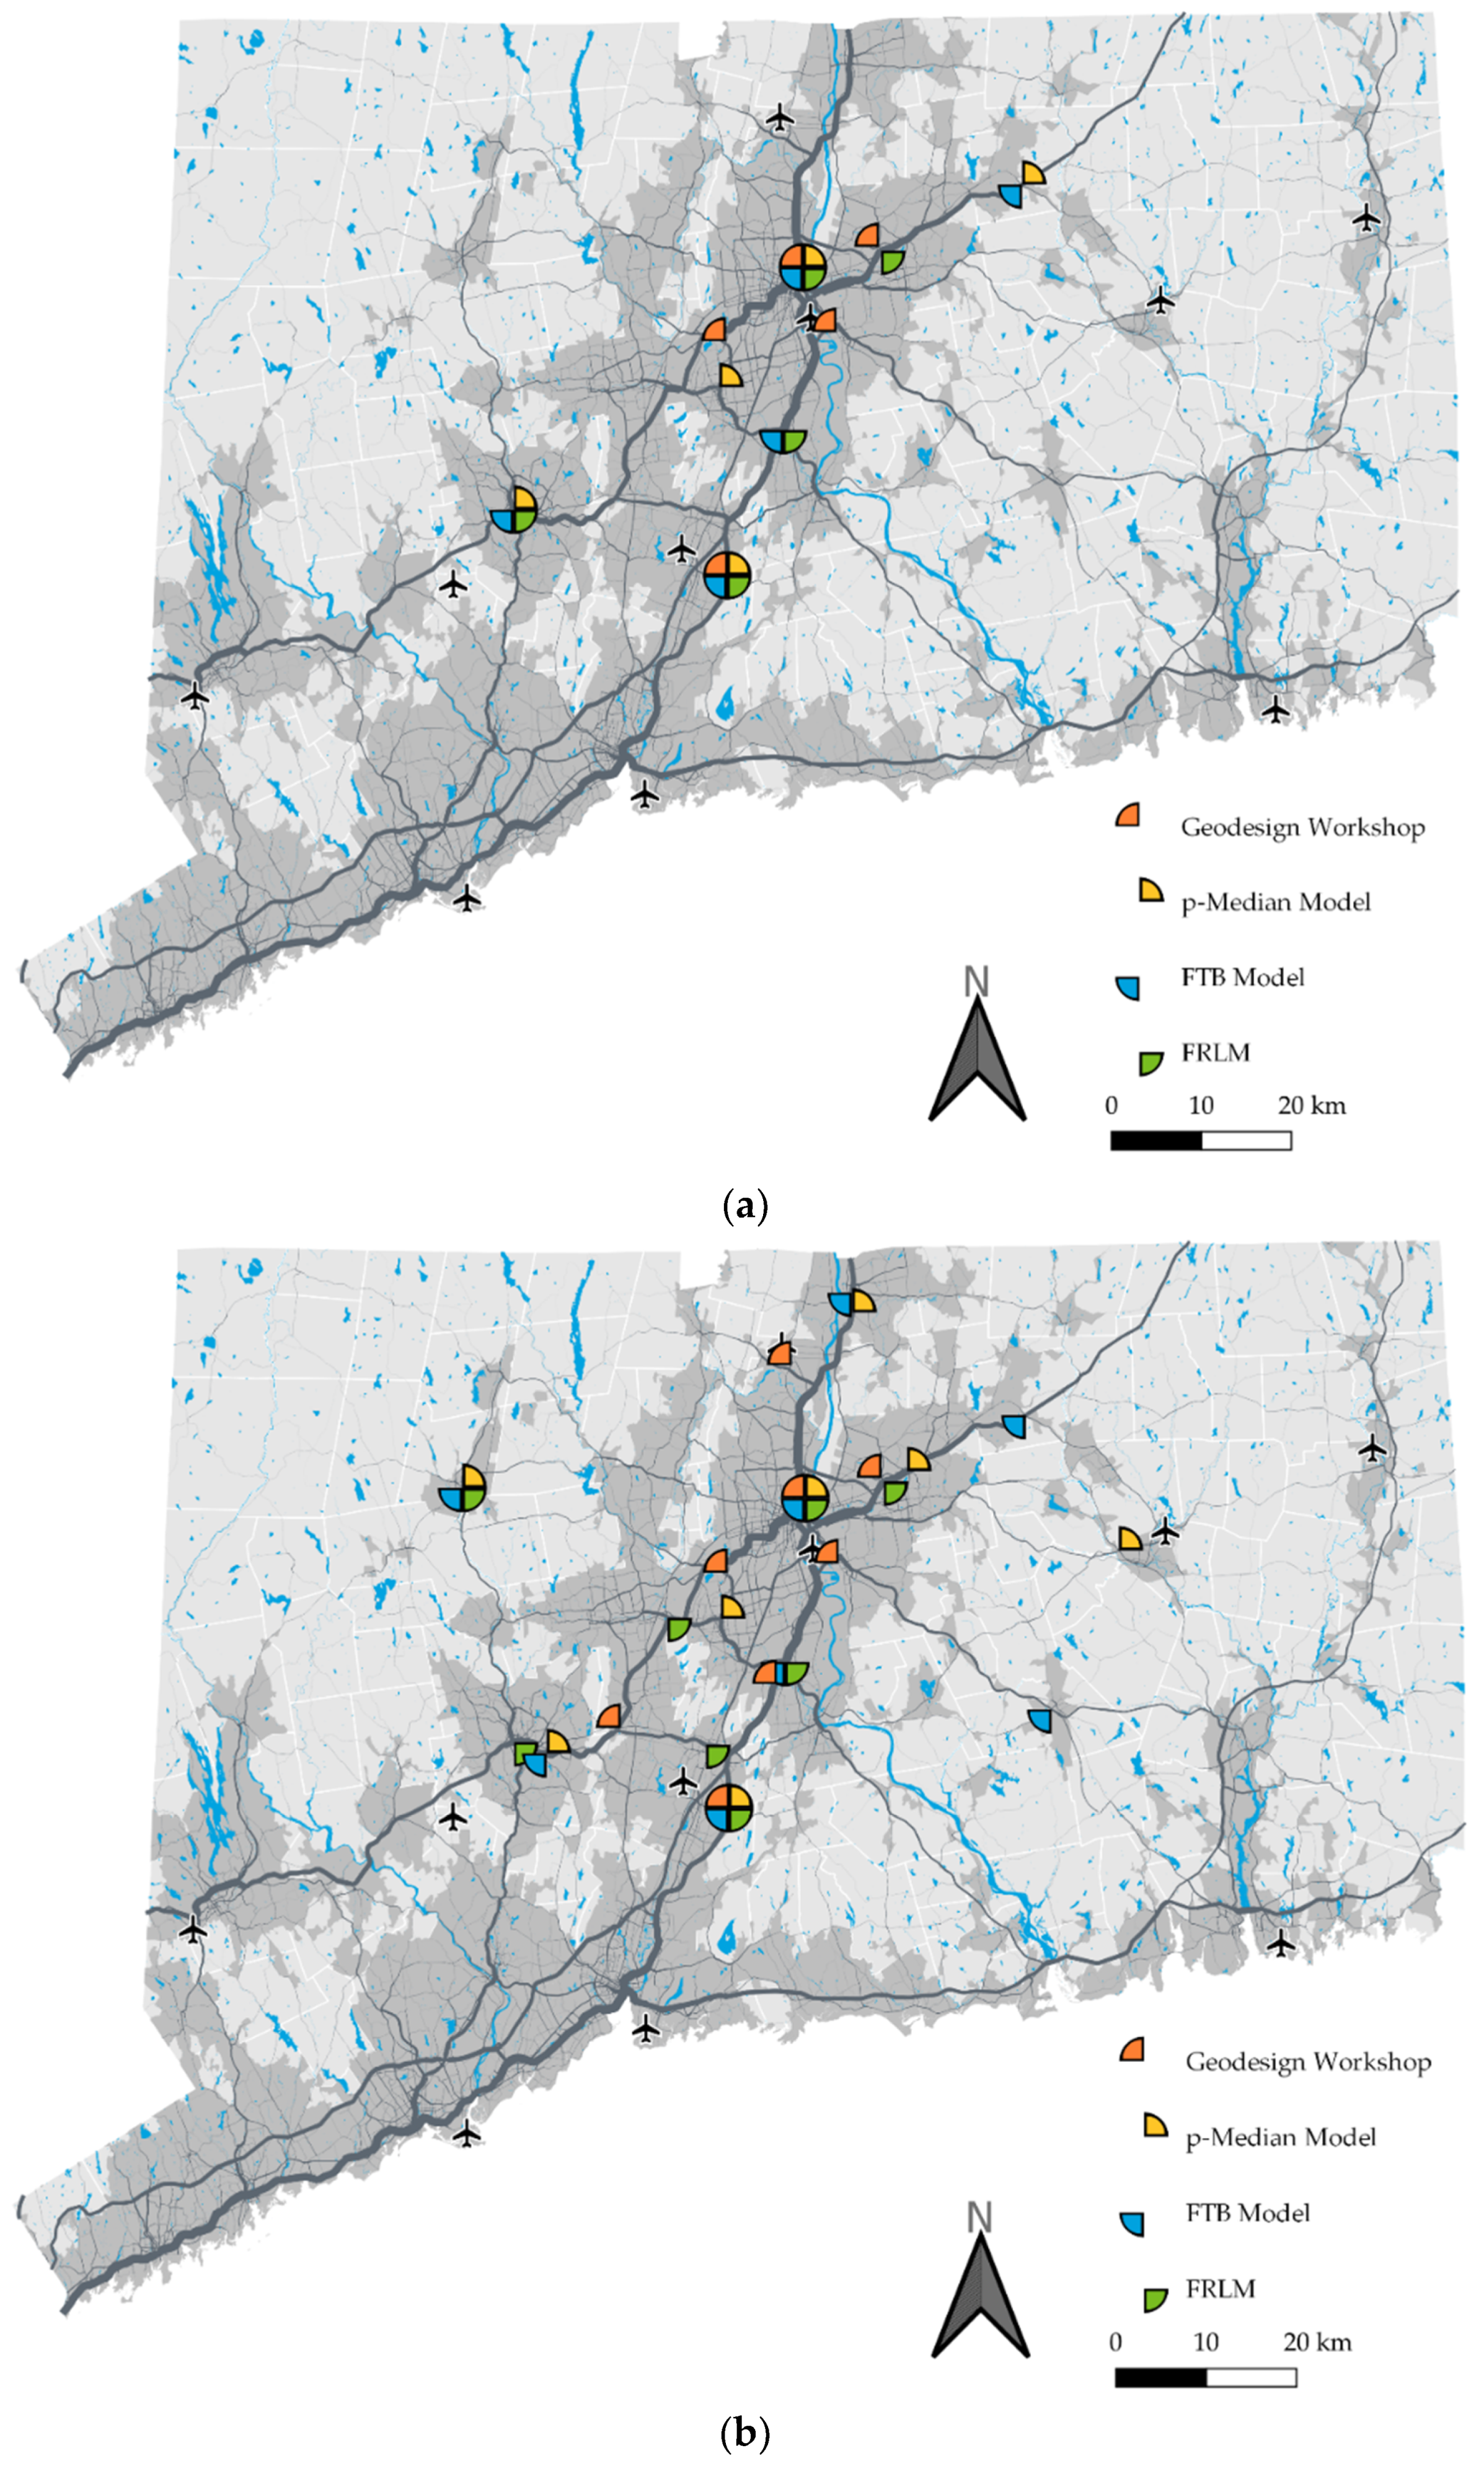
3.2. Qualitative Comparison between Geodesign and Optimization Results
3.3. Quantitative Comparison of Workshop and Optimization Model Results
3.3.1. Objective Function Performance Metrics
3.3.2. Point Pattern Analysis Metrics
4. Discussion
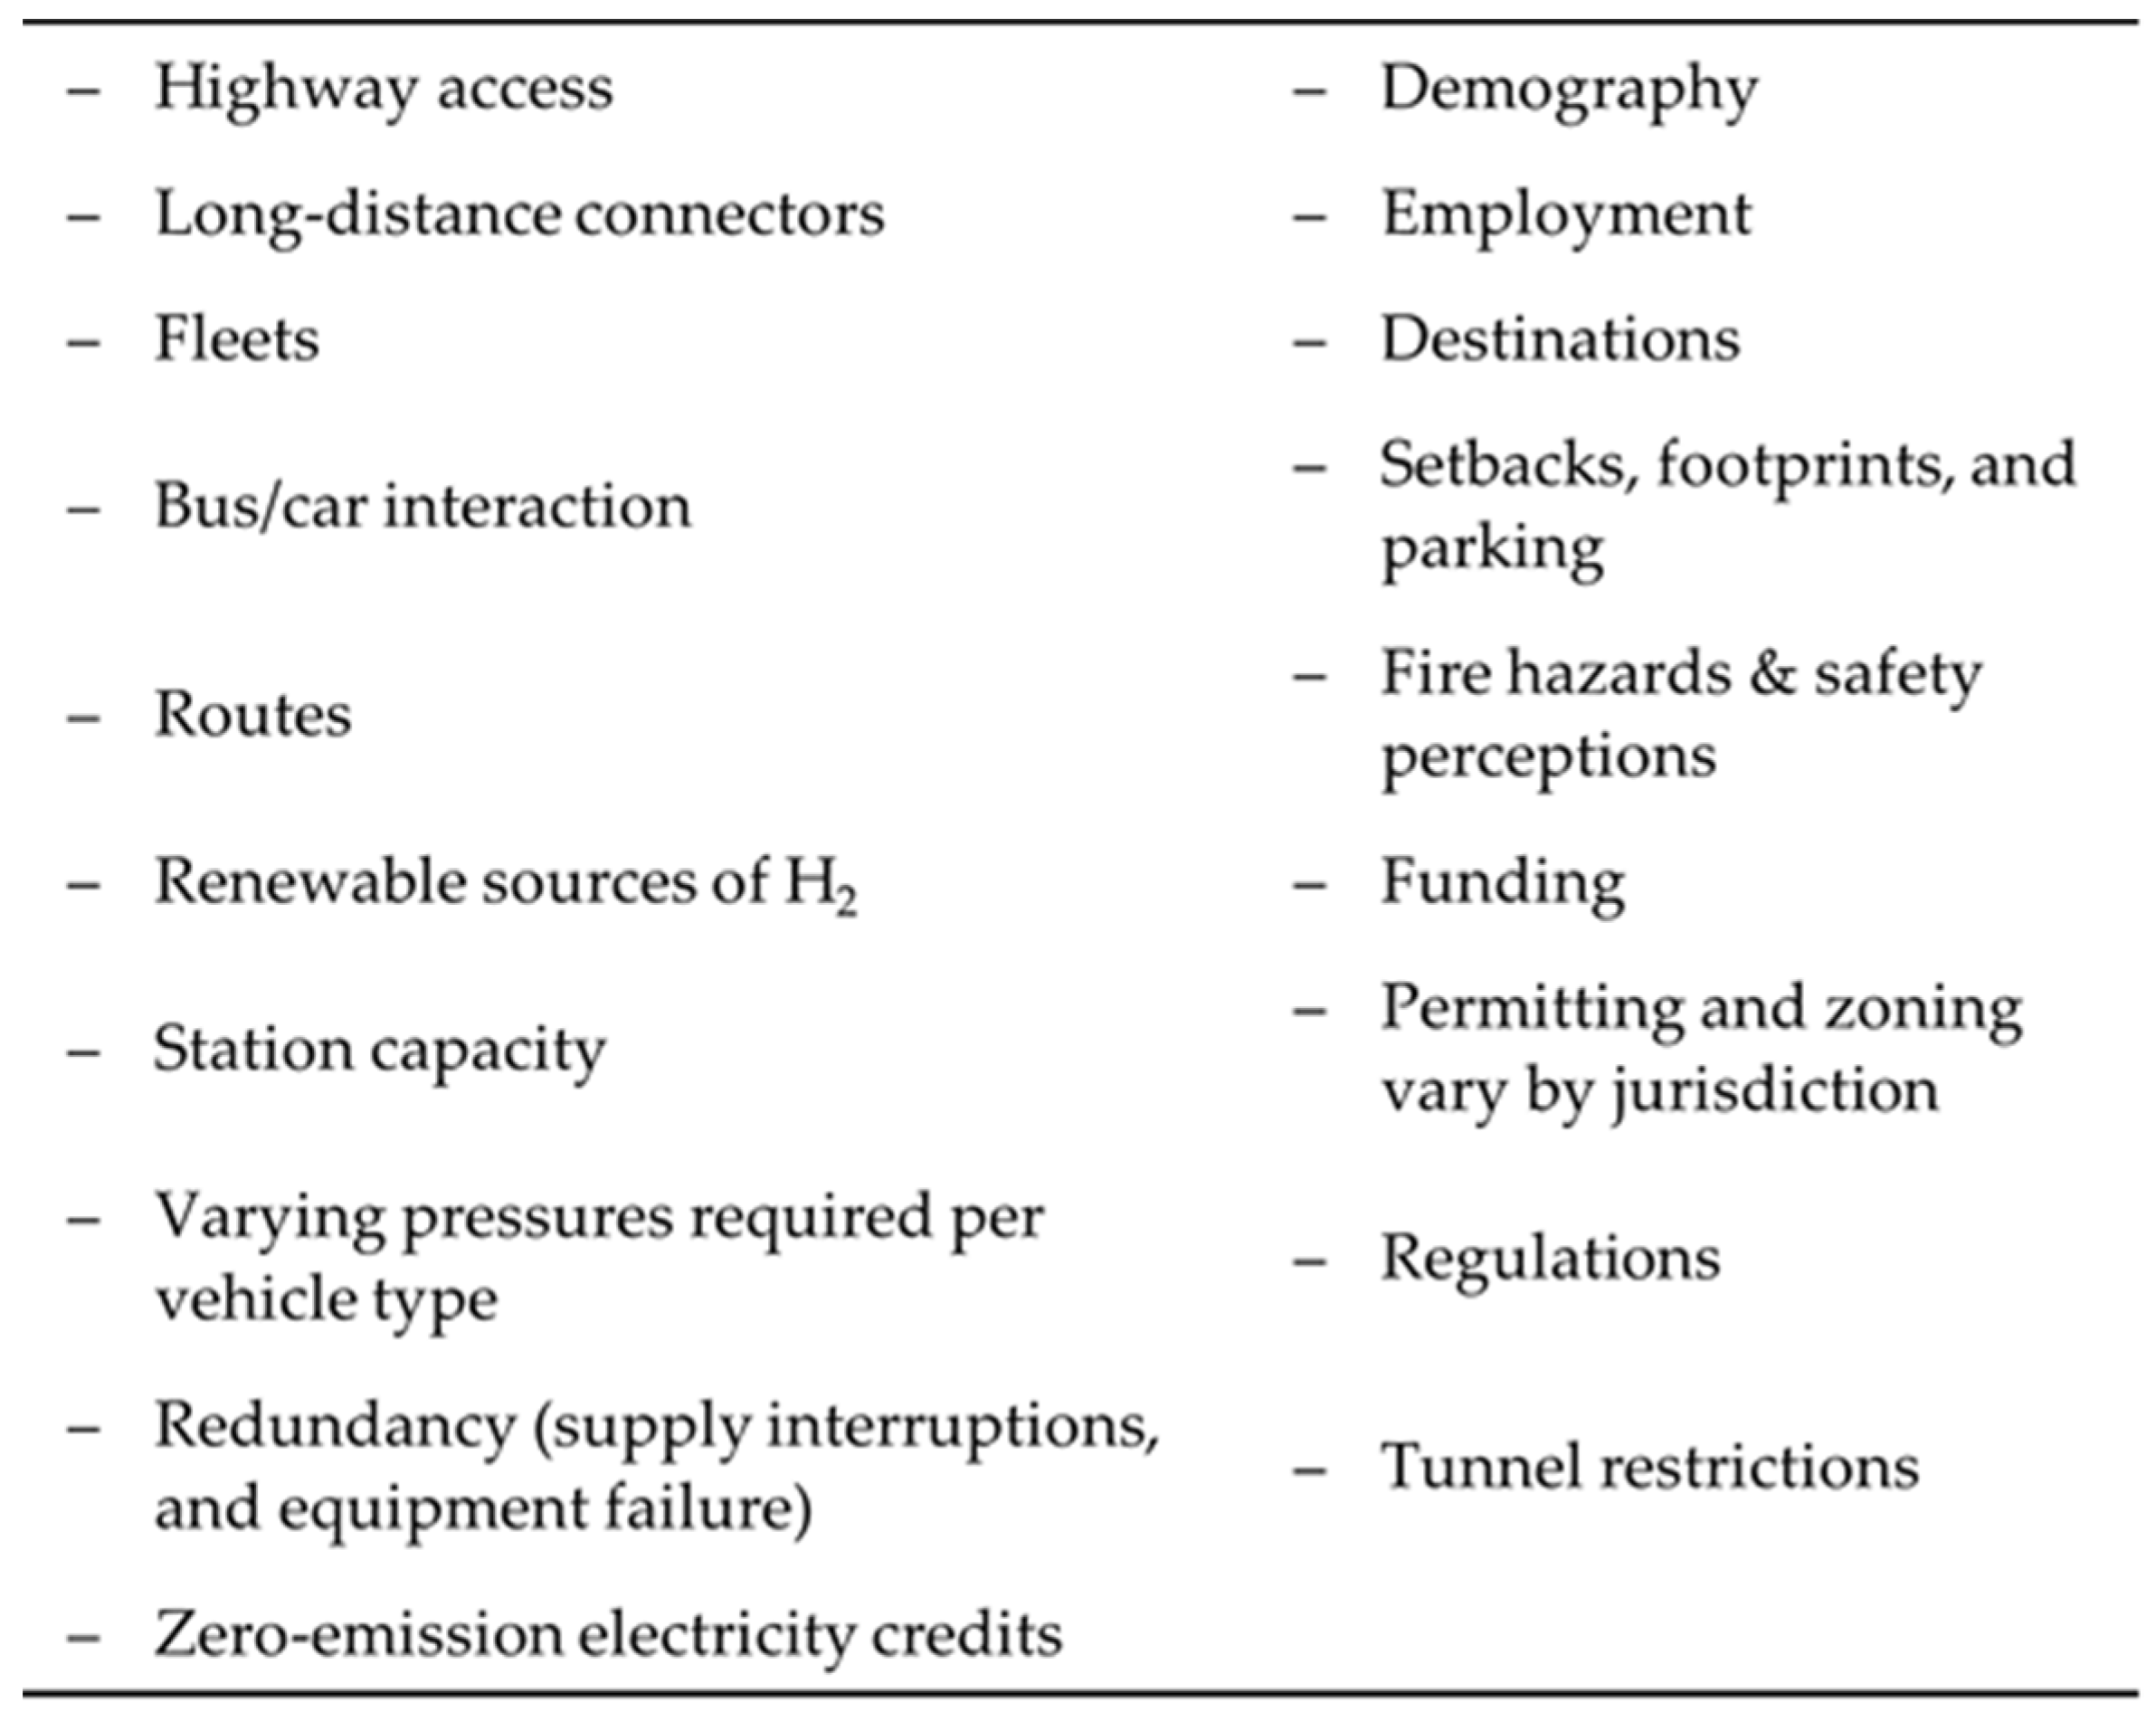
4.1. Information and Goals Considered
4.2. Advantages and Limitations of the Geodesign Approach for Point-Facility Location
4.2.1. Advantages
4.2.2. Limitations
4.3. Conclusions
Author Contributions
Funding
Institutional Review Board Statement
Informed Consent Statement
Data Availability Statement
Acknowledgments
Conflicts of Interest
References
- Rakadiya, S.; Yang, Z. Overview of Global Zero-Emission Vehicle Mandate Programs; The International Council on Clean Transportation: São Paulo, Brazil, 2019. [Google Scholar]
- Ritchie, H. Cars, Planes, Trains: Where do CO2 Emissions from Transport Come From? Our World in Data: Oxford, UK, 2020. [Google Scholar]
- Muratori, M.; Bush, B.; Hunter, C.; Melaina, M.W. Modeling Hydrogen Refueling Infrastructure to Support Passenger Vehicles. Energies 2018, 11, 1171. [Google Scholar] [CrossRef] [Green Version]
- Struben, J. Identifying Challenges for Sustained Adoption of Alternative Fuel Vehicles and Infrastructure; Social Science Research Network: Rochester, NY, USA, 2006. [Google Scholar]
- Struben, J.; Sterman, J.D. Transition Challenges for Alternative Fuel Vehicle and Transportation Systems. Environ. Plann. B Plann. Des. 2008, 35, 1070–1097. [Google Scholar] [CrossRef]
- Jayakumar, A.; Chalmers, A.; Lie, T.T. Review of Prospects for Adoption of Fuel Cell Electric Vehicles in New Zealand. IET Electr. Syst. Transp. 2017, 7, 259–266. [Google Scholar] [CrossRef]
- Greene, D.L.; Ogden, J.M.; Lin, Z. Challenges in the Designing, Planning and Deployment of Hydrogen Refueling Infrastructure for Fuel Cell Electric Vehicles. eTransportation 2020, 6, 100086. [Google Scholar] [CrossRef]
- Alazemi, J.; Andrews, J. Automotive Hydrogen Fuelling Stations: An International Review. Renew. Sustain. Energy Rev. 2015, 48, 483–499. [Google Scholar] [CrossRef]
- Deb, S.; Tammi, K.; Kalita, K.; Mahanta, P. Review of Recent Trends in Charging Infrastructure Planning for Electric Vehicles. Wiley Interdiscip. Rev. Energy Environ. 2018, 7, e306. [Google Scholar] [CrossRef] [Green Version]
- Jing, W.; Yan, Y.; Kim, I.; Sarvi, M. Electric Vehicles: A Review of Network Modelling and Future Research Needs. Adv. Mech. Eng. 2016, 8, 1687814015627981. [Google Scholar] [CrossRef] [Green Version]
- Juan, A.A.; Mendez, C.A.; Faulin, J.; De Armas, J.; Grasman, S.E. Electric Vehicles in Logistics and Transportation: A Survey on Emerging Environmental, Strategic, and Operational Challenges. Energies 2016, 9, 86. [Google Scholar] [CrossRef] [Green Version]
- Ko, J.; Gim, T.-H.T.; Guensler, R. Locating Refuelling Stations for Alternative Fuel Vehicles: A Review on Models and Applications. Transp. Rev. 2017, 37, 551–570. [Google Scholar] [CrossRef]
- Artz, M. GeoDesign: Changing Geography by Design; Directions Magazine: Glencoe, IL, USA, 2010; pp. 3–7. [Google Scholar]
- Campagna, M. Spatial Planning and Geodesign. In Handbook of Planning Support Science; Edward Elgar Publishing: Cheltenham, UK, 2020. [Google Scholar]
- Fisher, B.; Christie, M.; Aronson, J.; Braat, L.; Gowdy, J.; Haines-Young, R.; Maltby, E.; Blignaut, J.; Brondízio, E.; Costanza, R.; et al. Integrating the Ecological and Economic Dimensions in Biodiversity and Ecosystem Service Valuation; Earthscan: London, UK, 2010. [Google Scholar]
- Fisher, T. Geodesign. In International Encyclopedia of Geography; American Cancer Society: Atlanta, GA, USA, 2017; pp. 1–9. ISBN 978-1-118-78635-2. [Google Scholar]
- Flaxman, M. Fundamentals of Geodesign. In Digital Landscape Architecture; Anhalt University of Applied Science: Berlin, Germany, 2010; pp. 28–41. [Google Scholar]
- Goodchild, M.F. Towards Geodesign: Repurposing Cartography and GIS? Cartogr. Perspect. 2010, 7–22. [Google Scholar] [CrossRef] [Green Version]
- Perkl, R.M. Geodesigning Landscape Linkages: Coupling GIS with Wildlife Corridor Design in Conservation Planning. Landsc. Urban Plan. 2016, 156, 44–58. [Google Scholar] [CrossRef]
- Raumer, H.-G.S.; Stokman, A. GeoDesign-Approximations of a Catchphrase. In Digital Landscape Architecture; Anhalt University of Applied Science: Berlin, Germany, 2011; Volume 364, pp. 106–115. [Google Scholar]
- Steinitz, C. A Framework for Geodesign: Changing Geography by Design, 1st ed.; Esri: Redlands, CA, USA, 2012; ISBN 978-1-58948-333-0. [Google Scholar]
- Nicholas, M.A.; Ogden, J. Detailed Analysis of Urban Station Siting for California Hydrogen Highway Network. Transp. Res. Rec. 2006, 1983, 121–128. [Google Scholar] [CrossRef]
- Lin, Z.; Ogden, J.; Fan, Y.; Chen, C.-W. The Fuel-Travel-Back Approach to Hydrogen Station Siting. Int. J. Hydrogen Energy 2008, 33, 3096–3101. [Google Scholar] [CrossRef] [Green Version]
- Kuby, M.; Lim, S. The Flow-Refueling Location Problem for Alternative-Fuel Vehicles. Socio-Econ. Plan. Sci. 2005, 39, 125–145. [Google Scholar] [CrossRef]
- Campagna, M. Metaplanning: About Designing the Geodesign Process. Landsc. Urban Plan. 2016, 156, 118–128. [Google Scholar] [CrossRef]
- Campagna, M.; Steinitz, C.; Di Cesare, E.A.; Cocco, C.; Ballal, H.; Canfield, T. Collaboration in Planning: The Geodesign Approach. Rozwój Regionalny I Polityka Regionalna 2016, 35, 55–72. [Google Scholar]
- Dangermond, J. Geodesign and GIS–Designing Our Futures. In Digital Landscape Architecture; Anhalt University of Applied Science: Berlin, Germany, 2010; pp. 502–514. [Google Scholar]
- Steinitz, C. Beginnings of Geodesign: A Personal Historical Perspective; Esri: West Redlands, CA, USA, 2019. [Google Scholar]
- Church, R.; Murray, A. Location Covering Models: History, Applications and Advancements; Advances in Spatial Science; Springer International Publishing: Berlin/Heidelberg, Germany, 2018; ISBN 978-3-319-99845-9. [Google Scholar]
- Tong, D.; Murray, A.T. Spatial Optimization in Geography. Ann. Assoc. Am. Geogr. 2012, 102, 1290–1309. [Google Scholar] [CrossRef]
- California Hydrogen Infrastructure Tool (CHIT)|California Air Resources Board. Available online: https://ww2.arb.ca.gov/resources/documents/california-hydrogen-infrastructure-tool-chit (accessed on 27 August 2021).
- Martinez, A. California hydrogen infrastructure tool (chit) webinar: Simulated traffic volume dataset. In Proceedings of the March 2017 CHIT Traffic Data Webinar, Sacramento, CA, USA, 3 March 2017. [Google Scholar]
- Taha, H.A. Operations Research An Introduction; Pearson Education Limited: London, UK, 2017; ISBN 978-1-292-16554-7. [Google Scholar]
- ReVelle, C.S.; Swain, R.W. Central Facilities Location. Geogr. Anal. 1970, 2, 30–42. [Google Scholar] [CrossRef]
- Nicholas, M.A.; Handy, S.L.; Sperling, D. Using Geographic Information Systems to Evaluate Siting and Networks of Hydrogen Stations. Transp. Res. Rec. 2004, 1880, 126–134. [Google Scholar] [CrossRef]
- Itaoka, K.; Kimura, S.; Hirose, K. Methodology Development to Locate Hydrogen Stations for the Initial Deployment Stage. In Proceedings of the E3S Web of Conferences; EDP Sciences: Les Ulis, France, 2019; Volume 83, p. 01014. [Google Scholar]
- Hydrogen and Fuel Cell Strategy Council. The Current State of the FCV and Hydrogen Station Business; Hydrogen and Fuel Cell Strategy Council: Tokyo, Japan, 2021. [Google Scholar]
- Toregas, C.; Swain, R.; ReVelle, C.; Bergman, L. The Location of Emergency Service Facilities. Oper. Res. 1971, 19, 1363–1373. [Google Scholar] [CrossRef]
- Church, R.; ReVelle, C. The Maximal Covering Location Problem. In Papers of the Regional Science Association; Springer: Berlin/Heidelberg, Germany, 1974; Volume 32, pp. 101–118. [Google Scholar]
- Frade, I.; Ribeiro, A.; Gonçalves, G.; Antunes, A.P. Optimal Location of Charging Stations for Electric Vehicles in a Neighborhood in Lisbon, Portugal. Transp. Res. Rec. 2011, 2252, 91–98. [Google Scholar] [CrossRef] [Green Version]
- Tu, W.; Li, Q.; Fang, Z.; Shaw, S.; Zhou, B.; Chang, X. Optimizing the Locations of Electric Taxi Charging Stations: A Spatial–Temporal Demand Coverage Approach. Transp. Res. Part C Emerg. Technol. 2016, 65, 172–189. [Google Scholar] [CrossRef] [Green Version]
- He, S.Y.; Kuo, Y.-H.; Wu, D. Incorporating Institutional and Spatial Factors in the Selection of the Optimal Locations of Public Electric Vehicle Charging Facilities: A Case Study of Beijing, China. Transp. Res. Part C Emerg. Technol. 2016, 67, 131–148. [Google Scholar] [CrossRef]
- Boostani, A.; Ghodsi, R.; Miab, A.K. Optimal Location of Compressed Natural Gas (CNG) Refueling Station Using the Arc Demand Coverage Model. In Proceedings of the 2010 Fourth Asia International Conference on Mathematical/Analytical Modelling and Computer Simulation, Kota Kinabalu, Malaysia, 26–28 May 2010; pp. 193–198. [Google Scholar]
- Zhong, G.; Yin, T.; Zhang, J.; He, S.; Ran, B. Characteristics Analysis for Travel Behavior of Transportation Hub Passengers Using Mobile Phone Data. Transportation 2019, 46, 1713–1736. [Google Scholar] [CrossRef]
- Hodgson, M.J. A Flow-capturing Location-allocation Model. Geogr. Anal. 1990, 22, 270–279. [Google Scholar] [CrossRef]
- Kuby, M.; Lines, L.; Schultz, R.; Xie, Z.; Kim, J.-G.; Lim, S. Optimization of Hydrogen Stations in Florida Using the Flow-Refueling Location Model. Int. J. Hydrogen Energy 2009, 34, 6045–6064. [Google Scholar] [CrossRef]
- Chung, S.H.; Kwon, C. Multi-Period Planning for Electric Car Charging Station Locations: A Case of Korean Expressways. Eur. J. Oper. Res. 2015, 242, 677–687. [Google Scholar] [CrossRef]
- Mak, H.-Y.; Rong, Y.; Shen, Z.-J.M. Infrastructure Planning for Electric Vehicles with Battery Swapping. Manag. Sci. 2013, 59, 1557–1575. [Google Scholar] [CrossRef] [Green Version]
- He, Y.; Kockelman, K.M.; Perrine, K.A. Optimal Locations of US Fast Charging Stations for Long-Distance Trip Completion by Battery Electric Vehicles. J. Clean. Prod. 2019, 214, 452–461. [Google Scholar] [CrossRef]
- Stephens-Romero, S.D.; Brown, T.M.; Kang, J.E.; Recker, W.W.; Samuelsen, G.S. Systematic Planning to Optimize Investments in Hydrogen Infrastructure Deployment. Int. J. Hydrogen Energy 2010, 35, 4652–4667. [Google Scholar] [CrossRef] [Green Version]
- Badri-Koohi, B.; Tavakkoli-Moghaddam, R. Determining Optimal Number and Locations of Alternative-Fuel Stations with a Multi-Criteria Approach. In Proceedings of the 8th International Industrial Engineering Conference, Tehran, Iran, 15 February 2012. [Google Scholar]
- Honma, Y.; Kuby, M. Node-Based vs. Path-Based Location Models for Urban Hydrogen Refueling Stations: Comparing Convenience and Coverage Abilities. Int. J. Hydrogen Energy 2019, 44, 15246–15261. [Google Scholar] [CrossRef]
- Melendez, M. Transitioning to a Hydrogen Future: Learning from the Alternative Fuels Experience; National Renewable Energy Lab. (NREL): Golden, CO, USA, 2006. [Google Scholar]
- Nesbitt, K.; Sperling, D. Myths Regarding Alternative Fuel Vehicle Demand by Light-Duty Vehicle Fleets. Transp. Res. Part D Transp. Environ. 1998, 3, 259–269. [Google Scholar] [CrossRef] [Green Version]
- Statistical Atlas. Population of the Hartford Area, Connecticut (Metro Area); Statistical Atlas: Excelsior, MN, USA, 2018. [Google Scholar]
- DVMT by Urbanized Area, COG, County, and Town—2020. Available online: https://portal.ct.gov/-/media/DOT/documents/dpolicy/RoadwayInformationSystems/RoadwayInventorySection/DVMT_UrbanizedAreaCOGCountyTown.pdf (accessed on 9 August 2021).
- Connecticut Department of Transportation. Connecticut....On The Move! 2020 Transportation Fast Facts; Connecticut Department of Transportation: Newington, CT, USA, 2020.
- Alternative Fuels Data Center: Alternative Fueling Station Locator. Available online: https://afdc.energy.gov/stations#/find/nearest?fuel=HY (accessed on 30 September 2019).
- Lu, C.; Rong, K.; You, J.; Shi, Y. Business Ecosystem and Stakeholders’ Role Transformation: Evidence from Chinese Emerging Electric Vehicle Industry. Expert Syst. Appl. 2014, 41, 4579–4595. [Google Scholar] [CrossRef]
- Campagna, M.; Mourão Moura, A.C.; Borges, J. Future Scenarios for the Pampulha Region: A Geodesign Workshop; Wichmann Verlag: Berlin, Germany, 2016; ISBN 978-3-87907-612-3. [Google Scholar]
- Nyerges, T.; Ballal, H.; Steinitz, C.; Canfield, T.; Roderick, M.; Ritzman, J.; Thanatemaneerat, W. Geodesign Dynamics for Sustainable Urban Watershed Development. Sustain. Cities Soc. 2016, 25. [Google Scholar] [CrossRef] [Green Version]
- Rivero, R.; Smith, A.; Ballal, H.; Steinitz, C. Promoting Collaborative Geodesign in a Multidisciplinary and Multiscale Environment: Coastal Georgia 2050, USA. In Digital Landscape Architecture; Anhalt University of Applied Science: Berlin, Germany, 2015. [Google Scholar]
- Avin, U. Sketch Tools for Regional Sustainability Scenario Planning; Cambridge Systematics: Medford, MA, USA, 2016. [Google Scholar]
- Ballal, H. Collaborative Planning with Digital Design Synthesis. Ph.D. Thesis, University College London, London, UK, 2015. [Google Scholar]
- Kuby, M.; Bailey, K.; Wei, F.; Fowler, J.; Tong, D.; Zhong, Q.; Lopez, O.; Sheaffer, W. Collaborative Geodesign for Alternative-Fuel Station Location Using “Collablocation” Software. Transp. Res. Rec. 2018, 2672, 98–108. [Google Scholar] [CrossRef]
- Kim, J.-G.; Kuby, M. The Deviation-Flow Refueling Location Model for Optimizing a Network of Refueling Stations. Int. J. Hydrogen Energy 2012, 37, 5406–5420. [Google Scholar] [CrossRef]
- Zhao, Q.; Kelley, S.B.; Xiao, F.; Kuby, M.J. A Multi-Scale Framework for Fuel Station Location: From Highways to Street Intersections. Transp. Res. Part D Transp. Environ. 2019, 74, 48–64. [Google Scholar] [CrossRef]
- De Smith, M.J.; Goodchild, M.F.; Longley, P. Geospatial Analysis: A Comprehensive Guide to Principles, Techniques and Software Tools; Troubador Publishing Ltd.: Kibworth Harcourt, UK, 2007; ISBN 1-905886-60-8. [Google Scholar]
- Lynch, K. The Image of the City; Publications of the Joint Center for Urban Studies; MIT Press: Cambridge, MA, USA, 1960; ISBN 978-0-262-12004-3. [Google Scholar]
- Stotts, R.; Lopez-Jaramillo, O.G.; Kelley, S.; Krafft, A.; Kuby, M. How Drivers Decide Whether to Get a Fuel Cell Vehicle: An Ethnographic Decision Model. Int. J. Hydrogen Energy 2020, 46, 8736–8748. [Google Scholar] [CrossRef]
- Dar, S. De-Colonizing the Boundary-Object. Organ. Stud. 2018, 39, 565–584. [Google Scholar] [CrossRef]
- Star, S.L. Chapter 2—The Structure of Ill-Structured Solutions: Boundary Objects and Heterogeneous Distributed Problem Solving. In Distributed Artificial Intelligence; Gasser, L., Huhns, M.N., Eds.; Morgan Kaufmann: San Francisco, CA, USA, 1989; pp. 37–54. ISBN 978-1-55860-092-8. [Google Scholar]
- Star, S.L. This is not a Boundary Object: Reflections on the Origin of a Concept. Sci. Technol. Hum. Values 2010, 35, 601–617. [Google Scholar] [CrossRef]


| 9:00 | Introduction | |
| Tasks |
| |
| Outcomes |
| |
| 9:15 | Moderated Panel | |
| Tasks |
| |
| Outcomes |
| |
| 10:15 | Break | |
| 10:30 | Collablocation Demonstration | |
| Tasks |
| |
| Outcomes |
| |
| 10:50 | Breakout Groups Stage 1, Part 1 | |
| Tasks |
| |
| Outcomes |
| |
| 11:30 | Breakout Groups Stage 1, Part 2 | |
| Tasks |
| |
| Outcomes |
| |
| 12:00 | Assign Groups for Stage 2 | |
| Tasks |
| |
| Outcomes |
| |
| 12:15 | Lunch | |
| 13:00 | Breakout Groups Stage 2, Part 1 | |
| Tasks |
| |
| Outcomes |
| |
| 13:45 | Breakout Groups Stage 2, Part 2 | |
| Tasks |
| |
| Outcomes |
| |
| 14:15 | Break | |
| 14:30 | Stage 3 | |
| Tasks |
| |
| Outcomes |
| |
| 15:00 | Workshop Wrap-up | |
| Tasks |
| |
| Outcomes |
| |
| 16:00 | Close | |
| Theme (Consideration by Group during Design Activity) |
|---|
| Map layers |
| Station and iteration metrics |
| Pre-packaged optimization solutions |
| Designs by other groups in earlier stage |
| Previous solutions by same group |
| Outside knowledge (not visible in any map layer or performance metric) |
| Other—tool, scale, supporting long-distance travel, etc. |
| Final decision |
| Layer | Source | Description |
|---|---|---|
| H2 Stations | DOE Alternative Fuels Data Center | Existing or planned stations with fuel for retail to the public |
| Candidate sites | Google Maps | Existing gas stations in the Hartford metropolitan area |
| Annual average daily traffic (AADT) | CT Department of Transportation | AADT, separated into interstate, other freeway, major arterial, and minor arterial sub-layers |
| Population | CRCOG | 2015 populations for aggregated traffic analysis zones |
| Trips (to or from) | CRCOG | Number of trips originating from or terminating at traffic analysis zones |
| Optimization model results | Optimized by our team for this paper using dataset from Zhao et al. (2019) | 6 sublayers depicting locations of additional 3 or 8 HRSs as determined by p-Median, FRLM, and FTB models |
| Opportunity zones | US Dept. of the Treasury | Economically distressed communities where new investments, under certain conditions, may be eligible for preferential tax treatment |
| Natural gas pipelines | US Energy Information Association | Natural gas pipelines in CT |
| Existing points of H2 demand | CHFCC; Google Maps | Sublayers representing auto dealers, warehouses, cold-storage facilities, food processing facilities, metal finish shops, transit companies, truck parking, and wholesale retailers—all of which present opportunities for HRS co-location |
| p-Median Problem (PMP) | Fuel Travel Back Model (FTB) | Flow Refueling Location Model (FRLM) |
|---|---|---|
| (1) Subject to (2) (3) (4) (5) (6) | (7) Subject to (8) (9) (10) (11) (12) | (13) Subject to (14) (15) (16) (17) |
| where common terms for all models include the following: Xj = 1 if an HRS is opened at j, 0 otherwise (decision variable) p = number of HRS to open and | ||
| Yij = 1 if demand node i is allocated to HRS j, 0 otherwise (dec. var.) ai = population of node i (number of people) tij = travel time from demand node i to HRS j (hours) | Yaj = 1 if arc centroid a is allocated to HRS j, 0 otherwise (dec. var.) va = traffic on arc a (vehicle-miles traveled) taj = travel time from arc centroid a to HRS j (hours) | Yq = 1 if path q is refuelable, 0 otherwise (dec. var.) fq = flow on O-D round trip q (number of weekday trips) Aq = set of directional arcs on round trip q = set of candidate sites that can cover directional arc a on round trip q given the driving range |
| Stakeholder Group Being Assessed | |||||
|---|---|---|---|---|---|
| Academia | Government | Industry | Hydrogen Research and Advocacy | ||
| Stakeholder group assessing compatibility | Academia | ++ | ++ | ++ | |
| Government | + | ++ | ++ | ||
| Industry | − | ++ | + | ||
| Hydrogen Research and Advocacy | − | + | ++ | ||
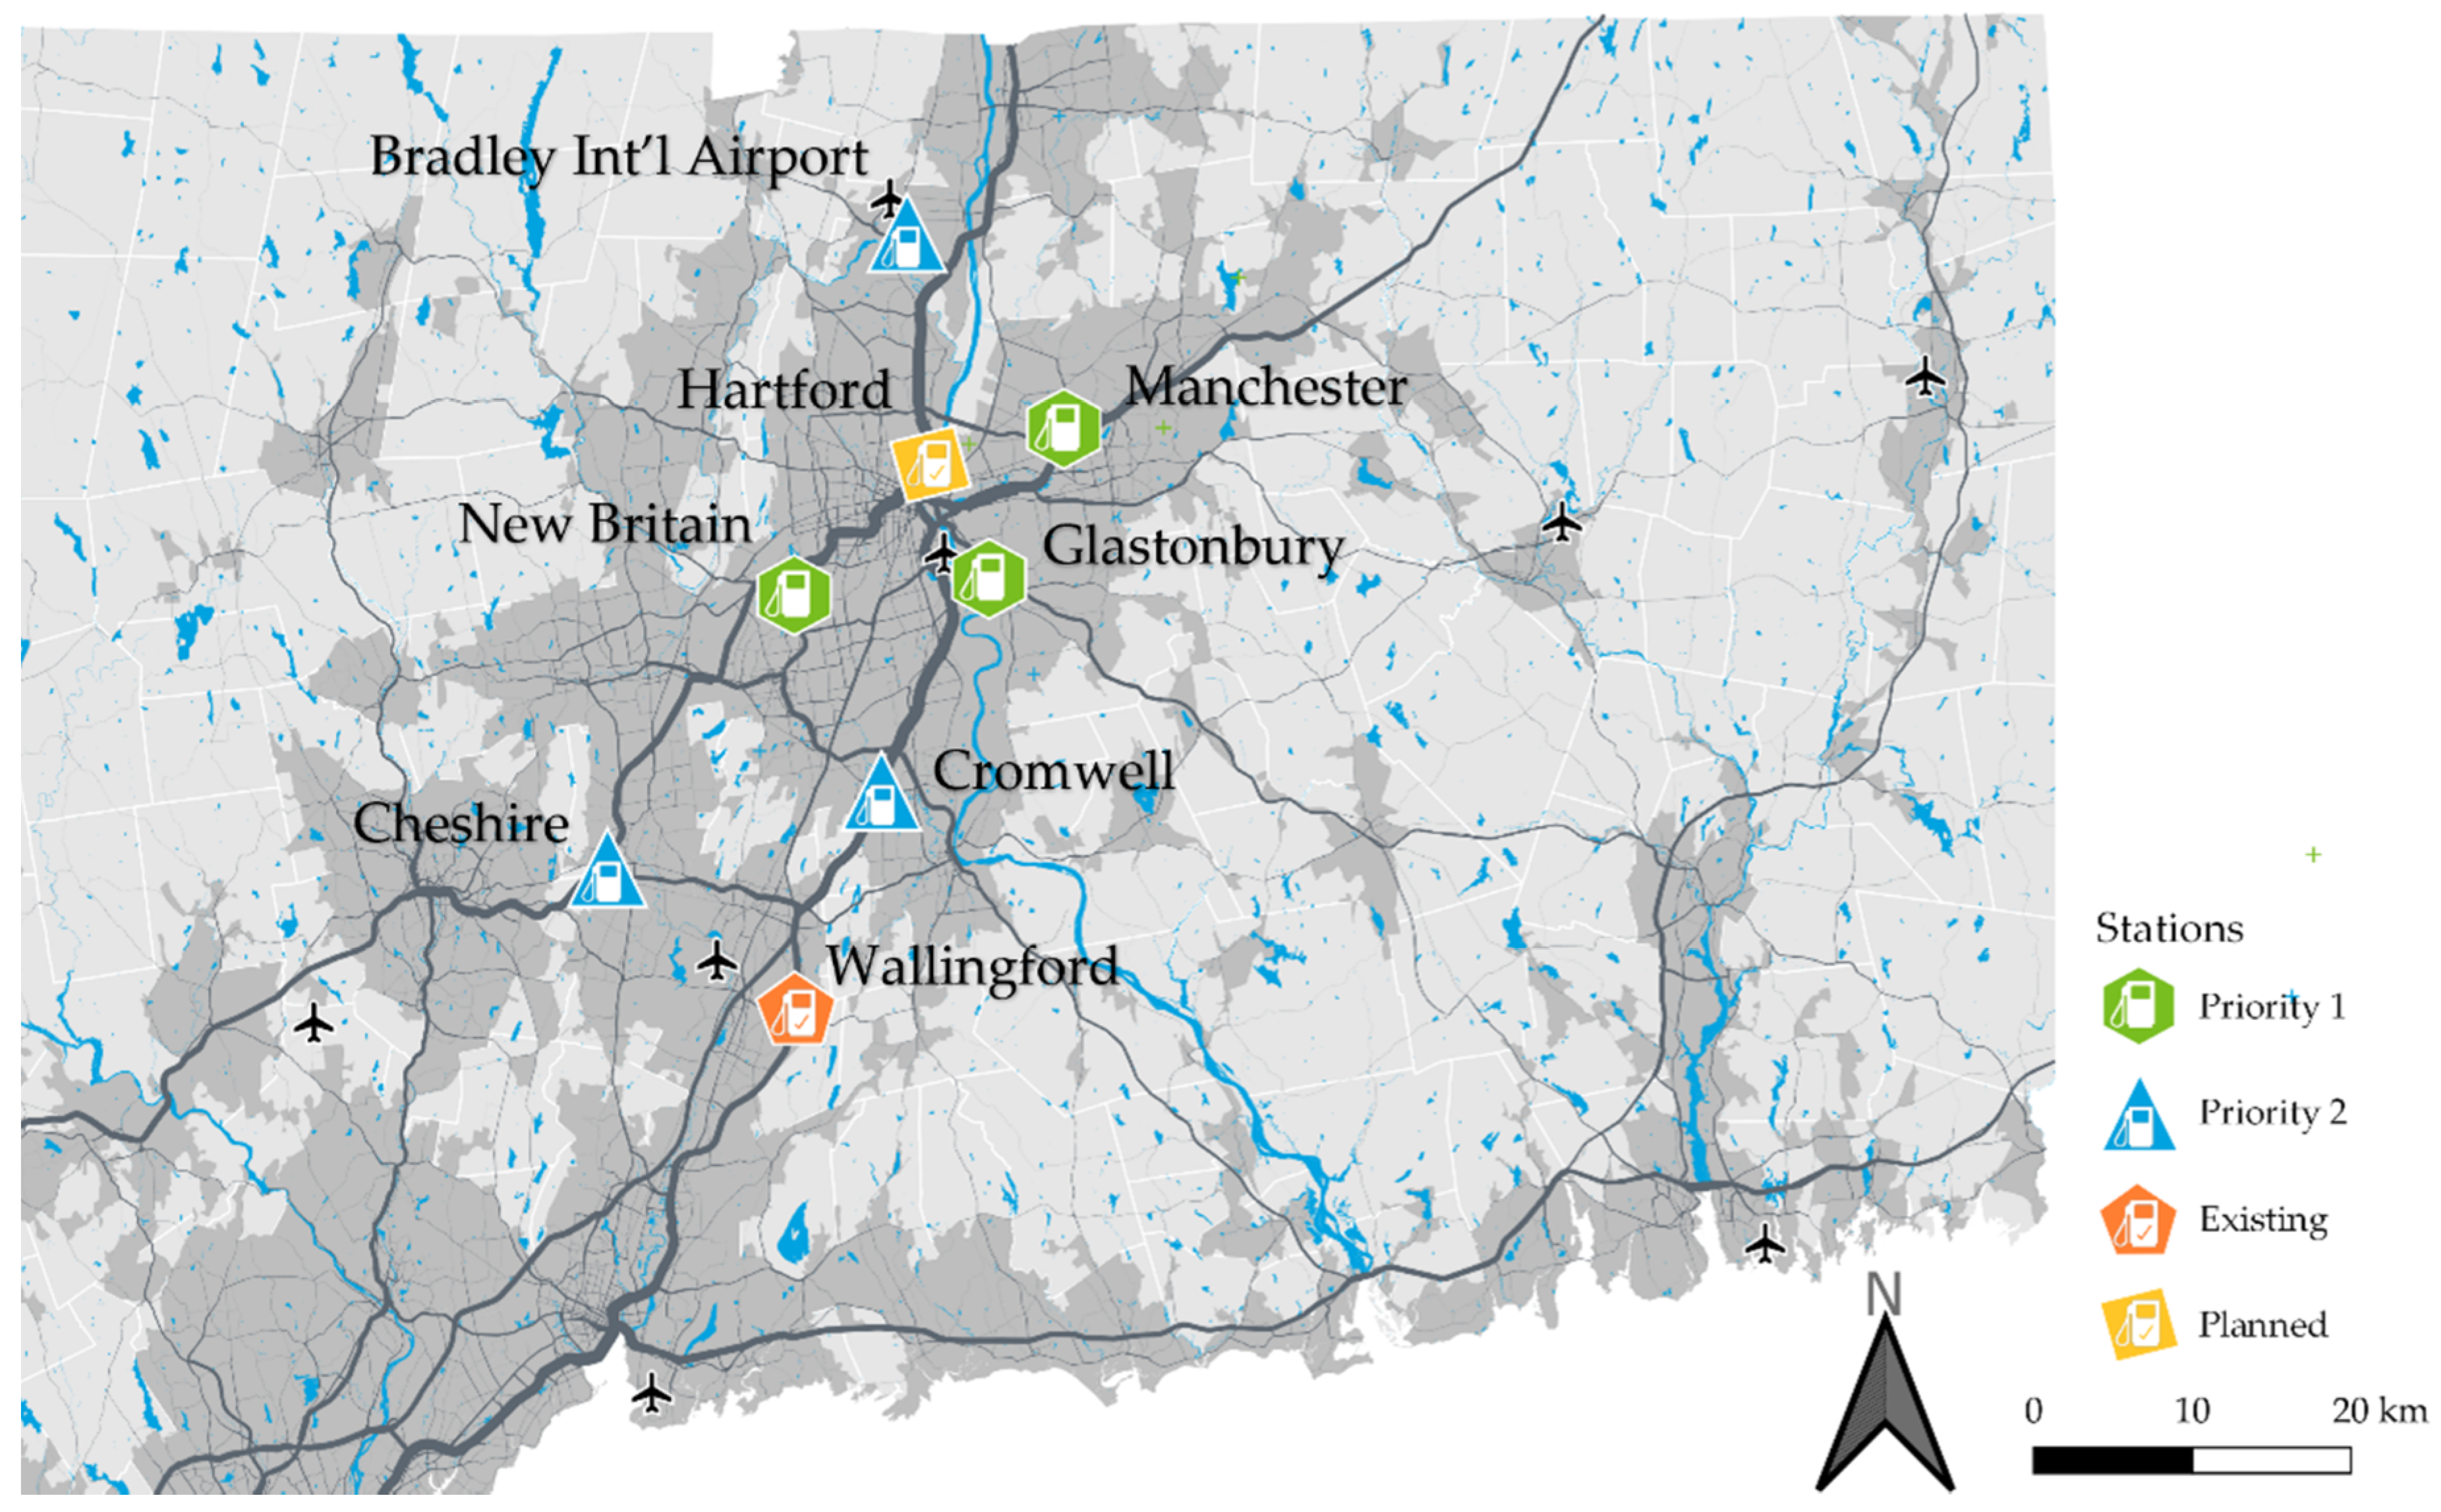
| Approximate Location | Nearby Gasoline Stations | Strengths Cited | Weaknesses Cited |
|---|---|---|---|
| Phase 0—Existing and Under Construction Stations Open to the Public | |||
| Wallingford, CT Nel Research Parkway near I-91 | Accessible from I-91 Short detour from Wilbur Cross Pkwy, I-691, US-5, CT-66, 68, and 15. Midway between Hartford and New Haven Near potential fleet adopters | ||
| Hartford, CT I-91 & Liebert Rd. | Near Transit Facility Near auto mall Accessible from I-91 Short detour from I-84 and I-I-291. Near potential fleet adopters. | ||
| Phase 1—Highest Priority Locations (in alphabetical order) | |||
| Glastonbury | 7–11, Mobil, Cumberland Farms, Stop & Shop, Shell | Accessible from CT-2 and CT-3. Short detour from I-91 Near Pratt and Whitney First adopter demographics, Whole Foods, mall Connector to New London | Not a major fleet hot spot |
| Manchester Buckland Hills Mall Area | Mobil, Shell, BJ’s | Accessible from I-84 Short detour from I-291 and I-384 Major trip generator Commercial center and Trader Joe’s Connector to Boston | Not a major fleet hot spot |
| New Britain CT-9 New Britain Ave./ Hartford Rd. | Sunoco, Costco | Accessible from I-84 Short detour from Near Blue Back Square mall in West Hartford Near UConn Health, CCSU First adopter demographics, Whole Foods and Trader Joe’s | Not a major fleet hot spot Not realistic to site in Blue Back Square, so sited in less congested area in nearby New Britain |
| Phase 2—Second-Priority Locations (in alphabetical order) | |||
| Bradley International Airport/Ella Grasso Turnpike | Pride, Mobil, Valero, Sunoco | Accessible from CT-20 Airport fleet vehicles, including taxis, shuttles, rental cars, baggage carts, buses | Good sites lacking directly off I-91 near airport, so sited near airport itself 3 miles from I-91 |
| Cromwell I-91 and Berlin Rd. | Sunoco, Mobil | Accessible from I-91 and CT-9 Near Middletown and Berlin, Wesleyan College | |
| Cheshire CT 322 | Mobil, Bouchard, Gulf | Accessible from I-84 and I-691 Near Southington, Waterbury, Meriden Connector to New York, Danbury, Waterbury | |
| Question | Mean | Median |
|---|---|---|
| How satisfied are you overall with the workshop design? | 8.1 | 8 |
| How satisfied are you overall with the solution from Part III (the iterated constrained version) | 7.7 | 8 |
| How satisfied are you that the list of factors generated during the workshop is comprehensive (meaning, no significant factors are missing)? | 7.7 | 8 |
| How satisfied are you with the level of knowledge exchange the workshop promoted between YOU and OTHER PARTICIPANTS (not including the researchers and organizers)? | 7.8 | 8.5 |
| How satisfied are you with the EASE OF USE of the geodesign platform? | 7.4 | 7 |
| How satisfied are you with the TECHNICAL ANALYTIC capacity of the geodesign platform? | 7.4 | 7 |
| Model | Network Generator | Total Travel Time (Weighted Hours) PMP and FTB Objective | Max. Travel Time (Hours) | Covered Trips (%) FRLM/DFRLM Objective |
|---|---|---|---|---|
| p-median | model | 276,075 person-hours | 0.69 | n.a. |
| workshop | 334,599 person-hours | 0.88 | n.a. | |
| FTB | model | 3,286,023 VHT 1 | 0.78 | n.a. |
| workshop | 4,273,191 VHT | 1.08 | n.a. | |
| FRLM | model | n.a. 2 | n.a. | 15.34 |
| workshop | n.a. | n.a. | 8.97 | |
| DFRLM | model | n.a. | n.a. | 54.27 |
| workshop | n.a. | n.a. | 38.76 |
| Model | Network Generator | Total Travel Time (Weighted Hours) PMP and FTB Objective | Max. Travel Time (Hours) | Covered Trips (%) FRLM/DFRLM Objective |
|---|---|---|---|---|
| p-median | model | 218,118 person-hours | 0.64 | n.a. |
| workshop | 264,734 person-hours | 0.72 | n.a. | |
| FTB | model | 2,469,915 VHT 1 | 0.56 | n.a. |
| workshop | 3,223,744 VHT | 0.9 | n.a. | |
| FRLM | model | n.a. 2 | n.a. | 23.4 |
| workshop | n.a. | n.a. | 14.56 | |
| DFRLM | model | n.a. | n.a. | 70.02 |
| workshop | n.a. | n.a. | 53.71 |
| Network Generator | Convex Hull Area (km2) | Convex Hull Perimeter (km) | Minimum Rectangle Area (km2) | Minimum Rectangle Perimeter (km) | Mean Distance Between Stations (km) | Distance from Mean Center to Workshop Mean Center (km) |
|---|---|---|---|---|---|---|
| p-median | 818.2 | 147.5 | 1391 | 175.0 | 3.544 | 5.477 |
| FTB | 818.2 | 147.5 | 1391 | 175.0 | 3.549 | 5.288 |
| FRLM | 580.2 | 115.8 | 1041 | 142.5 | 2.908 | 8.388 |
| Workshop | 247.4 | 86.95 | 445 | 102.6 | 2.030 | - |
| Network Generator | Convex Hull Area (km2) | Convex Hull Perimeter (km) | Minimum Rectangle Area (km2) | Minimum Rectangle Perimeter (km) | Mean Distance Between Stations (km) | Distance from Mean Center to Workshop Mean Center (km) |
|---|---|---|---|---|---|---|
| p-median | 2304 | 190.3 | 2972 | 222.7 | 37.88 | 2.744 |
| FTB | 2585 | 193.5 | 3126 | 224.8 | 40.39 | 1.551 |
| FRLM | 1150 | 140.2 | 1673 | 165.0 | 27.99 | 9.775 |
| Workshop | 610.8 | 115.4 | 691.4 | 123.8 | 23.40 | - |
Publisher’s Note: MDPI stays neutral with regard to jurisdictional claims in published maps and institutional affiliations. |
© 2021 by the authors. Licensee MDPI, Basel, Switzerland. This article is an open access article distributed under the terms and conditions of the Creative Commons Attribution (CC BY) license (https://creativecommons.org/licenses/by/4.0/).
Share and Cite
Lopez Jaramillo, O.; Rinebold, J.; Kuby, M.; Kelley, S.; Ruddell, D.; Stotts, R.; Krafft, A.; Wentz, E. Hydrogen Station Location Planning via Geodesign in Connecticut: Comparing Optimization Models and Structured Stakeholder Collaboration. Energies 2021, 14, 7747. https://doi.org/10.3390/en14227747
Lopez Jaramillo O, Rinebold J, Kuby M, Kelley S, Ruddell D, Stotts R, Krafft A, Wentz E. Hydrogen Station Location Planning via Geodesign in Connecticut: Comparing Optimization Models and Structured Stakeholder Collaboration. Energies. 2021; 14(22):7747. https://doi.org/10.3390/en14227747
Chicago/Turabian StyleLopez Jaramillo, Oscar, Joel Rinebold, Michael Kuby, Scott Kelley, Darren Ruddell, Rhian Stotts, Aimee Krafft, and Elizabeth Wentz. 2021. "Hydrogen Station Location Planning via Geodesign in Connecticut: Comparing Optimization Models and Structured Stakeholder Collaboration" Energies 14, no. 22: 7747. https://doi.org/10.3390/en14227747